Modification of Polyethylene by RF Plasma in Different/Mixture Gases


1
Center for Advanced Materials, Qatar University, P.O. Box 2713 Doha, Qatar
2
QAPCO R&D–Qatar Petrochemical Company, P.O. Box 756 Doha, Qatar
*
Author to whom correspondence should be addressed.
Coatings 2019, 9(2), 145; https://doi.org/10.3390/coatings9020145
Submission received: 21 January 2019
/
Revised: 5 February 2019
/
Accepted: 11 February 2019
/
Published: 22 February 2019
Abstract
:Herein, low-density polyethylene (LDPE) films were treated using radio-frequency plasma discharge in the presence of air, nitrogen, oxygen, argon, and their mixtures to introduce new chemical functionalities. The surface properties of treated LDPE were qualitatively and quantitatively characterized using various analytical and microscopic techniques. It was found that the optimum plasma treatment for LDPE occurs in the presence of air plasma at an exposure time of 120 s and 80 W of nominal power. The plasma formed layer had tendency to increasing thickness with increasing treatment time up to 60 s using air and oxygen and even more with inert gases. An aging study of plasma-treated LDPE samples stored in ambient air or water medium revealed the partial hydrophobic recovery.
1. Introduction
Low-density polyethylene (LDPE) has become one of the most extensively used commodity polymers in various technological applications, such as adhesives, microelectronics, coatings, thin-films, catheters, medical implants, and orthopedic devices [1,2,3,4,5,6,7]. Its versatility is mainly attributed to its outstanding material properties, including low density, ease of finishing, durability, flexibility, and chemical resistance, as well as its current commercial availability. Although the bulk properties of LDPE comply with various mechanical and thermal requirements, its surface properties are undesirable. The LDPE surface is characterized by a low surface free energy that results in poor wettability, adhesion and biocompatibility, making it unsuitable for several applications [4,7,8,9,10]. Surface free energy (wettability) of LDPE achieves values about 30 mJ/m2. However, for applications such as printing or lamination processes, surface free energy is required to be greater than 37 or 42 mJ/m2, respectively [11]. Moreover, untreated LDPE has a predisposition to a biofouling effect. When pristine LDPE is implanted in a biological environment, biofouling is most likely to occur as a result of poor biocompatibility [12]. To overcome similar issues, there has been a longstanding interest to chemically or physically modify and control the surface properties of polymeric materials by incorporating polar groups onto the surface to enhance hydrophilicity, adhesion, and biocompatibility characteristics [2,13,14]. The incorporation of new polar functionalities onto the polymer surface can be performed using wet chemical methods by acid etching or chemical oxidation. Nevertheless, practical use of those methods is complex and environmentally unfriendly as it requires handling and disposal of harmful chemicals. Therefore, for ecological requirements, different technologies have been developed to replace wet finishing processes in several domains to modify the surface properties of polymeric films without generating harmful wastes [15]. Low pressure reactive gas glow discharge, known as cold plasma, technology, is prevalently utilized to enhance the surface properties of polymers by changing the chemical composition and morphology [16]. Its usage has become one of the most versatile and effective means for surface modification applied throughout the food industry, physics, chemistry, material science, and medicine [17]. Several other surface modification strategies include flame, UV, and direct fluorination [18,19,20,21,22,23]. However, plasma technology has gained more preference over other techniques because it represents an alternative effective, clean, dry, economical, and environmentally friendly method. Another distinctive attribute of this technique is easy and fast processing, as the surface treatment is achieved in a single step without requiring further surface treatments. Apart from surface modification, plasma is enormously employed for cleaning, decontamination and sterilization applications [16].
Different treatment methods, as well as working gases and plasma sources, are used for surface modification. Gaseous corona discharge, radio-frequency (RF) discharge, dielectric barrier discharge, microwave discharge, direct current, and laser-based sources are the most common plasma sources available today [4,24]. RF plasma systems provide homogenous surface treatments that can be employed for three-dimensional and complex objects and are hence not confined to treating only flat thin 2D surfaces [25]. Plasma treatment leads to a formation of a new layer of treated materials with different properties compared to the bulk. During plasma treatment, an ionized gas is formed, consisting of different active species including electrons, positive and negative ions, free radicals, photons and neutral species with high energy [26,27,28]. The bombardment of the polymer surface by these highly energetic species initiates reactions that ultimately modify the chemical and physical properties of the surface. Several surface processes, such as etching, ablation, cross-scission, cross-linking, and degradation result in the formation of a new layer [29,30,31,32,33,34,35]. Effects could be either individual or combined based on the applied plasma conditions. In a typical modification process, the initial step involves breaking the existing chemical bonds and forming new ones, resulting in new groups at the surface, which then undergo further oxidation as the surface is exposed to air [24]. Monomers also undergo plasma polymerization because the treated surface is rich in radicals. Furthermore, plasma treatment is known to immensely enhance surface properties, while its penetration depth is limited to only a few nanometers [36,37,38,39,40]. In fact, the thinness/surface-specificity of the newly formed layer at the polymer interface is often regarded as an advantage of plasma treatment as the propitious bulk properties are preserved.
In this work, we report a thorough study of the surface properties of low density polyethylene (LDPE) films modified by low-temperature RF plasma using pure gases and their mixtures, namely, air, argon, oxygen, and nitrogen. An improvement of LDPE hydrophilicity with maximum efficiency using this technology was examined and can be applicable in printing, laminating, or antibiofouling applications. This improvement implied the determination of optimum processing conditions by changing the nominal power, exposure time, and gas type/mixtures. A comparison was done between the different gases in terms of surface wettability and aging behavior over time. Different inert (nitrogen, argon) and reactive gases (oxygen, air) were selected to analyze their effect on the resulted wettability of the LDPE surface. Generally, reactive gases are more susceptible to functionalization reactions, while inert gases predominantly lead to the crosslinking structures by recombination reactions of radicals or creation of alkenes (disproportionation reactions of radicals). However, after plasma treatment of LDPE using inert gases, functionalization reactions occurred between plasma generated radicals and oxygen from ambient air. Particular attention was given to find the extent to which wettability is affected by the chemistry and morphology on the surface area.
2. Materials and Methods
Commercial grade low-density polyethylene (LDPE) FE8000 was supplied in pellet form by Qatar petrochemical company (QAPCO, Doha, Qatar). Thin homogenous films approximately 0.41 mm thick were prepared by compression molding using an industrial mounting press machine (Carver, Wabash, IN, USA). The pellets were melted at 160 °C and compressed for 2 min using 0.2 MPa of pressure while maintaining the set temperature to obtain a film with a desired smooth surface. Samples were cooled down to RT using water before being peeled of the plates. The LDPE films were cleaned with acetone to remove any additives, residuals or other possible contaminants from the molding process that might affect the surface properties and were then dried in air for 20 min at RT. Small strips (5 cm × 1 cm) were cut out and directly used for surface treatment and subsequent analyses.
Ethylene glycol (>98% FLUKA, Morris Plains, NJ, USA), formamide (>98% FLUKA), ultra-pure water (prepared by Purification System Direct Q3, Millipore Corporation, Molsheim, France), and acetone (99.9% Scharlau, Barcelona, Spain) were used as testing liquids for wettability analyses.
2.1. Plasma Treatment
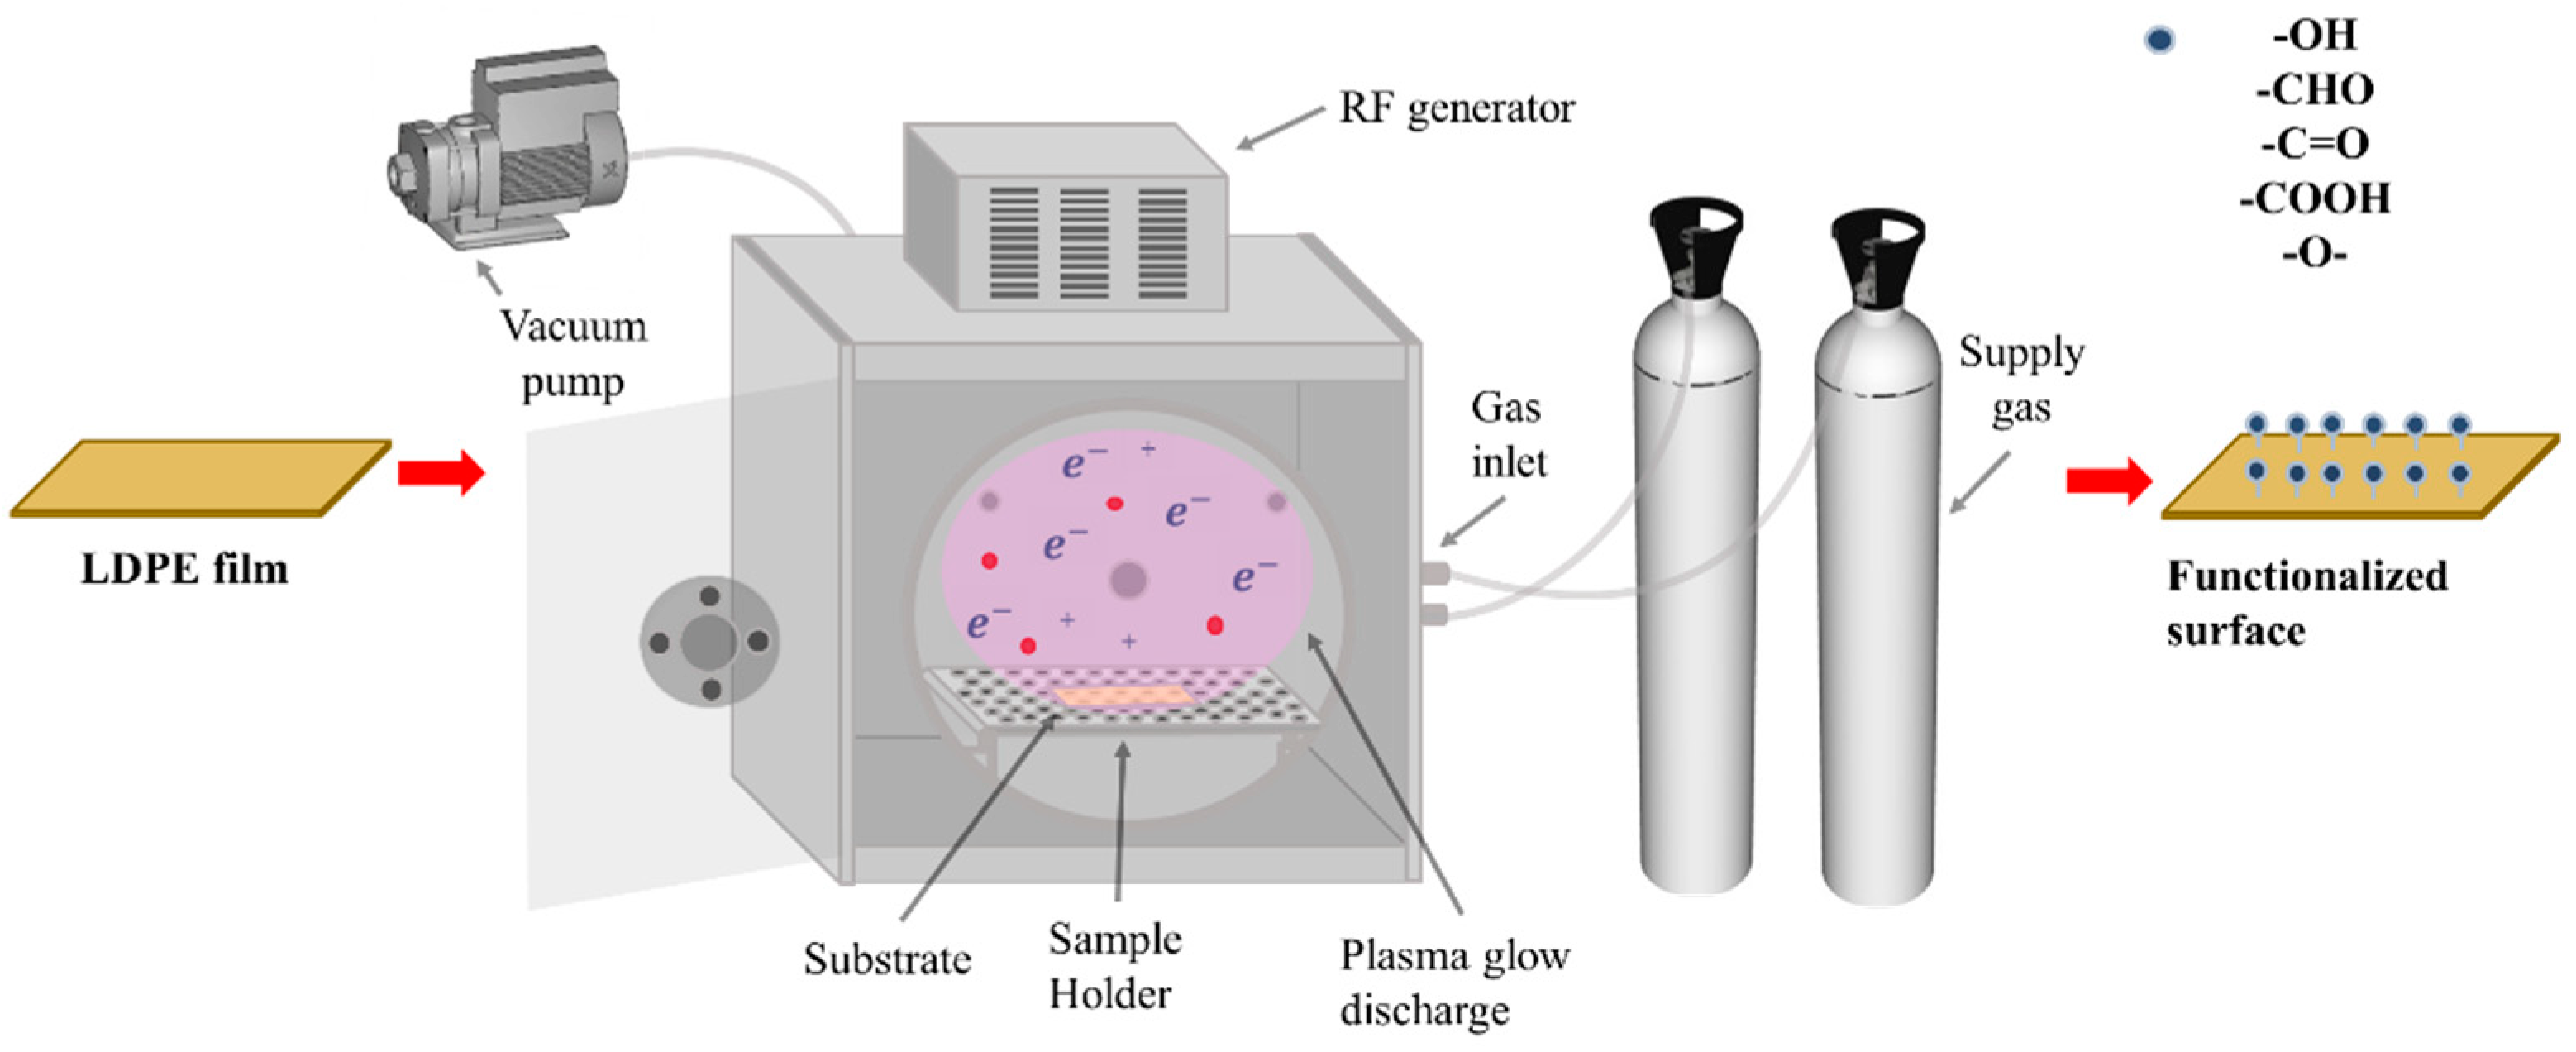
Plasma treatment of LDPE films was performed using an enclosed low-temperature plasma generating system, Venus75-HF (Plasma Etch Inc, Carson, CA, USA). The plasma excited species were generated using an RF generator operating at a frequency of 13.56 MHz. The chamber of the plasma system was evacuated to a pressure of approximately 0.2 Torr using a rotary vacuum pump before plasma ignition. Optimization of the treatment process was carried out by varying the nominal power, treatment time and working gas to obtain the maximum level of hydrophilicity in the LDPE surface. The applied nominal power varied from 50 to 120 W, and the range of treatment time was from 10 to 180 s at a constant optimal nominal power of 80 W. The gas flow rate was 10 cm3·min−1. The film surfaces were treated from both sides using four different gases, namely, air, oxygen, argon, and nitrogen, and their mixtures with different ratios. Repeatability of the plasma treatment process of the LDPE surface was proven by contact angle measurements of three different LDPE samples treated at 80 W for 120 s, which were carefully controlled by PC software Plasma Etch v1.3.0. The standard deviation of surface free energy obtained from three independent measurements was less than 3% of the mean indicating high reproducibility of the obtained results. The single step modification process using RF plasma is shown in Figure 1.
2.2. Surface Wettability Measurements
The changes in hydrophilicity induced after plasma treatment of LDPE films were evaluated by static contact angle measurements using the sessile drop method. Surface energy analysis system OCA35 (DataPhysics, Filderstadt, Germany) equipped with CCD camera was employed for this purpose. Water, formamide and ethylene glycol were used as testing liquids to evaluate the total surface free energy, polar and dispersive components using the conventional Owens-Wendt-Rabel-Kaelble method by considering a geometric mean of the polar (γsp) and dispersive (γsd) components of the surface free energy of solid γs = γsp + γsd and surface tension components of liquid (polar-γlp and dispersive-γld) of liquid γsl = γs + γl − 2 − 2. By the subsequent substitution in the Young equation γs = γsl + γlcosθ, a linear equation of the type y = mx + c is obtained (γl(1 + cosθ))/(2) = + . A droplet of approximately 3 µL from each testing liquid was placed on air-facing samples. The contact angle was calculated approximately after 3 s to allow thermodynamic equilibrium between the liquid and the sample interface to be reached. The reported value for each testing liquid corresponds to the mean of at least five measurements taken on different parts of the substrate surface.
2.3. Peel Test Analysis
A 90° peel test was performed to measure the adhesion characteristics of LDPE samples in terms of the peel resistance using a standard Lloyd 1K Lf plus-UTM testing machine (Lloyd Instruments, West Sussex, UK). Samples of 19 mm width and 6 cm length were attached to a polypropylene tape containing poly(2-ethylhexyl acrylate) adhesive (Scotch tape). The test was conducted with Scotch tape pressed on to the top of the treated LDPE surface. The unboned end of the testing tape was peeled off at 90° at a crosshead speed of 10 mm·min−1. The test was stopped after 6 min when the tape was completely detached from the LDPE surface, and six separate readings were carried out to obtain average values of peeling force.
2.4. Surface Chemistry Characterization
Fourier transform infrared spectroscopy with attenuated total reflectance mode (FTIR-ATR) was used to qualitatively investigate chemical composition changes of plasma treated LDPE surfaces. FTIR Spectrometer Frontier (PerkinElmer, Waltham, MA, USA) equipped with a ZnSe crystal was used for these analyses, capturing data from 1.66 µm penetration depth. The spectra in the 4000–550 cm−1 range were obtained using an average of 8 scans with a resolution of 4 cm−1.
Chemical composition changes caused by corona treatment of the LDPE surface were quantified by X-ray photoelectron spectroscopy (XPS). The XPS system AXIS (Kratos Analytical, Manchester, UK) was used for this study. The XPS system contains a spherical mirror analyzer and a delay-line detector for fast chemical composition screening, ensuring high spectral resolution and sensitivity. This system allows for analyzing data from 1–10 nm of sampling depth.
2.5. Surface Morphology Analysis
The surface morphology of LDPE films before and after plasma treatment was assessed by performing profilometry analysis using an optical surface metrology confocal system (profilometer), Leica DCM8 (Leica Microsystems, Wieselaar, Germany). This optical system was used for high accuracy surface profiling and to investigate morphological changes induced by plasma treatment on the film surfaces. Images of size 29.22 µm × 21.99 µm were scanned using 100× magnification objective and 6× zooming. Surface roughness was quantitatively characterized in terms of arithmetic mean height (Sa), which was calculated over the entire measured array.
Detailed information about three-dimensional changes in the surface topography of LDPE surface after plasma treatment was obtained using atomic force microscopy (AFM). The AFM device MFP-3D (Asylum Research, Abingdon, Oxford, UK) was used in these experiments. Scanning was carried out under ambient conditions using a silicon probe (Al reflex coated Veeco model–OLTESPA, Olympus, Tokyo, Japan) in the tapping mode in air (AC mode), allowing for obtaining images from 10 × 10 µm2 surface area. Moreover, the roughness parameter value (Ra) was calculated from the AFM images using the Z-Sensor.
Scanning electron microscopy (SEM) was used to obtain 2D images of the plasma modified surfaces. For this purpose, a Nova NanoSEM 450 microscope (FEI, Hillsboro, OR, USA) was used. A thin Au layer a few nanometers thick was sputter-coated onto LDPE samples to obtain high resolution images and to avoid the accumulation of electrons on the measured layer.
2.6. Plasma Film Thickness Measurement
Thickness measurements were performed using an F20 film thickness analyzer (Filmetrics, San Diego, CA, USA) to evaluate the increase in the plasma formed layer thickness. As a reference sample, 4.5 mm thick LDPE substrate (refractive index 1.5) was placed on a sample stage with an adjustable lens height under a UV light source. Measurements of plasma treated LDPE were carried out in air by including a refractive index of 1.4, which generally decreases with RF plasma treatment [41] as probably the result of an incorporation of oxygen functional groups, or the presence of low-molecular weight oxidative products. The data were collected from the near-UV and visible light regions (wavelength range of 380–1050 nm). The spectrum was analyzed by varying the measured parameters to obtain the best fit between the theoretical and measured data using FILMeasure software v7.19.0. At least five measurements from different areas were taken for each sample, and an average value was reported.
3. Results and Discussion
3.1. Surface Wettability Analysis
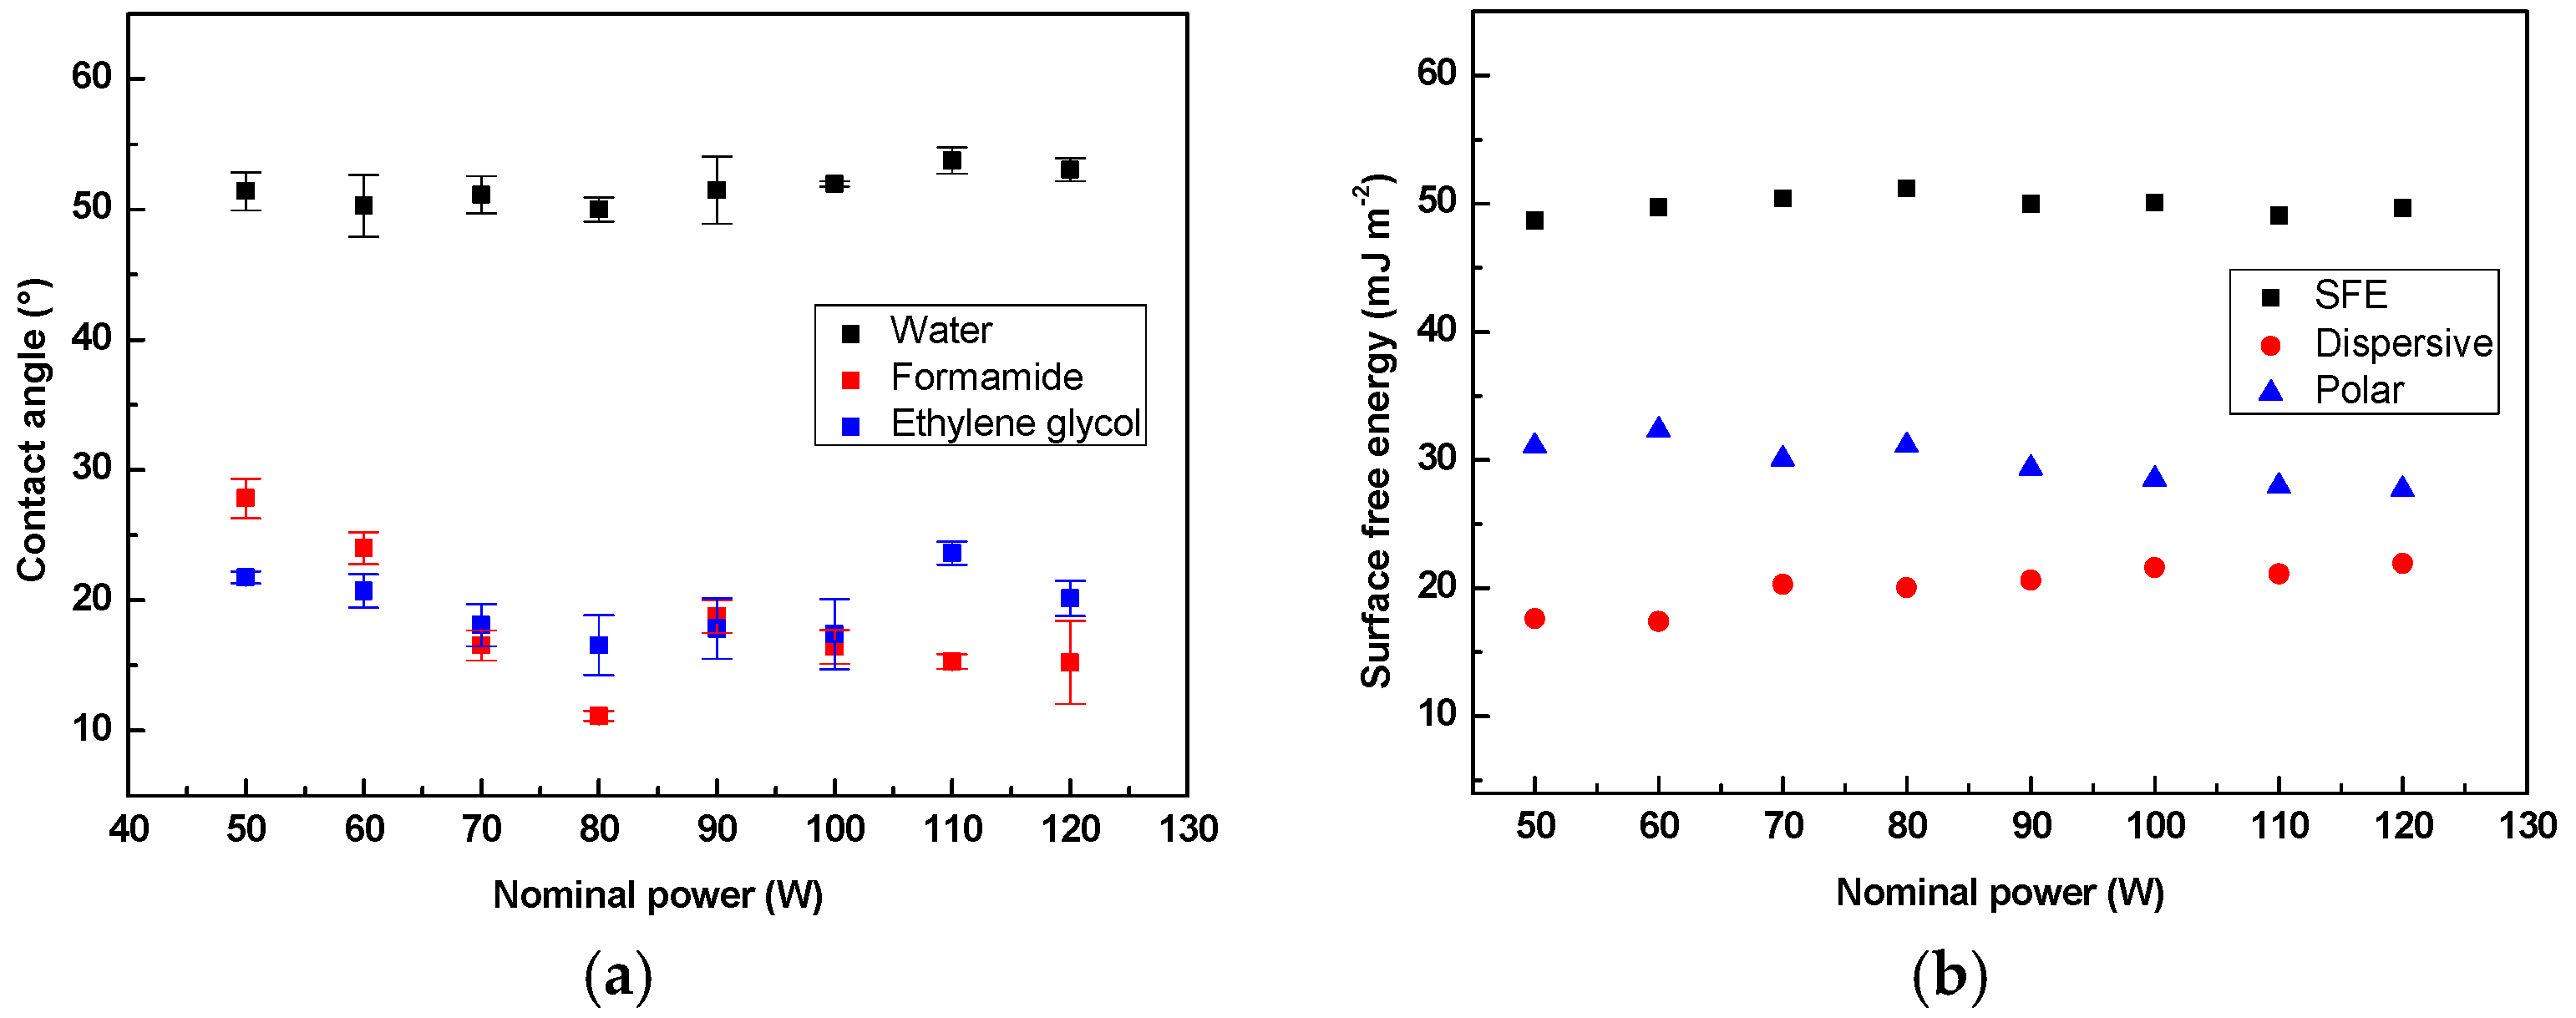
The wetting behavior changes of LDPE surfaces exposed to plasma treatment using different gases and their mixtures were examined using contact angle measurements. Several key parameters, which are crucial in the plasma treatment process, including nominal power, gas type/mixture, and exposure time, have been varied to analyze the optimum treatment process. An initial optimization of the plasma treatment was achieved by analyzing the influence of the nominal power on changes in surface wettability. Series of treatments have been carried out in the presence of air plasma for a fixed treatment time of 60 s under various input powers starting from 50 up to 120 W. Figure 2 presents the contact angle and surface free energy with respect to the nominal power. It was found that the optimum plasma effect, under which the treated film exhibited the lowest contact angle and the highest surface free energy, was achieved at 80 W. Therefore, further plasma treatments were carried out at a fixed nominal power of 80 W to avoid also any possible degradation processes at higher nominal powers.
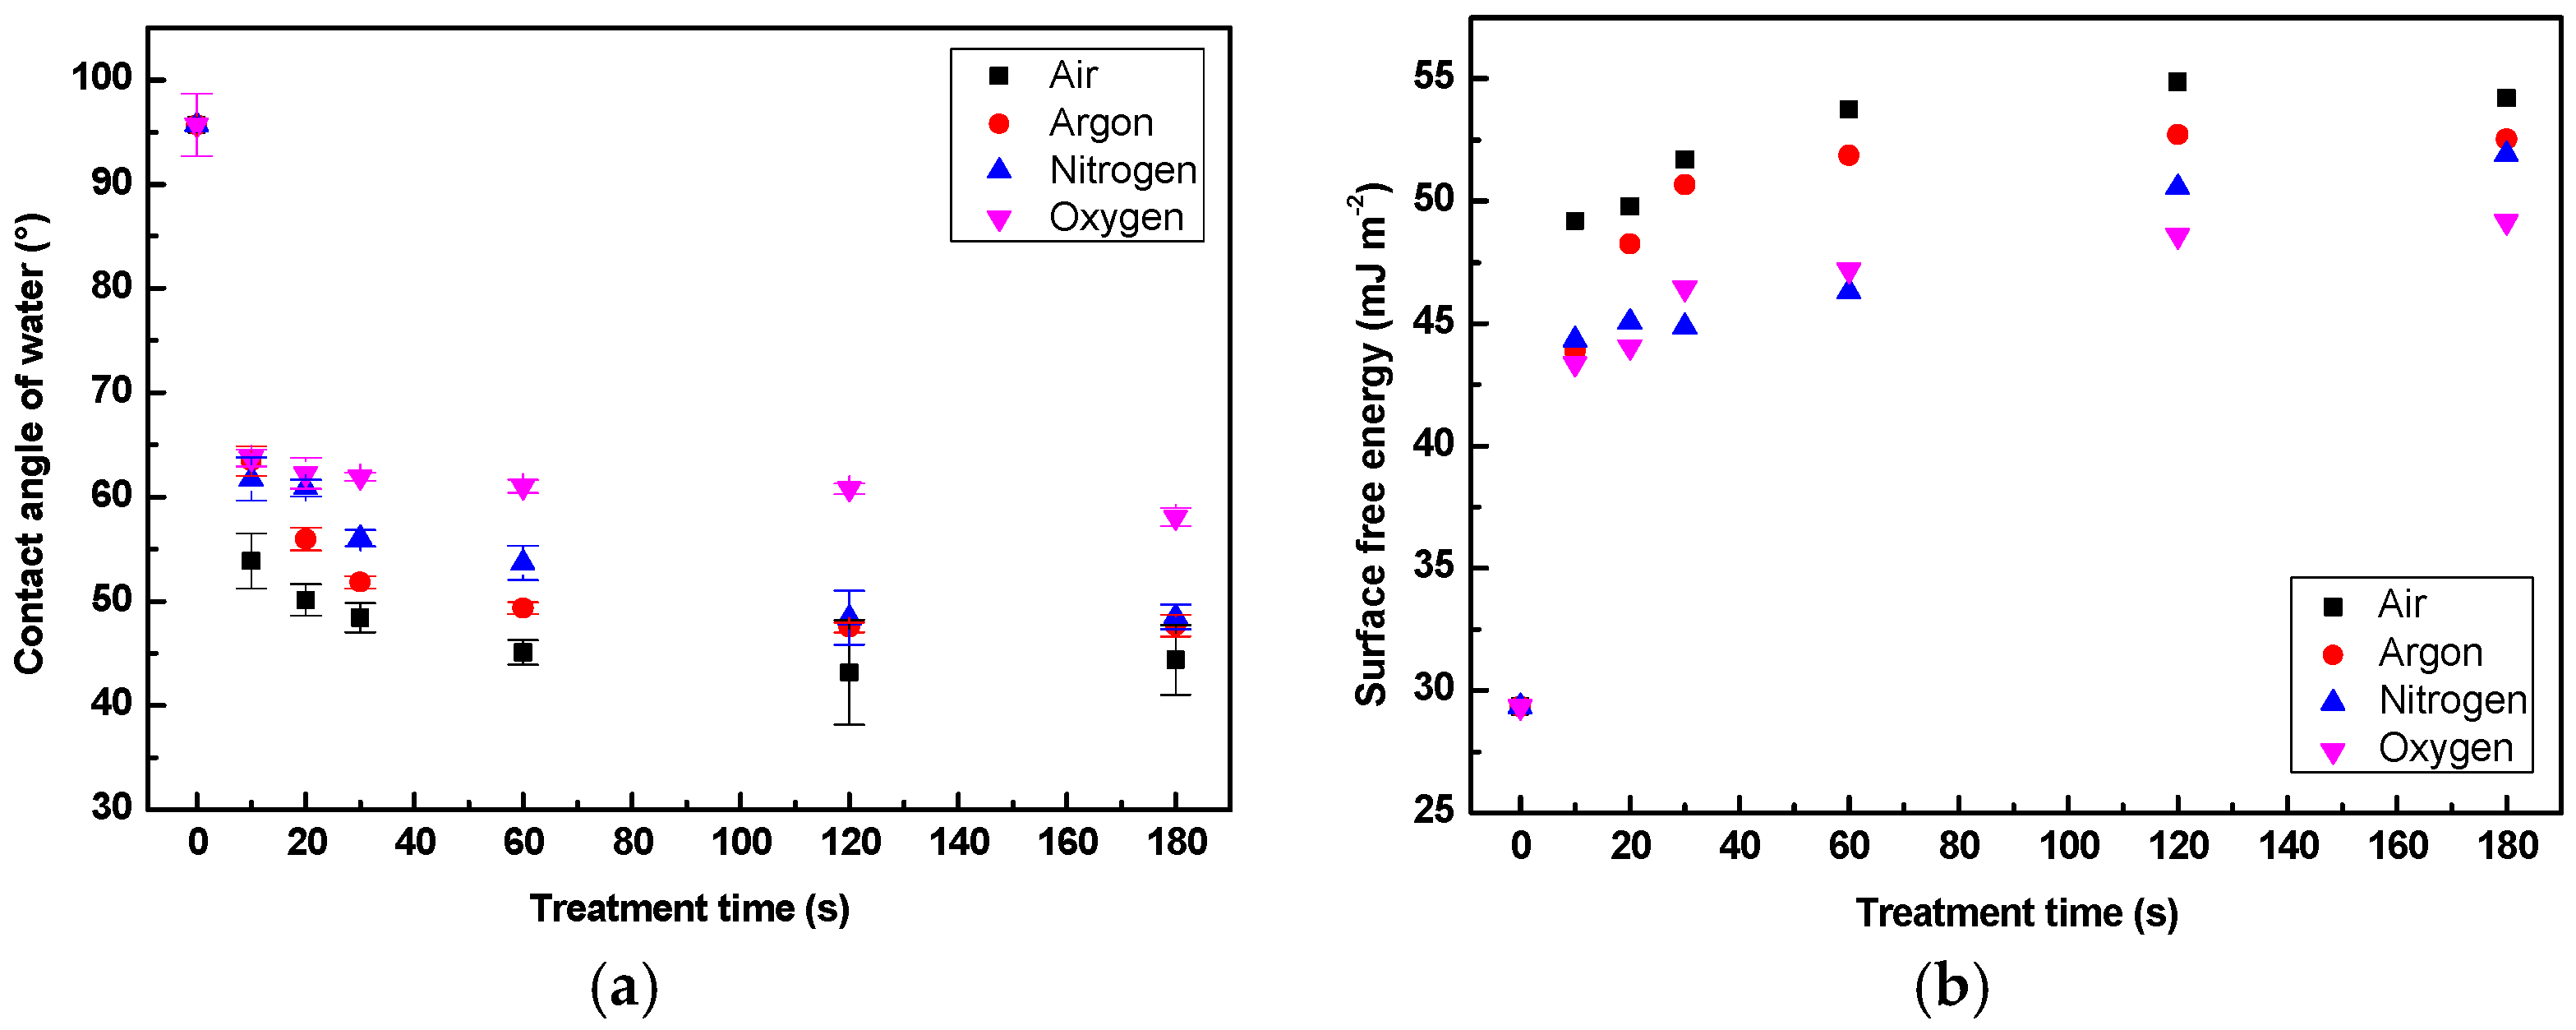
The impact of plasma treatment using air, argon, oxygen, and nitrogen on the surface hydrophilicity of LDPE in terms of the water contact angle and surface free energy as a function of treatment time is presented in Figure 3. As seen, the water contact angle for pristine LDPE substrate was initially 95.7°. Any material with contact angle greater than 90° is considered to be hydrophobic [42]. It is therefore evident that untreated LDPE corresponds to a hydrophobic surface. In fact, this poor surface wettability behavior was expected because LDPE surface is chemically inert and lacks polar active species. This outcome confirms that LDPE shows a low affinity to water and other polar liquids in general. Nevertheless, immediately after 10 s of plasma treatment, the LDPE surface exhibited a highly hydrophilic behavior, where the water contact angle is sharply reduced along with treatment time to 48°–61°, depending on the working gas. On the other hand, the total surface free energy has markedly improved in a time dependent manner. This improvement mainly occurs due to the increase in the value of the polar component of the total surface free energy, which validates the functionalization of LDPE surfaces. For a plasma treatment time of 60 s, the surface hydrophilicity improves further. However, as treatment time was prolonged up to 120 s, the contact angle of water levels off, where LDPE is not susceptible to any further reduction in the contact angle of water. This shows that a plasma saturation state on the film surfaces was reached. This finding mainly addresses the extent to which LDPE substrates could be modified using plasma discharge. Plasma treatment of LDPE surface under air has resulted in maximum hydrophilicity, considering the effects of surface functionalization and roughness on wettability. As seen later, surface morphological changes were indeed observed for plasma treated LDPE films.
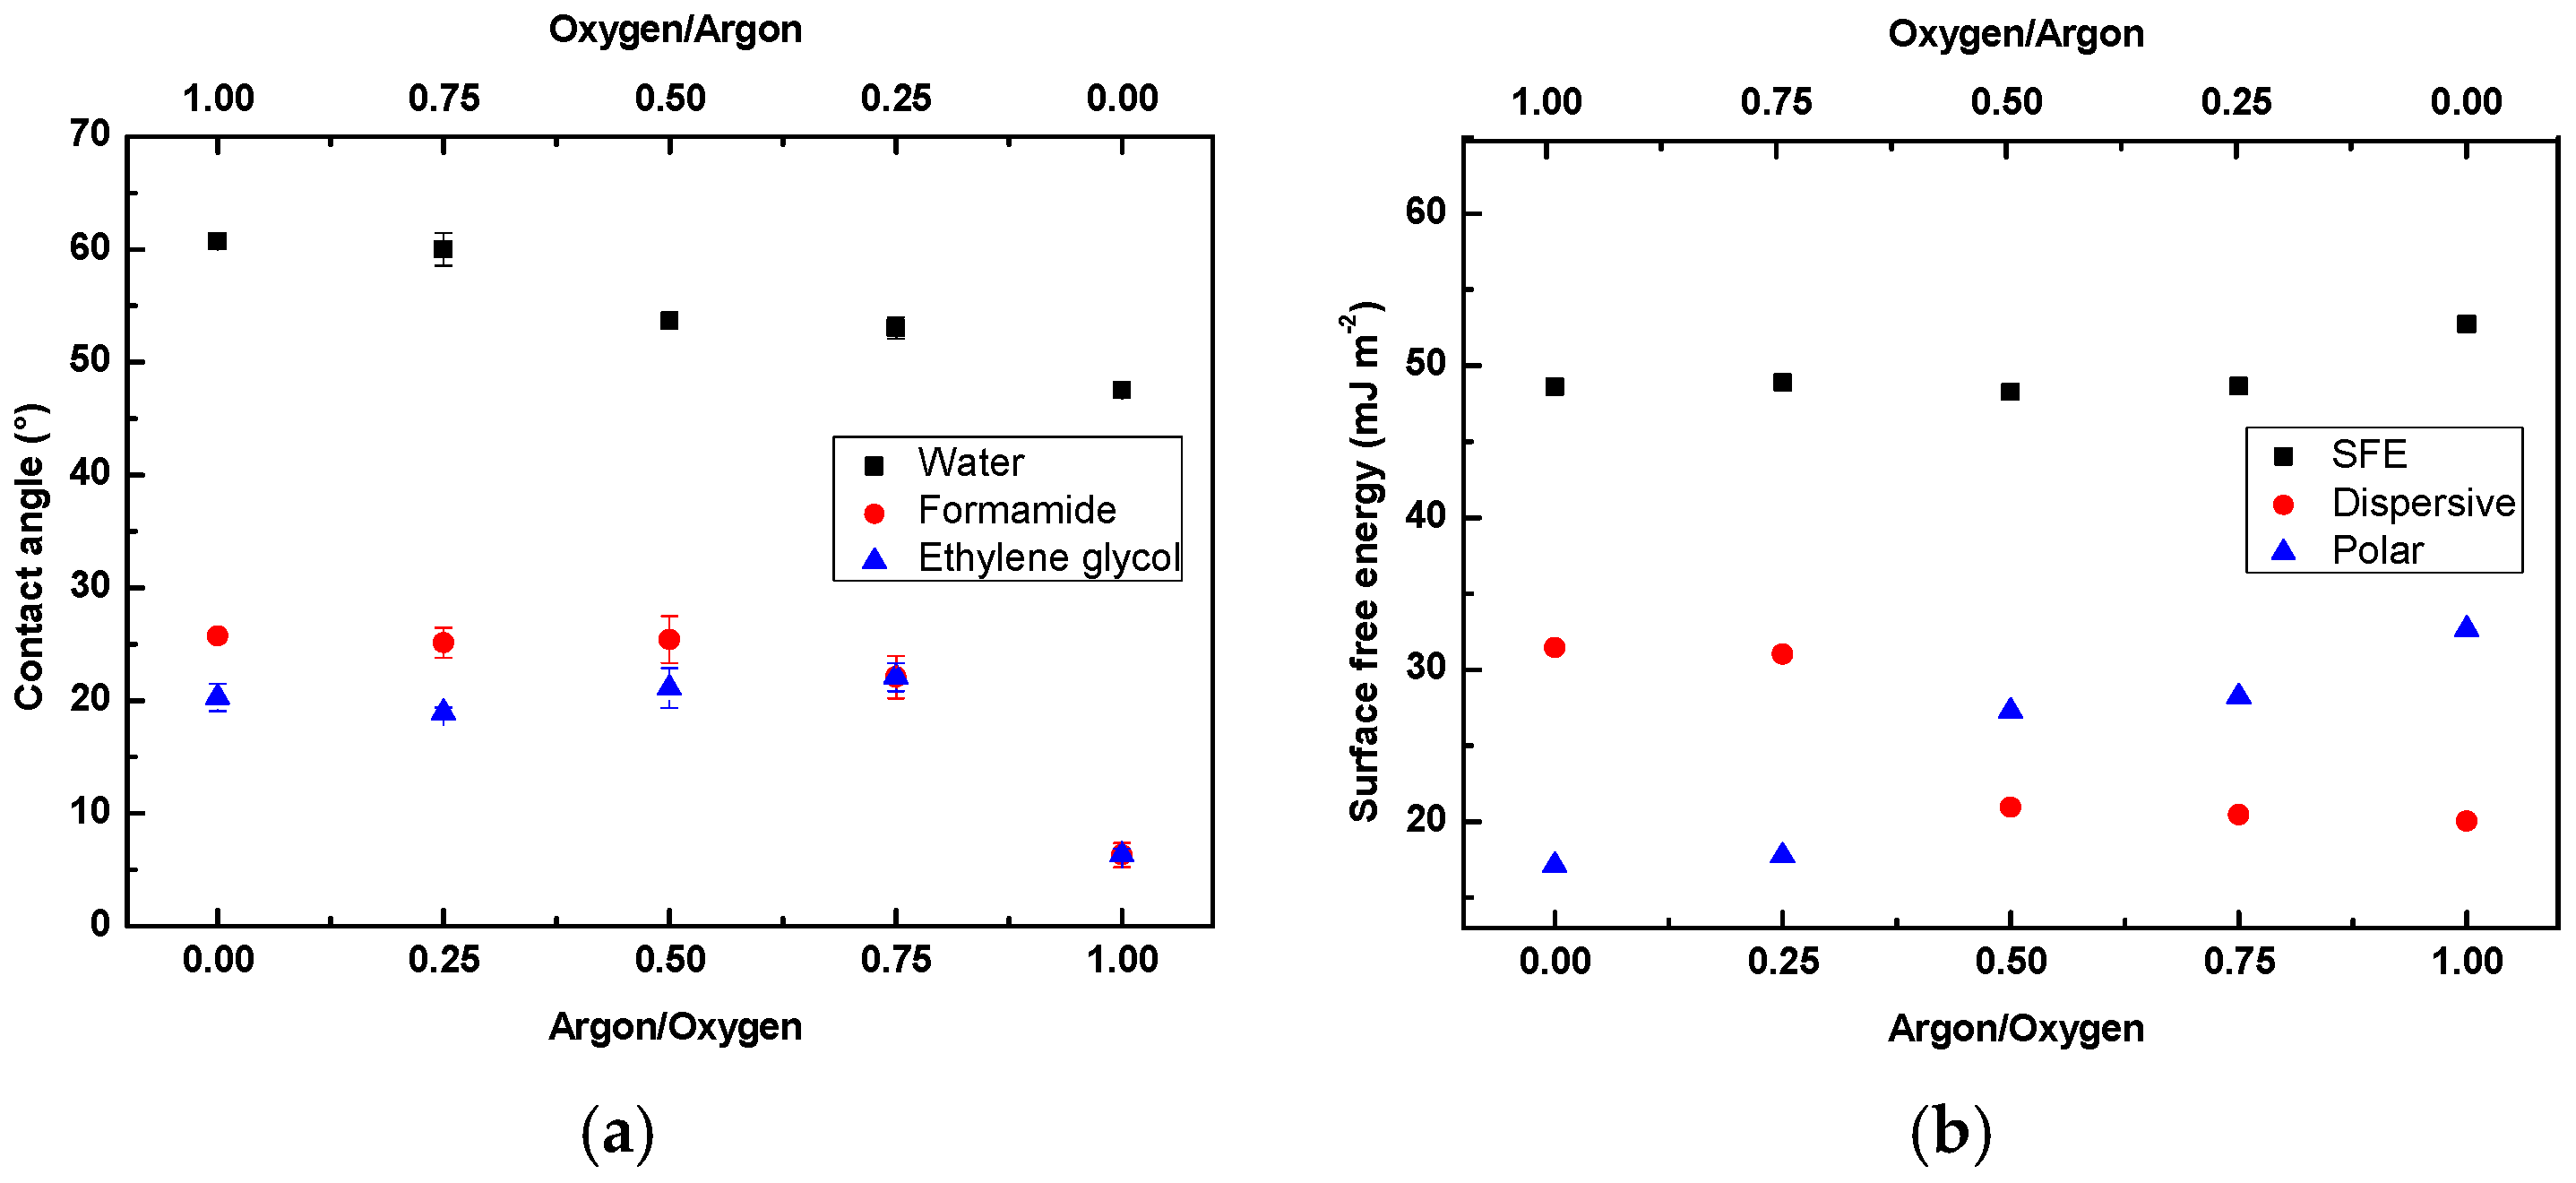
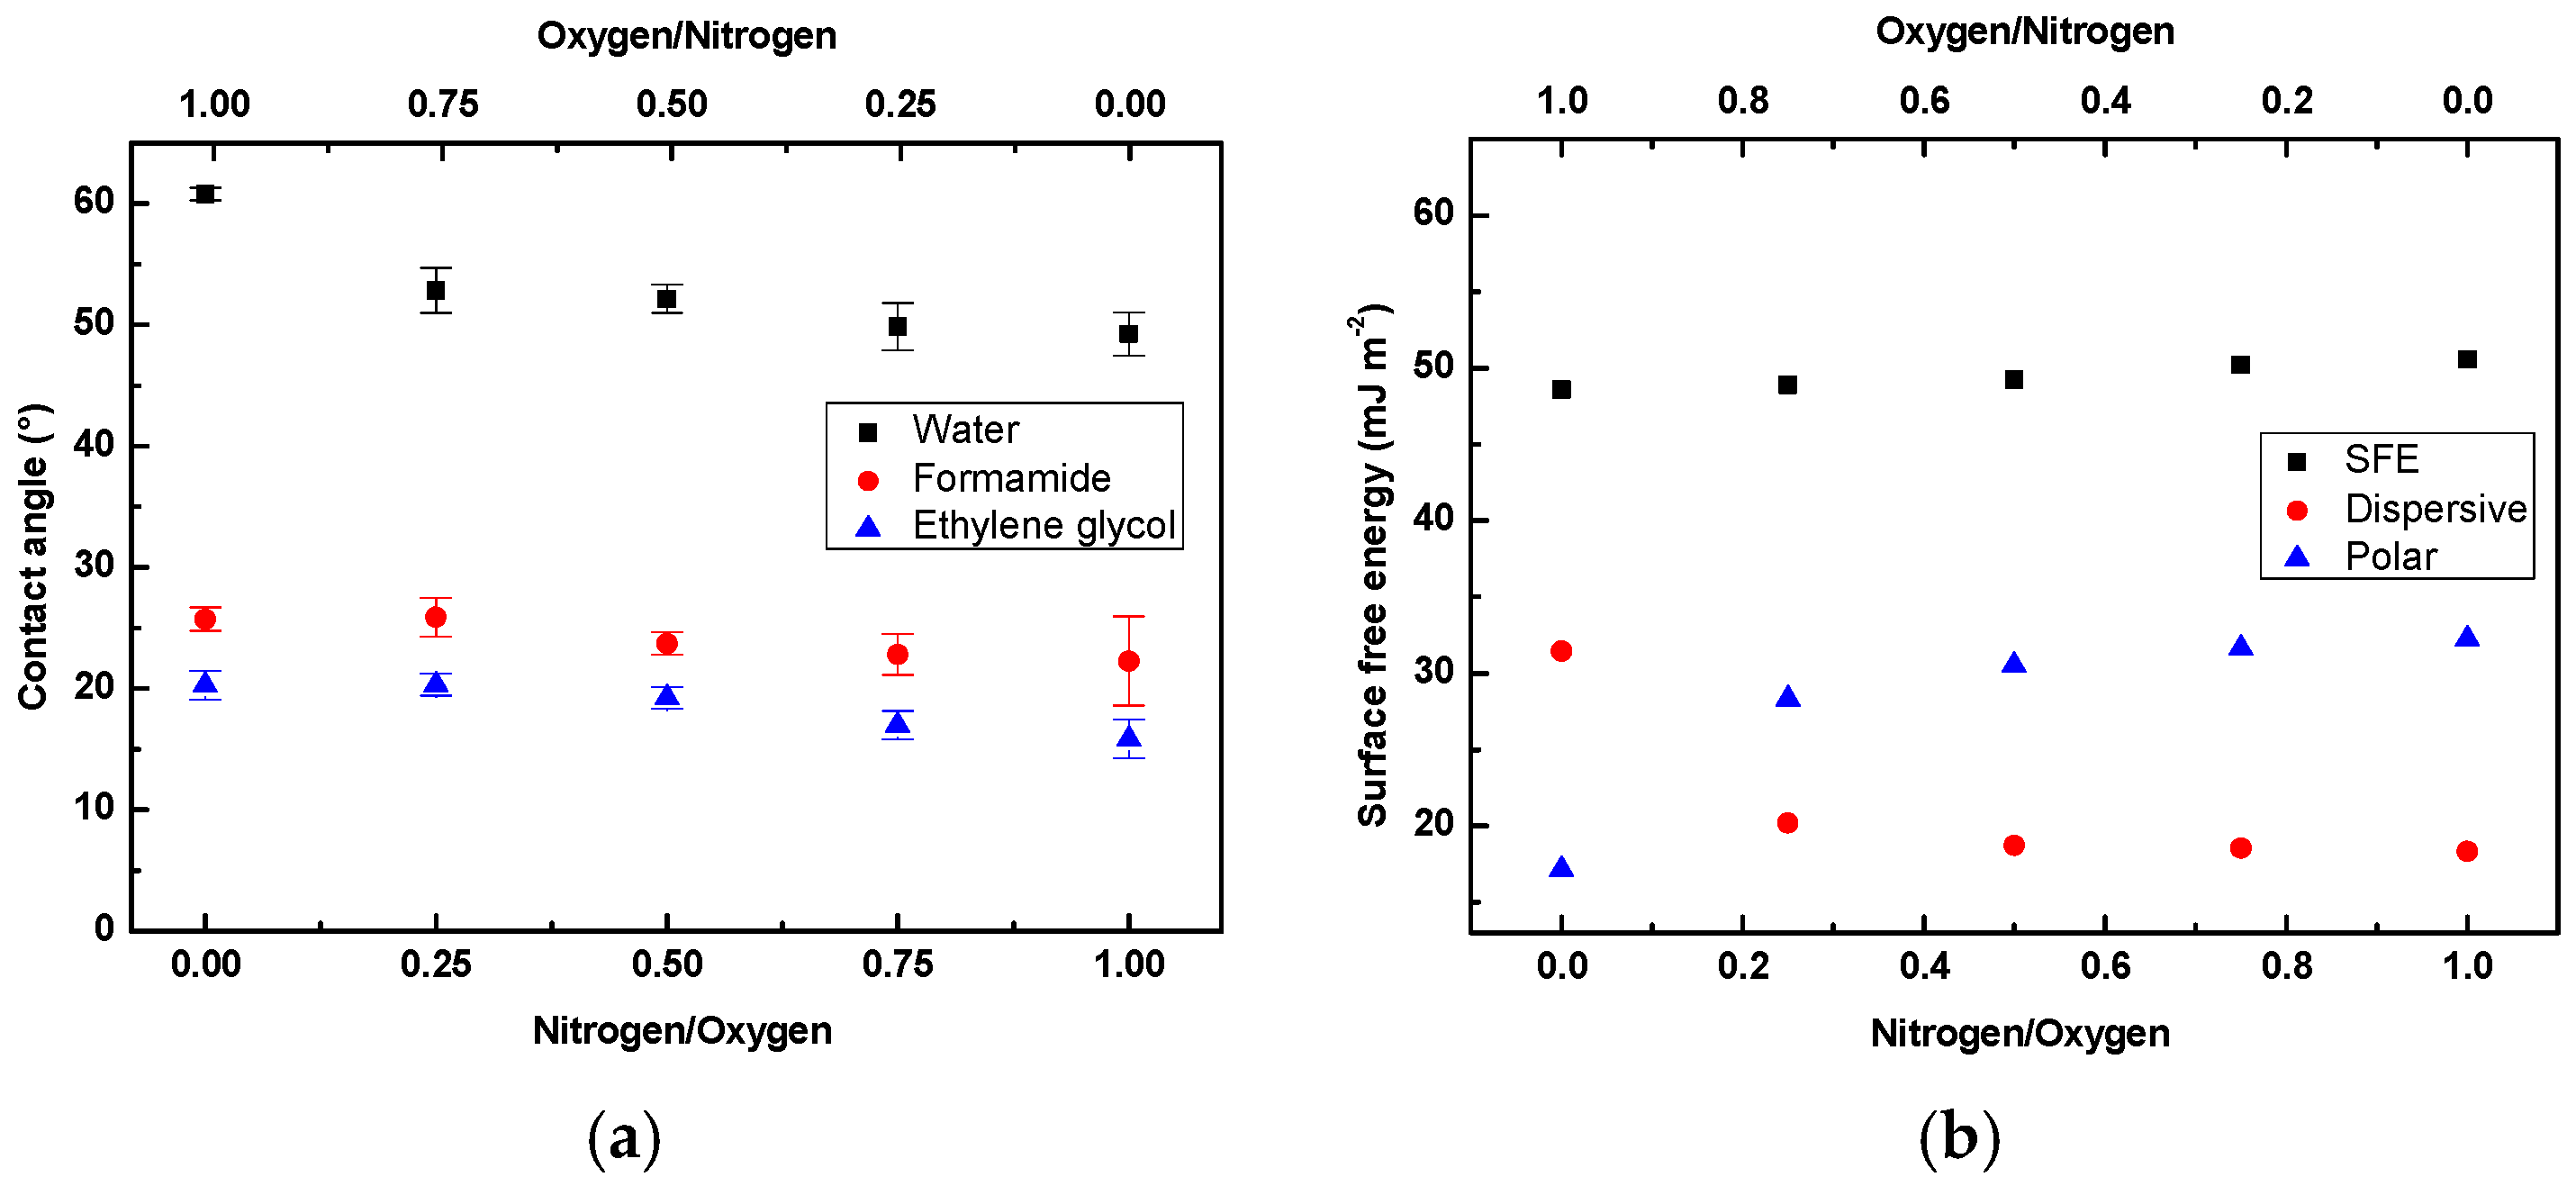
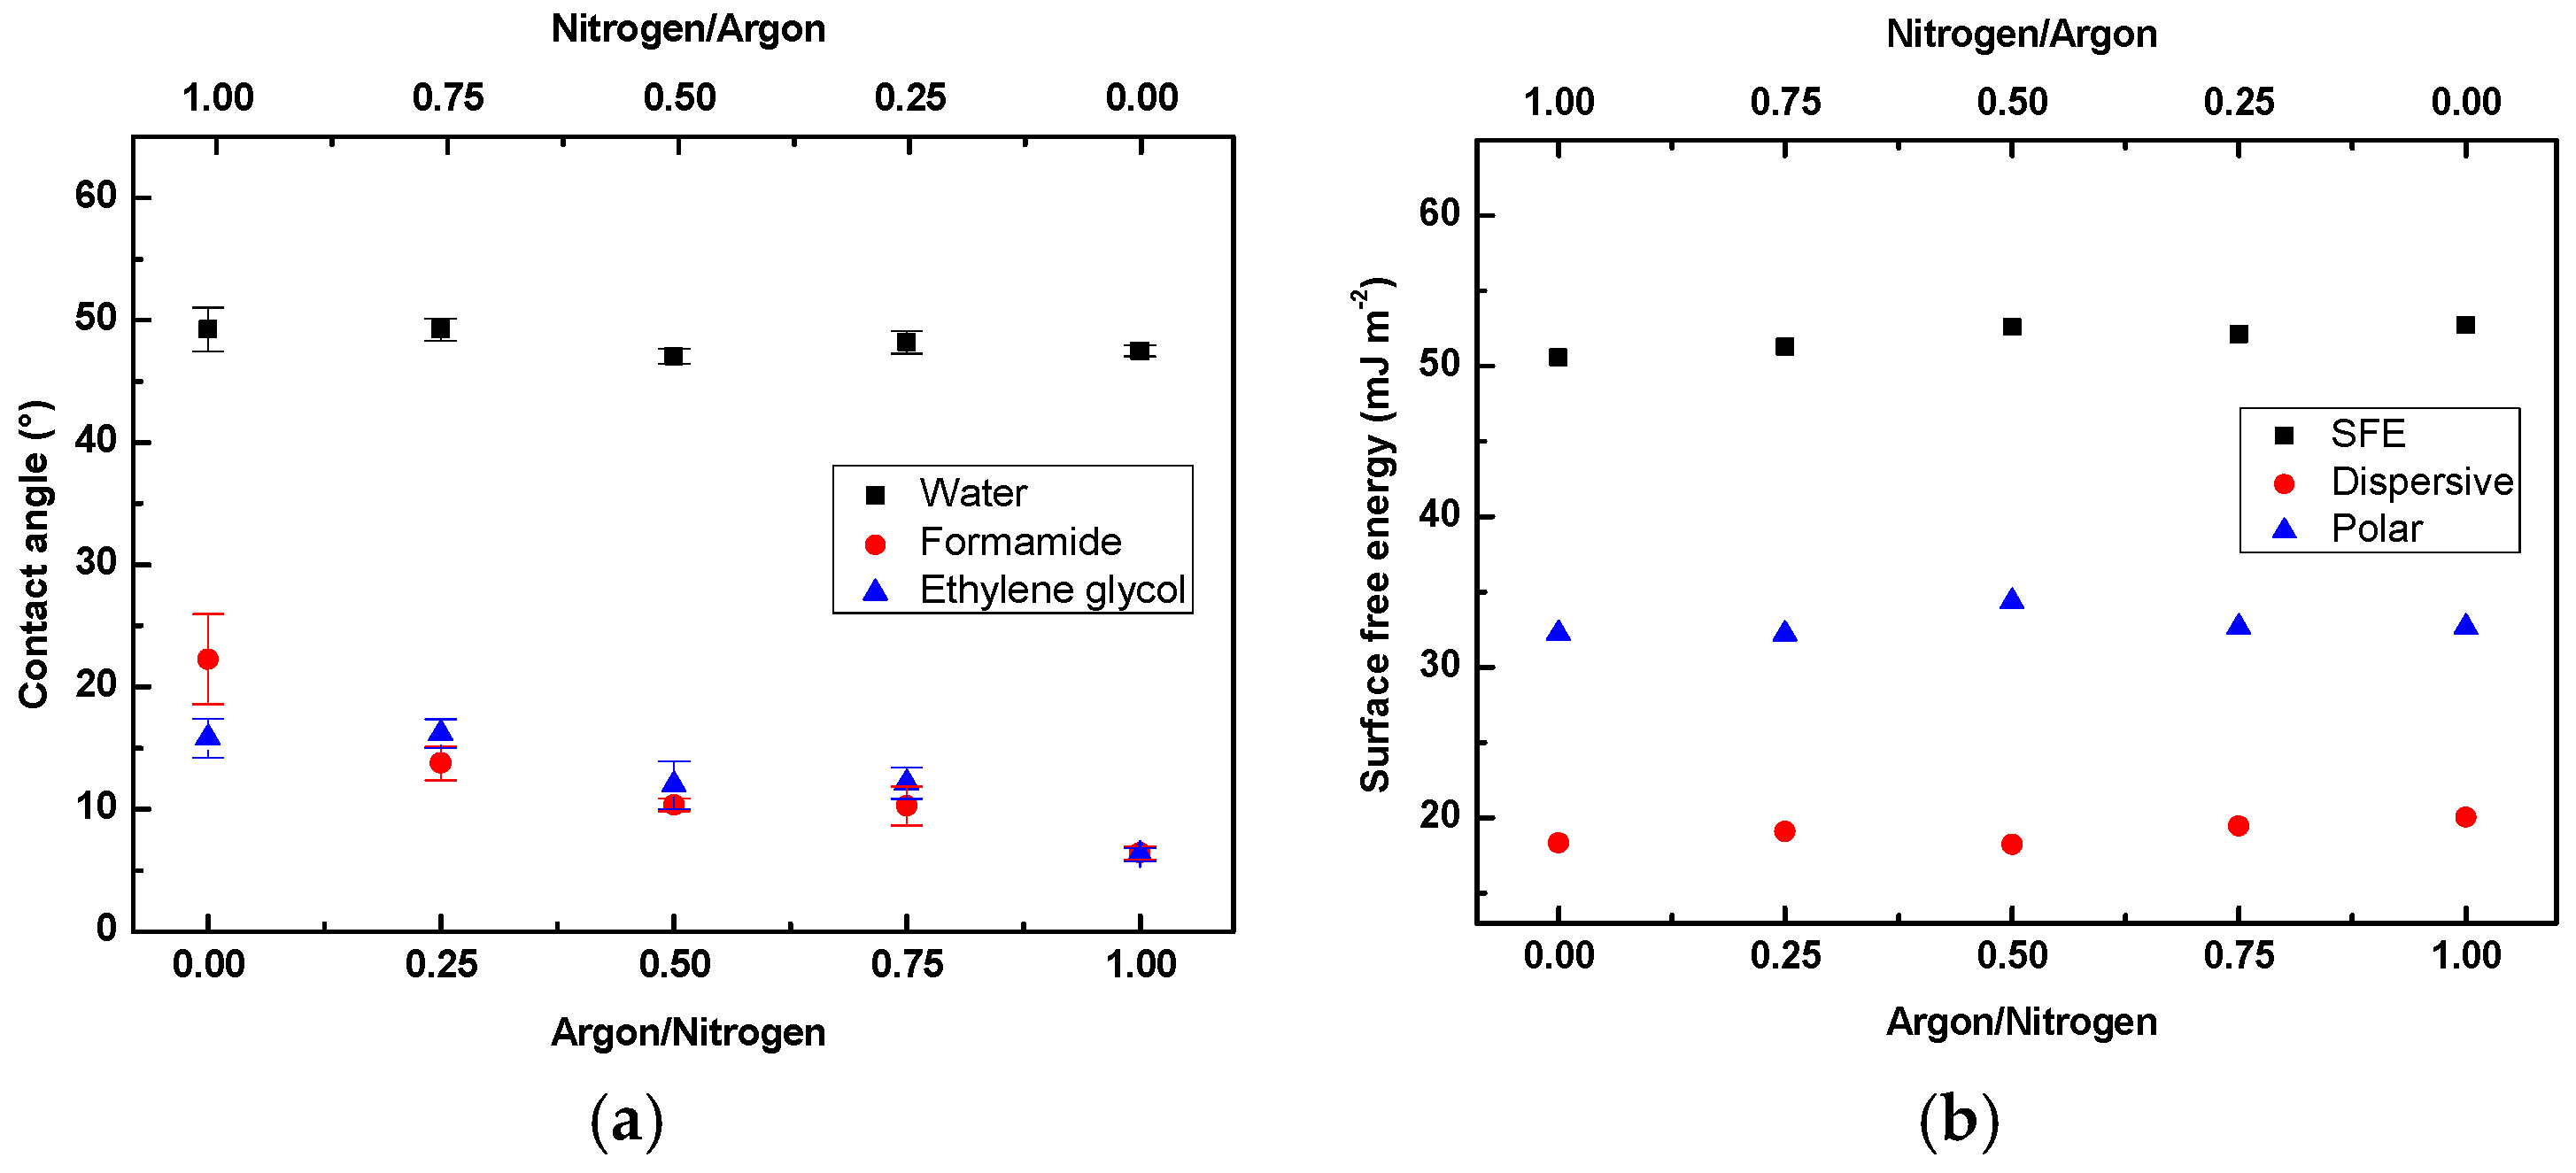
The hydrophilicity using gas mixtures, namely, argon/oxygen and nitrogen/oxygen plasma, as shown in Figure 4 and Figure 5 has slightly increased from those treated with pure oxygen upon increasing either argon and nitrogen concentrations. However, the effect is smaller compared to pure argon and nitrogen. The use of the nitrogen/argon mixture presented in Figure 6 caused only a slight increase in hydrophilicity of such treated LDPE, with a maximum achieved in the case of the use of pure argon. The results show that air plasma has demonstrated the most significant effects on increasing the wettability of the LDPE surface compared to other gases. Plasma treatment time of 120 s at 80 W of nominal power under air provided a minimum contact angle of 43.2° and maximum surface free energy of 54.9 mJ·m−2, representing optimal conditions for plasma treatment of LDPE surfaces. The decrease in contact angle and increase in surface free energy, particularly the polar component, confirm that RF plasma generates hydrophilic surface properties on LDPE within relatively short exposure times, which can be attributed to several factors. Mainly, the formation of new reactive oxygen- and nitrogen-containing functional groups incorporated onto the surface is promoted during the plasma treatment process. Additionally, the LDPE surface is enriched in free radicals immediately after removal from the plasma reactor, which are highly susceptible to atmospheric oxidation upon exposure to air. The other factor affecting hydrophilicity increase is the surface roughness, caused mainly by etching reactions. Moreover, plasma treatment can possibly inaugurate superficial reorientation of the polymer micro-domains, in which the hydrophilic regions are redirected to the surface of the substrate [43]. The effect of the latter factors on surface wettability can be explained in terms of the polarity of the interface. More polar groups result in increased molecular forces, consequently enhancing the interactions between surfaces that are in contact, hence increasing the hydrophilicity of the surface.
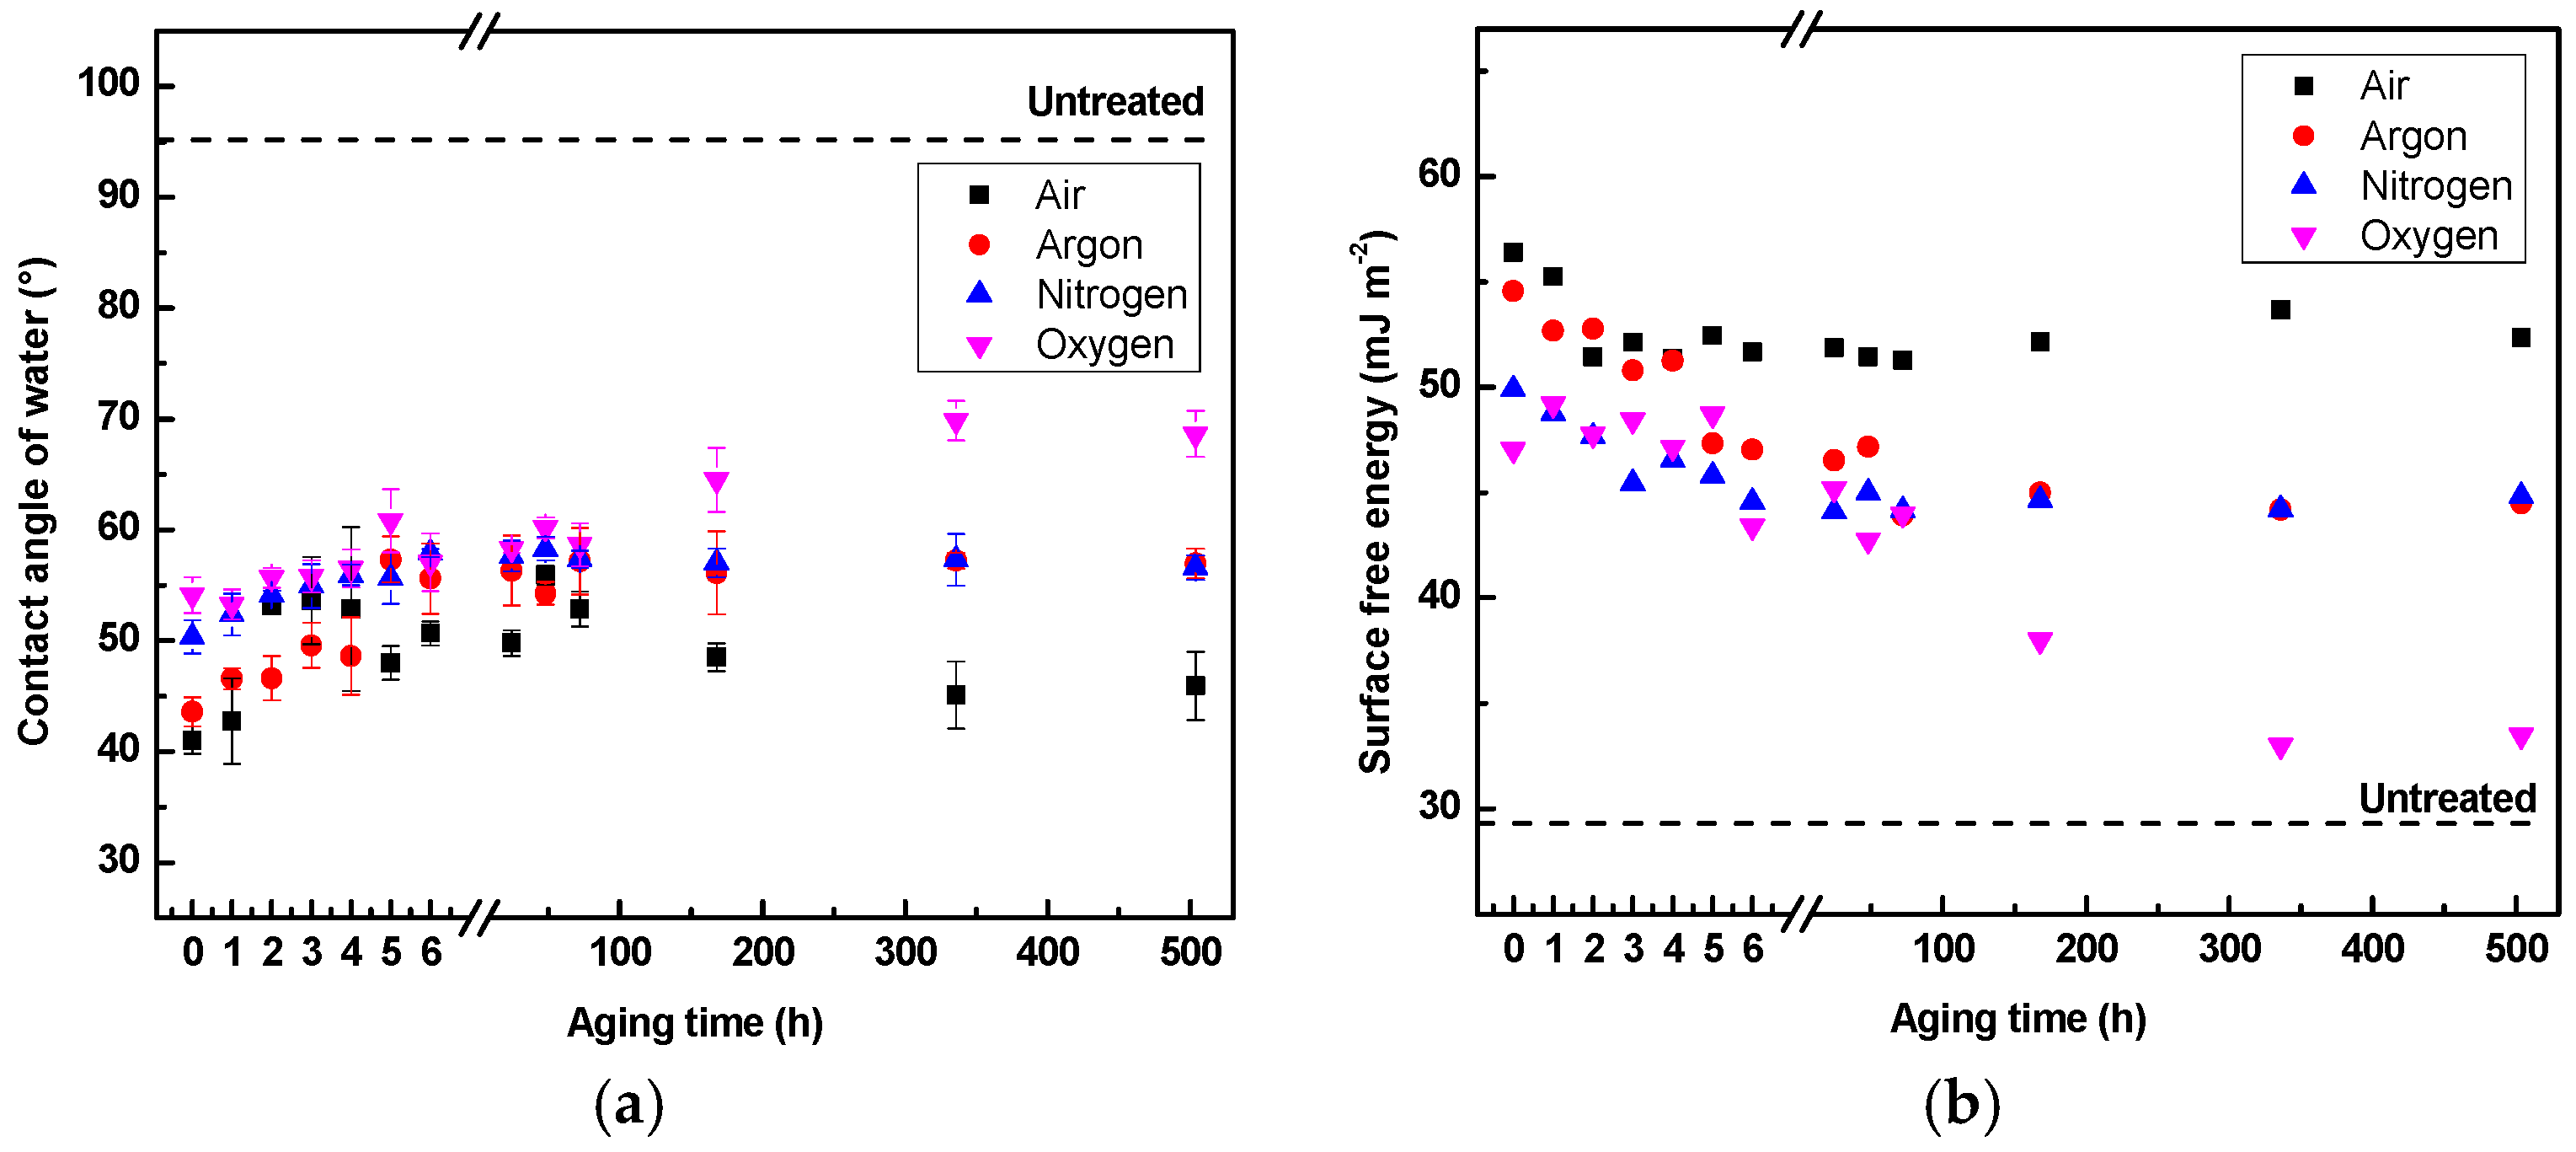
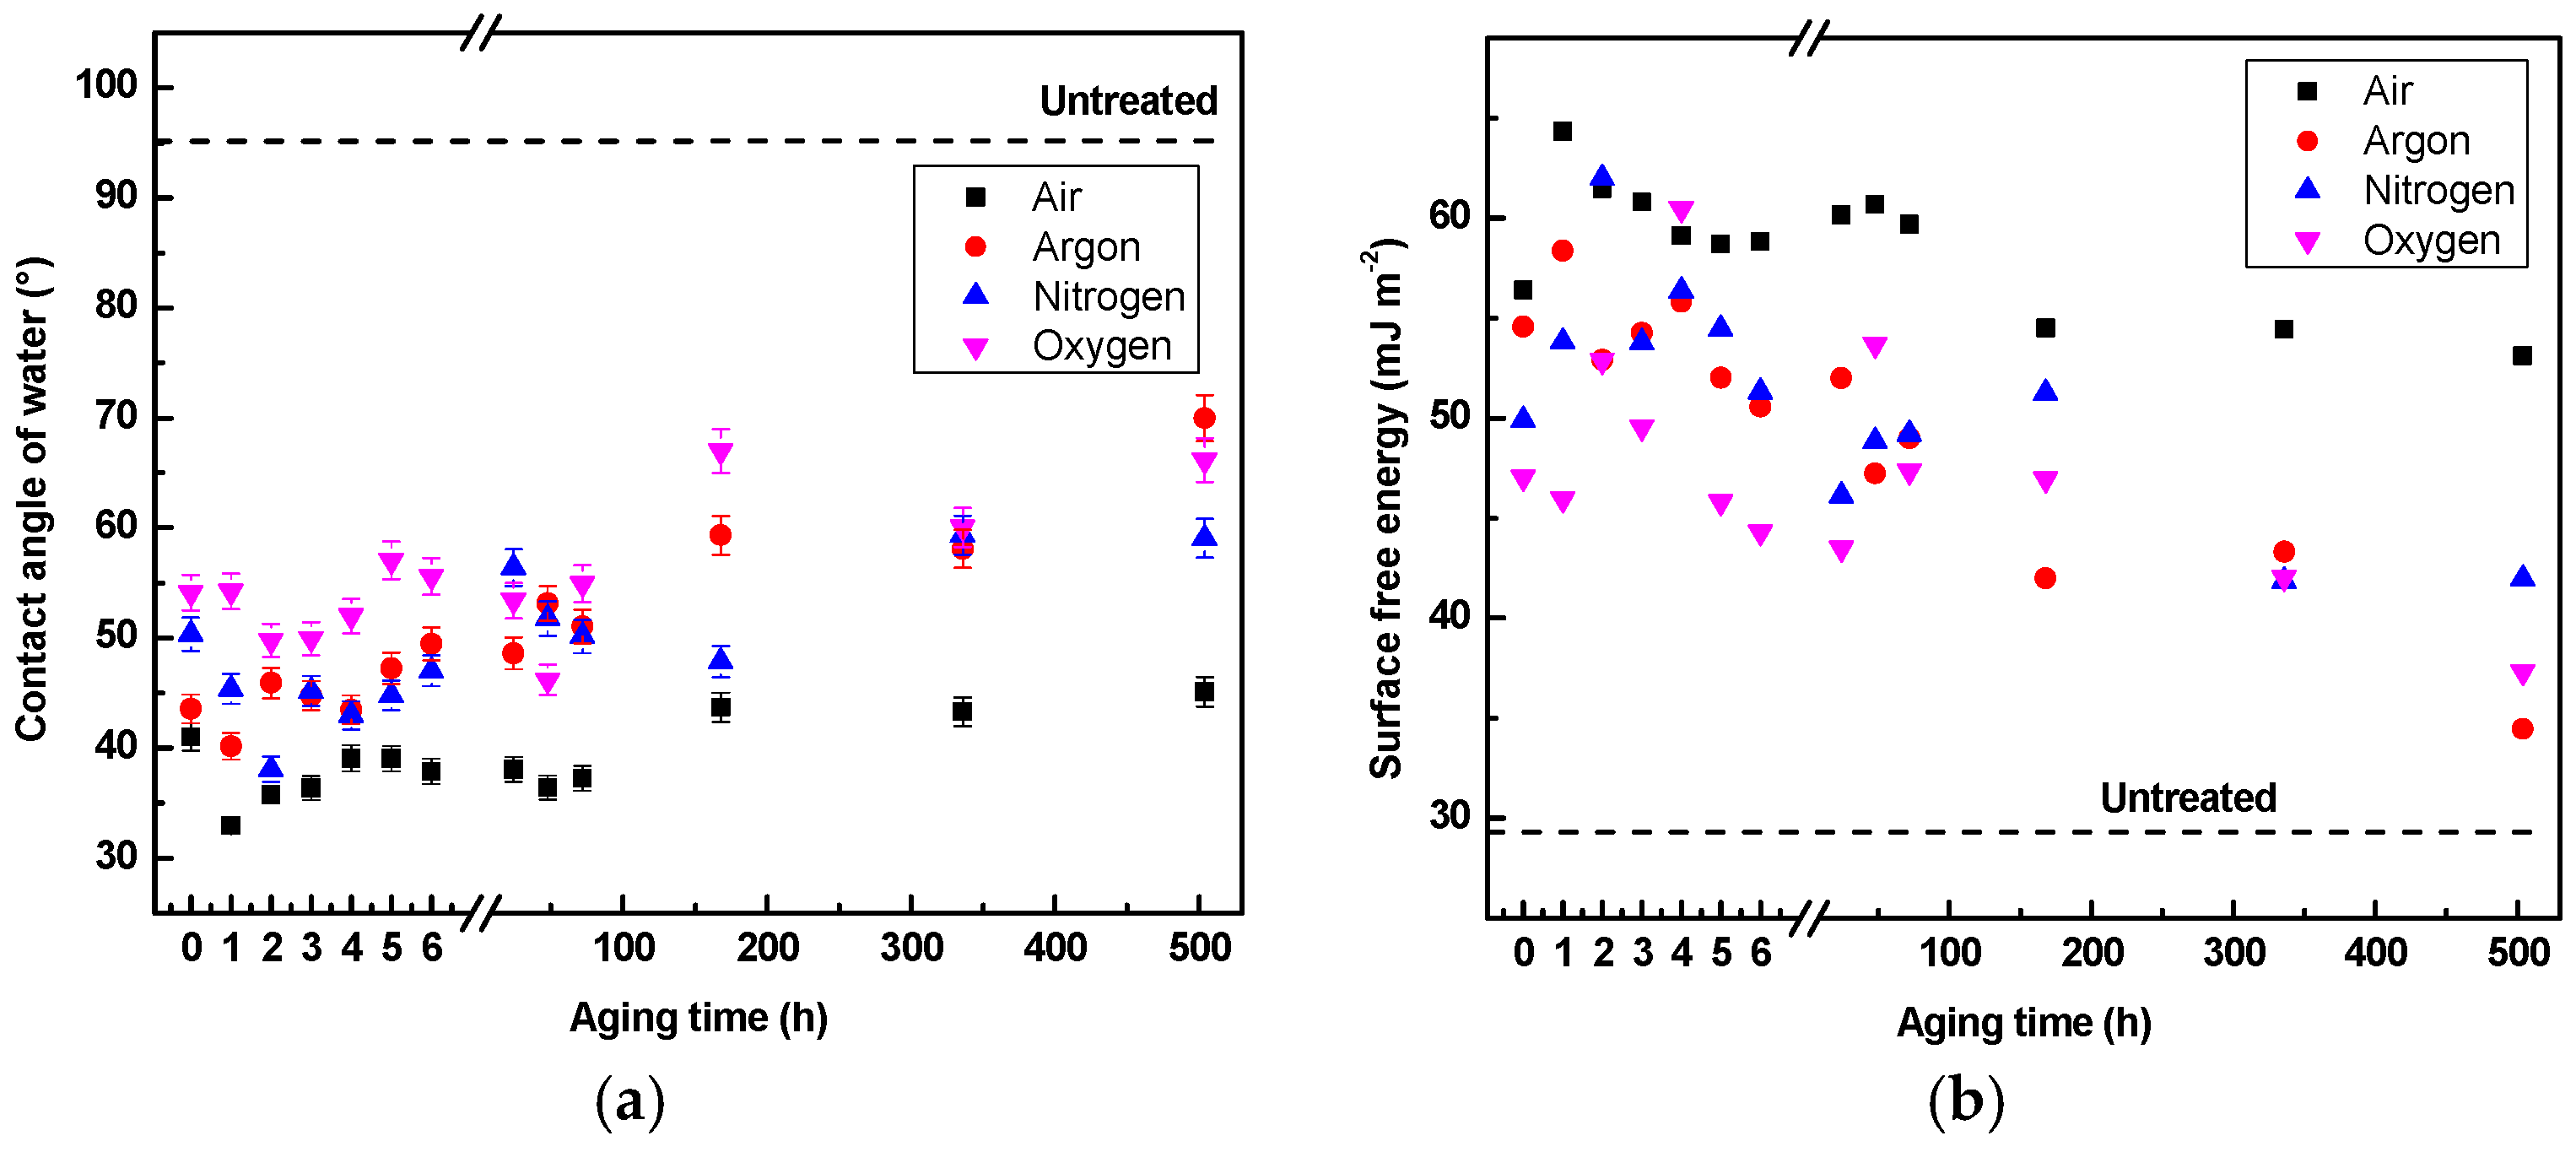
An aging study has been carried out for an extensive period of time after plasma treatment to study the stability of the polar groups formed during the functionalization processes. The hydrophobic/aging phenomenon can be explained in terms of the surface properties post plasma treatment. After plasma functionalization, the surface deviates from its equilibrium state due to an increase in surface free energy, which results in the formation of near surface gradients. Therefore, the surface tends to go back to its pre-plasma stage by reconstructing its surface to lower the surface free energy. The latter occurs by reorientation/migration of the polar groups, which are redirected back to the bulk of the polymer [44]. The aging phenomenon mainly depends on the storage condition, material properties and treatment type. Figure 7 and Figure 8 show the evolution of the water contact angle and surface free energy with respect to aging time for LDPE treated using different gases and storage conditions in ambient air and water medium. As seen, the aging effect (water contact angle increase) occurs predominantly during the first 6 h. The hydrophobic recovery of treated LDPE stored in air occurred at a relatively faster aging rate than in the case of LDPE stored in water media. Interestingly, hydrophobic recovery for LDPE samples treated with air, nitrogen, and argon was reversed upon immersion in water as the contact angle initially decreases after 1 hour and using oxygen after 2 h. This outcome could be due to the polarity of water, which forces the formed hydrophilic groups toward the LDPE surface, or else additional functional groups could be formed as a result of the free radicals’ interactions with water [45]. Increased aging time was probably responsible for washing out of these products, providing them with similar aging behavior as treated samples stored in air. However, it was found that this effect was only temporary, because the contact angle increases again at prolonged aging times, yet the values still fall below the untreated values. The hydrophilicity of the LDPE surface lasted for a longer time for samples treated in air, as the contact angle achieved lower values in comparison to other gases used. This outcome could be attributed to combination effects of individual gases in air plasma with high oxidation energy and surface etching (roughness changes).
3.2. Adhesion Investigation
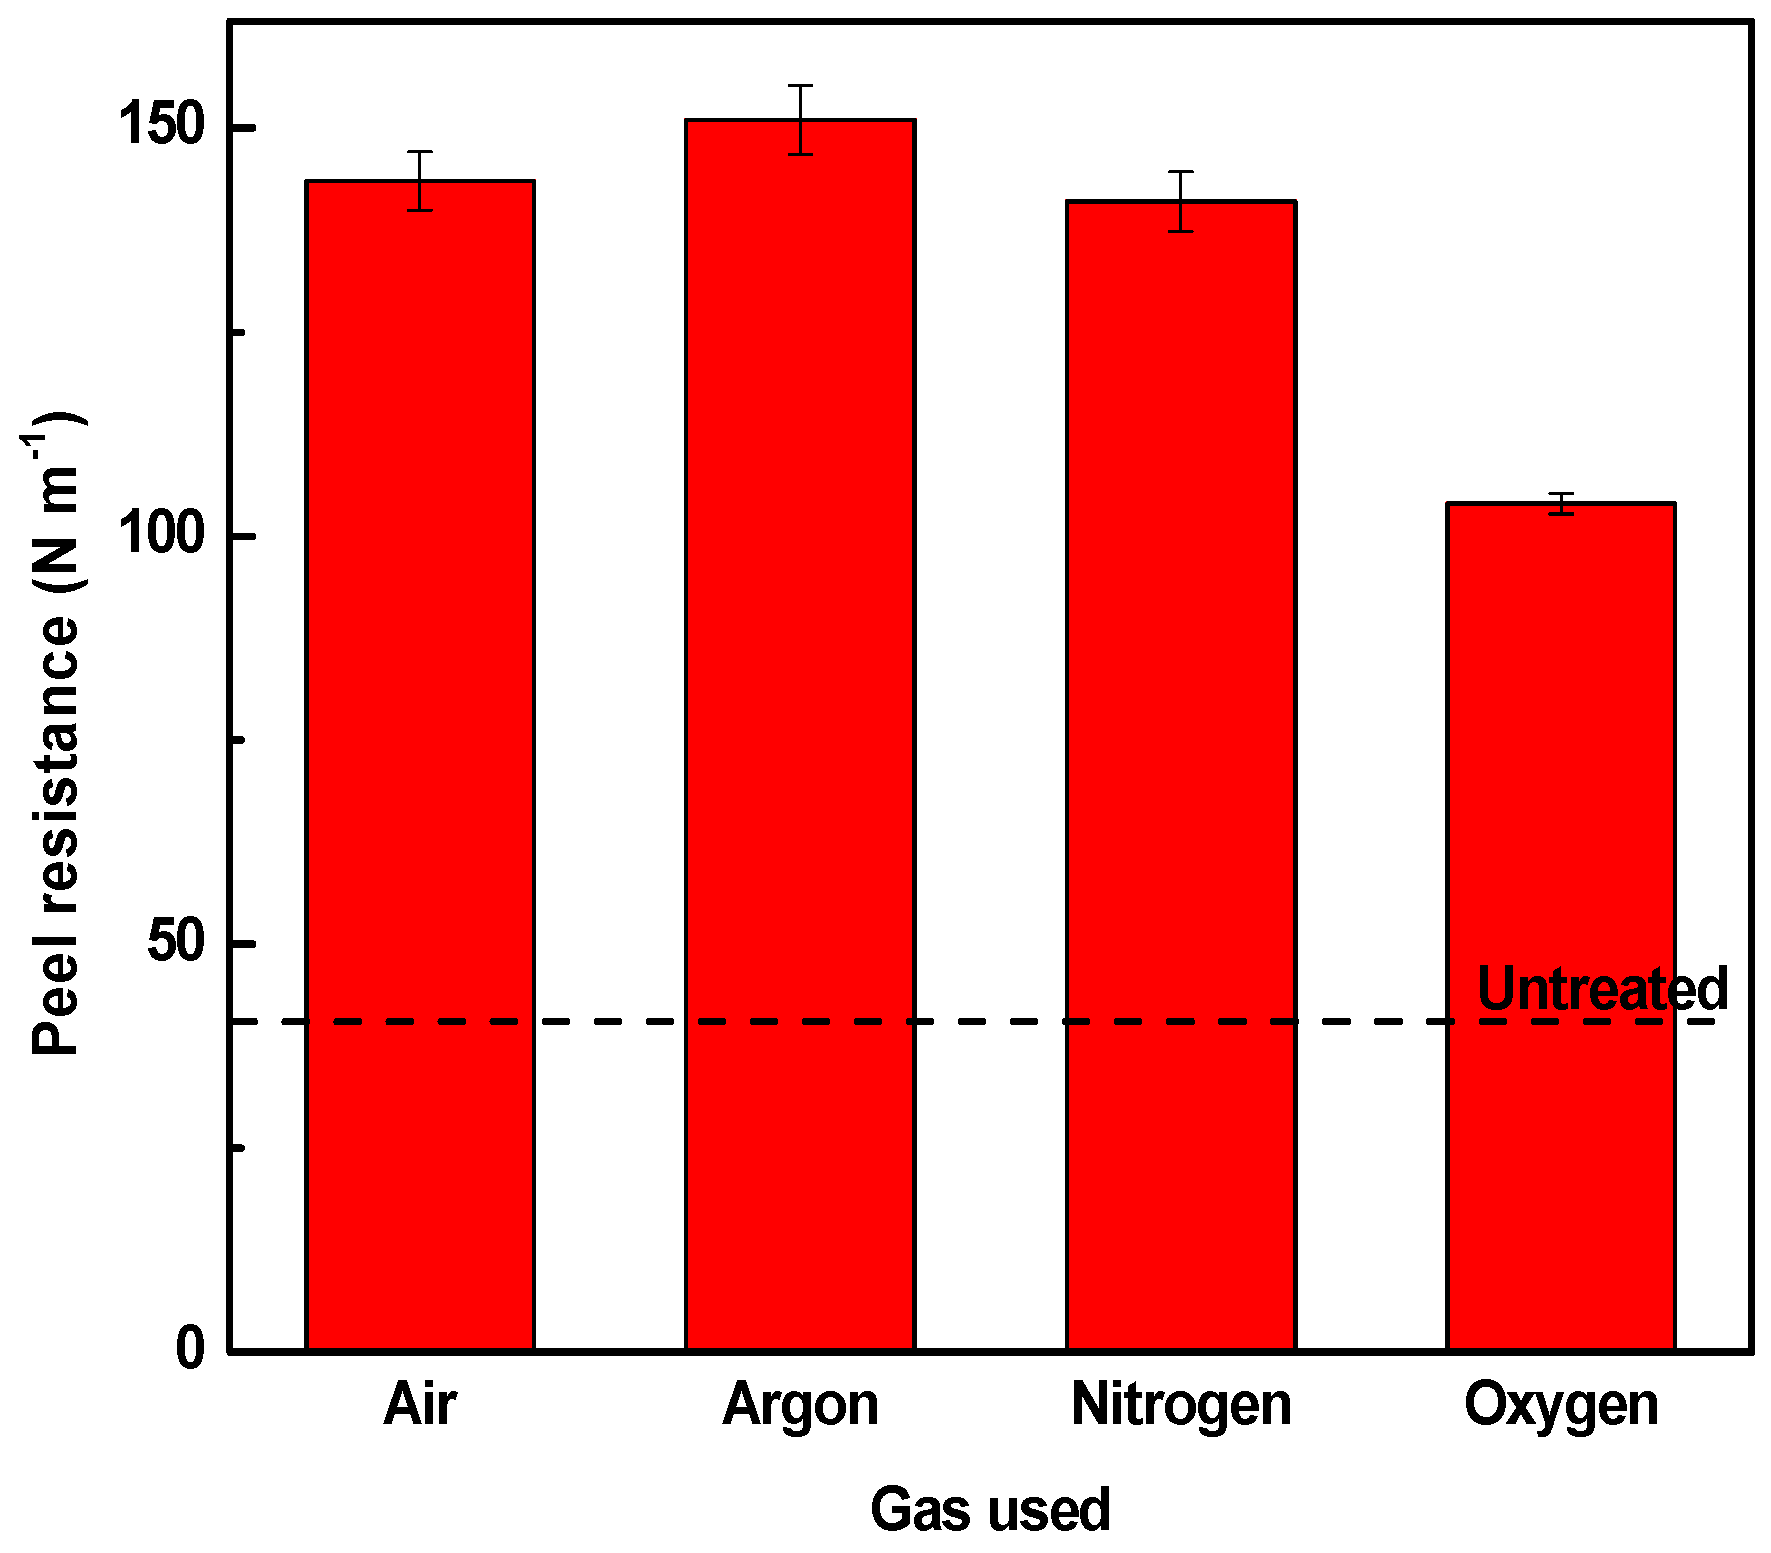
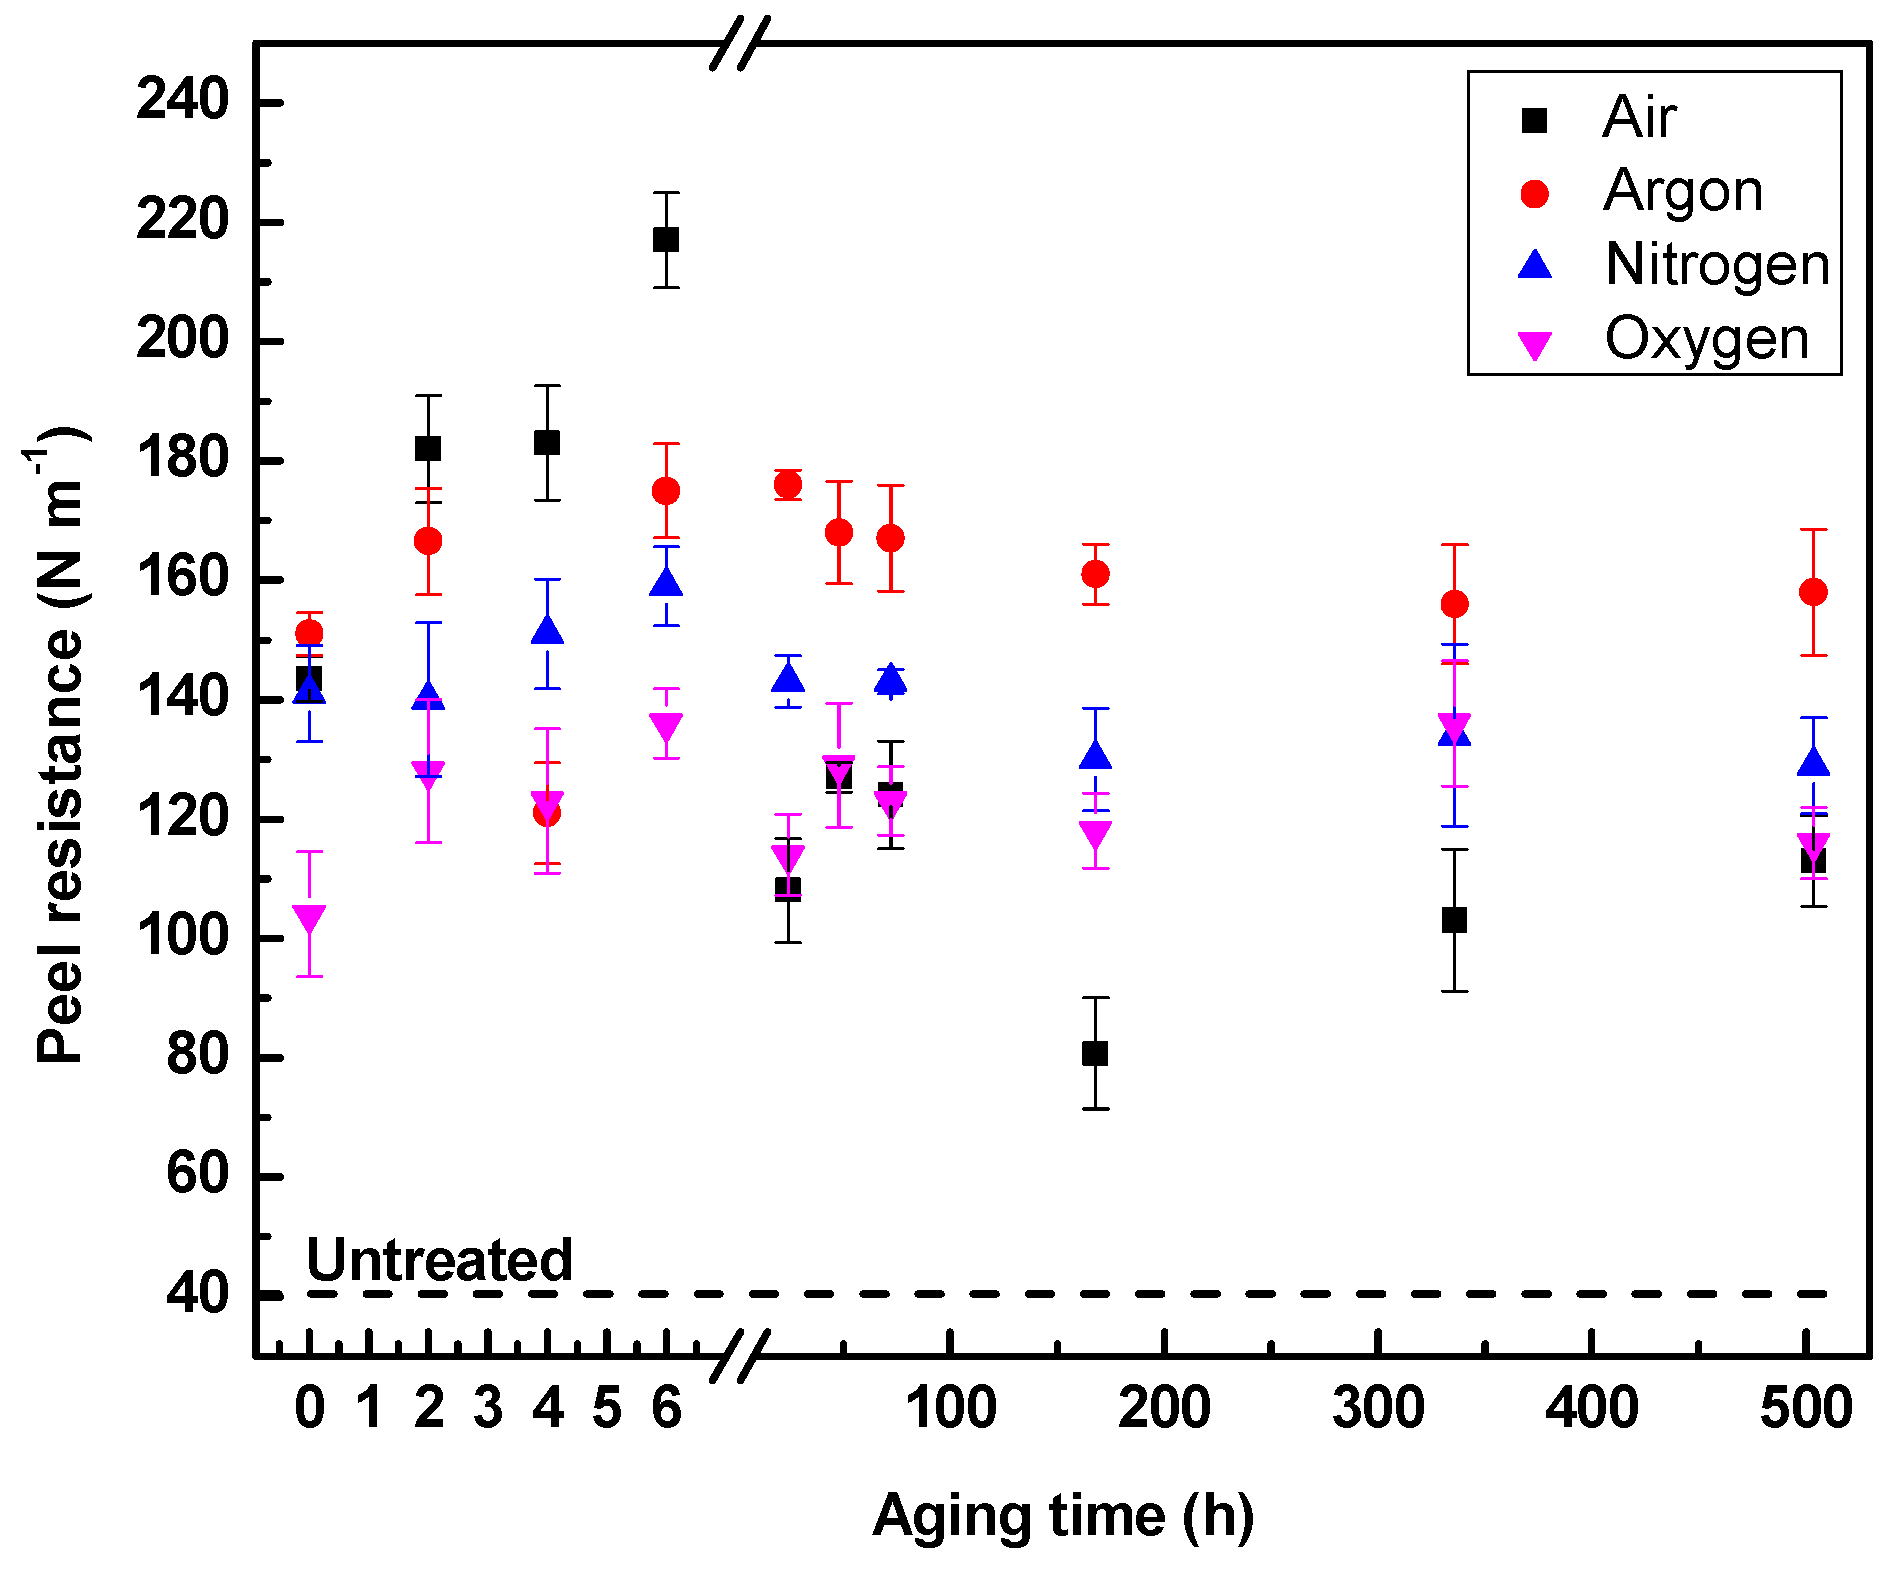
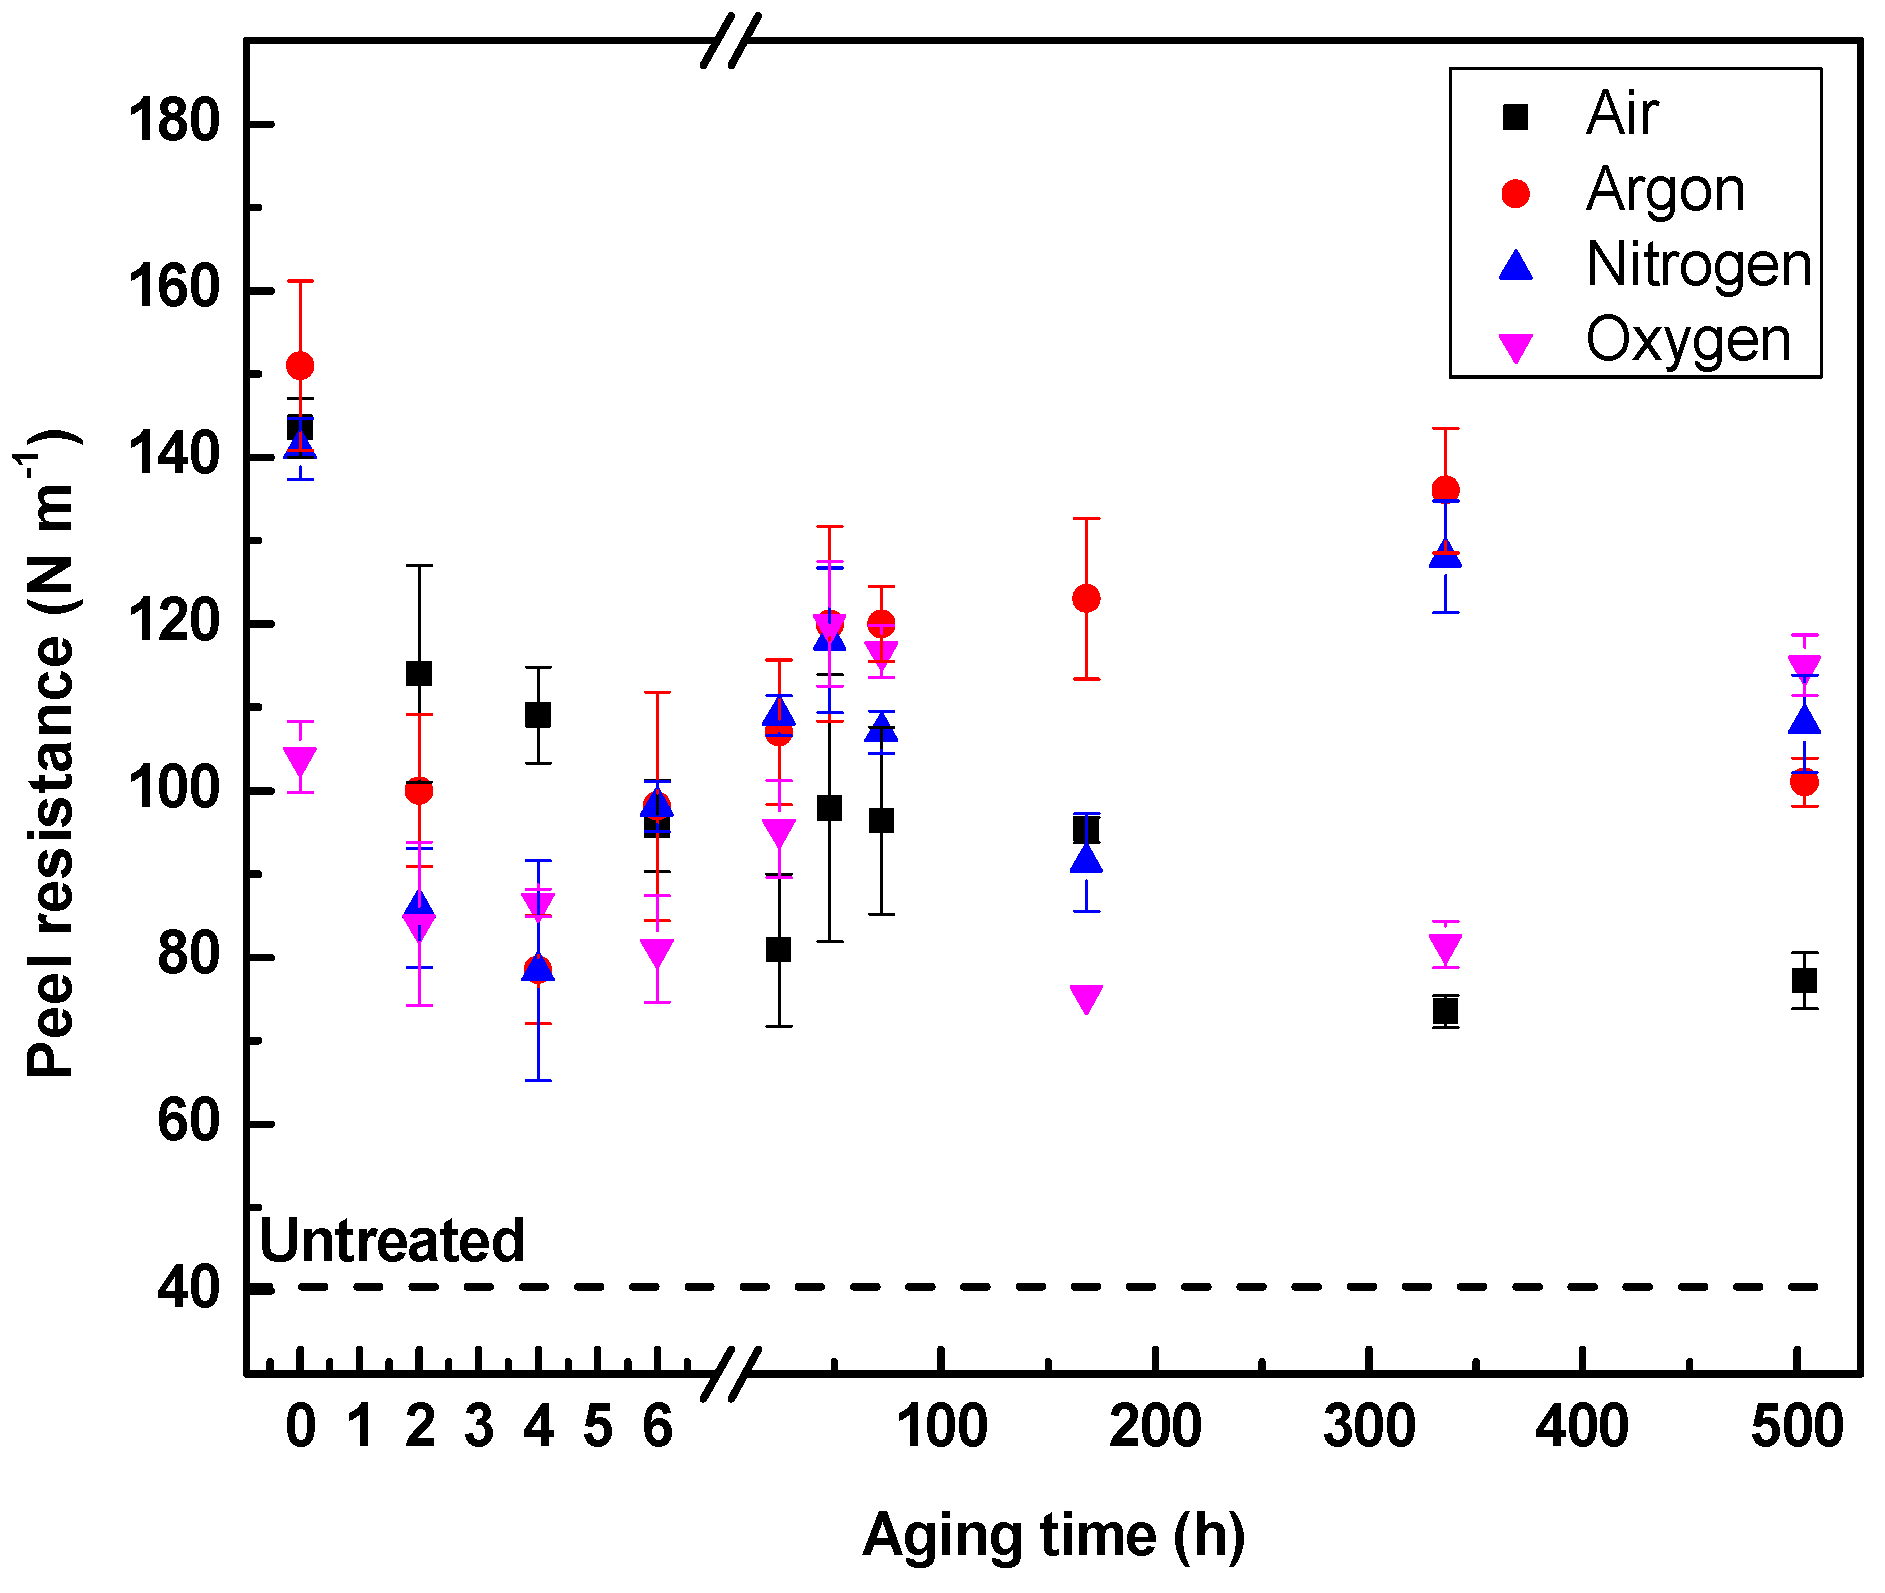
The plasma treatment of LDPE foils led to the improvement of adhesion properties as well, which are closely related to the wettability. The surface treatment varied based on the reactivity of the gases used, their ability to introduce new polar functional groups and the extent of etching. Apparently, as LDPE contains only non-polar hydrophobic groups, newly formed polar functional groups (oxygen and nitrogen containing) together with etching were responsible for the increase in wettability and adhesion represented by the peel resistance. Figure 9 represents the peel resistance changes of LDPE after plasma treatment using different gases. According to the values shown, the use of argon and nitrogen led to the highest values of peel resistance. In contrary, the plasma treatment of LDPE in oxygen gas was responsible for achieving the lowest values of peel resistance, which is in a good correlation with contact angle results. The aging effect on the plasma treated LDPE samples stored in air Figure 10 and water medium Figure 11 was studied as well. A re-arrangement of mobile polar species or low-molecular weight oxidative products formed during and immediately after plasma treatment with subsequent air exposure led to the aging phenomenon. These polar groups were reoriented toward the backbone of the material, which caused the reduction of surface polarity over time, and thus, surface wettability and adhesion decreased as the aging process occurs [46]. Aging results varied based on the media in which these samples were kept. Plasma treated LDPE samples stored in air showed an increasing trend in peel resistance during the first 6 h as post-oxidation reactions occur on the treated surface. Additional aging time led to the deterioration of adhesion properties and the decrease in peel resistance. The minor decrease was observed after three weeks of aging. Nevertheless, the peel resistance was still higher for treated LDPE than for untreated LDPE. Aging of samples in water media did not provide the same results as in air media, as shown in Figure 11. Water as a polar molecule can form hydrogen bonds with the formed polar groups or attract low-molecular oxidative products on the treated LDPE surface. An initial decrease of peel resistance until 4 h was observed for LDPE samples treated with argon and nitrogen stored in water medium with subsequent slightly increasing and decreasing tendencies with advanced aging time. The initial decrease of peel resistance for LDPE treated by oxygen and air aged in water medium was observed during the first 6 and 24 h, respectively. This adhesion decrease was probably caused by diffusion of plasma produced low-molecular weight oxidative products towards the LDPE surface, forced by the water medium.
3.3. Surface Chemistry Analysis
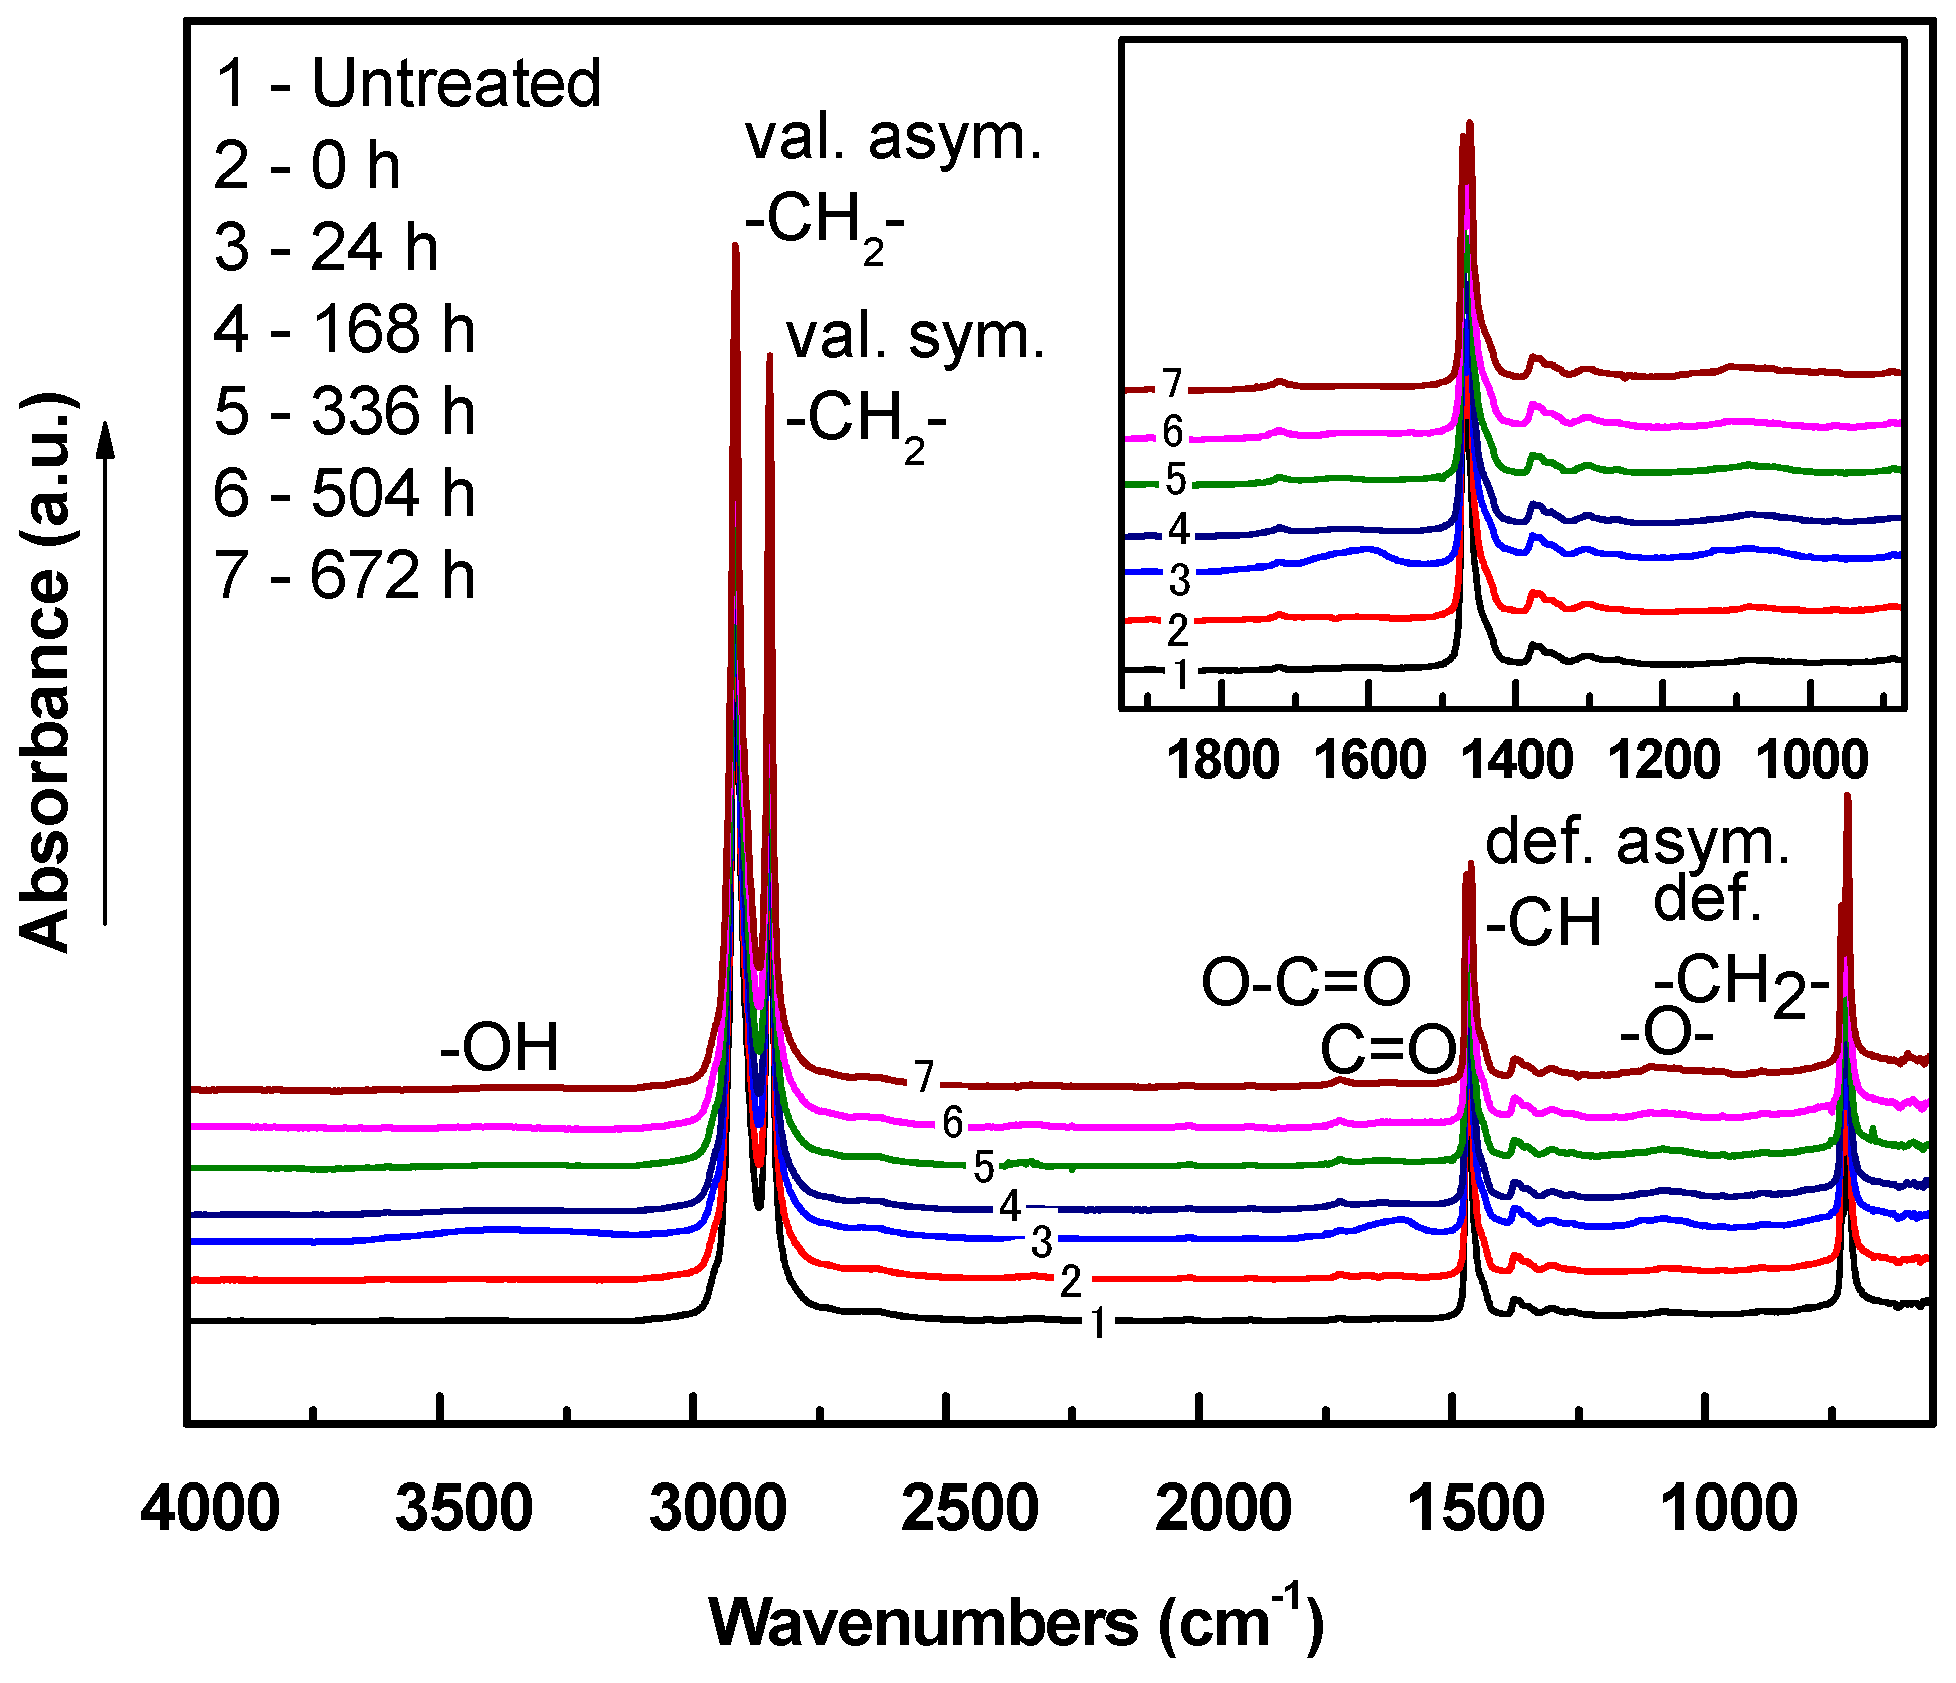
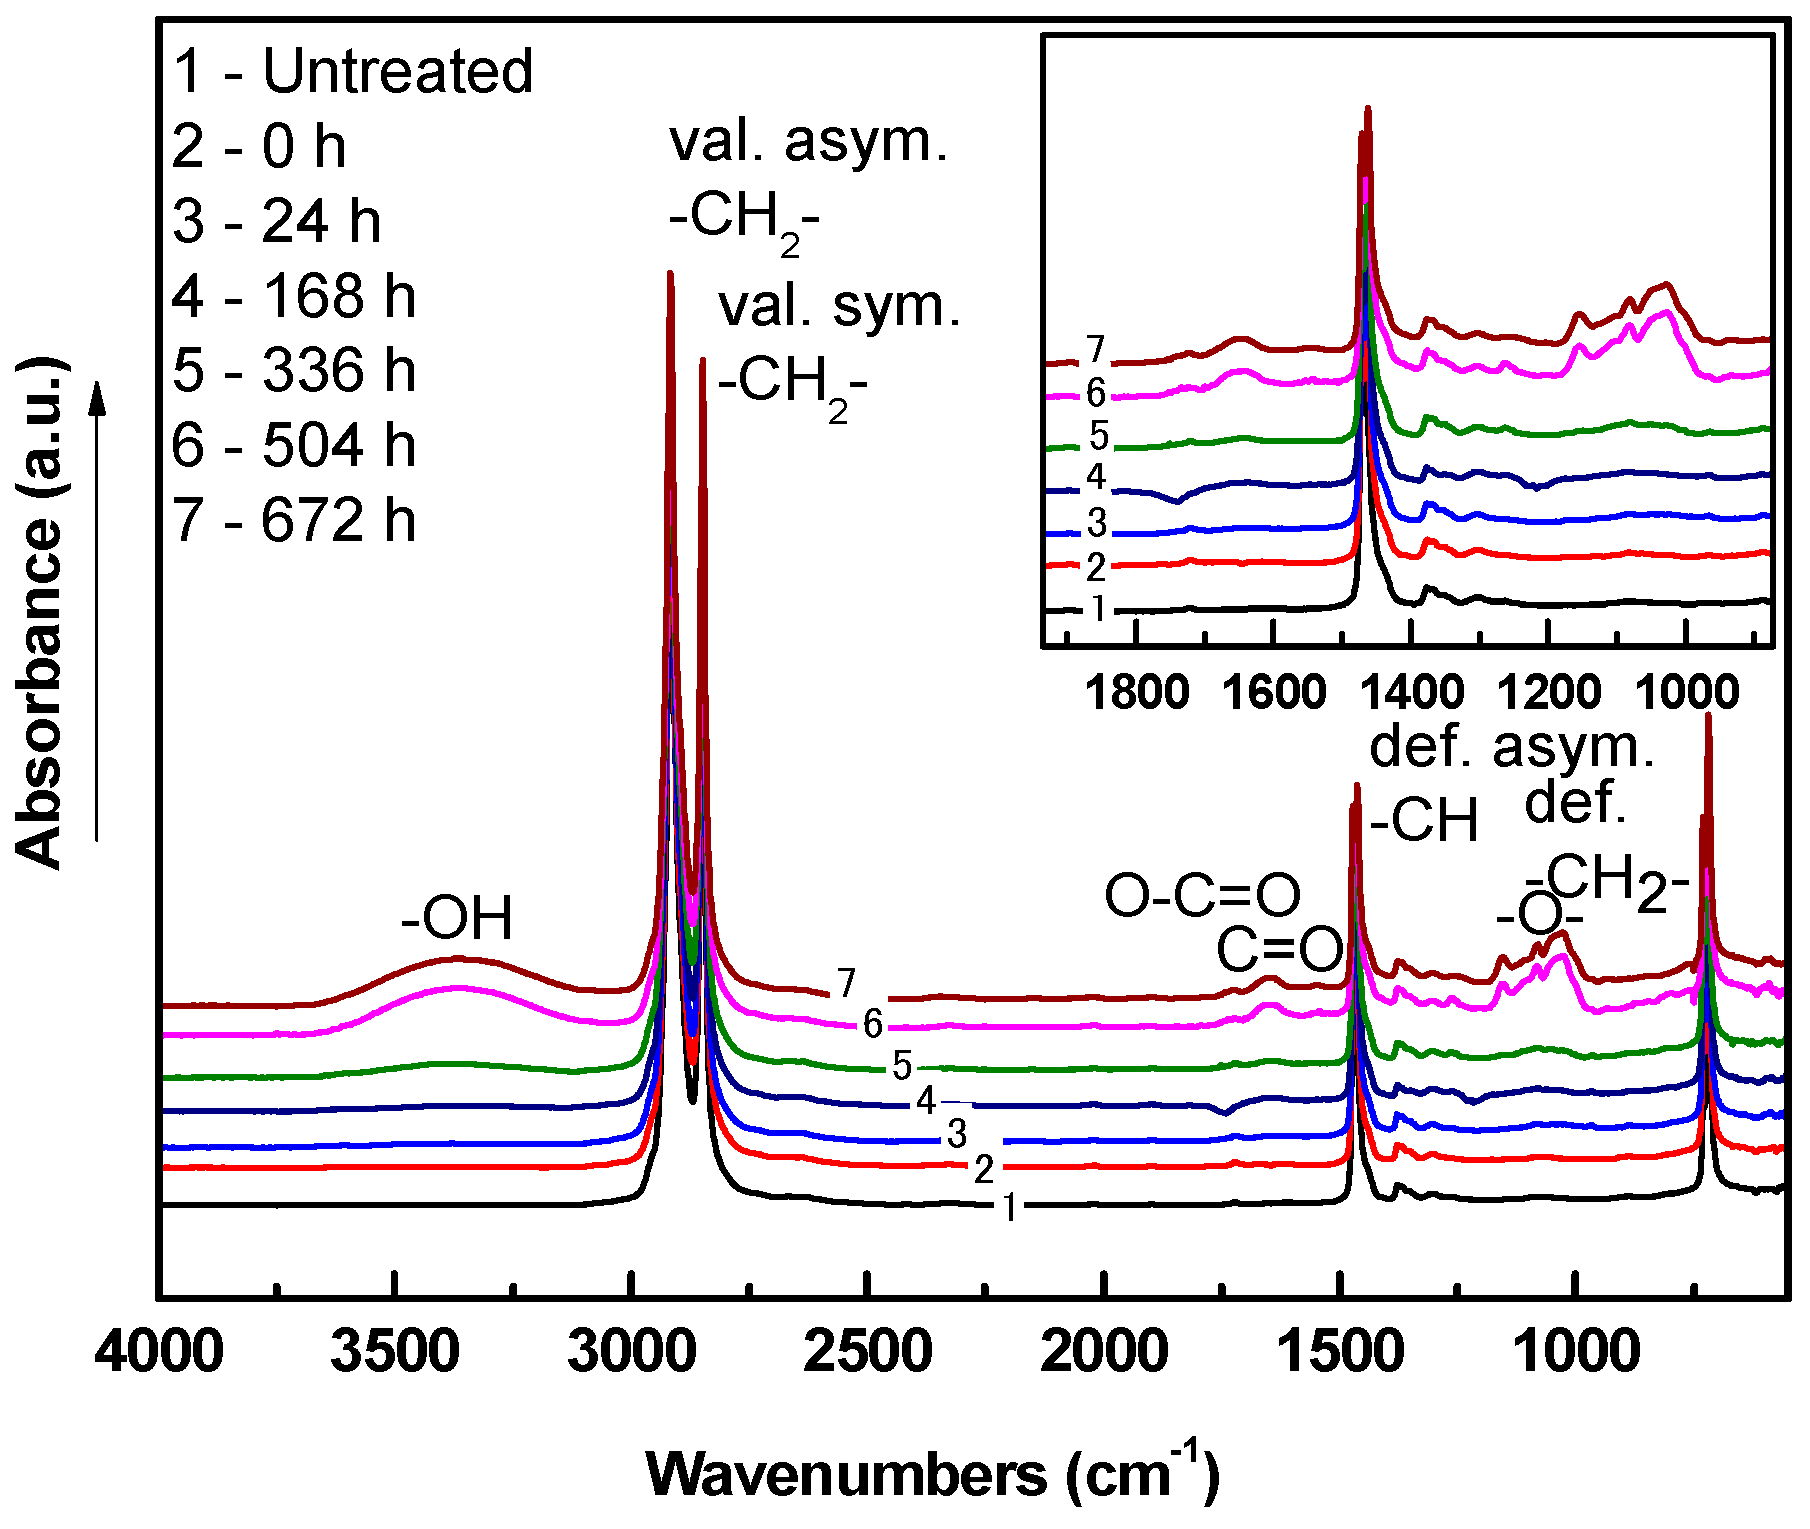
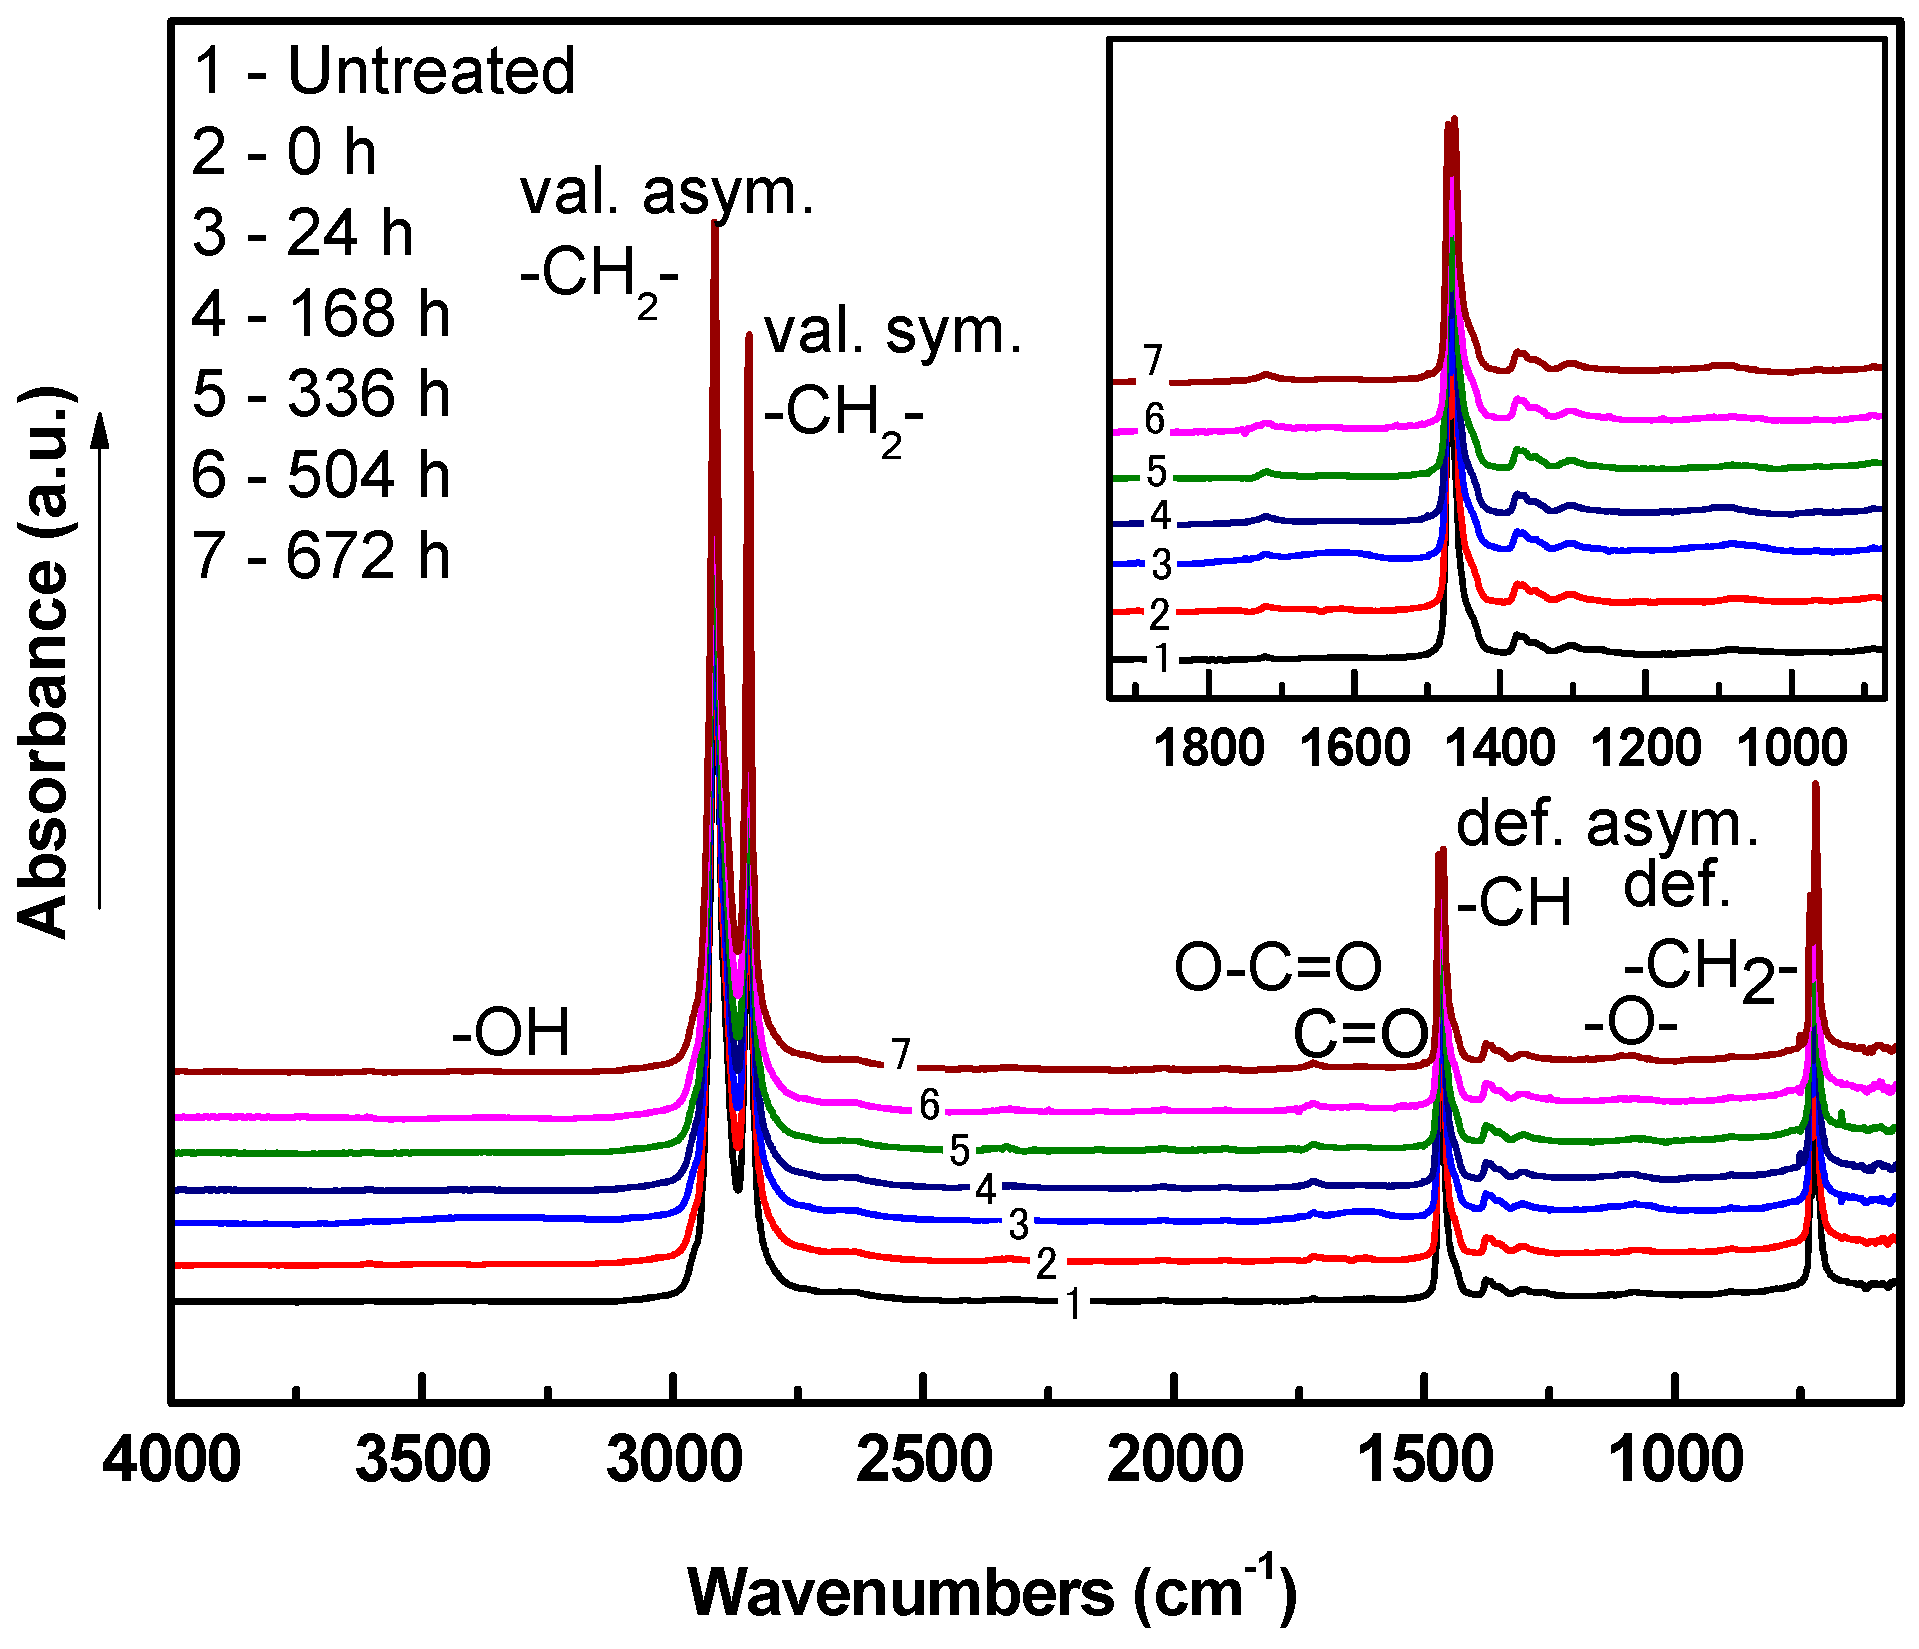
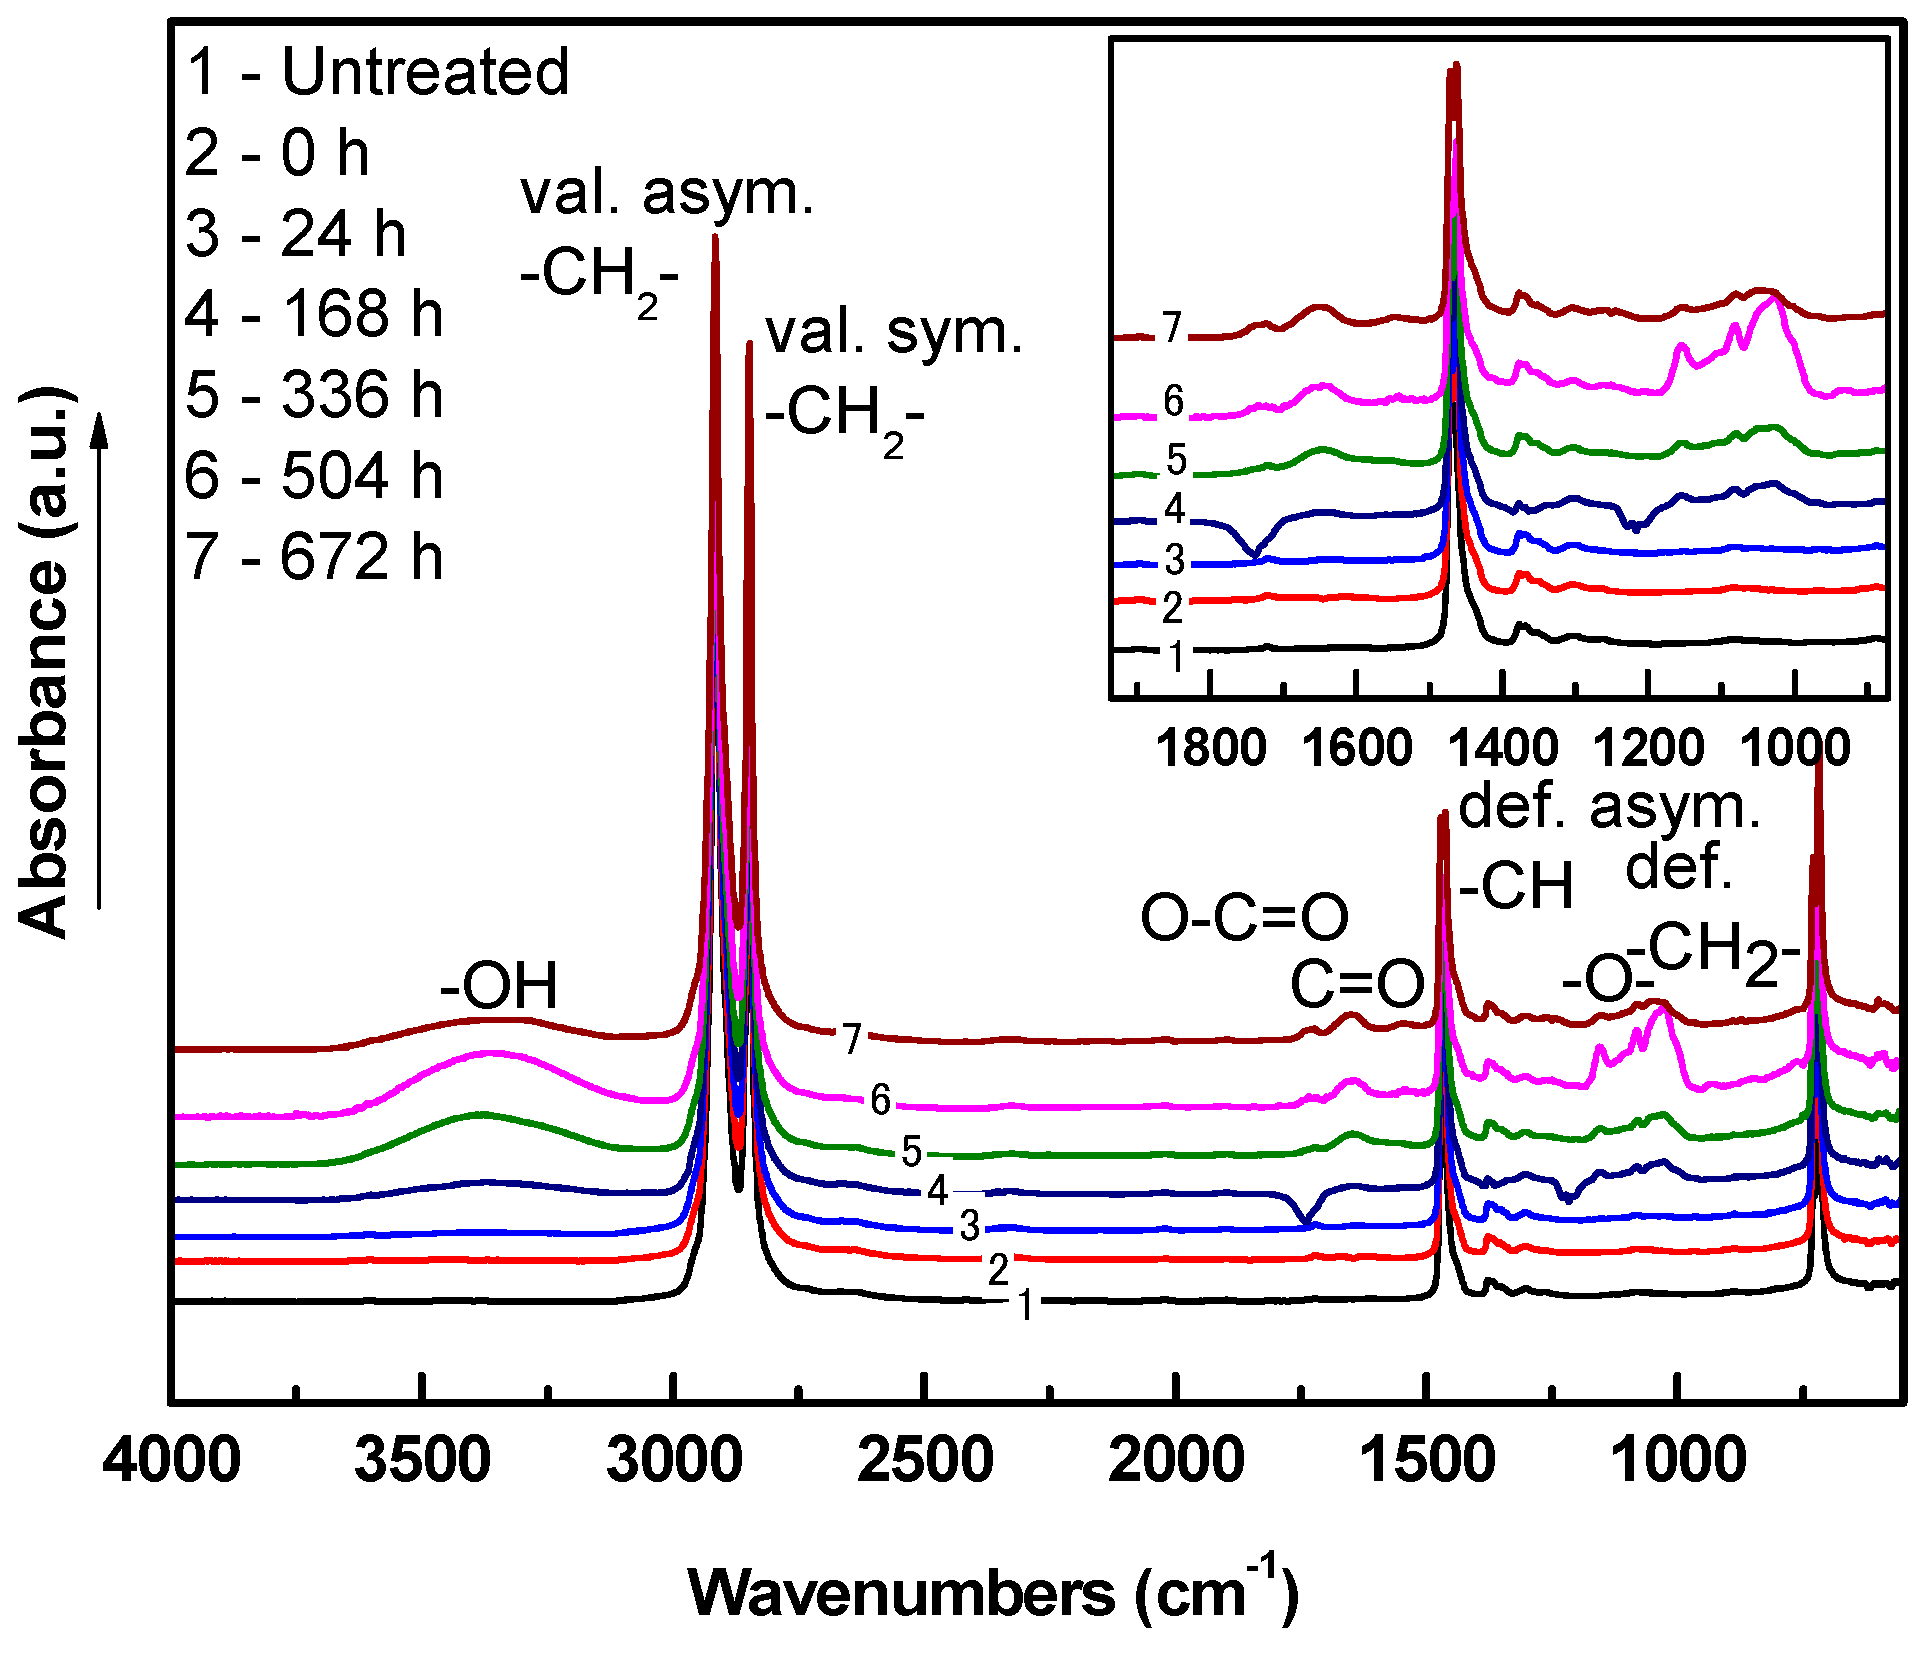
FTIR-ATR was used to analyze chemical composition changes of LDPE after plasma treatment. The IR spectrum of untreated LDPE contains mainly –CH stretching, bending and rocking vibrations in the regions of 2900–2800, 1500, 600 cm−1, respectively, since LDPE contains only hydrocarbon chains. Etching caused by plasma occurred at the nano-level, and thus the similarities between these infrared spectra radiation could not show the high intensity peaks of the new functional groups, as the graphs below showed. These nano-level changes were reflected in subsequent contact angle and XPS analyses. Some oxygen containing groups, for example, oxygen containing products at the surface of the polymer that appeared after 24 h of aging, show absorbance bands associated with vibrations of C=O or C=O in carboxyl group (in region 1800–1500 cm−1) and C–O vibration (1200 cm−1). Moreover, the absorbance band related to the vibration of –OH (wide absorbance band in the 3000–3500 cm−1 region) was observed after plasma treatment. The oxidative reaction plasma treated LDPE films led to changes in FTIR-ATR spectra with aging time (Figure 12, Figure 13, Figure 14, Figure 15, Figure 16, Figure 17, Figure 18 and Figure 19). The increased intensity in absorbance bands centered approximately at 3500 and 3250 cm−1 was likely caused by increased hydroperoxide decomposition in LDPE after aging effects. The increase in intensity centered at 1630 cm−1 was associated with carbonyl species originating from hydroperoxide decomposition because of radical reactions of polyethylene (PE) with oxygen [47].
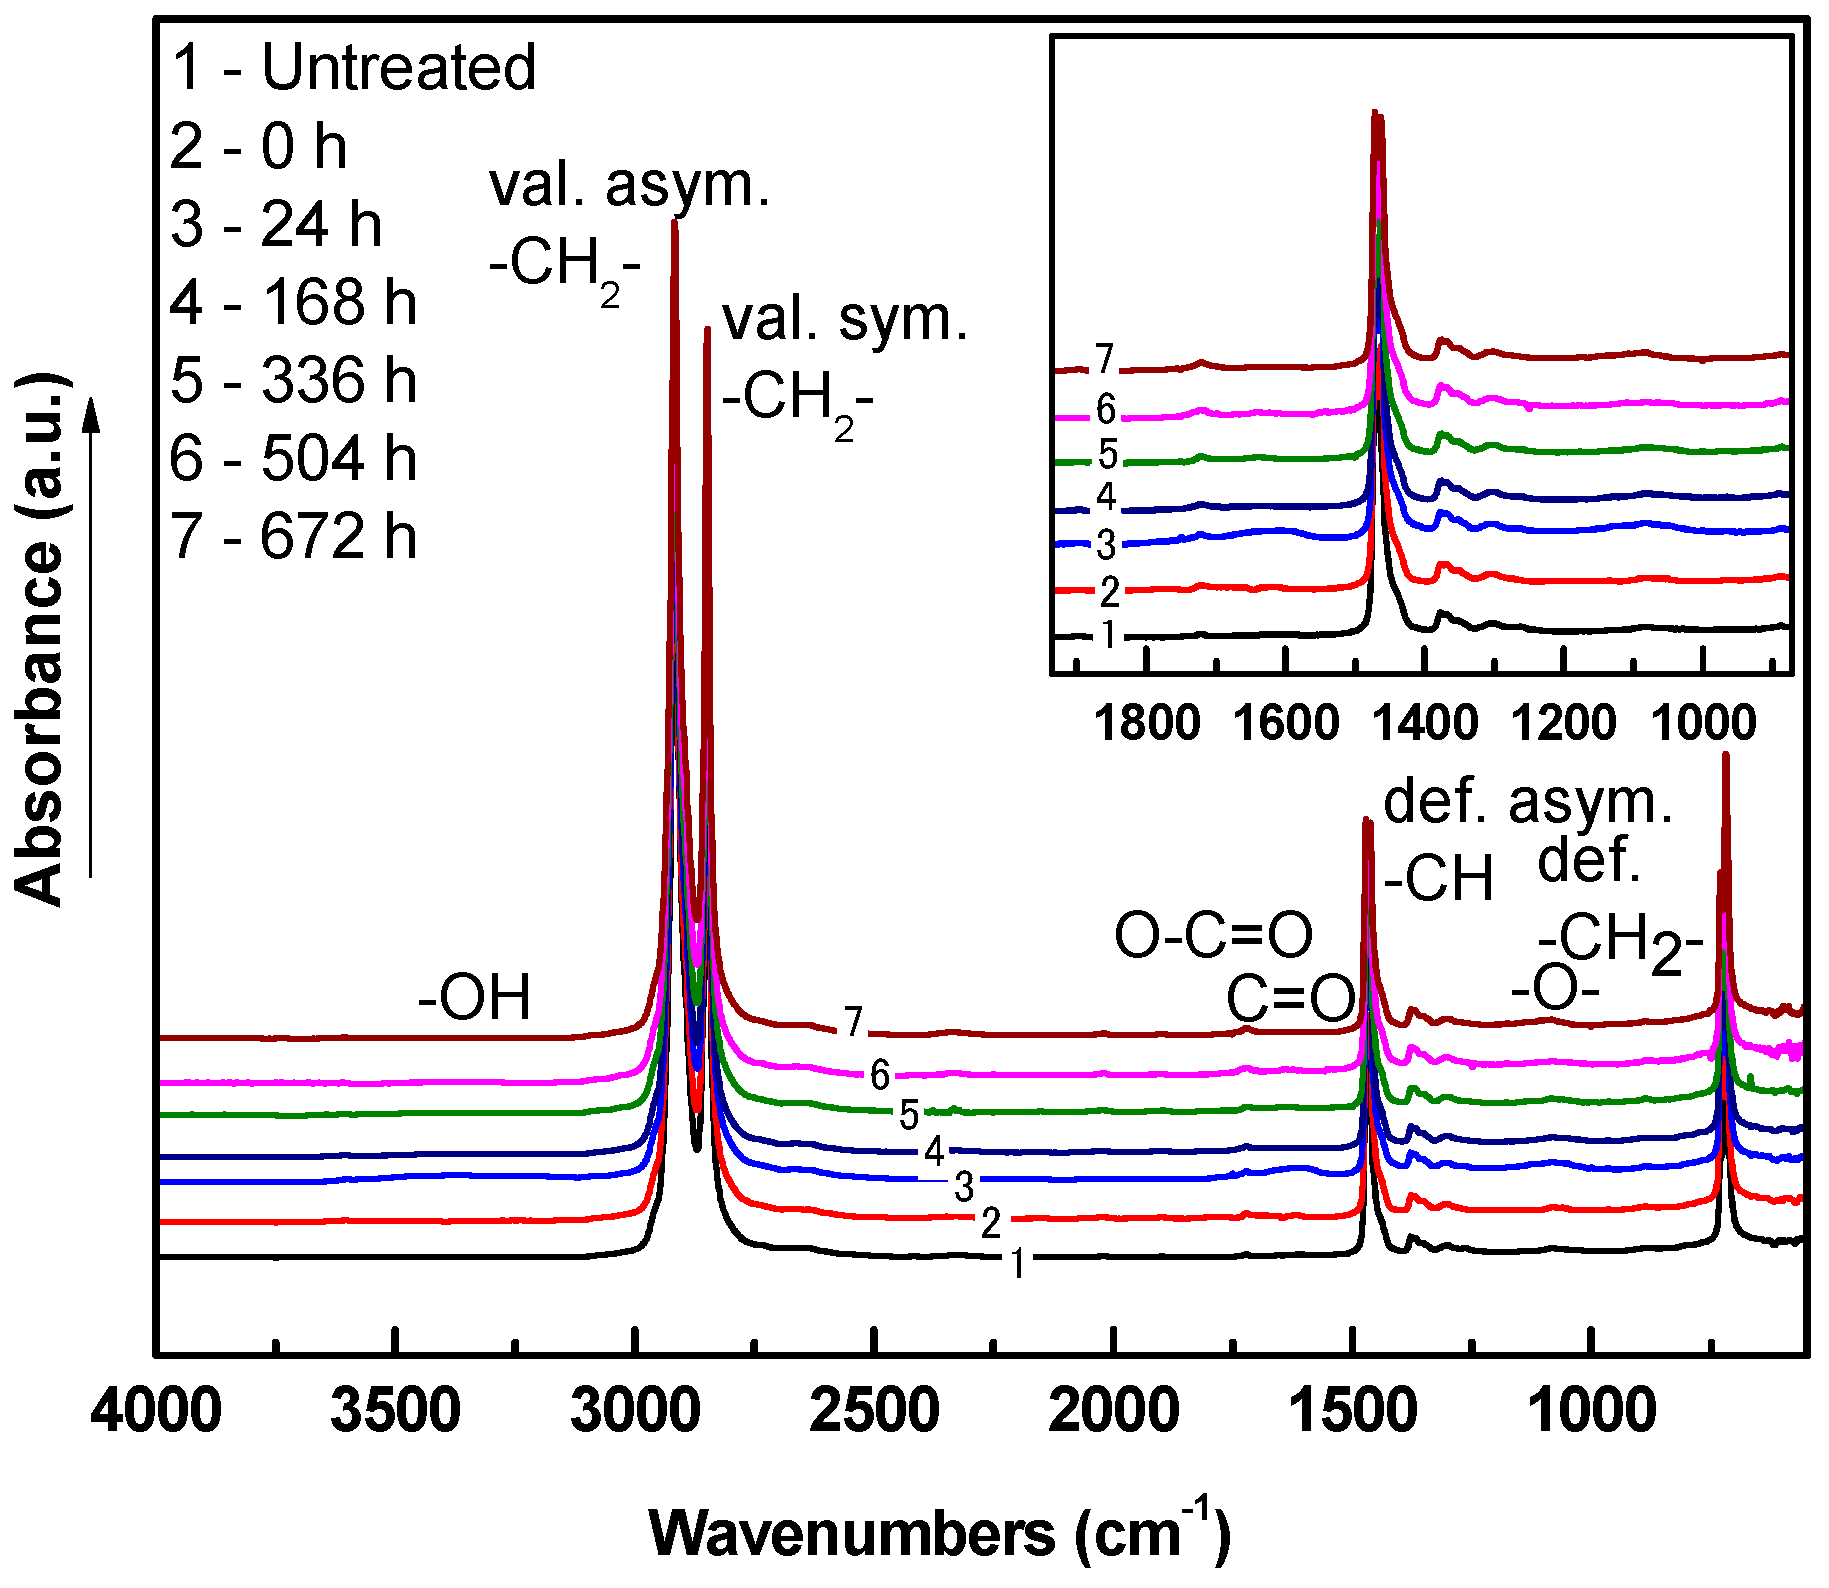
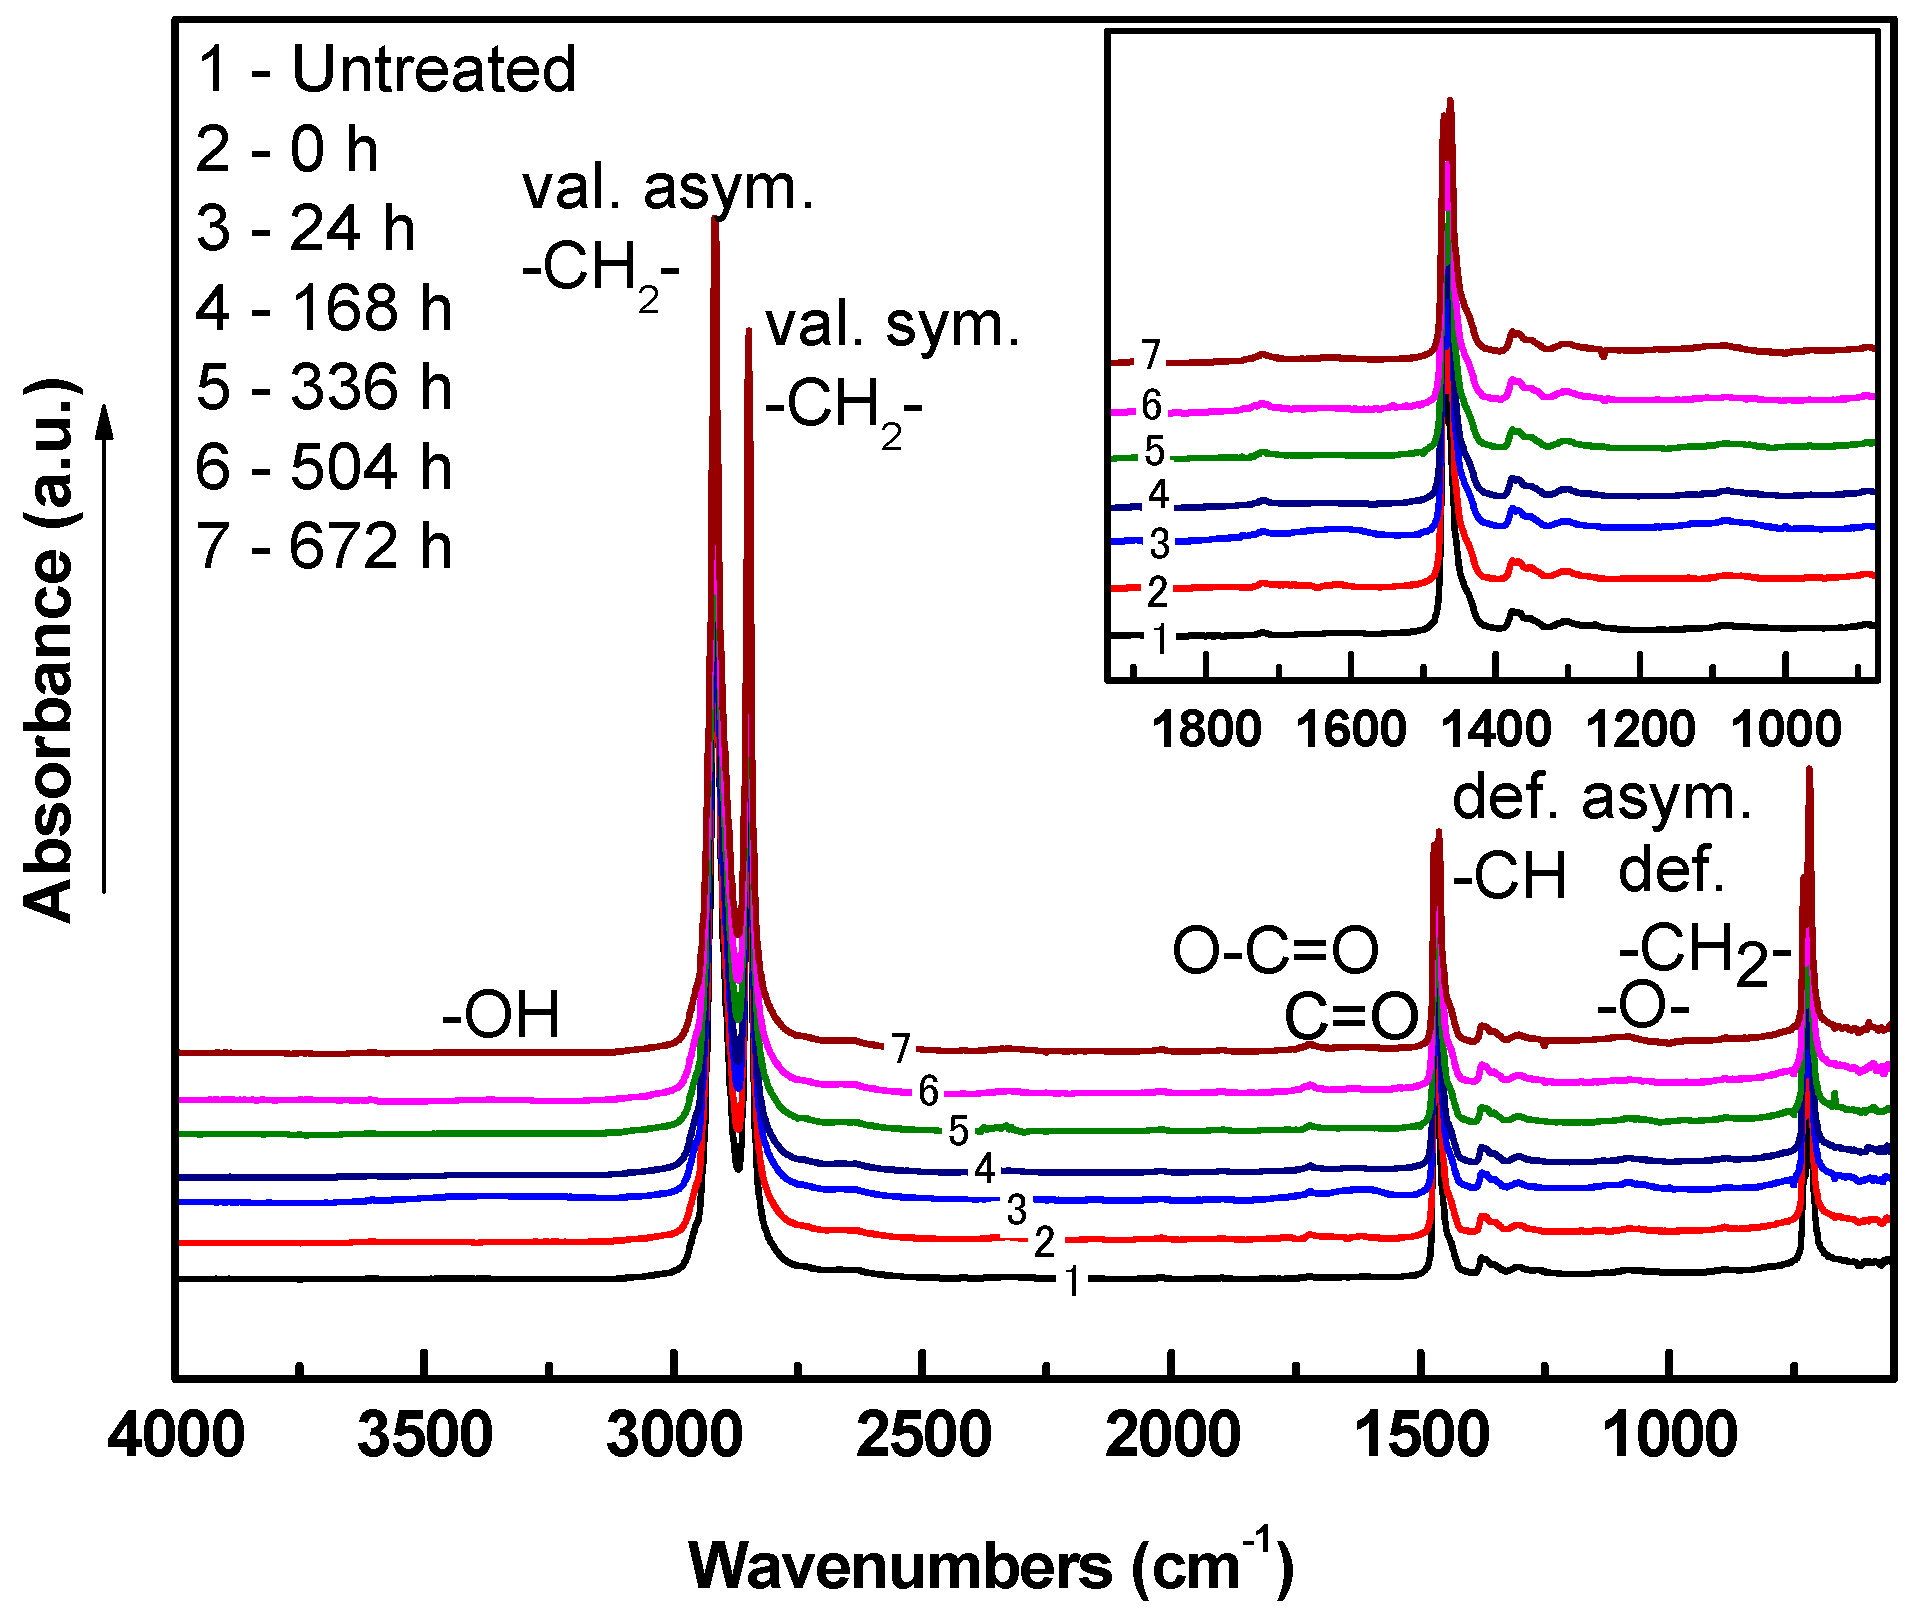
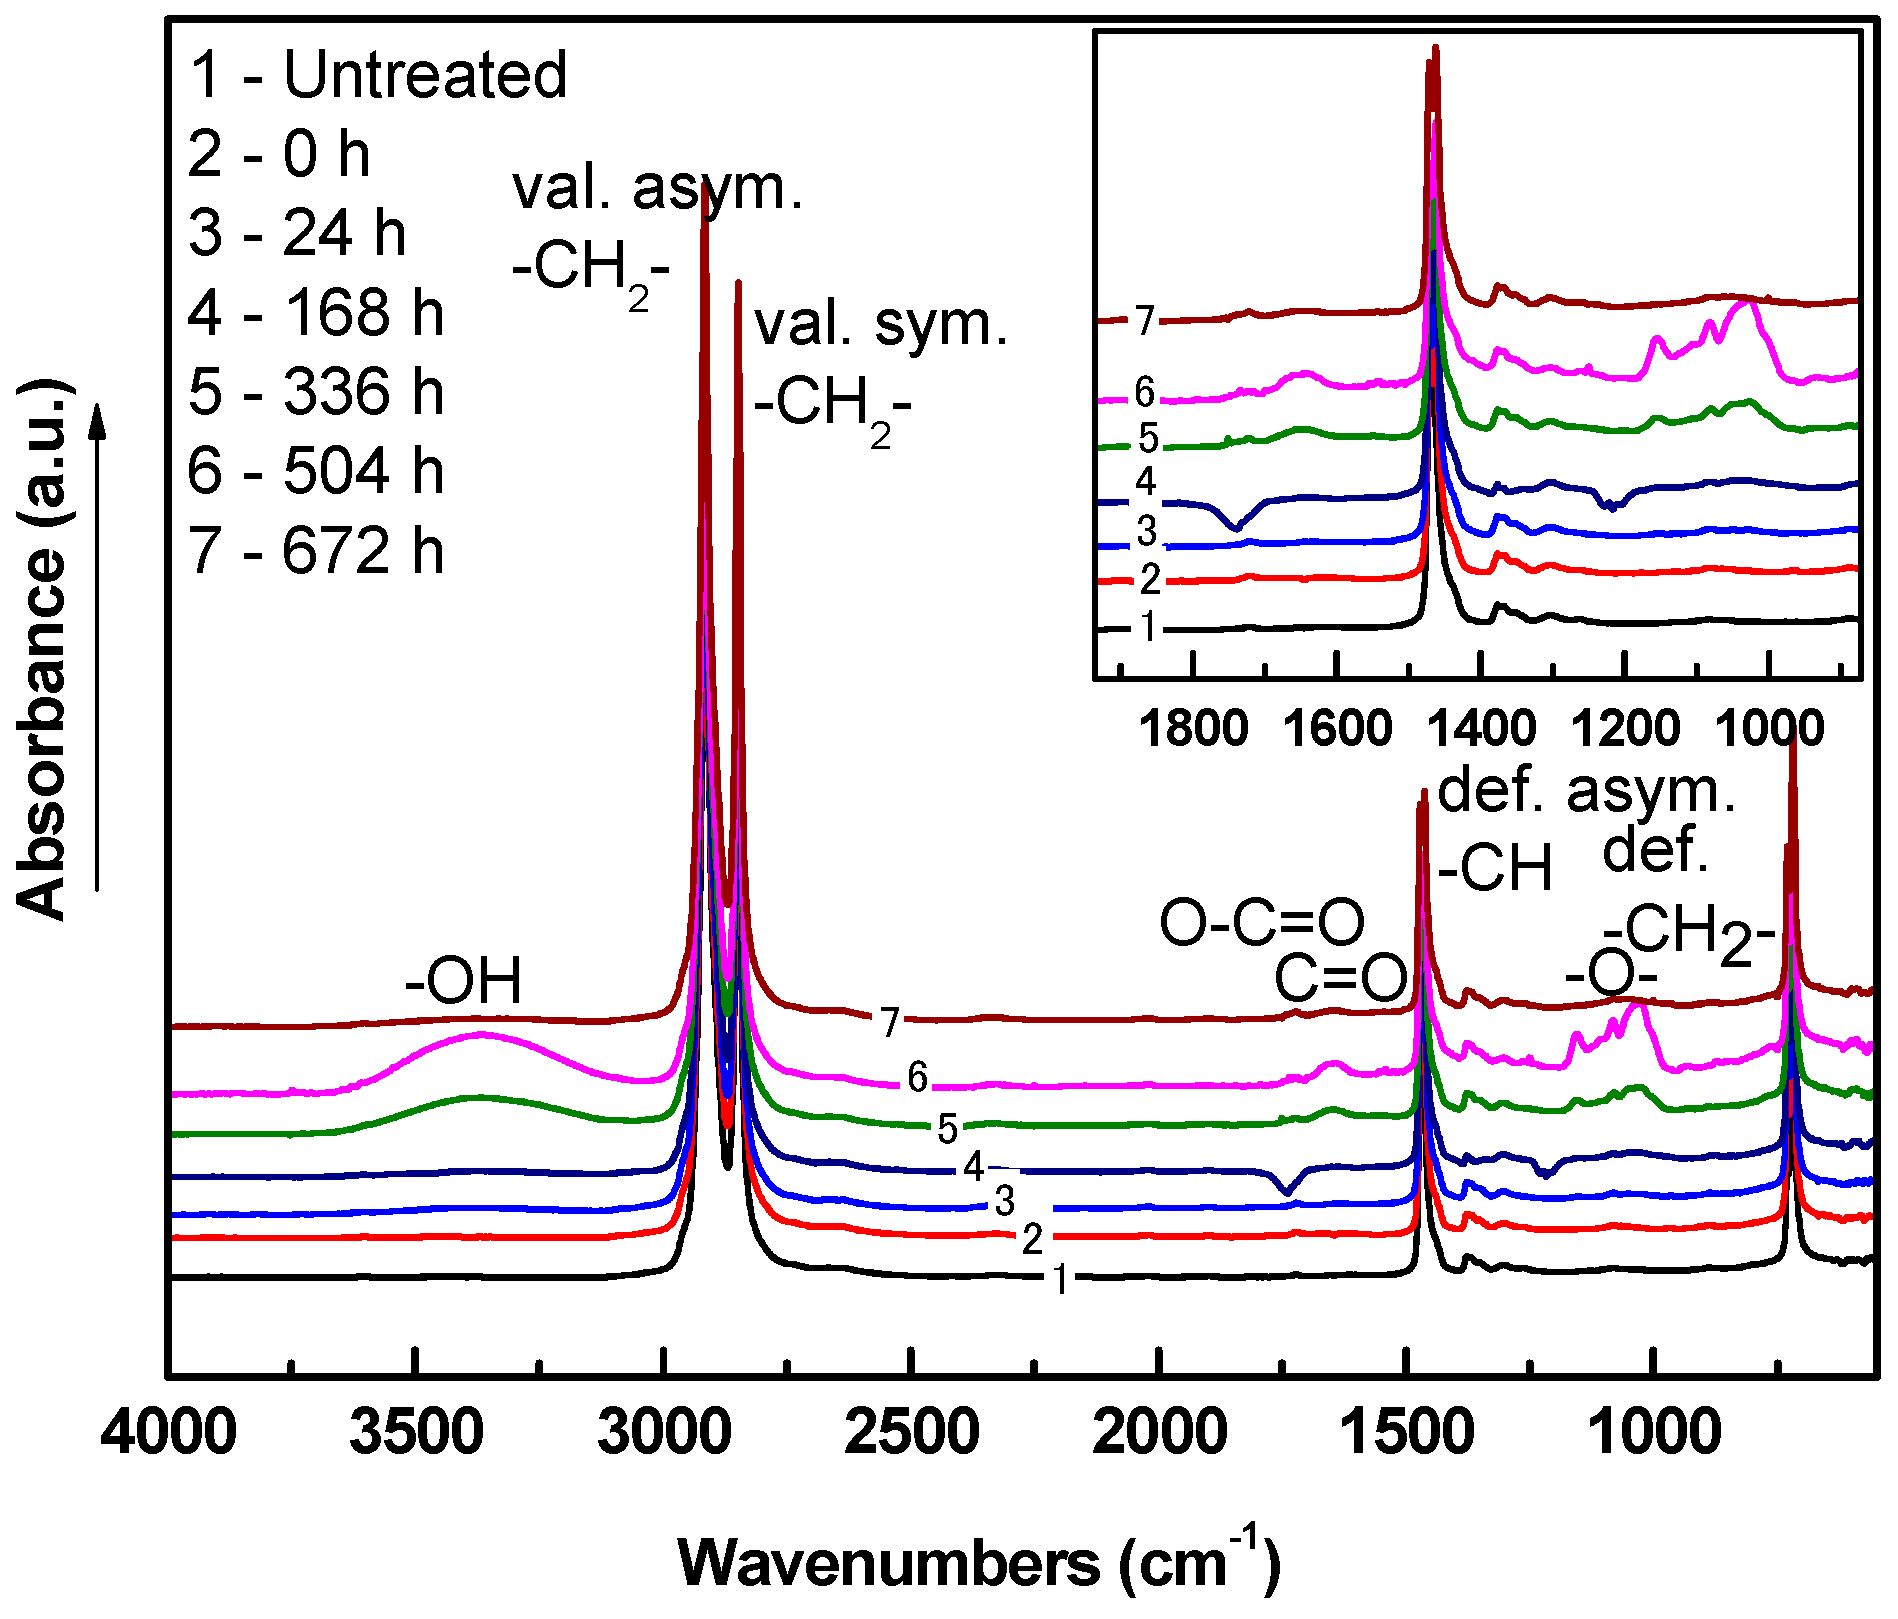
LDPE samples were treated in different gases (air, oxygen, nitrogen, and argon) and they were aged in air and water media to monitor chemical changes in surface functionalization with time. This functionalization was analyzed using FTIR during four weeks of aging. With time, temperature, and humidity factors fixed, the changes were observed and recorded (Figure 12, Figure 13, Figure 14, Figure 15, Figure 16, Figure 17, Figure 18 and Figure 19). PE has clear characteristics because it consists mainly of hydrocarbon chains and branches, and thus its IR spectrum showed vibrations in single CH stretching and bending at 2980–2900, 1470–1460 cm−1 asymmetric, and 730 cm−1 rocking. Plasma-initiated radicals on the hydrocarbon skeleton of PE surfaces created covalent bonding between the radicals and new functional groups on the PE surface. These groups are mainly oxygen containing groups, evidenced by the observed vibrations in different regions of the IR spectra (OH, C–O, C=O, O–O, COO). Different plasma gases will affect the concentration of the polar groups bonded to PE, which also depends on the radicalization. Air plasma is a mixture of oxygen, nitrogen and argon with other gases included, so it has a larger effect on creating radicals on PE surfaces. That could be evidenced from the absorbance intensity increase after plasma in the OH band (3500–3300 cm−1), carbonyl group C=O and O–C=O (1800–1700 cm−1), and ether groups C–O (1100–1000 cm−1). In oxygen plasma, the oxygen was more concentrated in the plasma and that led to the same or higher peak intensity, as well as more defined shapes in the mentioned vibration peaks. For argon and nitrogen, their peaks were not clearly in the same absorbance range as oxygen, and this can be attributed to a low oxygen concentration during treatment. An aging test was done in two media (air and water) to measure their effect on treated samples with newly introduced polar groups. In atmospheric normal aeration (with temperature and humidity fixed), the increase in intensity occurred within the first 24 h only (measurements were done for 672 h in total). After 24 h, the growth in intensity slowed with increasing time. This outcome can be explained by the reorientation of nonpolar groups, leading to more stabilized forms on the surface. The absorbance intensity has increased multiple times more for water aged samples than for samples in aeration, because water can form H-bonding with any OH and NH containing groups, which can form higher vibration peaks in IR. Samples treated with oxygen plasma showed a clearly defined increase in vibration intensity with time, followed by samples treated with air and argon, and nitrogen was least evidenced by its relatively lower peak intensities. The vibration stabilized after 336 h and began to decrease after 504 h, with the lowest for nitrogen treated samples Figure 17 aged in water. This is attributed to the low molecular weight materials (LMWM) being dissociated, leading to a decrease in the polarity of the surfaces [46].
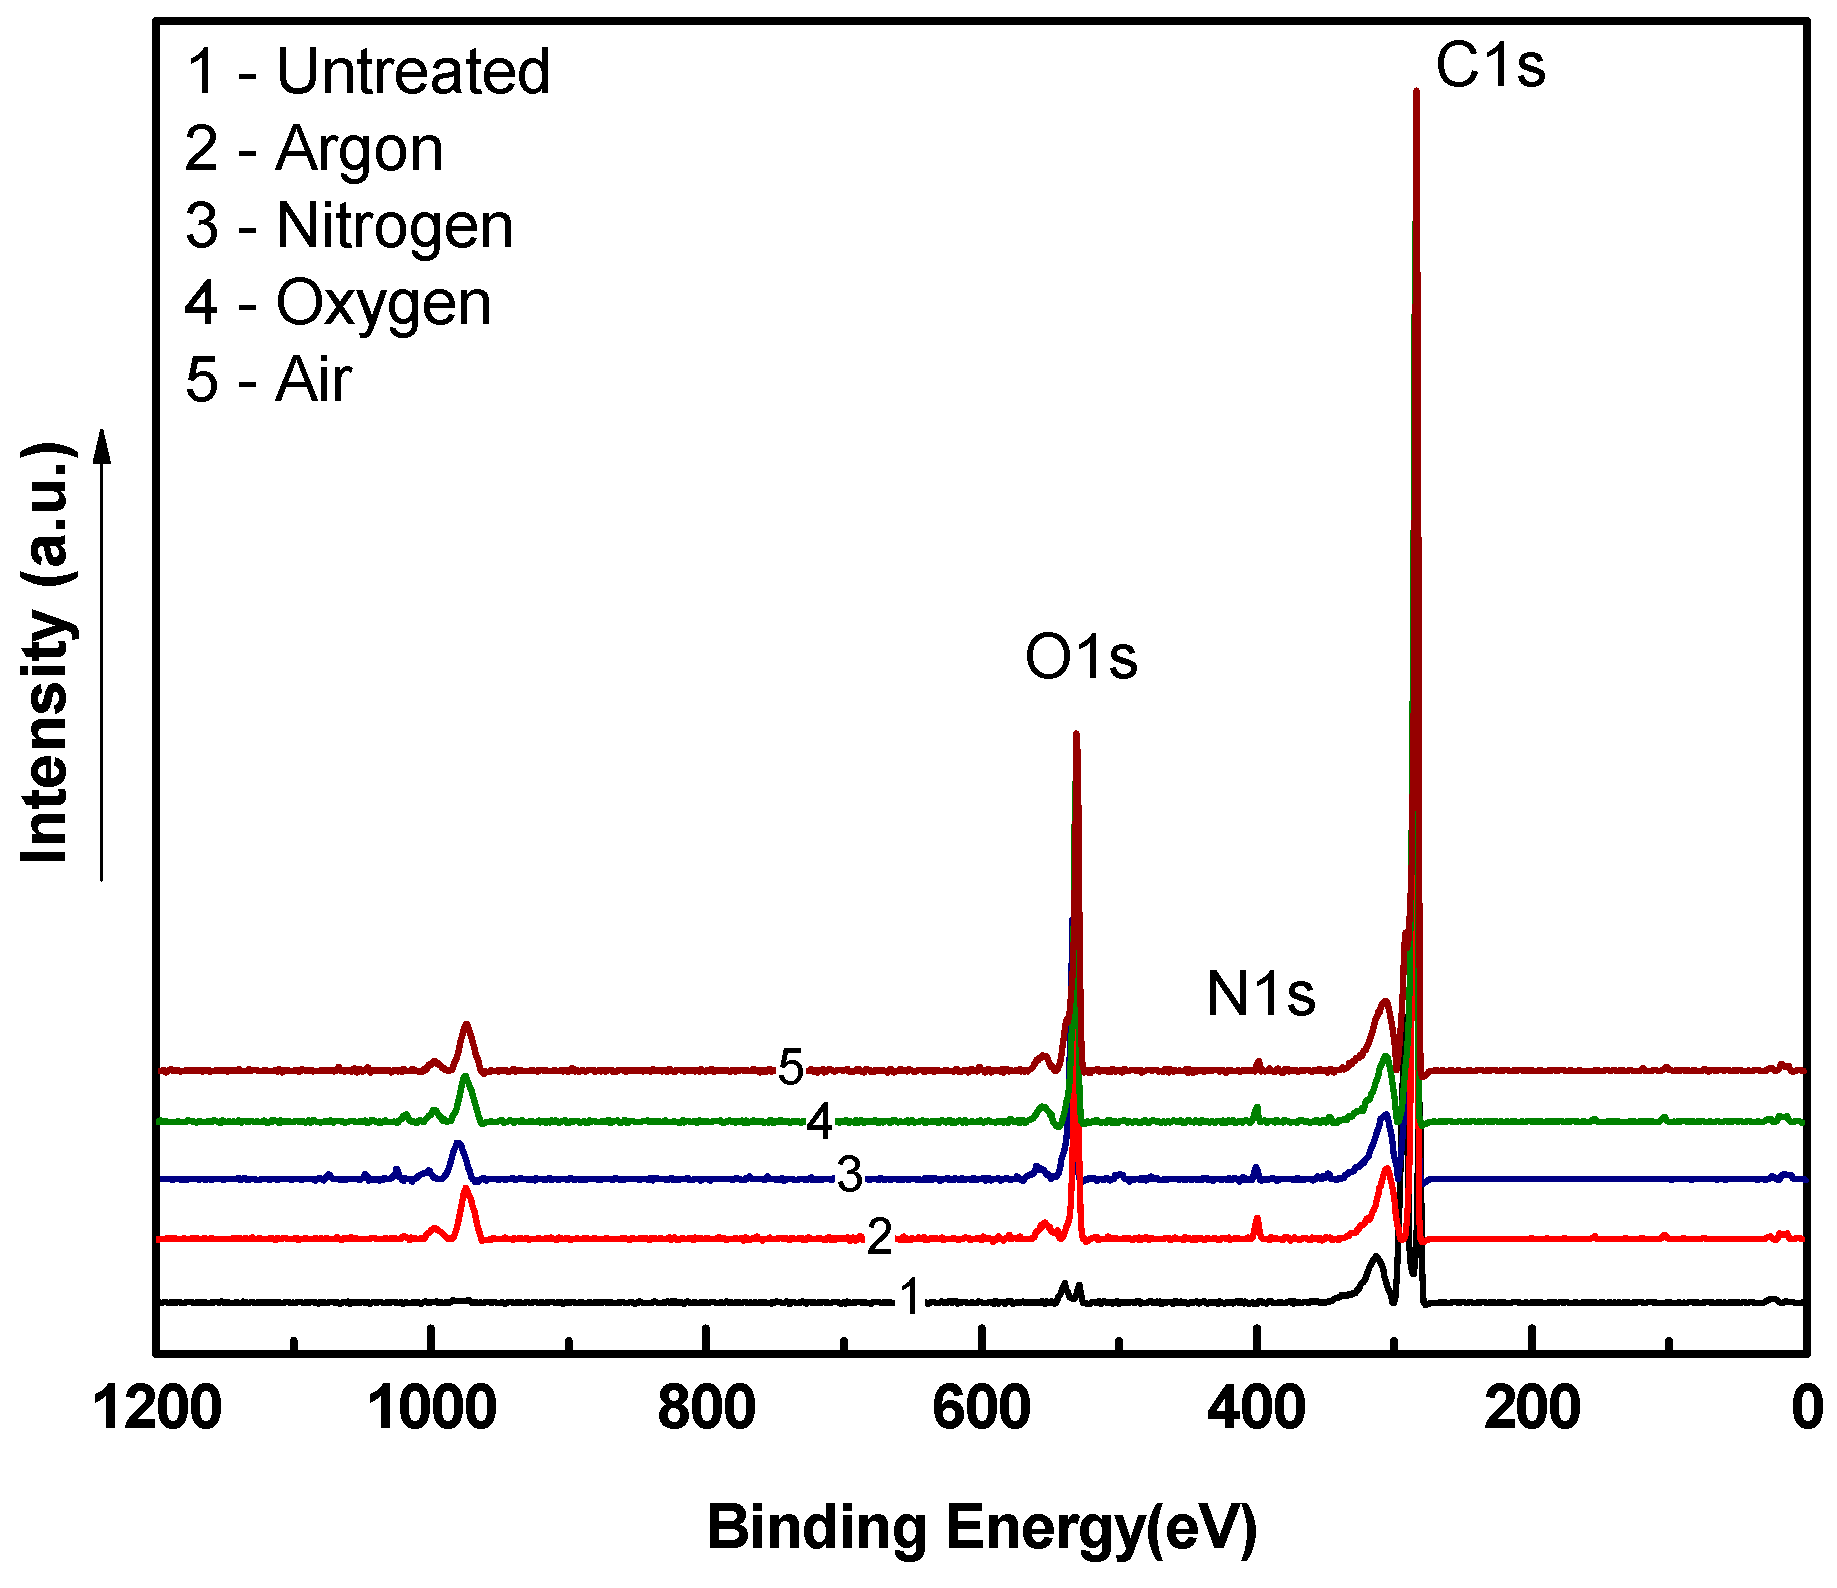
Changes in a surface chemical composition of the LDPE surface before and after plasma treatment were evaluated using XPS. The chemical composition of elements existing on the treated surface was obtained from the C1s, O1s, and N1s peaks, as shown in Table 1. The quantification report of the spectra for untreated LDPE revealed high carbon and low oxygen atomic concentrations (at.%) equal to 97.41 at.% and 2.59 at.%, respectively. Although the LDPE structure does not contain any oxygen in its nature, this may be attributed to the processing additives or residual air inside the analysis chamber. Plasma treatment of LDPE using air, nitrogen, oxygen and argon was responsible for the increase in the oxygen and nitrogen content at the expense of the carbon content, showing a significant decrease of the C1s peak at ~285 eV of binding energy relative to the untreated surface. This outcome indicates the formation of newly oxygen and nitrogen containing functional groups, and thus results in higher hydrophilicity. Moreover, some peaks with a relatively low intensity, such as Si2p, represent some impurities probably originated from the plasma reactor. Figure 20 shows the XPS spectra for LDPE, where the O1s peak was observed with maxima at ~530 eV, and the nitrogen peak appears at ~400 eV of the binding energy. The atomic concentration of O1s for LDPE samples treated in air, oxygen, nitrogen and argon increased to 12.75 at.%, 12.51 at.%, 11.64 at.%, and 14.40 at.%, respectively. Interestingly, surfaces plasma treated using argon and nitrogen exhibited high incorporation of polar groups as well. This result is likely, because the incorporation of oxygen-containing groups is apparent when samples are treated in an inert environment where functionalization mainly occurs upon exposure to air immediately after plasma treatment [48]. In Table 1, the atomic concentrations of individual chemical elements are summarized according to the used working gas, storing conditions and aging period. The samples were stored in two different humidity representing media, namely, air (~50% humidity) and water (100% humidity), for a maximum of 4 weeks. Intensity of O1s and N1s peaks for samples plasma treated using air, oxygen, and nitrogen, and stored in air, exhibited a slight increase after 24 h of storage time, while the O1s increase for samples treated in argon occurred after 168 h as the result of post-oxidation reactions and mobile phase reorientation. Samples stored in water medium had even higher oxygen content than samples stored in air medium, while atomic concentrations of O1s for samples treated using air, oxygen, nitrogen, and argon after 672 h of aging time achieved 31.02 at.%, 23.45 at.%, 23.37 at.%, and 23.92 at.%, respectively. Storage in water results in an accumulation of oxygen-containing groups on the surface of LDPE, resulting in higher atomic concentration of O1s with greater loss of elemental carbon.
3.4. Surface Morphology Analysis
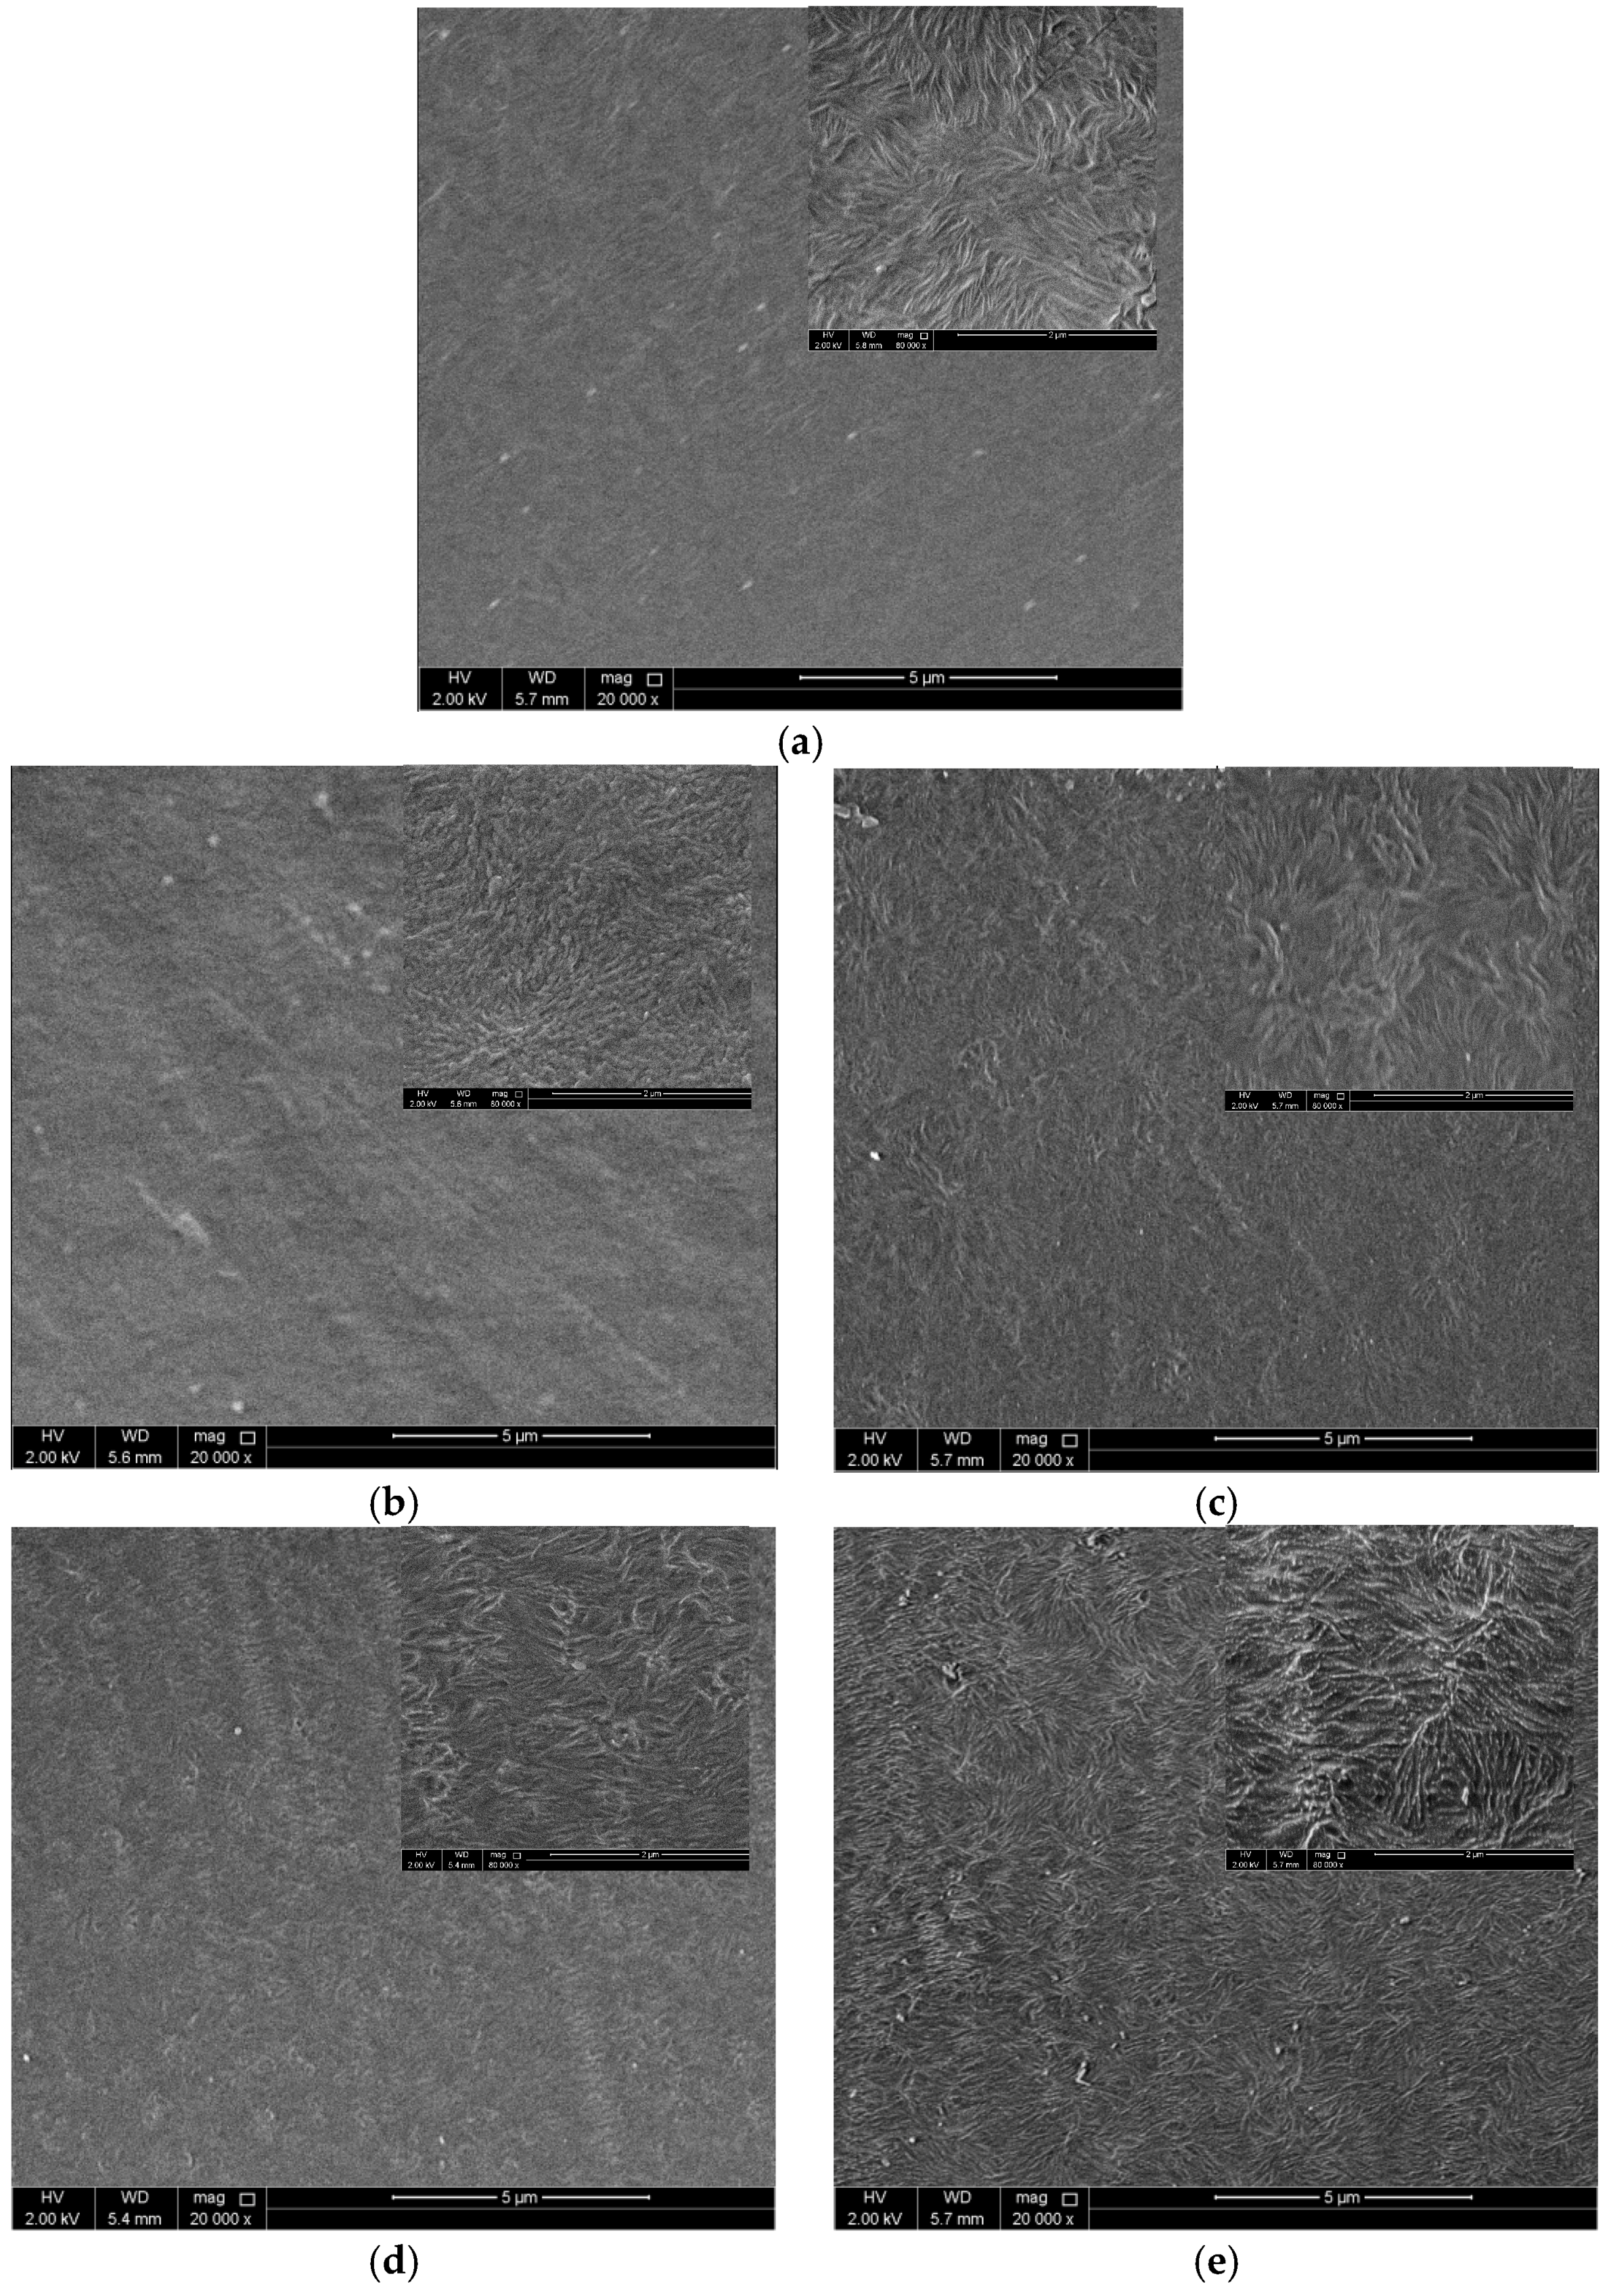
Surface roughness significantly affects wettability, and therefore an investigation of the surface morphology is highly essential. SEM and surface metrology systems were used to analyze surface morphology changes on the LDPE surface after plasma treatment using various gases and their mixtures. Figure 21 shows SEM images at 20000× magnification of untreated and plasma treated LDPE films at 120 s and 80 W, representing optimal conditions. The surface of untreated LDPE film was characterized by specific nano-sized irregularities in its texture, originating from the molding process. It can be observed that LDPE films plasma treated in the presence of air, nitrogen, argon, and oxygen exhibited some textured grooves and cavities. These surface morphology changes are mainly attributed to the etching action by plasma gaseous species (electrons, ions or free radicals) on the LDPE surface, where the polymer surface is modified. This phenomenon is promoted through physical bombardment of the surface with highly energetic particles generated during plasma treatment.
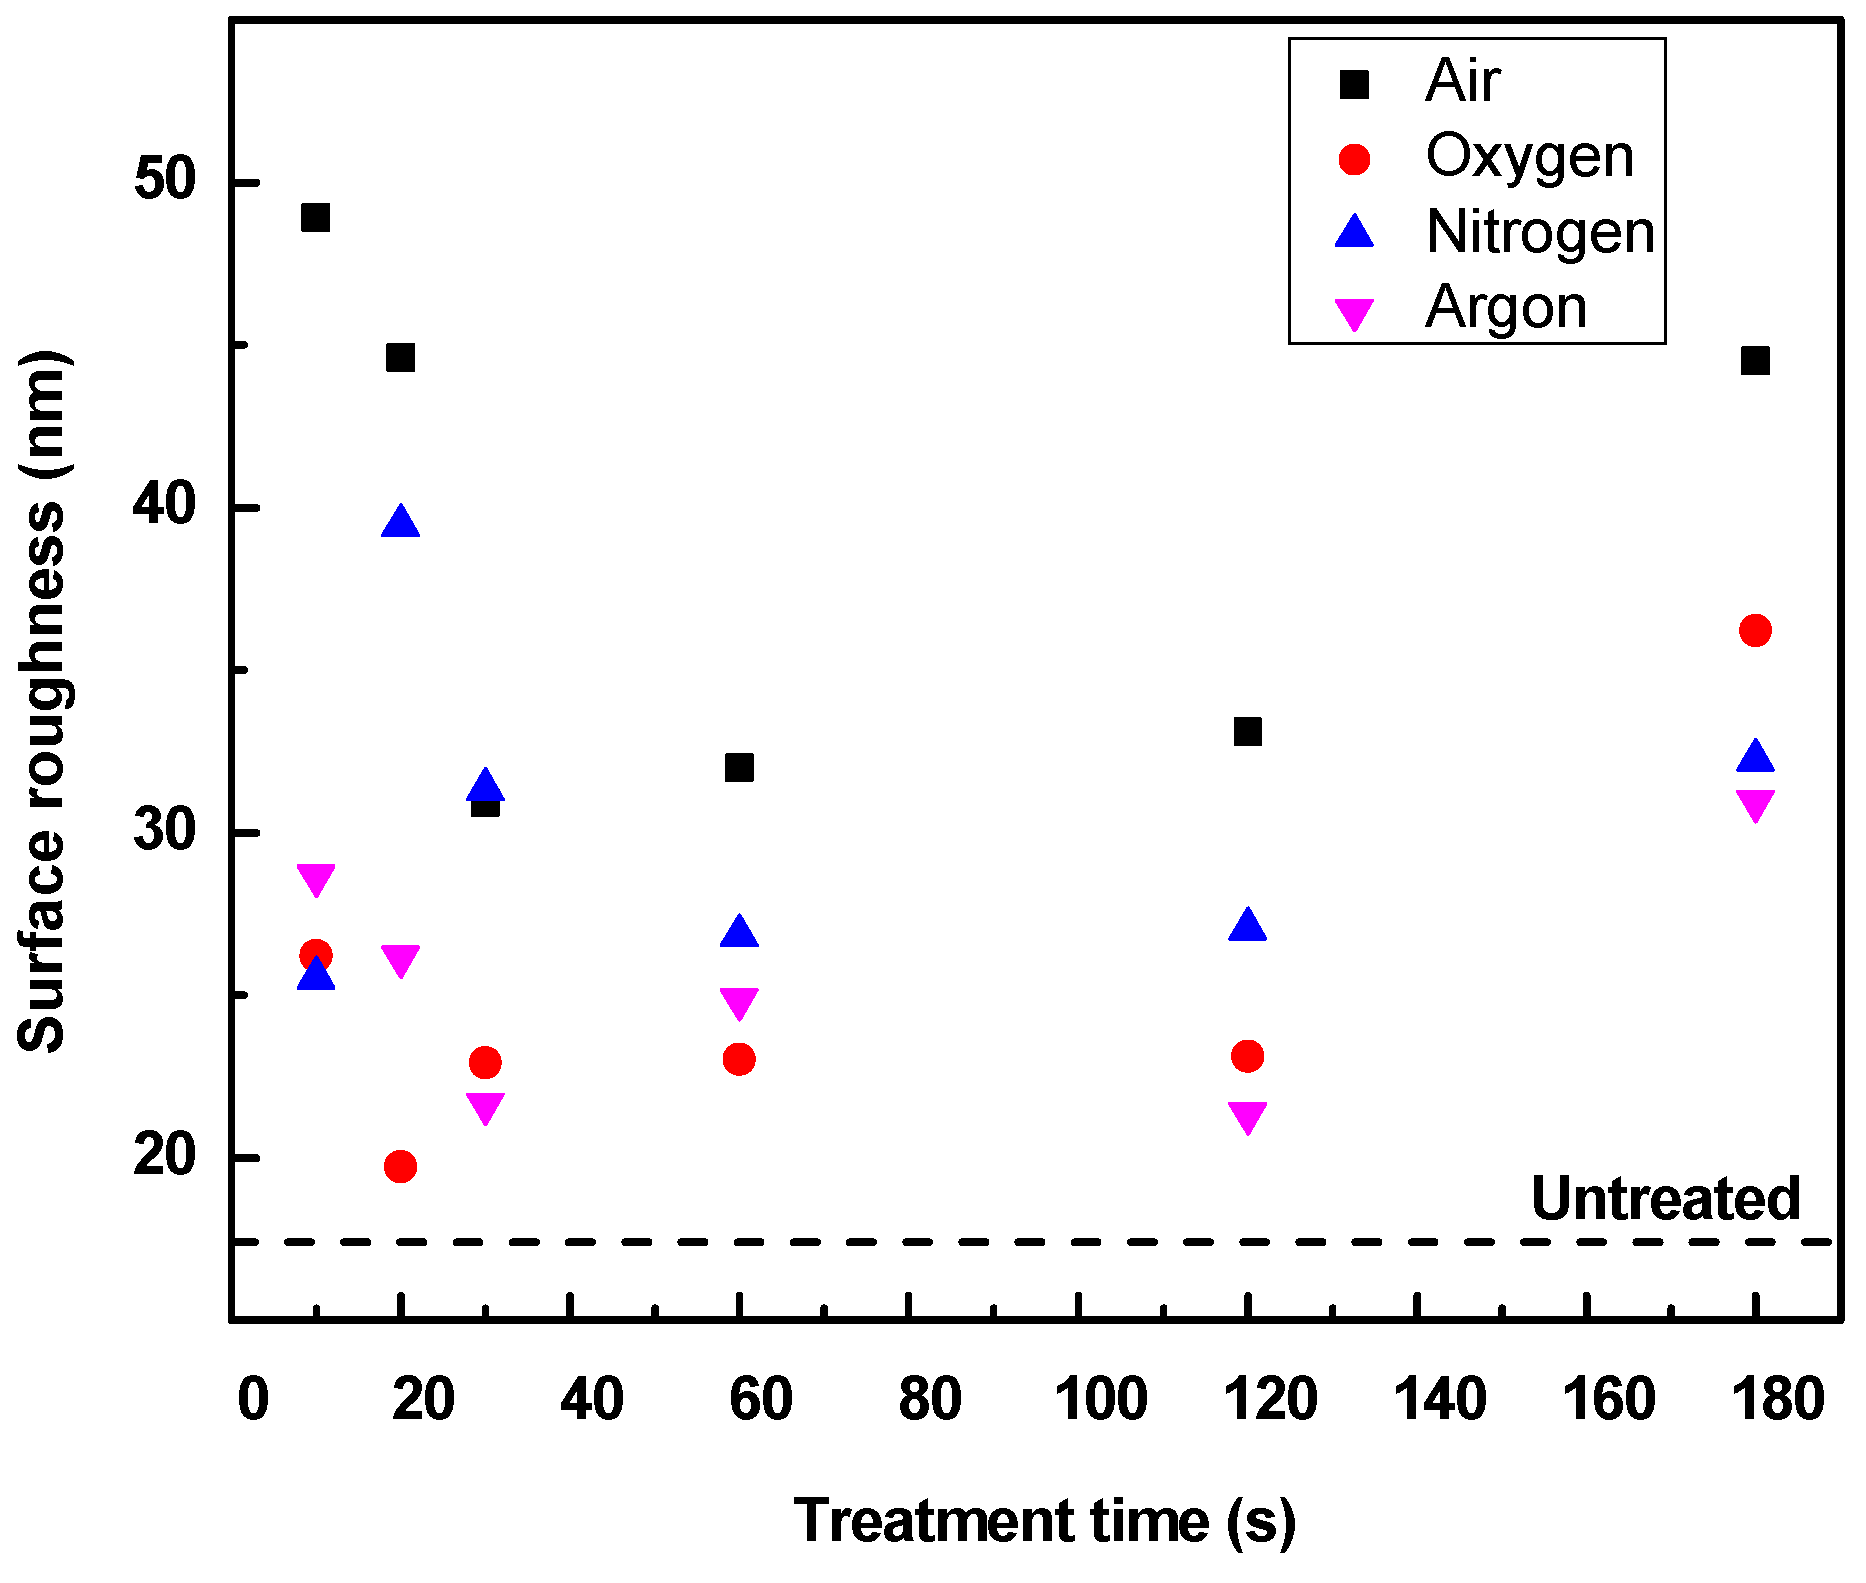
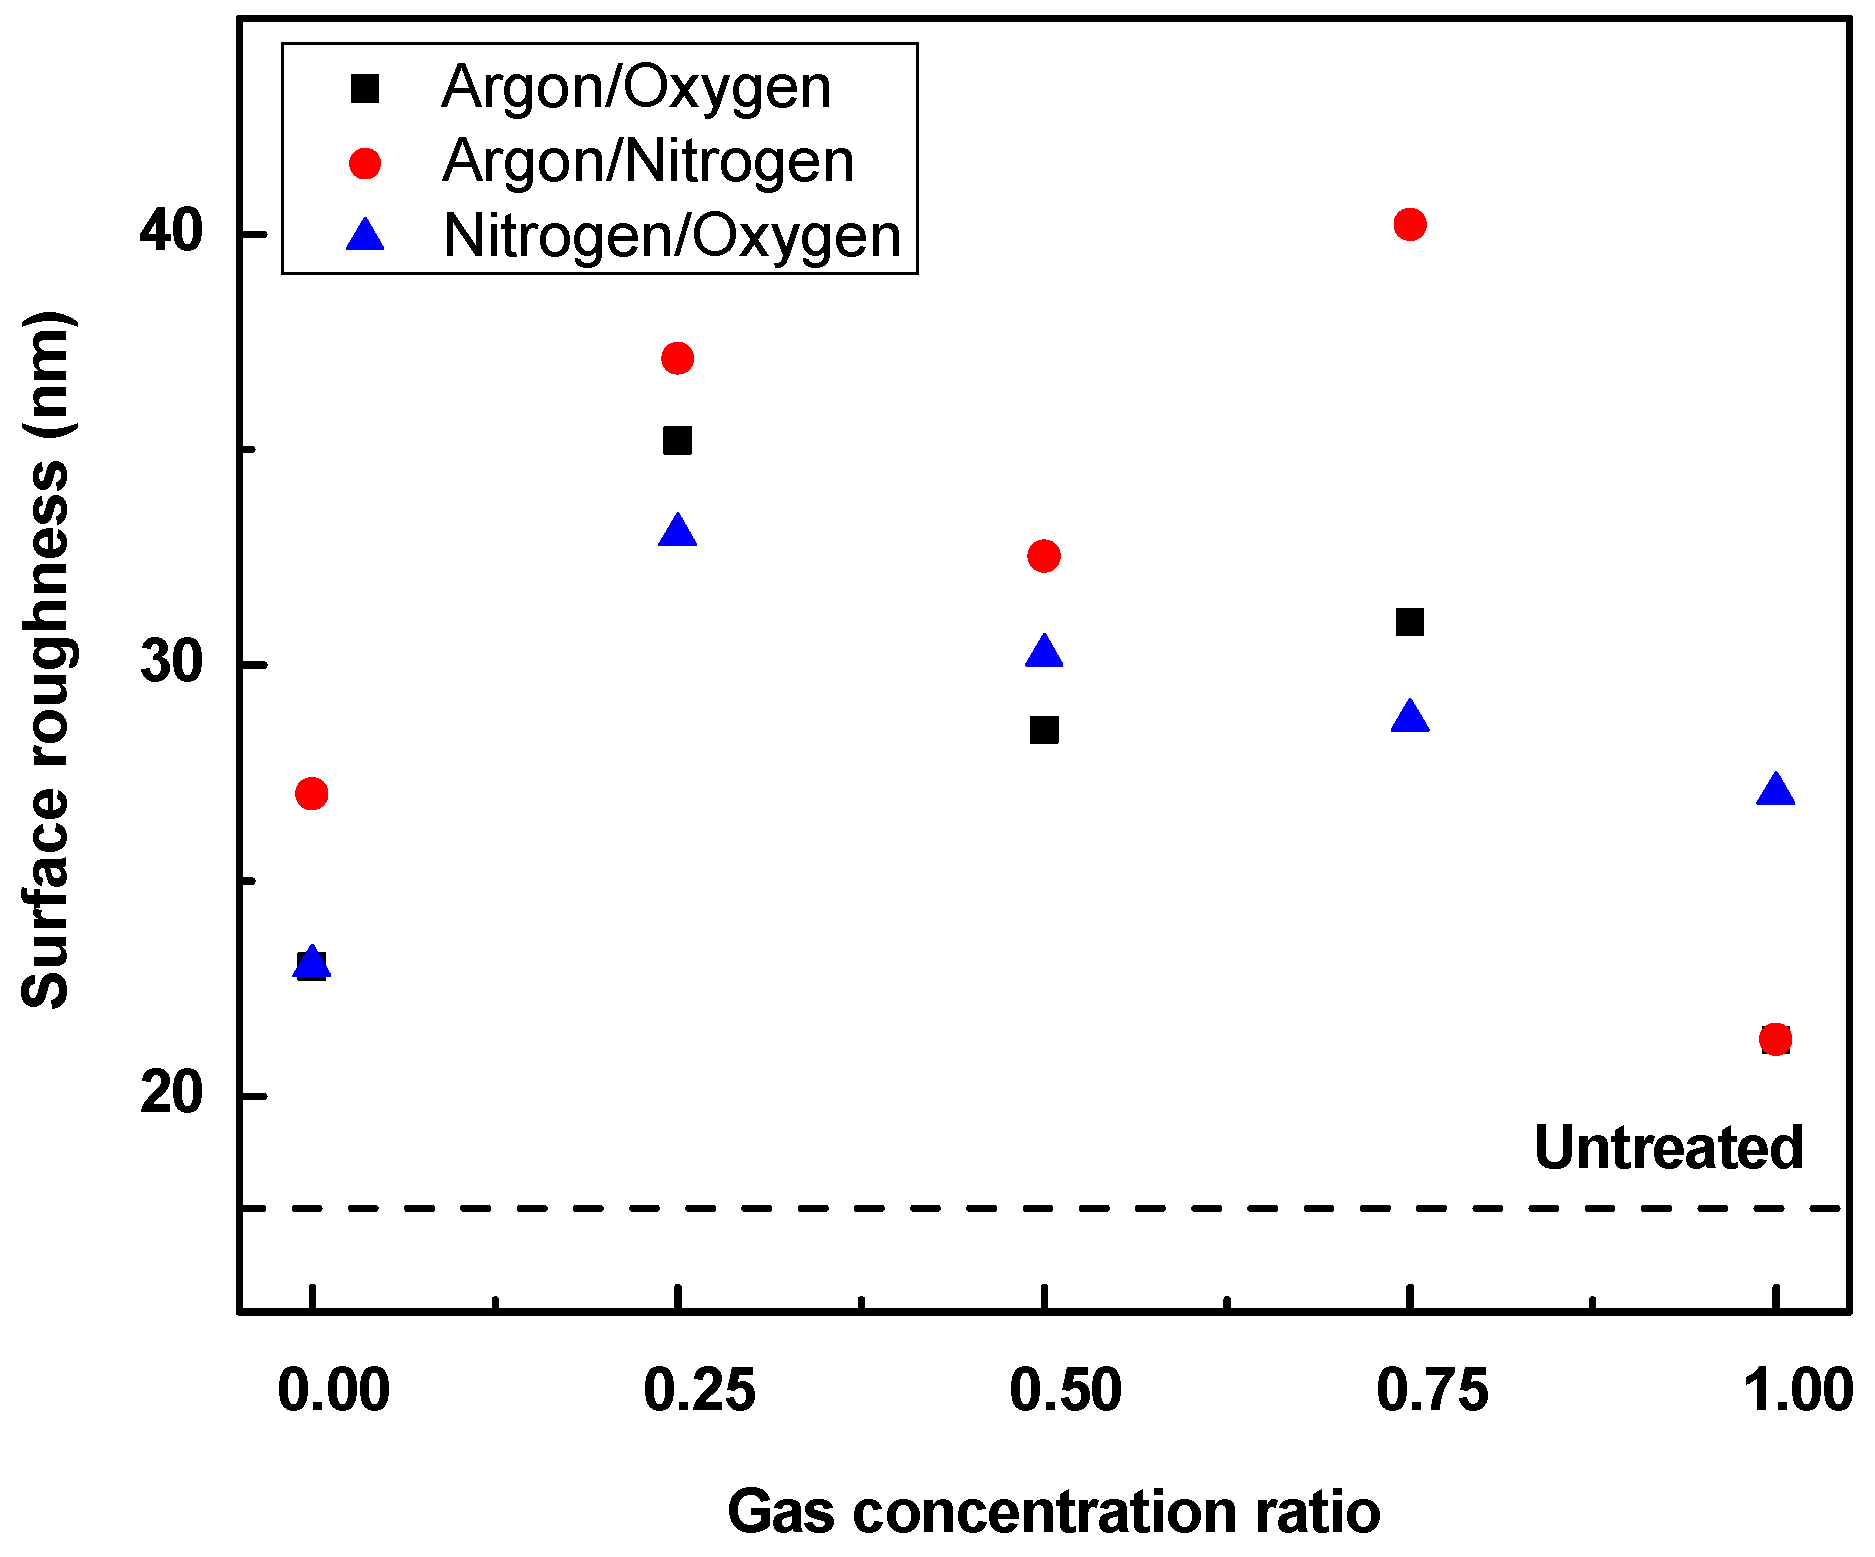
The surface roughness in terms of the arithmetic mean height (Sa) was obtained from measurements using a surface morphology system. The Sa parameter for untreated and plasma treated LDPE films using different gases and treatment times are summarized in Table 2. It could be expected that roughness will increase along with exposure time. However, the roughness values exhibit rather large fluctuations. The precision of surface roughness measurements depends on the size of the measured area. Surface topographies with smaller scan areas were obtained using 100× magnification with 6× zoom, which may offer more accurate observations in terms of micro roughness parameters. Figure 22 graphically presents surface roughness curves from 29.22 µm × 21.99 µm scan areas of untreated and plasma treated LDPE films using different gases, with respect to the treatment time. Initially, from 10–30 s, there were slight variations in roughness in terms of the treatment time, because the etching processes occurred only at the beginning. However, the trend stabilizes as etching processes gradually increased with increasing treatment times from 60 up to 120 s. With further increase in exposure time, the surface roughness again increased as possible degradation processes occurred. This indicates the predominance of the etching process, where the substrate suffers more material removal, producing a more dissimilar and rougher surface. Surface roughness increased more significantly for air and oxygen after 120 s because oxidative plasmas are typically accompanied by a higher etching level at the nano-scale. On the other hand, the use of argon has relatively presented the least aggressive etching effects over a larger surface area. The effects of gas mixtures on surface morphology were studied as well (Table 3). The evaluated Sa parameters with respect to gas mixture ratios are presented in Figure 23. LDPE films treated under pure oxygen exhibited a roughness value of 23 nm. Samples exposed to different gas mixtures of argon/oxygen, argon/nitrogen, and nitrogen/oxygen. Increasing argon content in argon/oxygen and argon/nitrogen mixtures during plasma treatment results in a sequential increasing and decreasing trend in the surface roughness of the respective LDPE films until argon concentration reached 75%, but with still higher surface roughness compared to films plasma treated with pure oxygen gas. The surface roughness of LDPE films treated under nitrogen/oxygen mixture increased to a maximum at 25% nitrogen, after which the roughness continues to drop. From these observations, it can be concluded that plasma treatment under gas mixtures results in higher levels of surface roughness compared to their pure gas counterparts. Given that surface wettability is influenced by surface roughness and the polarity of the surface, a correlation between contact angle measurements and roughness trends was observed. This correlation can be explained in terms of the substrate interfacial properties after plasma treatment. As the roughness of the outer-most molecular layer of the surface increases, the liquid droplets penetrate more easily into the surface, resulting in better wettability.
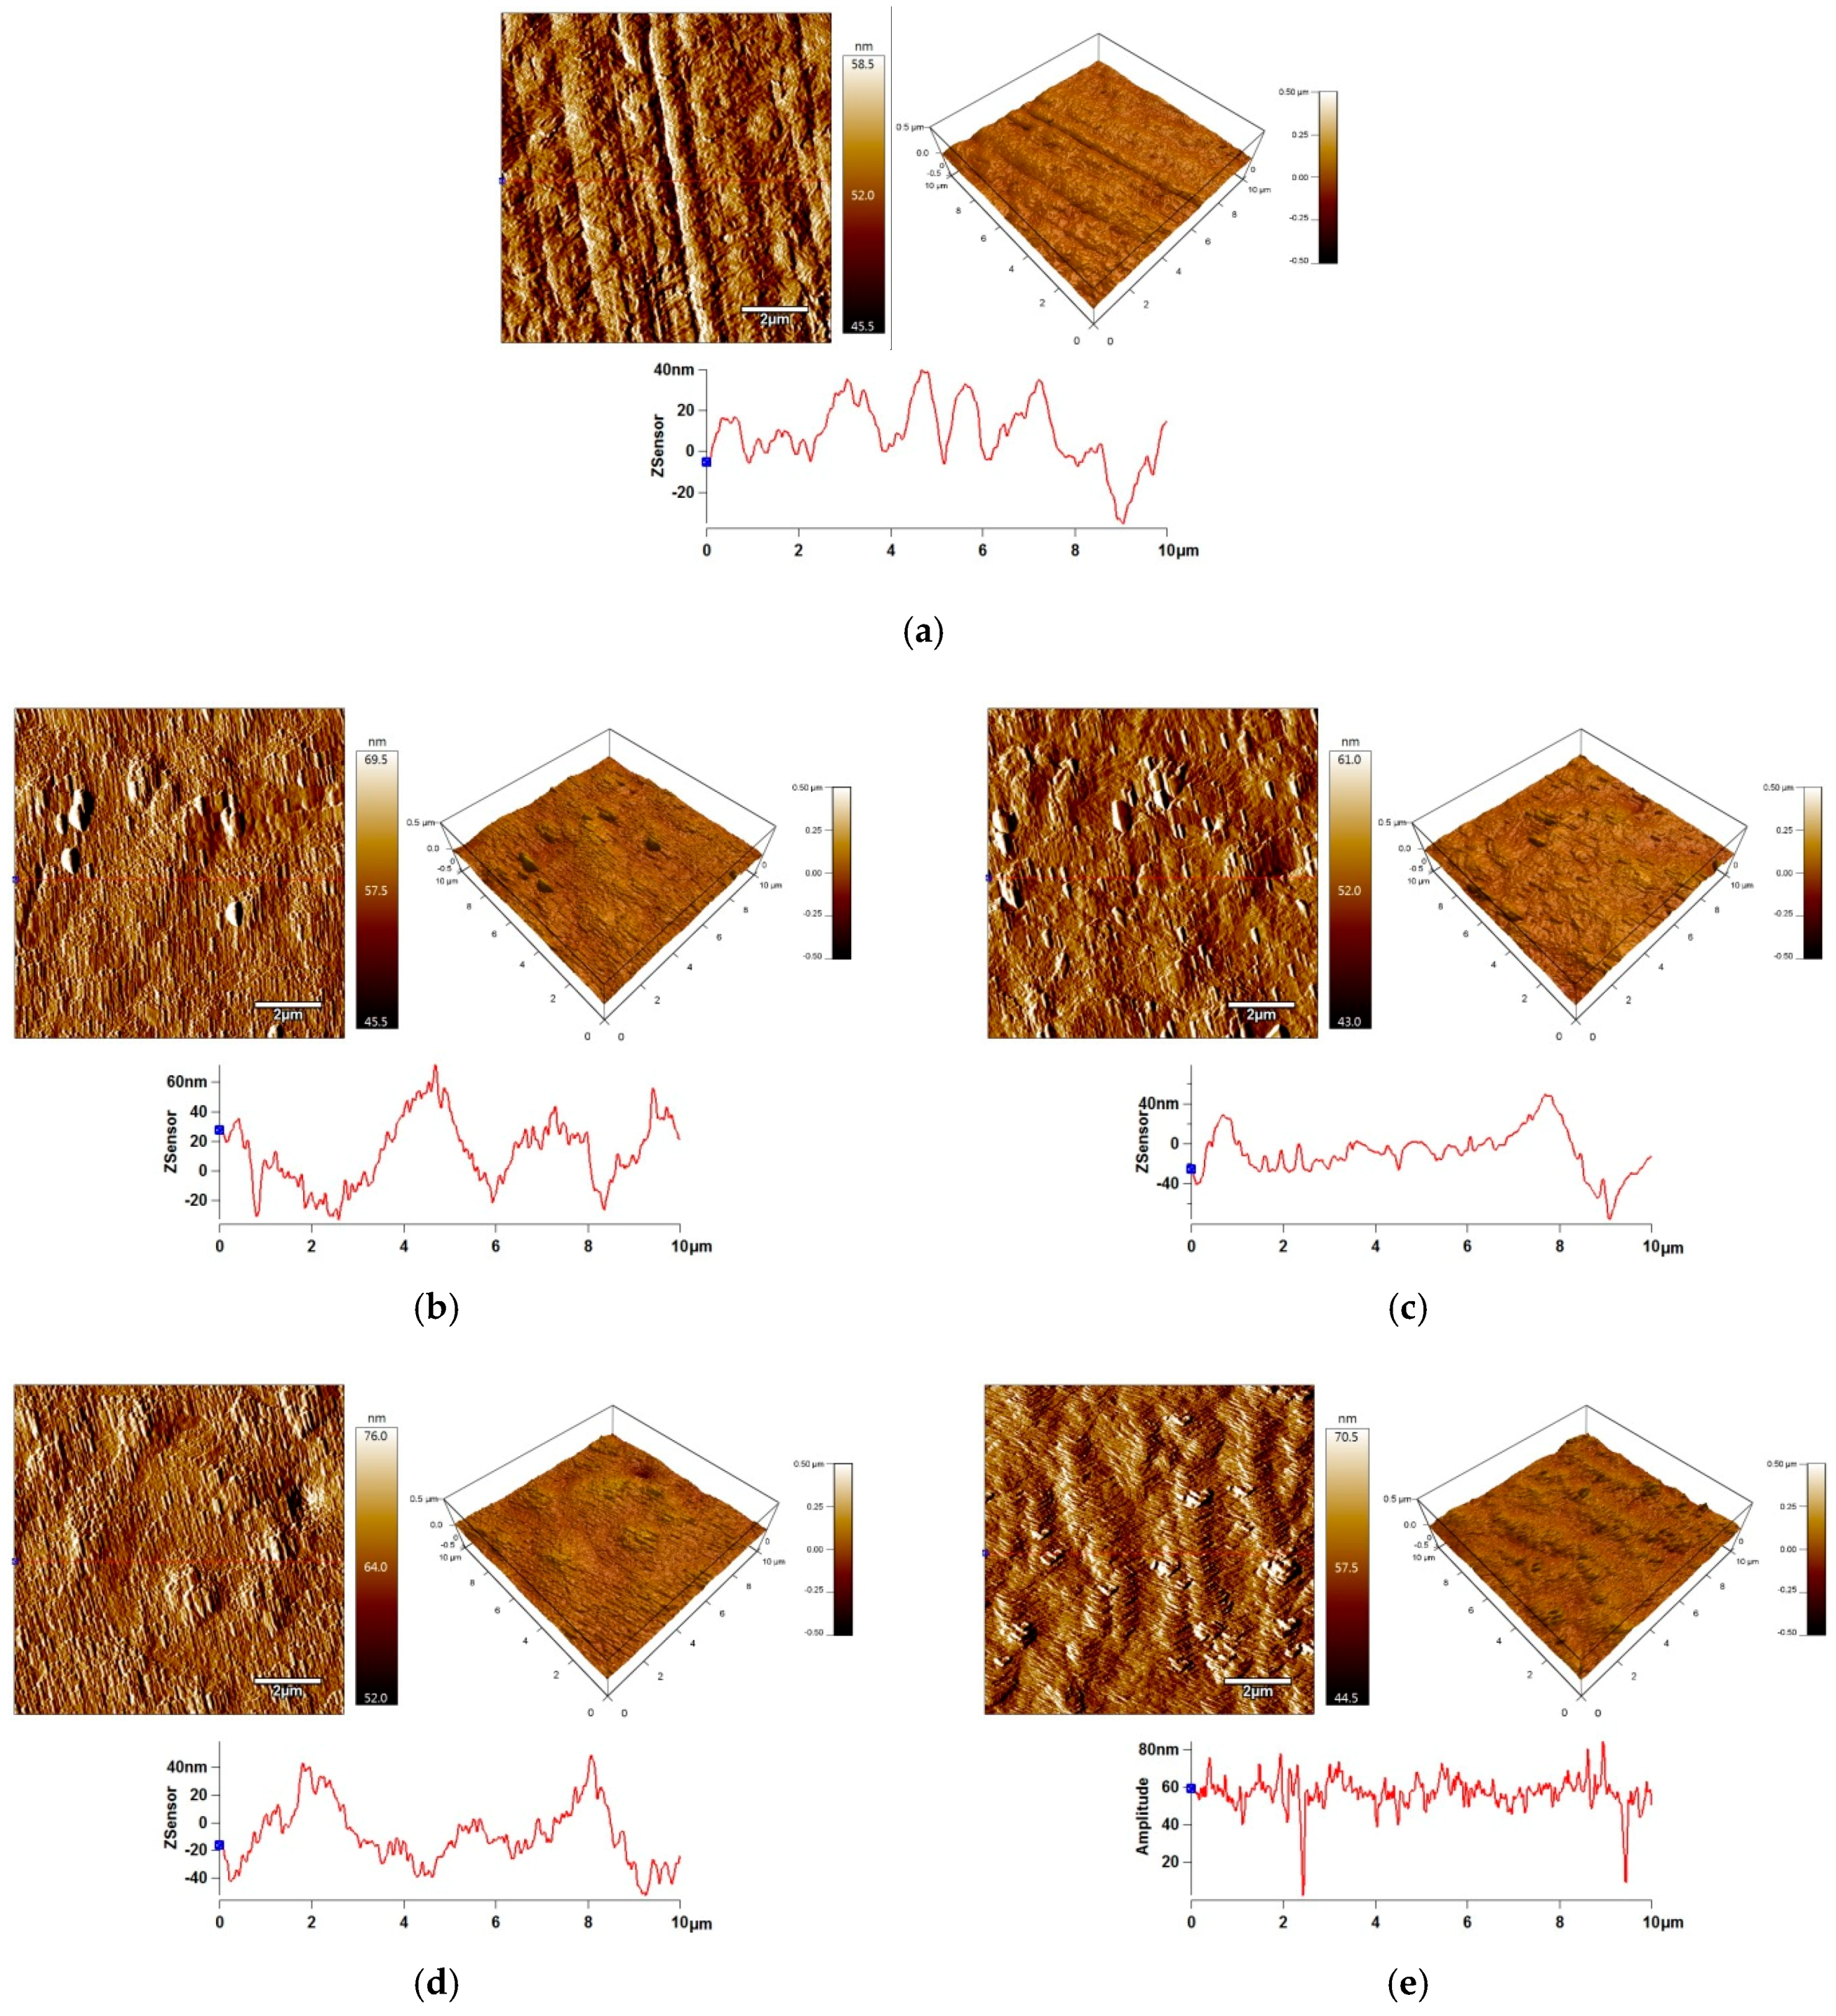
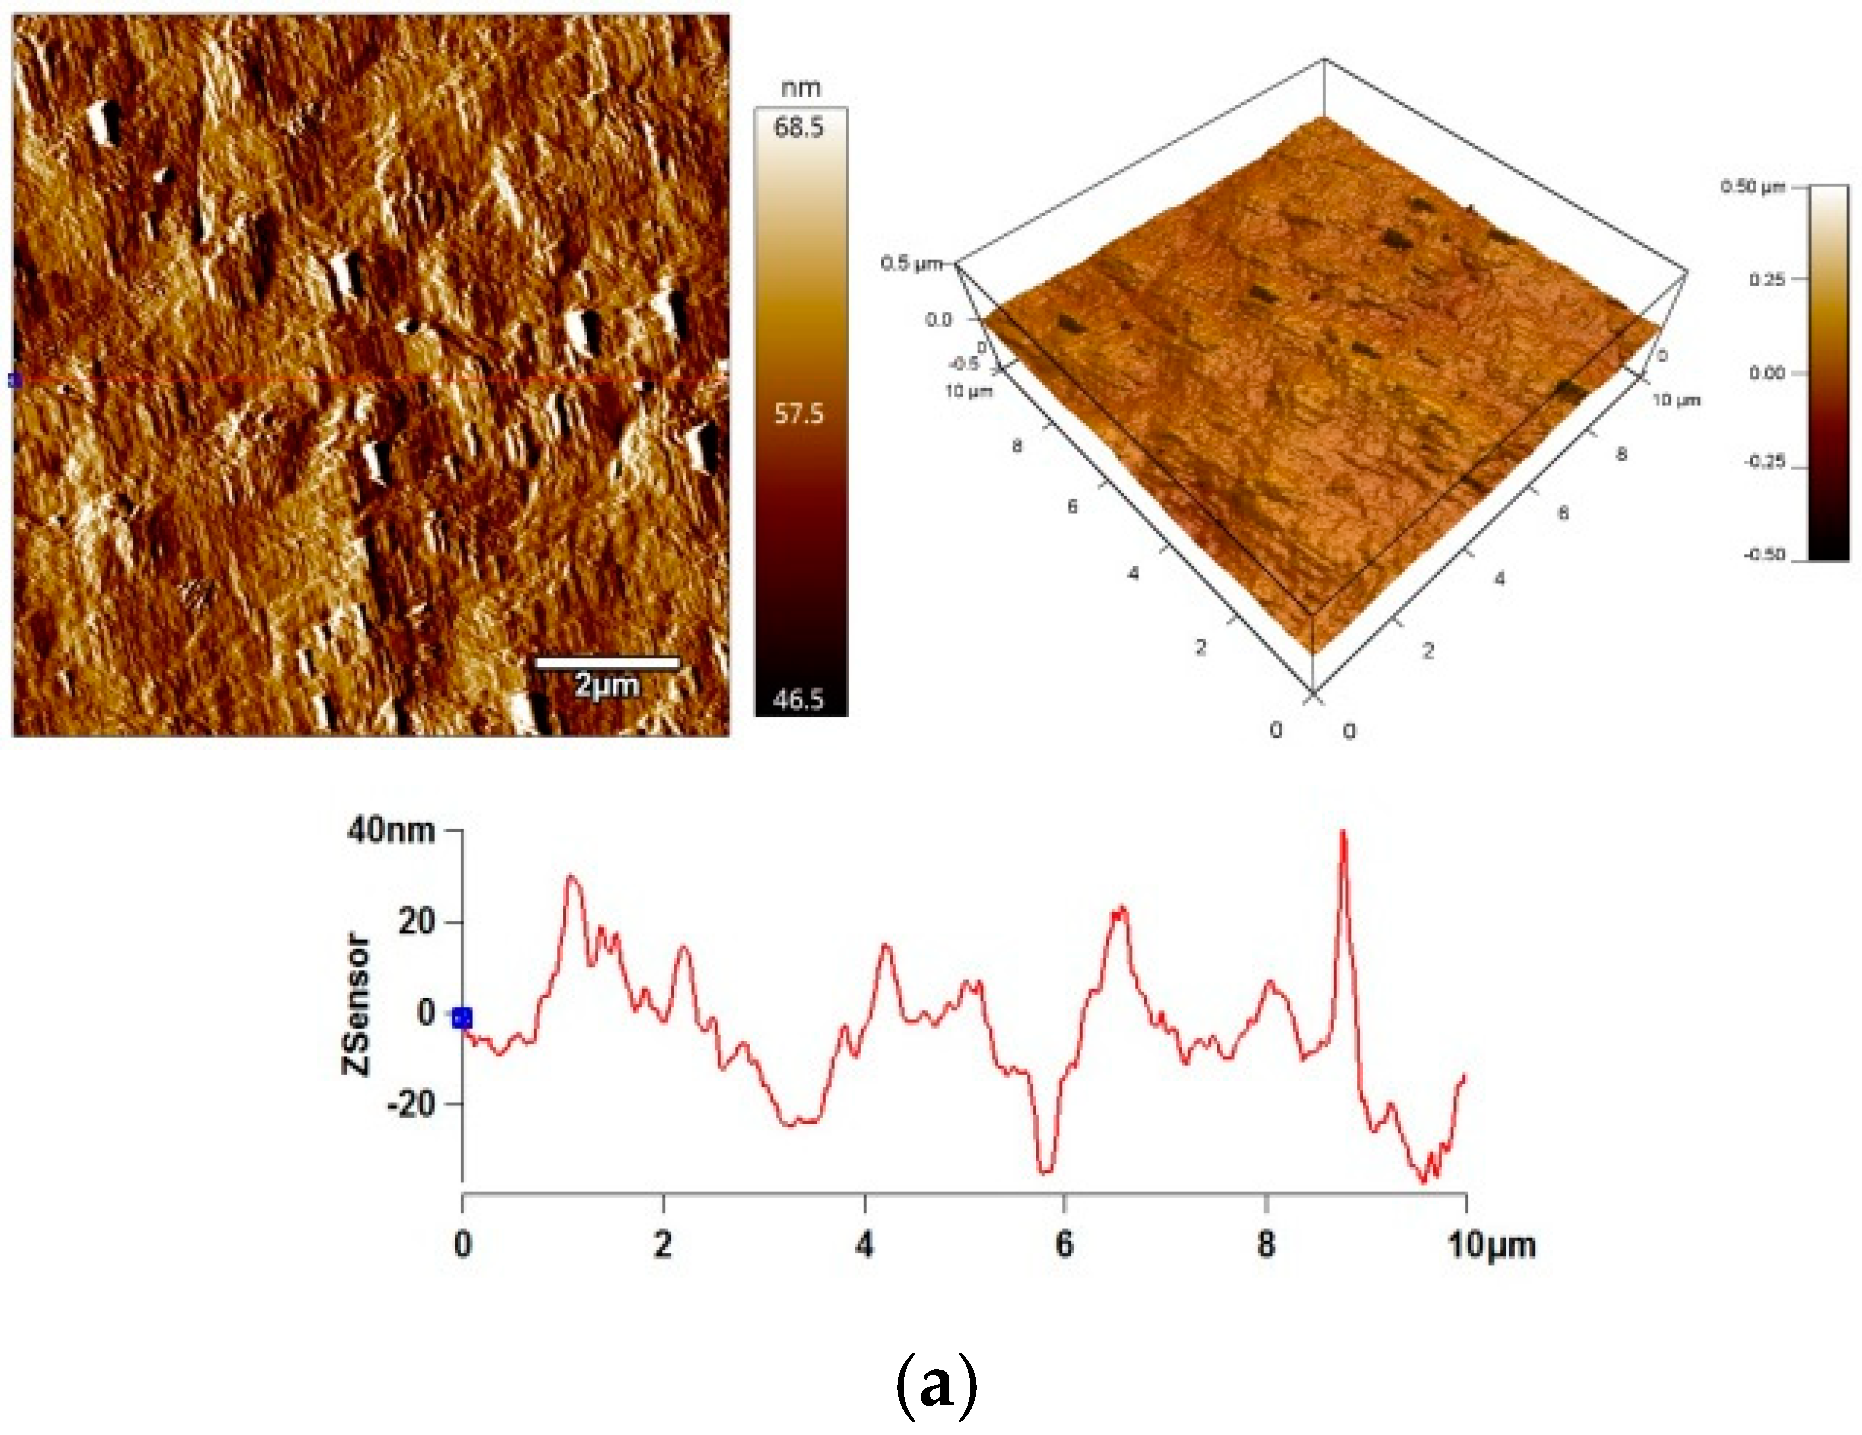
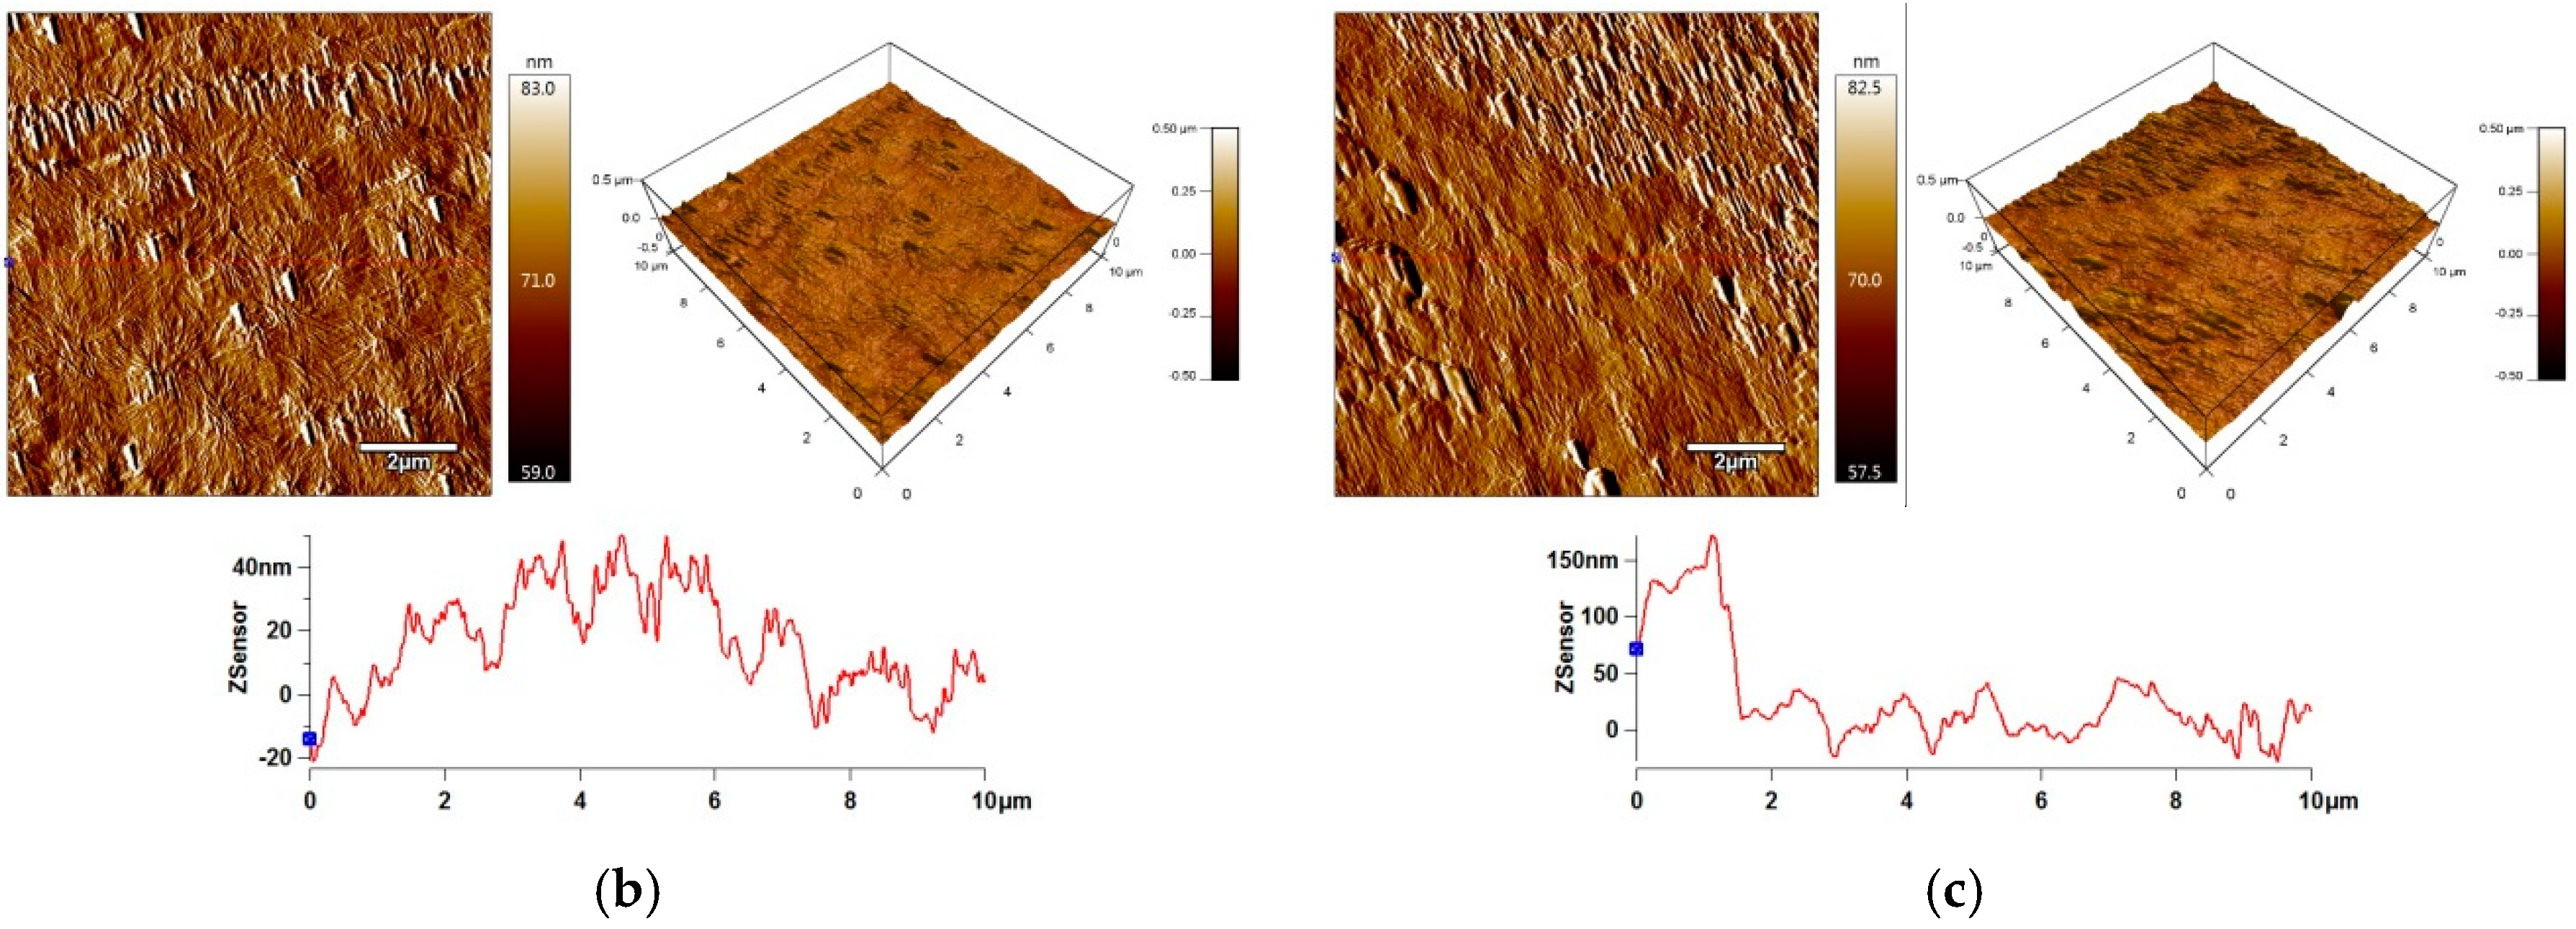
Detailed information about the surface topography changes on a small surface area (10 µm × 10 µm) of LDPE films after plasma treatment was obtained using AFM measurements. This technique was also used to quantify surface roughness changes, represented by the surface roughness parameter (Ra), which characterizes the average height of irregularities relative to the sample surface in a direction perpendicular to the surface plane. The amplitude, 3D height images, line profiles and Ra values calculated from the Z-sensor images for untreated and plasma treated LDPE (120 s and 80 W) surfaces are shown in Figure 24. Untreated samples had relatively smooth surfaces with characteristic textures originating from the production process. The Ra value of the untreated LDPE surface was relatively low, 15.7 nm. Plasma treatment of the samples led to noticeable changes in surface morphology, while Ra increased to 21.3, 18.4, 22.9, and 21.6 nm with the use of oxygen, nitrogen, argon, and air, respectively. The use of gas mixtures of argon/oxygen and argon/nitrogen with a ratio of 1:1 led to an increase in surface roughness, while the Ra value for argon/oxygen and argon/nitrogen increased to 18.0 and 21.5 nm, respectively (Figure 25). The Ra value of the LDPE surface treated with nitrogen/oxygen mixture was almost identical with Ra of untreated LDPE, but the surface morphology showed different textures. Plasma treatment of LDPE samples using each gas and their mixtures led to the regular nano-patterned structures over the surface area, with a positive effect on increase in wettability.
3.5. Plasma Affected Layer Analysis
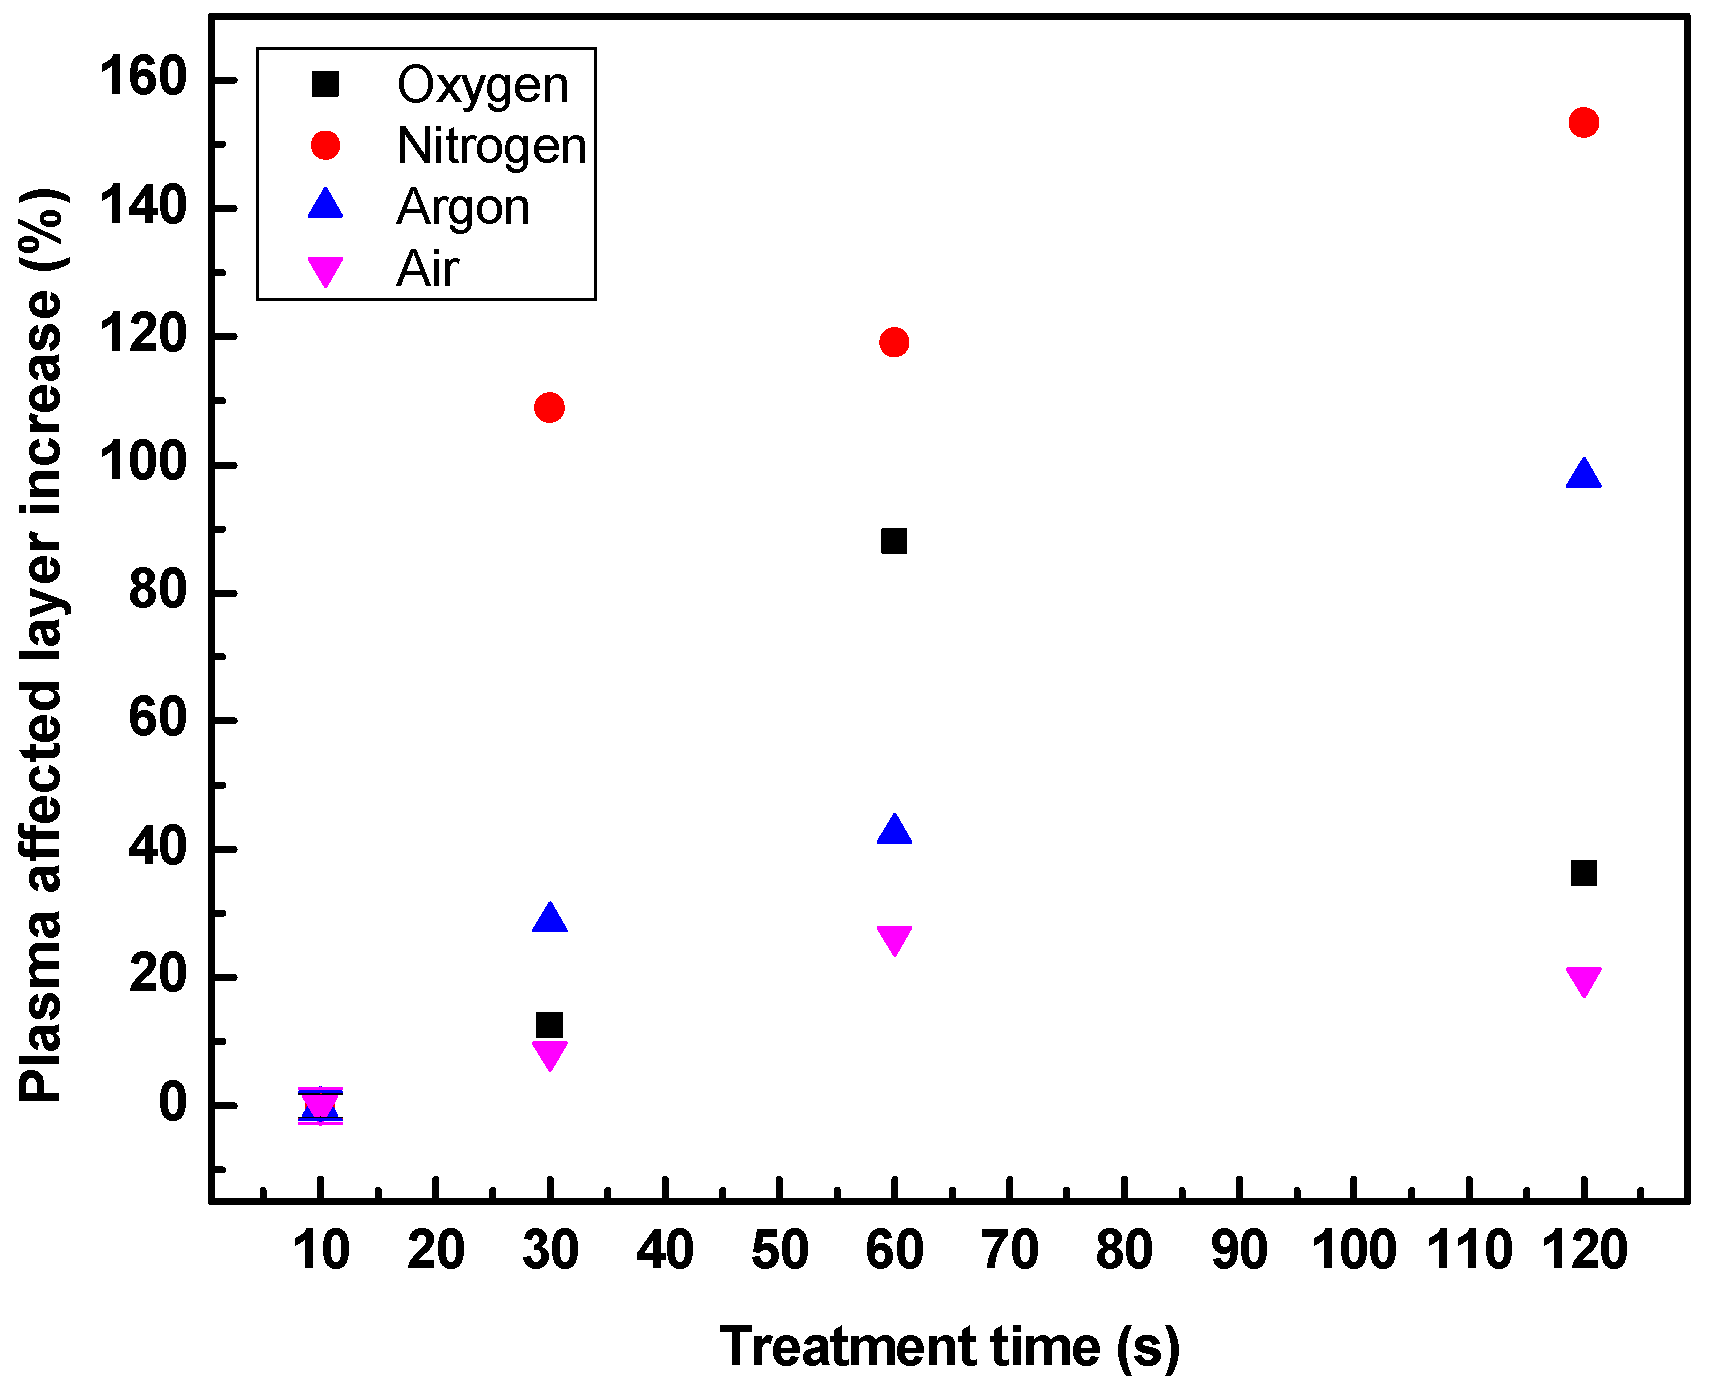
Since the native bulk properties of LDPE play an important role in various applications, the surface-specificity of plasma treatment is of considerable interest. To ensure that only the free surface is modified without compromising the bulk properties during plasma treatment, the thickness increase of the newly formed layer was measured using thin film analysis. Figure 26 shows the variation of the plasma layer thickness increase related to the 10 s treatment time of the plasma formed layer for LDPE samples treated with air, argon, nitrogen and oxygen. The measured thickness increase of treated LDPE samples ranges between 8.3%–153.4%, depending on the treatment time and used gas. Slight variations in the film thickness increase have been observed after plasma treatment, where the thickness increases during up to 60 s of exposure. Measurements after 60 s for samples treated with air and oxygen revealed a sudden drop in the thickness increase percentage. On the other hand, the thickness increase percentage continues to grow with exposure time to argon and nitrogen. This latter behavior can be explained in terms of the chemical nature of the working gas being used. Surface modification mainly occurs due to plasma deposition and etching, the effects of which could be either individual or combined. Given that argon and nitrogen are relatively inert, deposition after reactions in air with created radicals in LDPE chains is more prominent than etching, hence increasing the layer thickness. In contrast, air and oxygen are considered to be oxidative plasmas, where the etching effect dominates. This causes the outer surface layer of the substrate to be removed, hence decreasing the layer’s thickness with increasing treatment time.
4. Conclusions
In summary, a series of plasma treatments were carried out on LDPE films in the presence of pure oxygen, nitrogen, argon, air, and their mixtures representing reactive and inert gases to provide a complex overview of the changes in wettability and adhesion properties, required for various applications, such as printing, laminating, or antibiofouling. The effect of plasma on the LDPE surface has been thoroughly characterized by various analytical and microscopic techniques. The LDPE films exhibited a highly hydrophilic character after plasma treatment due to the incorporation of new polar functional species on its surface. Plasma treatment of LDPE using air was the most effective in terms of wettability when compared to plasma treatment using other gases and mixtures. Regarding the surface morphological changes, plasma treatment led to notable textured structures on the outermost surface layer of LDPE. Changes in the surface roughness indicate etching due to ion bombardment. Further plasma treatment times were responsible for the degradation of the LDPE surface occurring as a consequence of the progression of plasma etching. The maximum wettability of plasma treated LDPE surface was achieved in 120 s of exposure and with 80 W of nominal power, and this treatment revealed an 87% increase in the total surface free energy relative to an untreated surface. On the other hand, plasma treatment of the LDPE surface under argon led to the highest adhesion characteristics under the same conditions. However, over aging time, there was a reduction in hydrophilicity of the plasma treated samples due to the reorientation and migration of polar species dependent on the humidity of the medium in which samples were stored. The aging rate of plasma treated LDPE samples was different based on the gas used. Moreover, wettability increases when treated samples are stored in water for a short aging time. This was not in compliance with adhesion characteristics. Peel resistance of plasma treated LDPE samples stored in air increased after short aging times, while the use of water media led to the opposite effect. This phenomenon can be attributed to the diffusion of low-molecular weight oxidative products towards the surface area responsible for lack of adhesion and increase of wettability during short aging time periods.
Author Contributions
Conceptualization, A.P.; Methodology, A.P.; Validation, A.P.; Formal Analysis, A.P.; Investigation, A.E.A., S.H. and A.P.; Resources, M.O.; Data Curation, A.P.; Writing—Original Draft, A.E.A.; Writing—Review & Editing, A.P. and I.K.; Visualization, A.P., A.E.A. and S.H.; Supervision, A.P.; Project Administration, A.P.; Funding Acquisition, A.P.
Funding
This publication was made possible by an Award JSREP07-022-3-010 from the Qatar National Research Fund (a member of The Qatar Foundation). The statements made herein are solely the responsibility of the authors.
Acknowledgments
The authors gratefully acknowledge Gas Processing Center (GPC), Qatar University, for carrying out the XPS analysis.
Conflicts of Interest
The authors declare no conflict of interest.
References
- Van Deynse, A.; Cools, P.; Leys, C.; Morent, R.; De Geyter, N. Surface modification of polyethylene in an argon atmospheric pressure plasma jet. Surf. Coat. Technol. 2015, 276, 384–390. [Google Scholar] [CrossRef] [Green Version]
- Caldwell, R.A.; Woodell, J.E.; Ho, S.P.; Shalaby, S.W.; Boland, T.; Langan, E.M.; Laberge, M. In vitro evaluation of phosphonylated low-density polyethylene for vascular applications. J. Biomed. Mater. Res. 2002, 62, 514–524. [Google Scholar] [CrossRef] [PubMed]
- Pankaj, S.K.; Bueno-Ferrer, C.; Misra, N.N.; Milosavljević, V.; O’Donnell, C.P.; Bourke, P.; Keener, K.M.; Cullen, P.J. Applications of cold plasma technology in food packaging. Trends Food Sci. Technol. 2014, 35, 5–17. [Google Scholar] [CrossRef]
- Awaja, F.; Gilbert, M.; Kelly, G.; Fox, B.; Pigram, P.J. Adhesion of polymers. Prog. Polym. Sci. 2009, 34, 948–968. [Google Scholar] [CrossRef]
- Drnovská, H.; Lapčík, L.; Buršíková, V.; Zemek, J.; Barros-Timmons, A.M. Surface properties of polyethylene after low-temperature plasma treatment. Colloid Polym. Sci. 2003, 281, 1025–1033. [Google Scholar] [CrossRef]
- Jeong, E.; Bae, T.S.; Yun, S.M.; Woo, S.W.; Lee, Y.S. Surface characteristics of low-density polyethylene films modified by oxyfluorination-assisted graft polymerization. Colloids Surf. A 2011, 373, 36–41. [Google Scholar] [CrossRef]
- Ghasemi, M.; Minier, M.J.G.; Tatoulian, M.; Chehimi, M.M.; Arefi-Khonsari, F. Ammonia plasma treated polyethylene films for adsorption or covalent immobilization of trypsin: Quantitative correlation between X-ray photoelectron spectroscopy data and enzyme activity. J. Phys. Chem. B 2011, 115, 10228–10238. [Google Scholar] [CrossRef]
- Chashmejahanbin, M.R.; Daemi, H.; Barikani, M.; Salimi, A. Noteworthy impacts of polyurethane-urea ionomers as the efficient polar coatings on adhesion strength of plasma treated polypropylene. Appl. Surf. Sci. 2014, 317, 688–695. [Google Scholar] [CrossRef]
- Peyroux, J.; Dubois, M.; Tomasella, E.; Batisse, N.; Kharitonov, A.P.; Flahaut, D.; Romana, L.; Thomas, P. Surface modification of low-density polyethylene packaging film via direct fluorination. Surf. Coat. Technol. 2016, 292, 144–154. [Google Scholar] [CrossRef]
- Shenton, M.J.; Lovell-Hoare, M.C.; Stevens, G.C. Adhesion enhancement of polymer surfaces by atmospheric plasma treatment. J. Phys. D Appl. Phys. 2001, 34, 2754–2760. [Google Scholar] [CrossRef]
- Cáceres, C.A.; Mazzola, N.; França, M.; Canevarolo, S.V. Controlling in-line the energy level applied during the corona treatment. Polym. Test. 2012, 31, 505–511. [Google Scholar] [CrossRef]
- Kavc, T.; Kern, W.; Ebel, M.F.; Svagera, R.; Pölt, P. Surface modification of polyethylene by photochemical introduction of sulfonic acid groups. Chem. Mater. 2000, 12, 1053–1059. [Google Scholar] [CrossRef]
- Alves, P.; Pinto, S.; de Sousa, H.C.; Gil, M.H. Surface modification of a thermoplastic polyurethane by low-pressure plasma treatment to improve hydrophilicity. J. Appl. Polym. Sci. 2011, 122, 2302–2308. [Google Scholar] [CrossRef]
- Shi, L.S.; Wang, L.Y.; Wang, Y.N. The investigation of argon plasma surface modification to polyethylene: Quantitative ATR-FTIR spectroscopic analysis. Eur. Polym. J. 2006, 42, 1625–1633. [Google Scholar] [CrossRef]
- Hardman, S.J.; Hutchings, L.R.; Clarke, N.; Kimani, S.M.; Mears, L.L.; Smith, E.F.; Webster, J.R.P.; Thompson, R.L. Surface modification of polyethylene with multi-end-functional polyethylene additives. Langmuir 2012, 28, 5125–5137. [Google Scholar] [CrossRef] [PubMed]
- Chanunpanich, N.; Ulman, A.; Strzhemechny, Y.M.; Schwarz, S.A.; Janke, A.; Braun, H.G.; Kraztmuller, T. Surface modification of polyethylene through bromination. Langmuir 1999, 15, 2089–2094. [Google Scholar] [CrossRef]
- Lee, T.; Puligundla, P.; Mok, C. Inactivation of foodborne pathogens on the surfaces of different packaging materials using low-pressure air plasma. Food Control 2015, 51, 149–155. [Google Scholar] [CrossRef]
- Greene, G.; Yao, G.; Tannenbaum, R. Wetting characteristics of plasma-modified porous polyethylene. Langmuir 2003, 19, 5869–5874. [Google Scholar] [CrossRef]
- Irwan, G.S.; Aoyama, Y.; Kuroda, S.I.; Kubota, H.; Kondo, T. Characteristics of acrylic acid-grafted polyethylene prepared byphotografting using mixed solvents consisting of water and organic solvent. Eur. Polym. J. 2004, 40, 171–179. [Google Scholar] [CrossRef]
- Lee, J.M.; Kim, S.J.; Kim, J.W.; Kang, P.H.; Nho, Y.C.; Lee, Y.S. A high resolution XPS study of sidewall functionalized MWCNTs by fluorination. J. Ind. Eng. Chem. 2009, 15, 66–71. [Google Scholar] [CrossRef]
- Cheng, T.S.; Lin, H.T.; Chuang, M.J. Surface fluorination of polyethylene terephthalate films with RF plasma. Mater. Lett. 2004, 58, 650–653. [Google Scholar] [CrossRef]
- Jung, M.J.; Kim, J.W.; Im, J.S.; Park, S.J.; Lee, Y.S. Nitrogen and hydrogen adsorption of activated carbon fibers modified by fluorination. J. Ind. Eng. Chem. 2009, 15, 410–414. [Google Scholar] [CrossRef]
- Seguchi, T.; Yagi, T.; Ishikawa, S.; Sano, Y. New material synthesis by radiation processing at high temperature–Polymer modification with improved irradiation technology. Radiat. Phys. Chem. 2002, 63, 35–40. [Google Scholar] [CrossRef]
- Lei, J.; Liao, X. Surface graft copolymerization of acrylic acid onto LDPE film through corona discharge. Eur. Polym. J. 2001, 37, 771–779. [Google Scholar] [CrossRef]
- Demina, T.; Zaytseva-Zotova, D.; Yablokov, M.; Gilman, A.; Akopova, T.; Markvicheva, E.; Zelenetskii, A. DC discharge plasma modification of chitosan/gelatin/PLLA films: Surface properties, chemical structure and cell affinity. Surf. Coat. Technol. 2012, 207, 508–516. [Google Scholar] [CrossRef]
- Tajima, S.; Komvopoulos, K. Surface modification of low-density polyethylene by inductively coupled argon plasma. J. Phys. Chem. B 2005, 109, 17623–17629. [Google Scholar] [CrossRef] [PubMed]
- Kim, S.H.; Kim, J.H.; Kang, B.K.; Uhm, H.S. Superhydrophobic CFx coating via in-line atmospheric RF plasma of He-CF4-H2. Langmuir 2005, 21, 12213–12217. [Google Scholar] [CrossRef] [PubMed]
- Kim, S.H.; Kim, J.H.; Kang, B.K. Decomposition reaction of organophosphorus nerve agents on solid surfaces with atmospheric radio frequency plasma generated gaseous species. Langmuir 2007, 23, 8074–8078. [Google Scholar] [CrossRef] [PubMed]
- Lee, J.; Hwang, S.; Cho, D.H.; Hong, J.; Shin, J.H.; Byun, D. RF plasma based selective modification of hydrophilic regions on super hydrophobic surface. Appl. Surf. Sci. 2017, 394, 543–553. [Google Scholar] [CrossRef]
- Aflori, M.; Drobota, M.; Ţimpu, D.; Barboiu, V. Studies of amine treatments influence on poly(ethyleneterepthalate) films. Optoelectron. Adv. Mater. Rapid Commun. 2008, 2, 291–295. [Google Scholar]
- De Geyter, N.; Morent, R.; Leys, C. Influence of ambient conditions on the ageing behaviour of plasma-treated PET surfaces. Nucl. Instrum. Methods Phys. Res. Sect. B 2008, 266, 3086–3090. [Google Scholar] [CrossRef]
- Ataeefard, M.; Moradian, S.; Mirabedini, M.; Ebrahimi, M.; Asiaban, S. Investigating the effect of power/time in the wettability of Ar and O2 gas plasma-treated low-density polyethylene. Prog. Org. Coat. 2009, 64, 482–488. [Google Scholar] [CrossRef]
- López-Santos, C.; Yubero, F.; Cotrino, J.; González-Elipe, A.R. Nitrogen plasma functionalization of low density polyethylene. Surf. Coat. Technol. 2011, 205, 3356–3364. [Google Scholar] [CrossRef]
- Aflori, M.; Drobota, M.; Dimitriu, D.G.; Stoica, I.; Simionescu, B.; Harabagiu, V. Collagen immobilization on polyethylene terephthalate surface after helium plasma treatment. Mater. Sci. Eng. B 2013, 178, 1303–1310. [Google Scholar] [CrossRef]
- Junkar, I.; Vesel, A.; Cvelbar, U.; Mozetič, M.; Strnad, S. Influence of oxygen and nitrogen plasma treatment on polyethylene terephthalate (PET) polymers. Vacuum 2009, 84, 83–85. [Google Scholar] [CrossRef]
- Švorčík, V.; Kolářová, K.; Slepička, P.; Macková, A.; Novotná, M.; Hnatowicz, V. Modification of surface properties of high and low density polyethylene by Ar plasma discharge. Polym. Degrad. Stab. 2006, 91, 1219–1225. [Google Scholar] [CrossRef]
- Pandiyaraj, K.N.; Ferraria, A.M.; do Rego, A.M.B.; Deshmukh, R.R.; Su, P.G.; Halleluyah, J.M.; Halim, A.S. Low-pressure plasma enhanced immobilization of chitosan on low-density polyethylene for bio-medical applications. Appl. Surf. Sci. 2015, 328, 1–12. [Google Scholar] [CrossRef]
- Chvátalová, L.; Čermák, R.; Mráček, A.; Grulich, O.; Vesel, A.; Ponížil, P.; Minařík, A.; Cvelbar, U.; Beníček, L.; Sajdl, P. The effect of plasma treatment on structure and properties of poly(1-butene) surface. Eur. Polym. J. 2012, 48, 866–874. [Google Scholar] [CrossRef]
- Borcia, G.; Anderson, C.A.; Brown, N.M.D. The surface oxidation of selected polymers using an atmospheric pressure air dielectric barrier discharge. Part II. Appl. Surf. Sci. 2004, 225, 186–197. [Google Scholar] [CrossRef]
- Akishev, Y.; Grushin, M.; Dyatko, N.; Kochetov, I.; Napartovich, A.; Trushkin, N.; Minh Duc, T.; Descours, S. Studies on cold plasma-polymer surface interaction by example of PP- and PET-films. J. Phys. D. Appl. Phys. 2008, 41, 235203. [Google Scholar] [CrossRef]
- Dorranian, D.; Golian, Y. Effect of radio frequency plasma treatment on the nonlinear refractive index and absorption coefficient of red lake doped polyvinyl chloride film. Opt. Quantum Electron. 2015, 47, 2027–2038. [Google Scholar] [CrossRef]
- Jordá-Vilaplana, A.; Fombuena, V.; García-García, D.; Samper, M.D.; Sánchez-Nácher, L. Surface modification of polylactic acid (PLA) by air atmospheric plasma treatment. Eur. Polym. J. 2014, 58, 23–33. [Google Scholar] [CrossRef] [Green Version]
- Griesser, H.J.; Da, Y.; Hughes, A.E.; Gengenbach, T.R.; Mau, A.W. Shallow reorientation in the surface dynamics of plasma-treated fluorinated ethylene propylene polymer. Langmuir 1991, 7, 2484–2491. [Google Scholar] [CrossRef]
- Nakamatsu, J.; Delgado-Aparicio, L.F.; Da Silva, R.; Soberon, F. Ageing of plasma-treated poly(tetrafluoroethylene) surfaces. J. Adhes. Sci. Technol. 1999, 13, 753–761. [Google Scholar] [CrossRef]
- Hegemann, D.; Lorusso, E.; Butron-Garcia, M.I.; Blanchard, N.E.; Rupper, P.; Favia, P.; Heuberger, M.; Vandenbossche, M. Suppression of hydrophobic recovery by plasma polymer films with vertical chemical gradients. Langmuir 2016, 32, 651–654. [Google Scholar] [CrossRef] [PubMed]
- Yun, Y.I.; Kim, K.S.; Uhm, S.J.; Khatua, B.B.; Cho, K.; Kim, J.K.; Park, C.E. Aging behavior of oxygen plasma-treated polypropylene with different crystallinities. J. Adhes. Sci. Technol. 2004, 18, 1279–1291. [Google Scholar] [CrossRef]
- Yagoubi, W.; Abdelhafidi, A.; Sebaa, M.; Chabira, S.F. Identification of carbonyl species of weathered LDPE films by curve fitting and derivative analysis of IR spectra. Polym. Test. 2015, 44, 37–48. [Google Scholar] [CrossRef]
- Lock, E.H.; Petrovykh, D.Y.; Mack, P.; Carney, T.; White, R.G.; Walton, S.G.; Fernsler, R.F. Surface composition, chemistry, and structure of polystyrene modified by electron-beam-generated plasma. Langmuir 2010, 26, 8857–8868. [Google Scholar] [CrossRef] [PubMed]
Figure 1.
Schematic diagram of the surface modification process using radio-frequency (RF) plasma setup.
Figure 1.
Schematic diagram of the surface modification process using radio-frequency (RF) plasma setup.

Figure 2.
Surface wettability of low-density polyethylene (LDPE) as a function of nominal power for LDPE modified using air plasma for 60 s: (a) contact angle; (b) surface free energy (SFE).
Figure 2.
Surface wettability of low-density polyethylene (LDPE) as a function of nominal power for LDPE modified using air plasma for 60 s: (a) contact angle; (b) surface free energy (SFE).

Figure 3.
Surface wettability of LDPE as a function of plasma treatment time for LDPE treated using different gases: (a) contact angle of water; (b) surface free energy (SFE).
Figure 3.
Surface wettability of LDPE as a function of plasma treatment time for LDPE treated using different gases: (a) contact angle of water; (b) surface free energy (SFE).

Figure 4.
Surface wettability of LDPE treated using argon/oxygen plasma for 120 s as a function of gas concentration ratio: (a) contact angle of water; (b) surface free energy (SFE).
Figure 4.
Surface wettability of LDPE treated using argon/oxygen plasma for 120 s as a function of gas concentration ratio: (a) contact angle of water; (b) surface free energy (SFE).

Figure 5.
Surface wettability of LDPE treated using nitrogen/oxygen plasma for 120 s as a function of gas concentration ratio: (a) contact angle; (b) surface free energy (SFE).
Figure 5.
Surface wettability of LDPE treated using nitrogen/oxygen plasma for 120 s as a function of gas concentration ratio: (a) contact angle; (b) surface free energy (SFE).

Figure 6.
Surface wettability of LDPE treated using argon/nitrogen plasma for 120 s as a function of gas concentration: (a) contact angle; (b) surface free energy (SFE).
Figure 6.
Surface wettability of LDPE treated using argon/nitrogen plasma for 120 s as a function of gas concentration: (a) contact angle; (b) surface free energy (SFE).

Figure 7.
Surface wettability of LDPE treated for 120 s using different gases and stored in ambient air: (a) contact angle; (b) surface free energy (SFE).
Figure 7.
Surface wettability of LDPE treated for 120 s using different gases and stored in ambient air: (a) contact angle; (b) surface free energy (SFE).

Figure 8.
Surface wettability of LDPE treated for 120 s using different gases and stored in water: (a) contact angle; (b) surface free energy (SFE).
Figure 8.
Surface wettability of LDPE treated for 120 s using different gases and stored in water: (a) contact angle; (b) surface free energy (SFE).

Figure 9.
Peel resistance of LDPE treated for 120 s using different gases.

Figure 10.
Peel resistance of LDPE treated for 120 s using different gases and stored in air.

Figure 11.
Peel resistance of LDPE treated for 120 s using different gases and stored in water.

Figure 12.
FTIR spectra of LDPE plasma treated for 120 s using air and stored in air.

Figure 13.
FTIR spectra of LDPE plasma treated for 120 s using air and stored in water.

Figure 14.
FTIR spectra of LDPE plasma treated for 120 s using oxygen and stored in air.

Figure 15.
FTIR spectra of LDPE plasma treated for 120 s using oxygen and stored in water.

Figure 16.
FTIR spectra of LDPE plasma treated for 120 s using nitrogen and stored in air.

Figure 17.
FTIR spectra of LDPE plasma treated for 120 s using nitrogen and stored in water.

Figure 18.
FTIR spectra of LDPE plasma treated for 120 s using argon and stored in air.

Figure 19.
FTIR spectra of LDPE plasma treated for 120 s using argon and stored in water.

Figure 20.
XPS spectra of plasma treated LDPE using different gases.

Figure 21.
SEM images at 20000× magnification of LDPE films: (a) untreated; (b) treated in oxygen; (c) treated in nitrogen; (d) treated in argon; (e) treated in air.
Figure 21.
SEM images at 20000× magnification of LDPE films: (a) untreated; (b) treated in oxygen; (c) treated in nitrogen; (d) treated in argon; (e) treated in air.

Figure 22.
Surface roughness of plasma treated LDPE using air, oxygen, nitrogen, and argon.

Figure 23.
Surface roughness plasma treated LDPE using different gas mixtures ratio.

Figure 24.
AFM height images of LDPE: (a) untreated (Ra = 15.7 nm); and plasma treated (120 s) in: (b) oxygen (Ra = 21.3 nm); (c) nitrogen (Ra = 18.4 nm); (d) argon (Ra = 22.9 nm); (e) air (Ra = 21.6 nm).
Figure 24.
AFM height images of LDPE: (a) untreated (Ra = 15.7 nm); and plasma treated (120 s) in: (b) oxygen (Ra = 21.3 nm); (c) nitrogen (Ra = 18.4 nm); (d) argon (Ra = 22.9 nm); (e) air (Ra = 21.6 nm).

Figure 25.
AFM height images of plasma treated LDPE (120 s) in gas mixtures with 1:1 ratio: (a) nitrogen/oxygen (Ra = 15.8 nm); (b) argon/oxygen (Ra = 18.0 nm); (c) nitrogen/argon (Ra = 21.5 nm).
Figure 25.
AFM height images of plasma treated LDPE (120 s) in gas mixtures with 1:1 ratio: (a) nitrogen/oxygen (Ra = 15.8 nm); (b) argon/oxygen (Ra = 18.0 nm); (c) nitrogen/argon (Ra = 21.5 nm).


Figure 26.
The change in % increase of plasma affected layer of LDPE with increasing treatment time.
Figure 26.
The change in % increase of plasma affected layer of LDPE with increasing treatment time.


Table 1.
Chemical composition of LDPE treated using different gases and aged in air or water.
| Element | Atomic Concentration (at.%) | |||||||
|---|---|---|---|---|---|---|---|---|
| Untreated | Treated in Air | Aging Time (h) | ||||||
| 24 | 168 | 672 | ||||||
| Air | Water | Air | Water | Air | Water | |||
| C1s | 97.41 | 86.76 | 87.64 | 80.23 | 83.18 | 81.06 | 82.08 | 67.49 |
| O1s | 2.59 | 12.75 | 16.11 | 18.98 | 16.08 | 17.76 | 15.59 | 31.02 |
| N1s | 0.00 | 0.29 | 0.47 | 0.69 | 0.58 | 0.95 | 0.00 | 1.41 |
| Element | Untreated | Treated in Oxygen | Aging Time (h) | |||||
| 24 | 168 | 672 | ||||||
| Air | Water | Air | Water | Air | Water | |||
| C1s | 97.41 | 86.58 | 85.82 | 85.03 | 85.22 | 82.61 | 87.51 | 72.91 |
| O1s | 2.59 | 12.51 | 12.88 | 14.19 | 13.68 | 15.84 | 12.03 | 23.45 |
| N1s | 0.00 | 0.29 | 1.11 | 0.65 | 0.81 | 1.33 | 0.31 | 3.49 |
| Element | Untreated | Treated in Nitrogen | Aging Time (h) | |||||
| 24 | 168 | 672 | ||||||
| Air | Water | Air | Water | Air | Water | |||
| C1s | 97.41 | 87.84 | 85.35 | 73.39 | 85.90 | 82.50 | 86.89 | 74.90 |
| O1s | 2.59 | 11.64 | 13.53 | 26.08 | 13.16 | 15.75 | 12.40 | 23.37 |
| N1s | 0.00 | 0.52 | 0.99 | 0.53 | 0.81 | 1.19 | 0.62 | 1.51 |
| Element | Untreated | Treated in Argon | Aging Time (h) | |||||
| 24 | 168 | 672 | ||||||
| Air | Water | Air | Water | Air | Water | |||
| C1s | 97.41 | 84.24 | 85.06 | 86.14 | 84.60 | 79.31 | 84.39 | 72.28 |
| O1s | 2.59 | 14.40 | 13.72 | 13.47 | 14.55 | 19.39 | 14.81 | 23.92 |
| N1s | 0.00 | 1.09 | 1.02 | 0.40 | 0.68 | 1.11 | 0.48 | 3.73 |
Table 2.
Surface roughness of plasma treated LDPE.
| Treatment Time (s) | Surface Roughness Sa (nm) | |||
|---|---|---|---|---|
| Oxygen | Nitrogen | Argon | Air | |
| 0 | 17.4 | 17.4 | 17.4 | 17.4 |
| 10 | 26.2 | 25.5 | 28.6 | 48.9 |
| 20 | 19.7 | 39.4 | 26.1 | 44.6 |
| 30 | 22.9 | 31.3 | 21.6 | 30.9 |
| 60 | 23.0 | 27.8 | 24.8 | 26.1 |
| 120 | 23.1 | 27.0 | 21.3 | 33.1 |
| 180 | 36.2 | 32.2 | 30.9 | 31.5 |
Table 3.
Surface roughness of plasma treated LDPE using different gas mixtures at 120 s.
| Gas Concentration Ratio | Surface Roughness Sa (nm) | ||
|---|---|---|---|
| Argon/Oxygen | Nitrogen/Oxygen | Argon/Nitrogen | |
| 0 | 23.1 | 23.1 | 27.0 |
| 0.25 | 35.2 | 33.0 | 37.1 |
| 0.5 | 28.5 | 30.2 | 32.5 |
| 0.75 | 31.0 | 28.7 | 40.2 |
| 1 | 21.3 | 27.0 | 21.3 |
© 2019 by the authors. Licensee MDPI, Basel, Switzerland. This article is an open access article distributed under the terms and conditions of the Creative Commons Attribution (CC BY) license (http://creativecommons.org/licenses/by/4.0/).
Share and Cite
MDPI and ACS Style
E. Abusrafa, A.; Habib, S.; Krupa, I.; Ouederni, M.; Popelka, A. Modification of Polyethylene by RF Plasma in Different/Mixture Gases. Coatings 2019, 9, 145. https://doi.org/10.3390/coatings9020145
AMA Style
E. Abusrafa A, Habib S, Krupa I, Ouederni M, Popelka A. Modification of Polyethylene by RF Plasma in Different/Mixture Gases. Coatings. 2019; 9(2):145. https://doi.org/10.3390/coatings9020145
Chicago/Turabian StyleE. Abusrafa, Aya, Salma Habib, Igor Krupa, Mabrouk Ouederni, and Anton Popelka. 2019. "Modification of Polyethylene by RF Plasma in Different/Mixture Gases" Coatings 9, no. 2: 145. https://doi.org/10.3390/coatings9020145
Note that from the first issue of 2016, this journal uses article numbers instead of page numbers. See further details here.