Article

Very Low Nucleation Rates of Glucose Isomerase Crystals under Microgravity in the International Space Station

1
Graduate School of Technology, Industrial and Social Sciences, Tokushima University, 2-1 Minamijosanjima, Tokushima 770-8506, Japan
2
Graduate School of Engineering, Osaka University, 2-1 Yamadaoka, Suita, Osaka 565-0871, Japan
3
School of Science, Tohoku University, Aramaki, Aoba, Sendai 980-8578, Japan
4
Advanced Engineering Services Co., Ltd., 1-6-1 Takezono, Tsukuba, Ibaraki 305-0032, Japan
5
Japan Space Forum, 3-2-1 Kandasurugadai, Chiyoda-ku, Tokyo 101-0062, Japan
6
Graduate School of Advanced Technology and Science, Tokushima University, 2-1 Minamijosanjima, Tokushima 770-8506, Japan
7
Faculty of Engineering, Tokushima University, 2-1 Minamijosanjima, Tokushima 770-8506, Japan
8
Japan Manned Space Systems Corporation, 2-1-6 Sengen, Tsukuba, Ibaraki 305-0047, Japan
9
Japan Aerospace Exploration Agency (JAXA), 2-1-1 Sengen, Tsukuba, Ibaraki 305-8505, Japan
*
Author to whom correspondence should be addressed.
Crystals 2019, 9(2), 90; https://doi.org/10.3390/cryst9020090
Submission received: 28 December 2018 / Revised: 5 February 2019 / Accepted: 8 February 2019 / Published: 11 February 2019
(This article belongs to the Special Issue Protein Crystallography)

Abstract

:
In situ observation of the nucleation and growth of glucose isomerase (GI) crystals under microgravity was conducted using an optical microscope during the first flight of the Advanced Nano Step project undertaken in the International Space Station (ISS). Very low apparent nucleation rates (J’) of GI crystals in the solution and on the substrate of the growth container were confirmed compared with those on the ground. In particular, J’ of GI crystals in the solution were a few times lower than that on the substrate. The growth rates (R) of the {101} faces of GI crystals on the substrate and the apparent growth rates (R’) in the solution were measured. The very low nucleation rates allowed us to successfully measure R at a very high supersaturation region (up to ln(C/Ce) = 6), at which R cannot be measured on the ground.

1. Introduction

The first experiments were conducted from 1 November to 13 November 2017, during the first flight of the Advanced Nano Step project undertaken in the Japanese Experiment Module (KIBO) of the International Space Station (ISS).
Nucleation control is one of the most important processes for the improvement of protein crystal quality, which is a key issue for structure-based drug design [1], among other things. Microgravity conditions are ideal for the precise control of nucleation, as convection flows inevitably induced under normal gravity conditions are known to result in extraordinarily high crystal nucleation rates compared to those under microgravity [2]. Although Liu et al. measured the incubation time (τ) for the nucleation of CaCO3 using a fast dynamic light scattering (FDLS) method under microgravity during parabolic flight experiments [2] and suggested that high nucleation rates under normal gravity were due to the promotion of heterogeneous nucleation by convection flows under normal gravity, they did not count the number of crystals directly and the duration under microgravity was limited to 20 s. In addition, nucleation in the solution is hardly distinguishable from that on the container bottom wall, as microcrystals immediately sink to the bottom of the growth container after nucleation under normal gravity.
By contrast, if we utilize in situ observation facilities under microgravity conditions in the ISS, we can observe long-term nucleation events and count the number of crystals both in the solution and on the bottom wall over time. We already succeeded in observing the growth interface of tetragonal crystals of hen egg-white lysozyme during the Nano Step project undertaken in the ISS [3].
In this study, we directly observed the nucleation and growth of GI crystals in the solution and on the substrate under microgravity by counting the number of crystals and measuring the changes in crystal size with the optical microscopy of Nano Step hardware in KIBO on the ISS [3]. The observed nucleation processes were then compared with those of ground experiments. Although Patiño-Lopez et al. measured size distribution using a dynamic light scattering facility for the nucleation processes of GI crystals under microgravity during PROTEIN experiments in the Columbus module of the ISS, they did not convert their data to nucleation rates [4].

2. Materials and Methods

2.1. Sample Preparation

GI from Streptomyces rubiginosus was purchased from Hampton Research Corporation (Aliso Viejo, CA, USA) and used to prepare the solutions without further purification. For the ISS experiments, the starting solution comprised 20 mg mL−1 GI dissolved in 6 mM Tris-HCl buffer (pH 7.0), which contains 1 mM MgSO4 and 0.91 M (NH4)2SO4. The prepared solution was injected into a quartz glass cell with two inlets, and a seed crystal chemically fixed with 2.5% glutaraldehyde in 87.5 mM HEPES buffer [5] was placed on the resin sample holder screwed into the cell [3]. For ground experiments, the solution contents were the same as those for the ISS experiments except for concentration (24.29–33.12 mg mL−1).

2.2. In Situ Observation of Nucleation, Growth, and Dissolution of GI Crystals

The number of observable crystals was counted during the experiments. For the ISS experiments, we counted the number of crystals nucleated on the substrate (sample holder) ( N sub . ) and those in the solution ( N sol . ) in a quartz glass cell [3]. The difference between N sub . and N sol . indicates the difference in Gibbs energy for the formation of a critical nucleus. The area of the photos was fixed ( 1.28 × 0.96   mm 2 ), and a vertical scan was made from the surface of the sample holder to the top wall of the cell to count the nucleated and suspending crystals in the cell. The total volume for the observation ( V obs . ) was 3.6 × 10 9   m 3 . We increased the temperature up to 40 °C over 1.5 h to dissolve all crystals in the volume, then set the temperature for nucleation (7, 8, 9, 12, or 18 °C). It always took several hours or sometimes several days for new crystals to appear, as nucleation and growth mainly occurred overnight. In Japan, we could not download images from the ISS at night, namely from 5 p.m. to 9 a.m. JST, as all ISS experiments were operated from the ground at the “Space Station Integration and Promotion Center (SSIPC)” located at Tsukuba Space Center, Japan. Further details are described in Reference [3]. Therefore, we could not measure real-time increases in the number of crystals, and nucleation rates ( J ) ( J d N / d t N : number of crystals per unit volume) could not be measured directly. Instead, we counted the number of crystals ( N sub . and N sol . ) and divided them by the time after changing temperatures and V obs . . We named the fraction the apparent nucleation rate ( J ) . J has the same dimension as J .
For ground experiments, the number of crystals on the bottom wall ( N bottom ) of a handmade glass cell was counted over time at 20 °C [6]. We could not distinguish N sub . and N sol . , as microcrystals nucleated in the solution sank to the bottom immediately after nucleation.
Normal growth rates ( R ) were measured using the changes in several sets of micrographs of GI crystals onboard the ISS with the Nano Step hardware [3].
The supersaturation σ ln C C e ( C : concentration, C e : solubility) of the solution was controlled by changing the temperature with Peltier devices. C was calculated by measuring an equilibrium temperature and solubility curve, which we had measured beforehand [7]. We measured R as a function of σ .

3. Results and Discussion

3.1. Overview of the First Flight

Packing of the samples was done similarly to that for the Nano Step experiment [3] at the end of June, 2017. Samples were launched from Cape Canaveral by the SpX-12 flight on 15 August (JST), then transported to the ISS on 16 August (JST). The in situ observation, performed by downloading video images, was conducted from 1 November (four months after packing) to 13 November. Samples were undocked from the ISS by the SpX-13 flight on 13 January (JST) and later splashed down in the Pacific Ocean on 14 January. The bottom of the quartz glass cell with the samples was kept facing the direction of gravity during the descent and landing of the Dragon capsule of SpX-13. Grown crystals were later observed in the recovered cell.
Unexpectedly, regrowth on the chemically fixed seed crystal did not occur from the beginning of the in situ observation on 1 November. However, a few large spontaneously grown crystals were found in the solution. Although epitaxial regrowth on the seed was never achieved during the first flight, the nucleation and growth of crystals occurred elsewhere. Thus, nucleation and growth rates were measured using these crystals.

3.2. Determination of the Equilibrium Temperature and Concentration

Although the solution concentration was fixed before the flight, we must acknowledge a faint evaporation of water from the growth cell during a long-term experiment [8]. We therefore measured the equilibrium temperature of the solution in the cell on 13 November (the final day of the in situ observation). We determined the equilibrium temperature by observing the outer shape of a crystal at temperatures during the change in solution temperature. The equilibrium temperature was T e = 30.8 ± 0.3 °C, as the lowest temperature of dissolution and the highest temperature of growth were 31.0 °C and 30.5 °C, respectively. From the solubility curve with temperature [7], we could convert the temperature to concentration C = 11.3 ± 0.9   mg mL 1 . This value was lower than that of the starting solution ( C = 20.0   mg mL 1 ). This decrease is due to the existence of other large crystals that nucleated at the edge of the growth cell on the ground, grew large before the launch, and did not dissolve completely. Before the launch, distribution of the concentration around these crystals and in the cell was homogenized by gravitational convection. However, after transport to the ISS, homogenization of the concentration in the cell became difficult due to the lack of convection flows. Thus, in V obs . , there was no significant change in concentration, and all supersaturation data under microgravity in this paper uses this 11.3 ± 0.9   mg mL 1 as C . C e was calculated using the temperature and solubility curve. The error of the supersaturation was estimated to be less than 0.2, as the concentration change in the volume of observation ( V obs ) during the measurements was less than 2.0   mg mL 1 .

3.3. Number of Nucleated Crystals

The nucleation of crystals occurred both on the substrate (sample holder) and in the solution for the ISS experiments. The natural logarithms of J ln J values are plotted against σ with ln J values on the ground (Figure 1) [6]. Although we actually measured J on the ground using sigmoidal fitting of N bottom as a function of time, in order to properly compare the nucleation processes on the ground with those under microgravity, we recalculated the previous data to estimate J . Here, σ for the ISS experiments denotes approximate values as described in Section 3.2.. From the graph, ln J values under microgravity are significantly lower than those on the ground (Figure 1). Error bars for the ground experiments indicate the range of J . The values of the lowest and highest edges of the error bars indicate those of ln J , which are calculated by dividing plateau N bottom / V obs values by the longest and shortest time periods used for calculating J for the ISS experiments. Although a difference of about 2 in the logarithmic scale of ln J between those under normal gravity and microgravity in Figure 1 seems very large, Liu et al. also reported a very large difference in incubation time 4 in the logarithmic scale in the case of CaCO3 crystal nucleation [2]. They speculated that the convection flows around nucleating and growing crystals drastically enhanced the apparent number of nuclei.
Furthermore, nucleation occurred more often on the substrate than in the solution, as conventionally expected, except for one case. We should emphasize again that nucleation rates in gravity have very large values even at lower supersaturations, which prevents the measurement of nucleation and forthcoming growth rate measurements at higher supersaturations.

3.4. Normal Growth Rates of Crystals Nucleated on the Substrate

We measured the size of a crystal nucleated on the substrate over time at several temperatures (Figure 2). The growth rates (R) of the {101} face against σ were measured and compared with previous data [9] (Figure 3). Although the R values of this study look similar at lower supersaturations to those of the previous study with the exception of an extraordinarily high R value ( = 0.63   nm s 1 ) around σ = 2.8 in the previous data due to a very high concentration ( C = 51.5   mg mL 1 ) [9], the R values under microgravity could be successfully plotted up to a very high supersaturation region. This is mainly due to the suppression of nucleation under microgravity as shown in Figure 1, as the presence of numerous microcrystals in the visual field seriously interferes with the observation of the growth interfaces of crystals.

3.5. In Situ Observation of Crystals Growing in the Solution (Suspending Crystal)

We sequentially observed a crystal nucleated in the solution (suspending crystal). The precise time course of the suspending crystal was recorded on film (Video S1). From this video, we selected several frames, shown in Figure 4. The positions of each frame are the same; the crystal fluctuated in its position over several hours, and moved in a direction and rotated over several days. From a to b, the crystal rotated during the overnight hours, whereas the slight fluctuation in position from b to c occurred over several hours. The duration from c to d was three days. Clearly, the crystal moved and rotated a lot in this period. Snell et al. pointed out that the movements of the suspending crystals were correlated with microgravity disturbances caused by the firing of vernier jets on the Orbiter [10].
Such movements could destroy the solute depletion zone, which is believed to provide several benefits for improving the quality of protein crystals grown under microgravity conditions. If the depletion zone was lost during the movements, growth rates would change. Thus, we tried to estimate growth rates of the suspending crystal. As the suspending crystal moved randomly, the growth rates of a specific crystal face could not be precisely determined. Thus, we defined the apparent size of the crystal ( L ) as the square root of the area of microscopic images, and the apparent growth rates ( R ) 1 / 2 × d L / d t . Open circles in Figure 3 show R plotted against σ . R and R take similar values. This result indicates two possibilities. First, the rotation and translation rates shown in Figure 4 were too slow to destroy the depletion zone around the suspending crystal. Second, loss of the depletion zone did not affect the growth rates, as there were no impurities that significantly suppress the advancement of growth steps on the GI crystal surfaces. Answering this question for the next flight should entail measuring the distribution of concentration around the growing crystal by using an interferometer.
Actually, unshaped aggregates formed everywhere in the solution and increased after the first trial of the dissolution of crystals nucleated elsewhere, other than the seed crystal on 1 November. Although the number of aggregates had increased slightly up to the final day of data analyses (13 November), the nucleation and growth of crystals occurred smoothly, repeatedly, and reproducibly. The aggregates did not seriously affect the crystal growth process and the solution itself did not appear to be deteriorated. However, the unshaped aggregates inhibited the acquisition of clear interferograms using Michelson and Mach-Zehnder interferometers of the Nano Step and SCOF hardware, respectively. To discuss the growth process of GI crystals in more detail, we need to inhibit the formation of such unshaped aggregates in the next flight.

4. Conclusions

Nucleation in the solution and the subsequent growth of GI crystals under microgravity were observed for the first time during the first flight of the Advanced Nano Step project undertaken in ISS. Key findings in this study are as follows:
(1)
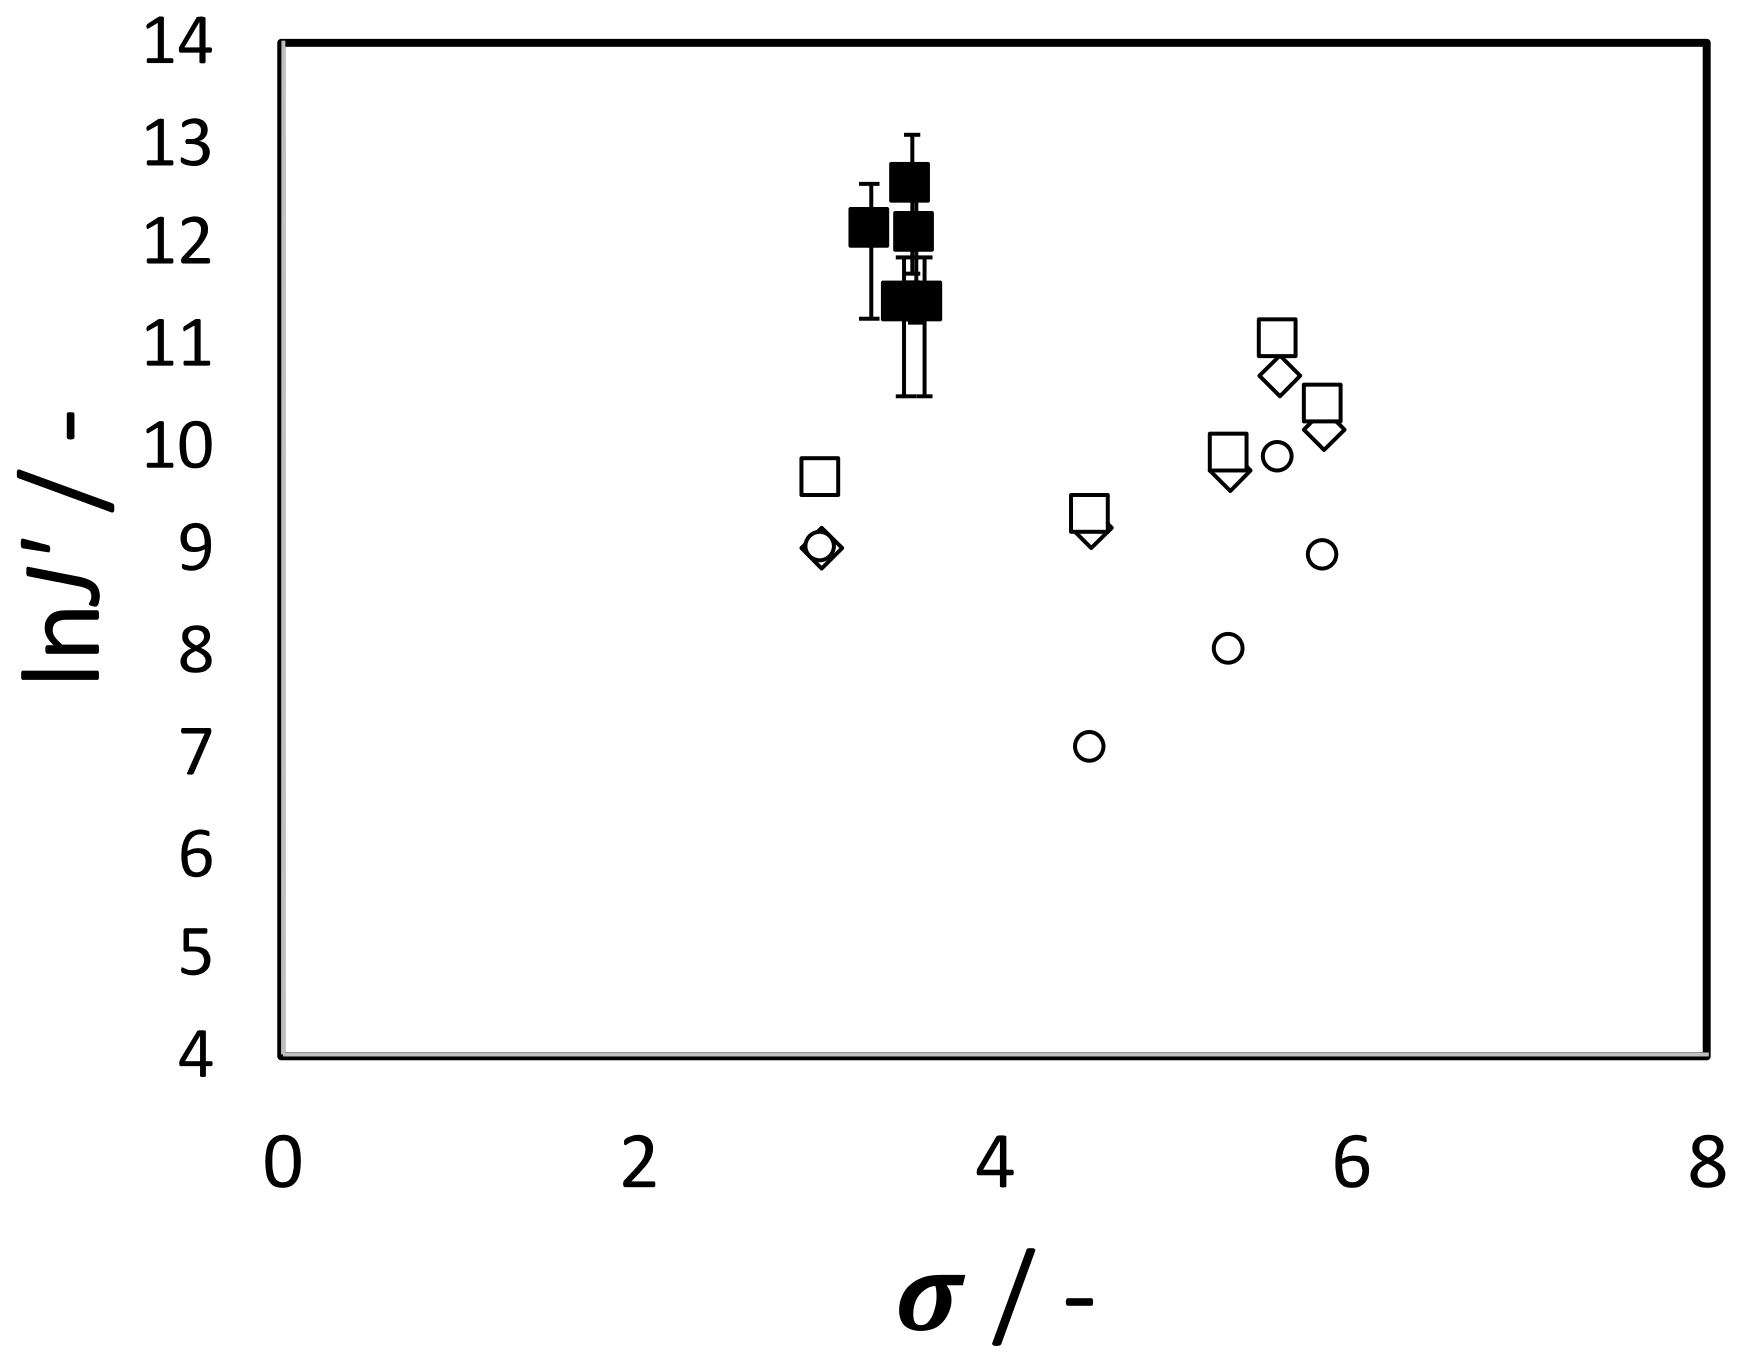
We counted the number of crystals over time and defined the apparent nucleation rates ( J ) under microgravity. J values were unexpectedly lower than J on the ground. This is probably due to the suppression of convection flows under microgravity. J values of nucleation in the solution were almost always lower than those on the substrate as conventionally expected.
(2)
Growth rates (R) of a {101} face of a crystal nucleated on the substrate vs. supersaturation σ under microgravity were measured and found to take values similar to those previously measured on the ground. Conversely, R under microgravity could be measured up to a very high σ region, given the very low nucleation rates under microgravity. In other words, nucleation under conditions of gravity starts at lower supersaturations, which prevents the measurement of nucleation and forthcoming growth rate measurements at higher supersaturations.
(3)
A suspending crystal that nucleated in the solution fluctuated at a position over a period of hours, and moved in a direction and rotated over a period of days. Although such movements could destroy the depletion zone around growing crystals and possibly change the growth rates under microgravity, growth rates of the suspending crystal took values similar to those of crystals nucleated on the substrate.

Supplementary Materials

The following are available online at https://www.mdpi.com/2073-4352/9/2/90/s1, Video S1: Movements of a suspending crystal

Author Contributions

Conceptualization and methodology, Y.S. and K.T. (Katsuo Tsukamoto); Methodology, K.T. (Katsuo Tsukamoto); Investigation, Y.S., T.F., K.T. (Katsuo Tsukamoto), S.F., T.S., K.T. (Kazuma Tsuchiya), A.N., Y.M., A.I., H.M., and T.Y.; Data curation, Y.S.; Writing—original draft preparation, Y.S.; Writing—review and editing, Y.S. and K.T. (Katsuo Tsukamoto); Project administration, T.S., T.Y., T.S. (Takehiko Sone), T.S. (Tetsuya Sakashita), M.N., and Y.A.; Funding acquisition, Y.S.

Funding

This research was partly funded by JSPS KAKENHI Grant Nos. 26390054, 15K05668, 16K05470, and 18K04960.

Acknowledgments

This study was supported by JAXA.

Conflicts of Interest

The authors declare there are no conflicts of interest.

References

  1. Chayen, N.; Helliwell, J.R.; Snell, E.H. Macromolecular Crystallization and Crystal Perfection; Oxford University Press Inc.: New York, NY, USA, 2010; pp. 3–4. [Google Scholar]
  2. Liu, X.Y.; Tsukamoto, K.; Sorai, M. New kinetics of CaCO3 nucleation and microgravity effect. Langmuir 2000, 16, 5499–5502. [Google Scholar] [CrossRef]
  3. Yoshizaki, I.; Tsukamoto, K.; Yamazaki, T.; Murayama, K.; Oshi, K.; Fukuyama, S.; Shimaoka, T.; Suzuki, Y.; Tachibana, M. Growth rate measurements of lysozyme crystals under microgravity conditions by laser interferometry. Rev. Sci. Instrum. 2013, 84, 103707. [Google Scholar] [CrossRef] [PubMed]
  4. Patino-Lopez, L.D.; Decanniere, K.; Gavira, J.A.; Maes, D.; Otalora, F. Protein experiment: Scientific data processing platform for on-flight experiment tuning. Microgravity Sci. Technol. 2012, 24, 327–334. [Google Scholar] [CrossRef]
  5. Iimura, Y.; Yoshizaki, I.; Rong, L.; Adachi, S.; Yoda, S.; Komatsu, H. Development of a reusable protein seed crystal processed by chemical cross-linking. J. Cryst. Growth 2005, 275, 554–560. [Google Scholar] [CrossRef]
  6. Maruoka, T.; Suzuki, Y.; Tamura, K. Effects of high pressure on the three-dimensional nucleation rates of glucose isomerase crystals. J. Phys. Conf. Ser. 2010, 215, 012158. [Google Scholar] [CrossRef]
  7. Suzuki, Y.; Sazaki, G.; Visuri, K.; Tamura, K.; Nakajima, K.; Yanagiya, S. Significant decrease in the solubility of glucose isomerase crystals under high pressure. Cryst. Growth Des. 2002, 2, 321–324. [Google Scholar] [CrossRef]
  8. Fujiwara, T.; Suzuki, Y.; Yoshizaki, I.; Tsukamoto, K.; Murayama, K.; Fukuyama, S.; Hosokawa, K.; Oshi, K.; Ito, D.; Yamazaki, T.; et al. Correction of the equilibrium temperature caused by slight evaporation of water in protein crystal growth cells during long-term space experiments at International Space Station. Rev. Sci. Instrum. 2015, 86, 083704. [Google Scholar] [CrossRef] [PubMed]
  9. Suzuki, Y.; Sazaki, G.; Takuro, M.; Nakajima, K.; Tamura, K. High pressure acceleration of the growth kinetics of glucose isomerase crystals. J. Phys. Chem. B 2005, 109, 3222–3226. [Google Scholar] [CrossRef] [PubMed]
  10. Snell, E.H.; Boggon, T.J.; Helliwell, J.R.; Moskowitz, M.E.; Nadarajah, S.C.C.D. Video observation of microgravity crystallization of lysozyme and correlation with accelerometer data. Acta Cryst. D 1997, 53, 747–755. [Google Scholar] [CrossRef]
Figure 1. Natural logarithm of apparent nucleation rates ln J with supersaturation σ . White and black squares indicate ln J calculated using the total number of crystals nucleated in V obs under microgravity and on the ground, respectively. White diamonds and circles indicate ln J on the substrate and in the solution, respectively.
Crystals 09 00090 g001
Figure 2. Growth of a crystal nucleated on the substrate. (a) 0 h ( σ = 4.0 ), (b) 25.6 h ( σ = 4.0 ), (c) 32.0 h ( σ = 5.6 ), (d) 96.2 h ( σ = 5.6 ) after start of observation. Normal growth rates (R) of a {101} face (top surface of the crystal) were calculated by measuring the lengths and angles of the crystal edges, and adjusting the angle of the {101} face. Scale bar represents 100 µm.
Crystals 09 00090 g002
Figure 3. Normal growth rates (R) of a {101} face with supersaturation σ . Open and filled squares indicate R values of this and previous [8] studies, respectively. Open circles indicate apparent growth rates (R’) of a crystal nucleated in the solution (described in Section 3.5..
Crystals 09 00090 g003
Figure 4. Some images of the same suspending crystal. (a) 24.0, (b) 42.1, (c) 49.4, (d) 113.8 h after starting observation. The crystal clearly rotated and moved. Scale bar indicates 100 µm.
Crystals 09 00090 g004

