Life Cycle Assessment of Alternative Ship Fuels for Coastal Ferry Operating in Republic of Korea

 , ,
, , 
Abstract
:1. Introduction
2. Materials and Methodologies
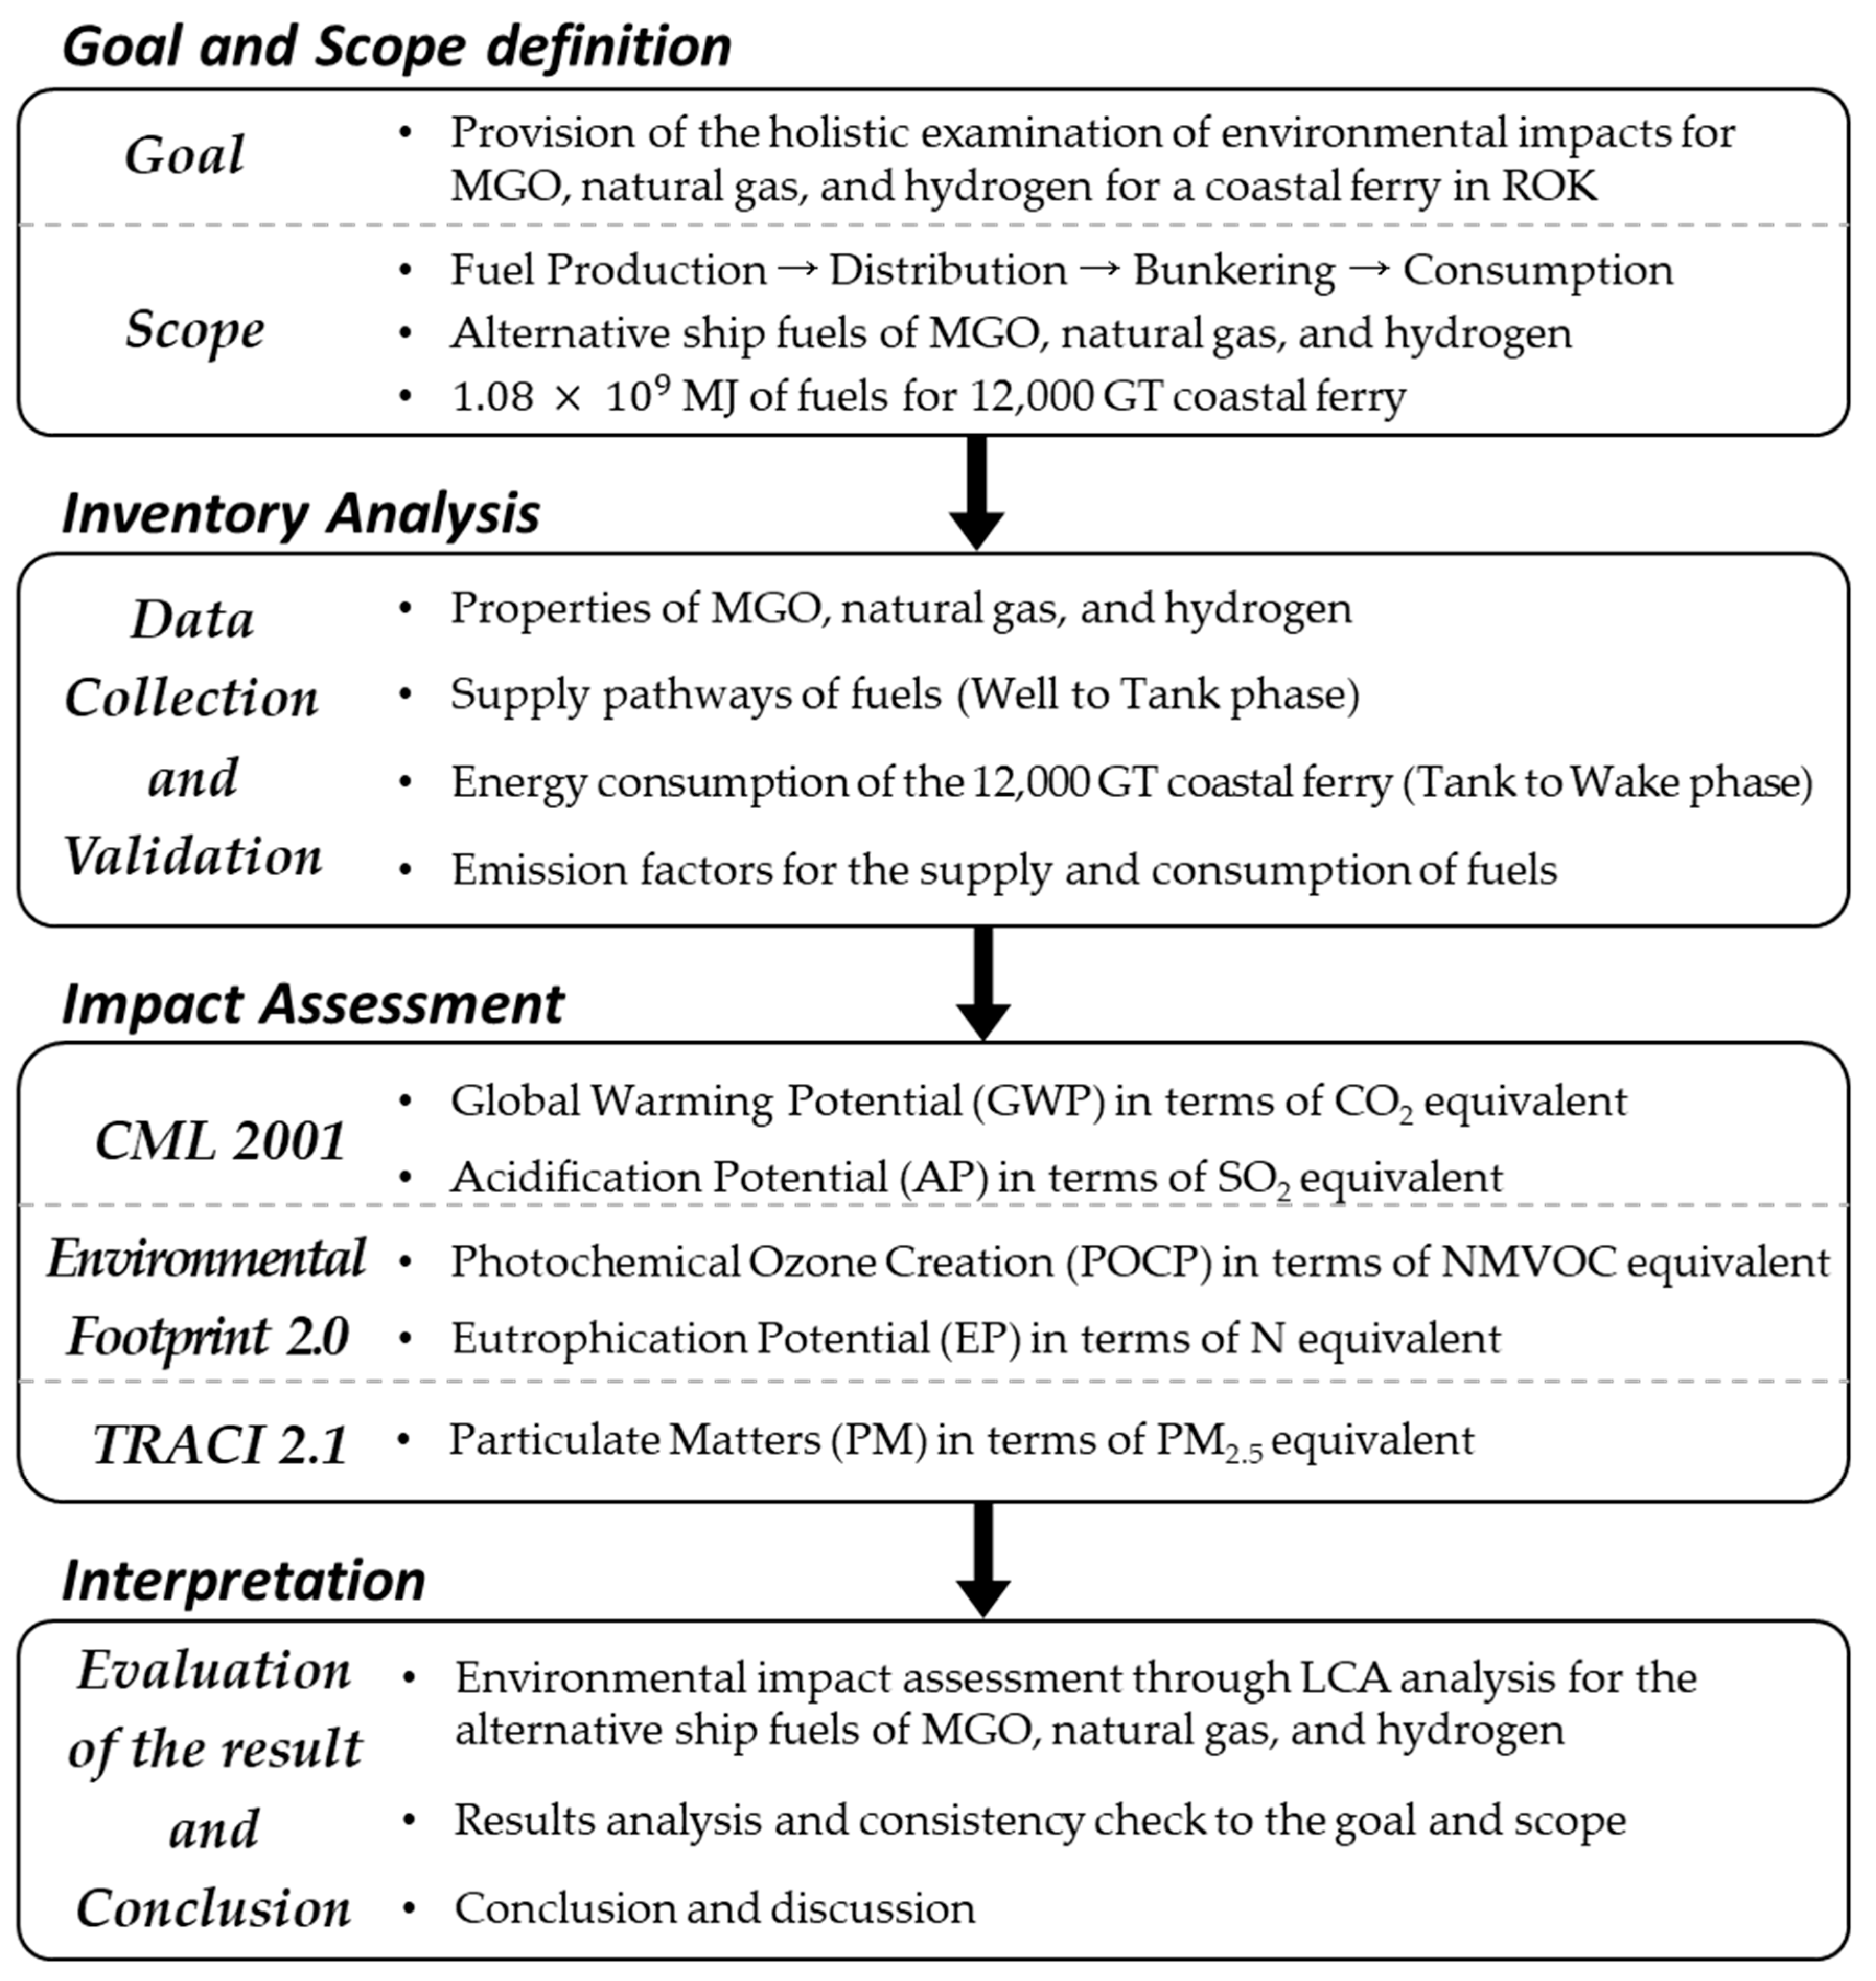
2.1. Procedure of Life Cycle Assessment (LCA)
- Goal and scope: This stage defines why the study was conducted and the arguments to be communicated with target audiences. The scope should be sufficiently defined at this stage to ensure that the details of the study are compatible and sufficient to address the stated goal.
- Inventory analysis: This stage involves the collection of data and the calculation procedures used to quantify relevant inputs and outputs of a product system.
- Impact assessment: The aim of this stage was to assess potential environmental impacts based on the data collected in the inventory analysis stage.
- Interpretation: This stage presents conclusions and recommendations based on the results of the impact assessment.
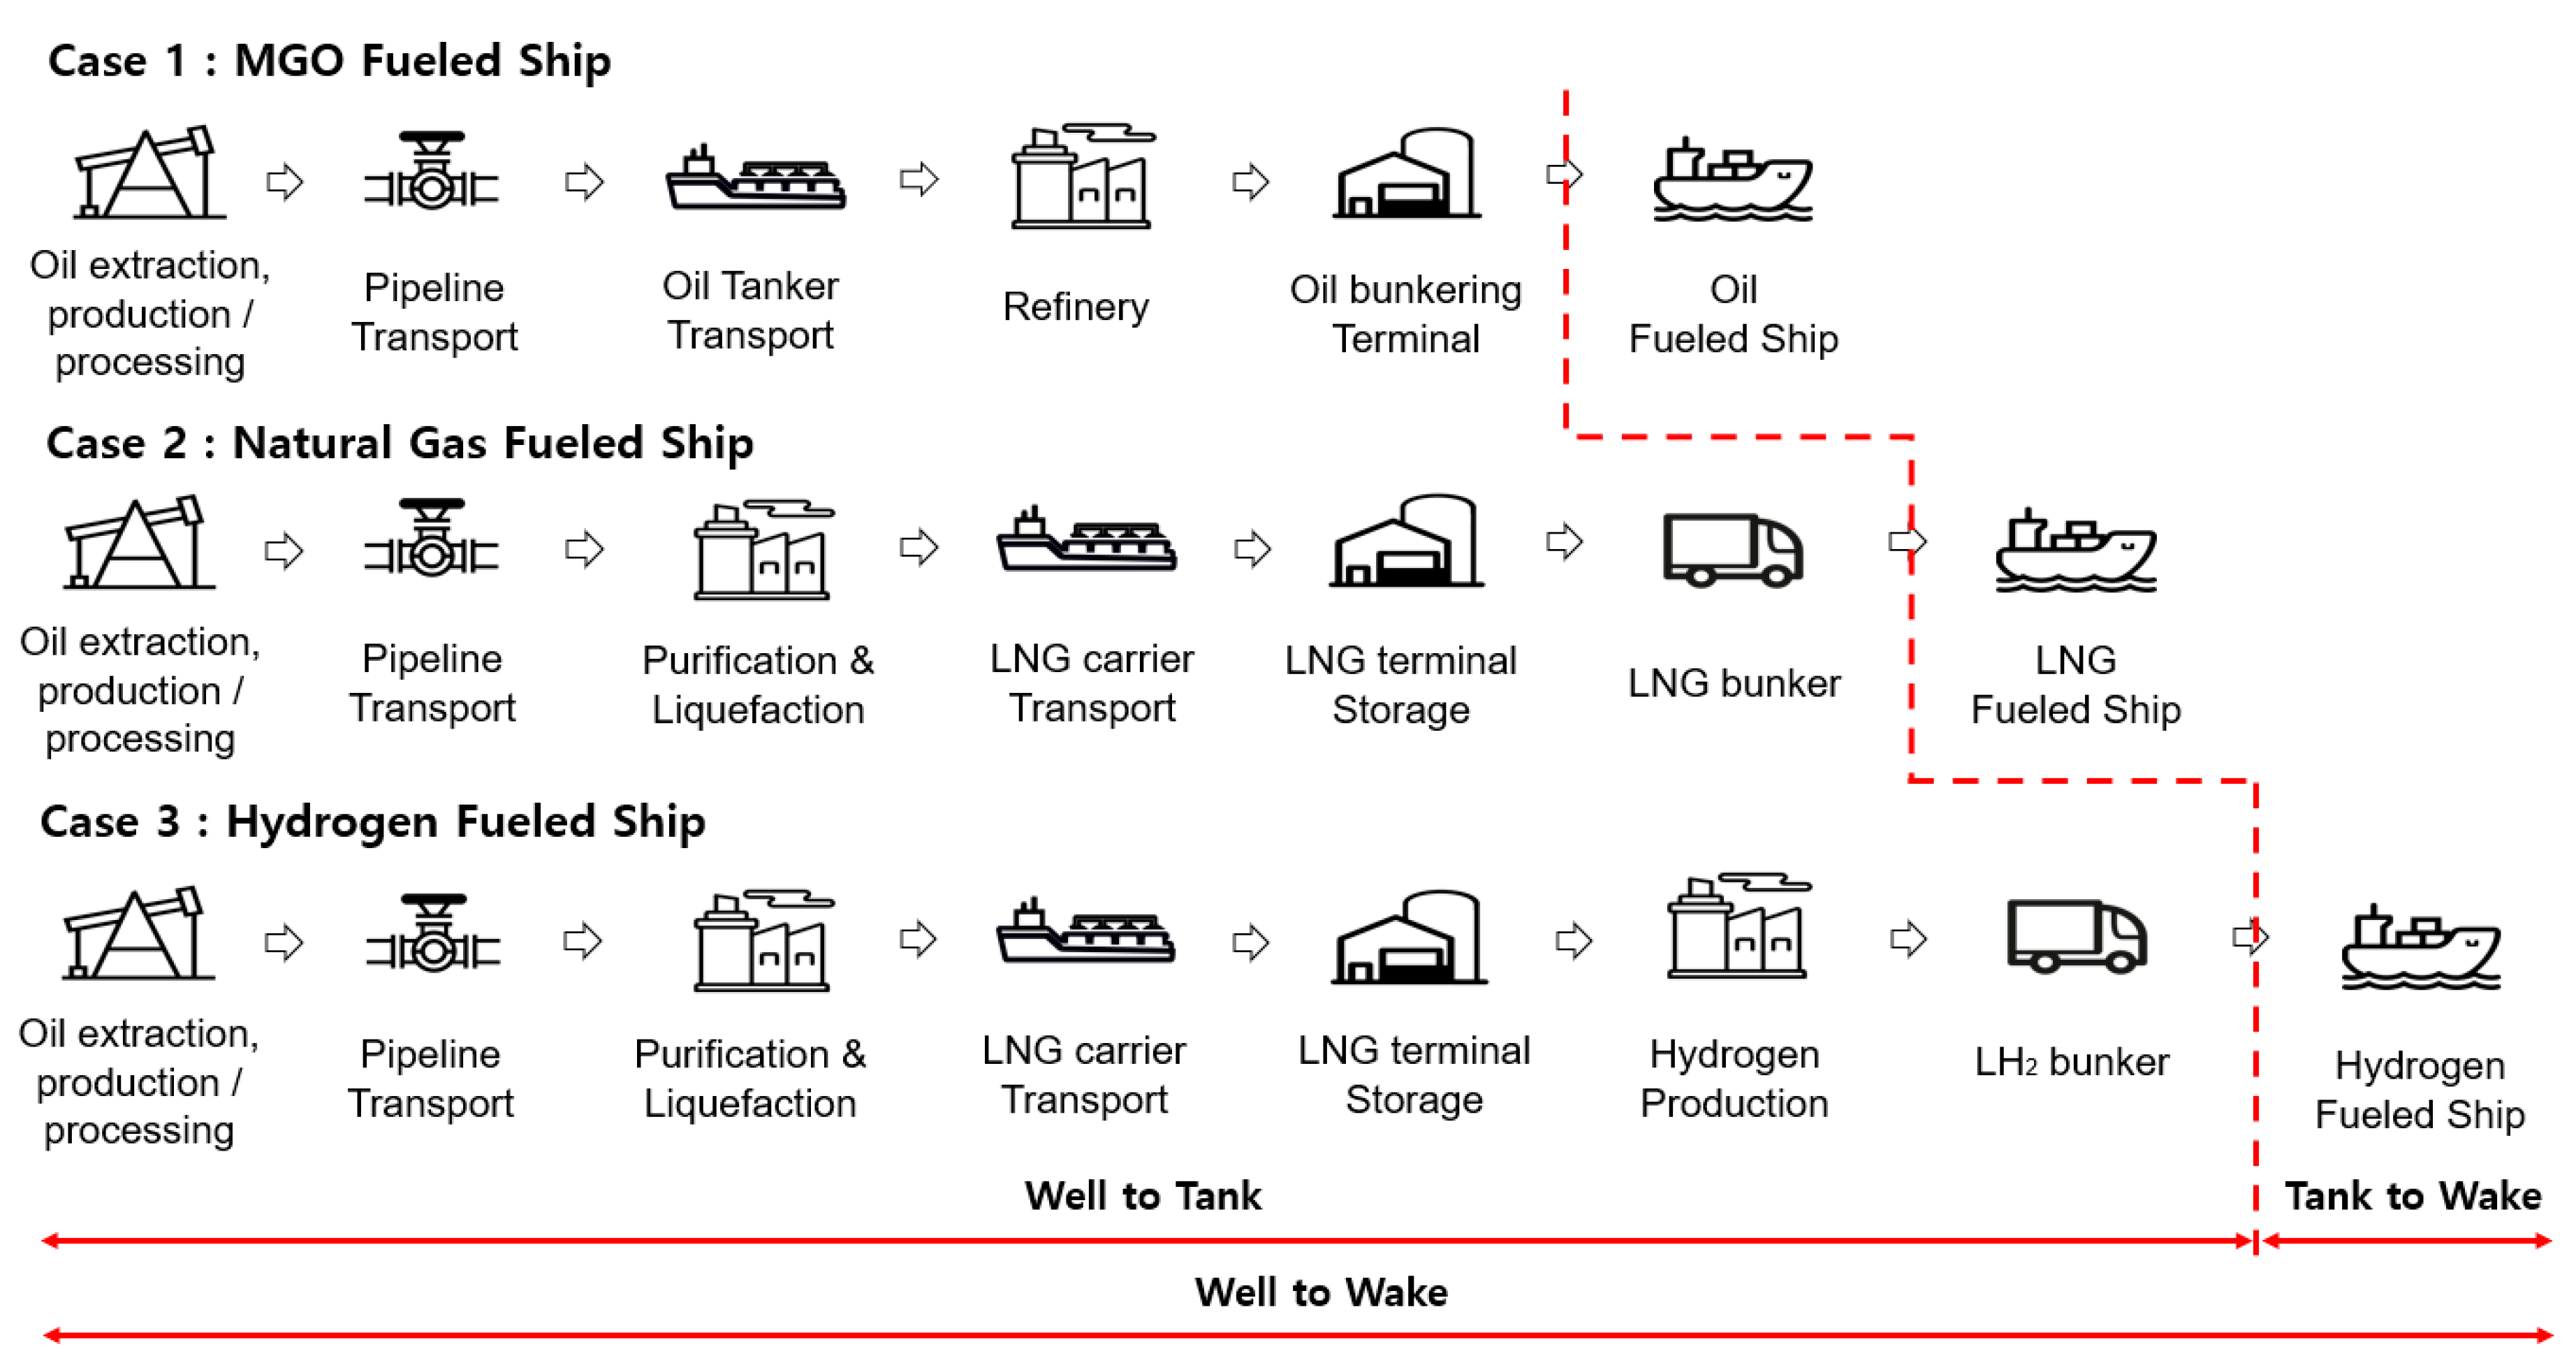
- Well-to-Wake: From a fuel production to fuel consumption to operate ship.
- Well-to-Tank: From a fuel production to a fuel tank of ship.
- Tank-to-Wake: From a fuel tank of ship to fuel consumption to operate ship.
2.2. Life Cycle Inventory Analysis: Well-to-Tank Phase
2.3. Life Cycle Inventory Analysis: Tank-to-Wake Phase
2.4. Life Cycle Impact Assessment
- Global Warming Potential (GWP): An index measuring a radiative forcing following the emission of a unit mass of a given substance, accumulated over a chosen time horizon, relative to that of the reference substance, carbon dioxide (CO2) [23].
- Acidification Potential (AP): An index that describes the acidifying effect of substances; their acid formation potential is calculated and compared with a reference substance, i.e., sulphur dioxide (SO2) [24].
- Photochemical Ozone Creation Potential (POCP): An index that indicates the potential capacity of an organic compound to create ozone in the troposphere. The value for ethene was set as the reference [25].
- Eutrophication Potential (EP): An index for the assessment of the excessive biological activity of organisms due to over-nutrification relative to that of the reference substances of N, P, and C.
- Particulate Matter (PM): PM refers to the secondary fine dust emitted into the atmosphere or produced by photochemical reactions, expressed as a single indicator based on PM2.5.
3. Results and Discussion
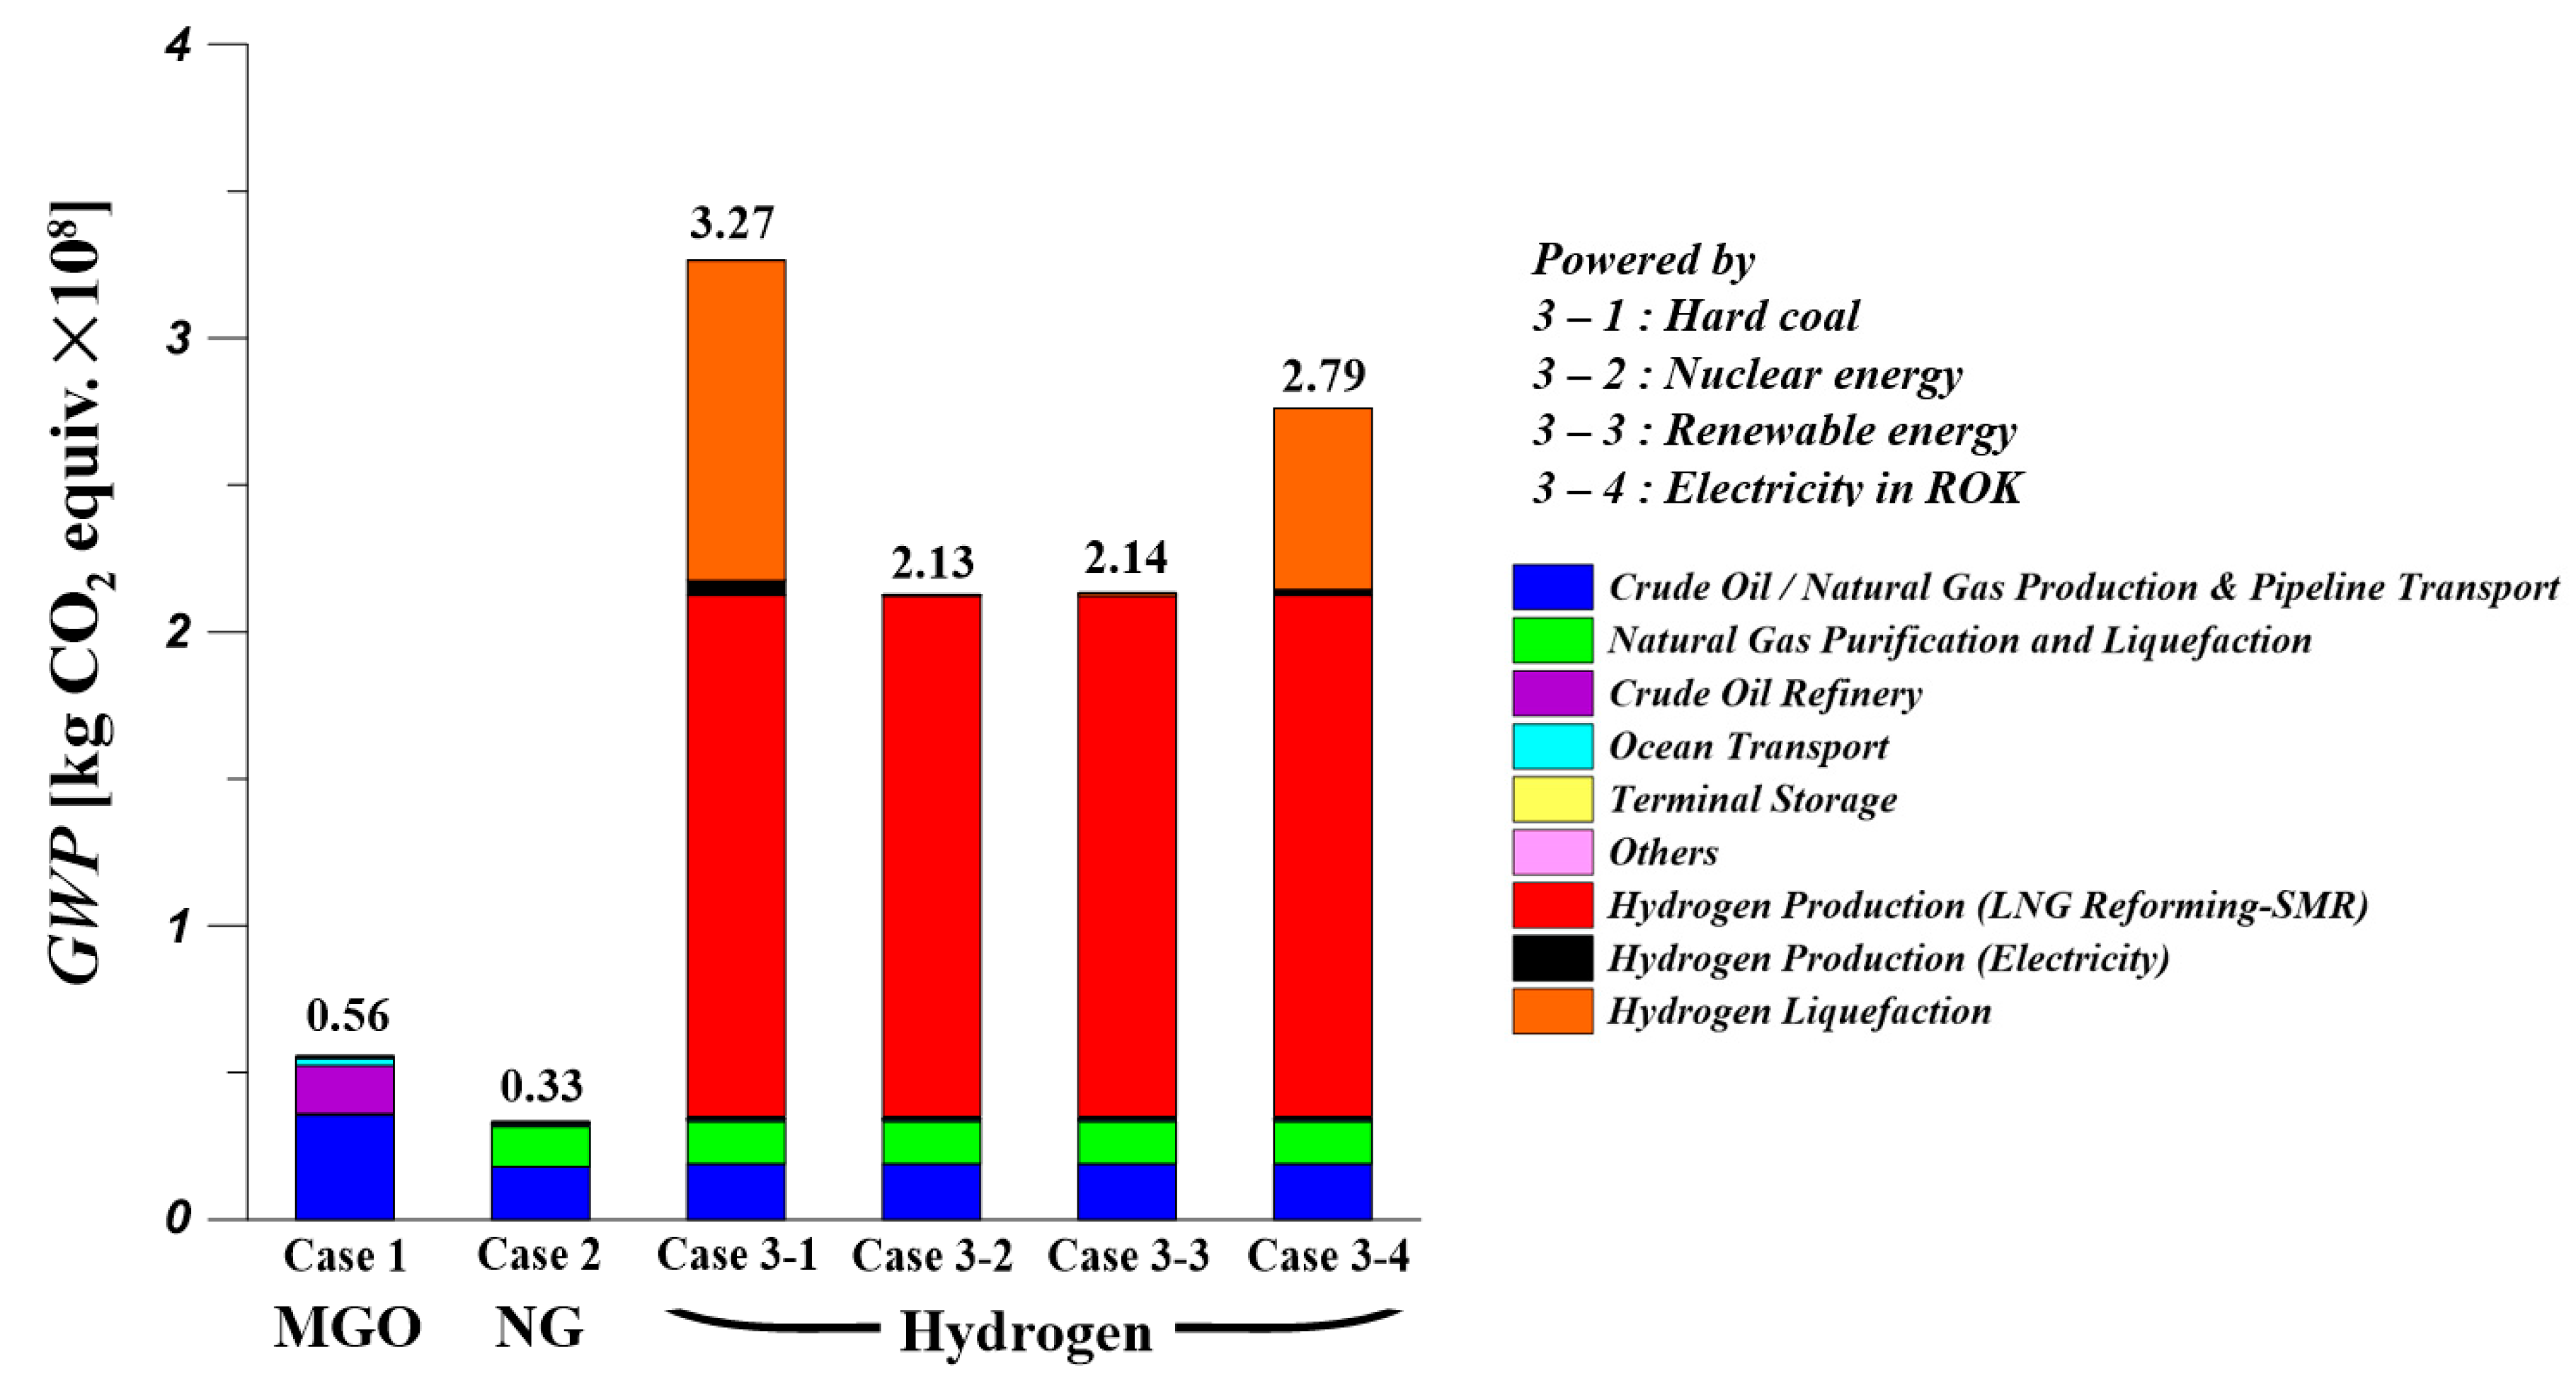
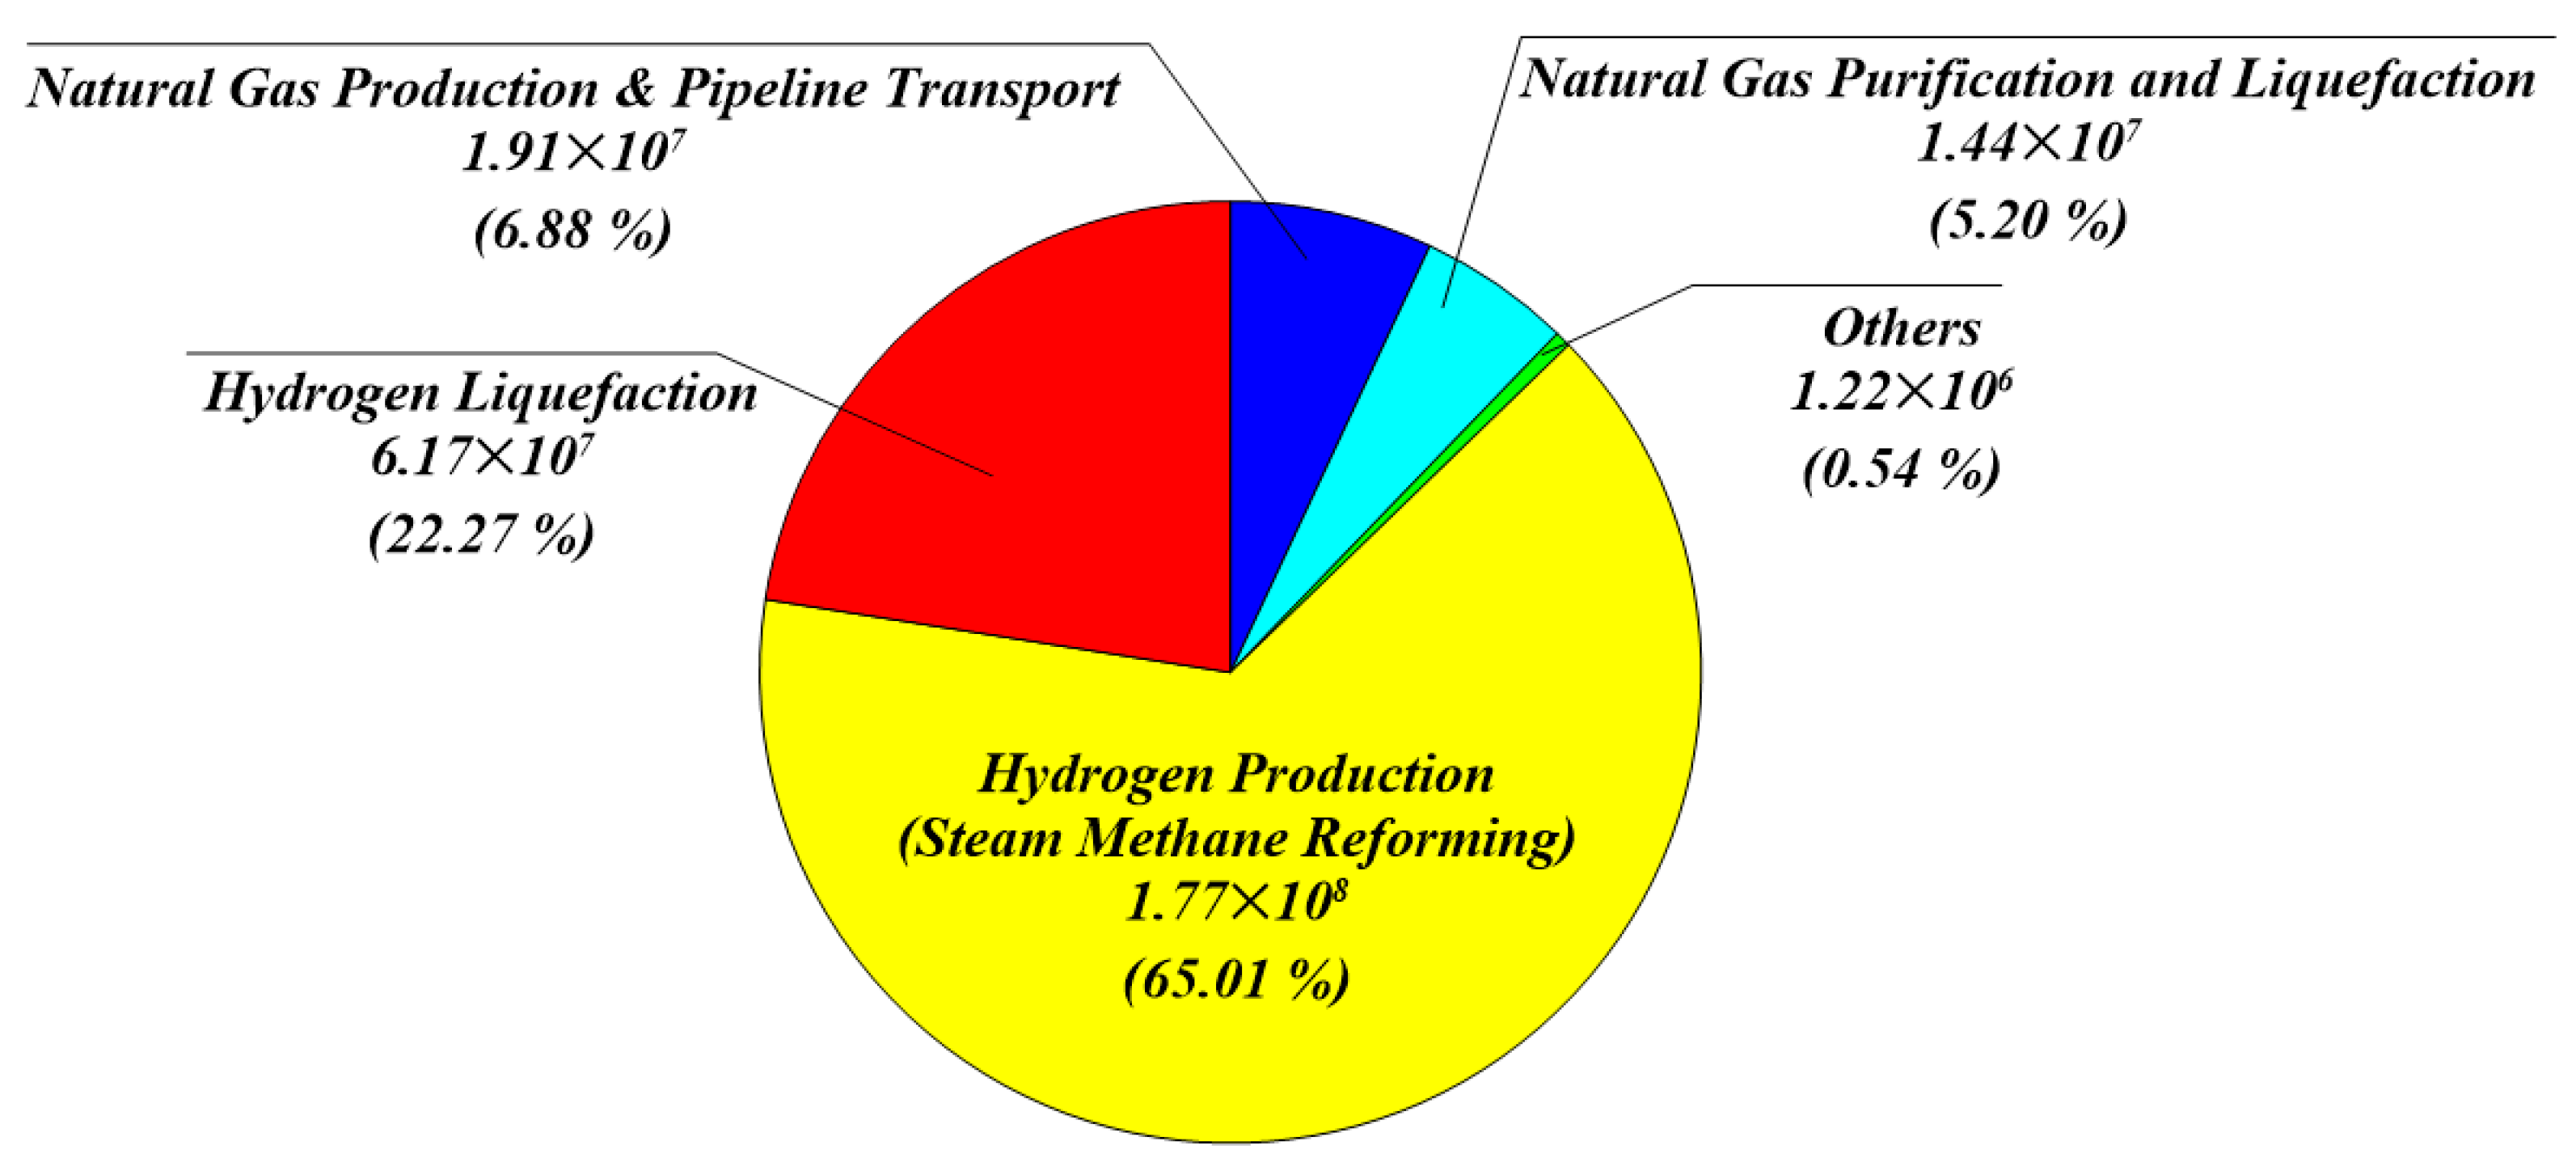
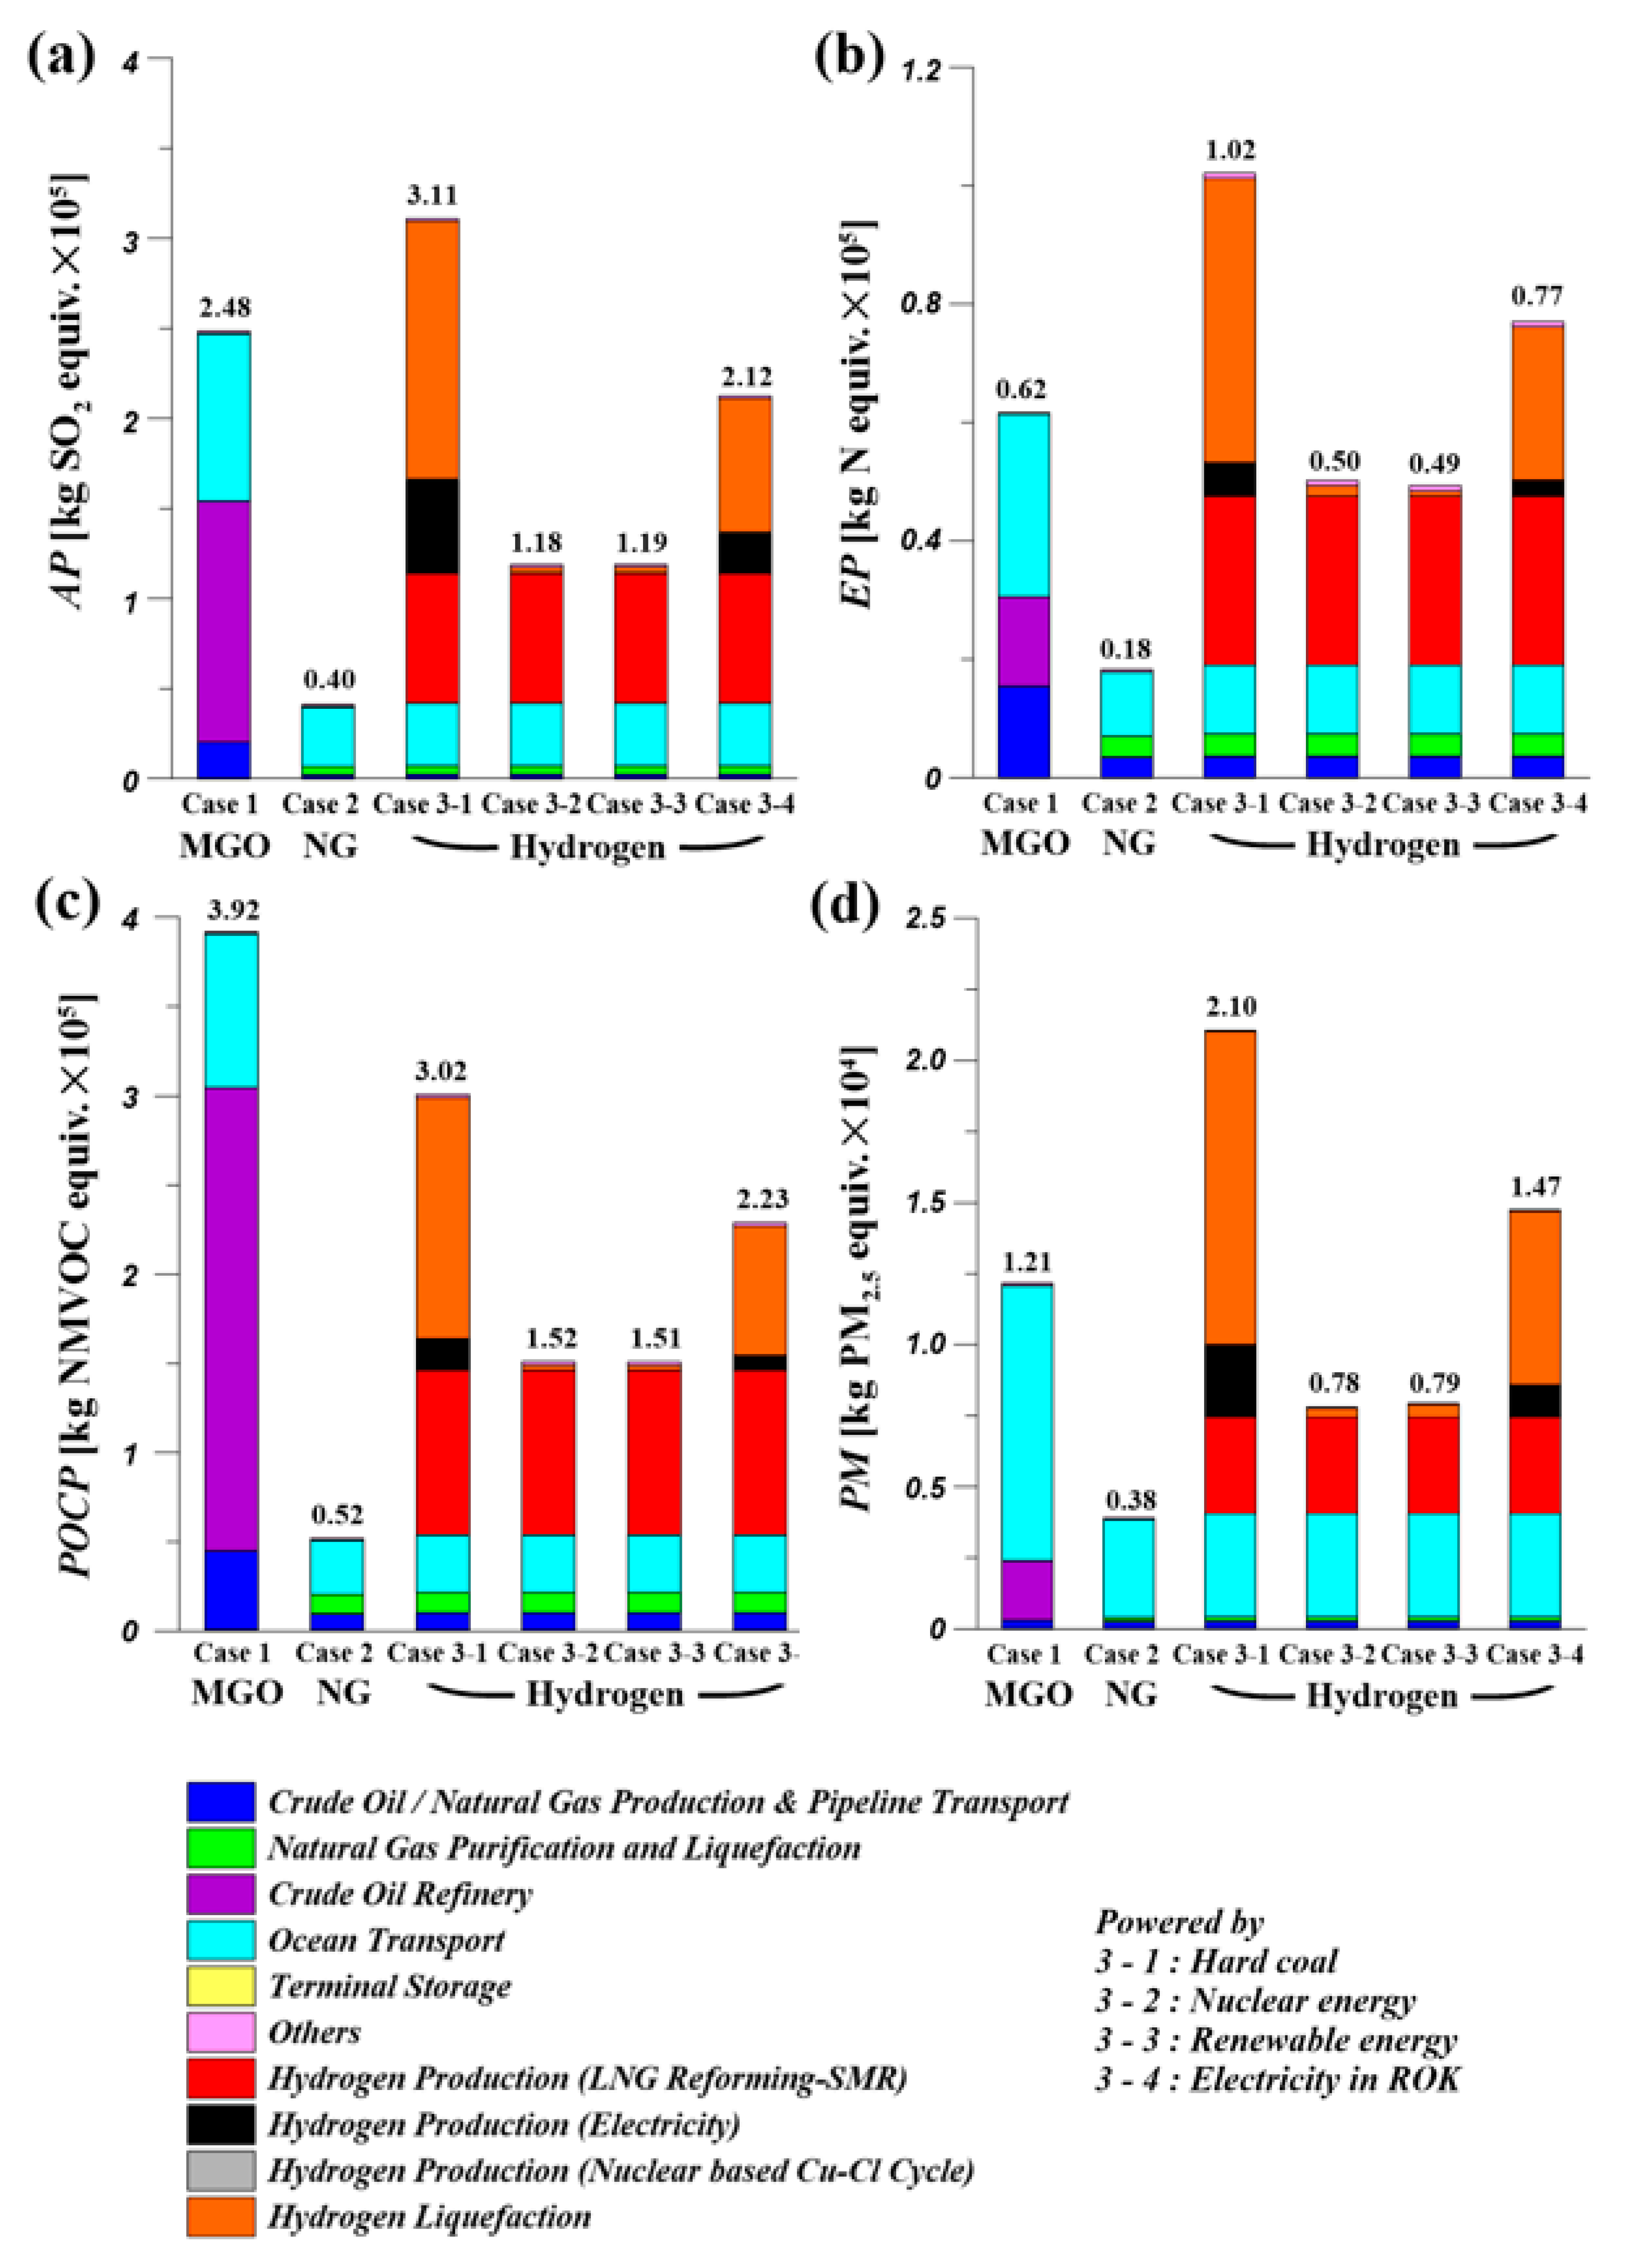
3.1. Environmental Impact Assessment Results in the Well-to-Tank Phase
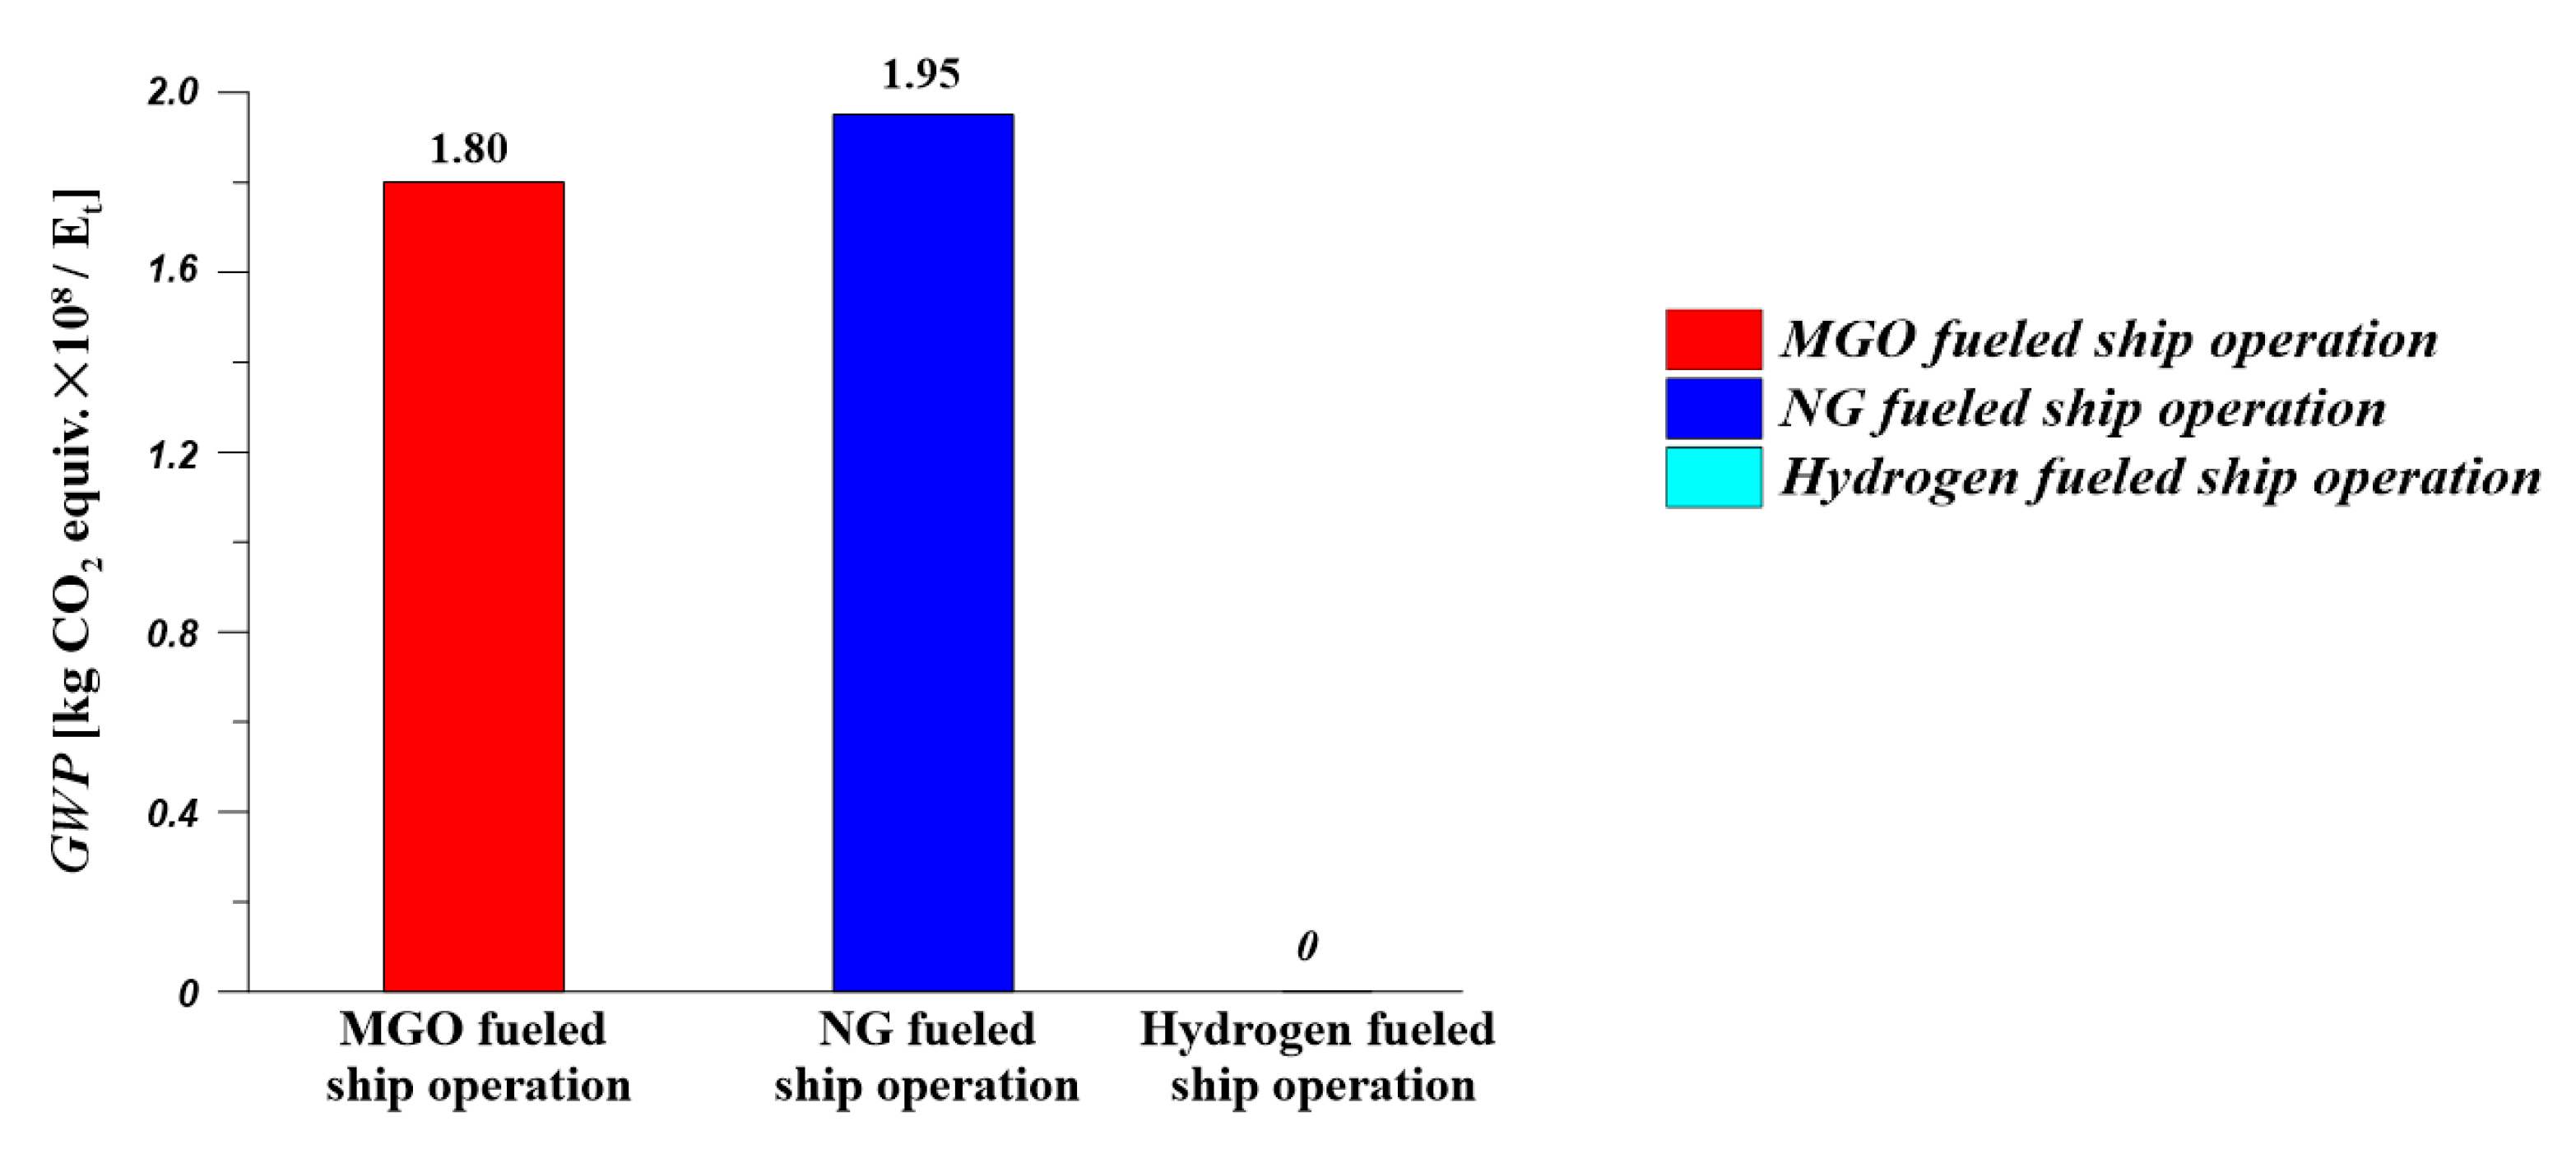
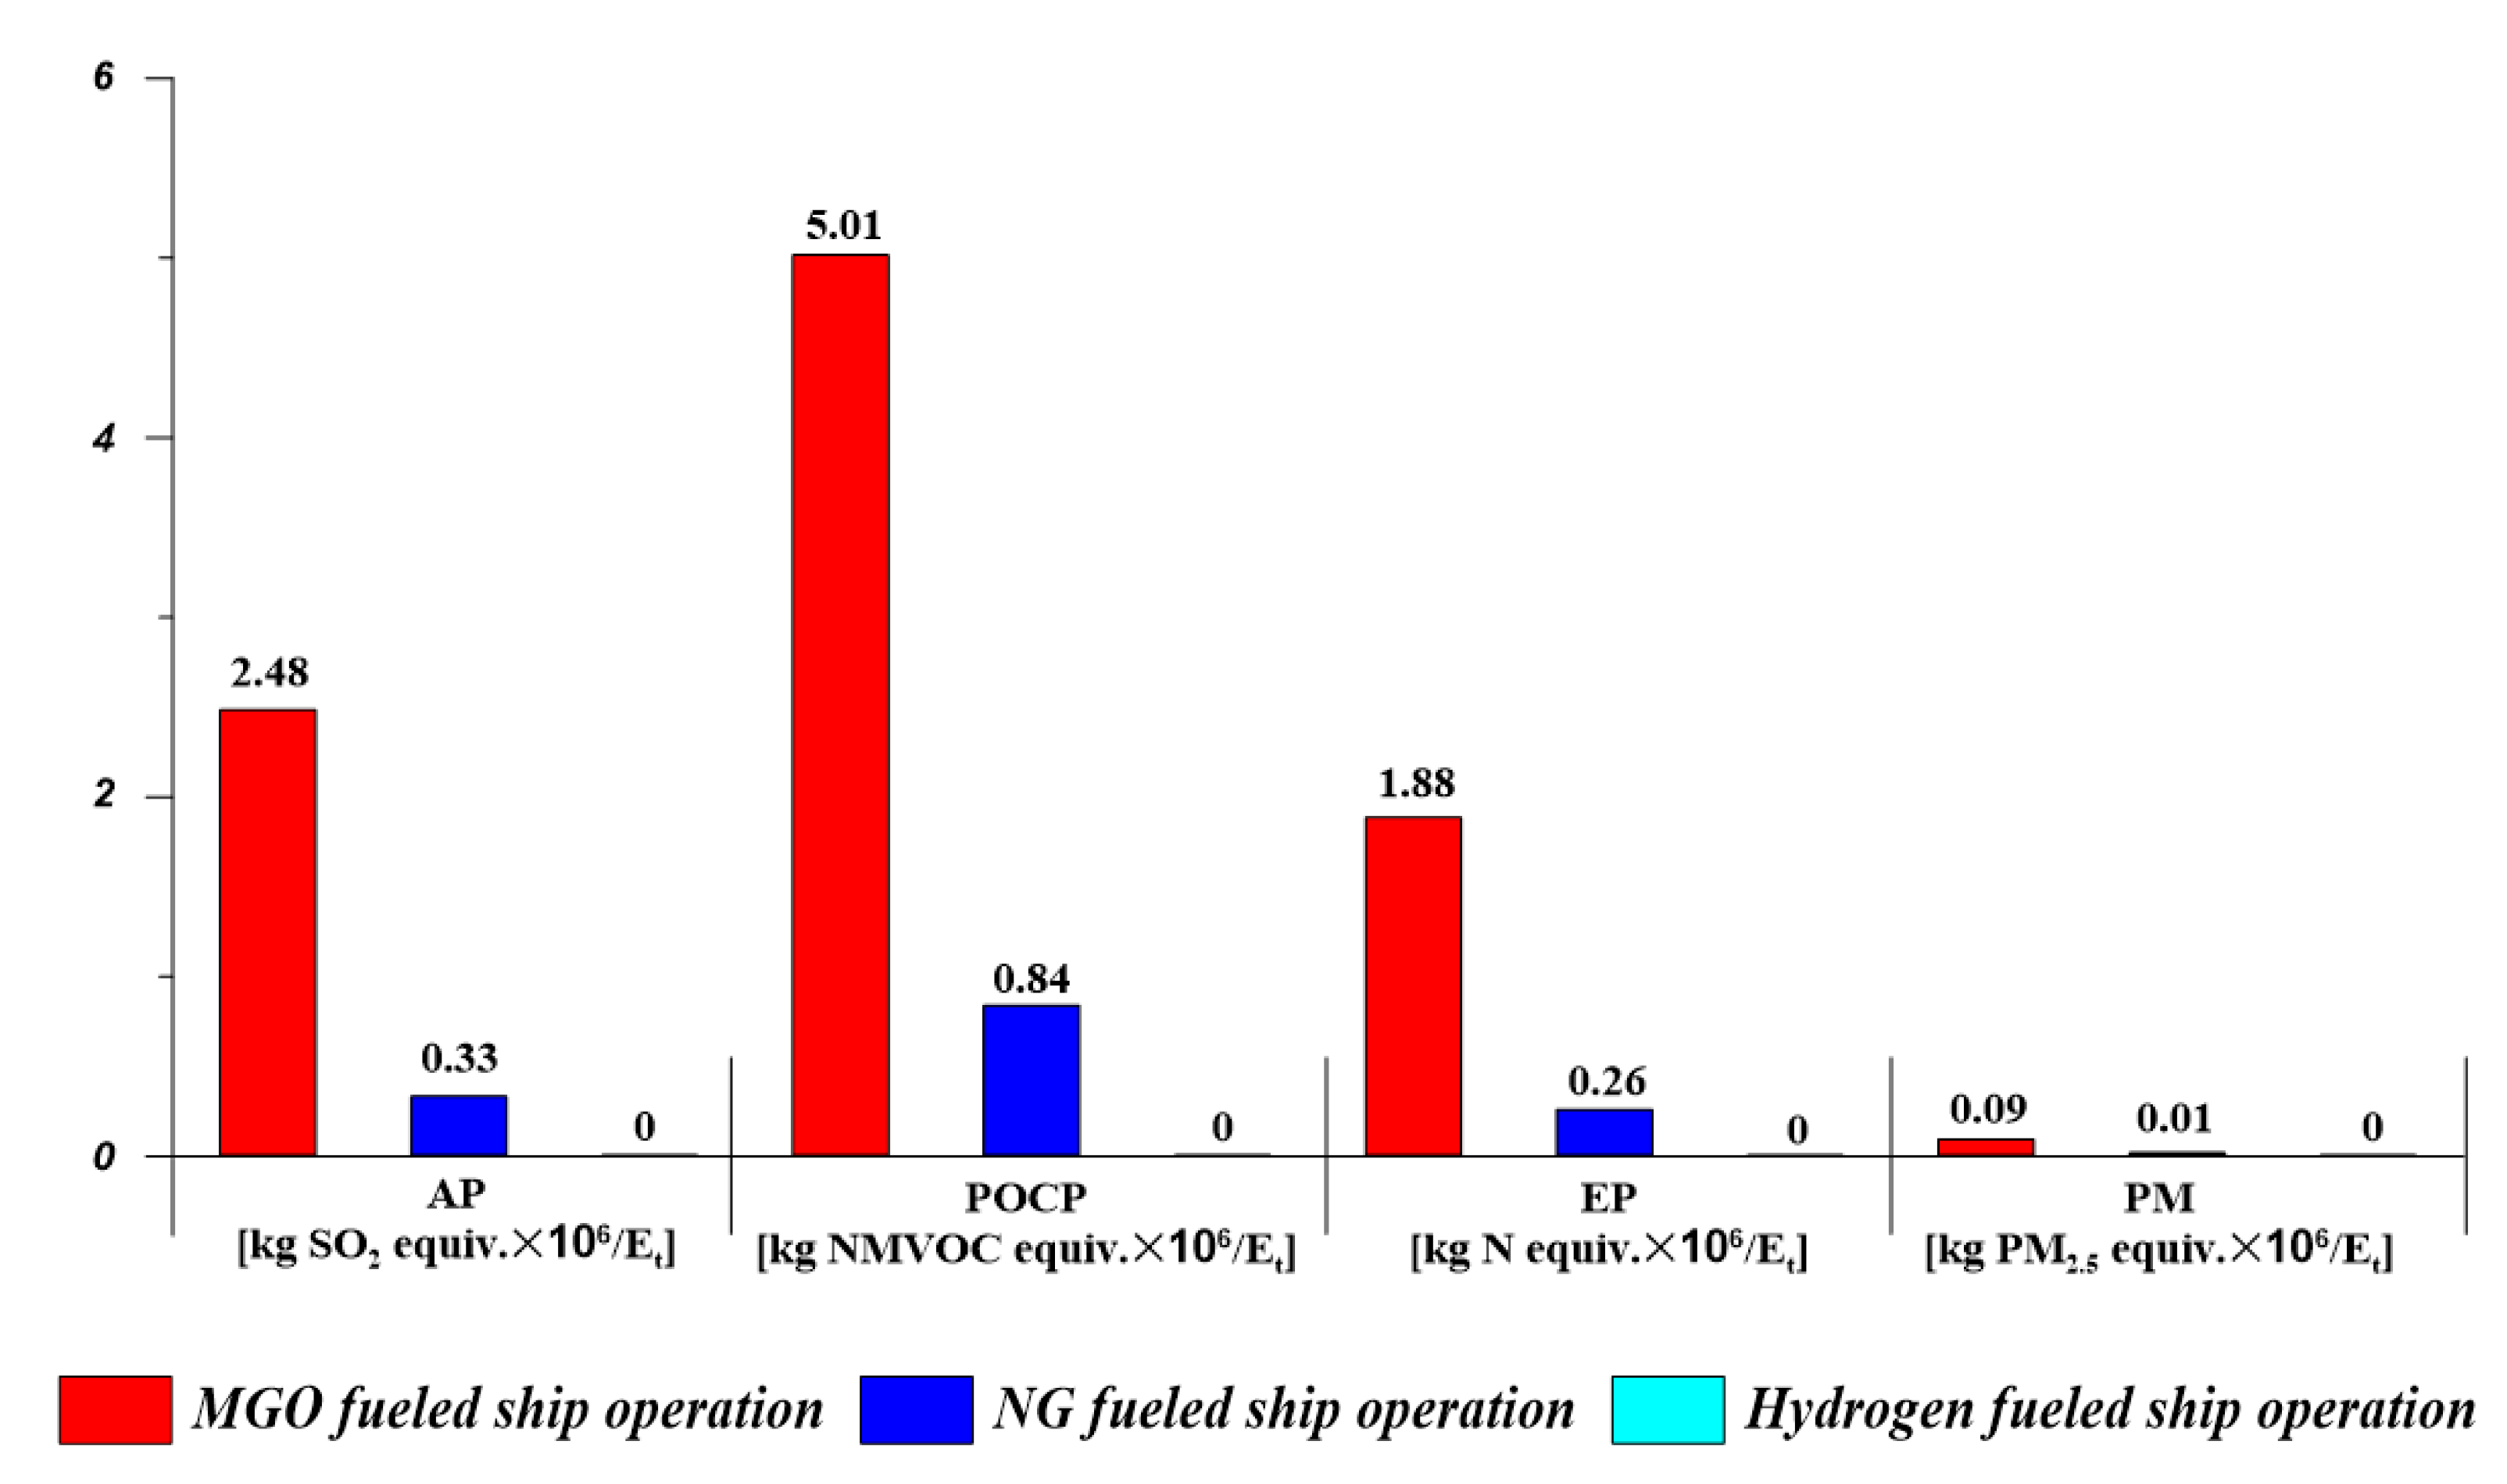
3.2. Environmental Impact Assessment Results at the Tank-to-Wake Phase
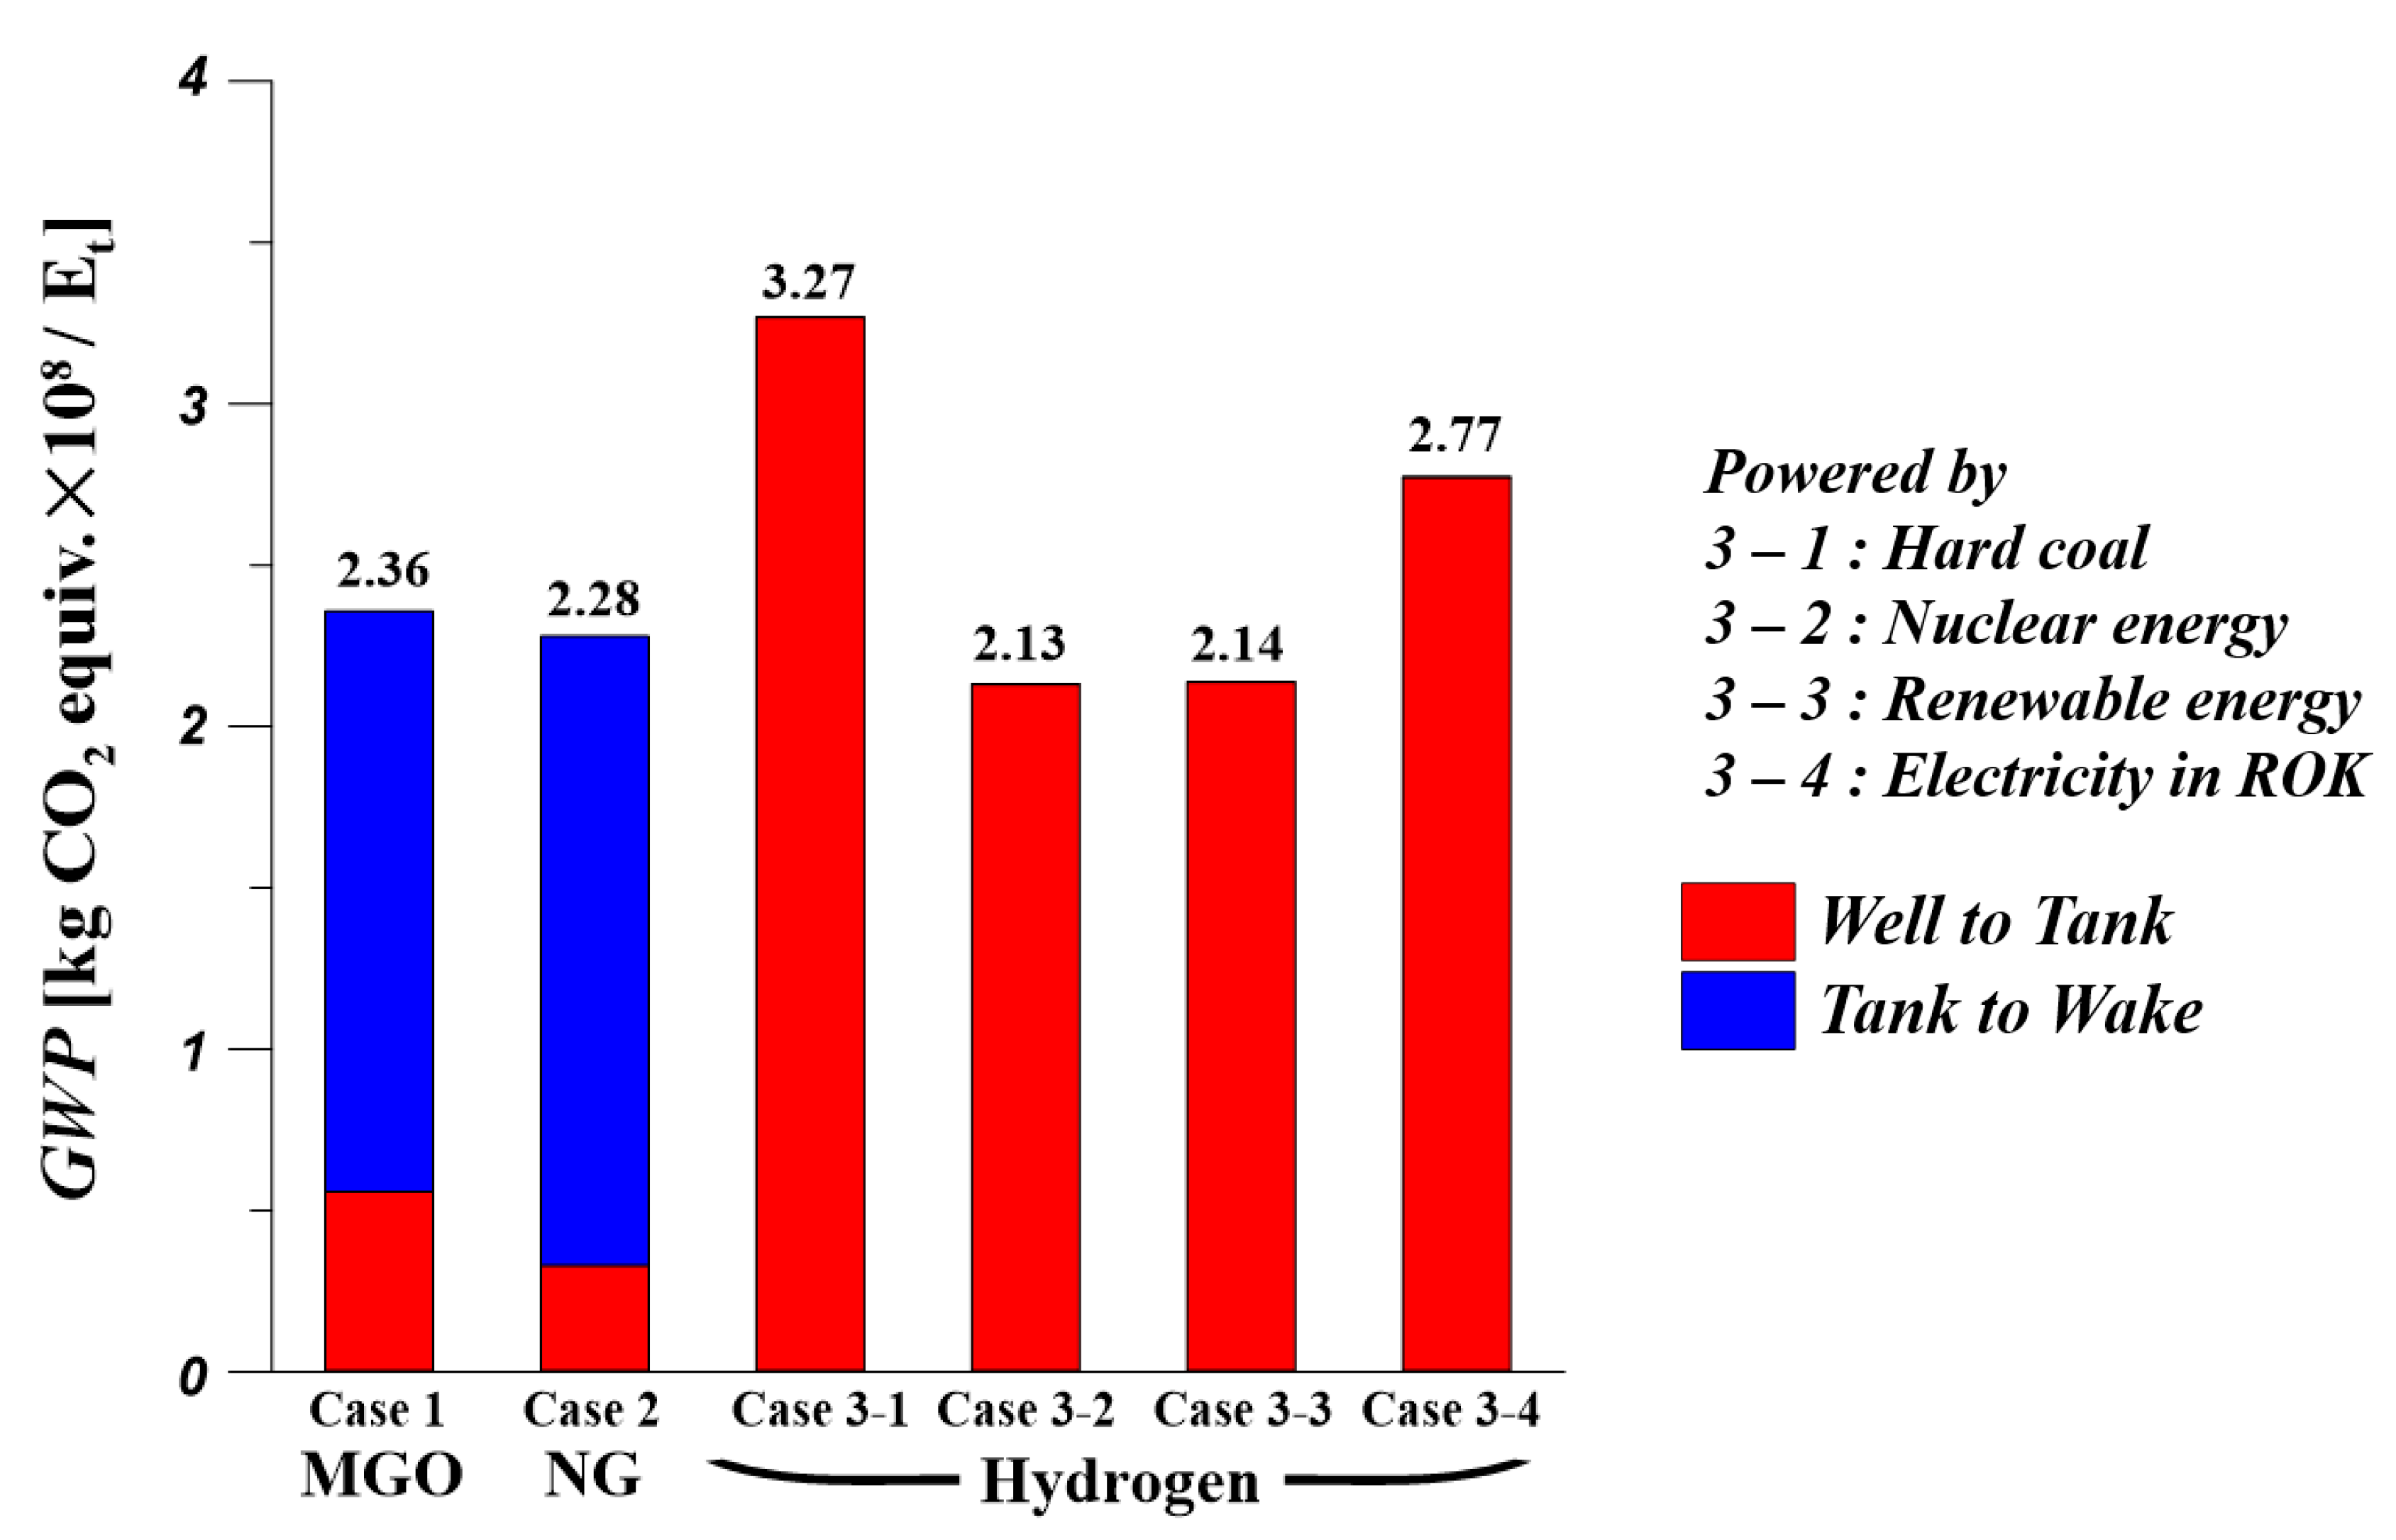
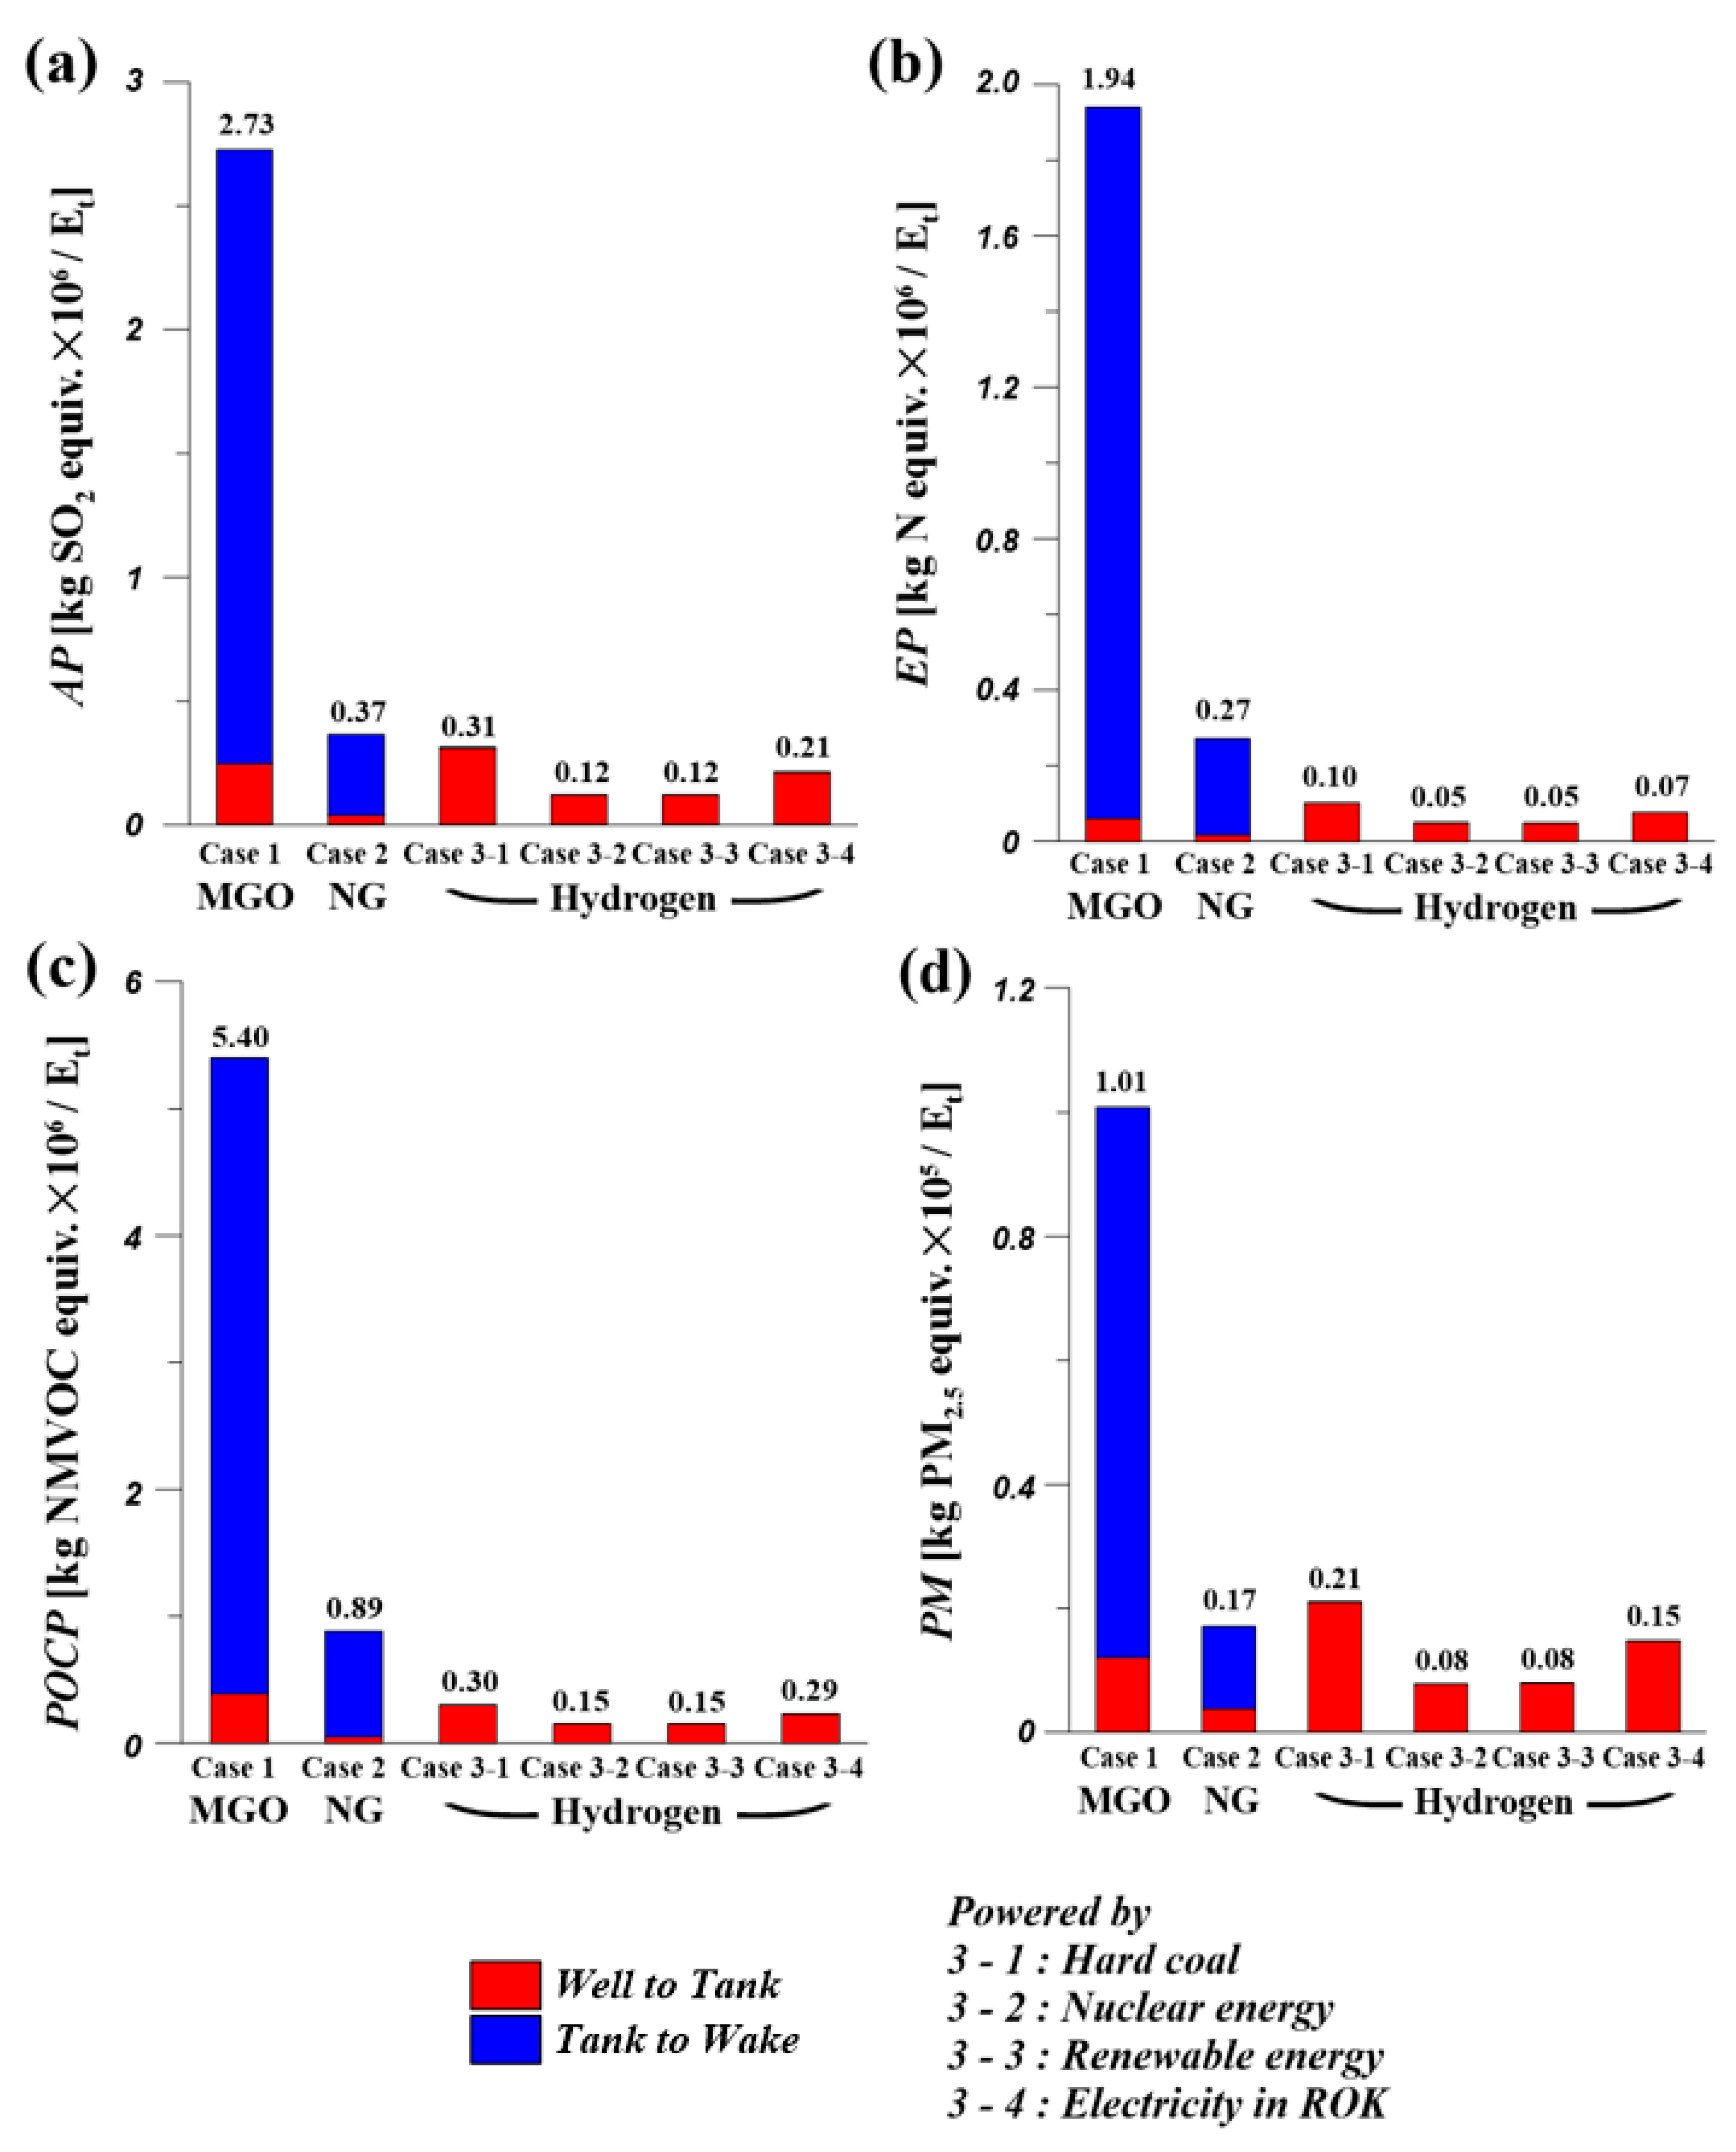
3.3. Environmental Impact Assessment Results in the Well-to-Wake Phase
4. Conclusions
- The GWP emitted from the MGO at its Well-to-Wake phase was almost the same as with natural gas, and it was at even a smaller level than the hydrogen with hard coal and electricity in the ROK. However, the emissions of AP, POCP, EP, and PM from MGO were much higher in the Tank-to-Wake phase than natural gas and hydrogen.
- The emissions of natural gas in the Well-to-Tank phase were relatively lower than those of MGO and hydrogen. However, the GWP of natural gas in the Tank-to-Wake phase had a slightly higher level than that of MGO, which was due to the large emissions of methane, which create a more severe greenhouse effect, i.e., 21 times greater GWP than CO2. It was verified that the coastal ferry with natural gas is proper for IMOs regulation of NOx and SOx, but it still is not able to meet IMOs GHG regulation by 2050.
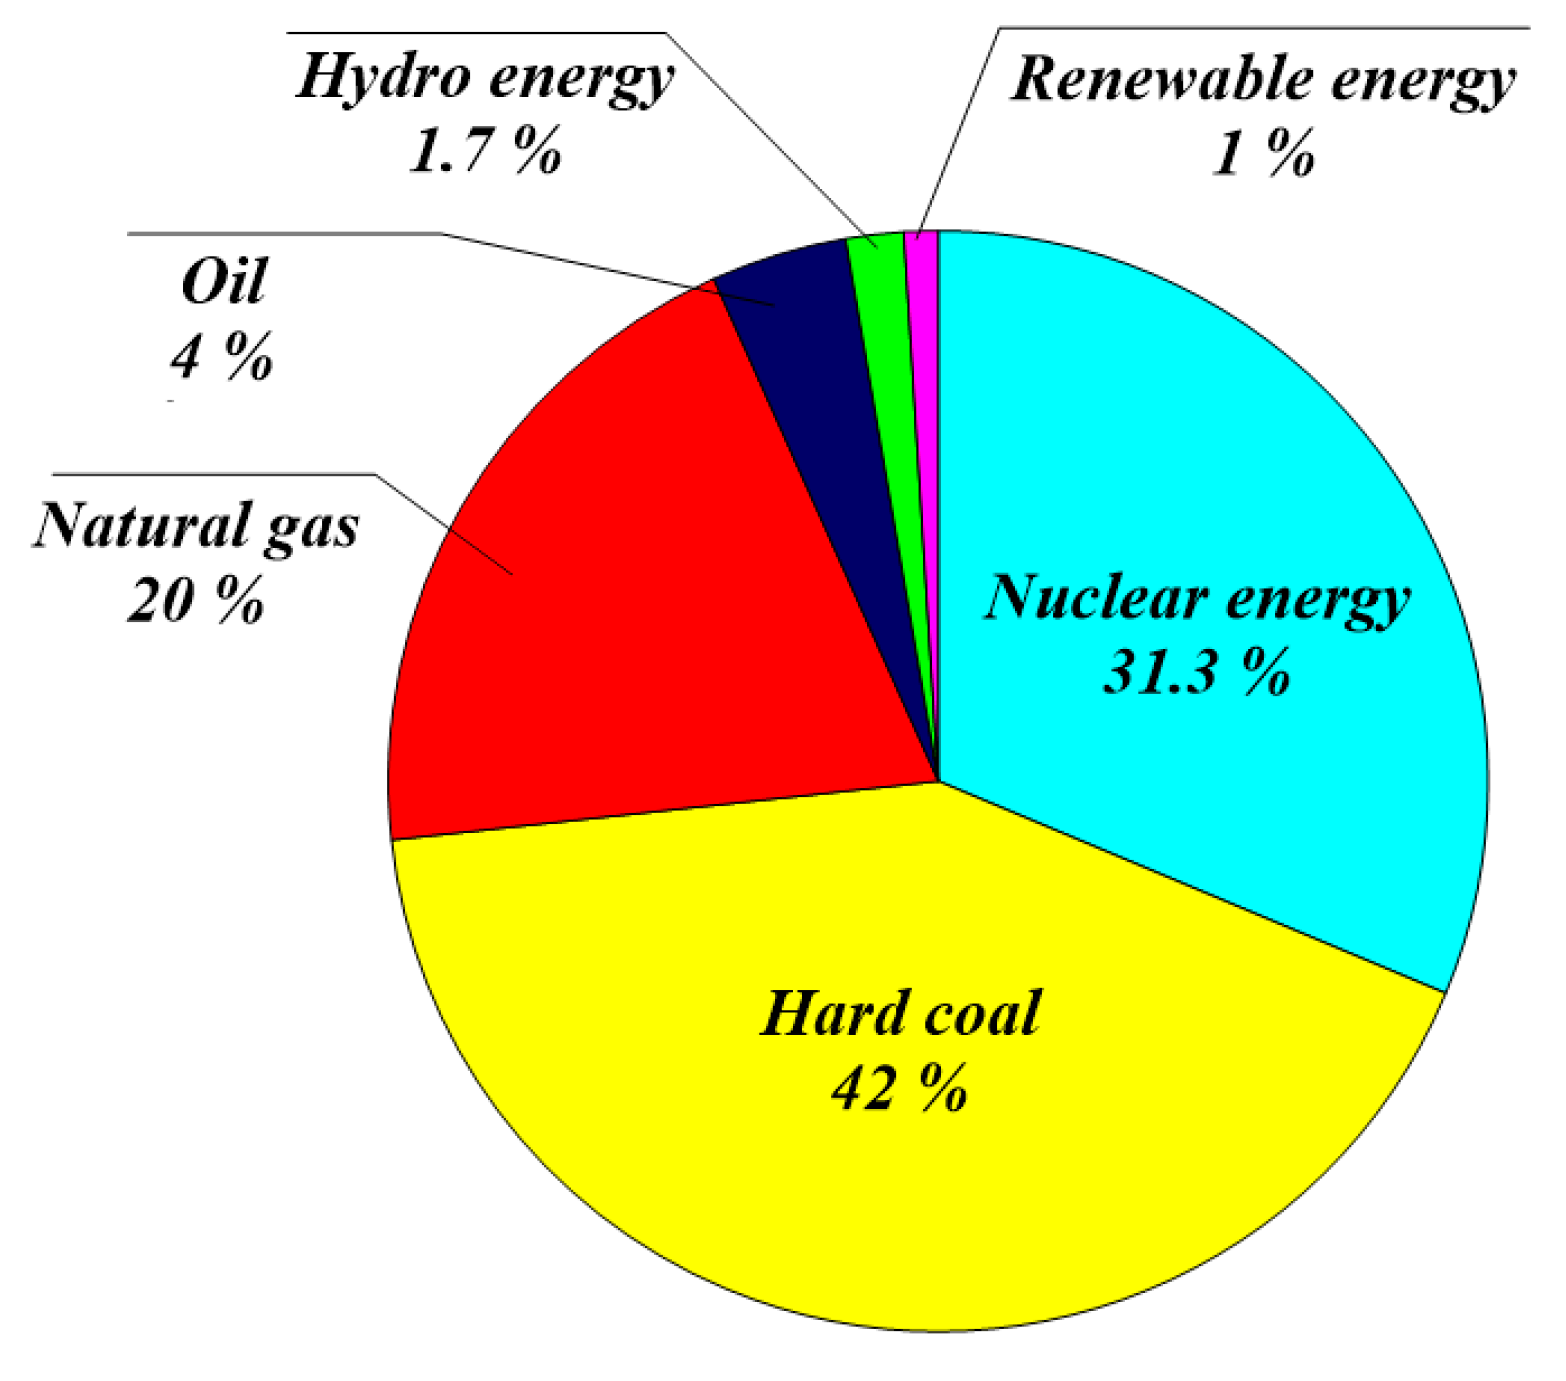
- The emissions from hydrogen depend highly on its energy sources. It was shown that the GWP emissions were remarkably larger than those from MGO and natural gas at the Well-to-Tank phase, and most of the emissions were from the SMR and liquefaction process. The emissions from the liquefaction process can be reduced by using nuclear or renewable energy sources.
- The SMR process is the way that is most commonly used to produce hydrogen, but the hydrogen from SMR, which is called gray hydrogen, is not more eco-friendly than natural gas due to the high level of GWP emissions in the Well-to-Tank phase. This means that hydrogen is the most suitable fuel for ships to meet IMOs 2050 GHG regulation with zero emissions in the Tank-to-Wake phase, but it is not a good solution because of the GWP emissions at the Well-to-Tank phase. As an alternative ship fuels with truly zero emission, green hydrogen is recommended using the water splitting method, which produces 6.14% more GWP than those from the SMR process [30].
- By-product hydrogen, which is produced during processes in the petrochemical industry, can be used as fuel for ships. The amount of by-product hydrogen in the ROK is approximately 192 M tons, and 73% of that amount is reused in the chemical process [31]. The residual by-product hydrogen can be used to power ships, and the amount is sufficient to power all of the coastal ships in the ROK.
- For the larger ships that operate in the ocean, large amounts of hydrogen must be produced, and it is inevitable that some brown coal or fossil fuels also will have to be used. The suitable way to produce hydrogen with the resources is the SMR process in combination with the carbon capture and storage (CCS) technique [32], which can reduce the environmental impact of GWP in the Well-to-Tank phase.
- For truly zero emission ships during their life cycle, it would be a solution to use the green hydrogen produced from the water splitting method. Moreover, the water splitting method can use either nuclear or renewable energy to produce the hydrogen without any emission during its life cycle.
Author Contributions
Funding
Acknowledgments
Conflicts of Interest
Appendix A

| Greenhouse Gas | Life Time (Years) |
|---|---|
| Carbon Dioxide (CO2) | 50~200 |
| Methane (CH4) | 12.4 |
| Nitrous Oxide (N2O) | 121 |
| Production and Pipeline transport [kg per 1 kg of Crude Oil] | CO2 | CO | NOx | N2O |
| SOx | NMVOC | PM | - | |
| - | ||||
| Ocean Tanker Transport (Saudi → ROK) [kg per 1 kg of Crude Oil] | CO2 | CO | NOx | SOx |
| NMVOC | PM | - | - | |
| - | - | |||
| Refinery [kg per 1 kg of MGO] | CO2 | CO | NO2 | NOx |
| SOx | NMVOC | PM | - | |
| - | ||||
| MGO Terminal Storage [kg per 1 kg of MGO] | CO2 | CO | H2S | NOx |
| NMVOC | SOx | - | - | |
| - | - | |||
| Bunkering Operation [kg per bunkering 1 MJ of MGO] | CO2 | CO | H2S | NOx |
| SO2 | NMVOC | - | - | |
| - | - |
| Production and Pipeline Transport [kg per 1 kg of Natural gas] | CO2 | CO | N2O | CH4 |
| NOx | S2O | NMVOC | - | |
| - | ||||
| Purification and Liquefaction [kg per 1 kg of LNG] | CO2 | CO | N2O | CH4 |
| NOx | SO2 | NMVOC | PM | |
| LNG Carrier Transport (Qatar → ROK) [kg per 1 kg of LNG] | CO2 | CO | N2O | CH4 |
| NOx | NMVOC | PM | - | |
| - | ||||
| LNG Terminal Storage [kg per 1 kg of LNG] | CO2 | CO | H2S | NOx |
| NMVOC | SOx | - | - | |
| - | - | |||
| Bunker Truck [kg per 108 km transport of 1 kg of LNG] | NH3 | Benzene | CO2 | CO |
| PM | CH4 | NO2 | NO | |
| N2O | NMVOC | SO2 | ||
| Bunkering Operation [kg per bunkering 1 MJ of LNG] | CO2 | CO | CH4 | H2S |
| N2O | SO2 | NMVOC | - | |
| - |
| Natural Gas Steam Methane Reforming [kg per 1 kg of production of hydrogen] | CO2 | CO | CH4 | NO2 |
| NO | NOx | N2O | SO2 | |
| PM | NMVOC | Butane | - | |
| - |
| Emission factor from hard coal [kg per 3.6 MJ electricity production] | CO2 | CO | CH4 | NO2 |
| NO | NOx | N2O | SO2 | |
| PM | NMVOC | Ethane | - | |
| - |
| Emission factor from nuclear energy [kg per 3.6 MJ electricity production] | CO2 | CO | CH4 | NO2 |
| NO | NOx | N2O | SO2 | |
| PM | NMVOC | Ethane | - | |
| - |
| Emission factor from renewable energy [kg per 3.6 MJ electricity production] | CO2 | CO | CH4 | NO2 |
| NO | NOx | N2O | SO2 | |
| PM | NMVOC | Ethane | - | |
| - |
| Emission factor from electricity in ROK [kg per 3.6 MJ electricity production] | CO2 | CO | CH4 | NO2 |
| NO | NOx | N2O | SO2 | |
| PM | NMVOC | Butane | Ethane | |
Appendix B
| MGO consumption [kg per 1 kg consumption of MGO] | CO2 | CO | N2O | CH4 |
| NOx | NMVOC | PM | SO2 | |
| Natural gas consumption [kg per 1 kg consumption of natural gas] | CO2 | CO | N2O | PM |
| CH4 | NOx | NMVOC | - | |
| - |
References
- Smith, T.W.P.; Jalkanen, J.P.; Anderson, B.A.; Corbett, J.J.; Faber, J.; Hanayama, S.; O’Keeffe, E.; Parker, S.; Johansson, L.; Aldous, L.; et al. Greenhouse Gas. Study, 3rd ed.; International Maritime Organization (I.M.O.): London, UK, 2015. [Google Scholar]
- Resolution MEPC. 176 (58); International Maritime Organization (I.M.O.): London, UK, 2008.
- Resolution MEPC. 259 (68); International Maritime Organization (I.M.O.): London, UK, 2015.
- Resolution MEPC. 304 (72); International Maritime Organization (I.M.O.): London, UK, 2018.
- Business Status of Nearshore Ferry in 2020; Korea Shipping Association (K.S.A.): Seoul, Korea, 2020. (In Korean)
- Verbeek, R.; Verbeek, K. LNG for Trucks and Ships: Fact Analysis Review of Pollutant and GHG Emissions Final; TNO Report; TNO Innovation for Life: The Hague, The Netherlands, 2015. [Google Scholar]
- Luckose, L.; Hess, H.L.; Johnson, B.K. Fuel cell propulsion system for marine applications. In Proceedings of the Electric Ship Technologies Symposium, Baltimore, MD, USA, 20–22 April 2009; pp. 574–580. [Google Scholar]
- Bailey, C.; Bain, A.; Birk, J.; Hainsselin, M.; Kamal, M.; Linden, H.; Lloyd, A.; Lynch, F.; MacKenzie, G.; Nahmias, D.; et al. The Green Hydrogen Report; National Renewable Energy Laboratory (N.R.E.L): Washington, DC, USA, 1995. [Google Scholar]
- Serban, M.; Lewis, M.A.; Basco, J.K. Kinematic study of the hydrogen and oxygen production reactions in the copper-chloride thermochemical cycle. In Proceedings of the 2004 AIChE Spring National Meeting, New Orleans, LA, USA, 15–19 April 2009; pp. 1–10. [Google Scholar]
- Naterer, G.F.; Suppiah, S.; Lewis, M.; Gabriel, K.; Dincer, I.; Rosen, M.A.; Fowler, M.; Rizvi, G.; Easton, E.B.; Ikeda, B.M.; et al. Recent Canadian advances in nuclear-based hydrogen production and the thermochemical Cu-Cl cycle. Int. J. Hydrogen Energy 2009, 34, 2901–2917. [Google Scholar] [CrossRef]
- Kupfer, T.; Baitz, M.; Colodel, C.M.; Kokborg, M.; Schöll, S.; Rudolf, M.; Thellier, L.; Gonzalez, M.; Schuller, O.; Hengstler, J.; et al. GaBi Database & Modelling Principles; Thinkstep: Stuttgart, Germany, 2017. [Google Scholar]
- International Standard Organization (ISO). ISO 14040: Environmental Management-Life Cycle Assessment-Principles and Framework; International Standard Organization (ISO): London, UK, 2006. [Google Scholar]
- International Standard Organization (ISO). ISO 14041: Environmental Management-Life Cycle Assessment-Goal and Scope Definition and Inventory Analysis; International Standard Organization (ISO): London, UK, 1998. [Google Scholar]
- Lee, C. Status and prospects of LNG bunkering by KOGAS. In Proceedings of the Int. LNG Fueled Ship & Bunkering Conference, Busan, Korea, 15 November 2018. [Google Scholar]
- KEPCO. Available online: https://blog.kepco.co.kr/918 (accessed on 18 March 2020).
- Yearbook of Energy Statistics in 2018; Korea Energy Economics Institute (K.E.E.I.): Ulsan, Korea, 2018.
- Bengtsson, S.; Andersson, K.; Fridell, E. Life Cycle Assessment of Marine Fuels: A Comparative Study of Four Fossil Fuels for Marine Propulsion; Chalmers University of Technology: Gothenburg, Sweden, 2011. [Google Scholar]
- Life Cycle GHG Emission Study on the Use of LNG as Marine Fuel; Thinkstep: Stuttgart, Germany, 2019.
- SEAROUTES. Available online: http://www.searoutes.com (accessed on 4 May 2020).
- Thinkstep. GaBi Database. Available online: http://www.gabi-software.com/international/databases (accessed on 15 June 2020).
- Endresen, Ø.; Sørgård, E.; Sundet, J.K.; Dalsøren, S.B.; Isaksen, I.S.; Berglen, T.F.; Gravir, G. Emission from international sea transportation and environmental impact. J. Geophys. Res. Atmos. 2003, 108. [Google Scholar] [CrossRef]
- Pratt, J.W. Feasibility of the SF-BREEZE: A Zero-Emission Hydrogen Fuel Cell High-Speed Passenger Ferry; Sandia National Lab (SNL-CA): Livermore, CA, USA, 2017. [Google Scholar]
- Stocker, T.F.; Qin, D.; Plattner, G.-K.; Tignor, M.M.B.; Allen, S.K.; Boschung, J.; Nauels, A.; Xia, Y.; Bex, V.; Midgley, P.M. Climate Change 2013: The Physical Science Basis. Contribution of Working Group I to the Fifth Assessment Report of the Intergovernmental Panel on Climate Change; Cambridge University Press: Cambridge, UK; New York, NY, USA, 2013; p. 1535. [Google Scholar]
- GHK, B.A. Study to Examine the Benefits of the End of Life Vehicles Directive and the Costs and Benefits of a Revision of the 2015 Targets for Recycling, Re-Use and Recovery Under the ELV Directive; DG Environment: Birmingham, AL, USA, 2006; pp. 3–4. [Google Scholar]
- Preiss, P. Photochemical ozone formation. In Life Cycle Impact Assessment; Springer: Dordrecht, The Netherlands, 2015; pp. 115–138. [Google Scholar]
- Dreyer, L.C.; Niemann, A.L.; Hauschild, M.Z. Comparison of three different LCIA methods: EDIP97, CML2001 and Eco-indicator 99. Int. J. Life Cycle Assess. 2003, 8, 191–200. [Google Scholar] [CrossRef]
- Chomkhamsri, K.; Wolf, M.A.; Pant, R. International reference life cycle data system (ILCD) handbook: Review schemes for life cycle assessment. In Towards Life Cycle Sustainability Management; Springer: Dordrecht, The Netherlands, 2011; pp. 107–117. [Google Scholar]
- Bare, J.C. TRACI: The tool for the reduction and assessment of chemical and other environmental impacts. J. Ind. Ecol. 2002, 6, 49–78. [Google Scholar] [CrossRef]
- Myhre, G.; Shindell, D.; Breon, F.-M.; Collins, W.; Fuglestvedt, J.; Huang, J.; Koch, D.; Lamarque, J.-F.; Lee, D.; Mendoza, B.; et al. Chapter 8-Anthropogenic and Natural Radiative Forcing. In 5th Assessment Report (AR5); Intergovernmental Panel on Climate Change (IPCC): Geneva, Switzerland, 2014; p. 151. [Google Scholar]
- Ozbilen, A.; Dincer, I.; Rosen, M.A. A comparative life cycle analysis of hydrogen production via thermochemical water splitting using a Cu–Cl cycle. Int. J. Hydrogen Energy 2011, 36, 11321–11327. [Google Scholar] [CrossRef]
- MOTIE. Road Map for Hydrogen Economy Activation. Available online: http://www.motie.go.kr/motie/py/td/tradefta/bbs/bbsView.do?bbs_cd_n=72&cate_n=3&bbs_seq_n=210222 (accessed on 25 June 2020).
- Haszeldine, R.S. Carbon capture and storage: How green can black be? Science 2009, 325, 1647–1652. [Google Scholar] [CrossRef] [PubMed]


| Case | Case 1 | Case 2 | Case 3-1 | Case 3-2 | Case 3-3 | Case 3-4 |
|---|---|---|---|---|---|---|
| Fuel | MGO | Natural gas | Hydrogen | |||
| Production methods | Import | Import | SMR from LNG | |||
| Electricity source | - | - | Hard coal | Nuclear energy | Renewable energy | Electricity in ROK |
| Type of Fuel | MGO | Natural Gas | Hydrogen |
|---|---|---|---|
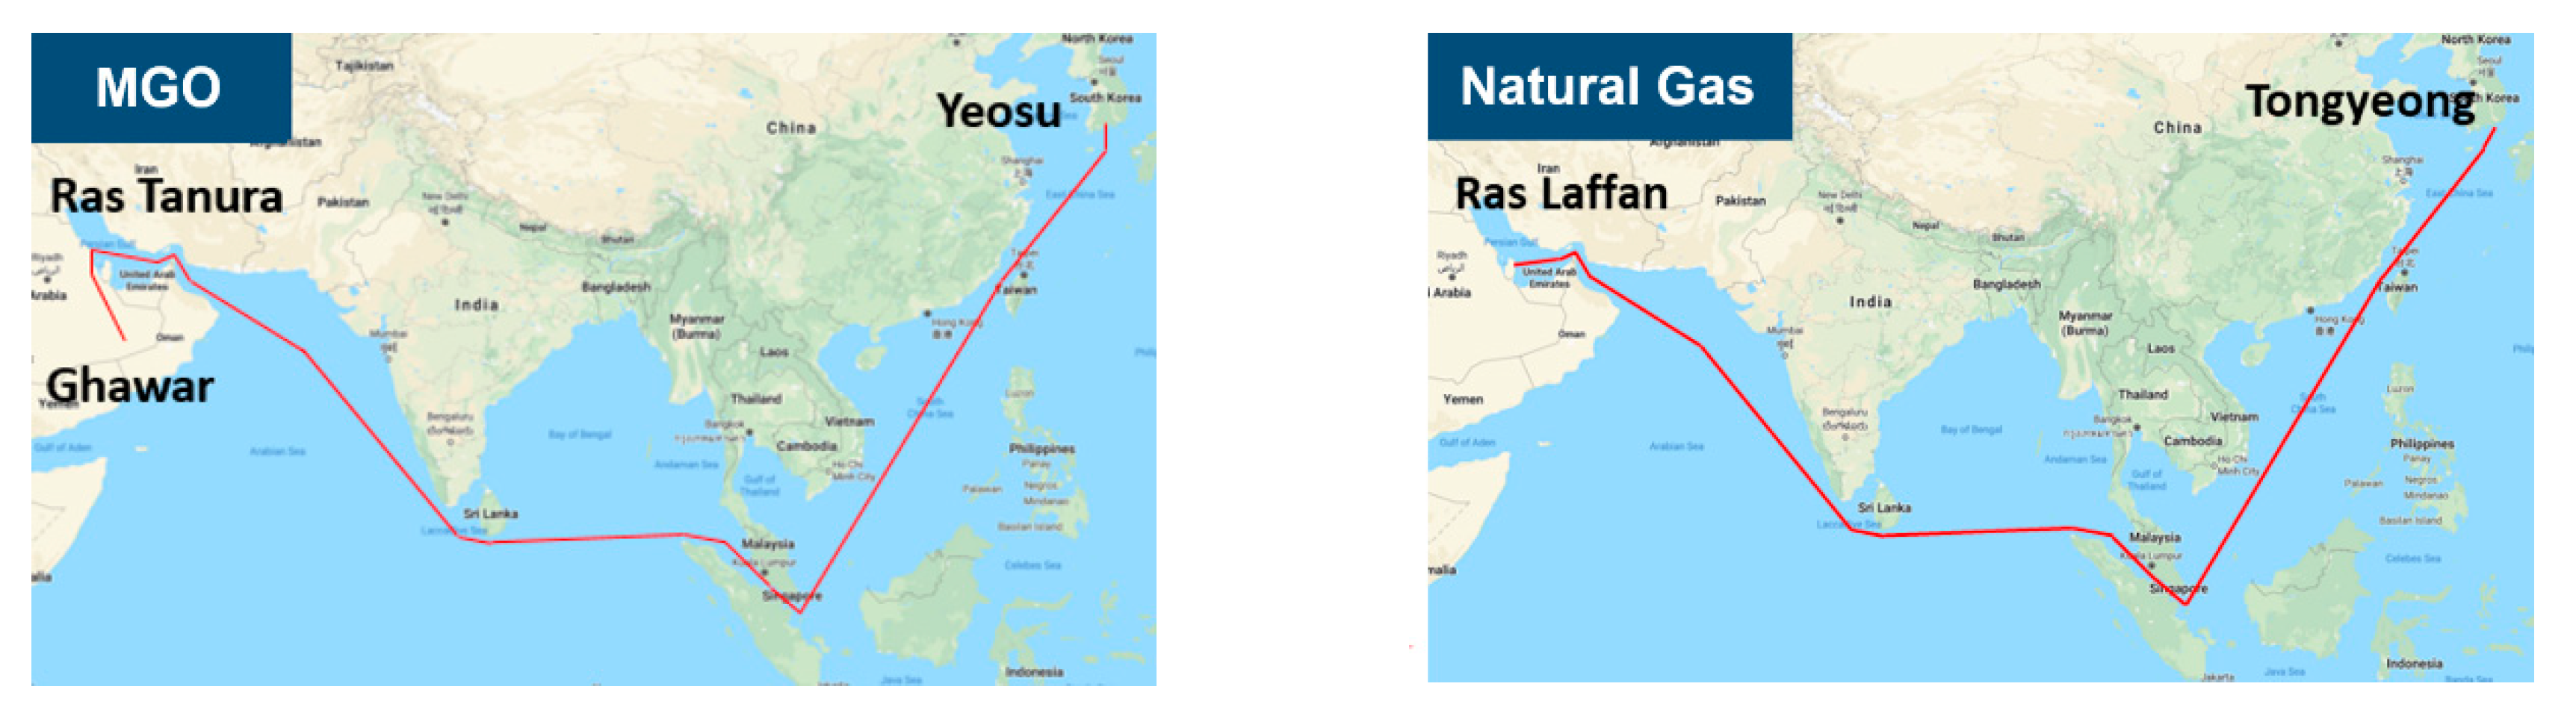
| Origin (country) | Ghawar field (Saudi Arabia) | North Dome gas field (Qatar) | |
| Terminal 1 (country) | Ras Tanura oil terminal (Saudi Arabia) | Ras Laffan LNG terminal (Qatar) | |
| Terminal 2 (country) | - | Tongyeong LNG terminal (ROK) | |
| Terminal 3 (country) | - | - | Ulsan Petrochemical Plant (ROK) |
| Destination (country) | Yeosu Oil Terminal (ROK) | ||
| Ocean transport distance [19] (km) | 11,400 | 11,350 | 11,350 |
| Ship Type | Engine Type | Engine Capacity (kW) | Design Speed (Knots) | Dead Weight (Tonne) | Fuel Type |
|---|---|---|---|---|---|
| Crude oil carrier | Diesel Engine | 18,796 | 16.0 | 165,000 | HFO (2.5% Sulphur) |
| LNG carrier | Steam turbine—4 stroke Otto cycle | 22,600 | 18.5 | 60,000 | LNG |
| Trip Scenario | |
|---|---|
| Tonnage (GT) | 12,000 |
| Capacity (Persons) | 1500 passengers and 140 cars |
| Trip Hour (min) | 5 h and 50 |
| Energy Consumption per Each Round Trip (MJ) | 148,050 |
| Trip Frequency (Times/Day) | 1 |
| Lifetime (Years) | 20 |
| Total Energy Consumption (MJ) | |
| Fuel | MGO | Natural Gas | Hydrogen |
|---|---|---|---|
| Efficiency (%) | 46 [20] | 47 [20] | 53 [22] |
| Fuel Consumption (g/kWh) | 184.7 | 155.8 | 56.6 |
| Consumed Fuel (ton) | 41,267 | 35,053 | 12,745 |
| Total Energy (MJ) | |||
| Power Output (MW) | 4 | ||
| Type | 4-stroke medium speed Otto-SI | 4-stroke medium speed CI | PEMFC (34 × 120 kW) |
| MGO | NATURAL GAS | Hydrogen | |
|---|---|---|---|
| 2016 IMO NOx Regulation (Global 14.4, ECA 3.4 g/kWh) * | ○(Global) ×(ECA) | ○ | ○ |
| 2020 IMO Sulphur Regulation (Global 0.5% S) | ○ | ○ | ○ |
| 2050 IMO new road map for GHG (at least 50% compared to 2008) | × | × | ○ |
© 2020 by the authors. Licensee MDPI, Basel, Switzerland. This article is an open access article distributed under the terms and conditions of the Creative Commons Attribution (CC BY) license (http://creativecommons.org/licenses/by/4.0/).
Share and Cite
Hwang, S.S.; Gil, S.J.; Lee, G.N.; Lee, J.W.; Park, H.; Jung, K.H.; Suh, S.B. Life Cycle Assessment of Alternative Ship Fuels for Coastal Ferry Operating in Republic of Korea. J. Mar. Sci. Eng. 2020, 8, 660. https://doi.org/10.3390/jmse8090660
Hwang SS, Gil SJ, Lee GN, Lee JW, Park H, Jung KH, Suh SB. Life Cycle Assessment of Alternative Ship Fuels for Coastal Ferry Operating in Republic of Korea. Journal of Marine Science and Engineering. 2020; 8(9):660. https://doi.org/10.3390/jmse8090660
Chicago/Turabian StyleHwang, Sang Soo, Sung Jin Gil, Gang Nam Lee, Ji Won Lee, Hyun Park, Kwang Hyo Jung, and Sung Bu Suh. 2020. "Life Cycle Assessment of Alternative Ship Fuels for Coastal Ferry Operating in Republic of Korea" Journal of Marine Science and Engineering 8, no. 9: 660. https://doi.org/10.3390/jmse8090660