Biome-Scale Forest Properties in Amazonia Based on Field and Satellite Observations

1
Environmental Change Institute, School of Geography and the Environment, University of Oxford, Oxford OX1 3QY, UK
2
National Institute for Space Research (INPE), São José dos Campos, SP 12227-010, Brazil
Remote Sens. 2012, 4(5), 1245-1271; https://doi.org/10.3390/rs4051245
Submission received: 20 February 2012
/
Revised: 26 April 2012
/
Accepted: 27 April 2012
/
Published: 4 May 2012
Abstract
:Amazonian forests are extremely heterogeneous at different spatial scales. This review intends to present the large-scale patterns of the ecosystem properties of Amazonia, and focuses on two parts of the main components of the net primary production: the long-lived carbon pools (wood) and short-lived pools (leaves). First, the focus is on forest biophysical properties, and secondly, on the macro-scale leaf phenological patterns of these forests, looking at field measurements and bringing into discussion the recent findings derived from remote sensing dataset. Finally, I discuss the results of the three major droughts that hit Amazonia in the last 15 years. The panorama that emerges from this review suggests that slow growing forests in central and eastern Amazonia, where soils are poorer, have significantly higher above ground biomass and higher wood density, trees are higher and present lower proportions of large-leaved species than stands in northwest and southwest Amazonia. However, the opposite pattern is observed in relation to forest productivity and dynamism, which is higher in western Amazonia than in central and eastern forests. The spatial patterns on leaf phenology across Amazonia are less marked. Field data from different forest formations showed that new leaf production can be unrelated to climate seasonality, timed with radiation, timed with rainfall and/or river levels. Oppositely, satellite images exhibited a large-scale synchronized peak in new leaf production during the dry season. Satellite data and field measurements bring contrasting results for the 2005 drought. Discussions on data processing and filtering, aerosols effects and a combined analysis with field and satellite images are presented. It is suggested that to improve the understanding of the large-scale patterns on Amazonian forests, integrative analyses that combine new technologies in remote sensing and long-term field ecological data are imperative.
1. Introduction
Amazonia plays a major and yet poorly understood function in the global carbon cycle. The Amazonian tropical forest holds about 120 ± 30 Pg of carbon in biomass [1] with an approximate spatial distribution of above ground live biomass ranging from 300 Mg·ha−1 in Central Amazonia and in regions to the east and north, to 100–200 Mg·ha−1 in the transitional and seasonal forests at the southern and north-western edges of the basin [2]. In addition, it contributes approximately 10% (4–6 Pg·C) of the world’s terrestrial annual net primary productivity (NPP, the net amount of carbon that is fixed from the atmosphere into new organic matter per unit time) [3,4].
The carbon cycle has been receiving increased attention, not only from environmental scientists but also from the public and media. It has become part of the political agenda because 60% of observed global warming is attributable to the increase in carbon dioxide concentration in the atmosphere [5]. The idea that terrestrial vegetation may significantly influence the climate at regional to global scales has advanced mainly in the past three decades. Progress in technology and an increase in scientific multinational and trans-disciplinary integrative collaborations have enabled vegetation feedbacks on atmospheric and climatic processes to be studied over a wide range of scales [6,7]. For example, evaporation, condensation, cloud formation and cloud condensation nuclei particles over Amazonia have been found to play a significant role on the global circulation, affecting not only South American rainfall but also the climate of the North Atlantic and Western Europe [8–10]. On the other hand, regional patterns of rainfall, radiation and temperature act on the physiological functioning, species composition and spatial distribution of plants in the Amazon region. Studies have shown that length of the dry season in Amazonia has a significant correlation with the above ground live biomass distribution [2] and also has a major effect on geographical variation in tree community composition [11]. Water availability may also exert a yet unrecognized selective pressure on leaf shape of rainforest trees [12], and if the environmental contribution is removed (e.g., site growing conditions, soil fertility and temperature), the total annual rainfall was found to positively influence the per area leaf mass and some leaf nutrient concentrations [13]. Photosynthesis and productivity are stimulated by diffuse radiation, which can penetrate deeper than direct radiation into closed canopies [14]. Recent results have shown that increased diffuse radiation, caused by the increase of aerosols in the Amazon atmosphere during the dry season, increases forest CO2 uptake [15].
Despite these studies, Amazon ecosystem processes cannot be understood in terms of climate alone. It has become clear that Amazon forest structure and dynamics are strongly related to physical and chemical edaphic conditions [16]. However, elevated logistic and research costs and the high heterogeneity of these forests make a detailed understanding of these ecological observations very challenging.
Therefore, in this paper I explore the recent findings on the large-scale patterns of the forest ecosystems properties in Amazonia. First, I focus on forest biophysical properties that directly influence the carbon dynamics across the Amazon (wood density, above ground biomass, tree height, crown size and wood productivity). Then, I explore the macro-scale phenological patterns of these forests, and bring into discussion the recent findings derived from remote sensing dataset. Finally, I present the most recent findings on the effects of droughts in Amazonia. A review of climate change effects on tropical forests have been explored elsewhere [17].
2. Forest Biophysical Properties
2.1. Wood Density
Wood density is an important factor in converting forest volume data to biomass. It is defined by the oven-dry weight divided by wet volume [18]. Wood specific gravity is highly correlated with the density of carbon per unit volume and is thus important for estimating ecosystem carbon storage and fluxes [18,19]. However, one of the large sources of uncertainty in all estimates of carbon stocks in tropical forests is the lack of information on tree height and wood density due to the high number of species [20].
The distribution of wood specific gravity within a tropical tree community is theoretically expected to vary among sites, associated with one or a combination of soil fertility, rates of forest disturbance, early and secondary successional vegetation, tree growth and mortality [21–26]. High disturbance rates and high turnover rates are expected to occur in faster-growing species, which as a result have relatively low density woods, while low soil fertility slows tree growth, and is expected to lead to relatively high density woods [27]. However, [24] argues that there are no clear explanations for differences in wood specific gravity among sites, and it seems likely that different factors may act at different scales.
In Amazonia, it has been suggested that regional patterns of species composition and abundance drive the observed east-west gradient in wood specific gravity [28]. Overall, mean stand-level wood specific gravity is 16% higher in forests in central and eastern, compared with north/western Amazonia [27]. It has been suggested that the higher specific gravity in central and eastern Amazon forests is related to the regular seasonal water availability or El Niño related droughts that occur in this region [23], and more recently, to a certain extent to the soil physical structure and quality [16].
2.2. Above Ground Biomass
A number of approaches have been used to estimate the spatial distribution of biomass in Amazonia, ranging from the development of allometric equations [25,29,30], local and large scale forest inventories [1,28,31–34] to a methodology using only remote sensing or combined with field data [2,35–37]. Houghton et al. [38] compared several biomass estimates for the Brazilian Amazon, and found very low agreement across estimates.
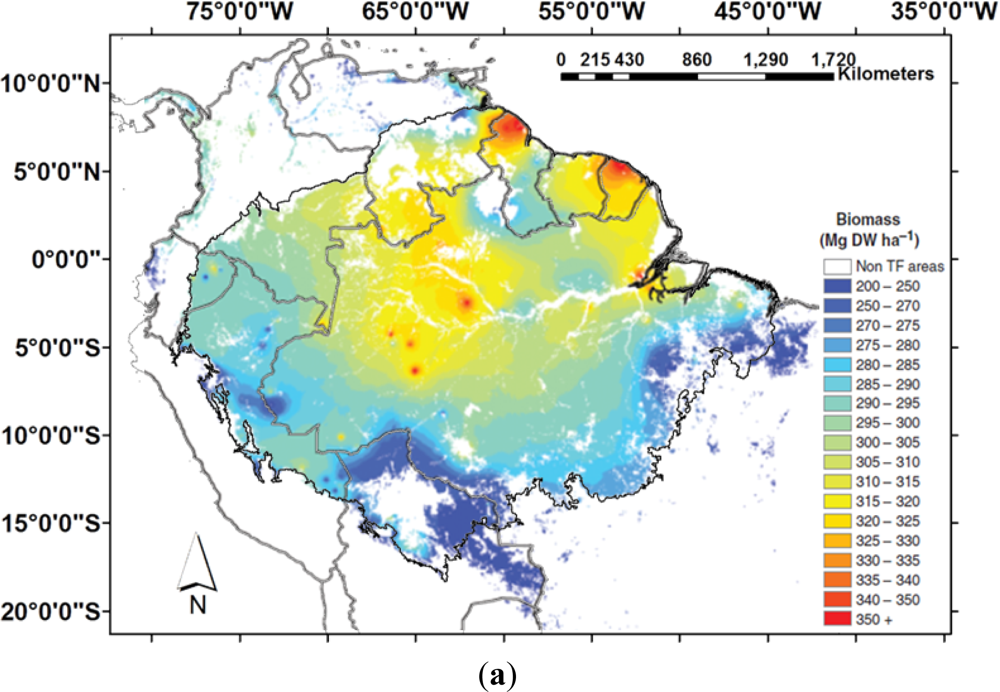
Differences in biomass estimates based on field measurements arise from differences in measurement methods in individual plots, extrapolation of the data from individual plots for the region, and the heterogeneity of the forests [38,39]. Remote sensing-based estimates are usually restricted either to a small area of coverage with high spatial resolution (e.g., Landsat, IKONOS, Japanese Earth Resources Satellite (JERS) or airborne laser data ([40,41] and others) or else to sensors with a higher area of coverage, but with low spatial resolution [42] which implies a loss of accuracy to detect variations in forest physiognomy. Direct estimates of biomass based solely on optical or radar data derived from satellites present inconsistencies in forests with moderate and high biomass, and new technologies are being developed, such as the BIOMASS mission from the European Space Agency (ESA) [43]. Recent studies based entirely on field data [1] or on field data merged with a remote sensing dataset [2], suggest high biomass (300–400 Mg·ha−1) in north-eastern Amazonia and central areas west of the Trombetas river to the west of the Rio Negro river, lower biomass (250–300 Mg·ha−1) in the main channel of the Amazon River, Igapó and Várzea floodplains and between 200–300 Mg ha−1 in western and southern Amazonia (Figure 1(a,b)). At a global scale, AGB has been recently estimated by using a combination of remote sensing and field data: the global forest height data measured by the Geoscience Laser Altimeter System (GLAS), onboard the Ice, Cloud, and land Elevation Satellite (ICESat), the moderate resolution imaging spectroradiometer (MODIS), the shuttle radar topography mission (SRTM), and quick scatterometer (QSCAT) [44]. The comparison of this global AGB with the map produced by [2] revealed in this new dataset lower biomass in the Rio Negro Basin, central region, and higher biomass in western Amazonia. Western Amazonia is a region that presents lower biomass then central regions [1,23,27,45] and it could be speculated that the bamboo forests, present in this region, could have effects on Lidar measurements.
The use of RADAR for biomass estimation in dense canopy forests is still limited. At a local scale, Synthetic Aperture Radar (SAR) has been used to map and estimate biomass on different land covers. By analyzing SIR-C data in C- and L-bands in a region in central Brazilian Amazonia, [46] noted a visual discrimination of the main regenerating classes, indicating a potentiality for biomass estimation, although the analysis of the six bands separately produced no significant relationships between SAR backscatter and forest biomass. The analysis performed by [47] using JERS-1 L-band data for central Amazonia suggested that only three broad classes of regenerating forest biomass density were distinguished and saturation were observed at lower biomass when compared with saturation limits in other forest types such as a coniferous plantation. Improvements on biomass mapping were achieved by the use of airborne P-band SAR [48], although primary and secondary forests in some cases exhibited similar P-band backscatter values. For the same region as [48], Gonçalves et al. [49] found average prediction errors of less than 14% for quantifying stem volume by using polarimetric synthetic aperture radar (PolSAR). A review on mapping and monitoring biomass estimation by comparing different methods and satellite data is provided by [50].
2.3. Canopy Height
There are few studies focusing on the spatial variability of tree height in Amazonia. The variation in tree height (and thus wood volume) with environmental factors are also poorly described. Nonetheless, tree height is expected to show a similar pattern to basal area and decrease with increasing dry season length as hydraulic constraints on tree height become more severe. Moreover, height increase in large diameter trees is expected to be limited due to mechanical and physiological constraints [51].
The development of a new approach to map forest height globally using light detection and ranging (Lidar) data from the Geoscience Laser Altimeter System (GLAS) is expected to greatly contribute to the understanding of forest structure, and refinements in the spatial scale would provide critical information on the pools’ above-ground biomass. The GLAS products were used by [52,53] to generate a global canopy height map. Both maps detected higher errors in closed broadleaves forests, such as the Amazon. In the Amazon basin Simard et al. [53] found differences in canopy height as a function of distance from rivers and edge effects were observed along roads and in the arc of deforestation (Figure 1(c)).
At local scale, the use of the Laser Vegetation Imaging Sensor (LVIS) detected canopy top height changes between the data from 1998 and 2005 in secondary and old growth forests coincident to the expected changes of these land cover types [54].
2.4. Crown Size and Leaf Size Patterns
A macrostructure of crown size has been detected by [55] in Amazonia terra firme forests. Despite the high local variability, apparent crown size tends to be larger than 16 m in a broad east-west band, from 5–10° of the equator, and larger than 15 m in the contiguous region in north-eastern Amazonia. These areas of large tree crown size are broadly located in the regions with short dry season (1–3 months). On the other hand, small crown sizes (<14 m) dominated north-western and the very southern limits, close to the Cerrado biome. These areas correspond to regions with no dry season or long dry season (>5 months). Interestingly, north-west Amazonia presents significantly greatest proportions of large-leaved species, and is followed by southwest, central and eastern and finally, north Amazonia [56]. In addition, species with large leaves have lower wood density (approximately 10% less) when compared with species with small leaves [56].
2.5. Forest Productivity
The biochemical construction of new organic material over a specified time interval—known as net primary production (NPP)—of tropical forests and its partitioning between long-lived carbon pools (wood) and shorter-lived pools (leaves, fine roots) is of considerable importance in the global carbon cycle [4]. It has been suggested that the NPP as well as the nitrogen and phosphorus content, all scale allometrically with phytomass across diverse plant communities, from tropical forest to arctic tundra [57].
The quantification of NPP is still very uncertain but considerable work has been done on the assessment of the above-ground components of NPP (leaf, flower, fruit and wood production) for different ecosystems. On the other hand, below-ground NPP, the partitioning between above- and below-ground components and the main environmental drivers of these patterns are still poorly understood. Data on both below- and above-ground NPP are especially limited in Amazonia due to elevated costs and challenging logistics involved in setting up and monitoring measurement sites. There are different approaches to evaluate and quantify the below- and above- ground primary production. Field measurements for assessing the above-ground component should include litterfall, branch production, coarse woody biomass production, aboveground biomass losses to consumers, and the emission of volatile organic carbon compounds and aboveground losses of leached organic compounds [58–62]. For the below-ground component, data on coarse and fine root productivity, dead coarse and fine roots, losses to consumers, and the carbon loss through exudates and mycorrhizae are necessary [61,63]. The second option for evaluating the above-ground component (mainly canopy process) relies on the use of remote sensing data and modeling [64–68], although field measurements are important for validation purposes.
Looking at the above-ground coarse wood carbon productivity in stems and branches, Malhi et al. [60] demonstrated that wood production varies by up to a factor of three across Amazonian forests. Lower wood production, according to that study, is found on poor oxisols in lowland eastern Amazonia and higher production occurs in more fertile soils in western Amazonia. In relation to the canopy NPP (leaves, twigs, flowers and fruits), Chave et al. [62] suggested that soil is not a major determinant of litterfall patterns, however infertile white sandy soils have significantly lower litterfall than other soil types, and more fertile soils exhibit higher canopy production [61]. Below-ground allocation declines with increasing clay content and more fertile soils tend to have higher fine root production [61]. Overall, soil phosphorus is likely to be more important than nitrogen in the determination of the total NPP across the Amazon [16]. It has also been suggested that forests in infertile soils, such as eastern Amazonia, have low carbon use efficiency, in comparison with recently disturbed forests or forests in fertile soils [69].
Remote sensing and modeling studies suggest or assume that temperature followed by solar radiation primarily determine variation in NPP in Amazonia, which is especially sensitive to large ENSO events [70,71] although soil depths significantly affect the gross primary production (GPP, the sum of net primary production (NPP) and autotrophic respiration) [68,72]. While temperature appears to exert a strong influence on NPP in some models [64], other models suggest that radiation increases carbon fluxes in Amazonian [65,73]. This is also suggested by remote sensing observations, which showed increases in leaf area index (LAI) and Enhanced Vegetation Indices (EVI) during the dry-season [66,74]. It is important to mention that not only remote sensing data but also modeling studies have limitations when applied to evergreen canopies such as the tropical forests, due to saturation in the data in the first case and lack of information in the latter.
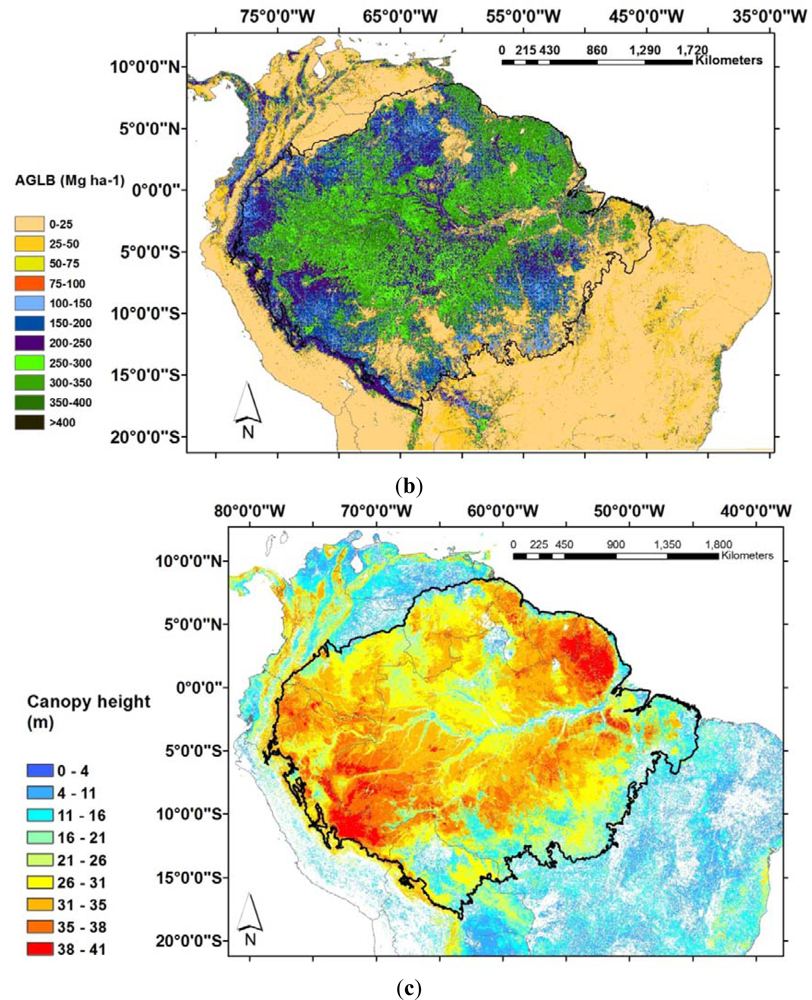
A synthesis of the large-scale patterns of wood density, above ground biomass and wood productivity, compiled from [1,27,60] is presented in Figure 2. By combining these biophysical measurements, two distinct groups of plots emerge: “east-central”, with higher above ground biomass, wood specific density and lower productivity than the “west” group (Figure 2(b)). A detailed evaluation of the plots and field sites is presented in [45].
Although there is a great effort from the scientific community on developing new techniques for mapping forests biomass, the understanding of how these forests will change with climatic variations, not only in terms of stocks but also in terms of metabolism or productivity represents perhaps a greater challenge. The differences among the biomass maps developed by [1,2,44] are possibly minor if compared with the uncertainties in those estimates. The availability of new products, such as the global carbon map and the global tree height map, [44] and [53], respectively, will certainly produce a strong “footprint” on the current state of the world’s forests. The development of such dataset for the next years will be important for the monitoring point of view, but remains uncertain if changes in biomass will be detectable with the available methods and at large scales.
In summary, by dividing the western Amazonia in north and south regions, we can conclude that north-western Amazonian forests presents lower wood specific gravity, small tree crown, greater proportions of large-leaved tree species, tree height varying from 26 to 38 meters, higher productivity and lower above ground biomass than the eastern regions. South-western forests differs from north western forests by presenting relatively lower biomass, lower proportion of large-leaved species and higher tree height. Eastern forests present higher wood density and higher above ground biomass, lower productivity, large tree crown, lowest proportions of large-leaved species and canopy height from 26 to 41 meters.
3. Vegetation Phenology
The term phenology is derived from Greek and means ‘to show or to appear’. In the ecological context, phenology is defined as the study of the seasonal timing of life cycle events [75], which can be critical for survival and reproduction of plants. Moreover, phenological characteristics of species reflect the influence of evolution and the environment on plant traits. These traits in turn have substantial implications for plant functioning at the level of the leaf, plant and ecosystem.
A complex mosaic of vegetation phenology is expected for the highly heterogeneous Amazonian forests as a result of differences in forest structure and composition associated with geomorphologycal and pedological conditions as well as variation in rainfall and radiation regimes.
In the next two sub-sections, I outline some evidence and discuss the phenological timing of canopy processes in Amazonia through the conceptual lens of field ecology, and the more recent insights from the remote sensing community. More specifically, the focus is on leaf phenology, as its periodicity, synchronicity and variability are still poorly understood and quantified.
3.1. Phenological Patterns Observed on the Ground
Evergreen, deciduous and semi-deciduous tropical tree species have leaves with different life spans. Some (not mutually exclusive) hypotheses that could explain how this cycle relates to environmental factors could be [76]: (a) competition for nutrients controls the senescence of individual leaves; (b) deciduous leaves evolved as a drought-avoidance mechanism; (c) the trade- off between leaf costs and benefits controls the life span; and (d) long-lived leaves have a high nutrient use efficiency (defined as total plant dry mass divided by foliar nitrogen or phosphorus mass). Aide [77] suggested that at a broader scale, some biotic factors could act on the leaf phenological cycle, and demonstrated that herbivores could influence leaf phenology of understory plants in a tropical forest in Panama, as 34% of the annual leaf production was observed during the dry season when insect abundance and damage to expanding leaves were lower.
The vegetation in the floodplains along the rivers in Amazonia is exposed to flood pulse hydrological regimes and experiences periodical inundation of large areas of forest. In these areas, there are two main vegetation formations: Várzeas and Igapós. Várzeas can be defined as forests flooded by white-water rivers (sediment rich rivers originating in the Andes), while Igapós are nutrient-poor areas flooded by black water Rivers (sediment poor, organic matter rich rivers originated in lowland forests) [78]. Despite the variability of phenological traits in these physiognomies, studies in central Amazonia suggest that the flush of new leaves in Várzea occurs in August in most species, while in the Igapó vegetation type, new leaves are flushed in July and August, and also in October, December and February [79–84].
Generalizations for temporal pattern of leaf production in Terra Firme forests are more difficult to perceive due to the lack of one strong event to mark or homogenize a signal to correlate with the vegetation response, such as the flood pulses in the forests along the rivers. Regular periods of low rainfall could act as such an event but unfortunately there is not a standardized way to define dry season in the literature, making more difficult an integrative analyses. For instance, the dry season definition can vary from the period of lower rainfall without a defined threshold ([73] and many others) to a very clear defined threshold, such rainfall less than 50 mm·month−1 [85] or less than 100 mm rain per month [86]. It has been suggested that dry season can be characterized by the periods during which evapotranspiration exceeds precipitation and the soil water available to plants declines [87] and 100 mm·month−1 rainfall could be used as a mean modeled threshold for Amazon evergreen forests [88].
In addition to temporal patterns of rainfall, seasonal variation in irradiance also occurs because of changes in cloud cover between dry and wet seasons and solar angle throughout the year and in different latitudes, affecting tropical forest canopies [13,89]. In a review of the literature, [90] suggested that tropical tree species could take advantage of maximum irradiance to produce new organs, conferring on them two main benefits (although co-varying environmental factors cannot be excluded). First, studies have shown that there is an increase of phenological activity and net primary production during the months of solar radiation peak when water is available. Secondly, leaf flush during the dry season would represent an advantage as insect activity and fungal pathogens are reduced during this period. More recent studies also support these hypotheses [14,91,92], although bimodal distributions of flushing of new leaves have been reported [91,93,94] as well as regions with negligible relationships between leaf production and leaf mortality with climate seasonality [95] and species with new leaves production during the wet season [96]. A recent review of litterfall seasonality in Amazonian forests demonstrated that it does not depend on annual rainfall across different sites in old growth forests nor on soil type [62]. However, their results showed significant positive relationships between litterfall seasonality and rainfall seasonality and higher litterfall production in forests growing on fertile soils than in forests growing in infertile soils in Amazonia.
In conclusion, the variability of leaf phenology in the Amazon is still poorly understood due to the high heterogeneity of forests types, the relative paucity of observational descriptions in the literature for such a large region and difficulties in inter-comparisons between events in the dry or wet seasons due to inconsistent definitions of seasons. Therefore, in the next section I explore how remote sensing data have been used to explore the temporal variation of phenological process covering large areas in Amazonia.
3.2. Phenological Patterns Derived from Remote Sensing
3.2.1. Background
Remote sensing technology offers a possible solution to the problem of collecting leaf data from the largest area of continuous forest on Earth. However, a potential obstacle to the acquisition of a multitemporal dataset for detecting vegetation phenology in the Amazon by satellite-derived vegetation indices is the influence of aerosols from biomass-burning [97,98] and clouds and cloud’s shades [99]. These problems are slowly becoming resolved through the use of a new generation of moderate-resolution sensors with more frequent coverage (e.g., daily) of Amazonia. These sensors represent a new opportunity for frequent and efficient assessment of natural changes in forest canopies. For instance, the Moderate Resolution Imaging Spectroradiometer (MODIS) instruments aboard the Terra (morning) and Aqua (afternoon) platforms provide consistent daily coverage of the entire globe at 250 m to 1 km resolution with 36 bands of spectral information since 2000 and 2001, respectively [100]. The MODIS instruments acquire images up to 4 times a day, with a swath width of approximately 2300 km. The data are geometrically and radiometrically rectified, and land-cover products are automatically generated for the monitoring of the earth surface, such as the daily and 8-day composite Surface Reflectance product (MOD09), 16-day composite Surface Reflectance and Vegetation Index product (MOD13), 8-day composite Leaf Area Index (MOD15), Vegetation Cover Conversion product (MOD44A), and the Vegetation Continuous Fields product (MOD44B).
Vegetation index images are the most widely used satellite data to monitor natural vegetation dynamics as they measure canopy greenness, a composite property of canopy structure, leaf area and canopy chlorophyll content [101]. Over the last several decades, vegetation monitoring at regional and global scales has been done with the Advanced Very High Resolution Radiometer (AVHRR) sensor data converted to Normalized Difference Vegetation Index (NDVI) images [102–108]. NDVI is defined as:
where ρNIR and ρRed are the reflectance of NIR and Red spectral bands.
In addition to the NDVI, the MODIS vegetation indices product also has the Enhanced Vegetation Index (EVI). NDVI has been intensively studied, and limitations including saturation in closed canopy and sensitivity to atmospheric aerosols and soil background have been reported [109,110]. In this sense, EVI was developed to minimize these effects, including the blue band for atmospheric correction, computed as (Equation (2)):
where ρNIR, ρRed and ρBlue are the reflectance in the NIR, Red and Blue channels respectively; 2.5 is a gain factor, 6 and 7.5 are coefficients designed to correct for aerosol scattering and absorption and 1 is a canopy background adjustment [111,112]. While NDVI is more sensitive to the absorbing chlorophyll bands (red) and to atmospheric properties such as clouds, water vapor solar illumination and satellite viewing geometry [113,114], EVI is more sensitive to canopy structural variations, including leaf area index [111].
3.2.2. Monitoring Forest Phenology
The first global dataset with high temporal resolution was acquired by the Advanced Very High Resolution Radiometer (AVHRR) sensor, onboard the TIROS-N satellite (launched in 1978) and National Oceanic and Atmospheric Administration (NOAA) series 6 through 14 (the latter launched in 1994) meteorological satellites. A number of vegetation indices were developed based on AVHRR images, including: the Normalized Difference Vegetation Index (NDVI) [115–118], the Vegetation Conditioning Index (VCI) [118,119], the Temperature Conditioning Index (TCI) [119,120], the Vegetation Health Index (VHI) [121], the NDVI-Land Surface Temperature (NDVI-LST) [122], the Drought Severity Index (DSI) and the Palmer Drought Severity Index (PDSI) [123–125].
Then, a more specific water sensitive index was developed, the normalized difference water index (NDWI) [126]. This index showed adequate potential for canopy-level water content estimation ([127–129] and others).
One of the first studies for the monitoring of Amazonian forests was carried out by [130]. Using daily NDVI images derived from NOAA AVHRR from 1982 to 1988, [130] found little or no cyclical pattern over the Amazon forest. They also reported a decline in the response of the vegetation index over the dense forested area over time, demonstrating the effects of the sensor degradation and the lack of sensor calibration. Liu et Kogan. [131] studied drought patterns in South America from 1985 to 1992 using AVHRR data. They found that NDVI and VCI agreed well with rainfall anomalies for the entire country. However, the relationship between NDVI and monthly rainfall in the tropical forest was weak and the drought dynamic patterns for both indices in this region were not strongly correlated with the meteorological precipitation anomaly data. Xiao et al. [132] carried out a correlation analysis between NOAA AVHRR NDVI and field meteorological stations in the Amazon evergreen forest, finding no relationships. However, during strong climatic events, such as El Niño and La Niña, changes in the amplitude of AVHRR NDVI over Amazonia suggest that the forest phenology is responsive to rainfall variation over seasonal and inter-annual time scales [106]. It has also been suggested that temporal variations in southern and eastern forests of Amazonia in the NOAA AVHRR NDVI data could be primarily associated with atmospheric variations such as clouds and aerosols [98].
The MODIS sensor, which has improved radiometric and atmospheric corrections in relation to the NDVI generated by the AVHRR sensor, has greatly contributed to the advances in the knowledge of the Amazon forest phenology. Studies evaluating the EVI for the Amazon evergreen forest captured for the first time a remarkable large-scale seasonal pattern. Huete et al. [74] observed an increase of 25% in EVI (enhanced leaves activity) in the sunnier dry season across Amazon forests, suggesting that sunlight may exert more influence than rainfall in the phenology of this forest. Results from the study performed by [133] using MODIS EVI also reinforce this result. Quantitative analysis of the MODIS LAI product for the Amazon forests demonstrated that changes in LAI are positively correlated with changes in solar radiation and negatively correlated with changes in precipitation, although the correlations between leaf area and radiation changes are larger and more numerous [66]. However, Poulter et al. [68] showed that the MODIS LAI seasonal differences are particularly sensitive to additional filtering for indirect aerosol and cloud effects, while the seasonal differences in EVI were less sensitive to the filtering methods evaluated.
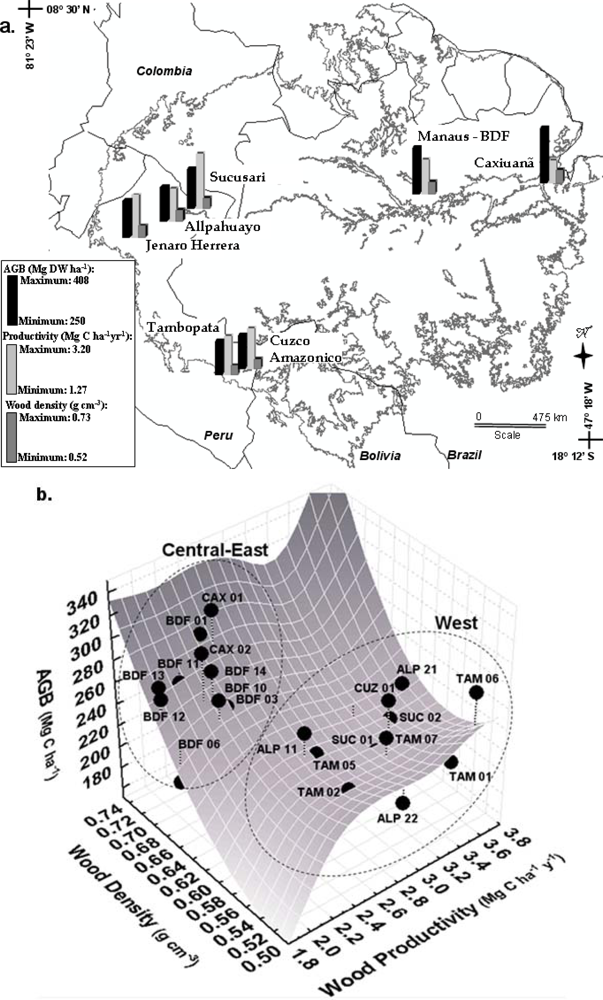
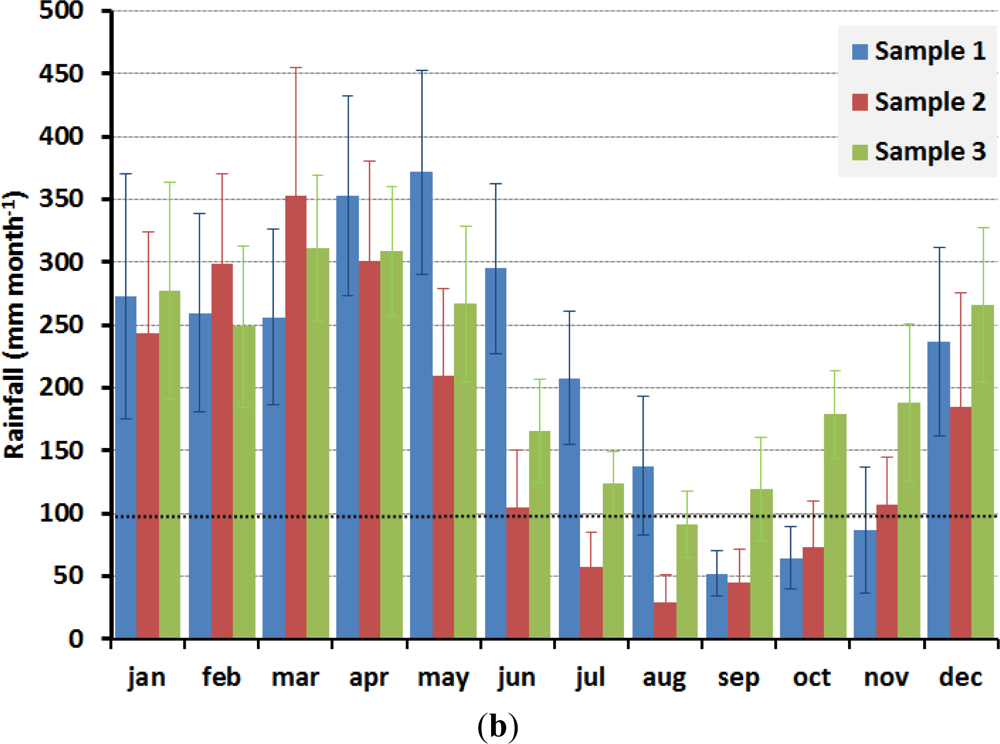
The large scale patterns observed on the new leaf production [66,74,133] encompasses many different forest types and these results do not agree with the observation of field studies, where peak in leaf flush has been observed during the dry, wet or dry and wet seasons in different forests in Amazonia. Although Brando et al. [134] observed a positive correlation between EVI with leaf flushing measured in the field in central-east Amazonia, EVI was relatively insensitive to changes in LAI. The increase in EVI during the dry season has also been attributed to solar illumination effects rather than changes in LAI; and changes in canopy foliage detected from MODIS LAI data were not consistent with LAI estimates from hemispherical photographs for a site in southern Amazonia [135]. Another criticism to the results presented by [66,74,133] is the fact that areas that exhibited higher indices during the dry season in their analysis are located in regions with dissimilar onset and end of the dry/wet season [136]. For example, areas that presented higher indices in their study are located in the north hemisphere in the Amazon region—north-east Amazonian forests—and have the dry season from September to November (sample 1, Figure 3); in center-east Brazilian Amazon—the Tapajós region, low rainfall occurs from July to October (sample 2, Figure 3), and central-west Brazilian Amazon presents low rainfall in August (sample 3, Figure 3). These contrasting results show that the large-scale extrapolation of a data collected from one site and with a reasonable agreement with the satellite image may not be valid for different regions. In addition, saturation and noise in the remote sensing dataset may cover the detection of changes in such dense canopy forests.
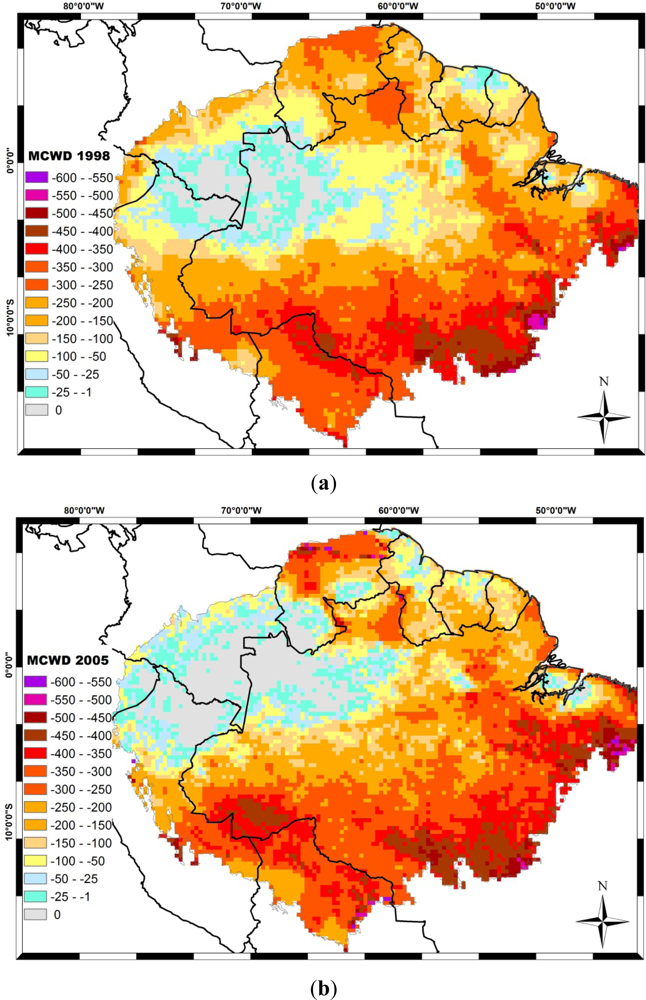
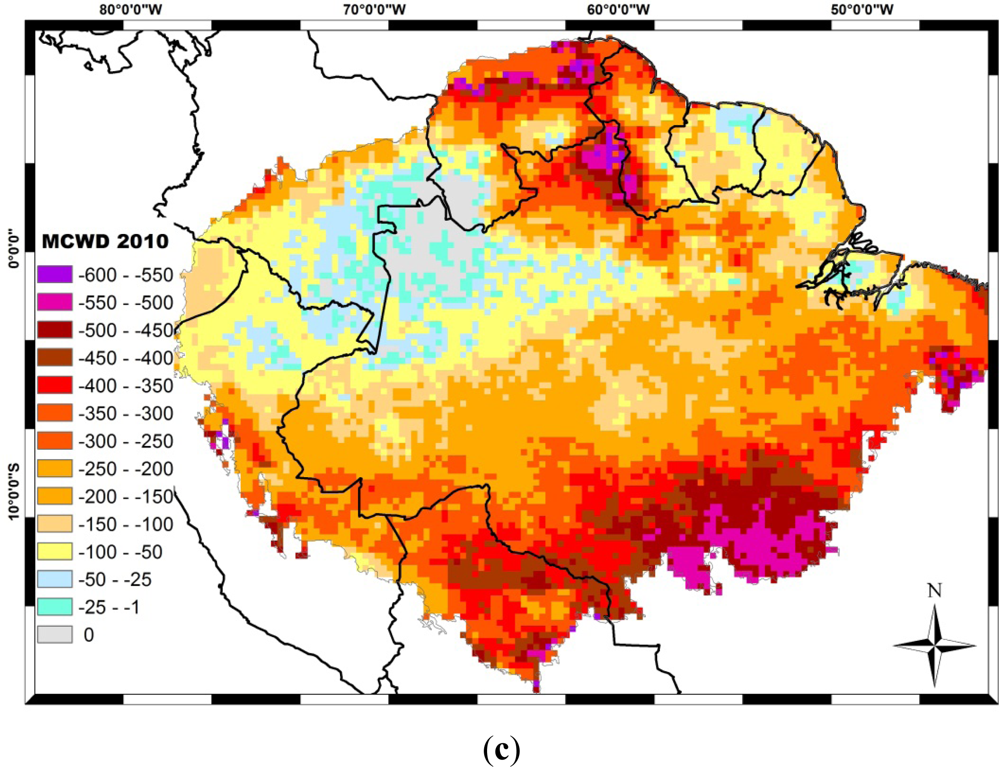
4. Drought Effects
The El Niño, associated with the low phase of the Southern Oscillation (SO), coincides with reduced Amazon rainfall, particularly in the northern and central regions. Opposite anomalies often occur during the high phase of the SO, related to La Niña. The 1997/98 drought during an El Niño year was considered the strongest in that century [137]. Differently from the El Niño–related droughts, during 2005, large sections of southwestern Amazonia were severely affected, and this drought was considered one of the most intense droughts of the last hundred years. The 2005 drought was driven by the warming of the tropical North Atlantic, combined with the reduced intensity in northeast trade wind moisture transport into southern Amazonia and the weakened upward motion over this section of Amazonia [138]. Five years later, another strong drought hit the Amazon. The 2010 drought started during an El Niño event in early austral summer of 2010 and then became more intense during La Niña in the austral winter dry season and the following spring. These three recent droughts affect different regions of the Amazon (Figure 4). In 1998, southwest regions of the Amazon, such as Bolivia and Rondonia state in Brazil, and north-eastern regions such as Roraima state were deeply affected. In 2005, the MAP region (Madre de Dios in Peru, Acre in Brazil and Pando in Bolivia) were the most severe affect region. In 2010, both central-north and central-south Amazonia were the most affected areas, covering Roraima and Mato Grosso states in Brazil and Guiana.
Long term measurements in central Amazonia showed that the 97/98 ENSO drought increased the tree mortality (1.91%) in comparison with 5- to 13-year measurements average (1.12%), and that trees that died due to the drought did not differ significantly in size or species composition from those that died previously [139].
After the 2005 drought extreme, the first study published was carried out by [140]. They evaluated the anomalies in the EVI generated from the MODIS c4 collection during the driest quarter of 2005 and found a significant increase in the EVI during the peak, rather than a decline. This was interpreted as a possible increase in productivity during the drought period. However, two years later a study based on field measurements evaluating the impact of the 2005 drought demonstrated that plots most affected by the rainfall suppression exhibited a decline in the rate of net aboveground biomass accumulation, and those losses were driven by occasionally large mortality increases and by widespread decline in growth [141]. More information on the effects of droughts in the Amazon can be found in the special issue of the New Phytologist, volume 187, issue 3, 2011. These contrasting results intrigued the scientific community and a re-assessment of the EVI processing was carried out by [142]. The authors reported differences with respect to the area and intensity of the 2005 increase in the EVI between results obtained from the c4 and c5 product and thus contested [140] results. Anderson et al. [143] also evaluated the anomalies in the EVI c5, and found only small and scattered areas with increase in this index. Moreover, Anderson et al. [143] showed that areas with positive anomalies in EVI presented positive anomaly in tree mortality, an indication that the increase in the EVI could be related to changes in the canopy structure. This result is also supported by a previous study where it is shown that the decline in the shade fraction is highly associated with the increase in EVI [144]. There is no conclusive result that fully explains what drove the increase in EVI during the 2005 drought. Although image processing artifacts could explain part of this result [142], no relationship was found between areas with EVI anomalies and areas with anomalies in atmospheric optical depth (a measurement of airborne particles, such as dust, cloud droplet, ice particles, biomass smoke, etc.) [143].
The preliminary study on the effects of the 2010 drought estimates a higher impact on the forests than the 2005 drought [145], and an evaluation of MODIS vegetation indices observed a decline in the greenness in an area four times greater (2.4 million km2), more severe than in 2005 and that persisted even after the return of normal rainfall levels, unlike in 2005 [146]. There is no study published based on field measurements yet, but a cumulative effect of the droughts could be expected.
In addition to the effects measured in primary forests, droughts also play a major role on the increase in fire susceptibility in Amazonian forests. It has been estimated that fires in the Amazon increased by 42% from 1998 to 2006 [147], with highest incidence in the arc of deforestation [148]. For instance, the 1997/98 drought affected the savannahs in Roraima, as 53% of the area burned in 1997/1998 in contrast to 1998/1999 (a wet year: 30% burned) and 1999/2000 (a normal year: 36% burned) [139]. From the 6,500 km2 of land surface burnt in Acre State during the 2005 drought, 2,800 km2 corresponded to areas of standing forests [149]. A great spread of fires on primary forests and forest fragments can also be expected to have occurred in 2010, as one of the most affected regions is located in the arc of deforestation. Therefore, fires can be considered an active factor for large-scale changes in forest structure and dynamics in this biome.
5. Future Directions
The improvements in remote sensing data and techniques, and the effort to install and monitor long-term ecological sites are necessary to answer local and regional questions. Integrative analyses are still very restricted, and probably are the next challenge to improve our knowledge of Amazonian.
Multi-collaborative projects in Amazonia have a successful history on acquiring, documenting, publishing and sharing ecological data. Examples of these programs include the Biological Dynamics of Forest Fragments Project (BDFFP), Center for Tropical Forest Science (CTFS), Tropical Ecology Assessment and Monitoring Initiative (TEAM), the Amazon Forest Inventory Network (RAINFOR), among others. However, due to the unlikely possibility of setting a randomly distributed network of field plots covering the Amazonian landscapes, remote sensing data can play a key role. For example, one step that could be adopted by scientist is the landscape evaluation of the area where they intend to set a new plot/site. Landsat data has proven to be adequate for detecting different forest physiognomies in dense Amazonian forests [45,150,151], and it has been released free of charge by the National Institute for Space Research (INPE).
A better documentation and standardization of field data and protocols is also needed. Although field courses, workshops and technical training has been shown to be highly effective, the limited resources requires a better use of the advances in the World Wide Web, such as to improve communication and data sharing (e.g., [152]) or to provide more details on site and data collections (e.g., using the on-line Supporting Information section of scientific journals).
The temporal scale for monitoring the different components of the Amazonian forests is a key issue for remote sensing data integration. Although for the quantification of above ground biomass, forest growth and recruitment, and changes in species composition can be achieved with inter-census intervals of 2 or more years, the understanding of canopy processes, such as direct observation of leaf phenology requires intensives measurements. Monthly images derived from remote sensing datasets showed to detect changes in the canopy of densely vegetated areas of Amazonia, and the validation of these observations are necessary. Despite increasing the costs for setting a plot with monthly measurements, this information is essential for the understanding of how tropical forests are responding to changing environmental factors.
As drought frequency has been predicted to increase in the Amazon, it is also expected that fires will increase. Techniques, such as the linear un-mixing model have proved adequate to detect burn scars in primary forests. However, the development of a methodology to detect the levels of susceptibility of primary forest to fires would be a great contribution, as it could be used as an “alert system” of forest flammability. Nonetheless, to achieve this objective, more research that combines both remote sensing and field measurements over burnt areas are necessary to fully understand the local factors and conditions that triggers the spread of fires and its intensity on primary forests.
Acknowledgments
The author thanks the AMAZONICA Project (Natural Environment Research Council NERC/grant: NE/F005806/1).
References
- Malhi, Y.; Wood, D.; Baker, T.R.; Wright, J.; Phillips, O.L.; Cochrane, T.; Meir, P.; Chave, J.; Almeida, S.; Arroyo, L.; et al. Regional variation of above-ground live biomass in old-growth Amazonian forests. Glob. Change Biol 2006, 12, 1–32. [Google Scholar]
- Saatchi, S.S.; Houghton, R.A.; Dos Santos Alvala, R.C.; Soares, J.V.; Yu, Y. Distribution of aboveground live biomass in the Amazon basin. Glob. Change Biol 2007, 13, 816–837. [Google Scholar]
- Field, C.B.; Behrenfeld, M.J.; Randerson, J.T.; Falkowski, P. Primary production of the biosphere: Integrating terrestrial and oceanic components. Science 1998, 281, 237–240. [Google Scholar]
- Malhi, Y.; Grace, J. Tropical forests and atmospheric carbon dioxide. Trends Ecol. Evol 2000, 15, 332–337. [Google Scholar]
- Grace, J. Understanding and managing the global carbon cycle. J. Ecol 2004, 92, 189–202. [Google Scholar]
- Keller, M.; Alencar, A.; Asner, G.P.; Braswell, B.; Bustamente, M.; Davidson, E.; Feldpausch, T.; Fernándes, E.; Goulden, M.; Kabat, P.; et al. Ecological research in the Large-scale Biosphere–Atmosphere experiment in Amazonia: Early results. Ecol. Appl 2004, 14, 3–16. [Google Scholar]
- Magnusson, W.E.; Costa, F.; Lima, A.; Baccaro, F.; Braga-Neto, R.; Laerte Romero, R.; Menin, M.; Penha, J.; Hero, J.-M.; Lawson, B.E. A program for monitoring biological diversity in the Amazon: An alternative perspective to threat-based monitoring. Biotropica 2008, 40, 409–411. [Google Scholar]
- Gedney, N.; Valdes, P.J. The effect of Amazonian deforestation on the northern hemisphere circulation and climate. Geophys. Res. Lett 2000, 27, 3053–3056. [Google Scholar]
- Werth, D.; Avissar, R. The local and global effects of Amazon deforestation. J. Geophys. Res 2002, 107, 8087. [Google Scholar]
- Freitas, S.; Longo, K.; Silva Dias, M.; Silva Dias, P.; Chatfield, R.; Prins, E.; Artaxo, P.; Grell, G.; Recuero, F. Monitoring the transport of biomass burning emissions in South America. Environ. Fluid Mech 2005, 5, 135–167. [Google Scholar]
- ter Steege, H.; Pitman, N.C.A.; Phillips, O.L.; Chave, J.; Sabatier, D.; Duque, A.; Molino, J.-F.; Prevost, M.-F.; Spichiger, R.; Castellanos, H.; et al. Continental-scale patterns of canopy tree composition and function across Amazonia. Nature 2006, 443, 444–447. [Google Scholar]
- Malhado, A.C.M.; Whittaker, R.J.; Malhi, Y.; Ladle, R.J.; ter Steege, H.; Butt, N.; Aragão, L.E.O.C.; Quesada, C.A.; Murakami-Araujo, A.; Phillips, O.L.; et al. Spatial distribution and functional significance of leaf lamina shape in Amazonian forest trees. Biogeosciences 2009, 6, 1577–1590. [Google Scholar]
- Fyllas, N.M.; Patiño, S.; Baker, T.R.; Bielefeld Nardoto, G.; Martinelli, L.A.; Quesada, C.A.; Paiva, R.; Schwarz, M.; Horna, V.; Mercado, L.M.; et al. Basin-wide variations in foliar properties of Amazonian forest: Phylogeny, soils and climate. Biogeosciences 2009, 6, 2677–2708. [Google Scholar]
- Graham, E.A.; Mulkey, S.S.; Kitajima, K.; Phillips, N.G.; Wright, S.J. Cloud cover limits net CO2 uptake and growth of a rainforest tree during tropical rainy seasons. Proc. Natl. Acad. Sci. USA 2003, 100, 572–576. [Google Scholar]
- Oliveira, P.H.F.; Artaxo, P.; Pires, C.; De Lucca, S.; Procopio, A.; Holben, B.; Schafer, J.; Cardoso, L.F.; Wofsy, S.C.; Rocha, H.R. The effects of biomass burning aerosols and clouds on the CO2 flux in Amazonia. Tellus 2007, 59B, 338–349. [Google Scholar]
- Quesada, C.A.; Lloyd, J.; Schwarz, M.; Baker, T.R.; Phillips, O.L.; Patiño, S.; Czimczik, C.; Hodnett, M.G.; Herrera, R.; Arneth, A.; et al. Regional and large-scale patterns in Amazon forest structure and function are mediated by variations in soil physical and chemical properties. Biogeosci. Discuss 2009, 6, 3993–4057. [Google Scholar] [Green Version]
- Clark, D.A. Detecting tropical forests’ responses to global climatic and atmospheric change: Current challenges and a way forward. Biotropica 2007, 39, 4–19. [Google Scholar]
- Fearnside, P.M. Greenhouse gases from deforestation in Brazilian Amazonia: Net committed emissions. Climate Change 1997, 35, 321–360. [Google Scholar]
- Brown, S.; Lugo, A.E. Biomass of tropical forests: A new estimate based on forest volumes. Science 1984, 223, 1290–1293. [Google Scholar]
- Chave, J.; Condit, R.; Aguilar, S.; Hernandez, A.; Lao, S.; Perez, R. Error propagation and scaling for tropical forest biomass estimates. Philos. Trans. R. Soc. Lond. Ser. B 2004, 359, 409–420. [Google Scholar]
- Enquist, B.; West, G.; Charnov, E.; Brown, J. Allometric scaling of production and life-history variation in vascular plants. Nature 1999, 401, 907–911. [Google Scholar]
- Roderick, M.L.; Berry, S.L. Linking wood density with tree growth and environment: A theoretical analysis based on the motion of water. New Phytol 2001, 149, 473–485. [Google Scholar]
- Baker, T.R.; Phillips, O.L.; Malhi, Y.; Almeida, S.; Arroyo, L.; Di Fiore, A.; Erwin, T.; Higuchi, N.; Killeen, T.J.; Laurance, S.G.; et al. Increasing biomass in Amazonian forest plots. Philos. Trans. R. Soc. Lond. Ser. B 2004, 359, 353–365. [Google Scholar]
- Muller-Landau, H.C. Interspecific and inter-site variation in wood specific gravity of tropical trees. Biotropica 2004, 36, 20–32. [Google Scholar]
- Nogueira, E.M.; Fearnside, P.M.; Nelson, B.W.; Barbosa, R.I.; Keizer, E.W.H. Estimates of forest biomass in the Brazilian Amazon: New allometric equations and adjustments to biomass from wood-volume inventories. For. Ecol. Manage 2008, 256, 1853–1867. [Google Scholar]
- Chao, K.-J.; Phillips, O.L.; Gloor, E.; Monteagudo, A.; Torres-Lezama, A.; Martínez, R.V. Growth and wood density predict tree mortality in Amazon forests. J. Ecol 2008, 96, 281–292. [Google Scholar]
- Baker, T.R.; Phillips, O.L.; Malhi, Y.; Almeida, S.; Arroyo, L.; Di Fiore, A.; Erwin, T.; Killeen, T.J.; Laurance, S.G.; Laurance, W.F.; et al. Variation in wood density determines spatial patterns in Amazonian forest biomass. Glob. Change Biol 2004, 10, 545–562. [Google Scholar]
- ter Steege, H.; Hammond, D.S. Character convergence, diversity, and disturbance in tropical rain forest in Guyana. Ecology 2001, 82, 3197–3212. [Google Scholar]
- Keller, M.; Palace, M.; Hurtt, G. Biomass estimation in the Tapajos National Forest, Brazil: Examination of sampling and allometric uncertainties. For. Ecol. Manage 2001, 154, 371–382. [Google Scholar]
- Chave, J.; Andalo, C.; Brown, S.; Cairns, M.; Chambers, J.; Eamus, D.; Fölster, H.; Fromard, F.; Higuchi, N.; Kira, T.; et al. Tree allometry and improved estimation of carbon stocks and balance in tropical forests. Oecologia 2005, 145, 87–99. [Google Scholar]
- Brown, S.; Lugo, A.E. Aboveground biomass estimates for tropical moist forests of the Brazilian Amazon. Interciencia 1992, 17, 8–18. [Google Scholar]
- Chave, J.; Riera, B.; Dubois, M.-A. Estimation of biomass in a Neotropical forest of French Guiana: Spatial and temporal variability. J. Trop. Ecol 2001, 17, 79–96. [Google Scholar]
- Cummings, D.L.; Boone Kauffman, J.; Perry, D.A.; Flint Hughes, R. Aboveground biomass and structure of rainforests in the southwestern Brazilian Amazon. For. Ecol. Manage 2002, 163, 293–307. [Google Scholar]
- de Castilho, C.V.; Magnusson, W.E.; de Araújo, R.N.O.; Luizão, R.C.C.; Luizão, F.J.; Lima, A.P.; Higuchi, N. Variation in aboveground tree live biomass in a central Amazonian Forest: Effects of soil and topography. For. Ecol. Manage 2006, 234, 85–96. [Google Scholar]
- DeFries, R.S.; Townshend, J.R.G.; Hansen, M.C. Continuous fields of vegetation characteristics at the global scale at 1-km resolution. J. Geophys. Res 1999, 104, 16911–16923. [Google Scholar]
- Potter, C.; Brooks Genovese, V.; Klooster, S.; Bobo, M.; Torregrosa, A. Biomass burning losses of carbon estimated from ecosystem modelling and satellite data analysis for the Brazilian Amazon region. Atmos. Environ 2001, 35, 1773–1781. [Google Scholar]
- Lu, D. Aboveground biomass estimation using Landsat TM data in the Brazilian Amazon. Int. J. Remote Sens 2005, 26, 2509–2525. [Google Scholar]
- Houghton, R.A.; Lawrence, K.T.; Hackler, J.L.; Brown, S. The spatial distribution of forest biomass in the Brazilian Amazon: A comparison of estimates. Glob. Change Biol 2001, 7, 731–746. [Google Scholar]
- Ramankutty, N.; Gibbs, H.K.; Achard, F.; Defries, R.; Foley, J.A.; Houghton, R.A. Challenges to estimating carbon emissions from tropical deforestation. Glob. Change Biol 2007, 13, 51–66. [Google Scholar]
- Nelson, R.F.; Kimes, D.S.; Salas, W.A.; Routhier, M. Secondary forest age and tropical forest biomass estimation using thematic mapper imagery. BioScience 2000, 50, 419–431. [Google Scholar]
- Foody, G.M.; Boyd, D.S.; Cutler, M.E.J. Predictive relations of tropical forest biomass from Landsat TM data and their transferability between regions. Remote Sens. Environ 2003, 85, 463–474. [Google Scholar]
- Defries, R.S.; Hansen, M.C.; Townshend, J.R.G.; Janetos, A.C.; Loveland, T.R. A new global 1-km dataset of percentage tree cover derived from remote sensing. Glob. Change Biol 2000, 6, 247–254. [Google Scholar]
- Le Toan, T.; Quegan, S.; Davidson, M.W.J.; Balzter, H.; Paillou, P.; Plummer, S.; Papathanassiou, K.; Rocca, F.; Saatchi, S.; Shugart, H.; et al. The BIOMASS mission: Mapping global forest biomass to better understand the terrestrial carbon cycle. Remote Sens. Environ 2011, 115, 2850–2860. [Google Scholar]
- Saatchi, S.; Harris, N.L.; Brown, S.; Lefsky, M.; Mitchard, E.T.A.; Salas, W.; Zutta, B.R.; Buermann, W.; Lewis, S.L.; Hagen, S.; et al. Benchmark map of forest carbon stocks in tropical regions across three continents. Proc. Natl. Acad. Sci. USA 2011. [Google Scholar] [CrossRef]
- Anderson, L.O.; Malhi, Y.; Ladle, R.J.; Aragão, L.E.O.C.; Shimabukuro, Y.; Phillips, O.L.; Baker, T.; Costa, A.C.L.; Espejo, J.S.; Higuchi, N.; et al. Influence of landscape heterogeneity on spatial patterns of wood productivity, wood specific density and above ground biomass in Amazonia. Biogeosciences 2009, 6, 1883–1902. [Google Scholar]
- Foody, G.M.; Green, R.M.; Lucas, R.M.; Curran, P.J.; Honzak, M.; Amaral, I.D. Observations on the relationship between SIR-C radar backscatter and the biomass of regenerating tropical forests. Int. J. Remote Sens 1997, 18, 687–694. [Google Scholar]
- Luckman, A.; Baker, J.; Honzak, M.; Lucas, R. Tropical forest biomass density estimation using JERS-1 SAR: Seasonal variation, confidence limits, and application to image mosaics. Remote Sens. Environ 1998, 63, 126–139. [Google Scholar]
- Santos, J.R.; Freitas, C.C.; Araujo, L.S.; Dutra, L.V.; Mura, J.C.; Gama, F.F.; Soler, L.S.; Sant’Anna, S.J.S. Airborne P-band SAR applied to the aboveground biomass studies in the Brazilian tropical rainforest. Remote Sens. Environ 2003, 87, 482–493. [Google Scholar]
- Gonçalves, F.G.; Santos, J.R.; Treuhaft, R.N. Stem volume of tropical forests from polarimetric radar. Int. J. Remote Sens 2011. [Google Scholar] [CrossRef]
- Goetz, S.; Baccini, A.; Laporte, N.; Johns, T.; Walker, W.; Kellndorfer, J.; Houghton, R.; Sun, M. Mapping and monitoring carbon stocks with satellite observations: A comparison of methods. Carbon Balance Manage 2009, 4, 2. [Google Scholar]
- Midgley, J.J. Is bigger better in plants? The hydraulic costs of increasing size in trees. Trends Evol. Ecol 2003, 18, 5–6. [Google Scholar]
- Lefsky, M.A. A global forest canopy height map from the moderate resolution imaging spectroradiometer and the geoscience laser altimeter system. Geophys. Res. Lett 2010, 37, L15401. [Google Scholar]
- Simard, M.; Pinto, N.; Fisher, J.B.; Baccini, A. Mapping forest canopy height globally with spaceborne lidar. J. Geophys. Res 2011. [Google Scholar] [CrossRef]
- Dubayah, R.O.; Sheldon, S.L.; Clark, D.B.; Hofton, M.A.; Blair, J.B.; Hurtt, G.C.; Chazdon, R.L. Estimation of tropical forest height and biomass dynamics using lidar remote sensing at La Selva, Costa Rica. J. Geophys. Res 2010. [Google Scholar] [CrossRef]
- Barbier, N.; Couteron, P.; Proisy, C.; Malhi, Y.; Gastellu-Etchegorry, J.-P. The variation of apparent crown size and canopy heterogeneity across lowland Amazonian forests. Glob. Ecol. Biogeogr 2010, 19, 72–84. [Google Scholar]
- Malhado, A.C.M.; Malhi, Y.; Whittaker, R.J.; Ladle, R.J.; ter Steege, H.; Phillips, O.L.; Butt, N.; Aragão, L.E.O.C.; Quesada, C.A.; Araujo-Murakami, A.; et al. Spatial trends in leaf size of Amazonian rainforest trees. Biogeosciences 2009, 6, 1563–1576. [Google Scholar]
- Kerkhoff, A.J.; Enquist, B.J. Ecosystem allometry: The scaling of nutrient stocks and primary productivity across plant communities. Ecol. Lett 2006, 9, 419–427. [Google Scholar]
- Clark, D.A.; Brown, S.; Kicklighter, D.W.; Chambers, J.Q.; Thomlinson, J.R.; Ni, J.; Holland, E.A. Net primary production in tropical forests: An evaluation and synthesis of existing field data. Ecol. Appl 2001, 11, 371–384. [Google Scholar]
- Nepstad, D.C.; Moutinho, P.; Dias-Filho, M.B.; Davidson, E.; Cardinot, G.; Markewitz, D.; Figueiredo, R.; Vianna, N.; Chambers, J.; Ray, D.; et al. The effects of partial throughfall exclusion on canopy processes, aboveground production, and biogeochemistry of an Amazon forest. J. Geophys. Res.-Atmos 2002, 107, 8085:1–8085:18. [Google Scholar]
- Malhi, Y.; Baker, T.R.; Phillips, O.L.; Almeida, S.; Alvarez, E.; Arroyo, L.; Chave, J.; Czimczik, C.I.; Fiore, A.D.; Higuchi, N.; et al. The above-ground coarse wood productivity of 104 Neotropical forest plots. Glob. Change Biol 2004, 10, 563–591. [Google Scholar]
- Aragão, L.E.O.C.; Malhi, Y.; Metcalfe, D.B.; Silva-Espejo, J.E.; Jiménez, E.; Navarrete, D.; Almeida, S.; Costa, A.C.L.; Salinas, N.; Phillips, O.L.; et al. Above- and below-ground net primary productivity across ten Amazonian forests on contrasting soils. Biogeosciences 2009, 6, 2759–2778. [Google Scholar]
- Chave, J.; Navarrete, D.; Almeida, S.; Álvarez, E.; Aragão, L.E.O.C.; Bonal, D.; Châtelet, P.; Silva Espejo, J.; Goret, J.Y.; von Hildebrand, P.; et al. Regional and temporal patterns of litterfall in tropical South America. Biogeosciences 2010, 7, 43–55. [Google Scholar]
- Metcalfe, D.; Meir, P.; Aragão, L.; da Costa, A.; Braga, A.; Gonçalves, P.; de Athaydes Silva Junior, J.; de Almeida, S.; Dawson, L.; Malhi, Y.; et al. The effects of water availability on root growth and morphology in an Amazon rainforest. Plant Soil 2008, 311, 189–199. [Google Scholar]
- Ichii, K.; Maruyama, M.; Yamaguchi, Y. Multi-temporal analysis of deforestation in Rondonia state in Brazil using Landsat MSS, TM, ETM plus and NOAA AVHRR imagery and its relationship to changes in the local hydrological environment. Int. J. Remote Sens 2003, 24, 4467–4479. [Google Scholar]
- Nemani, R.R.; Keeling, C.D.; Hashimoto, H.; Jolly, W.M.; Piper, S.C.; Tucker, C.J.; Myneni, R.B.; Running, S.W. Climate-driven Increases in global terrestrial net primary production from 1982 to 1999. Science 2003, 300, 1560–1563. [Google Scholar]
- Myneni, R.B.; Yang, W.; Nemani, R.R.; Huete, A.R.; Dickinson, R.E.; Knyazikhin, Y.; Didan, K.; Fu, R.; Negrón Juárez, R.I.; Saatchi, S.S.; et al. Large seasonal swings in leaf area of Amazon rainforests. Proc. Natl. Acad. Sci. USA 2007, 104, 4820–4823. [Google Scholar]
- Running, S.W.; Nemani, R.R.; Heinsch, F.A.; Zhao, M.; Reeves, M.; Hashimoto, H. A continuous satellite-derived measure of global terrestrial primary production. BioScience 2008, 54, 547–560. [Google Scholar]
- Poulter, B.; Cramer, W. Satellite remote sensing of tropical forest canopies and their seasonal dynamics. Int. J. Remote Sens 2009, 30, 6575–6590. [Google Scholar]
- Malhi, Y.; Aragão, L.E.O.C.; Metcalfe, D.B.; Paiva, R.; Quesada, C.A.; Almeida, S.; Anderson, L.; Brando, P.; Chambers, J.Q.; Da Costa, A.C.L.; et al. Comprehensive assessment of carbon productivity, allocation and storage in three Amazonian forests. Glob. Change Biol 2009, 15, 1255–1274. [Google Scholar]
- Potter, C.; Klooster, S.; de Carvalho, C.R.; Genovese, V.B.; Torregrosa, A.; Dungan, J.; Bobo, M.; Coughlan, J. Modelling seasonal and interannual variability in ecosystem carbon cycling for the Brazilian Amazon region. J. Geophys. Res 2001, 106, 10423–10446. [Google Scholar]
- Tian, H.; Melillo, J.M.; Kicklighter, D.W.; McGuire, A.D.; Helfrich, J.V.K.; Moore, B.; Vorosmarty, C.J. Effect of interannual climate variability on carbon storage in Amazonian ecosystems. Nature 1998, 396, 664–667. [Google Scholar]
- Sommer, R.; Fölster, H.; Vielhauer, K.; Carvalho, E.J.M.; Vlek, P.L.G. Deep soil water dynamics and depletion by secondary vegetation in the Eastern Amazon. Soil Sci. Soc. Am. J 2003, 67, 1672–1686. [Google Scholar]
- Rivera, G.; Elliott, S.; Caldas, L.; Nicolossi, G.; Coradin, V.; Borchert, R. Increasing day-length induces spring flushing of tropical dry forest trees in the absence of rain. Trees Struct. Funct 2002, 16, 445–456. [Google Scholar]
- Huete, A.R.; Didan, K.; Shimabukuro, Y.E.; Ratana, P.; Saleska, S.R.; Hutyra, L.R.; Yang, W.; Nemani, R.R.; Myneni, R. Amazon rainforests green-up with sunlight in dry season. Geophys. Res. Lett 2006, 33. [Google Scholar] [CrossRef]
- Rathcke, B.; Lacey, E.P. Phenological patterns of terrestrial plants. Annu. Rev. Ecol. Syst 1985, 16, 179–214. [Google Scholar]
- Chabot, B.F.; Hicks, D.J. The ecology of leaf life spans. Annu. Rev. Ecol. Syst 1982, 13, 229–259. [Google Scholar]
- Aide, T.M. Herbivory as a selective agent on the timing of leaf production in a tropical understory community. Nature 1988, 336, 574–575. [Google Scholar]
- Prance, G. Notes on the vegetation of Amazonia III. The terminology of Amazonian forest types subject to inundation. Brittonia 1979, 31, 26–38. [Google Scholar]
- Peres, C.A. Primate responses to phenological changes in an Amazonian terra firme forest. Biotropica 1994, 26, 98–112. [Google Scholar]
- Ferreira, L.; Parolin, P. Tree phenology in central Amazonian Floodplain forests: Effects of water level Fluctuation and precipitation at community and population level. Pesquisas Botânica 2007, 58, 139–156. [Google Scholar]
- Gribel, R.; Gibbs, P.E.; Queiroz, A.L. Flowering phenology and pollination biology of Ceiba pentandra (Bombacaceae) in Central Amazonia. J. Trop. Ecol 1999, 15, 247–263. [Google Scholar]
- Parolin, P. Phenology and CO2-assimilation of trees in Central Amazonian floodplains. J. Trop. Ecol 2000, 16, 465–473. [Google Scholar]
- Haugaasen, T.; Peres, C.A. Mammal assemblage structure in Amazonian flooded and unflooded forests. J. Trop. Ecol 2005, 21, 133–145. [Google Scholar]
- Parolin, P.; Armbruster, N.; Junk, W.J. Two Amazonian floodplain trees react differently to periodical flooding. Trop. Ecol 2006, 47, 243–250. [Google Scholar]
- Basset, Y. Insect herbivores foraging on seedlings in an unlogged rain forest in Guyana: Spatial and temporal considerations. Stud. Neotrop. Fauna E 2000, 35, 115–129. [Google Scholar]
- Brienen, R.; Zuidema, P. Relating tree growth to rainfall in Bolivian rain forests: A test for six species using tree ring analysis. Oecologia 2005, 146, 1–12. [Google Scholar]
- Borchert, R. Responses of tropical trees to rainfall seasonality and its long-term changes. Climate Change 1998, 39, 381–393. [Google Scholar]
- Aragão, L.E.O.C.; Malhi, Y.; Roman-Cuesta, R.M.; Saatchi, S.; Anderson, L.O.; Shimabukuro, Y.E. Spatial patterns and fire response of recent Amazonian droughts. Geophys. Res. Lett 2007, 34, L07701. [Google Scholar] [CrossRef]
- Stubblebine, W.; Langenheim, J.H.; Lincoln, D. Vegetative response to photoperiod in the tropical leguminous tree hymenaea courbaril L. Biotropica 1978, 10, 18–29. [Google Scholar]
- Wright, S.J.; van Schaik, C.P. Light and the phenology of tropical trees. Am. Nat 1994, 143, 192–199. [Google Scholar]
- Mulkey, S.S.; Kitajima, K.; Wright, S.J. Plant physiological ecology of tropical forest canopies. Trends Ecol. Evol 1996, 11, 408–412. [Google Scholar]
- Brando, P.; Ray, D.; Nepstad, D.; Cardinot, G.; Curran, L.; Oliveira, R. Effects of partial throughfall exclusion on the phenology of Coussarea racemosa (Rubiaceae) in an east-central Amazon rainforest. Oecologia 2006, 150, 181–189. [Google Scholar]
- Defler, T.; Defler, S. Diet of a group of Lagothrix Lagothricha Lagothricha in southeastern Colombia. Int. J. Primatol 1996, 17, 161–190. [Google Scholar]
- Kitajima, K.; Mulkey, S.S.; Wright, S.J. Seasonal leaf phenotypes in the canopy of a tropical dry forest: Photosynthetic characteristics and associated traits. Oecologia 1997, 109, 490–498. [Google Scholar]
- Reich, P.B.; Uhl, C.; Walters, M.B.; Prugh, L.; Ellsworth, D.S. Leaf demography and phenology in Amazonian rain forest: A census of 40 000 leaves of 23 tree species. Ecol. Monogr 2004, 74, 3–23. [Google Scholar]
- Ruiz, J.E.A.; da Cruz Alencar, J. Interpretação fenológica de cinco espécies de Chrysobalanaceae na Reserva Florestal Adolpho Ducke, Manaus, Amazonas, Brasil. Acta Amazonica 1999, 29, 223–242. [Google Scholar]
- Miura, T.; Huete, A.R.; van Leeuwen, W.J.D.; Didan, K. Vegetation detection through smoke-filled AVIRIS images: An assessment using MODIS band passes. J. Geophys. Res 1998, 103, 32001–32011. [Google Scholar]
- Kobayashi, H.; Dye, D.G. Atmospheric conditions for monitoring the long-term vegetation dynamics in the Amazon using normalized difference vegetation index. Remote Sens. Environ 2005, 97, 519–525. [Google Scholar]
- Asner, G.P. Cloud cover in Landsat observations of the Brazilian Amazon. Int. J. Remote Sens 2001, 22, 3855–3862. [Google Scholar]
- Justice, C.O.; Townshend, J.R.G.; Vermote, E.F.; Masuoka, E.; Wolfe, R.E.; Saleous, N.; Roy, D.P.; Morisette, J.T. An overview of MODIS Land data processing and product status. Remote Sens. Environ 2002, 83, 3–15. [Google Scholar]
- Myneni, R.B.; Hall, F.G.; Sellers, P.J.; Marshak, A.L. Marshak.. The interpretation of spectral vegetation indexes. IEEE Trans. Geosci. Remote Sens 1995, 33, 481–486. [Google Scholar]
- Spanner, M.A.; Pierce, L.L.; Running, S.W.; Peterson, D.L. The seasonality of AVHRR data of temperate coniferous forests: Relationship with leaf area index. Remote Sens. Environ 1990, 33, 97–112. [Google Scholar]
- Reed, B.C.; Brown, J.F.; VanderZee, D.; Loveland, T.R.; Merchant, J.W.; Ohlen, D.O. Measuring phenological variability from satellite imagery. J. Veg. Sci 1994, 5, 703–714. [Google Scholar]
- Batista, G.T.; Shimabukuro, Y.E.; Lawrence, W.T. The Long-term monitoring of vegetation cover in the Amazon region in Northern Brazil using NOAA-AVHRR data. Int. J. Remote Sens 1997, 18, 3195–3210. [Google Scholar]
- Duchemin, B.; Guyon, D.; Lagouarde, J.P. Potential and limits of NOAA-AVHRR temporal composite data for phenology and water stress monitoring of temperate forest ecosystems. Int. J. Remote Sens 1999, 20, 895–917. [Google Scholar]
- Asner, G.P.; Townsend, A.R.; Braswell, B.H. Satellite observation of el niño effects on amazon forest phenology and productivity. Geophys. Res. Lett 2000, 27, 981–984. [Google Scholar]
- Azzali, S.; Menenti, M. Mapping vegetation-soil-climate complexes in southern Africa using temporal Fourier analysis of NOAA-AVHRR NDVI data. Int. J. Remote Sens 2000, 21, 973–996. [Google Scholar]
- Lu, H.; Raupach, M.R.; McVicar, T.R.; Barrett, D.J. Decomposition of vegetation cover into woody and herbaceous components using AVHRR NDVI time series. Remote Sens. Environ 2003, 86, 1–18. [Google Scholar]
- Huete, A. A soil-adjusted vegetation index (SAVI). Remote Sens. Environ 1988, 25, 295–309. [Google Scholar]
- Kaufman, Y.J.; Tanré, D. Atmospherically resistant vegetation index (ARVI) for EOS-MODIS. IEEE Trans. Geosci. Remote Sens 1992, 30, 261–270. [Google Scholar]
- Huete, A.; Justice, C.; Liu, H. Development of vegetation and soil indices for MODIS-EOS. Remote Sens. Environ 1994, 49, 224–234. [Google Scholar]
- Huete, A.R.; Liu, H.Q.; Batchily, K.; van Leeuwen, W. Comparison of vegetation indices over a global set of TM images for EOS-MODIS. Remote Sens. Environ 1997, 59, 440–451. [Google Scholar]
- Tanre, D.; Holben, B.N.; Kaufman, Y.J. Atmospheric correction against algorithm for NOAA-AVHRR products: Theory and application. IEEE Trans. Geosci. Remote Sens 1992, 30, 231–248. [Google Scholar]
- Privette, J.L.; Fowler, C.; Wick, G.A.; Baldwin, D.; Emery, W.J. Effects of orbital drift on advanced very high resolution radiometer products: Normalized difference vegetation index and sea surface temperature. Remote Sens. Environ 1995, 53, 164–171. [Google Scholar]
- Rouse, J.; Haas, R.; Schell, J.; Deering, D. Monitoring Vegetation Systems in the Great Plains with ERTS. In Third Earth Resources Technology Satellite-1 Symposium; NASA: Greenbelt, MD, USA, 1974; pp. 301–317. [Google Scholar]
- Tucker, C.J. Red and photographic infrared linear combinations for monitoring vegetation. Remote Sens. Environ 1979, 8, 127–150. [Google Scholar]
- Justice, C.O.; Eck, T.F.; Tanré, D.; Holben, B.N. The effect of water vapour on the normalized difference vegetation index derived for the Sahelian region from NOAA AVHRR data. Int. J. Remote Sens 1991, 12, 1165–1187. [Google Scholar]
- Kogan, F.N. Remote sensing of weather impacts on vegetation in non-homogeneous areas. Int. J. Remote Sens 1990, 11, 1405–1419. [Google Scholar]
- Kogan, F.N. Application of vegetation index and brightness temperature for drought detection. Adv. Space Res 1995, 15, 91–100. [Google Scholar]
- Kogan, F.N. Global drought watch from space. Bull. Am. Meteorol. Soc 1997, 78, 621–636. [Google Scholar]
- Kogan, F.; Stark, R.; Gitelson, A.; Jargalsaikhan, L.; Dugrajav, C.; Tsooj, S. Derivation of pasture biomass in Mongolia from AVHRR-based vegetation health indices. Int. J. Remote Sens 2004, 25, 2889–2896. [Google Scholar]
- Karnieli, A.; Gabai, A.; Ichoku, C.; Zaady, E.; Shachak, M. Temporal dynamics of soil and vegetation spectral responses in a semi-arid environment. Int. J. Remote Sens 2002, 23, 4073–4087. [Google Scholar]
- Palmer, W.C. Meteorological Drought; US Department of Commerce, Weather Bureau: Washington, DC, USA, 1965; pp. 1–58. [Google Scholar]
- Walsh, S. Comparison of NOAA AVHRR data to meteorologic drought indices. Photogramm. Eng. Remote. Sens 1987, 53, 1069–1074. [Google Scholar]
- Di, L. Regional-Scale Soil Moisture Monitoring Using NOAA/AVHRR Data; ETD Collection for University of Nebraska-Lincoln Paper AAI9129546; University of Nebraska-Lincoln: Lincoln, NE, USA, 1991. [Google Scholar]
- Gao, B.C. NDWI: A Normalized Difference Water Index for remote sensing of vegetation liquid water from space. Remote Sens. Environ 1996, 58, 257–266. [Google Scholar]
- Zarco-Tejada, P.J.; Rueda, C.A.; Ustin, S.L. Water content estimation in vegetation with MODIS reflectance data and model inversion methods. Remote Sens. Environ 2003, 85, 109–124. [Google Scholar]
- Xiao, X.; Boles, S.; Liu, J.; Zhuang, D.; Liu, M. Characterization of forest types in Northeastern China, using multitemporal SPOT-4 VEGETATION sensor data. Remote Sens. Environ 2002, 82, 335–348. [Google Scholar]
- Asner, G.P.; Carlson, K.M.; Martin, R.E. Substrate age and precipitation effects on Hawaiian forest canopies from spaceborne imaging spectroscopy. Remote Sens. Environ 2005, 98, 457–467. [Google Scholar]
- D’Souza, G.; Malingreau, J.P. Malingreau. NOAA-AVHRR studies of vegetation characteristics and deforestation mapping in the Amazon Basin. Remote Sens. Reviron 1994, 10, 5–34. [Google Scholar]
- Liu, W.T.; Kogan, F.N. Monitoring regional drought using the Vegetation Condition Index. Int. J. Remote Sens 1996, 14, 2761–2782. [Google Scholar]
- Santos, P.; Negri, A.J. A comparison of the normalized difference vegetation index and rainfall for the Amazon and Northeastern Brazil. J. App. Meteorol 1997, 36, 958–965. [Google Scholar]
- Xiao, X.; Hagen, S.; Zhang, Q.; Keller, M.; Moore, B., III. Detecting leaf phenology of seasonally moist tropical forests in South America with multi-temporal MODIS images. Remote Sens. Environ 2006, 103, 465–473. [Google Scholar]
- Brando, P.M.; Goetz, S.J.; Baccini, A.; Nepstad, D.C.; Beck, P.S.A.; Christman, M.C. Seasonal and interannual variability of climate and vegetation indices across the Amazon. Proc. Natl. Acad. Sci. USA 2010, 107, 14685–14690. [Google Scholar]
- Galvão, L.S.; Santos, J.R.; Roberts, D.A.; Breuning, F.M.; Tomey, M.; Moura, Y.M. On the intra-annual EVI variability in the dry season of tropical forest: A case study with MODIS and hyperspectral data. Remote Sens. Environ 2011, 115, 2350–2359. [Google Scholar]
- Liebmann, B.; Camargo, S.J.; Seth, A.; Marengo, J.A.; Carvalho, L.M.V.; Allured, D.; Fu, R.; Vera, C.S. Onset and end of the rainy season in South America in observations and the ECHAM 4.5 atmospheric general circulation model. J. Clim 2007, 20, 2037–2050. [Google Scholar]
- Marengo, J.A.; Nobre, C.A. The hydroclimatological Framework in Amazonia. In Biogeochemistry of Amazonia; Richey, J., McClaine, M., Victoria, R., Eds.; Oxford University Press: Oxford, UK, 2001; pp. 17–42. [Google Scholar]
- Marengo, J.A.; Nobre, C.A.; Tomasella, J.; Oyama, M.; Sampaio, G.; Camargo, H.; Alves, L.M. The drought of Amazonia in 2005. J. Clim 2008, 21, 495–516. [Google Scholar]
- Williamson, G.B.; Laurance, W.F.; Oliveira, A.A.; Delamônica, P.; Gascon, C.; Lovejoy, T.E.; Pohl, L. Amazonian tree mortality during the 1997 El Niño Drought. Conserv. Biol 2000, 14, 1538–1542. [Google Scholar]
- Saleska, S.R.; Didan, K.; Huete, A.R.; da Rocha, H.R. Amazon forests green-up during 2005 drought. Science 2007, 318, 612. [Google Scholar]
- Phillips, O.L.; Aragão, L.E.O.C.; Lewis, S.L.; Fisher, J.B.; Lloyd, J.; Lopez-Gonzalez, G.; Malhi, Y.; Monteagudo, A.; Peacock, J.; Quesada, C.A.; et al. Drought sensitivity of the Amazon rainforest. Science 2009, 323, 1344–1347. [Google Scholar]
- Samanta, A.; Ganguly, S.; Myneni, R.B. MODIS Enhanced Vegetation Index data do not show greening of Amazon forests during the 2005 drought. New Phytol 2011, 189, 11–15. [Google Scholar]
- Anderson, L.O.; Malhi, Y.; Aragão, L.E.O.C.; Ladle, R.J.; Arai, E.; Barbier, N.; Phullips, O. Remote sensing detection of droughts in Amazonian forest canopies. New Phytol 2010, 187, 733–750. [Google Scholar]
- Anderson, L.O.; Shimabukuro, Y.E.; Aragão, L.E.O.; Huete, A. Fraction images derived from Terra/MODIS data: Monitoring intra-annual phenology in Amazonia. Int. J. Remote Sens 2011, 32, 387–408. [Google Scholar]
- Lewis, L.S.; Brando, P.M.; Phillips, O.L.; van der Heijden, G.M.F.; Nepstad, D. The 2010 Amazon Drought. Science 2011, 331, 554. [Google Scholar]
- Xu, L.; Samanta, A.; Costa, M.H.; Ganguly, S.; Nemani, R.R.; Myneni, R.B. Widespread decline in greenness of Amazonian vegetation due to the 2010 drought. Geophys. Res. Lett 2011, 38. [Google Scholar] [CrossRef]
- Aragão, L.E.O.C.; Shimabukuro, Y.E. The incidence of fire in Amazonian Forests with implications for REDD. Science 2010, 328, 1275–1278. [Google Scholar]
- Cardozo, F.S.; Shimabukuro, Y.E.; Pereira, G.; Silva, F.B. Using remote sensing products for environmental analysis in South America. Remote Sens 2011, 3, 2110–2127. [Google Scholar]
- Shimabukuro, Y.E.; Duarte, V.; Arai, E.; Freitas, R.M.; Lima, A.; Valeriano, D.M.; Brown, I.F.; Maldonado, M.L.R. Fraction images derived from Terra Modis data for mapping burnt areas in Brazilian Amazonia. Int. J. Remote Sens 2009, 30, 1537–1546. [Google Scholar]
- Aragão, L.E.O.C.; Shimabukuro, Y.E.; Espírito Santo, F.D.B.; Williams, M. Landscape pattern and spatial variability of leaf area index in eastern Amazonia. For. Ecol. Manage 2005, 211, 240–256. [Google Scholar]
- Salovaara, K.J.; Thessler, S.; Malik, R.N.; Tuomisto, H. Classification of Amazonian primary rain forest vegetation using Landsat ETM+ satellite imagery. Remote Sens. Environ 2005, 97, 39–51. [Google Scholar]
- Barlow, J.; Ewers, R.M.; Anderson, L.; Aragao, L.E.O.C.; Baker, T.R.; Boyd, E.; Feldpausch, T.R.; Gloor, E.; Hall, A.; Malhi, Y.; et al. Using learning networks to understand complex systems: A case study of biological, geophysical and social research in the Amazon. Biol. Rev 2010. [Google Scholar] [CrossRef] [Green Version]
Figure 1.
Biomass and canopy height estimates for Amazonia. (a) Interpolations of biomass calculated by overlaying basal area estimate with maps of the structure and wood density function (Adapted from [1]); (b) 1 km spatial resolution map derived from combined remote sensing and field data through a decision tree method and regression analysis with 11 biomass classes and overall accuracy of 88% (Adapted from [2]); (c) 1 km spatial resolution canopy height data from [53], available online: http://lidarradar.jpl.nasa.gov.


Figure 2.
Spatial distribution of above ground biomass, wood productivity and wood density across Amazonia: (a) Average values per site; (b) Plot values. Data from [45].
Figure 2.
Spatial distribution of above ground biomass, wood productivity and wood density across Amazonia: (a) Average values per site; (b) Plot values. Data from [45].

Figure 3.
Rainfall derived from TRMM (Tropical Rainfall Measuring Mission), product 3B43-v6, at 0.25° spatial resolution. Dry season is defined here when rainfall is lower than the estimated tropical forests canopy transpiration (∼100 mm·month−1). (a) Location of the samples sites; (b) Averaged rainfall values for each sample, from 1998 to 2010, and the standard deviation as error bars.


Figure 4.
Drought severity can be measured by the maximum cumulative water deficit (MCWD), which corresponds to the maximum value of the accumulated water deficit (WD) that reached each area within a period of time. The WD is estimated based on the approximation that moist tropical forests transpires 100 mm·month−1, and therefore, when rainfall is lower than 100 mm·month−1, the forest is considered under water stress. Areas that experienced more severe droughts present lower MCWD values. Spatial distribution of the MCWD between January and December (a) 1998; (b) 2005; and (c) 2010. Data derived from TRMM (Tropical Rainfall Measuring Mission), 3B43-v6, at 0.25° spatial resolution.


Share and Cite
MDPI and ACS Style
Anderson, L.O. Biome-Scale Forest Properties in Amazonia Based on Field and Satellite Observations. Remote Sens. 2012, 4, 1245-1271. https://doi.org/10.3390/rs4051245
AMA Style
Anderson LO. Biome-Scale Forest Properties in Amazonia Based on Field and Satellite Observations. Remote Sensing. 2012; 4(5):1245-1271. https://doi.org/10.3390/rs4051245
Chicago/Turabian StyleAnderson, Liana O. 2012. "Biome-Scale Forest Properties in Amazonia Based on Field and Satellite Observations" Remote Sensing 4, no. 5: 1245-1271. https://doi.org/10.3390/rs4051245