Turbomachinery Noise Predictions: Present and Future


Department of Mechanical Engineering, Université de Sherbrooke, Sherbrooke, QC J1K2R1, Canada
Acoustics 2019, 1(1), 92-116; https://doi.org/10.3390/acoustics1010008
Submission received: 7 December 2018
/
Revised: 27 December 2018
/
Accepted: 27 December 2018
/
Published: 4 January 2019
(This article belongs to the Collection Featured Position and Review Papers in Acoustics Science)
Abstract
:In future Ultra-High By-Pass Ratio turboengines, the turbomachinery noise (fan and turbine stages mainly) is expected to increase significantly. A review of analytical models and numerical methods to yield both tonal and broadband contributions of such noise sources is presented. The former rely on hybrid methods coupling gust response over very thin flat plates of finite chord length, either isolated or in cascade, and acoustic analogies in free-field and in a duct. The latter yields tonal noise with unsteady Reynolds-Averaged Navier–Stokes (u-RANS) simulations, and broadband noise with Large Eddy Simulations (LES). The analytical models are shown to provide good and fast first sound estimates at pre-design stages, and to easily separate the different noise sources. The u-RANS simulations are now able to give accurate estimates of tonal noise of the most complex asymmetric, heterogeneous fan-Outlet Guiding Vane (OGV) configurations. Wall-modeled LES on rescaled stage configurations have now been achieved on all components: a low-pressure compressor stage, a transonic high-pressure turbine stage and a fan-OGV configuration with good overall sound power level predictions for the latter. In this case, hybrid Lattice–Boltzmann/very large-eddy simulations also appear to be an excellent alternative to yield both contributions accurately at once.
1. Introduction
Significant reductions of aircraft noise have been achieved in the past decades, mostly by reducing jet noise. Yet, the continuously growing air traffic demands further improvements. One of the near-term solution is the Ultra-High By-pass-Ratio engine (UHBR), in which the fan diameter is further increased at the price of a relatively shorter nacelle to reduce both weight and drag. Consequently, the noise from the fan is expected to become the main noise source of future aircrafts at least in the forward arc, and at almost all flight conditions [1]. Another foreseen evolution in turbofan technology is the reduction of the number of stages in the turbine. Having more highly loaded turbine rows yields more intense tonal and broadband turbine noise, often shifted to more annoying frequency bands with less stage filtering and lining efficiency [2]. This has led to what Nesbitt calls the “turbine noise storm” in modern Low Pressure Turbines [3]. The reduction of the turbine masking combined with a more unstable lean combustion also leads to an increase of combustion noise that is expected to compete even more with jet noise at low frequencies. In summary, future evolution of turboengines will change the balance of noise sources and make the noise from rotating parts more dominant at the three certification points (approach, side-line and cutback).
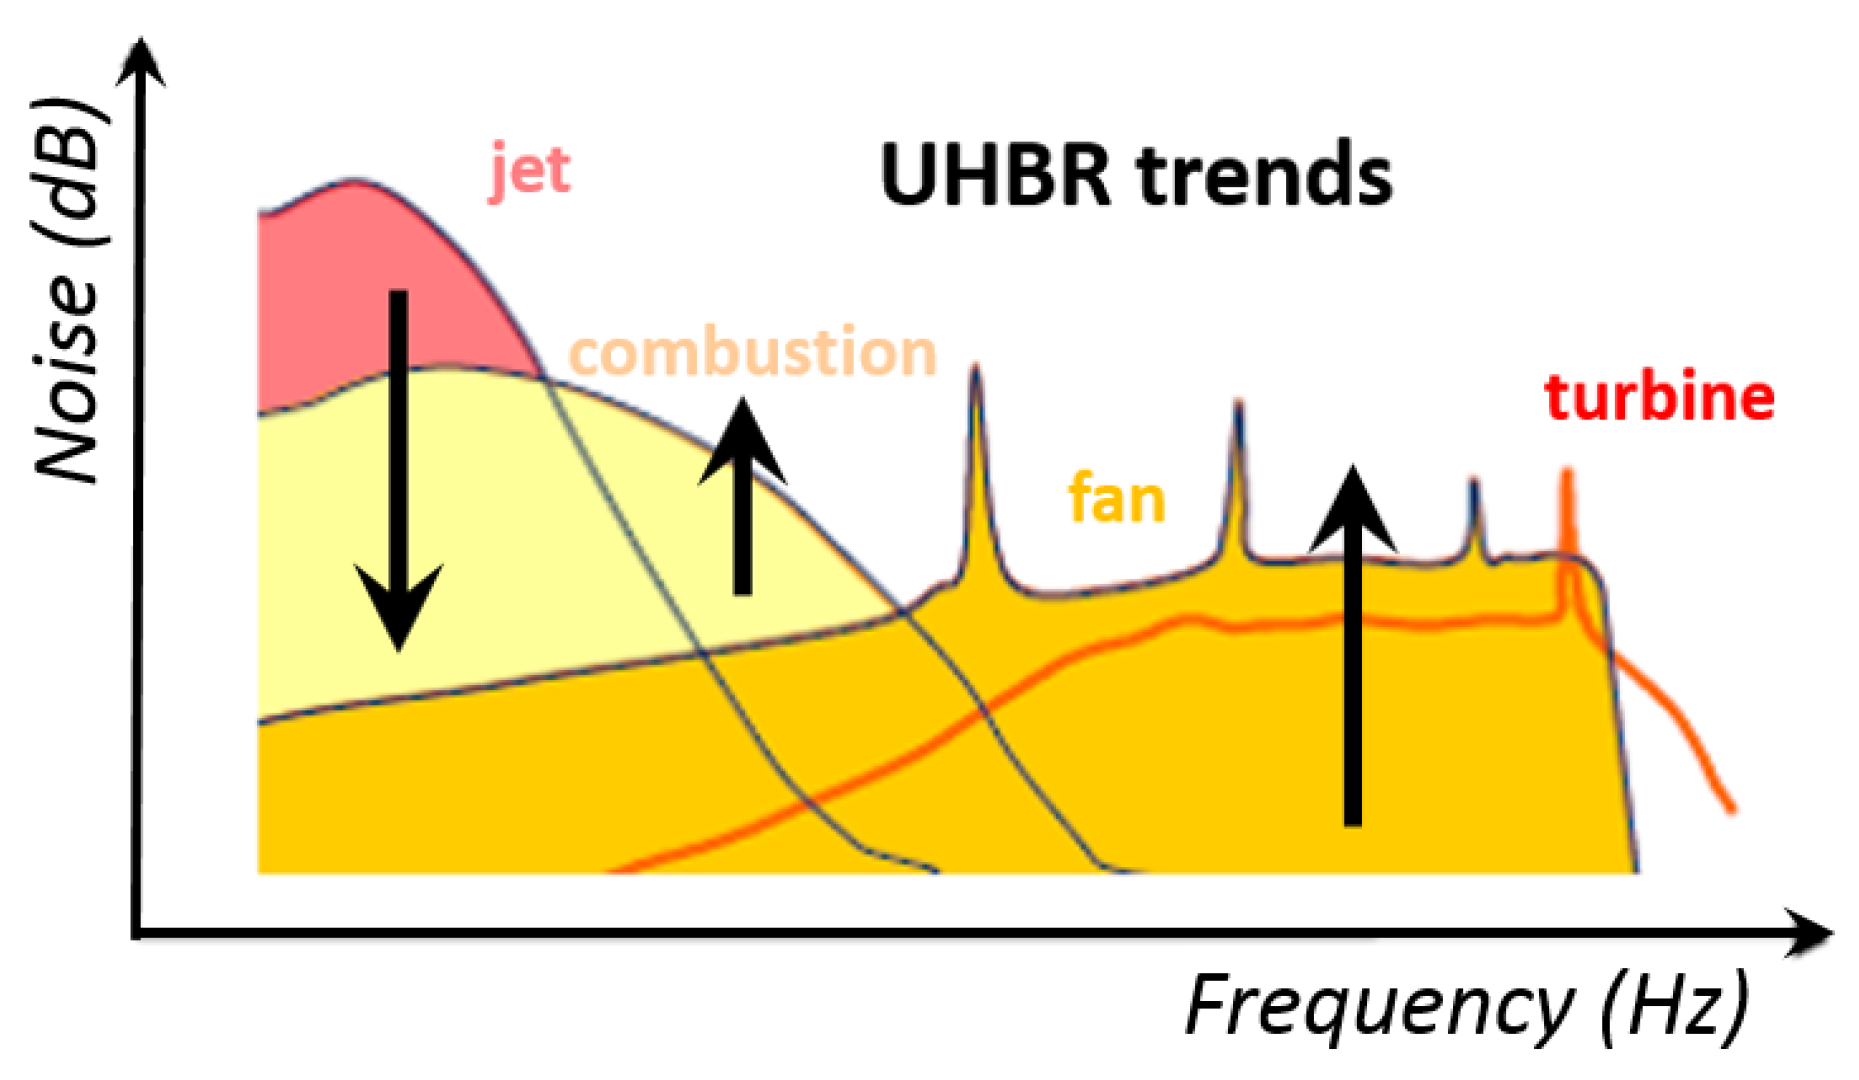
A typical engine spectrum of a current high by-pass ratio engine is sketched in Figure 1. It consists of both tonal and broadband components, contributions of which come from all rotating machines, mostly the fan (yellow) and the turbine (orange), the combustion chamber (sand) and the jet (pink). In the future UHBR architectures, the first three noise sources are expected to rise and the last one to decrease. The tones mostly come from periodic interactions in the turbomachinery stages or from inlet and outlet perturbations, whereas the broadband hump is a sum of the combustion and jet noise at low frequencies, and the turbomachinery parts at mid and high frequencies. How to model and simulate the former contribution is the object of the next section. How to model and simulate the latter comes next. For both contributions, fast analytical and semi-analytical methods are considered first, and the various simulations strategies with increasing complexity are then described. To limit the scope of the present study only illustrative cases are then shown for each type of noise source. Finally, some conclusions and perspectives are drawn to summarize the current state-of-the-art and the possible next steps. This study is an extended version of the paper first presented at the CMFF’18 conference [4].
2. Turbomachinery Tonal Noise
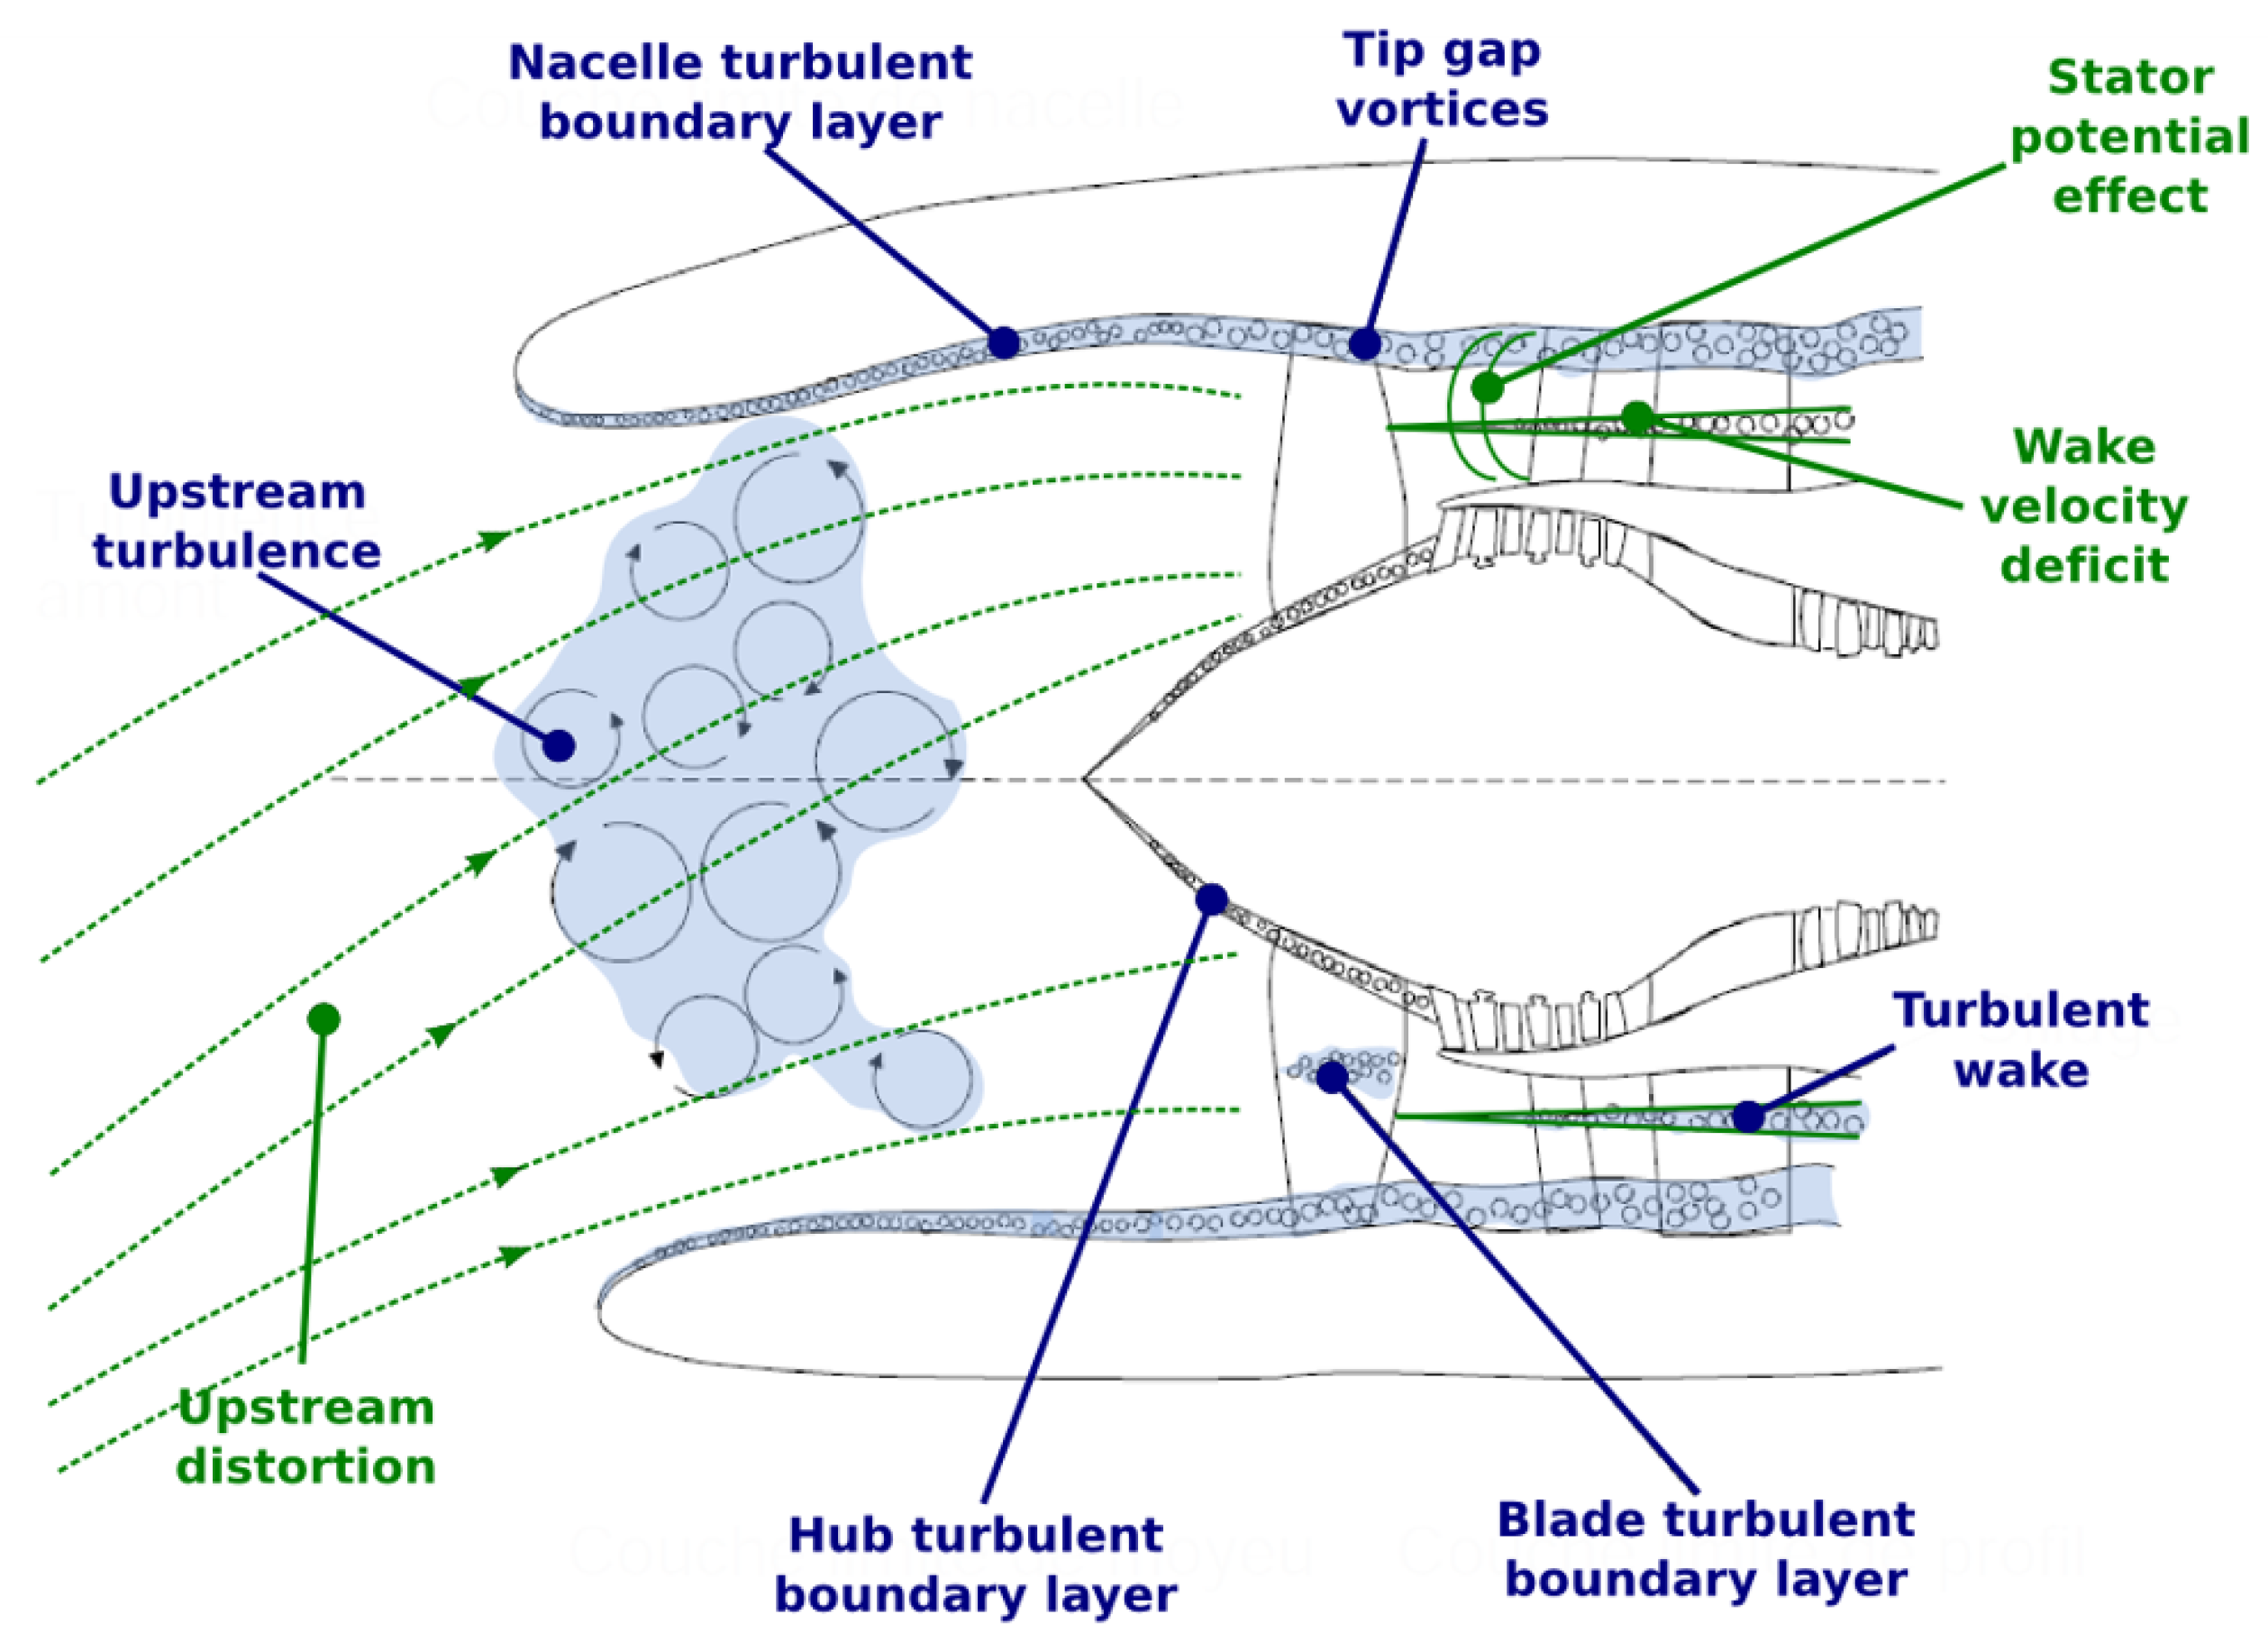
As mentioned in Section 1, tonal noise arises from periodic interactions in the engine stages. These noise sources are illustrated for the fan in Figure 2. The tonal mechanisms are highlighted in green. To yield analytical models for such a fan tonal noise some simplifications are required that are described next. The proper numerical simulations obtained by Computational Fluid Dynamics (CFD) are then described followed by comparisons of the two methods and state-of-the-art applications.
2.1. Analytical Models
Even though empirical models exist [5,6], we will focus here on physically based models only. They mostly resort to some form of an acoustic analogy that provides an integral form for the far-field acoustic pressure. In free-field, the most commonly used acoustic analogy is the Ffowcs Williams and Hawkings’s analogy (FWH) that deals with solid bodies in motion in a quiet and uniform reference medium [7]. Such a theory was soon applied to rotating machinery [8]. For turbomachinery applications that do not involve impulsive excitations such as the Blade–Vortex Interaction (BVI) of helicopters, the frequency domain formulation is better suited as it does not require solving for a retarted time implicit equation [9]. Yet such a rotating dipole formulation does not account for the presence of the duct, which induces a reorganisation of the acoustic field because of the reflections on the walls. Goldstein has proposed an extension of the FWH analogy by replacing the free-field Green’s function with the Green’s function in an infinite cylinder in the presence of an axial uniform flow [10]. This can be further generalized by considering the Green’s function in an infinite annular duct [11]. Note that the assumption of a constant axial flow does not hold in the interstage region, which is bound to play a more important role in UHBR with shorter nacelles. This is why such an analogy was further extended in the presence of swirl by Posson and Peake in the case of a homentropic flow [12], and more recently by Mathews and Peake for a more general isentropic flow with a lined duct [13]. Yet, the last two extensions involve a more complex sixth order wave equation that can only be solved numerically.
If only subsonic flows are considered, the dominant term in the above acoustic analogies is the dipolar integral that only depends on the unsteady loading on rigid walls. To provide a full analytical model, the remaining step is then to obtain the pressure jump on the blade. The latter is radially split in segments (strip theory), on which the blade section is assumed to be a very thin flat plate with the local mean stagger angle. A constant relative velocity at zero angle of attack is also taken on each strip. Depending on the solidity of the machine [14], an isolated airfoil response or a cascade response is searched. For both, the pressure jump is computed from the linearized Euler equation recast into a wave equation with two boundary conditions imposed in two half planes. This can be solved either using the Schwarzchild’s technique [15] or the Wiener–Hopf method [16]. Note that depending on the noise mechanism the appropriate variable to be solved for is either the upwash velocity or equivalently the velocity potential for impinging mechanisms or the pressure for trailing-edge mechanisms that involve the Kutta condition. In both cases, the excitation is decomposed into harmonic gusts by time and spatial Fourier transforms. In the case of wake-interaction, the mean wake deficit yields the upwash velocity gusts, and the resulting tonal cascade model has been described in detail by de Laborderie and Moreau [17]. A recent extension to account for camber effects has also been proposed (see results below) [18]. An alternative model that only considers propagation in free field (no duct modes) but with Glegg’s three dimensional rectilinear cascade response is Hanson’s model as implemented in the TFANS code for instance [19].
The application of the very thin flat-plate models to turbine blades is however doubtful as this engine component involves blades made of highly cambered and thick airfoils. Even though current research based on the Wiener Hopf method is on-going to account for these geometrical features, it is still limited to small variations [20]. A possible alternative is to approach the problem differently by a mode matching technique [21]. Bouley et al. first demonstrated the feasibility for both noise propagation (impinging acoustic wave) and generation (impinging vorticity wave) in a rectilinear cascade of flat plates. The first results of noise propagation have recently been obtained in a bifurcated waveguide [14], and successfully compared with numerical high-order results by Hixon [22].
2.2. Numerical Methods
For tonal noise that comes from the determistic and periodic interaction of turbomachinery rows, detailed simulation of the three-dimensional turbulent flow is not necessary. Instead the unsteady compressible Reynolds-Averaged Navier–Stokes (u-RANS) equations can be solved for the mass, momentum and energy conservations of the flow, as implemented in the Turb’flow code developed at Ecole Centrale de Lyon [23] or ANSYS-CFX. The turbulence model to close the RANS equations is either the k- SST model developed by Menter [24] or Kok’s model [25]. In either case, the production of the turbulence kinetic energy k is limited at the leading edge to reflect the local turbulence anisotropy at the stagnation point.
Performing u-RANS of turbomachinery stages requires careful treatment of the rotor/stator interfaces inherent to multiple reference frames. With both codes, a conservative sliding-mesh is used. Initial solutions are obtained with steady mixing-plane solutions. For some configurations, to account for pitch differences between the rotor blades and the stator vanes, the rescaling method of the stator vanes (similarity on the stator profile to match the rotor pitch while keeping solidity constant) has been used along with classical periodic boundary conditions [26]. The numerical schemes employed for all Turb’flow simulations are a second-order centered spatial scheme corrected to take into account the mesh size ratio for the conservative variables and a first-order upwind scheme for the turbulent variables. The time marching is achieved with an explicit second-order Runge-Kutta scheme using five steps. Similar strategy has been used with CFX using the available highest accurate second-order schemes.
More advanced methods such as the chorochronic method [27] or the time-inclined method [28] (now available in CFX for instance) could be used instead. Harmonic balance techniques are also alternative fast methods to yield unsteady loading [29]. Finally some additional unsteady hybrid Lattice–Boltzmann (LB)/Very Large-Eddy Simulation (VLES) simulations have been achieved with the low-dispersion, low-dissipation Powerflow code from Dassault Systems [30,31].
2.3. Results
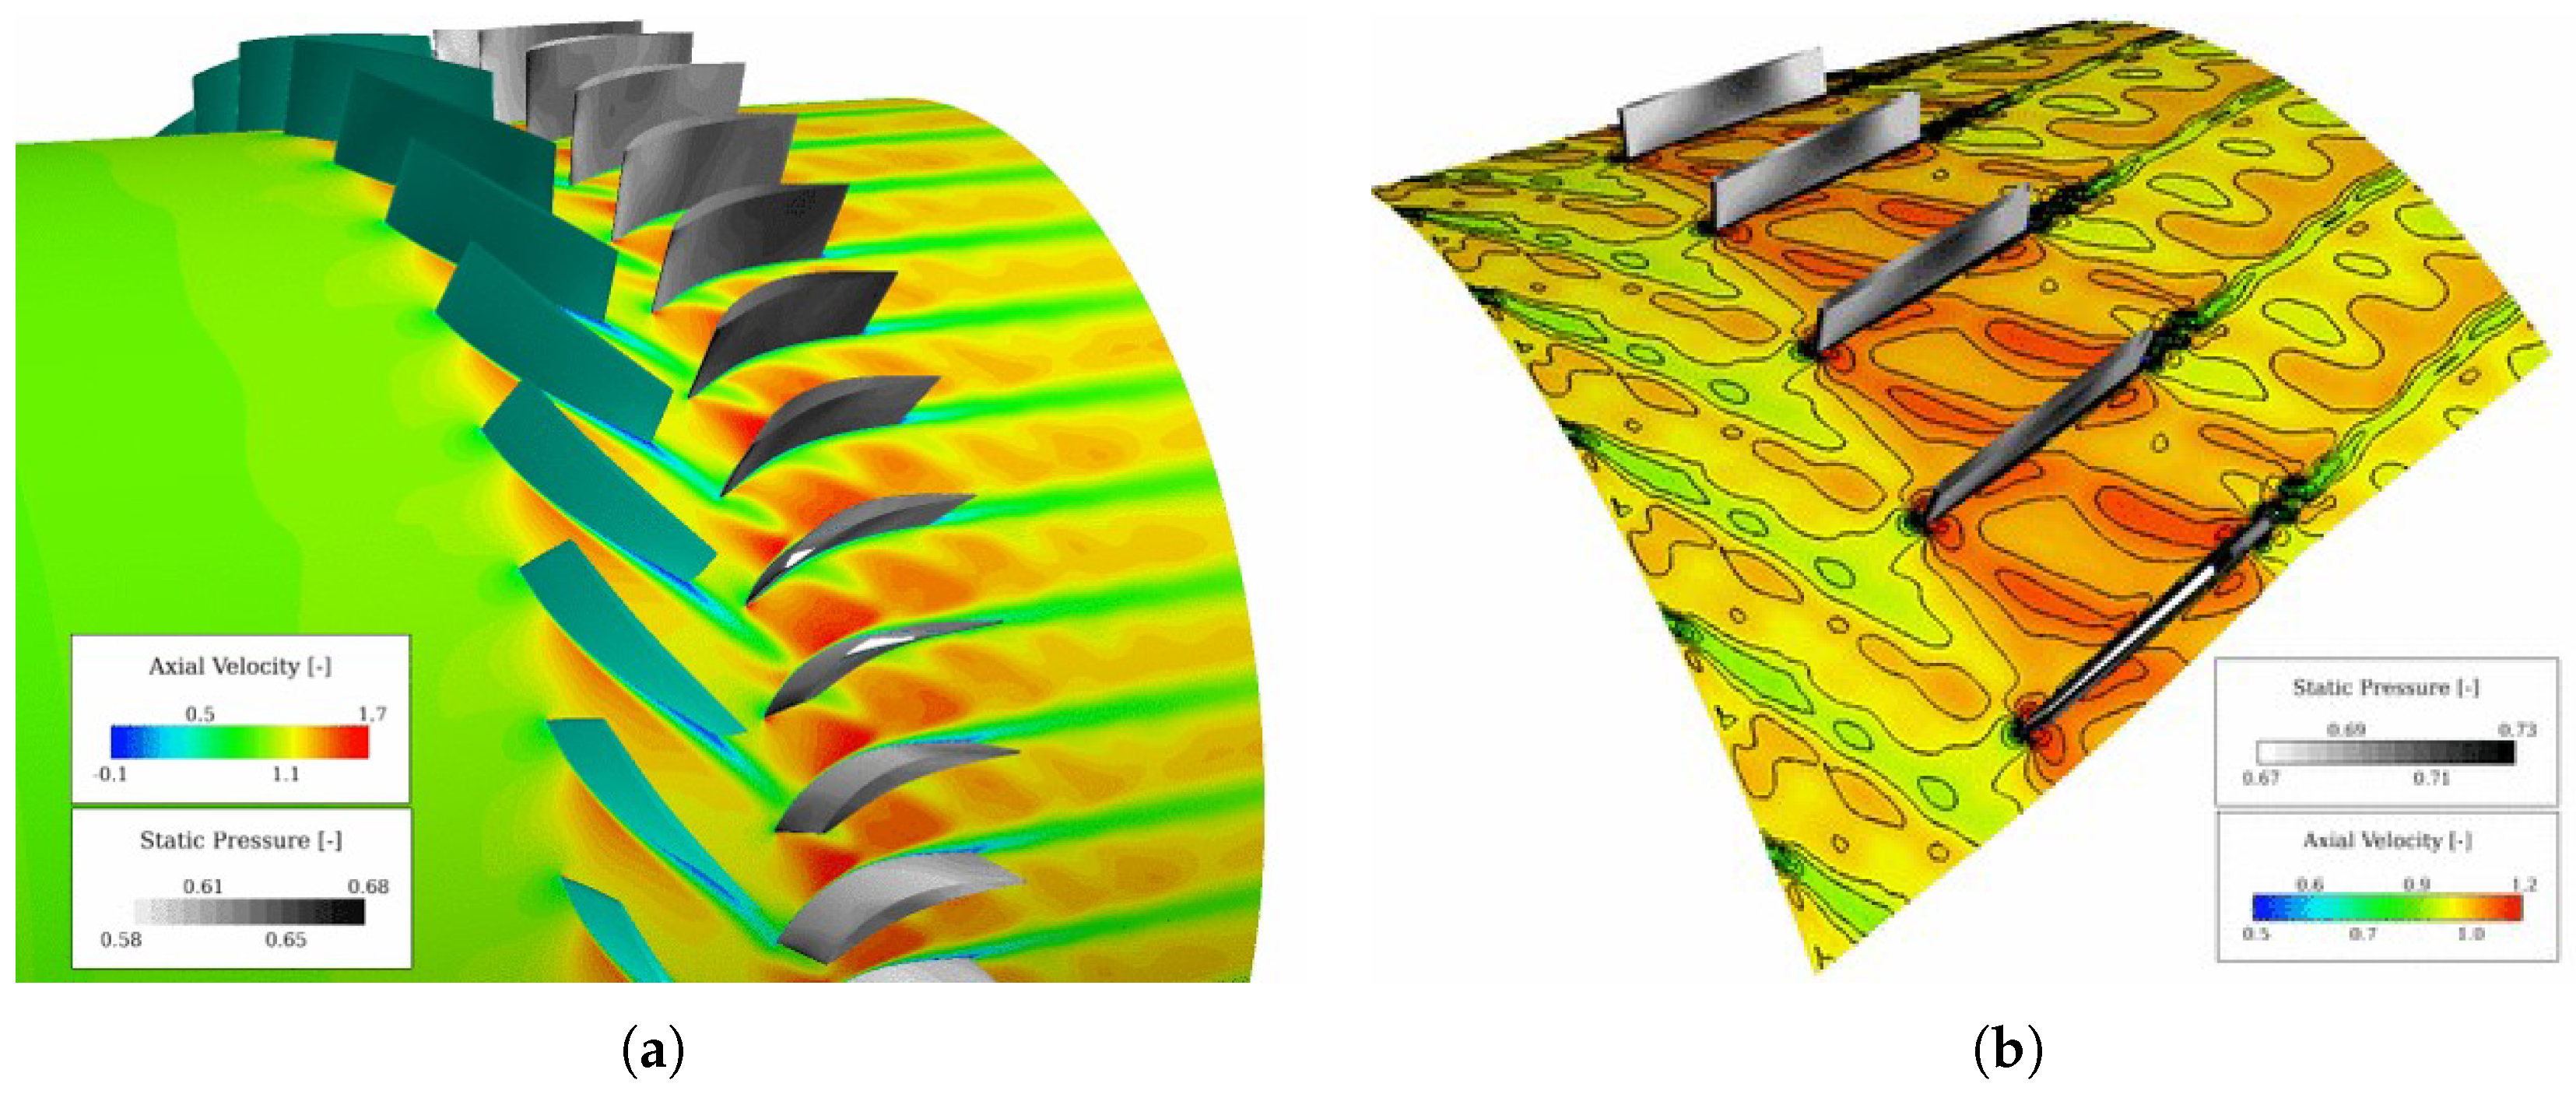
Most of the fan noise in current turboengines comes from the fan wake interaction with the downstream Outlet Guide Vanes (OGV) [32]. This noise mechanism is also present in all rotating parts of the engine including both turbine and compressor noise. Such a flow interaction is for instance shown in Figure 3a in the simulation of the actual CME2 research low-pressure compressor (three rotor blades and four stator vanes) [33]. With a simpler configuration involving the stator only in Figure 3b, de Laborderie could also study several technological effects on tonal noise, such as viscosity, thickness and camber [34]. The first two were found to be negligible whereas the third needed to be accounted for and a modification of the analytical model based on flat plates was then proposed [18].
A comparison between the above analytical model and the u-RANS results is shown in Figure 4 for both the blade response (the noise source) and the sound power level radiated upstream at the first blade passing frequency (BPF). Comparable results have also been found at the first two harmonics of the BPF with the correct modal decomposition [34]. Similar results were found for differents flow regimes and stator configurations for the NASA-ANCF rotor-stator configuration at all BPF with a maximum discrepancy of 5–10 dB on higher-order modes [17]. Figure 5 provides an example of comparison of the downstream acoustic mode sound power, , for azimuthal mode n and radial mode j, of the reference ANCF configuration with 14 stator vanes and a rotor-stator distance of half a rotor chord length. The corresponding upstream acoustic mode sound power can be found in Sanjose et al. [35]. The numerical results are obtained with the LB-VLES method as implemented in Powerflow (PF). Two analytical results are also shown: a first one, termed “Optibrui–”, assumes a flat plate cascade oriented with the stagger angle only; a second one, termed “Optibrui–”, considers a flat plate cascade oriented with the stagger angle and a combination of leading-edge and trailing-edge camber angles . In all cases, the modal content is again well predicted for both BPFs. Good overall agreement on the sound levels is found for all azimuthal modes and the first radial mode, with improved analytical results when accounting for the stagger angle only. Larger discrepancies are found in the analytical prediction for higher radial modes. Similar results are also found for higher BPFs. Further comparisons were also achieved on several stator configurations with the LB-VLES method that also showed excellent comparisons with measurements for both tonal and broadband noise [35]. Moreover, several weak heterogeneous stator configurations were also computed and compared with analytical models including wake interaction, potential interaction and inlet distortion [36]. The corresponding instantaneous flow field at midspan for the sixteen stator vane configuration () is shown in Figure 6. For this particular configuration, besides the usual wake-interaction noise mechanism (Figure 6a), a Parker mode resonance was also evidenced for the first time numerically, yielding a spurious strong radiating harmonics 38 as seen in the rotor reference frame in Figure 6b [37]. Sanjose et al. attributed this resonance to a non-linear interaction between the rotor wake and the stator potential effect.
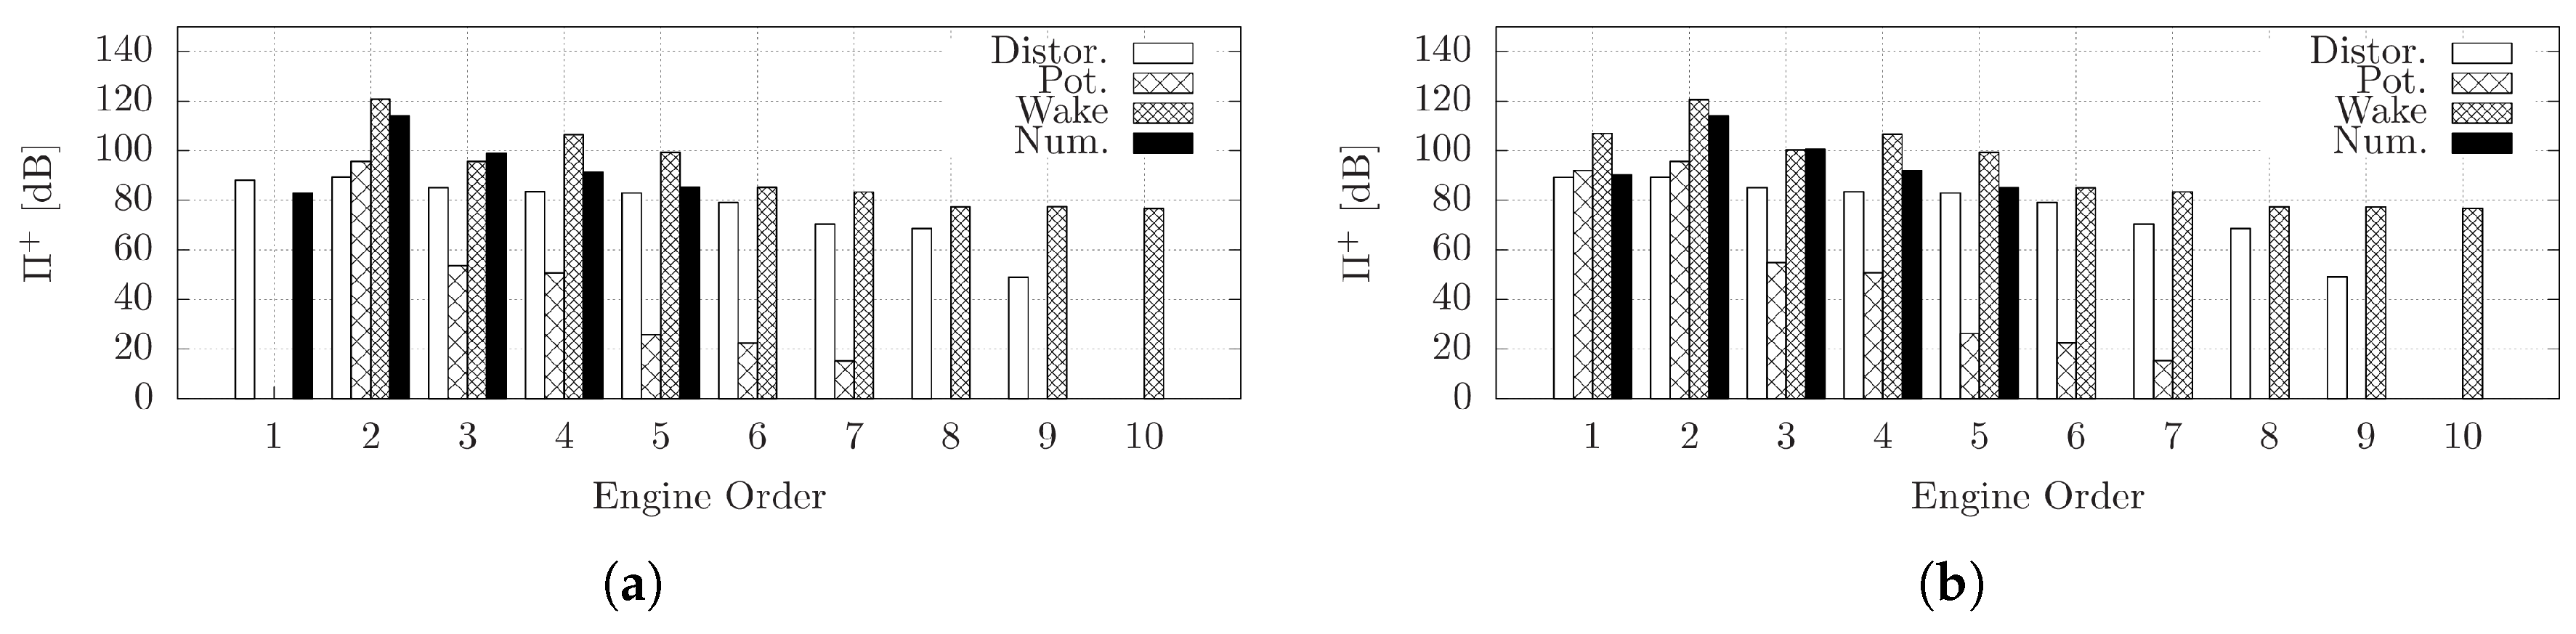
The upstream and downstream acoustic modal powers were then computed both numerically and analytically for the possible noise mechanisms in the homogeneous and heterogeneous stage respectively, as shown in Figure 7. Good agreement was found between both predictions and the analytical results could easily decipher the dominant noise mechanisms at stake. The wake-interaction was easily shown to be still the dominant noise mechanism in both configurations (Figure 7a,b). Additional contribution was coming from the inlet distortion, and the potential effect from the thicker stators was negligible for the considered rotor-stator distances (Figure 7b).
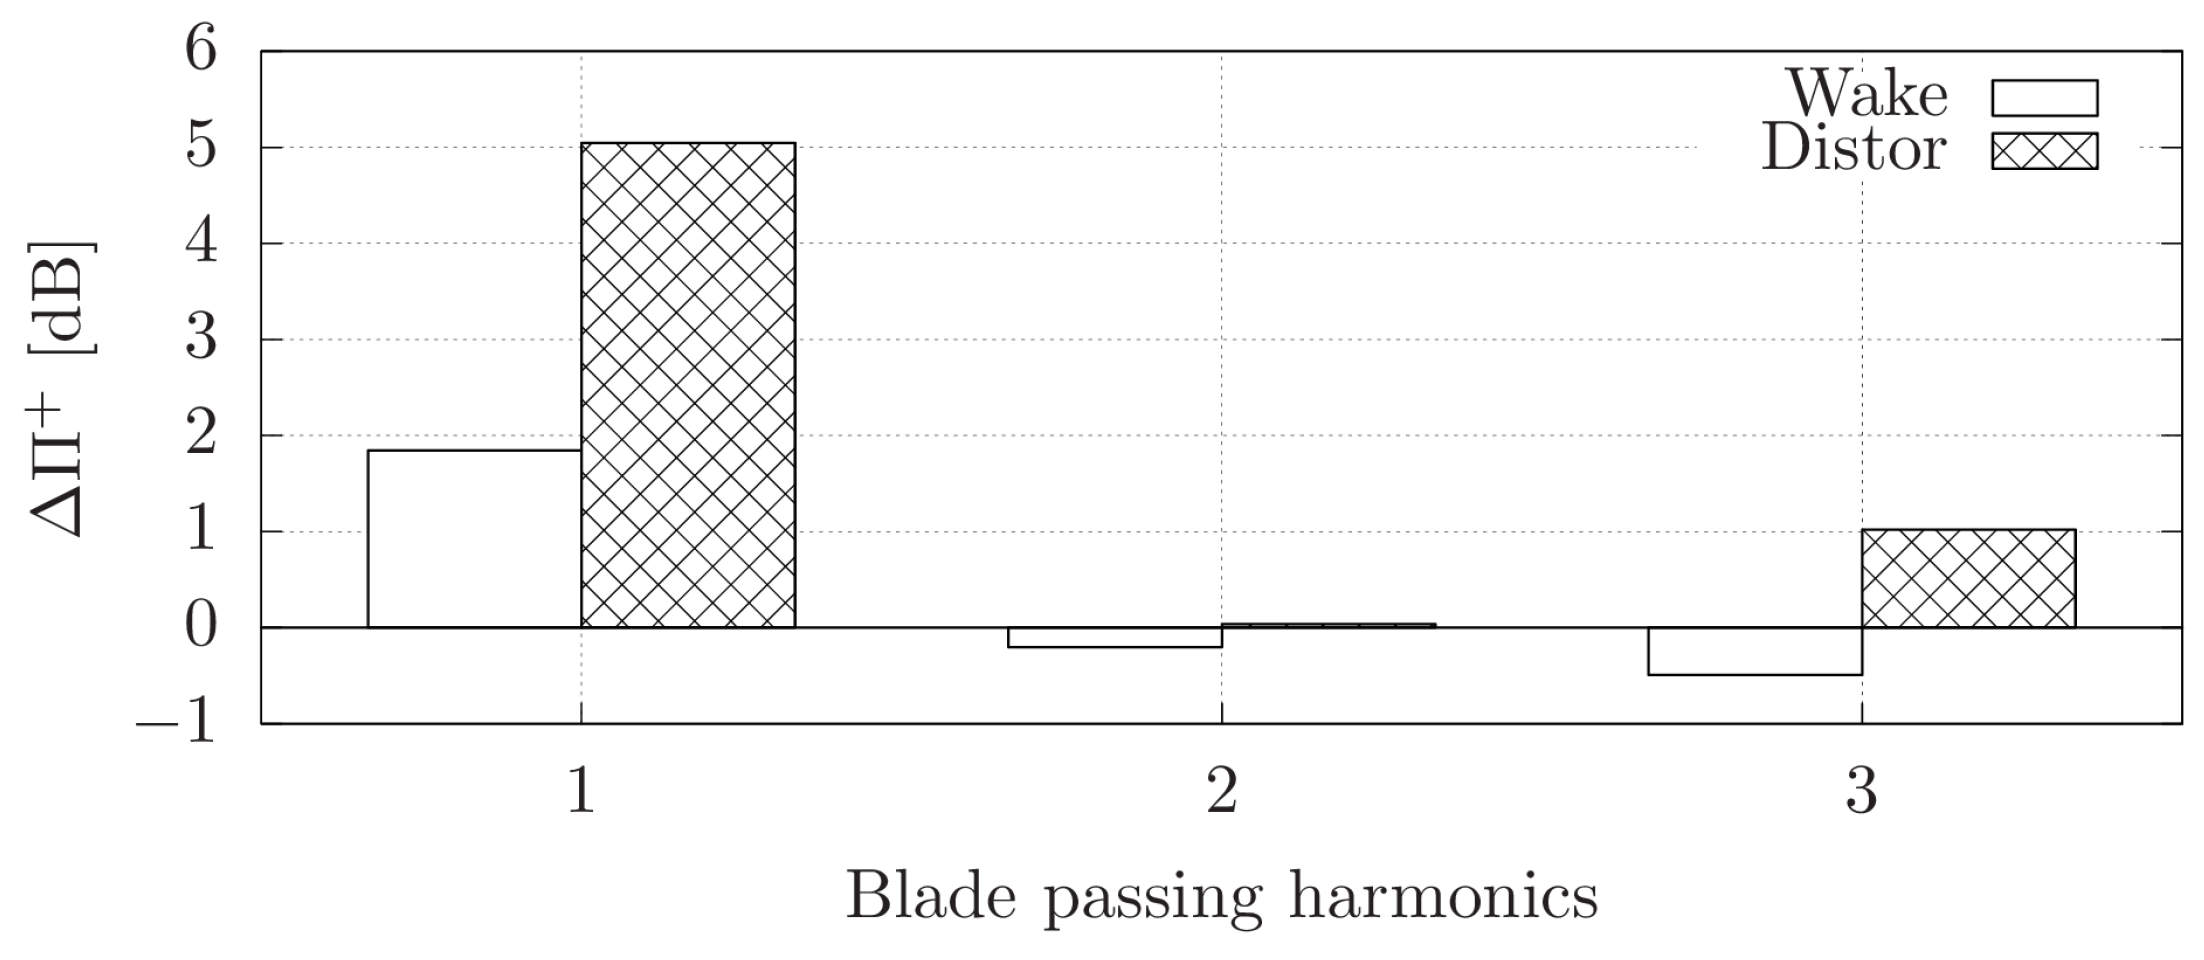
With the advent of short nacelles, strong inflow distortion and vastly heterogeneous OGV yield additional noise sources. Indeed the nacelle is no longer long enough to minimize the flow distortion induced by side-winds or sucked vortices, and the downstream bifurcations and struts that hold the nacelle are now included in the vane row that is no longer equispaced, with variable stagger angle to minimize the downstream distortion of the flow. Holewa et al. studied the effect of the bifurcations on fan noise [38]. Winkler et al. considered the effect of an inlet distortion on short engine inlets [39]. But only recently Daroukh et al. considered all the effects together by computing the 360 of a typical UHBR turbofan including a short nacelle, a strong OGV heterogeneity and the IGV of the primary engine stream, both at approach [11] and cutback conditions [40]. The flow field at approach for the axisymmetric air inlet is shown by the Q-criterion (second invariant of the velocity gradient) colored by vorticity in Figure 8. They showed that adding an inlet distortion and some strong OGV heterogeneity could lead to significantly increased noise levels on the BPFs as shown by the estimated upstream acoustic penalty in Figure 9. Both wake-interaction and distortion noise mechanisms are modified as the rotor wakes and loading are distorted by the strong downstream distortion, and the inlet distortion is an additional noise source. At cutback, the same effects were observed, but in addition, the shocks on the blades were shown to move along the chord and to change in amplitude during the rotation of the fan. The contribution of the self-noise that is described by the rotor-locked mode is also enhanced.
Future simulations could also focus on off-design phenomena such as rotating instabilities [41] or rotating stall [42]. For instance Crevel et al. already simulated one-eighth of the full CREATE 3.5-stage research compressor installed at Ecole Centrale de Lyon including the upstream settling chamber and the downstream collector [43]. The simulations could then cover the near-surge regime, the rotating stall inception and finally the full surge cycle. Figure 10 shows for instance the two rotating stall cells that appear in the third stage of the compressor. Eventhough the instabiliy frequencies were shifted compared to the experiment, most of the surge phenomenology could be reproduced by the u-RANS simulation. For instance acoustic modes of the complete installation were excited and detected in the numerical pressure field. Additional far-field acoustic predictions could be added in the future.
3. Turbomachinery Broadband Noise
As mentioned in Section 1, broadband noise arises from different random fluctuating mechanisms in the engine, starting from the turbulence ingestion at the inlet all the way to the jet plume including the unsteady turbulent flame in the combustion chamber and the turbulent boundary layers and wakes for all rotating stages. The latter noise sources are illustrated for the fan in Figure 2. The broadband mechanisms are highlighted in blue. To yield analytical models for such a fan broadband noise some simplifications are required that are described next.
3.1. Analytical Model
As for tonal noise we will not consider empirical models [5,6]. Instead we resort to physically based models only, using some form of an acoustic analogy. As the broadband noise mechanisms are random, a statistical treatment of the far field acoustic pressure is needed and power spectral densities must be defined. In free-field, the starting point can again be the frequency-domain expression of a rotating dipole. Blandeau et al. have for instance obtained analytical models for both trailing-edge (TEN) and turbulence-interaction (TIN) noise sources, for low-solidity contra-rotating open rotors [44]. Such models rely on isolated airfoils blade response. For subsonic regimes an even simpler model has been proposed originally for helicopter rotors [45,46]. It considers that each blade strip is locally in translation at the mean relative velocity, and the resulting spectrum is calculated by averaging over all possible angular locations of the blade segment and weighting by the Doppler ratio. Airfoil responses, as originally derived by Amiet [47,48] and extended by Roger and Moreau [15,49,50] to account for back-scattering effects and subcritical gusts, can then be applied for both leading and trailing-edge noise mechanisms. Such a model has been intensively used and validated for low-speed fans by Moreau and co-workers [51,52]. Sinayoko et al. showed that such a model behaves correctly and provide similar results as the exact model based on Bessel functions up to transsonic speeds [53]. Another model that relies on the free-space Green’s function but that considers Glegg’s three-dimensional rectilinear cascade blade response [16] is again Hanson’s model, which has been implemented in the BFANS code for instance [54].
As mentionned above, for a turboengine, the duct has a major effect on the sound field. Therefore, several analytical methods have rather used the Green’s function for an infinite duct in the presence of a uniform flow. In the case of low-solidity machines, the isolated airfoil responses can again be used in the acoustic analogy [55]. Otherwise, as for tonal noise, a cascade response must be used instead. Ventres et al. used the two-dimensional cascade response to a vortical gust proposed by Smith [56,57], and the consequent broadband TIN model (2-D unsteady blade response coupled with a 3-D duct acoustic field) was successfully applied to the NASA-SDT turbofan test-cases by Nallasamy and Envia [58] (RSI code). More recently, Posson et al. have extented Glegg’s rectilinear cascade model using the Wiener–Hopf method [59], and proposed a complete three-dimensionsal broadband TIN model (3-D unsteady blade response coupled with a 3-D duct acoustic field) for fan-OGV interaction [60]. Note that a correction to the 3-D rectilinear cascade model and hence of the unsteady blade loading, which mostly consists in introducing a corrected radial wavenumber to account for the actual annular dispersion relationship, has been proposed to remove some of the artificial resonance induced by the original model [60]. The complete model was again validated on the NASA-SDT turbofan test-cases [61]. More recently Masson et al. [62] have extended such a model by accounting for swirl using the generalized Green’s function proposed by Posson and Peake [12].
Illustrative results for all these models are shown in Figure 11 for the upstream SWL acoustic power of the NASA-SDT reference case with 22 rotor blades and 54 stator vanes, at approach. Here, the RANS inputs from the AIAA fan broadband noise benchmark have been used. Figure 11a first looks at the effect of the blade response on the SWL. A first check for the proper implementation of the models has been to correctly reproduce Nallasamy and Envia’s results (purple line) with Ventres 2-D cascade response and a Gaussian spectrum for the upwash velocity. The latter has then been replaced by a more realistic Liepmann spectrum fitted on the SDT hot-wire measurements, which yields a significantly lower SWL at all frequencies (blue line). The proper excitation velocity spectrum is therefore crucial to a proper noise broadband noise prediction. This was already verified by Posson et al. with axisymmetric turbulence spectra [61]. The same Liepmann spectrum has then been used with both Hanson’s (red line) and Posson’s models (green line). The experimental levels are nicely recovered by both models stressing the key role of the 3-D cascade response. Posson’s model slighly overpredicts at mid frequencies, but providing better SWL slopes at both low and high frequencies. Therefore both the blade response and the upwash velocity spectrum (the TIN excitation) are important for a reliable analytical prediction of fan broadband noise. It can also be shown that subcritical gusts are also important at low frequencies and should be accounted for [61], as was previously found on airfoils [63]. Figure 11b then shows the effect of swirl on the SWL with Masson’s extended model. The same Liepmann spectrum is used in both cases. A significant improvement (3–5 dB) is found by accounting for the swirl in the interstage. Finally, note that the differences between the results by Posson et al. [61] and the present ones are the flow inputs that come from two different RANS simulations of the SDT configuration at approach. This is actually consistent with the sensitivity to RANS inputs reported by Grace using an enhanced version of the RSI code [64].
Some of the issues related to these models are the unphysical resonances induced by the rectilinear cascade response, the uncorrelated blade response from strip to strip, and the lack of radial mode scattering imposed by the strip theory [65]. As mentioned above, Posson proposed a modification of the blade response that partially damp the resonances [60]. Yet, as shown in Figure 11, some peaks still remain, which can be off-set by properly selecting the frequencies at which the duct models are applied as done by Grace for instance [64]. An alternative approach for modeling both sound generation and propagation in a blade row is the mode-matching technique in a bifurcated waveguide. A preliminary encouraging result for broadband TIN on a low-speed fan stage has been shown recently by François et al. [66]. An excellent comparison with experiment is obtained, similar to a much more expensive Delayed Detached Eddy Simulation by Shur et al. at a fraction of the cost [67]. Similarly a unique model for trailing-edge noise model with cascade effects has been proposed [68].
3.2. Numerical Methods
To yield reliable broadband noise predictions, turbulent eddies must be resolved and properly convected up to a certain scale which will depend on the Reynolds number of the flow. To avoid solving all scales down to the Kolmogorov scale by direct numerical simulation which is still out-of-reach for practical aeronautical applications, the three-dimensional turbulent flow in a typical turbomachinery is therefore solved by a Large Eddy Simulation (LES) that describes the spatially filtered unsteady compressible mass, momentum and energy conservations (Navier–Stokes equations). Two LES codes are used here: Turb’flow (see above), and AVBP jointly developed by Cerfacs and IFPen [69]. The subgrid- scale (SGS) closure for the former is the shear-improved Smagorinsky model [70]. Most AVBP simulations rely on the WALE SGS model [71] particularly suited for wall-bounded flows. The standard Smagorinsky SGS model [72] was only used by Wang et al. in a preliminary study of the MT1 High-Pressure turbine described below [73]. The impact of the selected SGS model was then estimated on the same configuration by Papadogiannis et al. [74].
Performing LES of turbomachinery stages requires an even more careful treatment of the rotor/stator interactions as it should not only be able to convect small eddies through the interface without dissipation and dispersion, but also to be computationally efficient. To this end, the Multi Instances Solvers Coupled via Overlapping Grids (MISCOG) overset grid method has been selected with AVBP instead of the above sliding interface [75]. Two instances of the reactive LES solver AVBP are coupled through the OpenPALM coupling software. The first instance computes the flow field across the first row, while the second one handles the second one. High-order interpolation have also been implemented to preserve the solver scheme accuracy [76].
The numerical scheme employed for all AVBP simulations is the Two-step Taylor Galerkin (TTG) finite-element schemes [77] with explicit temporal integration, which are third- or fourth-order in time and space. These schemes are used in conjunction with Hermitian interpolation for the data exchange at the overlap zone, ensuring low dissipation and low dispersion of the rotor/stator interactions, while preserving the global order of accuracy of the employed numerical scheme. Initial flow solutions and grid studies were obtained with the Lax-Wendroff (LW) finite volume scheme [78] with second-order accuracy in time and space [73,75,79]. For the boundary conditions on the computational domain, Navier–Stokes Characterisitic Boundary Conditions (NSCBC) are crucially used to prevent any reflection that may corrupt the acoustic field [80]. Additional sponges layers can be further used to damp strong wakes for instance. Moreover, extensions of the NSCBC dedicated to turbomachinery applications have also been developed and applied [81]. It should be stressed here that the NSCBC naturally satisfy the radial equilibrium downstream of the stage. Future developments should address the periodic boundary conditions that allow considering only a fraction of the full turbomachine, but without any artificial periodicity of turbulence at the interface, as was recently proposed by Mouret et al. to replace the traditional Fourier series decomposition (FSD) with a compression method that does not make any assumptions on the spectrum of the flow [82].
3.3. Results
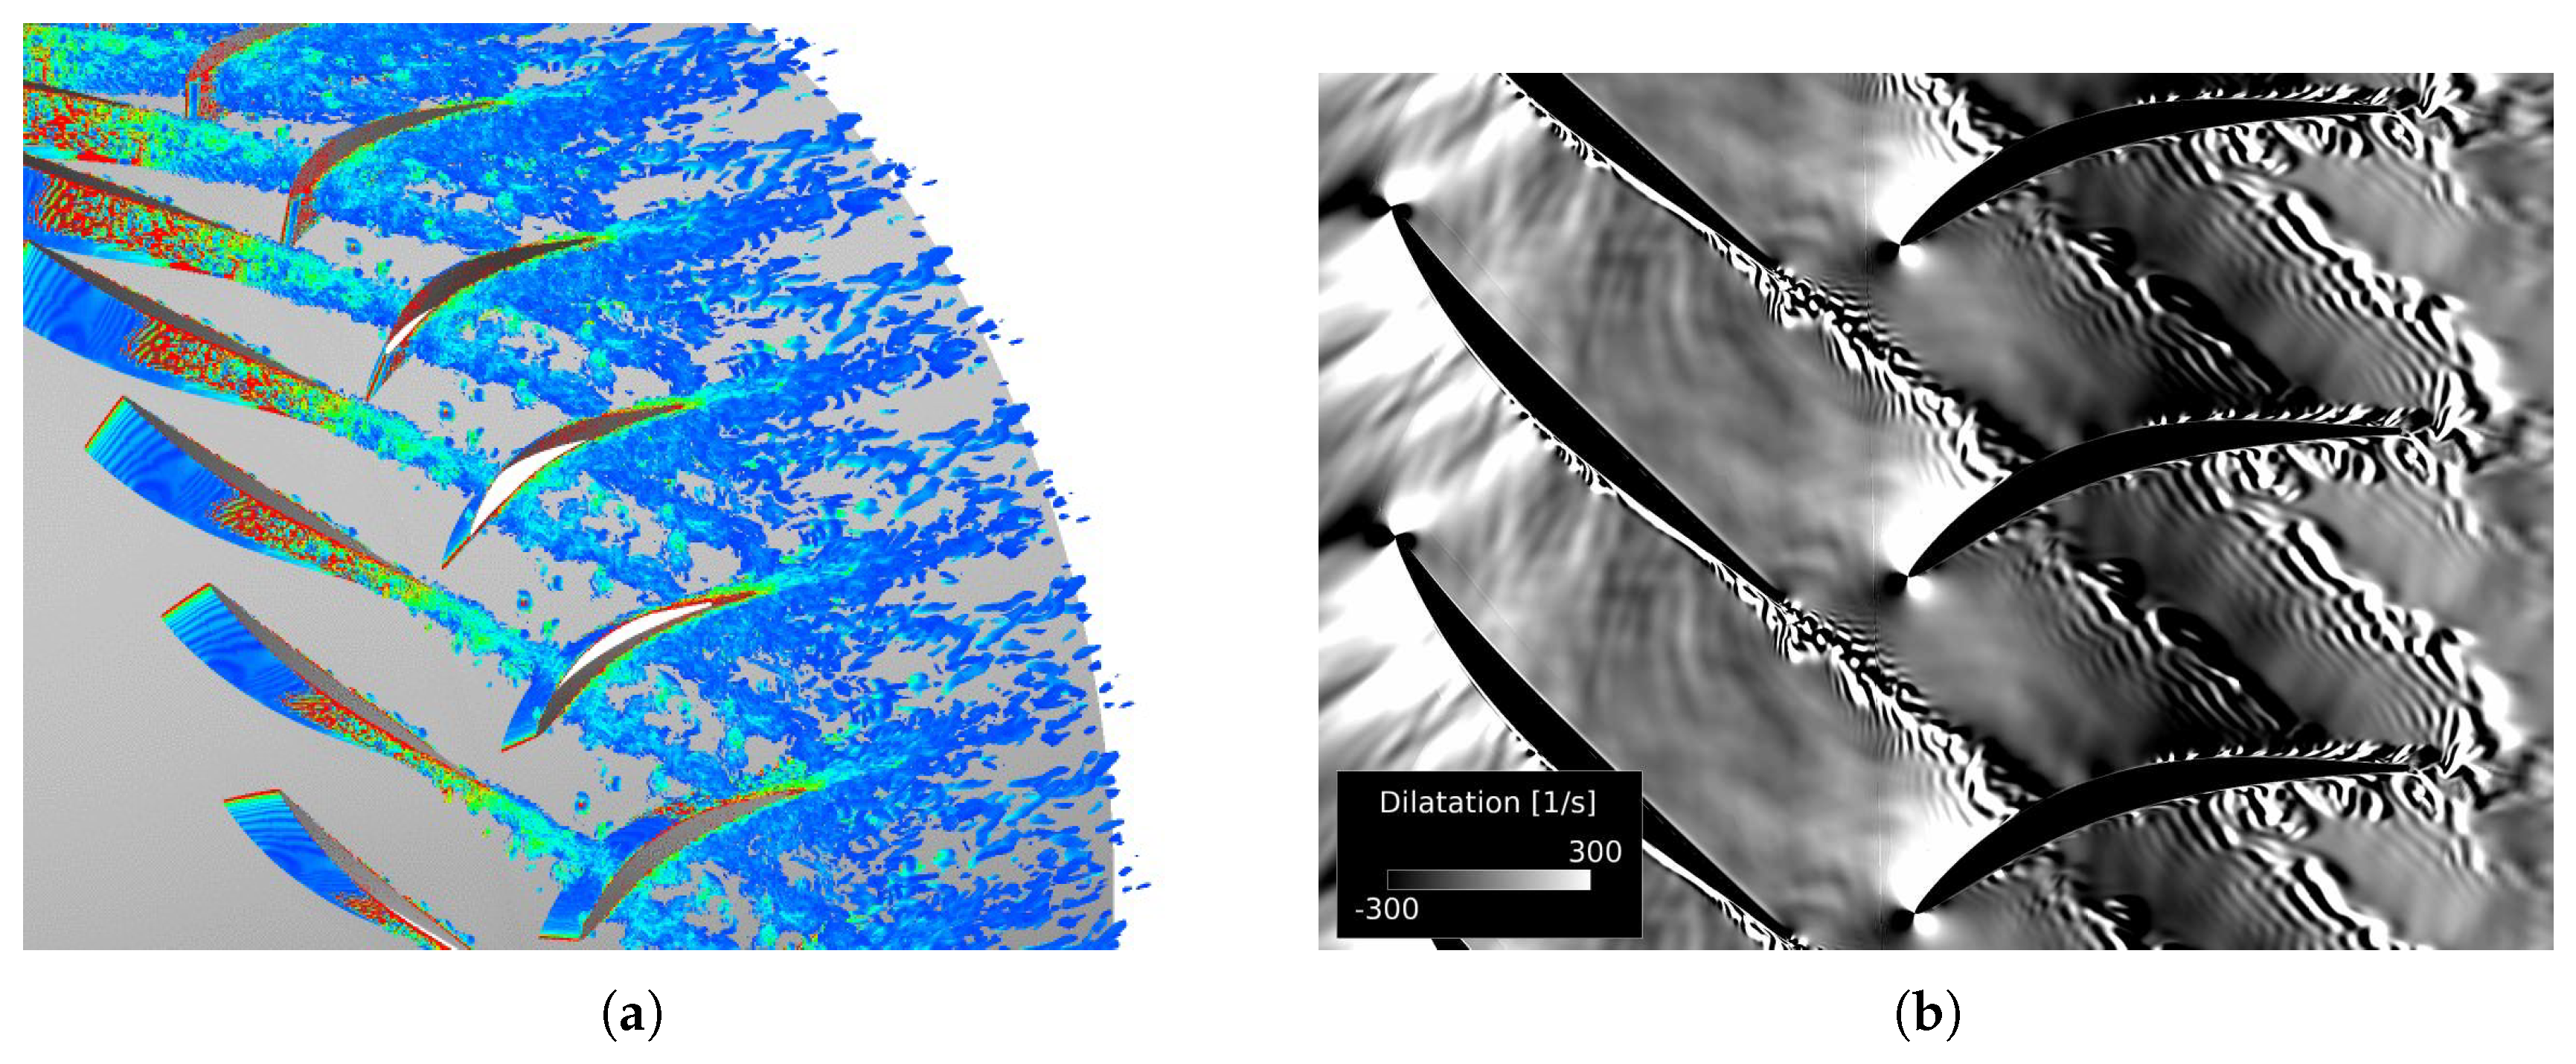
The first step has been again to tackle the LES of the CME2 low-speed compressor (Figure 12), which involves lower Reynolds number and shorter blade spans (reduced grid size). The geometry was further simplified and rescaled to account for the interaction of one rotor blade with one stator vane as explained in Section 2.2, and both the hub junction and tip gap were neglected to discard secondary flow effects [83]. The corresponding flow field obtained with Turb’flow is shown in Figure 12a by iso-contours of the Q-criterion colored by vorticity. Noticeably for this low-pressure compressor, the transition to turbulence occurs at mid-chord (contrarily to the above u-RANS results in Figure 3a) for both rotor blades and stator vanes, yielding thinner wakes than all u-RANS results. Similar results were confirmed on the full compressor configuration without any rescaling, including hub junction and tip clearance with AVBP by Wang et al. [84]. The latter showed also excellent agreement with the parallel velocity measurements by laser Doppler anemometry in all blade rows confirming the actual thinner wakes and indirectly the delayed transition on each blade row [85]. The corresponding acoustic field is represented by iso-contours of the dilatation field in Figure 12b. A strong dipolar source is seen at the stator vane leading edge, and a weaker high-frequency source is also coming from the rotor trailing edge. Strong noise radiation is seen to propagate upstream. These initial LES results also stressed the crucial role of the spanwise coherence length in broadband noise [83].
The second more challenging case has been the MT1 research High-Pressure turbine. The actual geometry has been again rescaled to only have one stator vane and two rotor blades to only have a 12 sector. A specific grid study has been achieved on on this configuration with the LW scheme and four levels of grid refinements summarized in Table 1. The CPU times in h/rev are only indicative and correspond to simulations on the Mammoth cluster MP2 at Université de Sherbrooke.
The dimensionless distance to the wall on M4 is close to 1 everywhere and can be seen as the wall-resolved case. Wall functions are used for the other wall-modeled LES. Figure 13 shows the corresponding instantaneous Schlieren plots at midspan: it stresses the complex flow features in the passage with the multiple shocks and acoustic waves interacting with both blade rows. Noticeably a strong interaction exists between the shock at the stator trailing edge and the rotor blade at the selected instant. Some significant vortex shedding is also seen from both rows. Little differences were observed in the flow features between the last two grid levels and very similar flow topology was even obtained on M2 with the high-order TTG schemes and the Hermitian interpolation.
Two illustrative comparisons with experiment [86] are shown in Figure 14. Figure 14a shows the mean isentropic Mach number (or mean wall-pressure) distribution at various heights on the stator blades. The observed chordwise and radial variations are properly reproduced by the finest LES, which actually improves previous RANS or u-RANS predictions on the suction side near the trailing edge. Figure 14b shows the radial azimuthally averaged profiles of total pressure and temperature and the yaw angle in the near plane behind the rotor blades (about 12 mm downstream of their trailing edge). Significant improvement is found on the two finest grids as the footprints of the secondary flow features at the hub (corner vortex) and at the tip (tip-leakage and tip-separation vortices) are predicted at the correct experimental radial position and the variation of total pressure and temperature are better predicted, especially around 40% and 70% of blade height. Note that the M4 case also provides the best match with experiment for all variables in the tip region. As for the wall-pressure distribution, the LES results also significantly improve the radial distribution obtained by the RANS and u-RANS simulations noticeably in the secondary flow regions at the hub and at the tip where the turbulent mixing is intense. Similar good comparison is obtained for the pressure distribution on the rotor blade, and for the radial azimuthally averaged profiles in the far-field.
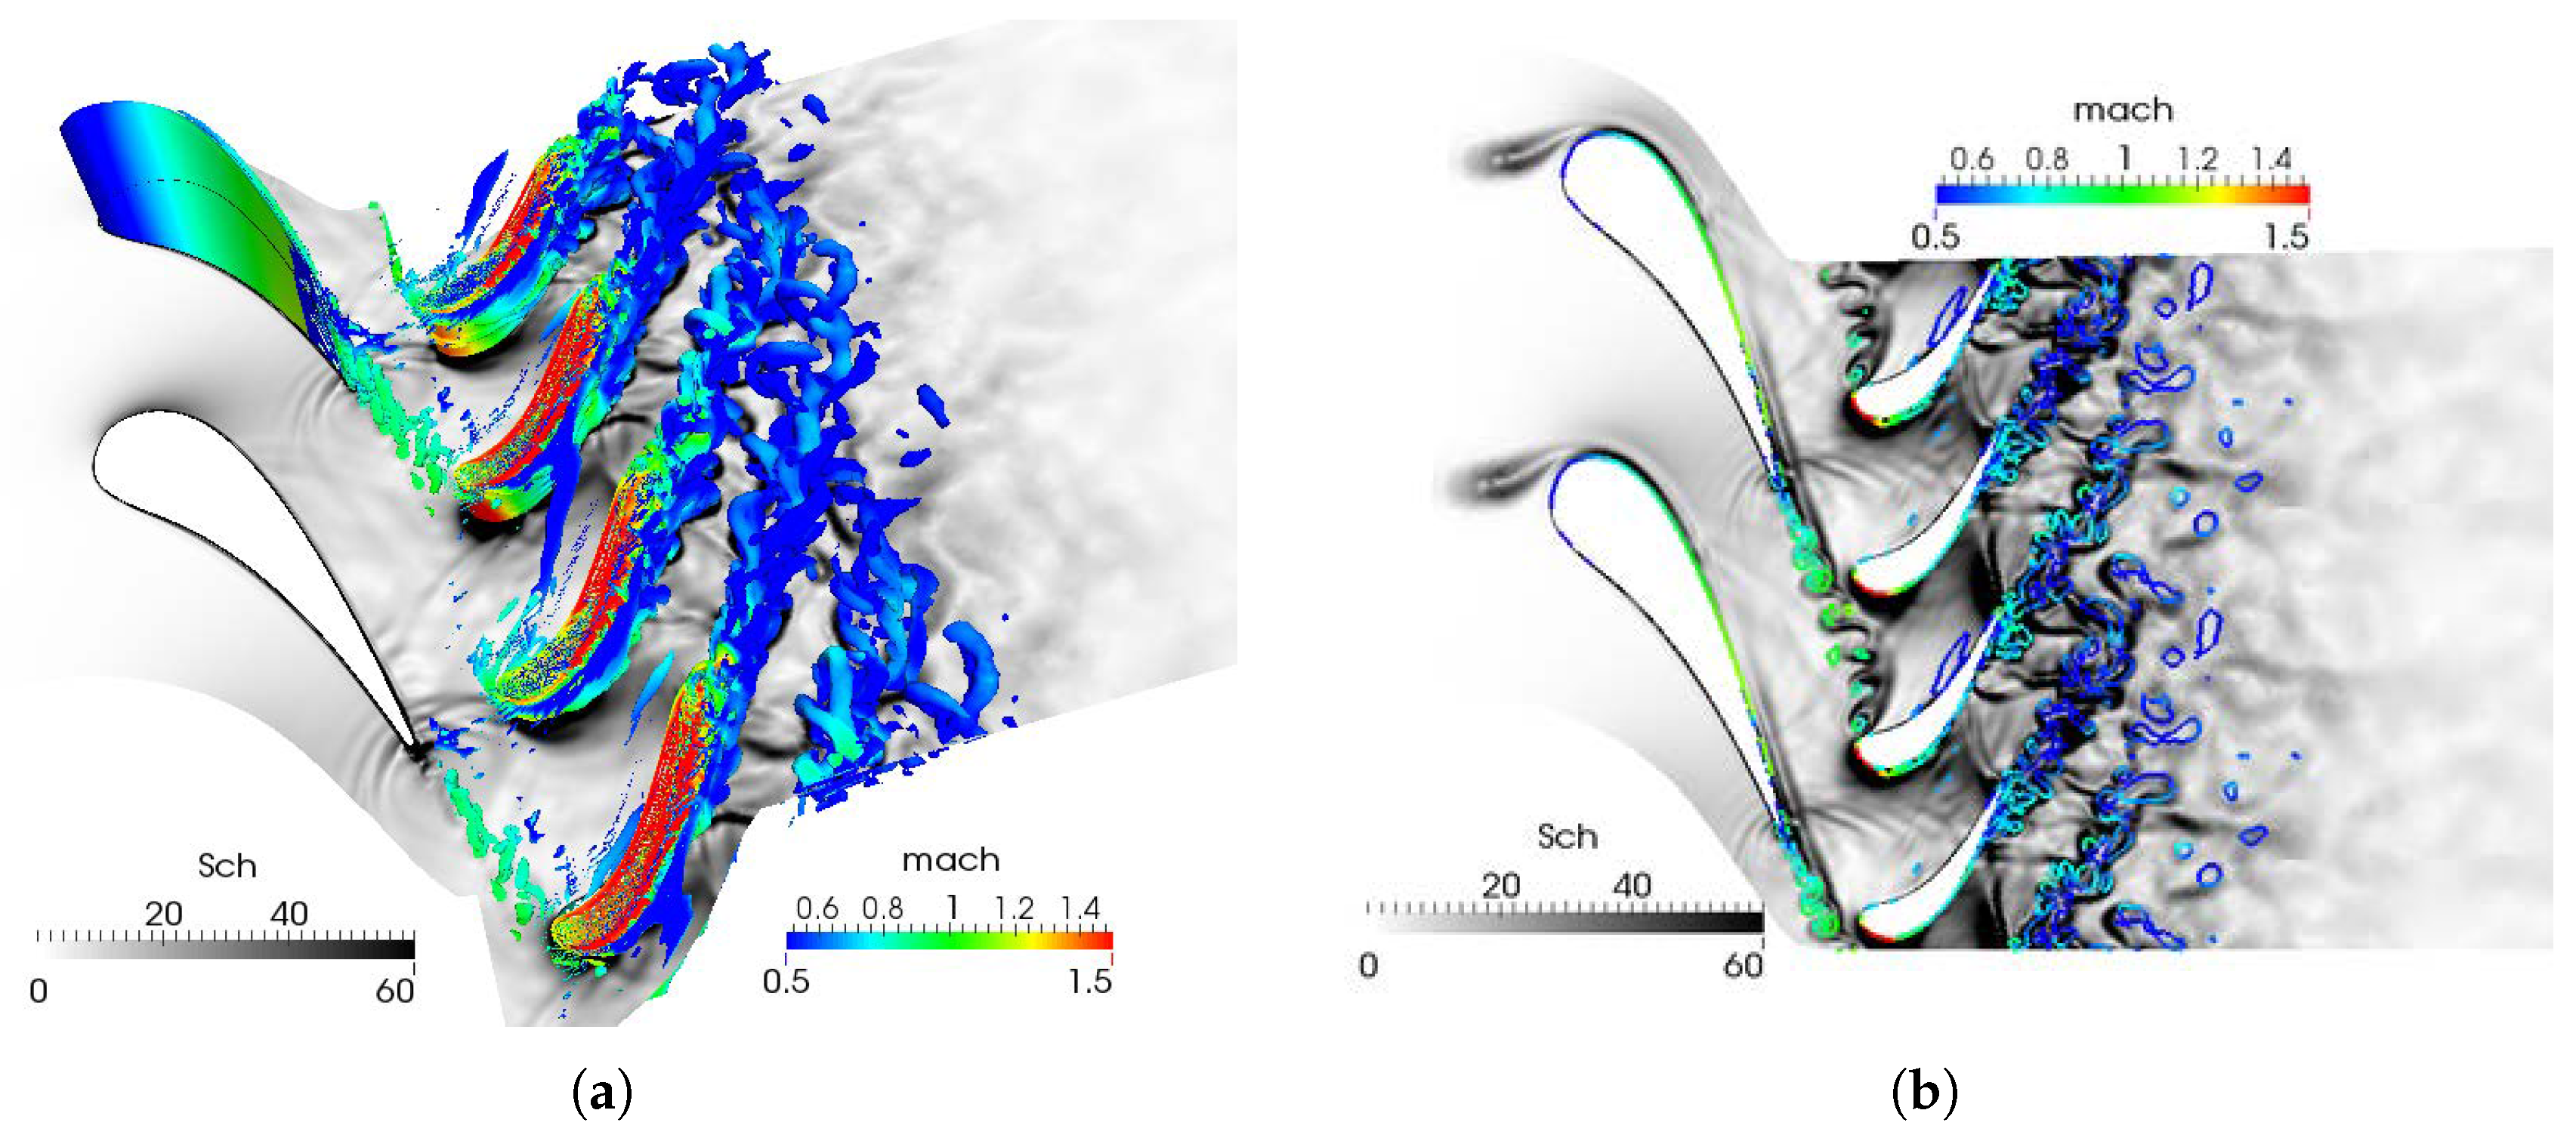
Two sets of simulations have then been performed to address the propagation of both direct and indirect combustion noise through the first HP-turbine stage. A first one without any entropy pulse at the inlet (clean inflow) and a second one with an entropy pulse at the inlet (pulsed case). The latter pulse was first assumed to be a uniform plane wave at a single frequency (1000 Hz and 2000 Hz) as provided by the CONOCHAIN methodology coupling a LES of the combustion chamber with a compact analytical model through the turbines stages [87,88]. Such a canonical case allowed comparing with the compact theory of Cumpsty and Marble [89] corrected for the entropy wave attenuation through a blade row by the mean flow, as originally proposed by Leyko et al. [90] and revisited by Bauerheim et al. [91] for a stage (CHORUS code). Papadogiannis et al. first concluded that there was more entropy attenuation through the 3-D stage than through the 2-D stage at midspan, and consequently that the indirect noise production was mostly limited to the first HP turbine stage. They also concluded that there were less reflection of acoustic waves (direct combustion noise from the unsteady turbulent flame in the combustion chamber) through the 3-D stage and similar transmission to the next turbine stage. The former result suggested that the actual reflection at the turbine inlet was less prone to instabilities, and the latter suggested that the 2-D approximation of CHORUS through the turbine stages could be satisfactory. More recently a more realistic cylindrical source term mimicking the actual temperature stratification and hot streaks at the exit of the combustion chamber in an actual aero-engine has been injected at the inlet in front of the stator leading edge [92]. The flow topology of both cases with and without entropy volumic spot are shown in Figure 15 for the latter case. Compared to the baseline case in Figure 13, the same complex flow is observed. Yet, the additional entropy source placed in front of the stator leading edge triggers a significant increase of the gradient of density on the suction side of the stator, and consequently the boundary layer flow with earlier transition, thicker and more unsteady vortex shedding impacting the rotor blades.
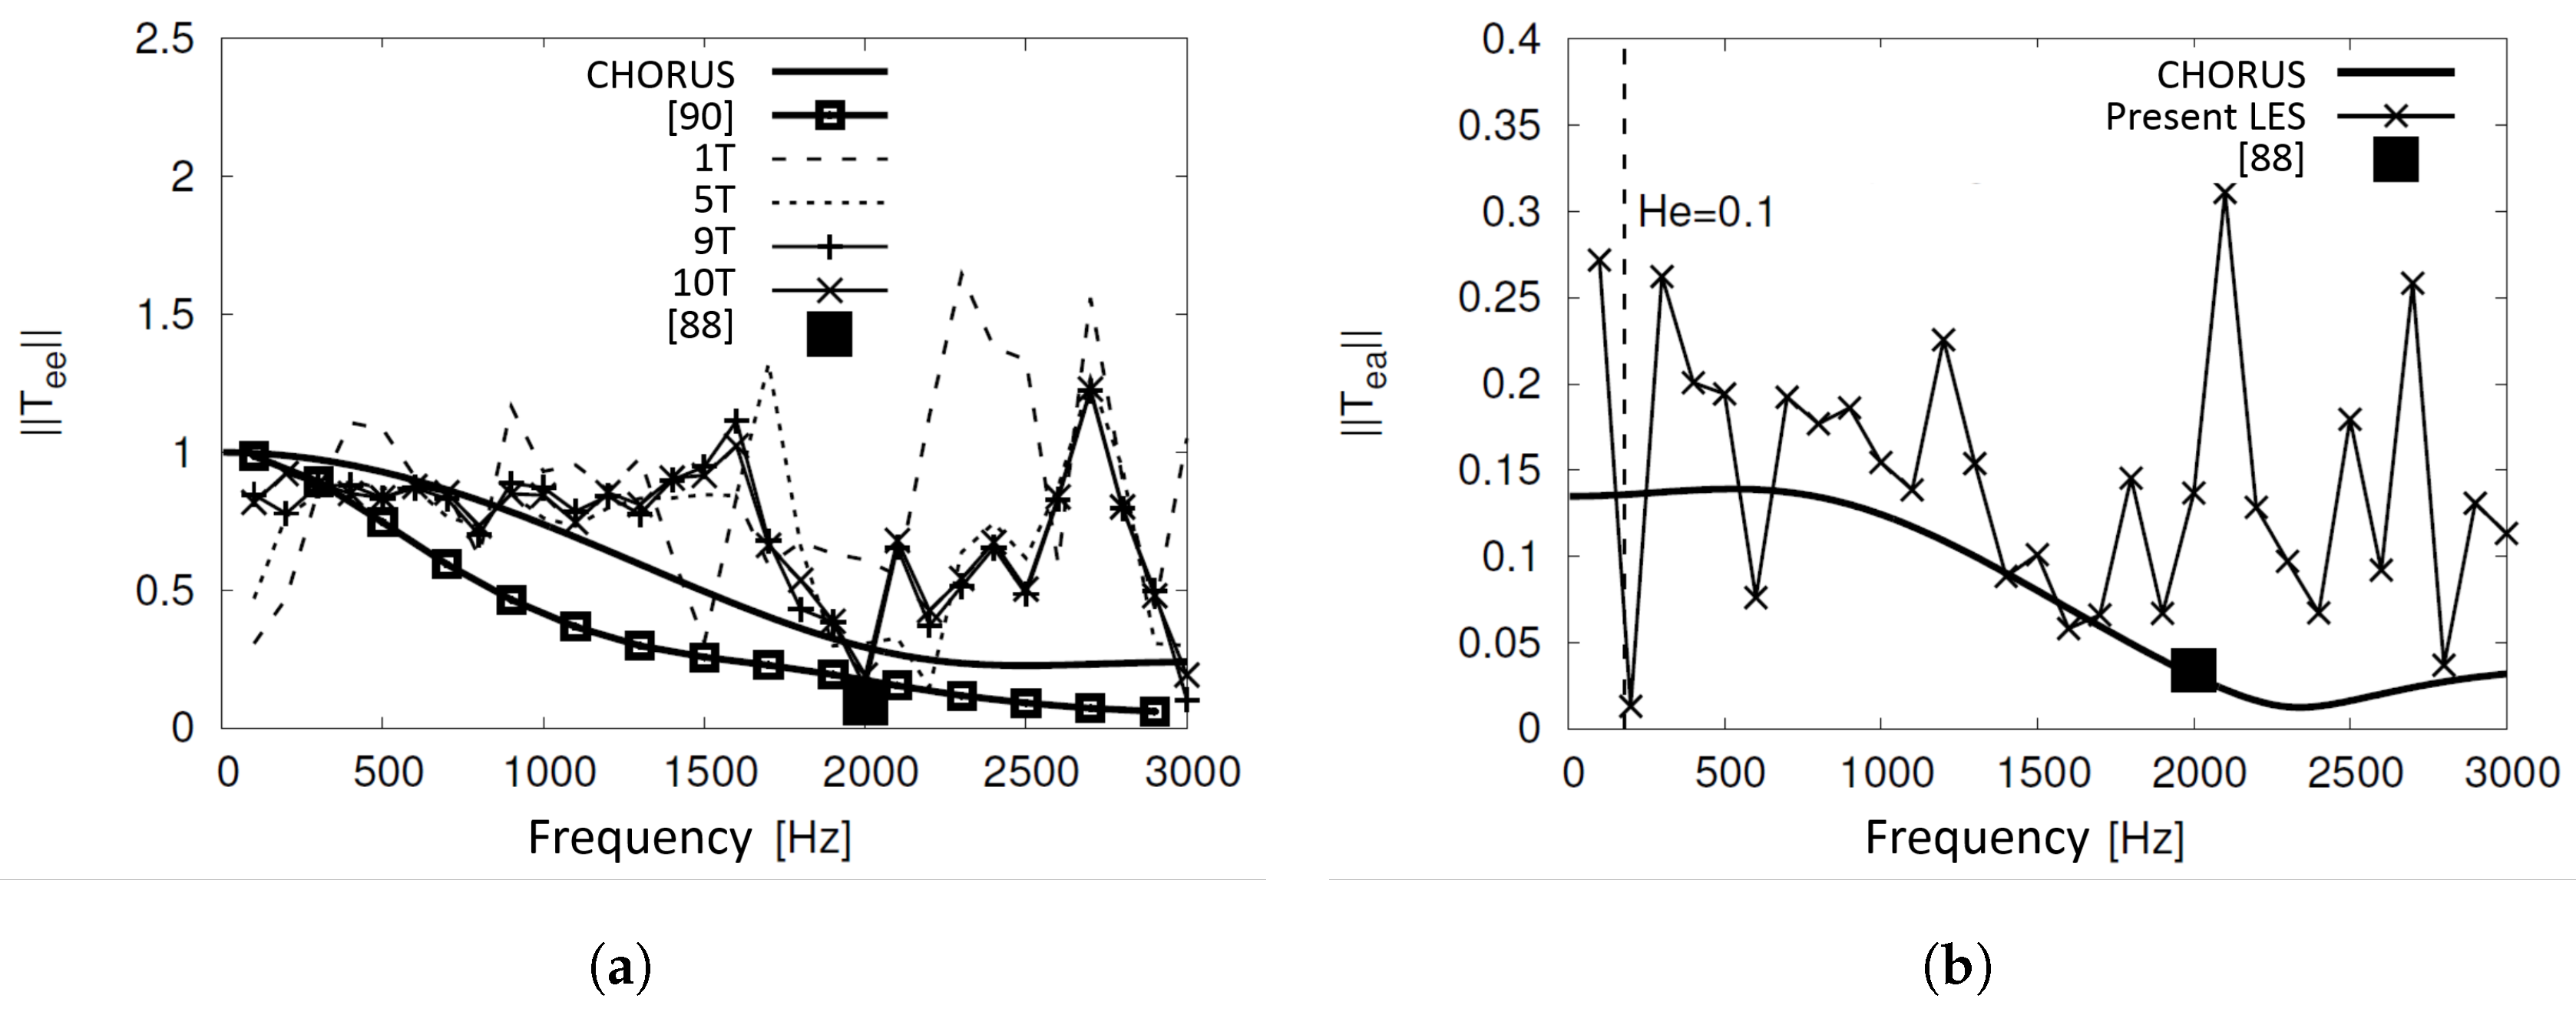
Several outstanding findings have been made by Becerril et al. [92], which are summarized by the entropy transmission coefficients shown in Figure 16. In both plots CHORUS (thick black line) stands for the 2-D stage predictions at midspan as presented by Papadogiannis et al. [88], and studied in detail by Bauerheim et al. [91]. In Figure 16a, the thick line with open square symbols is a three-dimensional application of the attenuation function defined by Leyko et al. [90], based on the 3-D streamlines of the simulation mean flow. Considering the actual 3-D mean flow has therefore a significant impact and recovers the direct calculation (solid square symbols) of Papadogiannis et al. [88]. All thin lines (with and without symbols) represent direct calculations using Dynamic Mode Decomposition [93] after several periods T defined by Papadogiannis et al. [88] (the entropy wave frequency of 2000 Hz). Contrarily to the ideal plane wave case, the transmission coefficients only converge after nine to ten periods. Moreover, the realistic entropy plane wave is now conserved through the turbine stage up to 1600 Hz as in the compact theory. This is caused by the entropy modes generated naturally by the flow (heat transfer with the constant temperature walls, wakes, shocks, strong acceleration etc.). The latter can be even stronger than the forcing locally yielding a transmission coefficient larger than 1. The cylindrical forcing (non-planar wave) is also less sensitive to the attenuation of the non-homogeneous flow: in this case the attenuation of the 2000 Hz entropy plane wave is divided by two compared to the more ideal case of Papadogiannis et al. [88]. For the acoustic transmission coefficient shown in Figure 16b, globally higher levels are again found compared to the simpler CHORUS model. This could be caused again by the additional sound mechanisms in the stage: acoustic waves generated by the energy source term (direct noise), by the acceleration of entropy and vorticity waves generated by the wakes, secondary flows and shocks etc.
The final application that will complete the broadband aeroacoustic simulation of turbomachinery components in a modern turboengine is the main fan-OGV interaction described in Section 2.3. We will again consider the baseline NASA-SDT configuration described in Section 3.1. Once again, the actual geometry has been rescaled to only have two rotor blades and five stator vanes yielding a 37.2 sector. Posson’s analytical model in Section 3.1 was used to verify that going from a 22–54 to a 22–55 configuration did not change the broadband noise spectrum significantly.
Only the approach condition (61.7% of maximum rotor speed) has been fully simulated so far for two configurations: on the one hand the rescaled rotor-stator (RS) including the nacelle and a large domain around it as in the wind tunnel experiment [94,95]; on the other hand the rotor alone (RO) with one blade passage only and a much shorter domain in the nacelle extending one rotor chord length upstream and one chord length behind the location of the stator in the RS case [96]. For the former configuration, the resulting mesh has 75 million cells and the range of is 10–50 on the rotor blades and 20–80 on the stator vanes (that are mostly refined at the leading edge where the wake interaction occurs). Larger are found on the hub and nacelle, which actually prevented obtaining physical results with the TTG scheme (flow separation upstream of the rotor). Wall laws are then used on all walls. For the latter configuration, the mesh has been refined around the blade, in the blade passage and in the wake to capture it properly all the way to the position of the stator leading edge. The grid size is 68 million cells and the average is now around 10. Solutions with both LW and TTG schemes have been obtained on this case, without noticing major modifications of the flow topology.
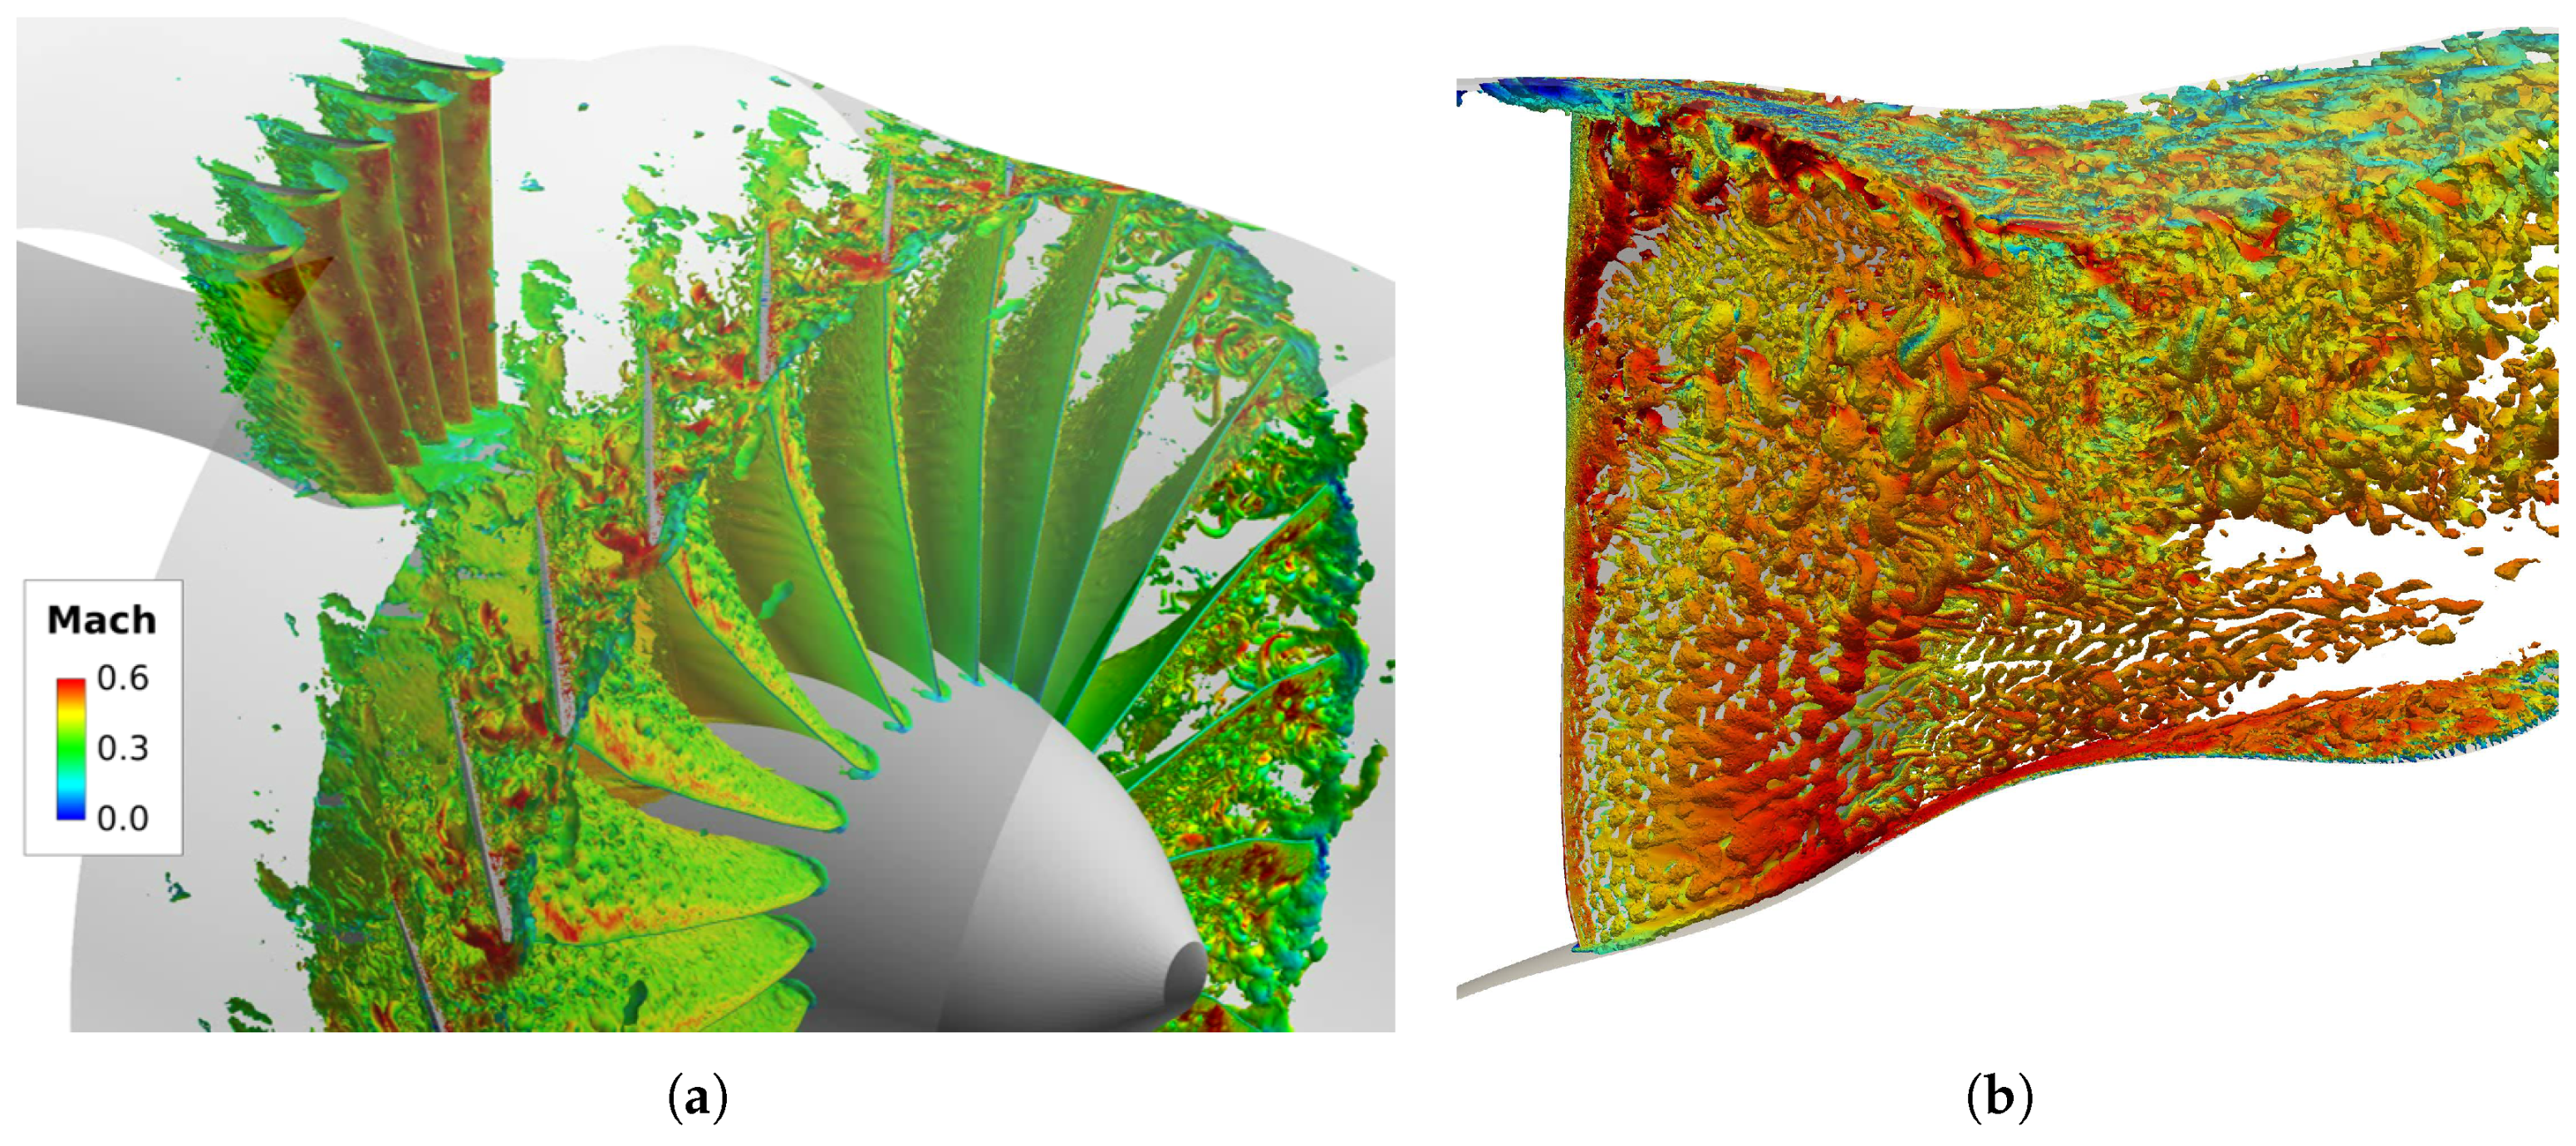
The flow topology is first shown in Figure 17 by iso-surfaces of the Q-criterion colored by the Mach number. On the one hand, only the suction sides of the blades show turbulent structures with a clear intensification of turbulence at mid-span on the upper part of the blade. For the finer rotor-alone simulation (Figure 17b), a clear radial vortex develops along the leading-edge, which breaks down at 75% span and merges with the tip leakage vortex. On the other hand hardly any structures are found on the pressure sides. Moving to a finer grid in the RO simulation (see Figure 6 in [96]) show some rollers and a transition on-set on the pressure side close to the tip. This is further emphasized by using the high-order TTG scheme. Large structures are also found in the tip region corresponding to the tip-leakage and tip-separation vortices. Pérez Arroyo et al. actually showed some migrations of the vortices from one blade to the other. This impingement might be one of the source of broadband noise at lower frequencies. Moreover, similarly to the CME2 case in Figure 12, the rotor wake do not yield an immediate transition to turbulence on the stator vanes, which is delayed to mid-chord.
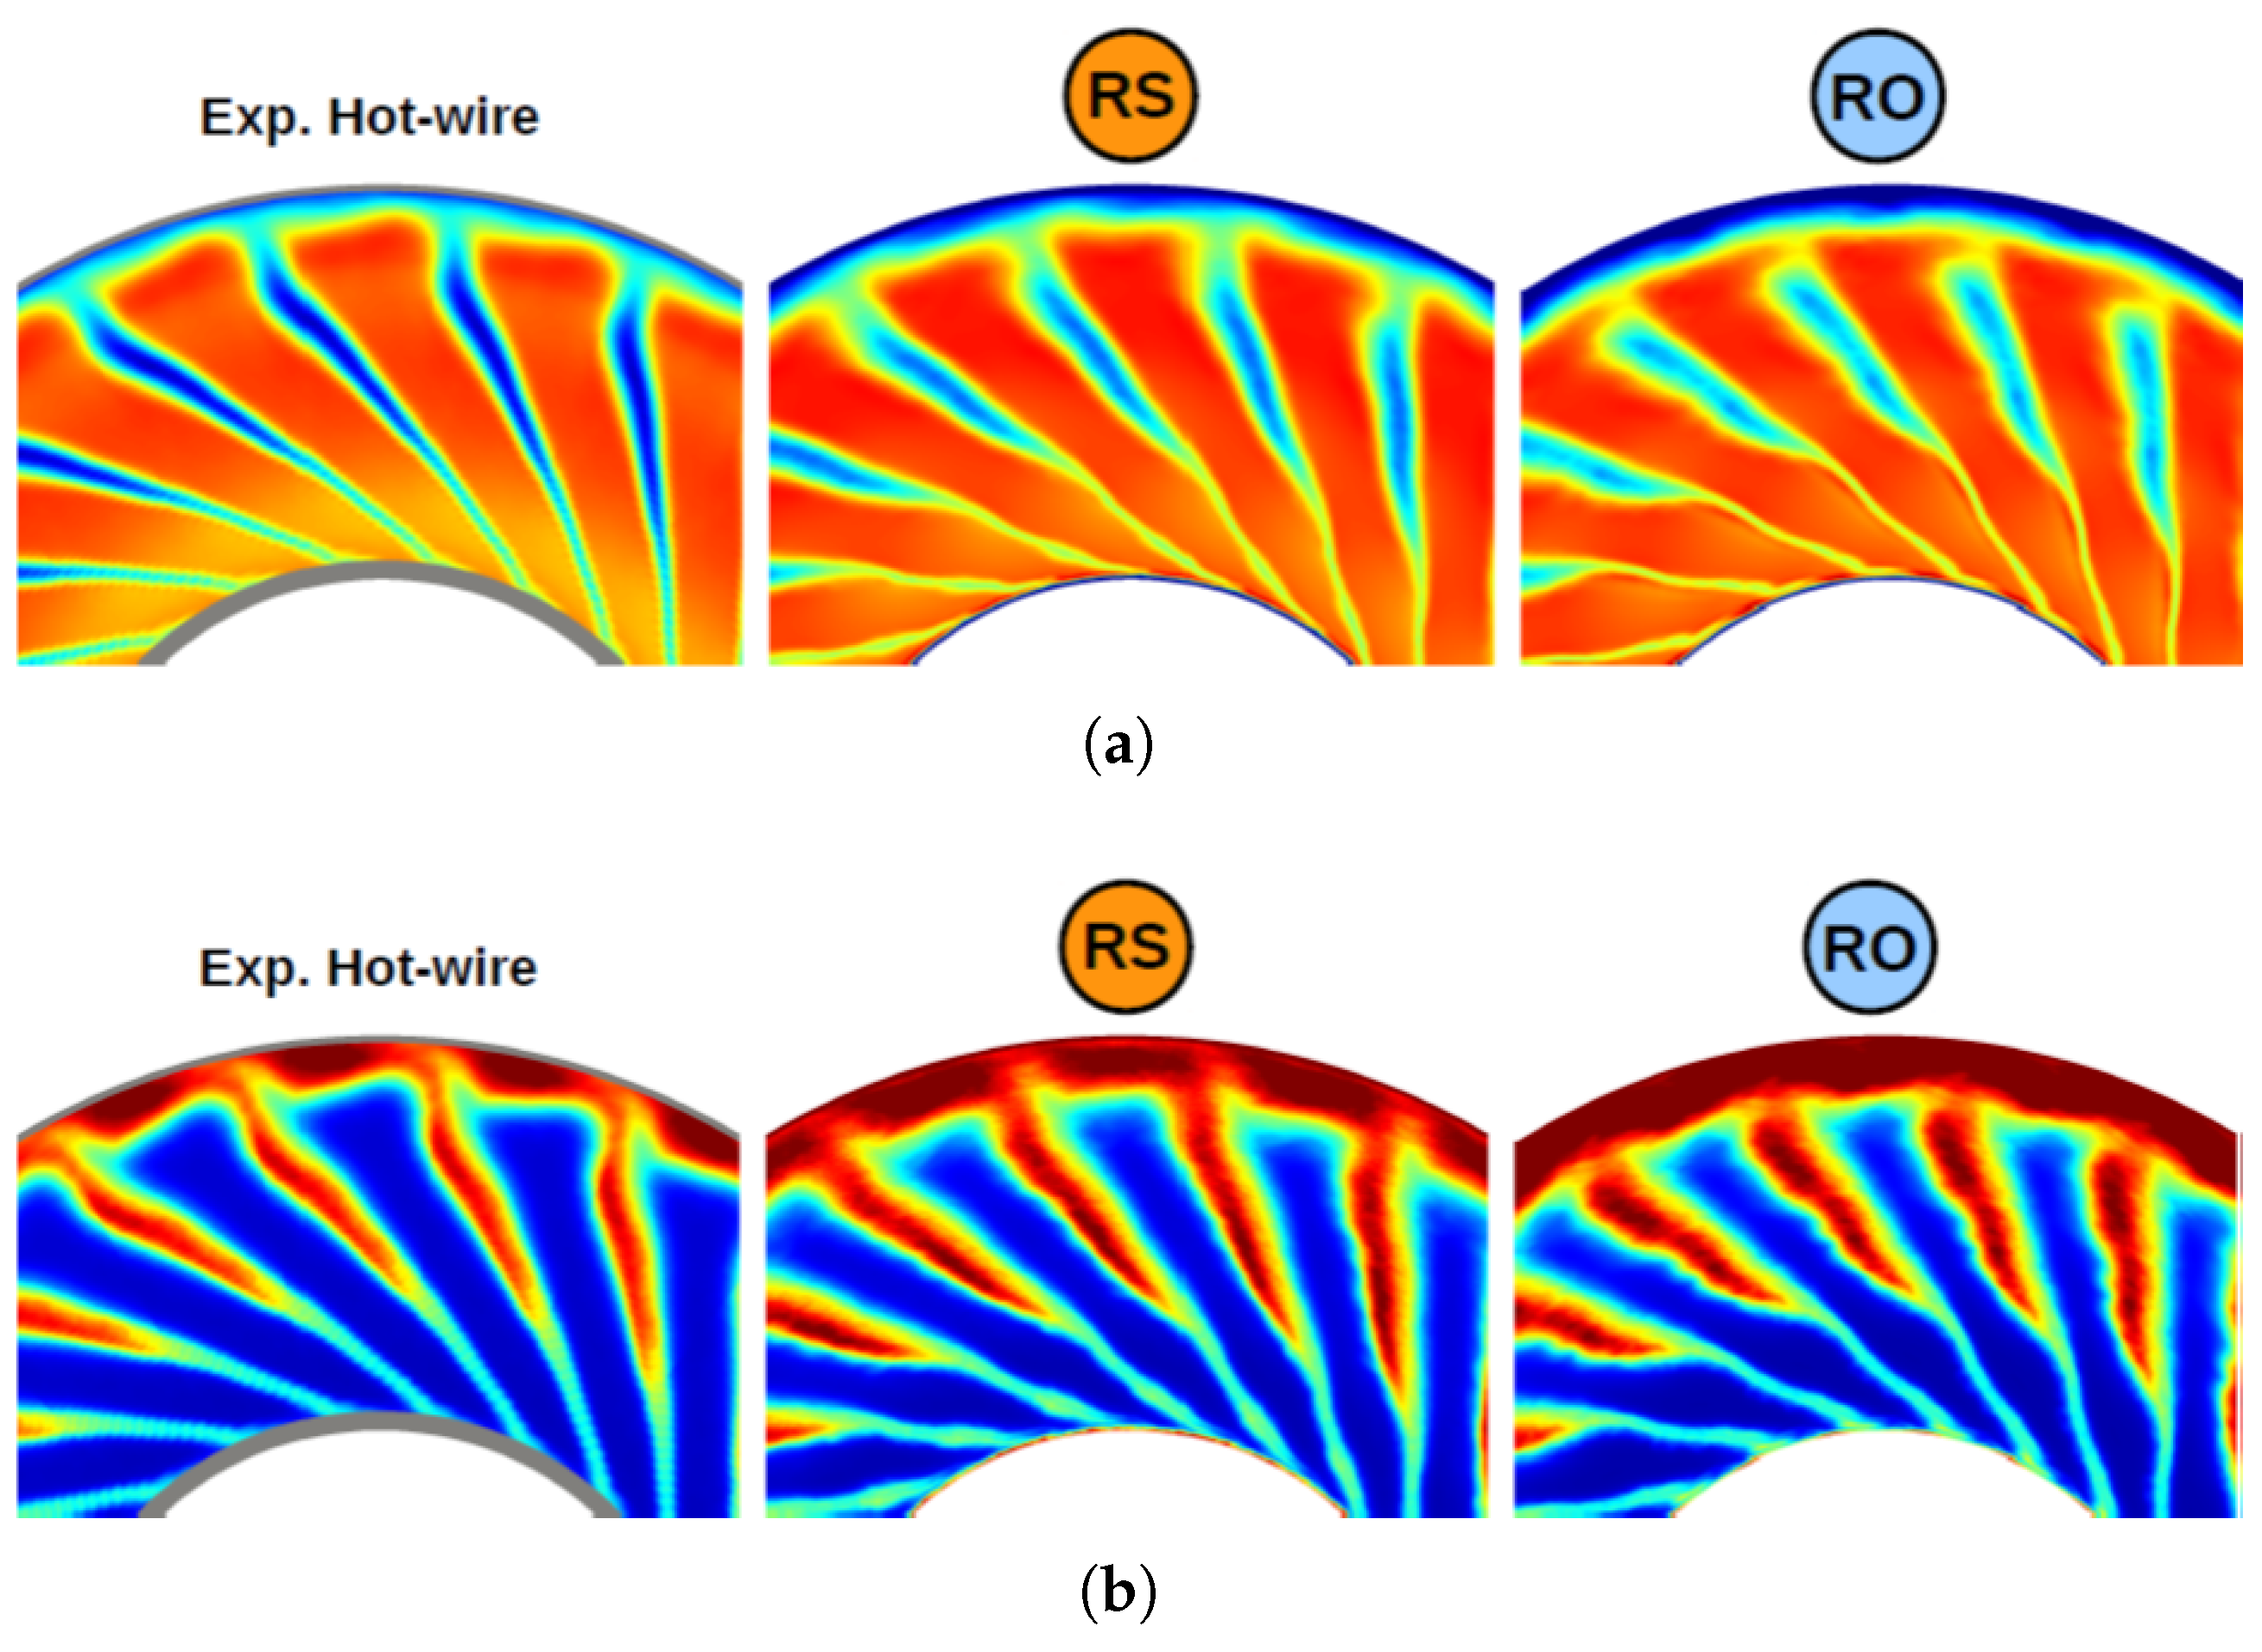
Overall predicted performances are then compared with experiment in Table 2 [97]. The mass-flow rate, , is underpredicted in both RS simulations: −1.12% for the RANS and −2.52% for the LES. It is slightly overpredicted in the RO simulation (+1.05%). The total pressure ratio, (where and are the averaged total pressure downstream and upstream of the rotor respectively), is slightly overpredicted in all simulations: +0.09% for the RANS-RS; +0.25% for the LES-RS; +1.04% for the LES-RO. Even though the flow conditions are slightly shifted, when rescaled with the averaged mean axial velocity, both the phase-locked average and root-mean-square (rms) velocity components compare favorably with hot-wire measurements at mid-distance between the rotor and the OGV. Figure 18 shows both the mean and rms axial velocities for the two experiments and the hot-wire measurement. In Figure 18a the twisting effect of the mean wake by the swirl is well captured by both RS and RO simulations. The latter slightly under-predicts the wake deficit, but captures its shape nicely without showing a S-shape at 70% as obtained by all RANS simulations (caused by a slight flow separation in the mean flow simulations) [94]. The top 10% of the channel is affected by the tip leakage flow, which is slightly overpredicted in all simulations (RANS and LES). In Figure 18b a good agreement of the LES results with the hot-wire measurements is seen. Noticeably the transition at mid-span, as already reported above in Figure 17, is nicely captured. Some overprediction of the fluctuations is also found near the tip-gap for the RO simulation, which can be traced to the more intense turbulence structures in the tip in this simulation. The same good agreement is found on the other velocity components and carries over to the stator leading edge in the other measurement plane. Another important result from these maps at these two stations is that the local turbulence is seen to be almost homogeneous and isotropic in the wake close to the stator vanes, which is similar to what Bonneau et al. found in a different turobengine fan-OGV simulation by Zonal Detached Eddy Simulation but with similar large fan-OGV distance [98]. This confirms one of the assumption used in the analytical models in Section 3.1. Note this might be less the case in future UHBR configurations for which the fan-OGV distance will be reduced.
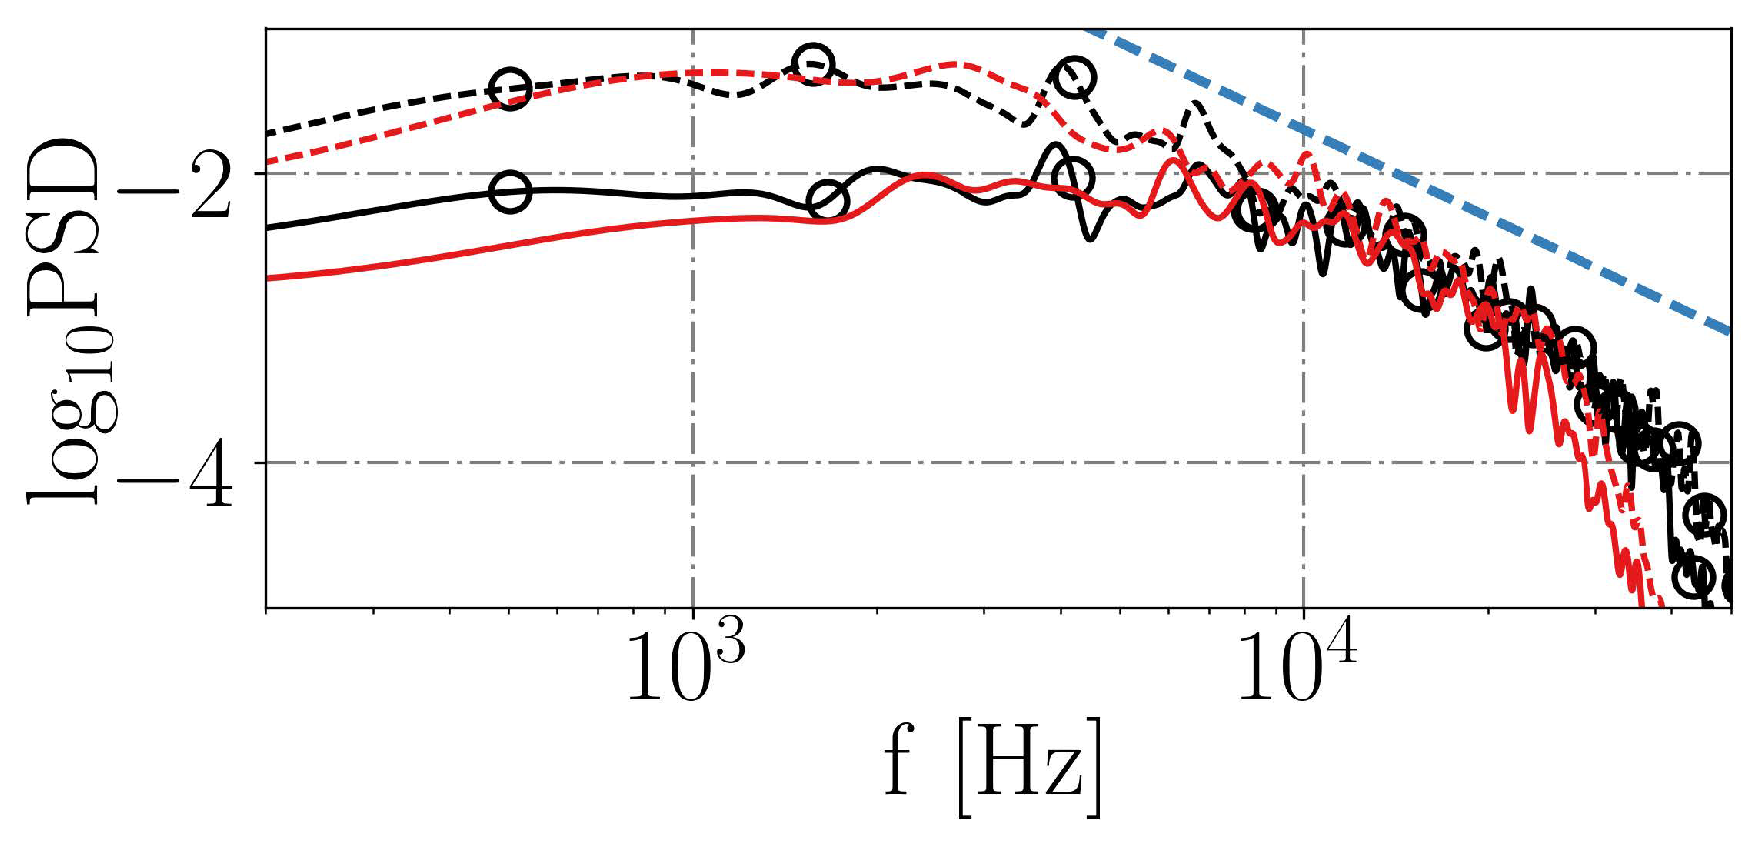
The improved resolution with the RO simulation can be seen by looking at wall-pressure spectra or velocity spectra in the wake. Figure 19 shows for instance the PSD of the axial velocity at two positions in the wake (solid and dashed lines respectively). The inertial range shown by the blue dashed line corresponding to a −5/3 slope is obtained in both cases stressing that the turbulence is properly developed in the simulations. The RO results (red lines) only extend the frequency range of the RS results (black lines) as more structures are resolved. Similar conclusions have been drawn on the wall-pressure spectra at different locations on the rotor blade [95,96].
Finally some sound predictions have been obtained by using both the FWH (free space) and Goldstein’s analogies applied on the stator vanes. The computed wall-pressure fluctuations on the stator vanes are then used as noise sources. Figure 20 compares the predicted SWL using both analogies with the RS results, and the NASA far field measurements [99]. Note that these spectra have been obtained by using the wall-pressure fluctuations on the five blades in the simulations and by multiplying by 11 the number of periodic sectors (the correlated case in [95]). The periodicity artificially introduces the BPF tone shown in these spectra. The FWH spectra are seen to overpredict the far field measurements (no cut-off of modes) whereas Goldstein’s analogy provides a much closer agreement. Note this was already found with the analytical models in Figure 11a. The slight overprediction at lower frequencies seen both upstream and downstream (Figure 20a,b respectively) might still be caused by too coherent structures in the tip gap yielding a too large tip noise.
The same 22-in Source Diagnostic Test fan rig of the NASA Glenn Research Center has also been simulated with the same LB-VLES flow model as in Section 2.3. Even though additional tripping was required on the rotor blades to yield the proper boundary-layer and wake development, no rescaling was needed and the finest simulations showed excellent acoustic predictions for all tested stator configurations at approach [100]. Note however that the same discrepancies on the casing as in the LES are found in all LB simulations: the axial velocity component is underestimated and exhibits a thicker boundary layer along the casing even though the mass-flow rate is predicted within 1%. The flexibility of the method also allowed including the effect of a 1-DOF honeycomb liner. Casalino et al. also tested the effect of leading-edge serrations on the reference OGV [101]. More recent simulations at high transonic speed (cut-back) even show promising results [102].
4. Conclusions
In future UHBR turboengines, turbomachinery noise is expected to become the main contributor in all flight conditions at least in the forward arc. Consequently, models and simulation methods must be devised to predict such a main noise source that can be seen as a combination of tonal and broadband noise, with possibly similar weight.
Most physically based analytical models are hybrid methods that couple Goldstein’s acoustic analogy in an annular duct with uniform axial flow, with unsteady pressure jumps obtained from the linearized Euler equations on very thin flat plates of finite chord length. The latter can be obtained for different noise mechanisms provided the excitation can be decomposed into harmonic gusts. For high solidity cases, only a 3-D rectilinear cascade has been derived for impinging vortical gusts. A strip theory is also applied to account for the actual blade geometry and the flow non uniformity from hub to tip. The simplified pressure jumps are then derived on each strip, two key features being to obtain 3-D blade responses to 3-D gusts. The corresponding tonal noise model is found to be a fair representation of the mode distribution in a turboengine with proper modal amplitudes. The associated broadband noise model is also found to mimic the correct spectra measured in the NASA-SDT configurations. On-going extensions of such a method is to include swirl and modified boundary conditions to account for liners with a realistic base flow to model the interstage more accurately, and to account for some geometrical features as camber and thickness. Future developments will also include extensions to the mode matching technique that may alleviate some of the inherent limitations of the present hybrid model.
Numerical predictions of tonal noise mostly rely on unsteady RANS computations either in the time domain or in Fourier space. They provide reliable tonal predictions within the experimental uncertainties and can now provide such predictions for even the most complicated 360 UHBR configurations with asymmetric inlets, full fan and heteregeneous OGVs and the internal stream split with IGVs. Such simulations show how this additional flow distortion may impact the noise sources and modifiy the balance in fan noise. For broadband noise, the simulations must simulate and resolve the turbulent structures up to the relevant maximum frequency, which in a turbofan is beyond 40 kHz. Only a few LES have been achieved so far for all turbomachinery components in an engine. They usually involve some rescaling of the blades and use wall functions because of the high Reynolds number involved. They have already provided valuable information on the transition processes at approach, on the transmision and reflection of combustion noise through a HP turbine stage, and on the broadband noise spectra of the current main noise source: the fan wake-OGV interaction. The LB-VLES method has also emerged as the most versatile and efficient numerical way to get both tonal and broadband noise at a reasonable turn-around cost.
Funding
This research received several external funding over the past twenty years, but benefited mostly from the two industrial Chairs that held the author over the past five years (Industrial Chair in Aeroacoustics at Université de Sherbrooke in Canada, and Industrial Chair ADOPSYS from the Agence Nationale de la Recherche in France).
Acknowledgments
This research was mostly enabled by the computational resources provided by Calcul Québec and Compute Canada. The author would like to thank E. Envia and D. Stuliff from NASA for providing the experimental data. He is also grateful to Cerfacs, Ecole Centrale de Lyon and Dassault Systems (former Exa). for providing us the computational codes and technical support.
Conflicts of Interest
The authors declare no conflict of interest.
References
- Hughes, C. NASA Collaborative Research on the Ultra High Bypass Engine Cycle and Potential Benefits for Noise, Performance, and Emissions; Technical Memorandum TM-2013-216345; NASA: Washington, DC, USA, 2013.
- Hultgren, L.S. Editorial: Emerging importance of turbine noise. Int. J. Aeroacoust. 2011, 10, i–iv. [Google Scholar] [CrossRef]
- Nesbitt, E. Towards a quieter low pressure turbine: Design characteristics and prediction needs. Int. J. Aeroacoust. 2011, 10, 1–15. [Google Scholar] [CrossRef]
- Moreau, S. Turbomachinery-related aeroacoustic modelling and simulation. In Proceedings of the 17th International Conference on Fluid Flow Technologies, Budapest, Hungary, 4–7 September 2018. [Google Scholar]
- Kontos, K.B.; Janardan, B.A.; Gliebe, P.R. Improved NASA-ANOPP Noise Prediction Computer Code for Advanced Subsonic Propulsion Systems Volume 1: ANOPP Evaluation and Fan Noise Model Improvement; Contractor Report CR-195480; NASA: Washington, DC, USA, 1986.
- Lopez, L.V.; Burley, C.L. Design of the next generation aircraft noise prediction program: ANOPP2. In Proceedings of the 17th AIAA/CEAS Aeroacoustics Conference (AIAA 2011-2854), Portland, OR, USA, 5–8 June 2011. [Google Scholar]
- Ffowcs Williams, J.E.; Hawkings, D.L. Sound Generation by Turbulence and Surfaces in Arbitrary Motion. Philo. Trans. R. Soc. Lond. A Math. Phys. Sci. 1969, 264, 321–342. [Google Scholar] [CrossRef]
- Ffowcs-Williams, J.E.; Hawkings, D.L. Theory relating to the noise of rotating machinery. J. Sound Vib. 1969, 10, 10–21. [Google Scholar] [CrossRef]
- Lowson, M.V. Theoretical Studies of Compressor Noise; Contractor Report CR-1287; NASA: Washington, DC, USA, 1969.
- Goldstein, M.E. Aeroacoustics; Mc Graw-Hill: New York, NY, USA, 1976. [Google Scholar]
- Daroukh, M.; Moreau, S.; Gourdain, N.; Boussuge, J.; Sensiau, C. Effect of Distortion on Turbofan Tonal Noise at Cutback with Hybrid Methods. Int. J. Turbomach. Propuls. Power 2017, 2, 16. [Google Scholar] [CrossRef]
- Posson, H.; Peake, N. The acoustic analogy in an annular duct with swirling mean flow. J. Fluid Mech. 2013, 726, 439–475. [Google Scholar] [CrossRef] [Green Version]
- Matthews, J.; Peake, N. The acoustic Green’s function for swirling flow in a lined duct. J. Sound Vib. 2017, 395, 294–316. [Google Scholar] [CrossRef]
- Moreau, S.; Roger, M. Advanced noise modeling for future propulsion systems. Int. J. Aeroacoust. 2018, 17, 576–599. [Google Scholar] [CrossRef]
- Roger, M.; Moreau, S. Extensions and limitations of analytical airfoil broadband noise models. Int. J. Aeroacoust. 2010, 9, 273–305. [Google Scholar] [CrossRef]
- Glegg, S.A.L. The response of a swept blade row to a three-dimensional gust. J. Sound Vib. 1999, 227, 29–64. [Google Scholar] [CrossRef]
- de Laborderie, J.; Moreau, S. Prediction of tonal ducted fan noise. J. Sound Vib. 2016, 372, 105–132. [Google Scholar] [CrossRef]
- de Laborderie, J.; Blandeau, V.; Node-Langlois, T.; Moreau, S. Extension of a Fan Tonal Noise Cascade Model for Camber Effects. AIAA J. 2015, 53, 863–876. [Google Scholar] [CrossRef]
- Topol, D.A. TFaNS Tone Fan Noise Design/Prediction System: User’s Manual, TFaNS Vers1.5; Contractor Report CR-2003-212380; NASA: Washington, DC, USA, 2003.
- Baddoo, P.; Ayton, L. An Analytic Solution for Gust Cascade Interaction Including Effects of Realistic Aerofoil Geometry—Inter-Blade Region. In Proceedings of the 24th AIAA/CEAS Aeroacoustics Conference (AIAA 2018-2957), Atlanta, GA, USA, 25–29 June 2018. [Google Scholar]
- Bouley, S.; François, B.; Roger, M.; Posson, H.; Moreau, S. On a two-dimensional mode-matching technique for sound generation and transmission in axial-flow outlet guide vanes. J. Sound Vib. 2017, 403, 190–213. [Google Scholar] [CrossRef]
- Hixon, R. Computational Aeroacoustics Prediction of Acoustic Transmission Through a Realistic 2D Stator. In Proceedings of the 17th AIAA/CEAS Aeroacoustics Conference (AIAA 2011-2706), Portland, OR, USA, 6–8 June 2011. [Google Scholar]
- Soulat, L.; Ferrrand, P.; Moreau, S.; Aubert, S.; Buisson, M. Efficient optimisation procedure for design problems in fluid mechanics. Comput. Fluids 2013, 82, 73–86. [Google Scholar] [CrossRef]
- Menter, F. Two-equation eddy-viscosity turbulence models for engineering applications. AIAA J. 1994, 32, 1598–1605. [Google Scholar] [CrossRef] [Green Version]
- Kok, J. Resolving the dependence on freestream values for the k-omega turbulence model. AIAA J. 2000, 38, 1292–1295. [Google Scholar] [CrossRef]
- Rai, M.; Madavan, N. Multi-Airfoil Navier–Stokes Simulations of Turbine Rotor-Stator Interaction. J. Turbomach. 1990, 112, 377–384. [Google Scholar] [CrossRef]
- Gerolymos, G.; Michon, G.; Neubauer, J. Analysis and application of chorochronic periodicity in turbomachinery rotor/stator interaction computations. J. Propuls. Power 2002, 18, 1139–1152. [Google Scholar] [CrossRef]
- Giles, M.B. Calculation of unsteady wake/rotor interaction. J. Propuls. Power 1988, 4, 356–362. [Google Scholar] [CrossRef]
- Guédeney, T.; Gomar, A.; Gallard, F.; Sicot, F.; Dufour, G.; Puigt, G. Non-uniform time sampling for multiple-frequency harmonic balance computations. J. Comput. Phys. 2013, 236, 317–345. [Google Scholar] [CrossRef] [Green Version]
- Chen, S.; Dooler, G.D. Lattice Boltzmann method for fluid flows. Ann. Rev. Fluid Mech. 1998, 30, 329–364. [Google Scholar] [CrossRef]
- Brès, G.; Pérot, F.; Freed, D. Properties of the Lattice–Boltzmann Method for Acoustics. In Proceedings of the 15th AIAA/CEAS Aeroacoustics Conference (AIAA 2009-3395), Miami, FL, USA, 11–13 May 2009. [Google Scholar]
- Peake, N.; Parry, A.B. Modern challenges facing turbomachinery aeroacoustics. Annu. Rev. Fluid. Mech. 2012, 44, 227–248. [Google Scholar] [CrossRef]
- de Laborderie, J.; Soulat, L.; Moreau, S. Prediction of Noise Sources in Axial Compressor from URANS Simulation. J. Propuls. Power 2014, 30, 1257–1271. [Google Scholar] [CrossRef]
- de Laborderie, J.; Moreau, S. Evaluation of a Cascade-Based Acoustic Model for Fan Tonal Noise Prediction. AIAA J. 2014, 52, 2877–2890. [Google Scholar] [CrossRef]
- Sanjosé, M.; Daroukh, M.; Magnet, W.; De Laborderie, J.; Moreau, S.; Mann, A. Tonal fan noise prediction and validation on the ANCF configuration. Noise Control Eng. J. 2015, 63, 552–562. [Google Scholar] [CrossRef]
- Sanjosé, M.; Moreau, S.; Pestana, M.; Roger, M. Effect of Weak Outlet-Guide-Vane Heterogeneity on Rotor-Stator Tonal Noise. AIAA J. 2017, 55, 3440–3457. [Google Scholar] [CrossRef]
- Parker, R. Resonant effects in wake shedding from parallel plates: Calculation of resonant frequencies. J. Sound Vib. 1967, 5, 330–343. [Google Scholar] [CrossRef]
- Holewa, A.; Weckmüller, C.; Guérin, S. Impact of bypass duct bifurcations on fan noise. J. Propuls. Power 2014, 30, 143–152. [Google Scholar] [CrossRef]
- Winkler, J.; Moreau, S.; Carolus, T. Turbofan Inlet Distortion Noise Prediction with a Hybrid CFD-CAA Approach. In Proceedings of the 20th AIAA/CEAS Aeroacoustics Conference (AIAA 2014-3102), Atlanta, GA, USA, 16–20 June 2014. [Google Scholar]
- Daroukh, M.; Moreau, S.; Gourdain, N.; Boussuge, J.; Sensiau, C. Complete Prediction of Modern Turbofan Tonal Noise at Transonic Regime. In Proceedings of the 17th International Symposium on Transport Phenomena and Dynamics of Rotating Machinery, Lahaina, HI, USA, 16–21 December 2017. [Google Scholar]
- Pardowitz, B.; Tapken, U.; Neuhaus, L.; Enghardt, L. Experiments on an Axial Fan Stage: Time-Resolved Analysis of Rotating Instability Modes. J. Eng. Gas Turb. Power 2015, 137, 062505. [Google Scholar] [CrossRef]
- Cudina, M. Noise Generation in Vane Axial Fans due to Rotating Stall and Surge. Proc. Inst. Mech. Eng. Part C J. Mech. Eng. Sci. 2001, 215, 57–64. [Google Scholar] [CrossRef]
- Crevel, F.; Gourdain, N.; Moreau, S. Numerical simulation of aerodynamic instabilities in a multistage high-speed high-pressure compressor on its test-rig: Part 1—Rotating stall. J. Turbomach. 2014, 136, 101003. [Google Scholar] [CrossRef]
- Blandeau, V.; Joseph, P.; Kingan, M.; Parry, A. Broadband noise predictions from uninstalled contra-rotating open rotors. Int. J. Aeroacoust. 2013, 12, 245–282. [Google Scholar] [CrossRef]
- Paterson, R.W.; Amiet, R.K. Noise of a Model Helicopter Rotor Due to Ingestion of Turbulence; Contractor Report CR-3213; NASA: Washington, DC, USA, 1979.
- Schlinker, R.H.; Amiet, R.K. Helicopter Rotor Trailing Edge; Contractor Report CR-3470; NASA: Washington, DC, USA, 1981.
- Amiet, R.K. Acoustic radiation from an airfoil in a turbulent stream. J. Sound Vib. 1975, 41, 407–420. [Google Scholar] [CrossRef]
- Amiet, R.K. Noise due to turbulent flow past a trailing edge. J. Sound Vib. 1976, 47, 387–393. [Google Scholar] [CrossRef]
- Roger, M.; Moreau, S. Back-scattering correction and further extensions of Amiet’s trailing edge noise model. Part 1: Theory. J. Sound Vib. 2005, 286, 477–506. [Google Scholar] [CrossRef]
- Moreau, S.; Roger, M. Back-scattering correction and further extensions of Amiet’s trailing-edge noise model. Part II: Application. J. Sound Vib. 2009, 323, 397–425. [Google Scholar] [CrossRef]
- Roger, M.; Moreau, S.; Guedel, A. Broadband Fan Noise Prediction using Single-Airfoil Theory. Noise Control Eng. J. 2006, 54, 5–14. [Google Scholar] [CrossRef]
- Sanjosé, M.; Moreau, S. Fast and accurate analytical modeling of broadband noise for a low-speed fan. J. Acoust. Soc. Am. 2018, 143, 3103–3113. [Google Scholar] [CrossRef]
- Sinayoko, S.; Kingan, M.; Agarwal, A. Trailing edge noise theory for rotating blades in uniform flow. Proc. R. Soc. A Math. Phys. Eng. Sci. 2013, 469, 20130065. [Google Scholar] [CrossRef]
- Hanson, D.B. Theory of Broadband Noise for Rotor and Stator Cascade with Inhomogeneous Inflow Turbulence including Effects of Lean and Sweep; Contractor Report CR-210762; NASA: Washington, DC, USA, 2001.
- Glegg, S.A.L.; Jochault, C. Broadband self-noise from a ducted fan. AIAA J. 1998, 36, 1387–1395. [Google Scholar] [CrossRef]
- Smith, S.N. Discrete Frequency Sound Generation in Axial Flow Turbomachines; H.M. Stationery Office: Richmond, UK, 1973; Volume 3709, pp. 1–59. [Google Scholar]
- Ventres, C.S.; Theobald, M.A.; Mark, W.D. Turbofan Noise Generation, Volume 1: Analysis; Contractor Report CR-167952; NASA: Washington, DC, USA, 1982.
- Nallasamy, M.; Envia, E. Computation of rotor wake turbulence noise. J. Sound Vib. 2005, 282, 649–678. [Google Scholar] [CrossRef]
- Posson, H.; Roger, M.; Moreau, S. On a uniformly valid analytical rectilinear cascade response function. J. Fluid Mech. 2010, 663, 22–52. [Google Scholar] [CrossRef] [Green Version]
- Posson, H.; Moreau, S.; Roger, M. On the use of a uniformly valid analytical cascade response function for fan broadband noise predictions. J. Sound Vib. 2010, 329, 3721–3743. [Google Scholar] [CrossRef]
- Posson, H.; Moreau, S.; Roger, M. Broadband noise prediction of fan outlet guide vane using a cascade response function. J. Sound Vib. 2011, 330, 6153–6183. [Google Scholar] [CrossRef]
- Masson, V.; Posson, H.; Sanjosé, M.; Moreau, S.; Roger, M. Fan-OGV interaction broadband noise prediction in a rigid annular duct with swirling and sheared mean flow. In Proceedings of the 22nd AIAA/CEAS Aeroacoustics Conference (AIAA 2016-2944), Lyon, France, 30 May–1 June 2016. [Google Scholar]
- Moreau, S.; Roger, M.; Jurdic, V. Effect of angle of attack and airfoil shape on Turbulence-Interaction Noise. In Proceedings of the 11th AIAA/CEAS Aeroacoustics Conference Meeting and Exhibit (AIAA 2005-2973), Monterey, CA, USA, 23–25 May 2005. [Google Scholar]
- Grace, S.M. Fan broadband interaction noise modeling using a low-order method. J. Sound Vib. 2015, 346, 402–423. [Google Scholar] [CrossRef]
- Elhadidi, B.; Atassi, H.M. Sound generation and scattering from radial vanes in uniform flow. In Proceedings of the Seventh International Conference of Fluid Dynamics and Propulsion (ICFDP7), Sharm El-Sheikh, Egypt, 18–20 December 2001; Volume AAC-3. [Google Scholar]
- François, B.; Bouley, S.; Roger, M.; Moreau, S. Analytical models based on a mode-matching technique for turbulence impingement noise on axial-flow outlet guide vanes. In Proceedings of the 22nd AIAA/CEAS Aeroacoustics Conference and Exhibit (AIAA 2016-2947), Lyon, France, 30 May–1 June 2016. [Google Scholar]
- Schram, C.; Christophe, J.; Shur, M.; Strelets, M.; Travin, A.; Wolhbrandt, A.; Guérin, S.; Ewert, R.; Martinez-Lera, P.; Tournour, M.; et al. Fan noise predictions using scale-resolved, statistical, stochastic and semi-analytical models. In Proceedings of the 23rd AIAA/CEAS Aeroacoustics Conference and Exhibit (AIAA 2017-3386), Denver, CO, USA, 5–9 June 2017. [Google Scholar]
- François, B.; Roger, M.; Moreau, S. Cascade trailing-edge noise modeling using a mode-matching technique and the edge-dipole theory. J. Sound Vib. 2016, 382, 310–327. [Google Scholar]
- Schönfeld, T.; Rudgyard, M. Steady and Unsteady Flows Simulations Using the Hybrid Flow Solver AVBP. AIAA J. 1999, 37, 1378–1385. [Google Scholar] [CrossRef]
- Lévèque, E.; Toschi, F.; Shao, L.; Bertoglio, J.P. Shear-Improved Smagorinsky model for large-eddy simulation of wall-bounded turbulent flows. J. Fluid Mech. 2007, 570, 491–502. [Google Scholar] [CrossRef]
- Nicoud, F.; Ducros, F. Subgrid-scale stress modelling based on the square of the velocity gradient. Flow Turb. Combust. 1999, 62, 183–200. [Google Scholar] [CrossRef]
- Smagorinsky, J. General circulation experiments with the primitive equations: I. The basic experiment. Mon. Weather Rev. 1963, 91, 99–164. [Google Scholar] [CrossRef]
- Wang, G.; Moreau, S.; Duchaine, F.; Gourdain, N.; Gicquel, L.Y.M. Large Eddy Simulations of the MT1 high-pressure turbine using TurboAVBP. In Proceedings of the 21st Annual Conference of the CFD Society of Canada, Sherbrooke, QC, Canada, 6–9 May 2013. [Google Scholar]
- Papadogiannis, D.; Duchaine, F.; Gicquel, L.; Wang, G.; Moreau, S. Effects of SGS modeling on the deterministic and stochastic turbulent energetic distribution in LES of a high pressure turbine stage. J. Turbomach. 2016, 138, 091005. [Google Scholar] [CrossRef]
- Wang, G.; Duchaine, F.; Papadogiannis, D.; Duran, I.; Moreau, S.; Gicquel, L. An overset grid method for large eddy simulation of turbomachinery stages. J. Comput. Phys. 2014, 274, 333–355. [Google Scholar] [CrossRef]
- de Laborderie, J.; Duchaine, F.; Gicquel, L.Y.M.; Vermorel, O.; Wang, G.; Moreau, S. Numerical analysis of a high-order unstructured overset grid method for compressible LES of turbomachinery. J. Comput. Phys. 2018, 363, 371–398. [Google Scholar] [CrossRef]
- Colin, O.; Rudgyard, M. Development of high-order Taylor-Galerkin schemes for unsteady calculations. J. Comput. Phys. 2000, 162, 338–371. [Google Scholar] [CrossRef]
- Lax, P.D.; Wendroff, B. Difference schemes for hyperbolic equations with high order of accuracy. Commun. Pure Appl. Math. 1964, 17, 381–398. [Google Scholar] [CrossRef]
- Wang, G.; Sanjosé, M.; Moreau, S.; Papadogiannis, D.; Duchaine, F.; Gicquel, L. Noise mechanisms in a transonic high-pressure turbine stage. Int. J. Aeroacoust. 2016, 15. [Google Scholar] [CrossRef]
- Poinsot, T.; Lele, S. Boundary conditions for direct simulations of compressible viscous flows. J. Comput. Phys. 1992, 101, 104–129. [Google Scholar] [CrossRef]
- Odier, N.; Sanjosé, M.; Gicquel, L.; Poinsot, T.; Moreau, S.; Duchaine, F. A characteristic inlet boundary condition for compressible, turbulent, multispecies turbomachinery flows. Comput. Fluids 2019, 178, 41–55. [Google Scholar] [CrossRef]
- Mouret, G.; Gourdain, N.; Castillon, L. Adaptation of phase-lagged boundary conditions to Large Eddy Simulation in turbomachinery configurations. J. Turbomach. 2016, 138, 041003. [Google Scholar] [CrossRef]
- de Laborderie, J.; Moreau, S.; Berry, A. Compressor Stage Broadband Noise Prediction using a Large-Eddy Simulation and Comparisons with a Cascade Response Model. In Proceedings of the 19th AIAA/CEAS Aeroacoustics Conference (AIAA 2013-2042), Berlin, Germany, 27–29 June 2013. [Google Scholar]
- Wang, G.; Moreau, S.; Duchaine, F.; de Laborderie, J.; Gicquel, L.Y.M. LES Investigation of Aerodynamics Performance in an Axial Compressor Stage. In Proceedings of the 22nd Annual Conference of the CFD Society of Canada, Toronto, ON, Canada, 1–4 June 2014. [Google Scholar]
- Faure, T.M.; Michon, G.J.; Miton, H.; Vassilieff, N. Laser Doppler Anemometry Measurements in an Axial Compressor Stage. J. Propuls. Power 2001, 17, 481–491. [Google Scholar] [CrossRef]
- Qureshi, I.; Smith, A.D.; Chana, K.S.; Povey, T. Effect of Temperature Nonuniformity on Heat Transfer in an Unshrouded Transonic HP Turbine: An Experimental and Computational Investigation. J. Turbomach. 2014, 134, 011005. [Google Scholar] [CrossRef]
- Livebardon, T.; Moreau, S.; Gicquel, L.; Poinsot, T.; Bouty, E. Combining LES of combustion chamber and an actuator disk theory to predict combustion noise in a helicopter engine. Combust. Flames 2016, 165, 272–287. [Google Scholar] [CrossRef] [Green Version]
- Papadogiannis, D.; Duchaine, F.; Gicquel, L.; Wang, G.; Moreau, S.; Nicoud, F. Assessment of the indirect combustion noise generated in a transonic high-pressure turbine stage. J. Eng. Gas Turbines Power 2016, 138, 041503. [Google Scholar] [CrossRef]
- Cumpsty, N.A.; Marble, F.E. The interaction of entropy fluctuations with turbine blade rows—A mechanism of turbojet engine noise. Proc. R. Soc. Lond. Ser. A Math. Phys. Sci. 1977, 357, 323–344. [Google Scholar] [CrossRef]
- Leyko, M.; Duran, I.; Moreau, S.; Nicoud, F.; Poinsot, T. Simulation and Modelling of the waves transmission and generation in a stator blade row in a combustion-noise framework. J. Sound Vib. 2014, 333, 6090–6106. [Google Scholar] [CrossRef]
- Bauerheim, M.; Duran, I.; Livebardon, T.; Wang, G.; Moreau, S.; Poinsot, T. Transmission and reflection of acoustic and entropy waves through a stator-rotor stage. J. Sound Vib. 2016, 374, 260–278. [Google Scholar] [CrossRef]
- Becerril, C.; Moreau, S.; Gicquel, L.Y.M. Study of Combustion Noise Generation in a Realistic Turbine Stage Configuration; GT2018-75062; ASME Turbo Expo: Oslo, Norway, 2018. [Google Scholar]
- Schmid, P. Dynamic Mode Decomposition of numerical and experimental data. J. Fluid Mech. 2010, 656, 5–28. [Google Scholar] [CrossRef]
- Leonard, T.; Sanjosé, M.; Moreau, S.; Duchaine, F. Large Eddy Simulation of a scale-model turbofan for fan noise source diagnostic. In Proceedings of the 22nd AIAA/CEAS Aeroacoustics Conference (AIAA 2016-3000), Lyon, France, 30 May–1 June 2016. [Google Scholar]
- Pérez Arroyo, C.; Leonard, T.; Sanjosé, M.; Moreau, S.; Duchaine, F. Large Eddy Simulation of a Scale-model Turbofan for Fan Noise Source Diagnostic. In Proceedings of the 17th International Symposium on Transport Phenomena and Dynamics of Rotating Machinery, Lahaina, HI, USA, 16–21 December 2017. [Google Scholar]
- Pérez Arroyo, C.; Leonard, T.; Sanjosé, M.; Moreau, S.; Duchaine, F. Large Eddy Simulation of a rotor stage for Fan Noise Source Diagnostic. In Proceedings of the Global Power and Propulsion Forum, Montreal, QC, Canada, 7–9 May 2018. [Google Scholar]
- Hughes, C.; Jeracki, R.; Woodward, R.; Miller, C. Fan Noise Source Diagnostic Test-Rotor Alone Aerodynamic Performance Results. In Proceedings of the 8th AIAA/CEAS Aeroacoustics Conference & Exhibit (AIAA-2002-2426), Breckenridge, CO, USA, 17–19 June 2002. [Google Scholar]
- Bonneau, V.; Polacsek, C.; Castillon, L.; Marty, J.; Gervais, Y.; Moreau, S. Turbofan broadband noise predictions using a 3D ZDES rotor blade approach. In Proceedings of the 22nd AIAA/CEAS Aeroacoustics Conference and Exhibit (AIAA 2016-2950), Lyon, France, 30 May–1 June 2016. [Google Scholar]
- Woodward, R.P.; Hughes, C.E.; Jeracki, R.J.; Miller, C.J. Fan Noise Source Diagnostic Test-Far-Field Acoustic Results; Technical Memorandum TM-2002-211591; NASA: Washington, DC, USA, 2002.
- Casalino, D.; Hazir, A.; Mann, A. Turbofan Broadband Noise Prediction Using the Lattice Boltzmann Method. AIAA J. 2018, 56, 609–628. [Google Scholar] [CrossRef]
- Casalino, D.; Avallone, F.; Gonzales-Martino, I.; Ragni, D. Aeroacoustic study of a wavy stator leading edge in a realistic fan/OGV stage. In Proceedings of the International Symposium on Transport Phenomena and Dynamics of Rotating Machinery (ISROMAC-17), Maui, HI, USA, 16–21 December 2017. [Google Scholar]
- Gonzalez-Martino, I.; Casalino, D. Fan Tonal and Broadband Noise Simulations at Transonic Operating Conditions Using Lattice–Boltzmann Methods. In Proceedings of the 24th AIAA/CEAS Aeroacoustics Conference (AIAA 2018-3395), Atlanta, GA, USA, 25–29 June 2018. [Google Scholar]
Figure 1.
Typical turboengine spectrum and future trends for UHBR architectures.

Figure 2.
Sketch of turbofan noise sources.

Figure 3.
Axial velocity and wall-pressure contours in axial compressors. (a) CME2 research low pressure compressor; (b) Simplified thick flat plate cascade (extracted from CME2 midpsan section).
Figure 3.
Axial velocity and wall-pressure contours in axial compressors. (a) CME2 research low pressure compressor; (b) Simplified thick flat plate cascade (extracted from CME2 midpsan section).

Figure 4.
Source and noise from the simplified CME2 compressor at BPF. (a) Pressure jump; solid line: analytical model, dashed line: CFD; (b) Upstream sound power level (SWL); black bar: analytical model, white bar: CFD.
Figure 4.
Source and noise from the simplified CME2 compressor at BPF. (a) Pressure jump; solid line: analytical model, dashed line: CFD; (b) Upstream sound power level (SWL); black bar: analytical model, white bar: CFD.

Figure 5.
Downstream acoustic mode power predicted in the ANCF 14 stator vane-Half Chord configuration. (a) 1 BPF; (b) 2 BPF.
Figure 5.
Downstream acoustic mode power predicted in the ANCF 14 stator vane-Half Chord configuration. (a) 1 BPF; (b) 2 BPF.

Figure 6.
Noise mechanisms in ANCF stage: pressure and axial velocity instantaneous fields for heterogeneous. (a) Rotor–stator interstage cut at 50% of the section height; (b) Time harmonic 38 in the rotor reference frame.
Figure 6.
Noise mechanisms in ANCF stage: pressure and axial velocity instantaneous fields for heterogeneous. (a) Rotor–stator interstage cut at 50% of the section height; (b) Time harmonic 38 in the rotor reference frame.

Figure 7.
Upstream modal powers of the second BPF harmonic in ANCF stage for . Comparison between numerical simulation and analytical predictions for the upstream distortion-interaction noise, the potential-interaction noise, and the wake-interaction noise. (a) Homogeneous configuration; (b) Heterogeneous configuration.

Figure 8.
Isosurface of the Q-criterion colored by the vorticity modulus for the axisymmetric air inlet case.
Figure 8.
Isosurface of the Q-criterion colored by the vorticity modulus for the axisymmetric air inlet case.

Figure 9.
Upstream acoustic penalty induced by asymmetric inlet at approach on wake-interaction (hatched blue) and on distortion noise (crosshatched red).
Figure 9.
Upstream acoustic penalty induced by asymmetric inlet at approach on wake-interaction (hatched blue) and on distortion noise (crosshatched red).

Figure 10.
Entropy contours: two rotating stall cells in the third stage of the CREATE compressor rig.
Figure 10.
Entropy contours: two rotating stall cells in the third stage of the CREATE compressor rig.

Figure 11.
Upstream sound power level (SWL) from the NASA-SDT reference case at approach. (a) Effect of blade response and upwash velocity spectrum; black: experiment, red: Hanson, blue: Ventres, green: Posson; purple: Ventres+Gaussian spectrum; (b) Effect of swirl; black: experiment, green: Posson, red: Masson.

Figure 12.
LES of CME2 research low-pressure compressor. (a) Iso-contours of Q-criterion; (b) Iso-contours of dilatation field.
Figure 12.
LES of CME2 research low-pressure compressor. (a) Iso-contours of Q-criterion; (b) Iso-contours of dilatation field.

Figure 13.
Instantaneous Schlieren plots (contours ) at midspan on M4 grid.

Figure 14.
Comparisons of MT1 LES results with experiment [86]. (a) Isentropic Mach number on the stator blade on M4; (b) Radial azimuthally averaged profiles in the near blade behind the rotor.
Figure 14.
Comparisons of MT1 LES results with experiment [86]. (a) Isentropic Mach number on the stator blade on M4; (b) Radial azimuthally averaged profiles in the near blade behind the rotor.

Figure 15.
Instantaneous Schlieren plots (contours ) at midspan colored by the Mach number. (a) Clean inflow; (b) Pulsed case.
Figure 15.
Instantaneous Schlieren plots (contours ) at midspan colored by the Mach number. (a) Clean inflow; (b) Pulsed case.

Figure 16.
MT1 comparison between the analytical model, the numerical simulation using different runtimes and entropy plane wave forced simulation [88]. (a) Entropy-entropy transmission coefficient; (b) Entropy-acoustic transmission coefficient.
Figure 16.
MT1 comparison between the analytical model, the numerical simulation using different runtimes and entropy plane wave forced simulation [88]. (a) Entropy-entropy transmission coefficient; (b) Entropy-acoustic transmission coefficient.

Figure 17.
SDT Q-criterion iso-surfaces colored by the Mach number. (a) Rotor-Stator; (b) Rotor alone.
Figure 17.
SDT Q-criterion iso-surfaces colored by the Mach number. (a) Rotor-Stator; (b) Rotor alone.

Figure 18.
SDT axial velocity iso-contours at mid-distance between the rotor and the OGV. (a) Mean axial velocity; (b) rms axial velocity.
Figure 18.
SDT axial velocity iso-contours at mid-distance between the rotor and the OGV. (a) Mean axial velocity; (b) rms axial velocity.

Figure 19.
SDT PSD of axial velocity at two different positions in the wake (solid and dashed lines). RO: red lines; RS: black lines. Blue dashed line: .
Figure 19.
SDT PSD of axial velocity at two different positions in the wake (solid and dashed lines). RO: red lines; RS: black lines. Blue dashed line: .

Figure 20.
SDT comparison of predicted SWL using FHW and Goldstein analogies with experiment [99]. (a) Upstream SWL; (b) Downstream SWL.
Figure 20.
SDT comparison of predicted SWL using FHW and Goldstein analogies with experiment [99]. (a) Upstream SWL; (b) Downstream SWL.


Table 1.
Grid study for the MT1 LES (CPU time in h/rev).
| Case | Cells | CPU Time | |
|---|---|---|---|
| M1 | 13 × 10 | 50–150 | 4 × 10 |
| M2 | 41 × 10 | 4–120 | 3 × 10 |
| M3 | 68 × 10 | 2–30 | 1.7 × 10 |
| M4 | 129 × 10 | 1–15 | 8 × 10 |
Table 2.
Performances for the baseline configuration at approach and mean axial velocity Vref at mid-distance between the rotor and the OGV.
Table 2.
Performances for the baseline configuration at approach and mean axial velocity Vref at mid-distance between the rotor and the OGV.
| Case | (kg/s) | (m/s) | |
|---|---|---|---|
| Experiment | 26.44 | 1.159 | 112.42 |
| RANS-RS | 26.14 | 1.160 | 107.01 |
| LES-RS | 25.77 | 1.162 | 105.40 |
| LES-RO | 26.72 | 1.171 | 105.65 |
© 2019 by the author. Licensee MDPI, Basel, Switzerland. This article is an open access article distributed under the terms and conditions of the Creative Commons Attribution (CC BY) license (http://creativecommons.org/licenses/by/4.0/).
Share and Cite
MDPI and ACS Style
Moreau, S. Turbomachinery Noise Predictions: Present and Future. Acoustics 2019, 1, 92-116. https://doi.org/10.3390/acoustics1010008
AMA Style
Moreau S. Turbomachinery Noise Predictions: Present and Future. Acoustics. 2019; 1(1):92-116. https://doi.org/10.3390/acoustics1010008
Chicago/Turabian StyleMoreau, Stéphane. 2019. "Turbomachinery Noise Predictions: Present and Future" Acoustics 1, no. 1: 92-116. https://doi.org/10.3390/acoustics1010008