1. Introduction
The movement pattern of unmanned aerial vehicles (UAVs) [
1] in UAANET depends on the type of application for which they are being used. For example, a mobility model that allows the nodes to move independently from one another is more suitable in searching missions where a large area has to be scoured.
Mobility models can be classified into two main groups: path-defined mobility models and random mobility models. In path-defined mobility models, a path is predefined for the node to follow. The positions that the nodes are going to go through are set in advance. In random mobility models, the positions are computed “as we go”. Such models are more suitable for searching missions where the information available about the searched area is minimal. Random mobility models can be further classified into two main groups: group mobility models and entity mobility models. In group mobility models, the nodes move as a group, following a group leader. Conversely, in entity mobility models, the nodes move independently from one another. Since our main interest is in searching missions in UAANET, this paper focuses on random entity mobility models.
The deployment of UAANET is still not widespread nowadays. Consequently, real-life measurements for pure research purposes are mostly non-existent and, where available, can be very expensive. Therefore, the research community has to rely on simulations as an alternative in order to develop and evaluate routing protocols. The mobility models used in simulations play a central role in such a context. It actually would be nice to design routing protocols that are insensitive to mobility patterns and that would perform well regardless of the mobility pattern used in the simulation. Since this is mostly not the case, this paper conducts an in-depth experimental study to understand how and why mobility models affect the performance of routing protocols in UAANET in the context of search missions.
An accurate evaluation of the impact of the mobility models on the performance of routing protocols requires testing multiple mobility patterns and different routing protocols. Otherwise, the observations made and the conclusions drawn from the simulation studies may be misleading. For that reason, we are considering five distinct random entity mobility models in this paper: the random waypoint (RWP) [
2], the random direction (RD) [
2], the smooth-turn (ST) [
3,
4], the Gauss–Markov (GM) [
5] and the enhanced Gauss–Markov (EGM) [
6] models. RWP is widely used for simulations of MANET due to its simplicity and its availability in almost all simulators. However, this model is very unrealistic, since it features sudden stops and sharp turns. Due to mechanical and dynamics constraints, UAVs cannot turn abruptly nor stop/accelerate suddenly. RD, which is fairly similar to RWP, is just as unrealistic as RWP for the same reasons. ST and GM were proposed in order to overcome these sharp turns and sudden stops problems. However, they still feature sharp turns at the boundaries. To solve this problem, we proposed EGM as part of our previous work [
6].
For the routing protocols, we are considering four very distinct protocols:
ad hoc on-demand distance vector (AODV) [
7,
8], optimized link state routing (OLSR) [
7,
9], reactive-geographic hybrid routing (RGR) [
10,
11,
12,
13] and geographic routing protocol (GRP) [
14]. AODV is a reactive on-demand routing protocol, whereas OLSR is a table-driven proactive routing protocol. GRP is a geographic routing protocol, and RGR is a hybrid reactive and geographic routing protocol that we developed in a previous work [
10,
11,
12,
13]. We also consider simple packet flooding for further understanding. For our analysis, we first define a set of protocol-independent metrics to characterize and compare the different mobility models. These metrics will also help to explain the different performance shown by the routing protocols under various mobility models. We also define a set of metrics that capture the routing performance and rank the routing protocols based on their observed performance. All of this should tell us, in detail, how and why the mobility patterns affect the routing protocol performance in UAANET.
Our goal in this paper is to investigate how mobility models affect the performance of UAANET in simulations. We perform this investigation in order to come up with conclusions/recommendations that provide a benchmark for future simulations of UAANET. No such benchmark exists in the literature for UAANET. Most of the work presented in the literature is a bit limited in that regard, and it only addresses relatively low mobility MANET. UAANET are very high mobility MANET and need to be addressed more specifically; which is what we are doing in the paper. Our work is based on existing protocols and models. We do not aim to propose a new routing protocol nor mobility model. We do not aim to provide mathematical analyses in the paper either.
The remainder of this paper is organized as follows.
Section 2 summarizes the related work.
Section 3 presents the five mobility models and the routing protocols that we are considering. The evaluation metrics are presented in
Section 4. Simulations and analysis are presented in
Section 5, and concluding remarks are made in
Section 6.
2. Related Work
An analysis of the impact of mobility models on the performance of MANET is provided in [
15]. The main conclusion is that even when setting the same parameters, different mobility models have different impacts on the performance evaluation of protocols. Although they focus on entity mobility models as we do, the speed range is limited in the range of 2–10 m/s, which is way below the range of 50–60 m/s that we are considering for UAANET. Therefore, the work in [
15] is for relatively low mobility MANET, and their analysis is limited to the impact of speed and pause time on the performance of MANET. Moreover, they provide no clear comparison between the chosen mobility models
per se. Such a comparison would need to be carried out by means of protocol-independent metrics, for instance.
The same problem of non-applicability to UAANET is found in [
16]. Here, the authors compare the performance of different routing protocols, namely RWP, reference point group mobility (RPGM) and file-based models. One of the main conclusions is that the performance ranking of the routing protocols changes depending on whether the nodes are moving according to a group mobility model. However, the analysis is done over a hybrid network, where four groups of nodes have different mobility, ranging from static to high UAANET-like mobility. Therefore, the conclusions drawn do not necessarily apply to pure UAANET, which are our main focus.
Prabhakaran and Sankar [
17] also carried out experiments to evaluate the impact of entity and group mobility models on the performance of MANET using the AODV routing protocol. Once again, the conclusion is that the MANET performance is affected by the mobility of the nodes; therefore, the mobility model has to be chosen in accordance with the scenario in consideration. Unfortunately, only a single routing protocol (AODV), a reactive one, is considered in the analysis. Moreover, the variation of the nodes’ speed from 5–80 m/s in the scenarios often falls within the range of slow mobility; which is not interesting for UAANET. Similar to [
17], yet specifically for vehicular
ad hoc networks (VANET), Luo
et al. [
18] analyzed the performance of a routing protocol over different mobility models, including the RWP, the Simulation of Urban Mobility (SUMO) [
19] and the Shanghai Urban Vehicular Network (SUVnet) model. SUMO is an open source, microscopic, space-continuous traffic simulator designed to handle large road networks, whereas SUVnet is a realistic mobility model obtained from the actual GPS data collected from more than 4000 taxis in Shanghai, China. The considered routing protocol is the distance-aware epidemic routing (DAER) protocol, which is also introduced in [
18]. The results show that the selection of mobility models heavily influences the routing performance. Moreover, the performance under the SUVnet reality-based mobility model is worse than under the other two models. The conclusion is that even by means of a complex map-based microscopic traffic simulator, care should be taken, as the results obtained with these models might not be as close to reality as expected. This further points out the crucial role of mobility models, as poorly choosing one of them can actually yield misleading conclusions on an actual routing protocol’s performance. However, the analysis in [
18] focuses on VANET with speeds of the order of 7 m/s, which is very low compared to our average of 55 m/s for UAANET. The analysis of Simaremare
et al. in [
20] with respect to our concern is even more simplistic. They proposed an optimized version of AODV and then compared its performance under RWP and RPGM. The results showed higher performance with RWP. In [
21], Amnai
et al. investigate how the AODV protocol behaves when the number of nodes increases with different mobility models, including RWP, RD and Mobgen steady state. The observation is that AODV performs well under RD compared to the other mobility models, and their major conclusion is that AODV can be used for applications that tolerate a small amount of packet loss. Unfortunately, be it in [
20] or in [
21], no clear explanation is provided as to what feature or statistical behaviour of a given mobility model actually influences which aspect of the protocol.
The authors in [
22] study the impact of mobility patterns on multicast routing protocols for MANET. A better analysis (compared to a few aforementioned papers) is provided that shows that the mobility pattern influences the connectivity graph, which, in turn, influences the protocol performance. It is also found that routing protocols perform better under unrealistic RWP. Yet, among the considered models is the Manhattan grid, which is not applicable to UAANET, not to mention that the speed of the nodes in the models can go as low as zero, which again is a problematic value when considering UAANET. A comparative analysis of various common routing protocols under various mobility models is also provided in [
23]. A wide range of routing protocols of different types (reactive, proactive and hybrid) are considered. For mobility, group, file and RWP mobility models are considered. The simulations show that the mobility model has a significant impact on the performance of the routing protocols. Plus, RWP once again shows better performance for the protocols. However, there are a few problems with the simulations. For example, the simulations run for 30 s, which is problematic, since we know that RWP, for instance, needs a certain time in order to reach its steady-state spatial distribution [
24]. Therefore, the conclusions drawn in [
23] might well be skewed due to a transitory state. From our experience, it takes about 600 s to observe a steady-state-like behaviour in the performance metrics. We might have formulated similar reservations with the analysis in [
25], where the simulation only lasts 500 s, but they specifically consider a different version of RWP. In fact, they use the random way point-steady state (RWP-SS) [
26], where the initial speed and the stationary distribution location are sampled in order to overcome the problem of discarding the initial simulation data. In [
25] also, AODV is used as the underlying routing protocol for simulation. The authors reached the conclusion that a mobility model should be selected based on the type of application scenario. Yet, they recognized the lack of evaluating multiple distinct routing protocols in their analysis. Furthermore, the speed range they used, with a maximum of 25 m/s, is considered relatively low in the context of UAANET. AODV is also the underlying routing protocol in the comparative simulation study of RWP and GM mobility models on the performance of MANET presented in [
27]. The results show that both mobility models are not different at speeds representative of human mobility. In this case, which is of no interest for UAANET, the authors advise using RWP, because it has less computational overhead compared to GM. When the speed of the nodes is as high as fast automobiles, the performance result using RWP is significantly different from GM, and the authors advise to use GM instead. Then again, there is no in-depth analysis or comparison of the two mobility models based on routing-protocol-independent metrics. Such an analysis would provide a better understanding of the effects of the models on AODV, for instance. Not to mention that, once again, there is a lack of evaluating multiple routing distinct protocols in [
27], as well.
In [
28], the performance of DSDV (destination-sequenced distance-vector) and AODV under the realistic mobility model is analysed and compared. The realistic mobility model is obtained based on spatial and temporal information about each and every node in a healthcare environment and based on personal behavior modelling [
29]. However, this is about a simulation area of 27 m × 18 m with mobile nodes moving at 0.6 m/s and, therefore, a fairly static MANET. In [
30], the impact of random and realistic mobility models on the performance of Bypass-AODV is studied. Bypass-AODV is an optimization of AODV that uses cross-layer MAC-notification. The results show that Bypass-AODV is insensitive to the random mobility models used and has a clear performance improvement compared to AODV. It has a comparable performance under a group mobility model compared to AODV. However, the study is more about a comparison between AODV and Bypass-AODV and less about how mobility models affect the performance of MANET in general. Even so, a considerable range of the speeds they used is not interesting for UAANET.
Unlike the limited analysis in [
30] and most of the work cited above, a general analysis framework is presented in [
31]. This framework analyzes the impact of mobility on the performance of routing protocols in
ad hoc networks (IMPORTANT). The authors try to explain why and how mobility affects routing protocol performance. For that matter, the performance of three different routing protocols (AODV, DSR (dynamic source routing) and DSDV) is observed under four different mobility models. However, first, the mobility patterns are evaluated among themselves by means of predefined protocol-independent mobility metrics. This evaluation helps understand/explain the relative performance of the protocols across the mobility models. This work [
31] is similar to what we are doing here in this paper. However, in [
31], the diversity of routing protocols is limited as, for instance, AODV and DSR are both reactive protocols. Instead of having two of the three protocols being of the same general approach to routing in MANET, they could have chosen a hybrid protocol or a geographic protocol. Moreover, some of the low speed ranges that they are considering are not applicable for a study in UAANET; not to mention that we are focusing on entity mobility models mostly for searching missions applications, for instance, which is not the case in [
31], where group mobility and grid patterns are considered.
Each of the above reviewed related work suffers from one or more of the following shortcomings: lack of a study that targets the typical speed range of UAANET (around 55 m/s), limited diversity on the types of routing protocols, lack of comparison of the mobility models among themselves by means of protocol-independent evaluation metrics that would explain the impact on the routing protocols, non-applicability to UAANET of some of the considered mobility models, no targeted study towards entity mobility models that would more likely be used in search applications of UAANET, for example. Therefore, we feel compelled to conduct an analysis that is directed at UAANET and that resolves all of the aforementioned shortcomings. To the best of our knowledge, this is the first study/analysis of this kind.
5. Simulation and Analysis
We used OPNET Modeler 16.0 [
34] for the simulation of the routing protocols. We set the channel capacity to be 11 Mbps for all mobile hosts. The rest of the simulation settings and parameters are summarized in
Table 1.
We have only one source node and one destination node for data packets. The 28 remaining nodes are potential forwarding nodes. For each protocol, and with the above set of parameters, we generate 30 independent scenarios using 30 different seeds of the pseudo-random number generator available in OPNET. By doing so, we have 30 sets of pseudo-independent results for every metric for every protocol. The 30 results are then averaged. Confidence intervals are also calculated.
Table 1.
Simulation parameters.
Table 1.
Simulation parameters.
| Parameter | Value |
|---|
| Number of simulated nodes | 30 |
| Area length | 2000 m |
| Area width | 4000 m |
| Wireless transmission range | 1000 m |
| Packet size | 1024 bits |
| Send rate of traffic | 5 pkts/s |
| Speed | 50 to 60 m/s |
| Pause time at simulation | 0 s |
| Simulation time | 1800 s |
5.1. Statistical Analysis of the Mobility Models
RWP was initially present in OPNET. We implemented EGM and ST in OPNET ourselves. For RD and GM, we imported them from BonnMotion [
43] and used them in OPNET protocol simulations.
Table 2 shows a recap of the mobility models’ statistics according to the metrics discussed in Subsection 4.1. All of the metrics are shown in
Table 2, except for coverage, which is shown in
Figure 6. Note that the numbers presented are the averages over 30 independent runs. The 95% confidence intervals are presented in the form of “±error” near each average value. These statistics are obtained by means of a C++ Network Analyzer program that we had written specifically for that purpose. The program creates statistics from dynamic and static network simulations of NS-2 and OPNET using the Boost Graph Library [
44]. The program also uses MATLAB, GraphViz and Excel to help visualize, organize and interpret the statistics as needed.
In terms of network diameter, we can see that RWP has the lowest and RD has the highest, closely followed by ST. Therefore, it is expected that, overall, routing protocols will perform better under RWP compared to the others and worse under RD and ST. As we already know, a mobility model that creates a low diameter will improve routing performance and minimize interference.
Table 2.
Mobility models statistics.
Table 2.
Mobility models statistics.
| Metric | RWP | EGM | ST | RD | GM |
|---|
| Network diameter | 5.0 ± 0.4 | 5.5 ± 0.4 | 5.8 ± 0.5 | 6.0 ± 0.5 | 5.5 ± 0.3 |
| (hops and meters) | 3777 ± 226 m | 4146 ± 206 m | 4374 ± 403 m | 4455 ± 269 m | 4159 ± 203 m |
| Number of components | 1.05 ± 0.03 | 1.10 ± 0.03 | 1.09 ± 0.03 | 1.13 ± 0.02 | 1.09 ± 0.03 |
| Clustering coefficient | 3.4 ± 0.2 | 2.7 ± 0.2 | 2.3 ± 0.2 | 2.3 ± 0.2 | 2.6 ± 0.1 |
| Number of neighbors | 10.3 ± 0.4 | 8.8 ± 0.4 | 7.7 ± 0.3 | 7.6 ± 0.5 | 8.5 ± 0.2 |
| Path length | 2.1 ± 0.1 | 2.3 ± 0.1 | 2.5 ± 0.4 | 2.5 ± 0.2 | 2.3 ± 0.2 |
| (hops and meters) | 1461 ± 83 m | 1597 ± 62 m | 1764 ± 271 m | 1796 ± 93 m | 1654 ± 119 m |
| Links created | 3.9 ± 0.04 | 3.2 ± 0.03 | 2.7 ± 0.04 | 3.8 ± 0.02 | 4.3 ± 0.04 |
| Links broken | 4.0 ± 0.03 | 3.2 ± 0.03 | 2.7 ± 0.05 | 3.9 ± 0.02 | 4.4 ± 0.04 |
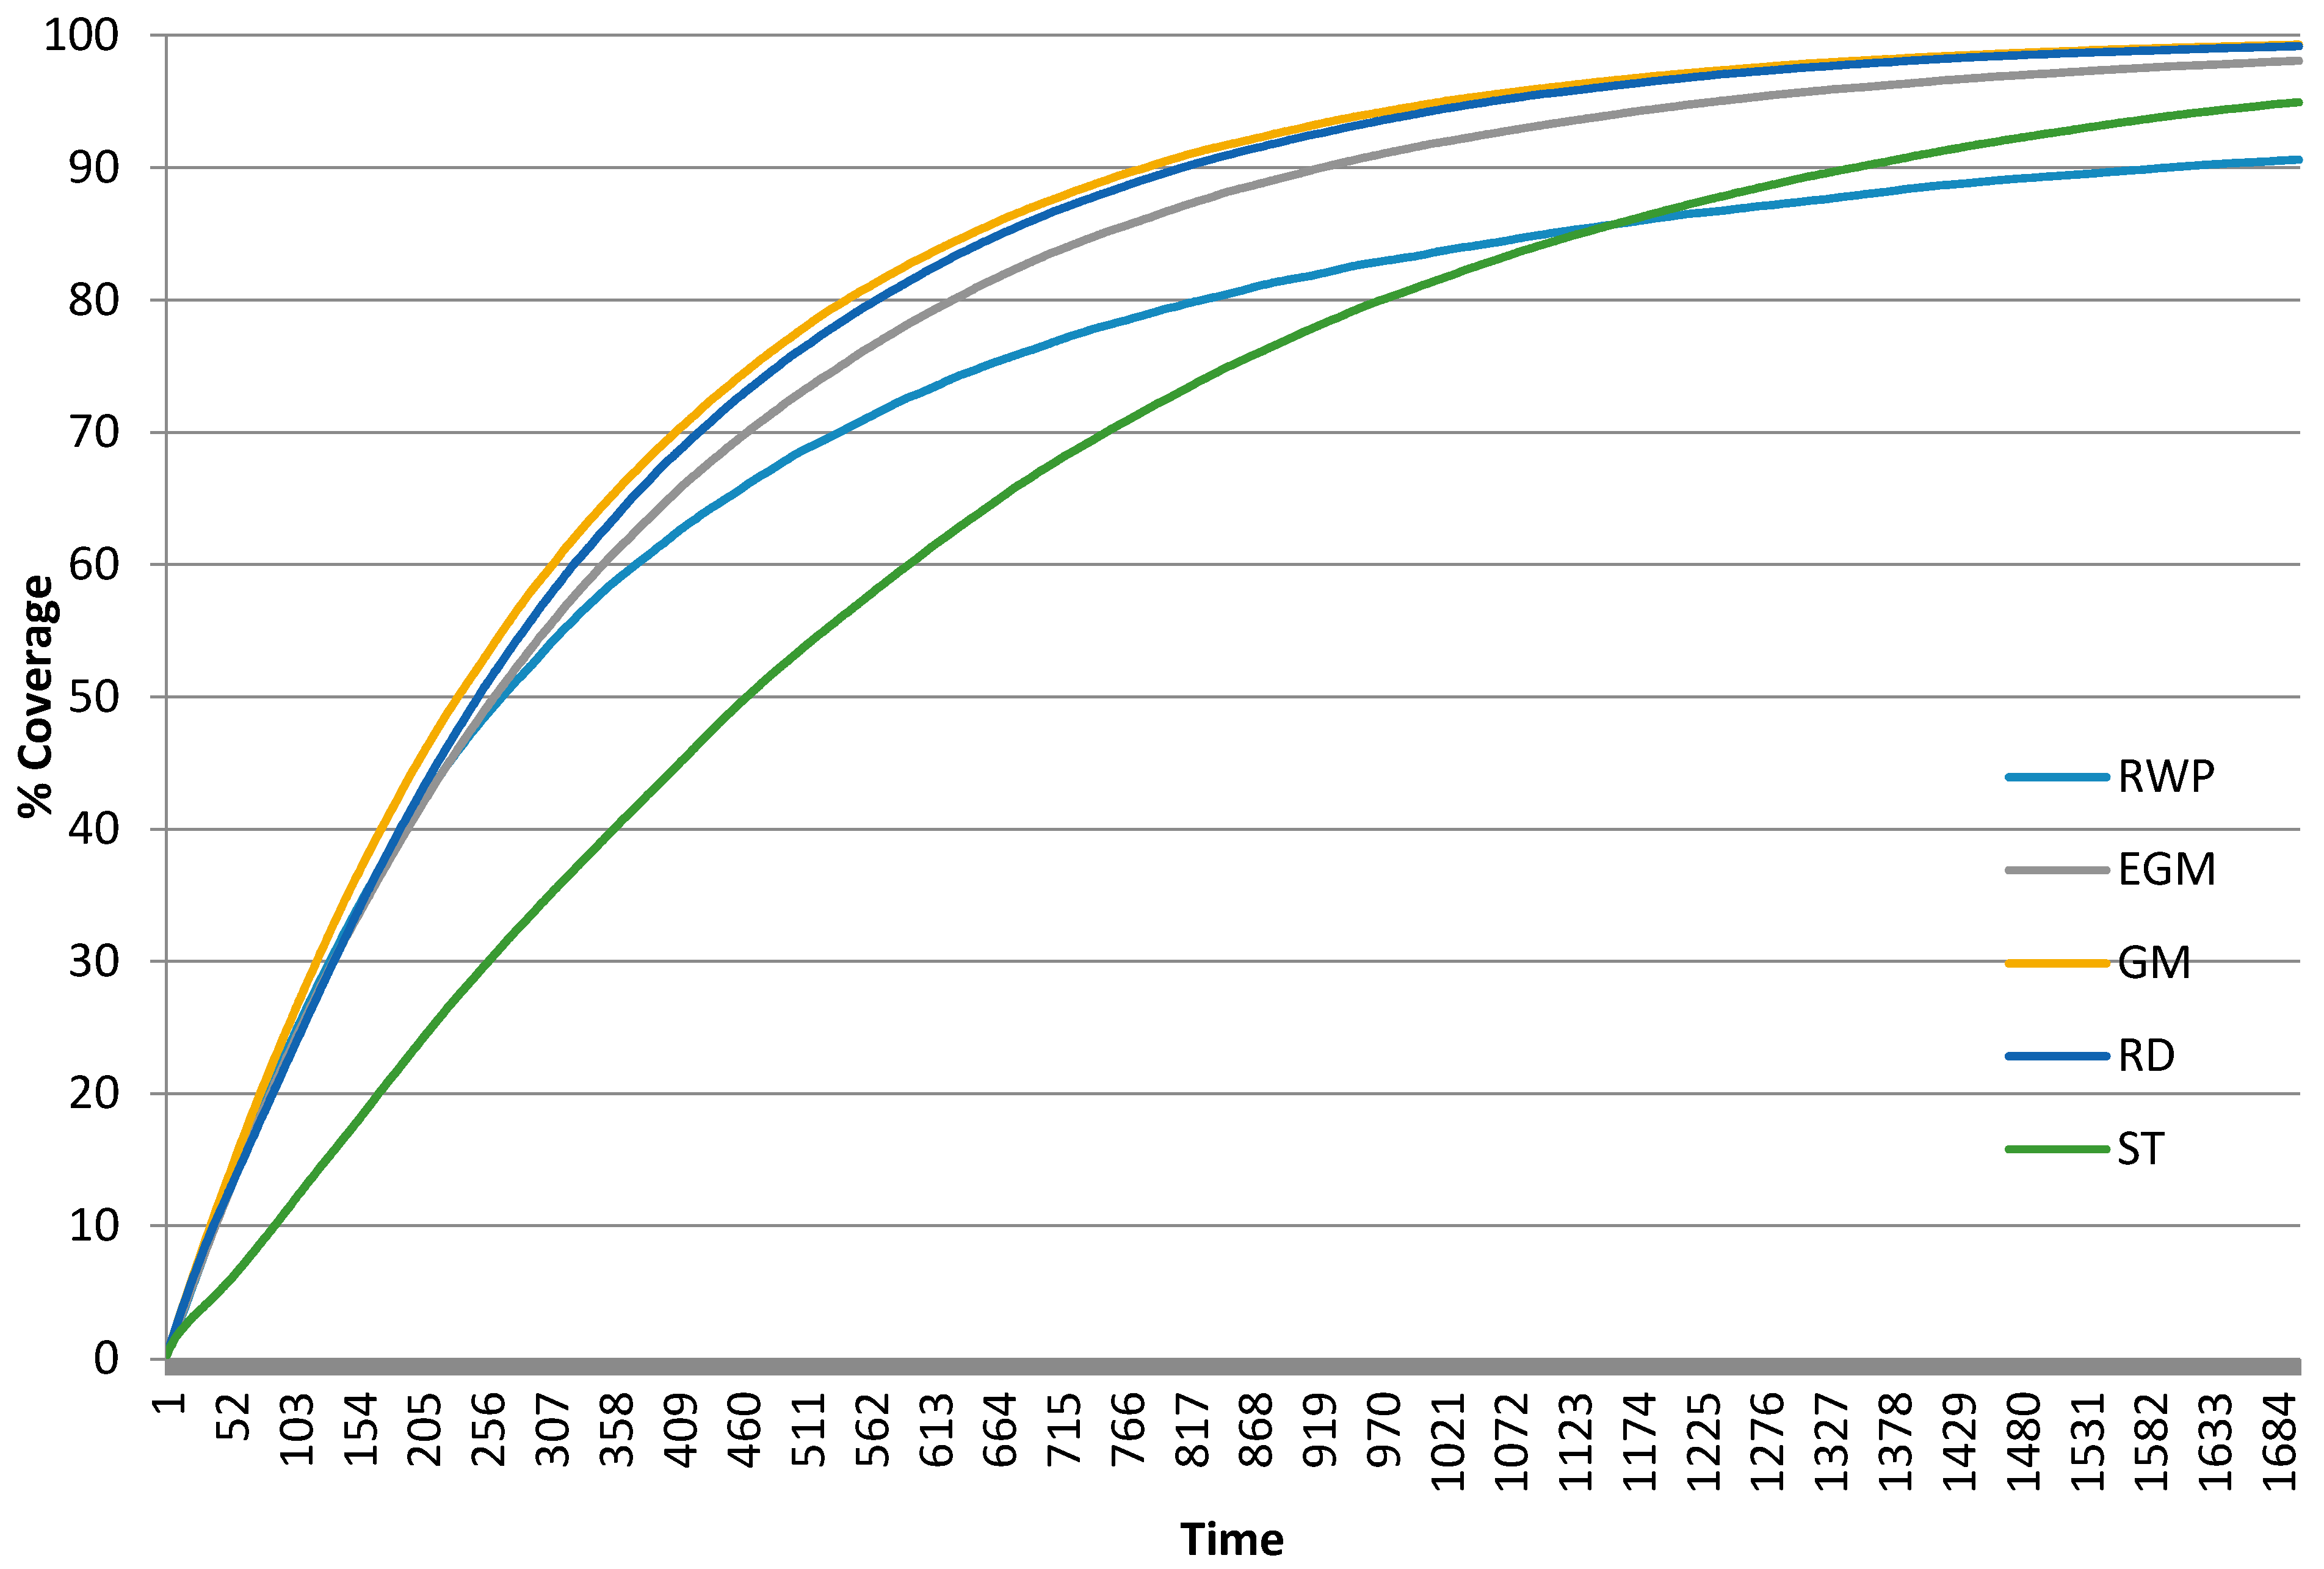
Figure 6.
Coverage for the various mobility models.
Figure 6.
Coverage for the various mobility models.
In terms of the number of components, once again, RWP shows the least and RD shows the largest. These are averages over many simulation runs and over a long period of simulation time (1800 s). What we learn from here is that overall RD causes the network to be partitioned more often than all of the other mobility models, especially RWP, which causes the least partitioning. Therefore, we should expect a performance under RD that is distinctively lower than that under RWP.
The clustering coefficient is distinctively higher, once again, with RWP. When a node presents a high clustering coefficient, this means that its neighbors have many radio links with each other. A route can, with high probability, pass through its neighbors without a path length increase. Therefore, we should expect the routing protocols to perform better with RWP and less with RD and ST.
The average number of neighbors is the lowest under RD and ST and highest under RWP. The second highest average number of neighbors is observed under EGM. This should also lead to better protocol performance under RWP; for the higher the number of neighbors, the higher probability of finding a route. Moreover, we observe that the average path length actually follows the reverse classification of the average number of neighbors. This can be explained by the fact that having more neighbors per node increases the chances of neighbors of my neighbors being also my neighbors; which therefore saves one hop right there and reduces the hop-measured path length. These two statistics (number of neighbors and path length) are expected to reflect on the average end-to-end delay with the routing protocols. We should consistently observe lower delay under RWP followed by EGM and the worst delay under RD.
In terms of the fluctuation of the topology measured by means of the average number of links created/broken, we can see that the network topology changes the most under GM and RWP and the least under ST. However, the ratio of broken links over created links is roughly the same for all of the mobility models. There is no mobility model that tends to “accumulate” or “lose” links over time compared to another.
As far as coverage is concerned,
Figure 6 depicts it as a function of time. We can infer that EGM, GM and RD provide a better coverage of the entire area (close enough to 100%), compared to RWP and ST. The mobility models present a steady state. By steady state, we mean a state when the coverage ratio remains close to a constant. We see that RD and GM reach the steady-state coverage faster with the highest steady-state value (almost 100%), closely followed by EGM. ST has the slowest convergence towards its steady state (around 95%). In fact, it seems as if it just reaches its steady state towards the end of the simulation (1700 s). RWP converges to its steady-state value almost at the same pace as RD and GM do; however the steady-state value of RWP is the lowest of all (90%). Overall, the main information to take away from
Figure 6 is that with some mobility models (ST and the widely-used RWP), the 30 nodes take way more time than others (EGM, GM and RD) to cover the entire region in an acceptable/interesting extent. As a matter of fact, anything between the 90% and 100% range can be seen as satisfactory. We can see that GM, RD and EGM enter that range around halfway through into the simulation, whereas as ST enters the same range towards the end. The widely-used RWP enters the range almost at the end of the simulation; this clearly shows an unsatisfactory coverage overall compared to GM, RD and EGM.
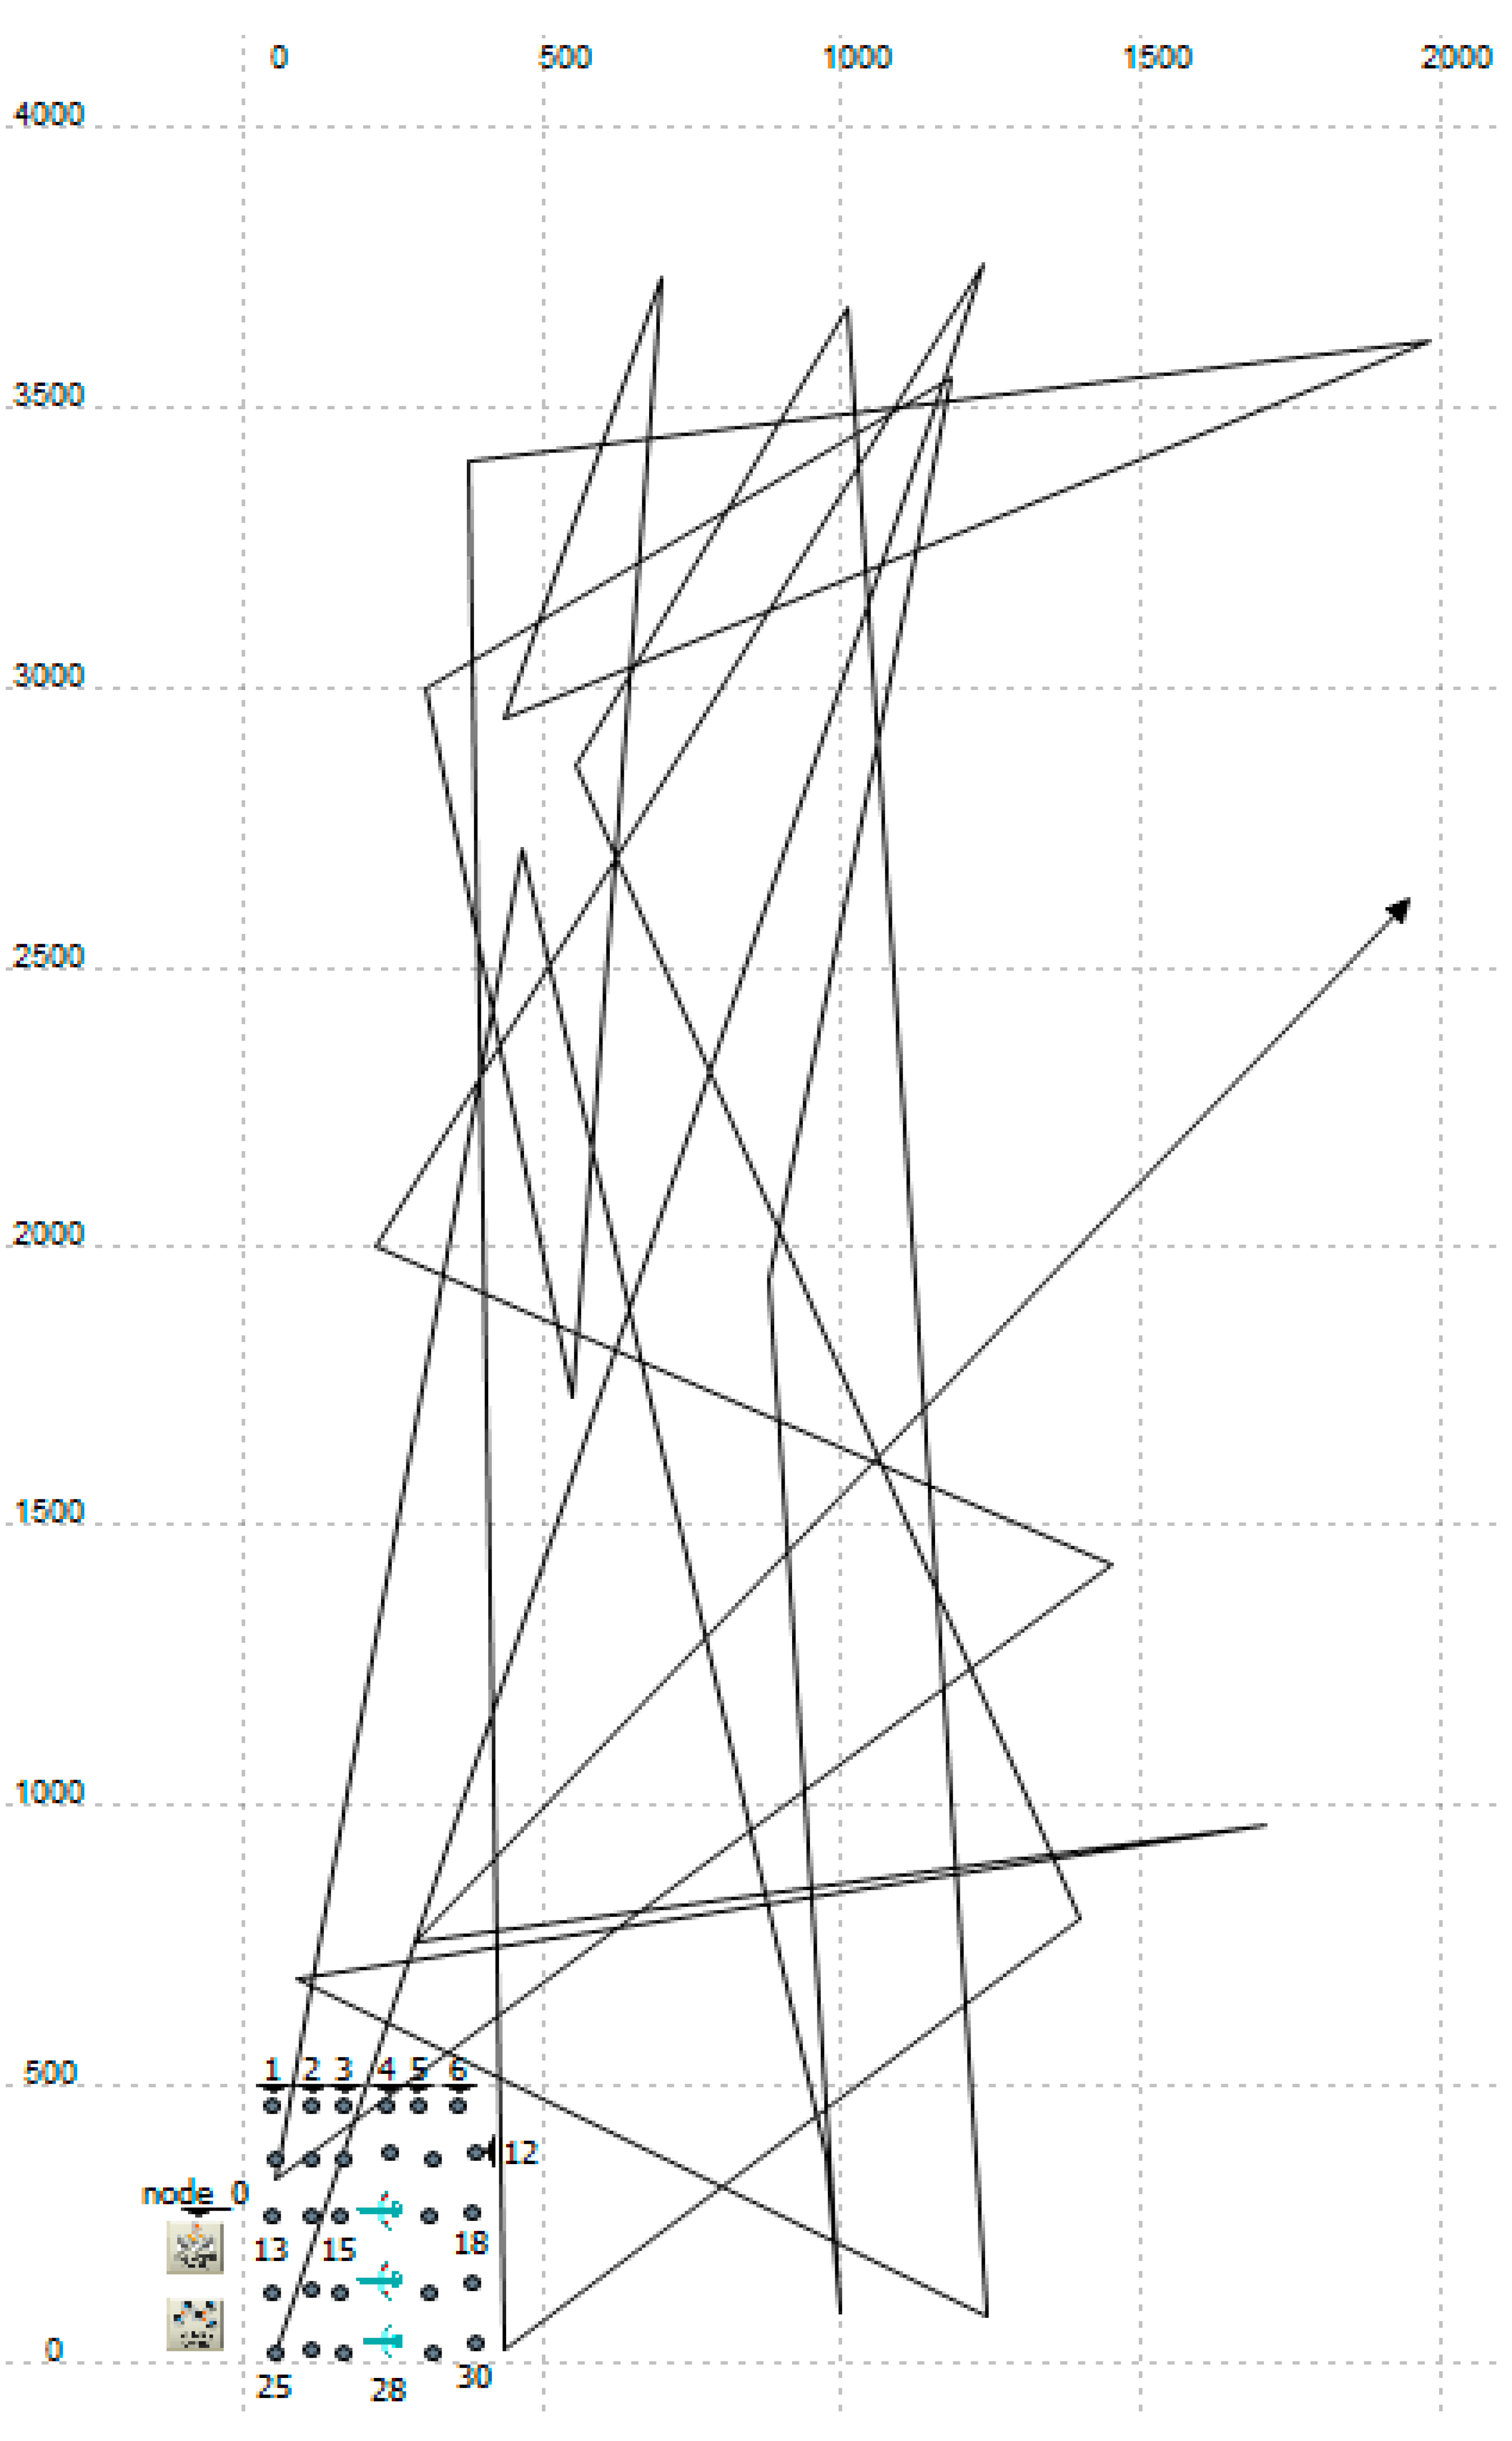
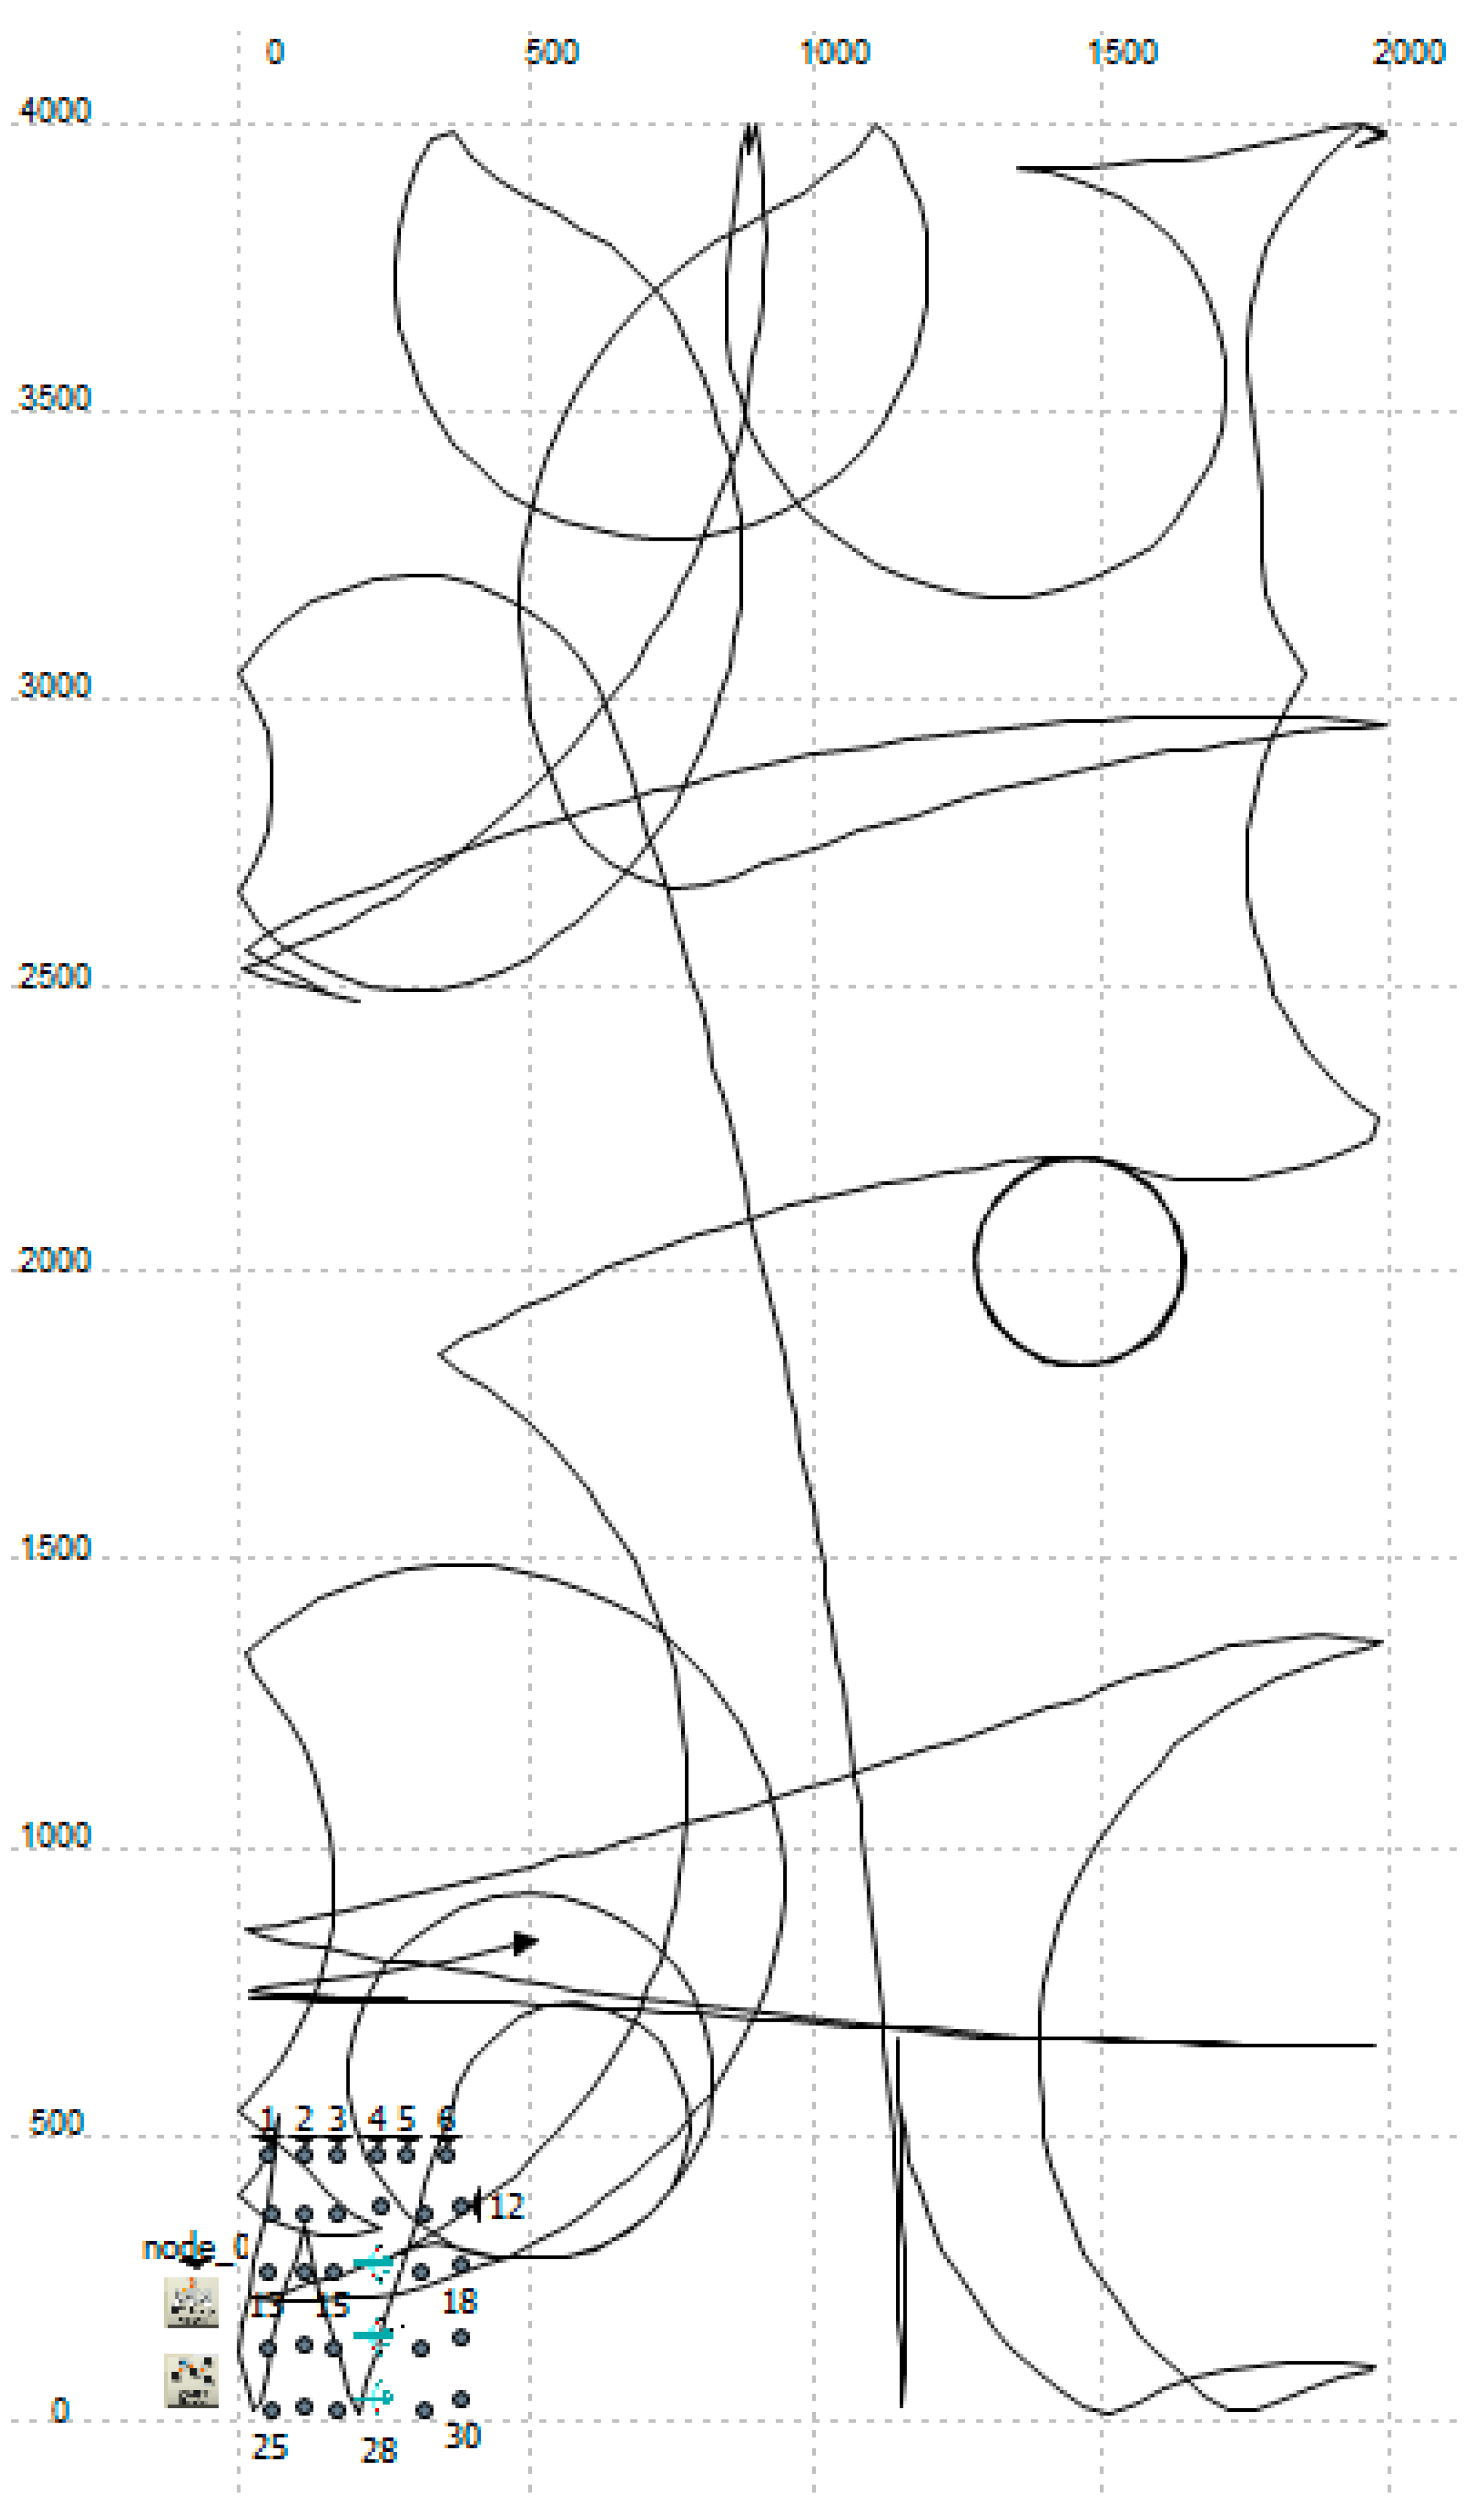
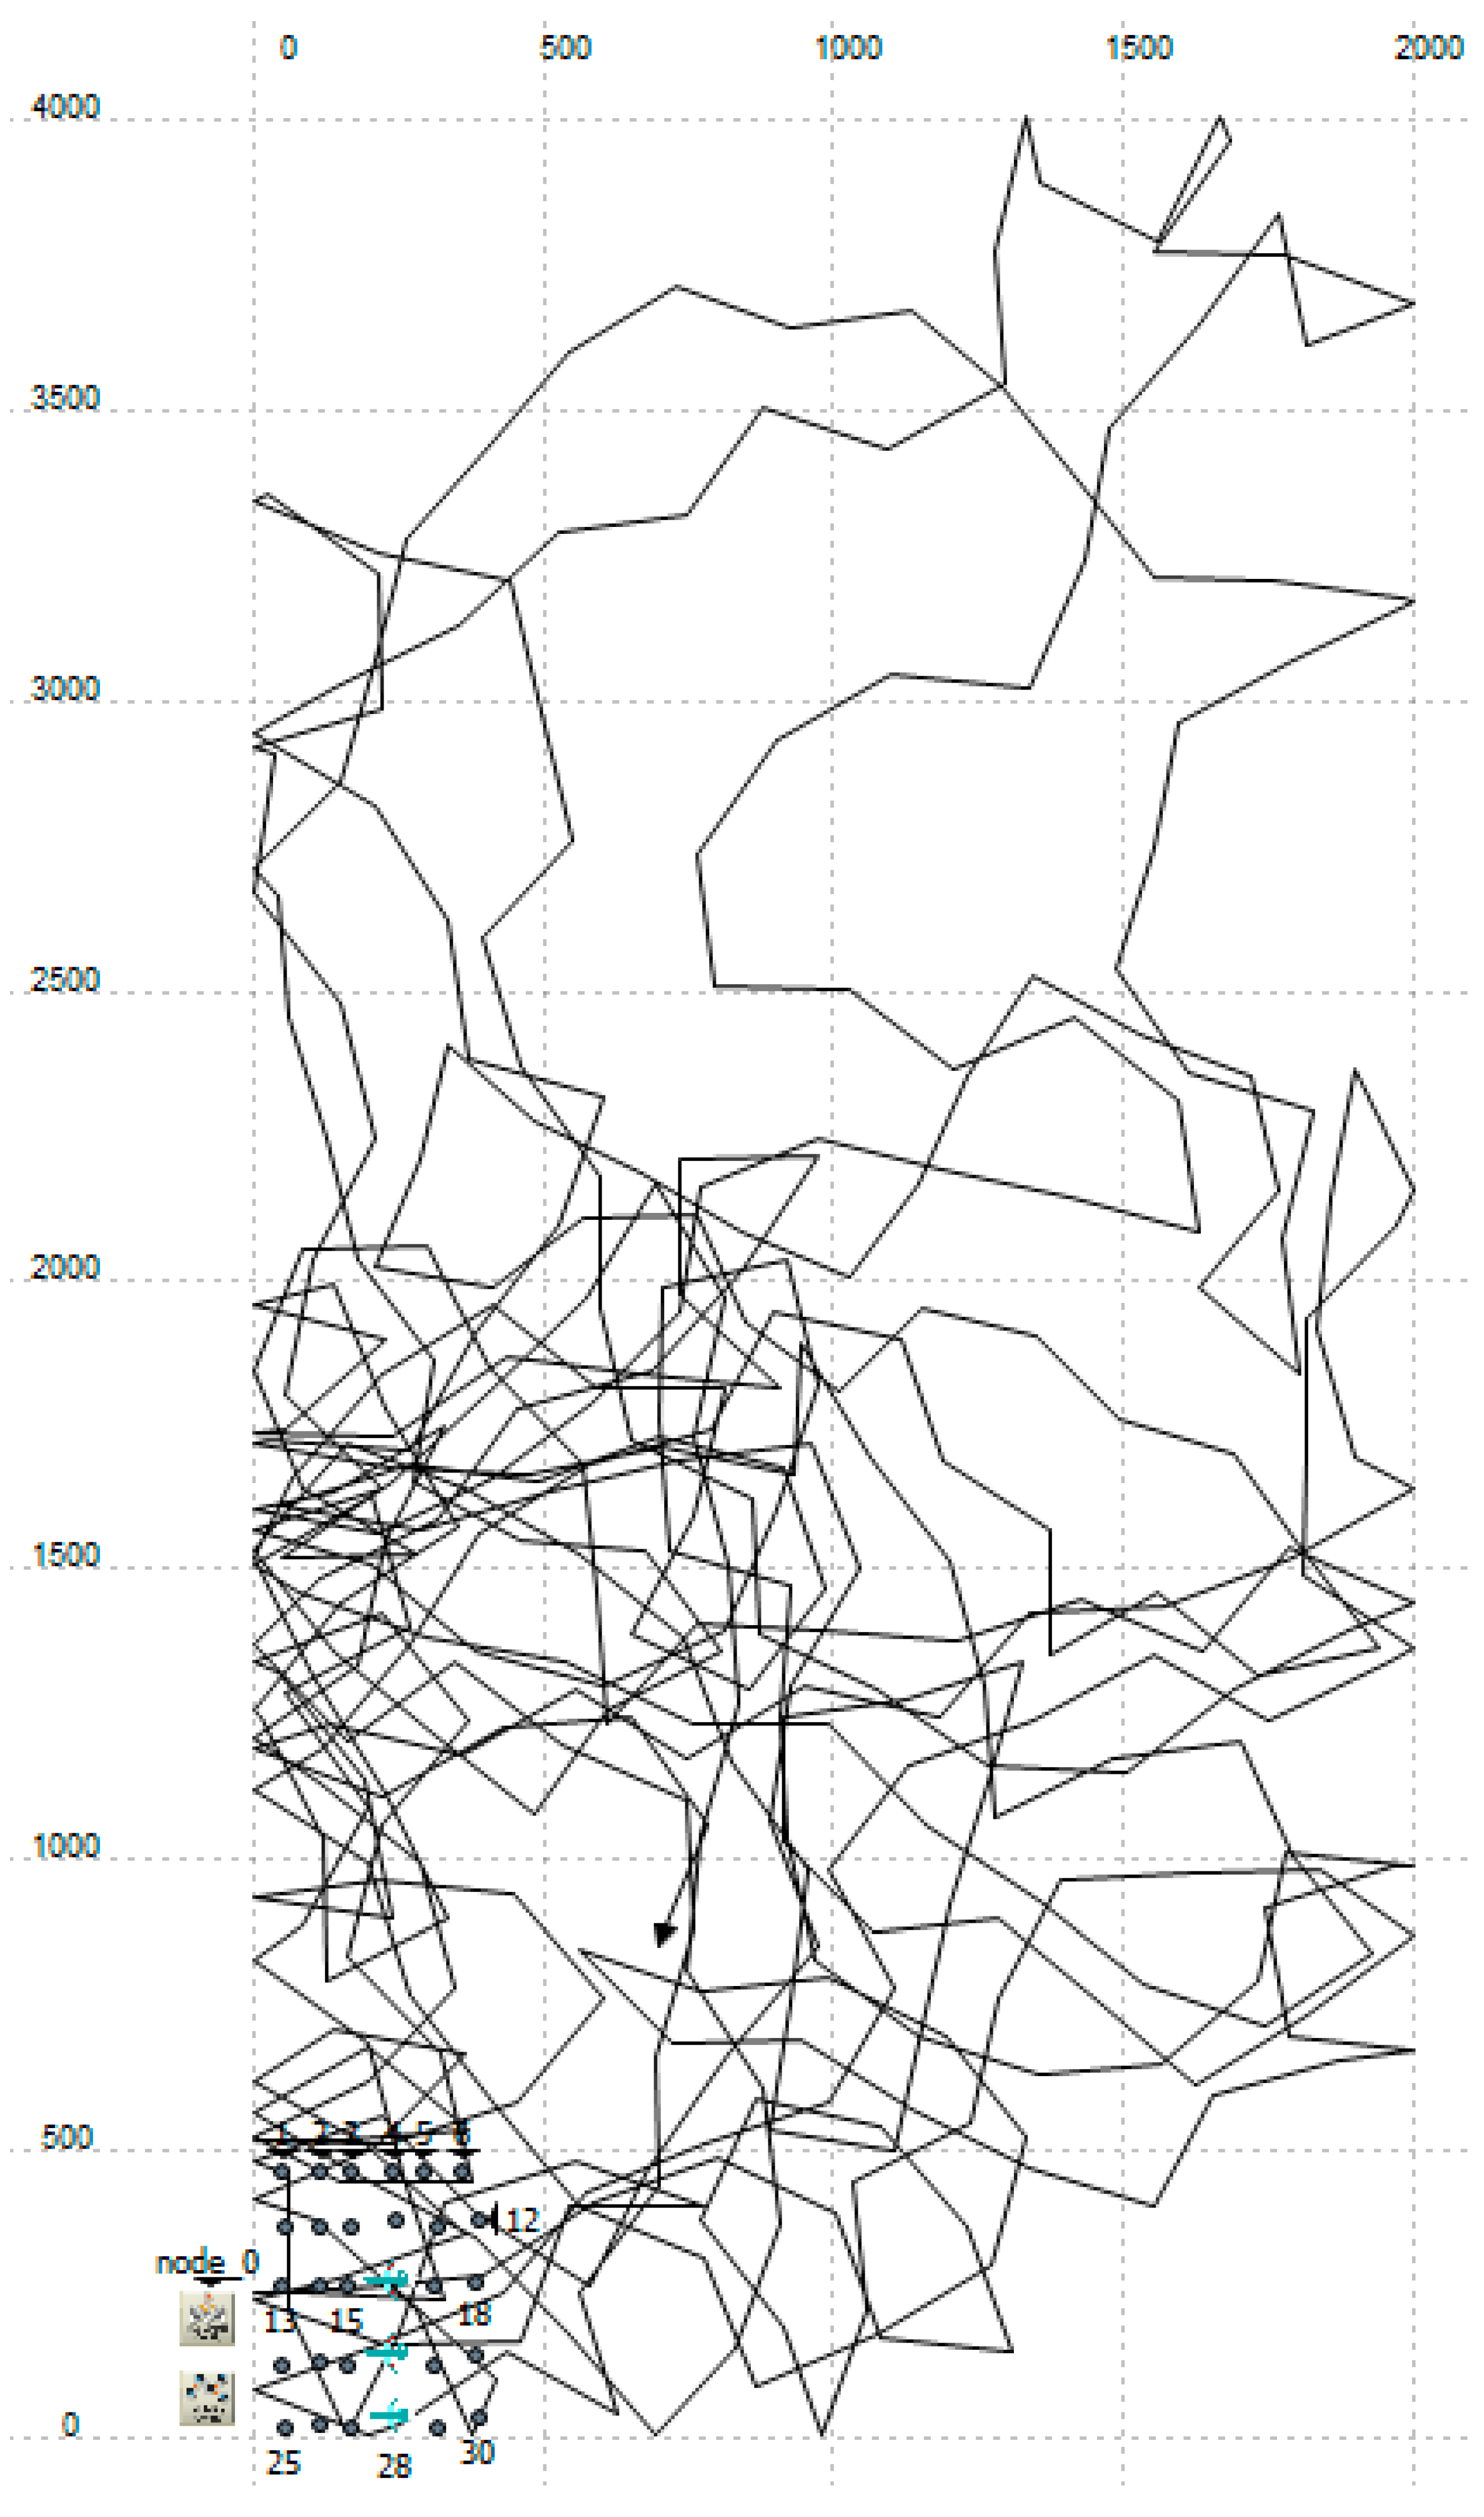
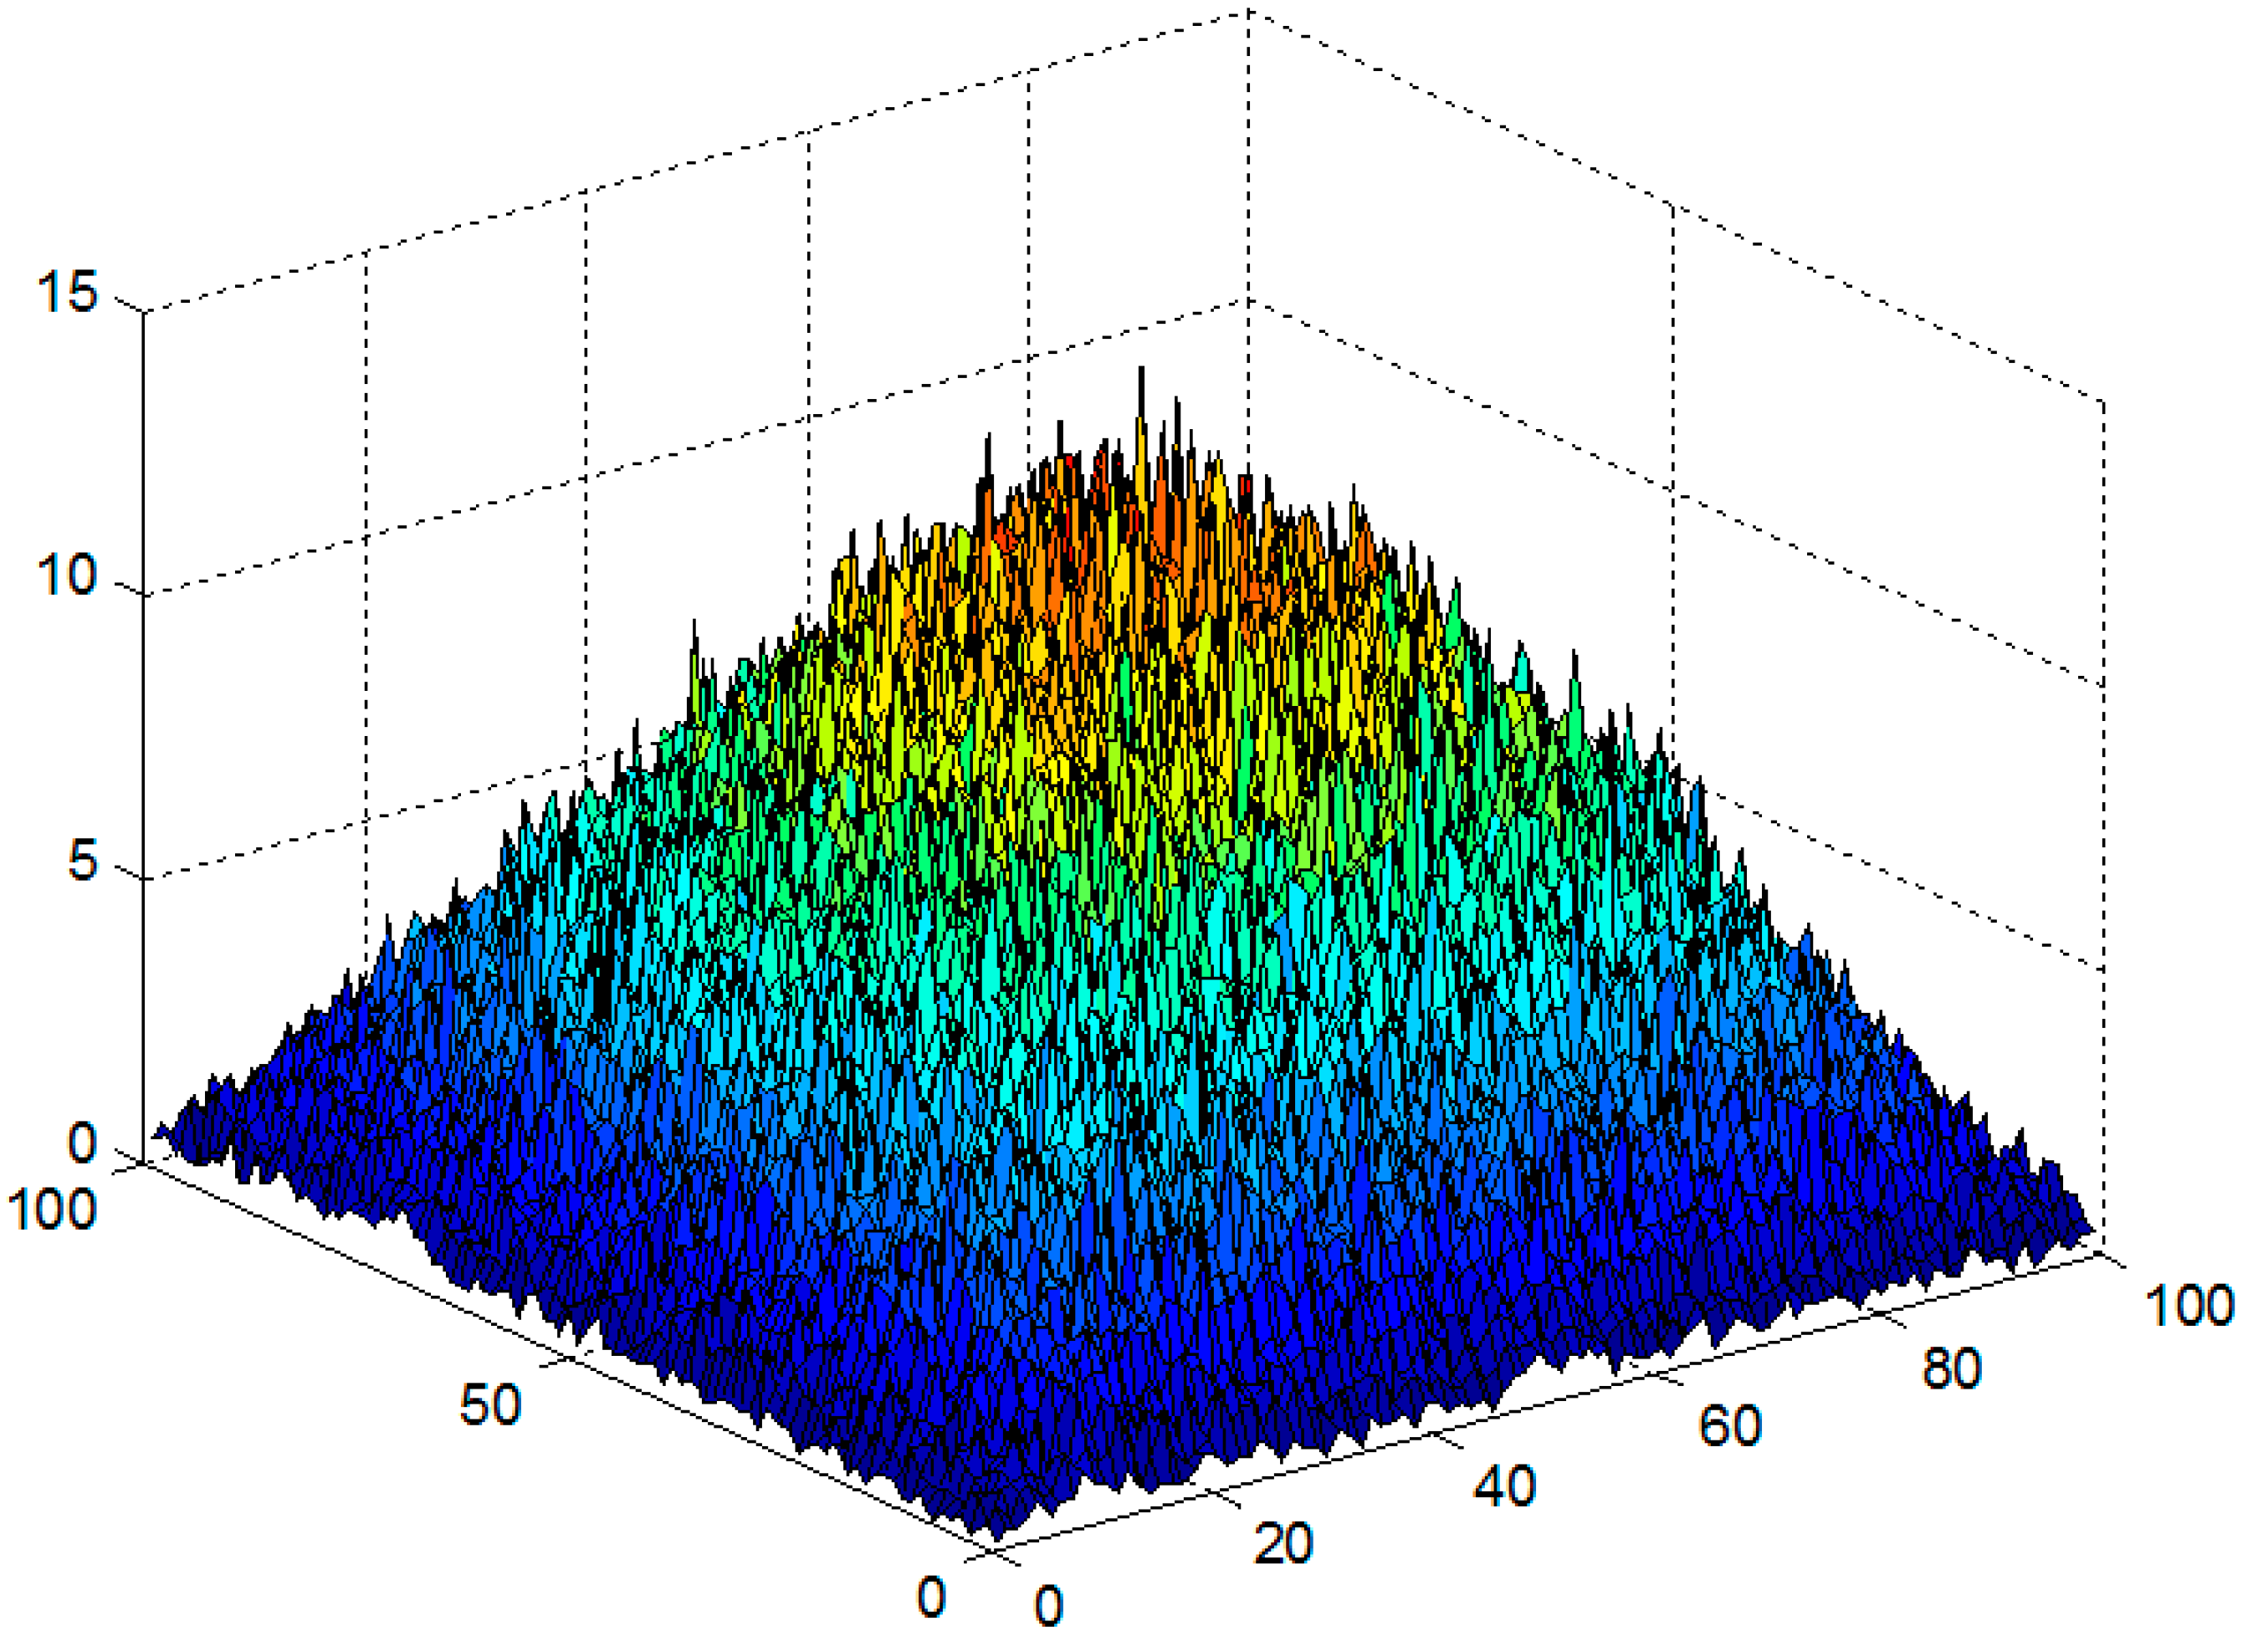
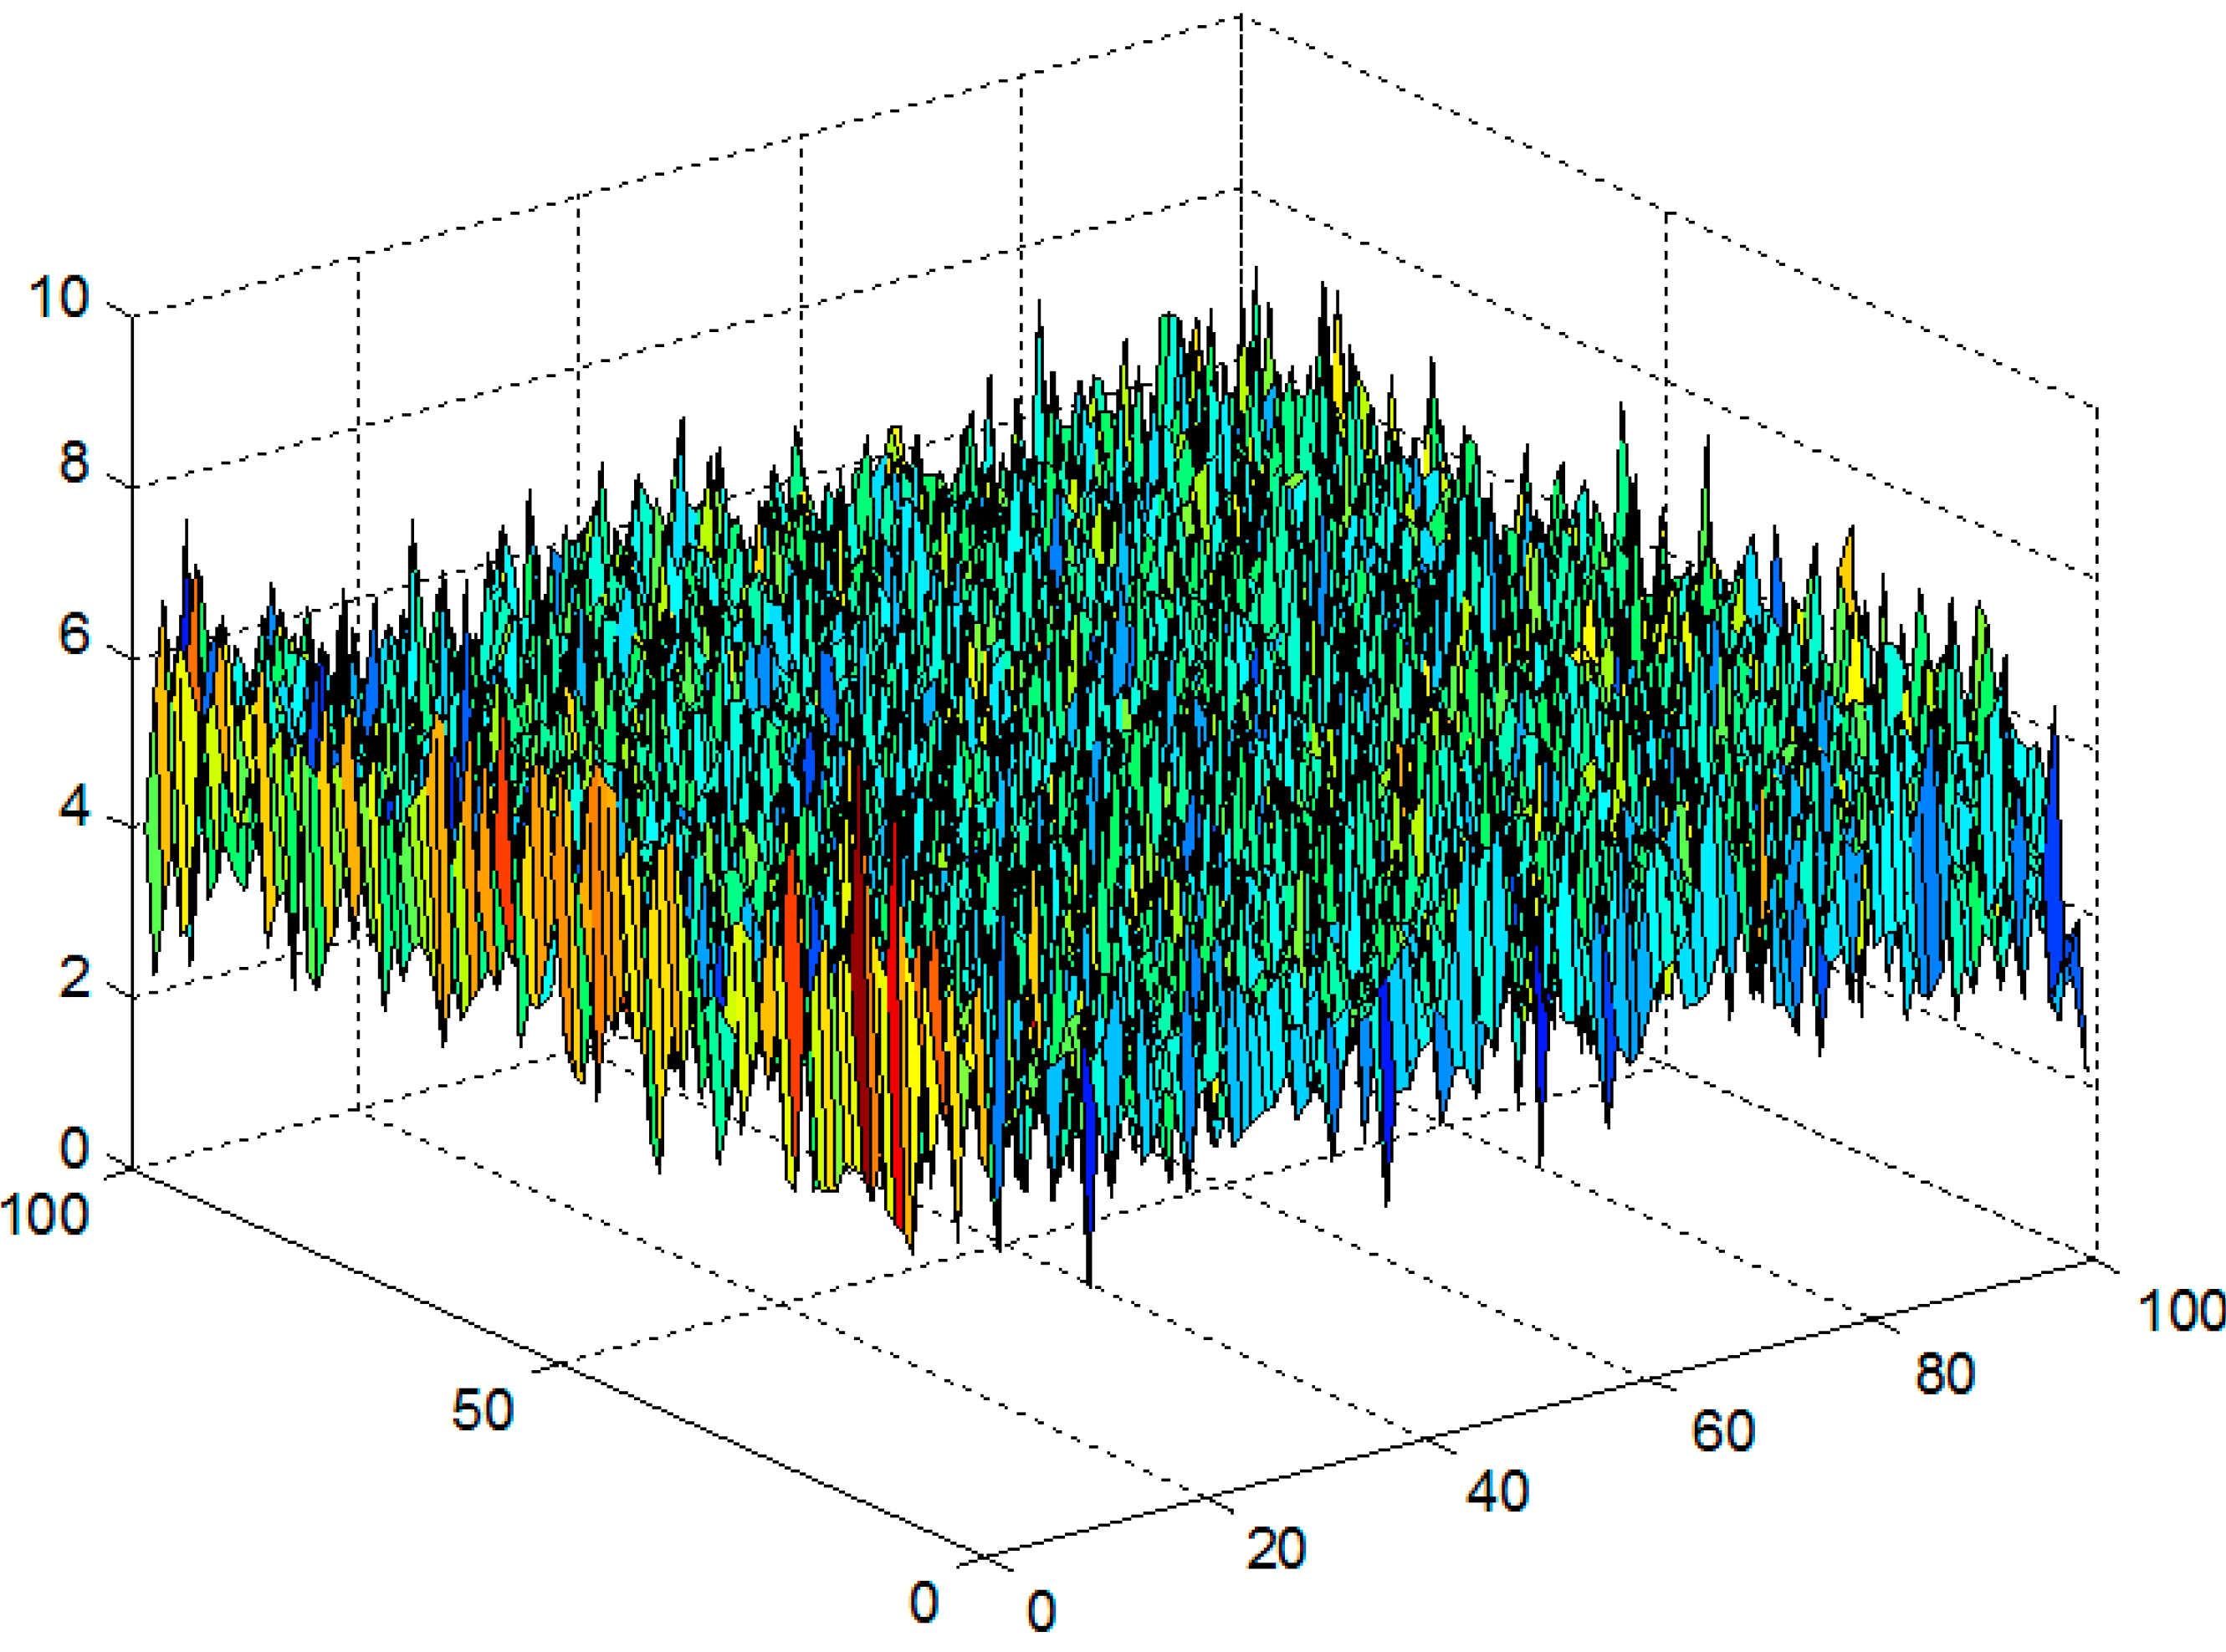
Furthermore, we can see in
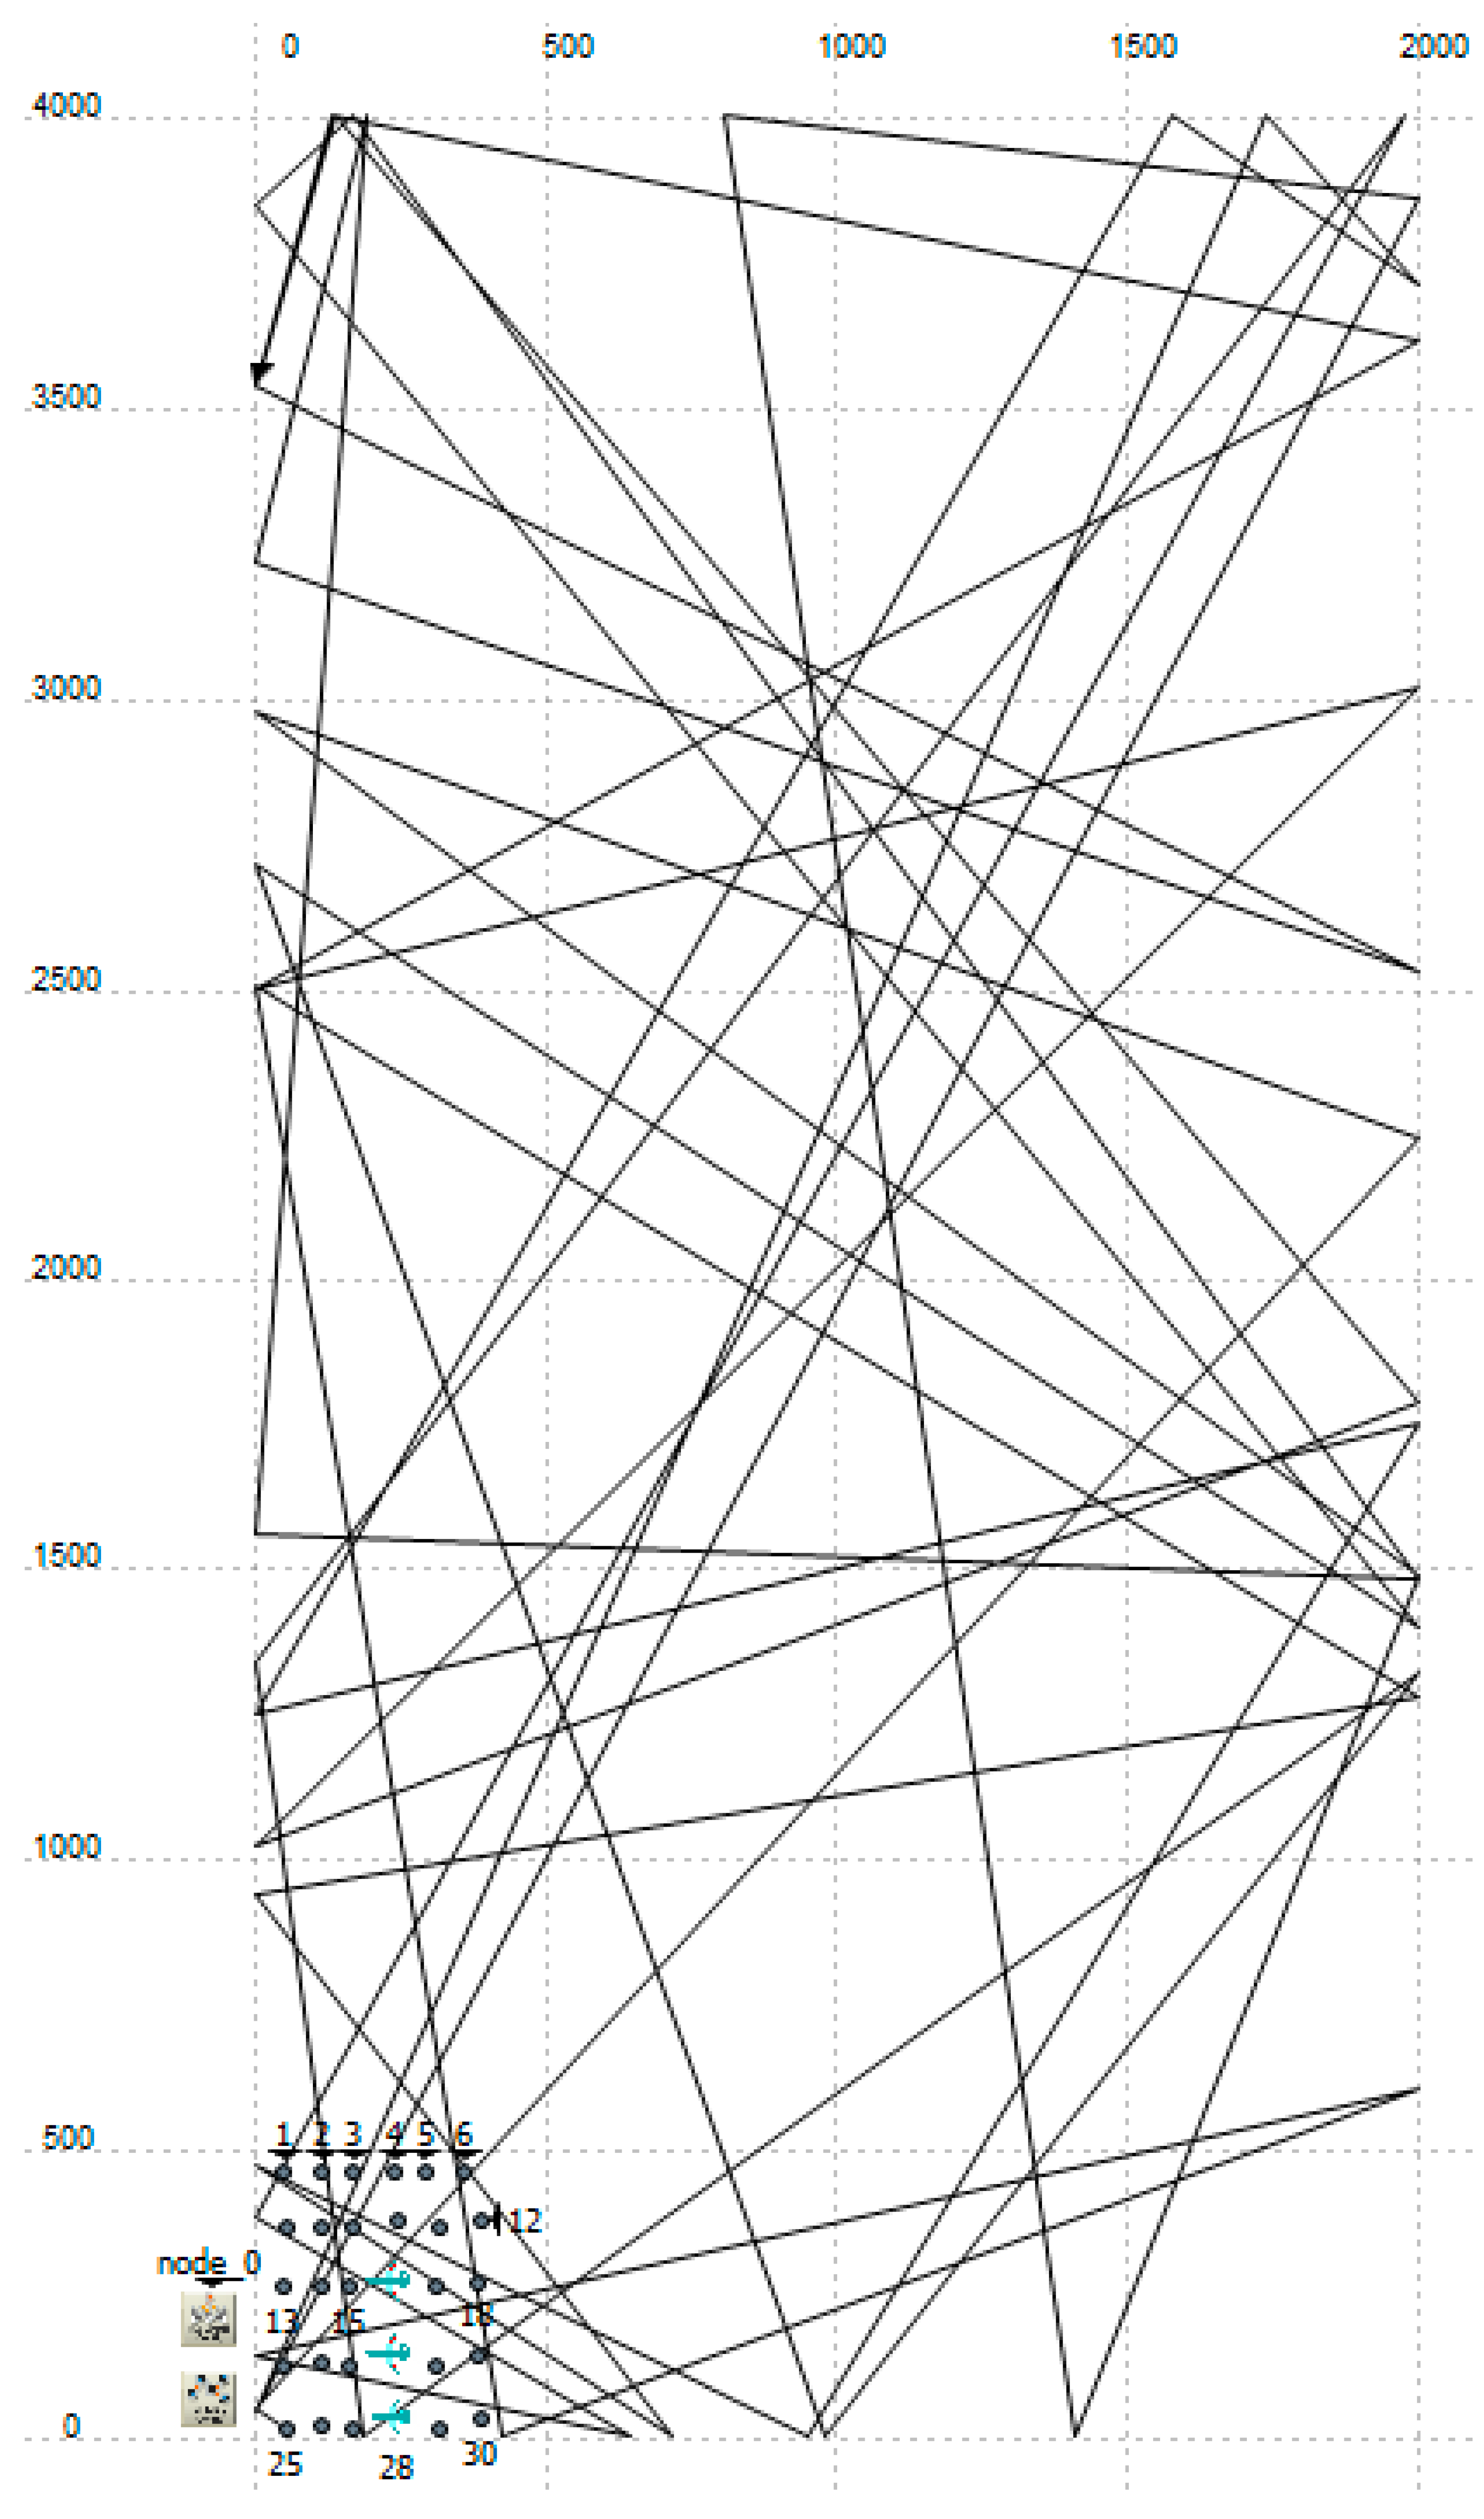
Figure 7 that with RWP, the nodes cluster around the center of the region and pass by the boundary regions with a very low density. At the other extreme, GM (
Figure 8) shows a more uniform node distribution with no specific spikes. We expect EGM to have a similar if not slightly better distribution as GM, since it is an enhanced version of the latter.
Figure 7.
Node distribution under RWP.
Figure 7.
Node distribution under RWP.
Figure 8.
Node distribution under GM.
Figure 8.
Node distribution under GM.
All of the above on coverage gives us an idea of the better suitability of one mobility model over another when it comes to a UAANET application, such as search missions. We now know that RD, GM and EGM are better choices than RWP and ST. Coverage does not give us much information about the potential performance of routing protocols. It is more of a measure of suitability to a given UAANET application.
The conjunction of all of the above-mentioned statistics leads us to believe that RWP will provide the best performance among all of the routing protocols. On the other hand, RD should exhibit the worst performance among all of the protocols. Moreover, EGM consistently shows the second best statistics right behind RWP. We expect this ranking to reflect on the routing protocols’ performance, as well.
6. Conclusions
In this paper, we have conducted a simulation-based study of the impact of mobility patterns on the performance of routing protocols in UAANET in the context of search missions. Similar studies in the literature had a few limitations: lack of diversity in the considered routing protocols, lack of focus on searching missions-applicable mobility models or, most importantly, relatively low mobility that does not apply to UAANET. In an effort to eliminate the abovementioned limitations in our study, we have considered five random entity mobility models applicable to search missions, namely RWP, RD, ST, GM and EGM. Moreover, we considered four distinct routing protocols: AODV, a reactive protocol, OLSR, a proactive protocol, GRP, a geographic protocol, and RGR, a hybrid reactive-geographic protocol. In addition to those four protocols, we also considered simple packet flooding (i.e., no routing strategy) in order to single out the impact of certain mobility models’ properties on the routing protocols and also to establish certain performance upper bounds.
We have established that in UAANET, mobility models do affect the performance of routing protocols individually to almost the same extent as the ranking between the protocols’ performance does not change when we go from one mobility model to the next. By means of protocol-independent metrics, we have shown that this impact of the mobility models can be explained and predicted. We can actually deduct a few rules with regard to this as follows: (i) a higher average number of neighbors coupled with a shorter average path length will lead to a shorter end-to-end delay; (ii) slow network topology fluctuations lead to lower routing overhead; (iii) a small network diameter coupled with a high clustering coefficient bring about a high PDR and shorter delay; (iv) the lower the average number of components, the higher the PDR.
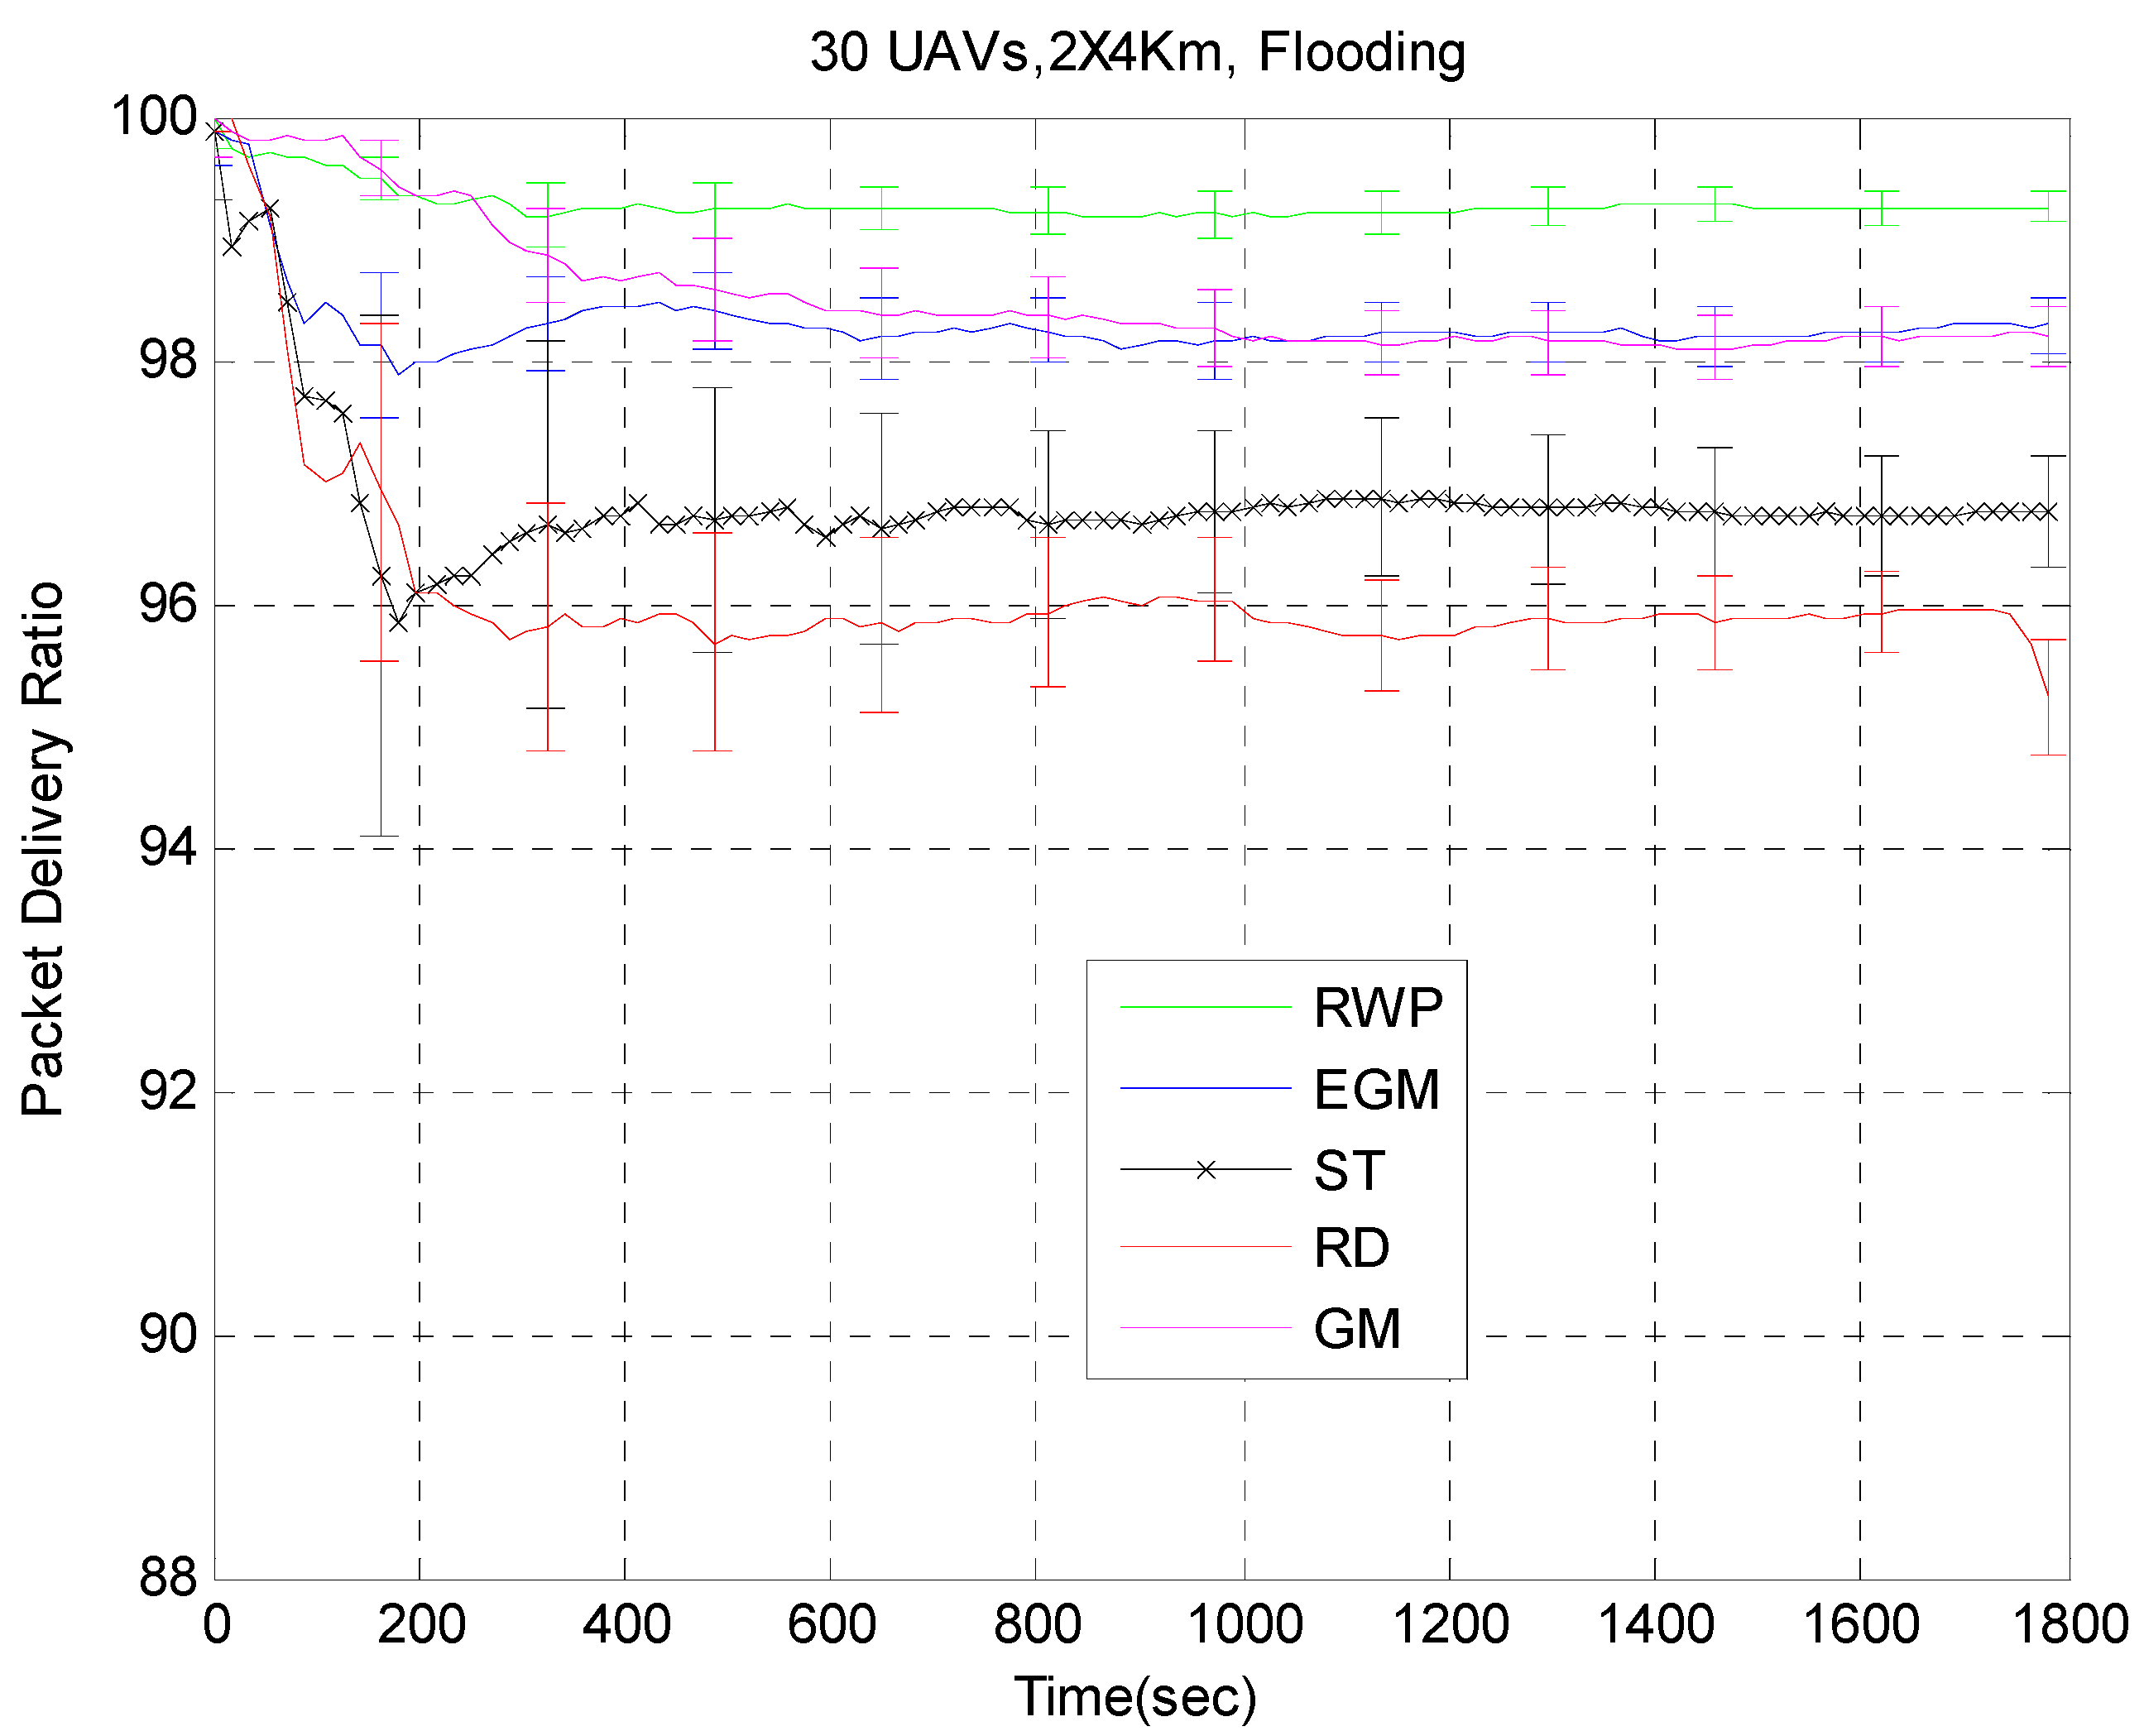
Finally, we have come up with a few conclusions/recommendations that were not drawn in the literature yet, to the best of our knowledge. These conclusions/recommendations provide a benchmark for future simulations of UAANET. Our main conclusions/recommendations are as follows. (i) We have enough reasons to strongly recommend not using the RWP mobility model for UAANET simulations: not only does it make unrealistic assumptions about the trajectory of a UAV, but also it results in poor coverage (the worst among all mobility models); therefore, it would not be suitable for the simulation of a thorough search mission of an entire region. We highly recommend using the EGM model instead, as it best mimics the movement pattern of UAVs. (ii) OLSR, a table-driven proactive routing protocol, and GRP, a position-based geographic routing protocol, are both three-times more sensitive than AODV, an on-demand reactive routing protocol, to the changes induced by the mobility models. (iii) GRP, a position-based geographic routing protocol, closely followed by OLSR, presents the worst routing performance over all of mobility models considered. This feeble performance points out the non-suitability of position-based geographic protocols and table-driven proactive protocols for UAANET. On the other hand, RGR, a reactive-geographic hybrid routing protocol, is best suited for UAANET. (iv) Based on the results of flooding, the upper bound for PDR for routing protocols to tend to is about 99.2%. Moreover, changing mobility models will lead to a PDR fluctuation of at least three percentage points.
In a future work, we will investigate the effect of increased traffic on the routing performance in UAANET. We will simulate various numbers of traffic flows (source-destination pairs) from 1–30 instead of just one, as we do in this paper.


