Design Model of Flow Lines to Include Switch-Off Policies Reducing Energy Consumption


School of Engineering, University of Basilicata, 85100 Potenza, Italy
*
Author to whom correspondence should be addressed.
Appl. Sci. 2020, 10(4), 1475; https://doi.org/10.3390/app10041475
Submission received: 27 January 2020
/
Revised: 31 January 2020
/
Accepted: 18 February 2020
/
Published: 21 February 2020
(This article belongs to the Special Issue Design and Optimization of Production Lines)
Abstract
:One of the most promising approaches to reduce the amount of energy consumed in manufacturing systems is the switch off policy. This policy reduces the energy consumed when the machines are in the idle state. The main weakness of this policy is the reduction in the production rate of the manufacturing systems. The works proposed in the literature do not consider the design of the production lines for the introduction of switch off policies. This work proposes a design model for production lines that include a targeted imbalance among the workstations to cause designed idle time. The switch-off policy introduced in such designed production lines allows for a reduction in the energy consumed with any production rate loss. Simulation tests are conducted to verify the benefits of switch off policies in production lines designed for its. The simulation results show that the proposed line design allows for a reduction in energy consumption, with a defined loss in the throughput. The application of switch-off policies in the proposed flow line leads to a significant reduction in the energy used in unproductive states controlling the production loss.
1. Introduction and Motivations
Nowadays, the industrial manufacturers study energy-efficient models because of the costs and environmental impact of energy consumption [1,2].
The manufacturing activities are characterized by a relevant demand from around 40% with relevant growth expectations between 2018 and 2050 across all cases. Increases in industrial energy use from increasing shipments are partially offset by efficiency gains [3].
Studies by the European Association of the Machine Tool Industries [4,5] on the discrete part manufacturing discussed the importance and environmental impacts of electrical energy consumption.
The main models proposed in the literature, for the design of manufacturing systems, focused primarily on the performance in regards to productivity, quality, and work in process, etc. Recently, the models proposed include the energy efficiency issue, but Gahm et al. [6] emphasized how the scheduling models that include energy-saving may reduce the other goals of the manufacturing systems. Then, it is more important to propose a model that reduces energy consumption without reducing the productivity performance of manufacturing companies.
The works proposed regarding machining energy consumption [7,8] identified three main energy shares: start-up operations (computers and fans, coolant pumps, etc.), runtime operations (tool change, Jog axis, etc.) and material removal operations (machining). The first and second parts are constant and independent of the operation, while the third part is variable and depends on the machining operation.
Gutoski et al. [8,9,10] underlined how the constant independent of the operation is the major part of the energy consumed by the machining machines and this trend has grown in past years.
The reduction in the energy consumption of these parts can be obtained without studying the effect on the particular machining operation as: roughness, cutting paths, cutting time, etc. Therefore, it is more simply to extend a model that reduces the constant energy to several machining systems and other production systems.
A promising approach proposed in the literature to reduce the constant energy consumed by the machining machines is the switch-off policy [11]. Reducing the idle time is a good approach to realize energy-efficient production [12]. One example is the suppliers for small-parts in aircrafts, where the idle periods accounted for 16% of the total production time, and about 13% of the total energy consumption could be saved if the idle machines were switched off [13]. Another study by Weinert and Mose [14] highlighted how almost 50% to 60% of energy consumption could be reduced by turning the standby machines into energy-saving states.
The switch-off policies switch off when the machine is in the idle state, which reduces the constant energy consumed during this state. When there are a determined number of parts waiting for the operation, the machine switches on, subject to a warm-up period to be operative. The decision of the switch on is crucial to maintain the productivity level of the production line. Some approaches have been proposed, by Frigerio and Matta [15,16], with a significant reduction in energy consumption in a flow lines context. The switch-off models proposed works on a flow line designed following classical objectives that solve the simple assembly line balancing problem [17,18]. An extensive survey of the flow line production system balancing was discussed in References [19,20].
Mathematical models to support the decision towards the switch off/on, which works off-line, have been proposed by Mashaei and Lennartson [21] and Jia et al. [22]. These models did not handle the uncertainty of the production system and the optimization can lead to high computational complexity when the number of machines is higher; this reduces the potential application in real industrial manufacturing systems.
Su et al. [23] and Frigerio and Matta [16] studied upstream, downstream, and mixed policies in a single machine, and the extension to a production line, assuming stochastic arrivals, and constant warm-up under to stock control. These models did not consider how the control of the machines may reduce the production performance of the manufacturing system.
Renna [24] studied a dynamic and adaptive control strategy to switch-off the machines on a production line under the pull control policy. The policy proposed uses the information of the buffers and the level of customer satisfaction. The results also underlined the potential application of the switch-off policies in production lines under pull control.
Duque et al. [25] studied one machine with one buffer with a fuzzy controller that includes the information about the buffer, the machine state and the production rate required, considering the warm-up energy. The controller was tested through simulation experiments and it was observed that a large amount of energy could be saved without affecting the throughput significantly.
Wang et al. [26,27] proposed a method based on a fuzzy controller that includes the information of the upstream, downstream buffer and the status of the machine. They proposed a set of fuzzy rules to take the decision to the switch off/on policy. The simulation experiments show that the proposed approach can be a simple, practical way towards the energy saving operation with accepted throughput loss.
Marzano et al. [28] proposed a model that controls the machine on-line acquiring data and estimating the risk of the control policy actions. The model has several limitations because it is tested for a specific distribution for the estimation of the parameters and the tests are conducted considering a production line composed of two machines.
The discussion of the past works highlights the following issues:
- -
- The switch-off policies are mainly proposed for a single machine and some works considered a flow line with the introduction of buffers;
- -
- Few works evaluate the reduction of the performance level due to the introduction of the switch-off policy, but only energy consumption;
- -
- Works were proposed to consider the possibility of a switch-off policy and were considered from the design step of the production line.
In response to the limits in the literature, this paper proposed a design model that includes the switch-off policy by first asking:
RQ1: what is the impact of the design model proposed on the performance of the production line in terms of energy saving maximizing the production rate?
Some previous works show how the switch-off policy causes production loss, then our second research question asks:
RQ2: can the constraint of a limited reduction loss improve significantly the energy saving of the production line obtaining an adequate trade off?
The research proposed concerns about the development of a design model of the flow lines that includes the possibility of the switch-off already in this design step. Then, the switch-off policy is introduced in the flow line designed by the proposed model. The proposed design and switch-off policy is compared to a flow line designed with the classical objectives with the same switch-off policy.
Simulation experiments will be used to answers our two research questions. The simulations were conducted by considering different levels of production rates in the design model and different levels of the buffers (upstream and downstream) that control the switch-off policy.
The paper is organized as follows. Section 2 described the design model of the flow line, while Section 3 introduces the switch-off policy used. Section 4 introduces the reference context investigated with simulation scenarios, while Section 5 discussed the numerical results. Section 6 provides the conclusions and a future research path.
2. Flow Line Design Model
The problem deals with the designing of a flow line composed by M stations that manufactures one product type. The product consists of N operations to process; these operations should be assigned to the M workstations, following the precedence constrains. The variables of the model are the assignments of the operations to the workstations of the flow line. The operation assignment binary variable xij is defined as follows (Equation (1)):
The precedence constrains binary variable ensures that the i-th operation must be completed before the k-th operation, and it is computed as (Equation (2)):
The processing time Tj of the j-th station is the sum of the processing time of the operations assigned to j-th station, as follows (Equation (3)):
The cycle time C of the production line is equal to the maximum of the stations’ processing times, as shown in Equation (4)
The j-th station idle time is defined as follows (Equation (5)):
The idle time for each cycle is given by Equation (6):
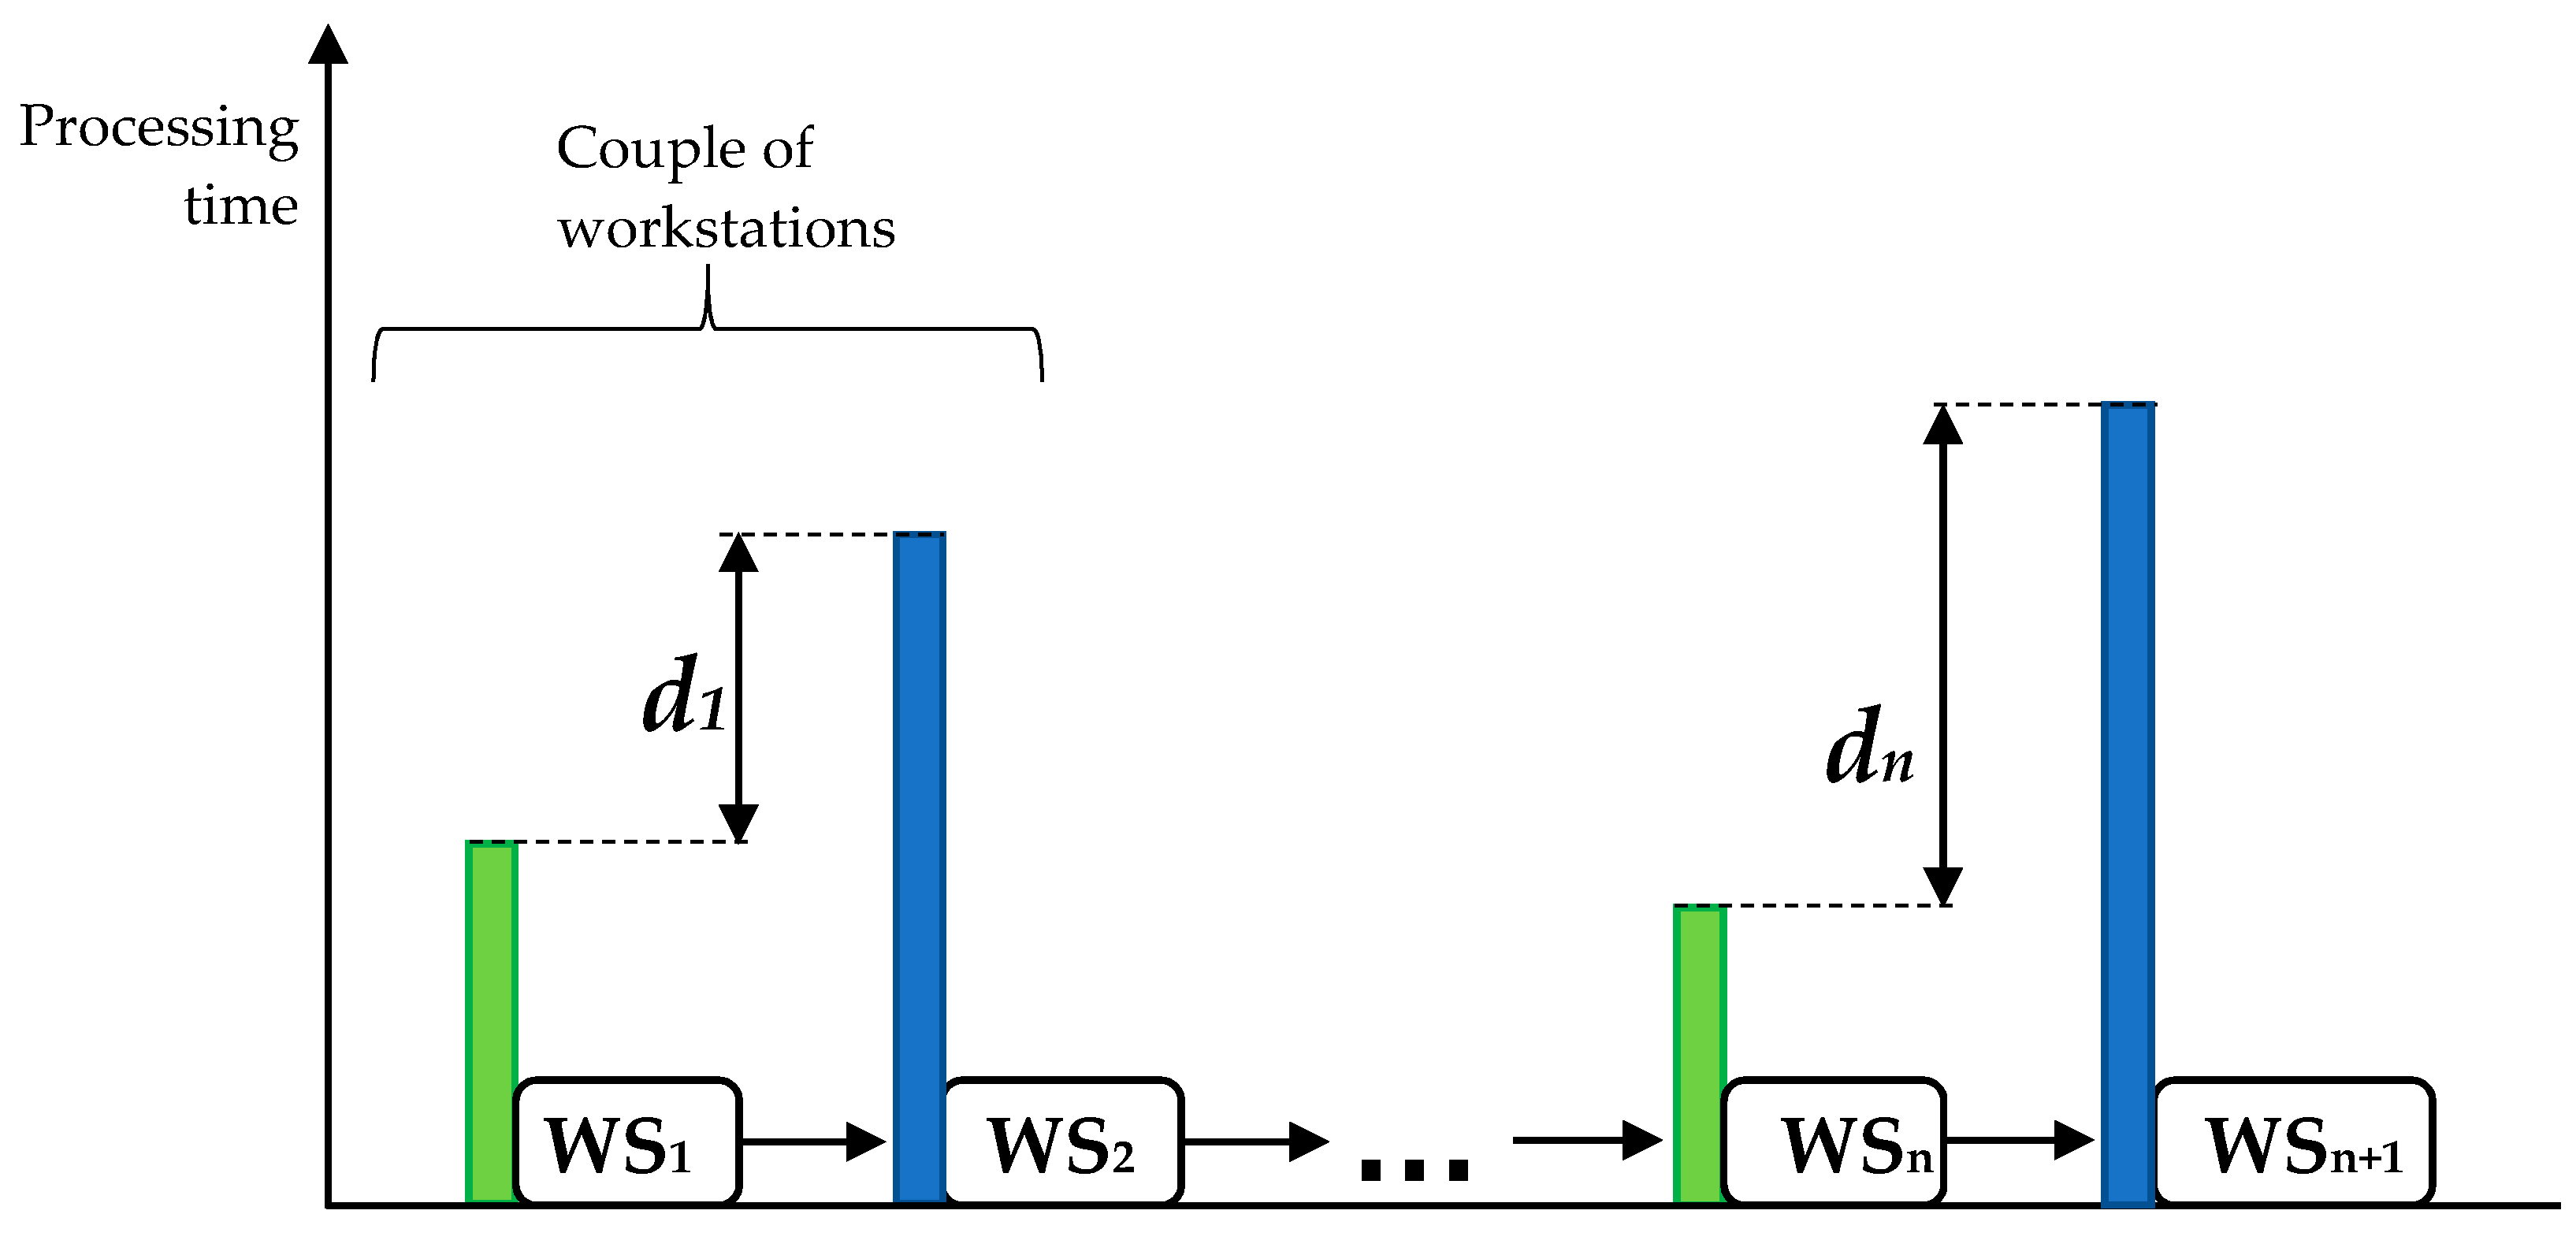
The difference of processing time between nearby stations is called distance dj and it is defined as follows (Equation (7)):
A positive value of the distance dj forms a couple of workstations when the first has a higher velocity than the second workstation. Then, the first workstation can fill the downstream buffer and goes into the off state, reducing energy consumption. Therefore, the flow line consists of a couple of workstations to facilitate the off state of the first workstation of the couple. Figure 1 shows the concept of the distance of a couple of workstations. In the following figure, the term WSj has been used to identify the j-th workstation; the distance between two stations has been obtained as the difference of the processing time of the second workstation (with higher working time) and the first workstation of the couple. In Figure 1, the processing time is linked to the stations with, respectively, lower and higher productivity per couple, as represented in blue and green.
To achieve an unbalanced flow line, the objective function is achieved by maximizing the sum of the distance between stations (Equation (8)):
This is subject to the following constrains (Equations (9)–(11))
Equation (9) ensures that each operation is only assigned to one machine. Equation (10) ensures that the constraints on the precedence of operations are respected. Finally, Equation (11) ensures that the station processing times are below the maximum fixed cycle time. By setting the cycle time, maximizing the objective function achieves an unbalanced line that respects the targeted productivity. Equation (8) results in an unbalanced flow line with high idle times between sequential stations. In order to achieve more downtime, and therefore higher energy saving, this research proposes a different objective function from past literature, where the focus instead is on obtaining the minimum cycle time [17], the minimum number of stations, and the minimum idle time [18].
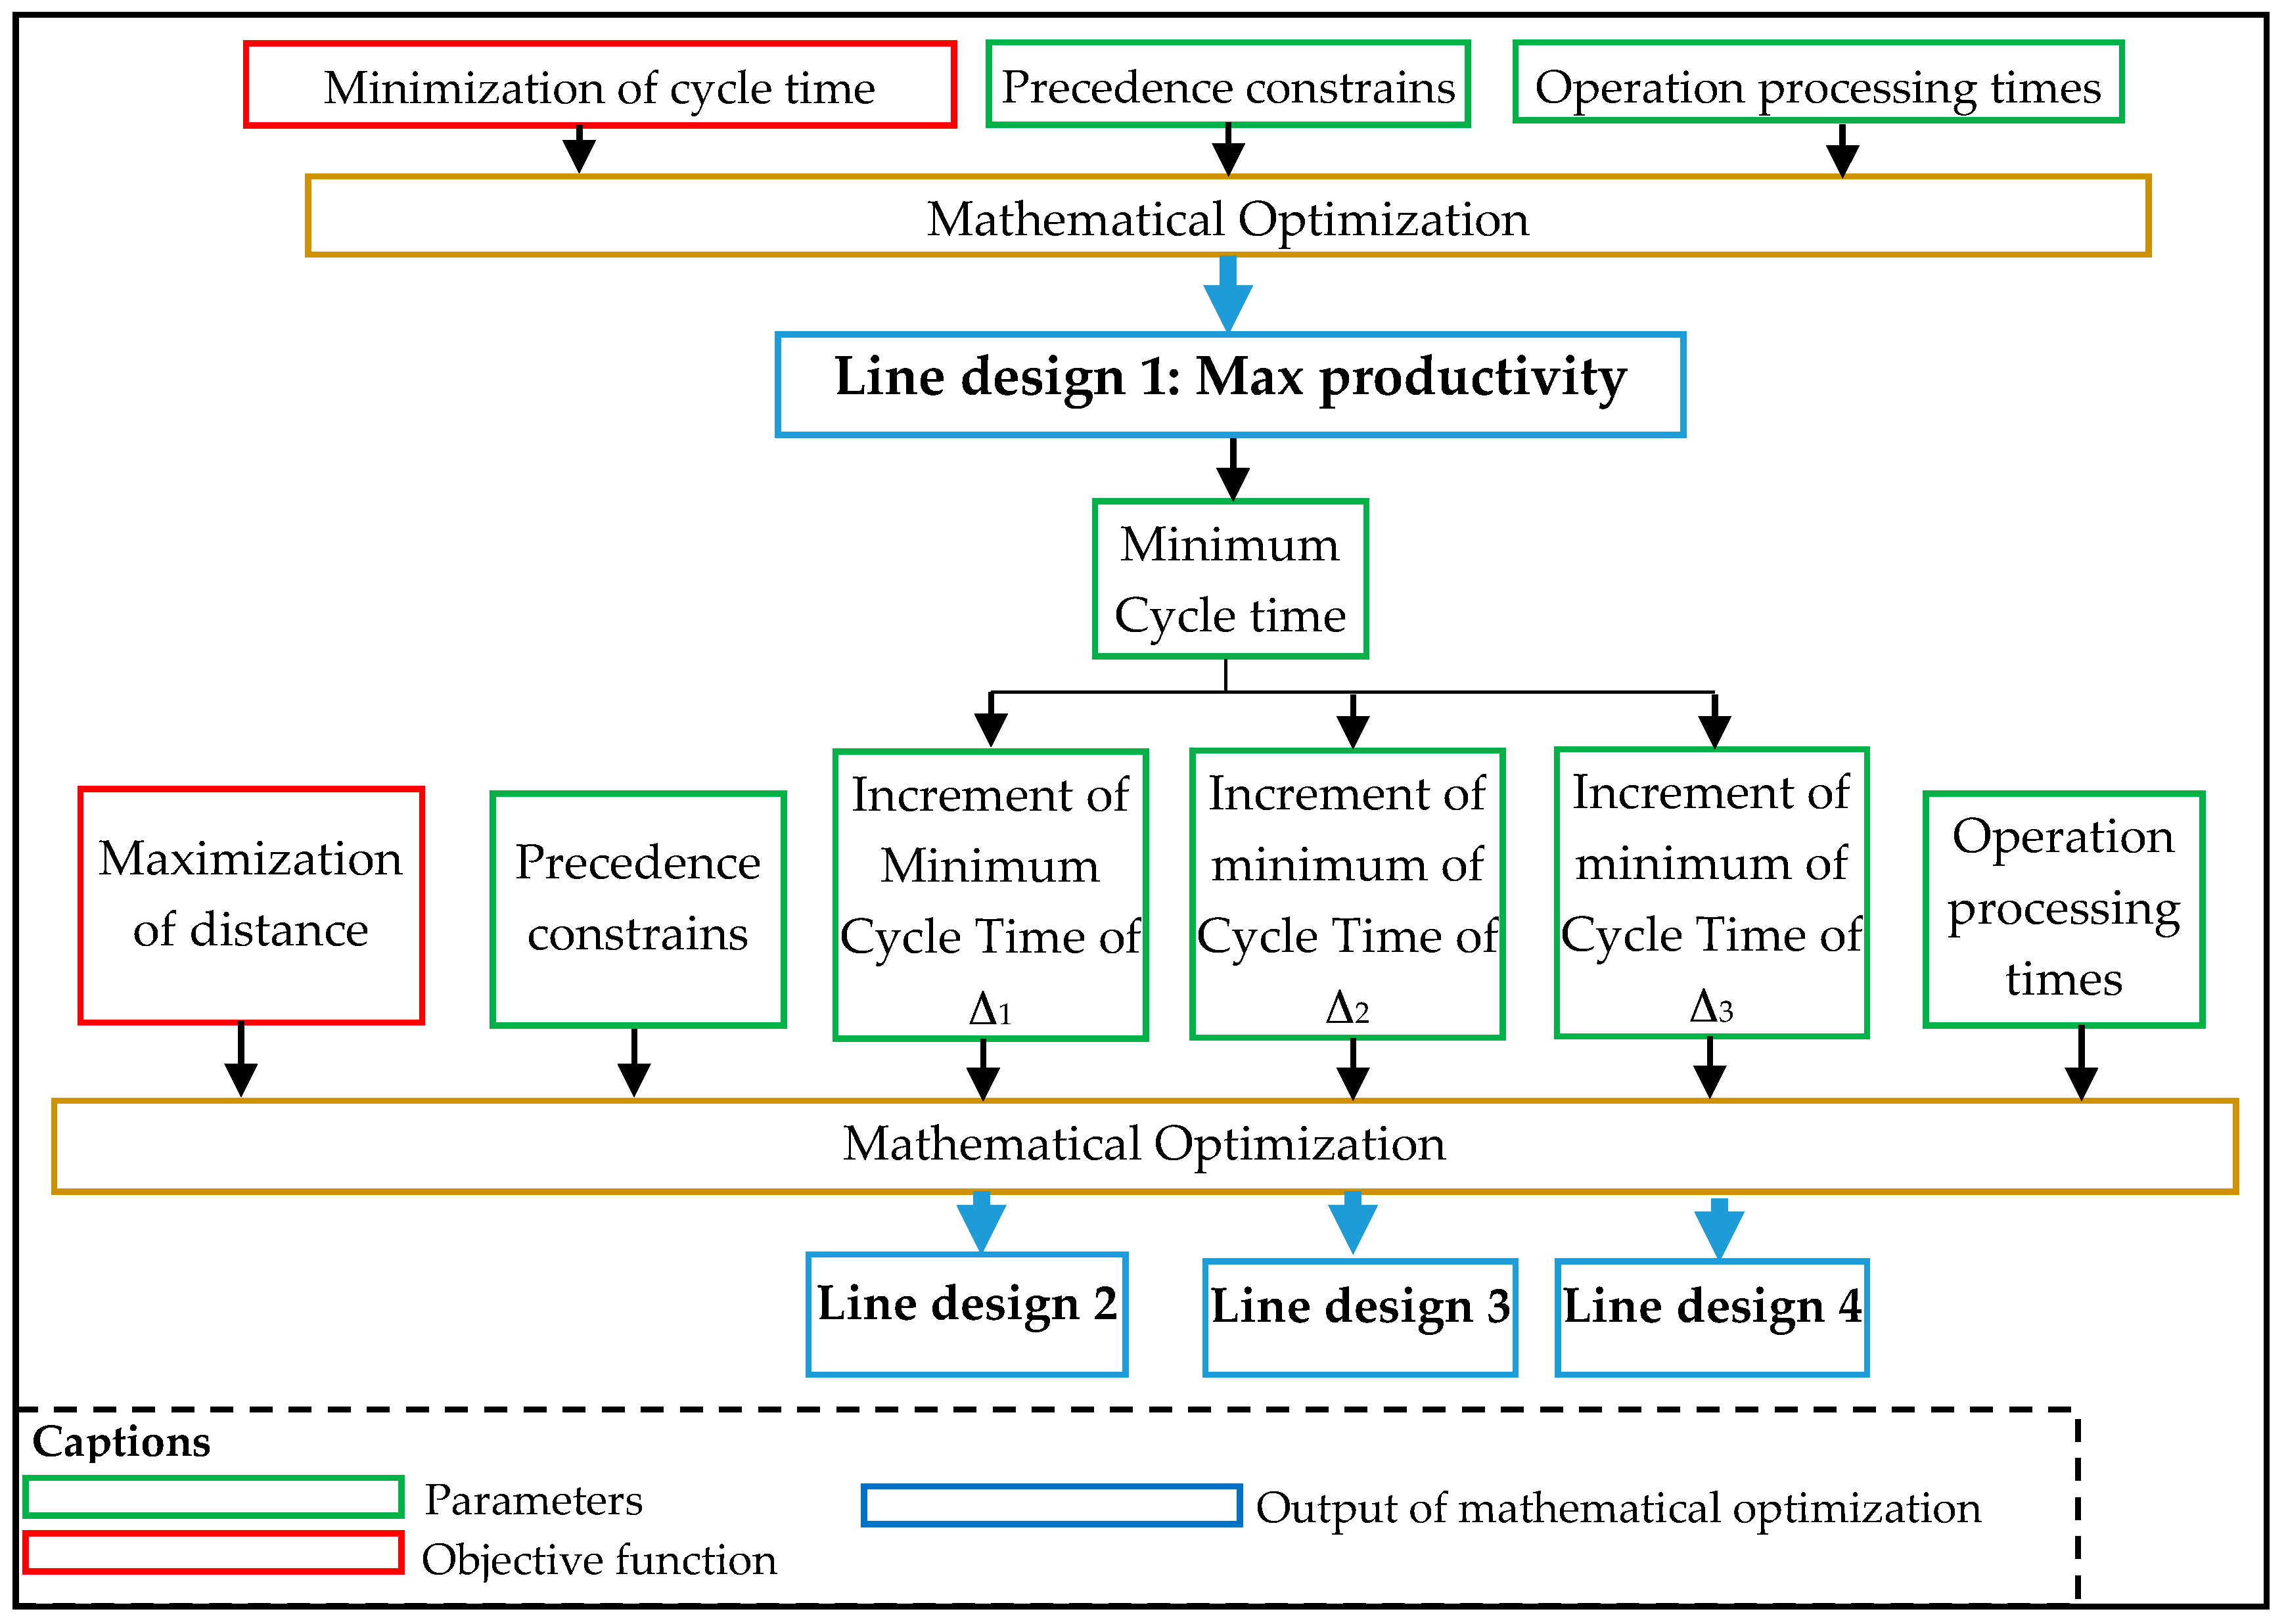
Figure 2 shows the framework used for the design of unbalanced flow lines. First, using the mathematical model, the flow line with maximum productivity and minimum cycle time has been achieved. The obtained maximum productivity flow line and the minimum cycle time has been calculated as the bottleneck station processing time. The minimum cycle time has been used as a parameter to design unbalanced flow lines using the maximization of the sum of distances as the objective function according Equation (8). Then, increasing and fixing the cycle time, the maximization of the sum of the distance results in several unbalanced flow lines (in this paper, three unbalanced flow lines have been obtained). Then, the simulation will be studied if the increment of the cycle time can lead to important energy reduction.
3. Switch off Policy
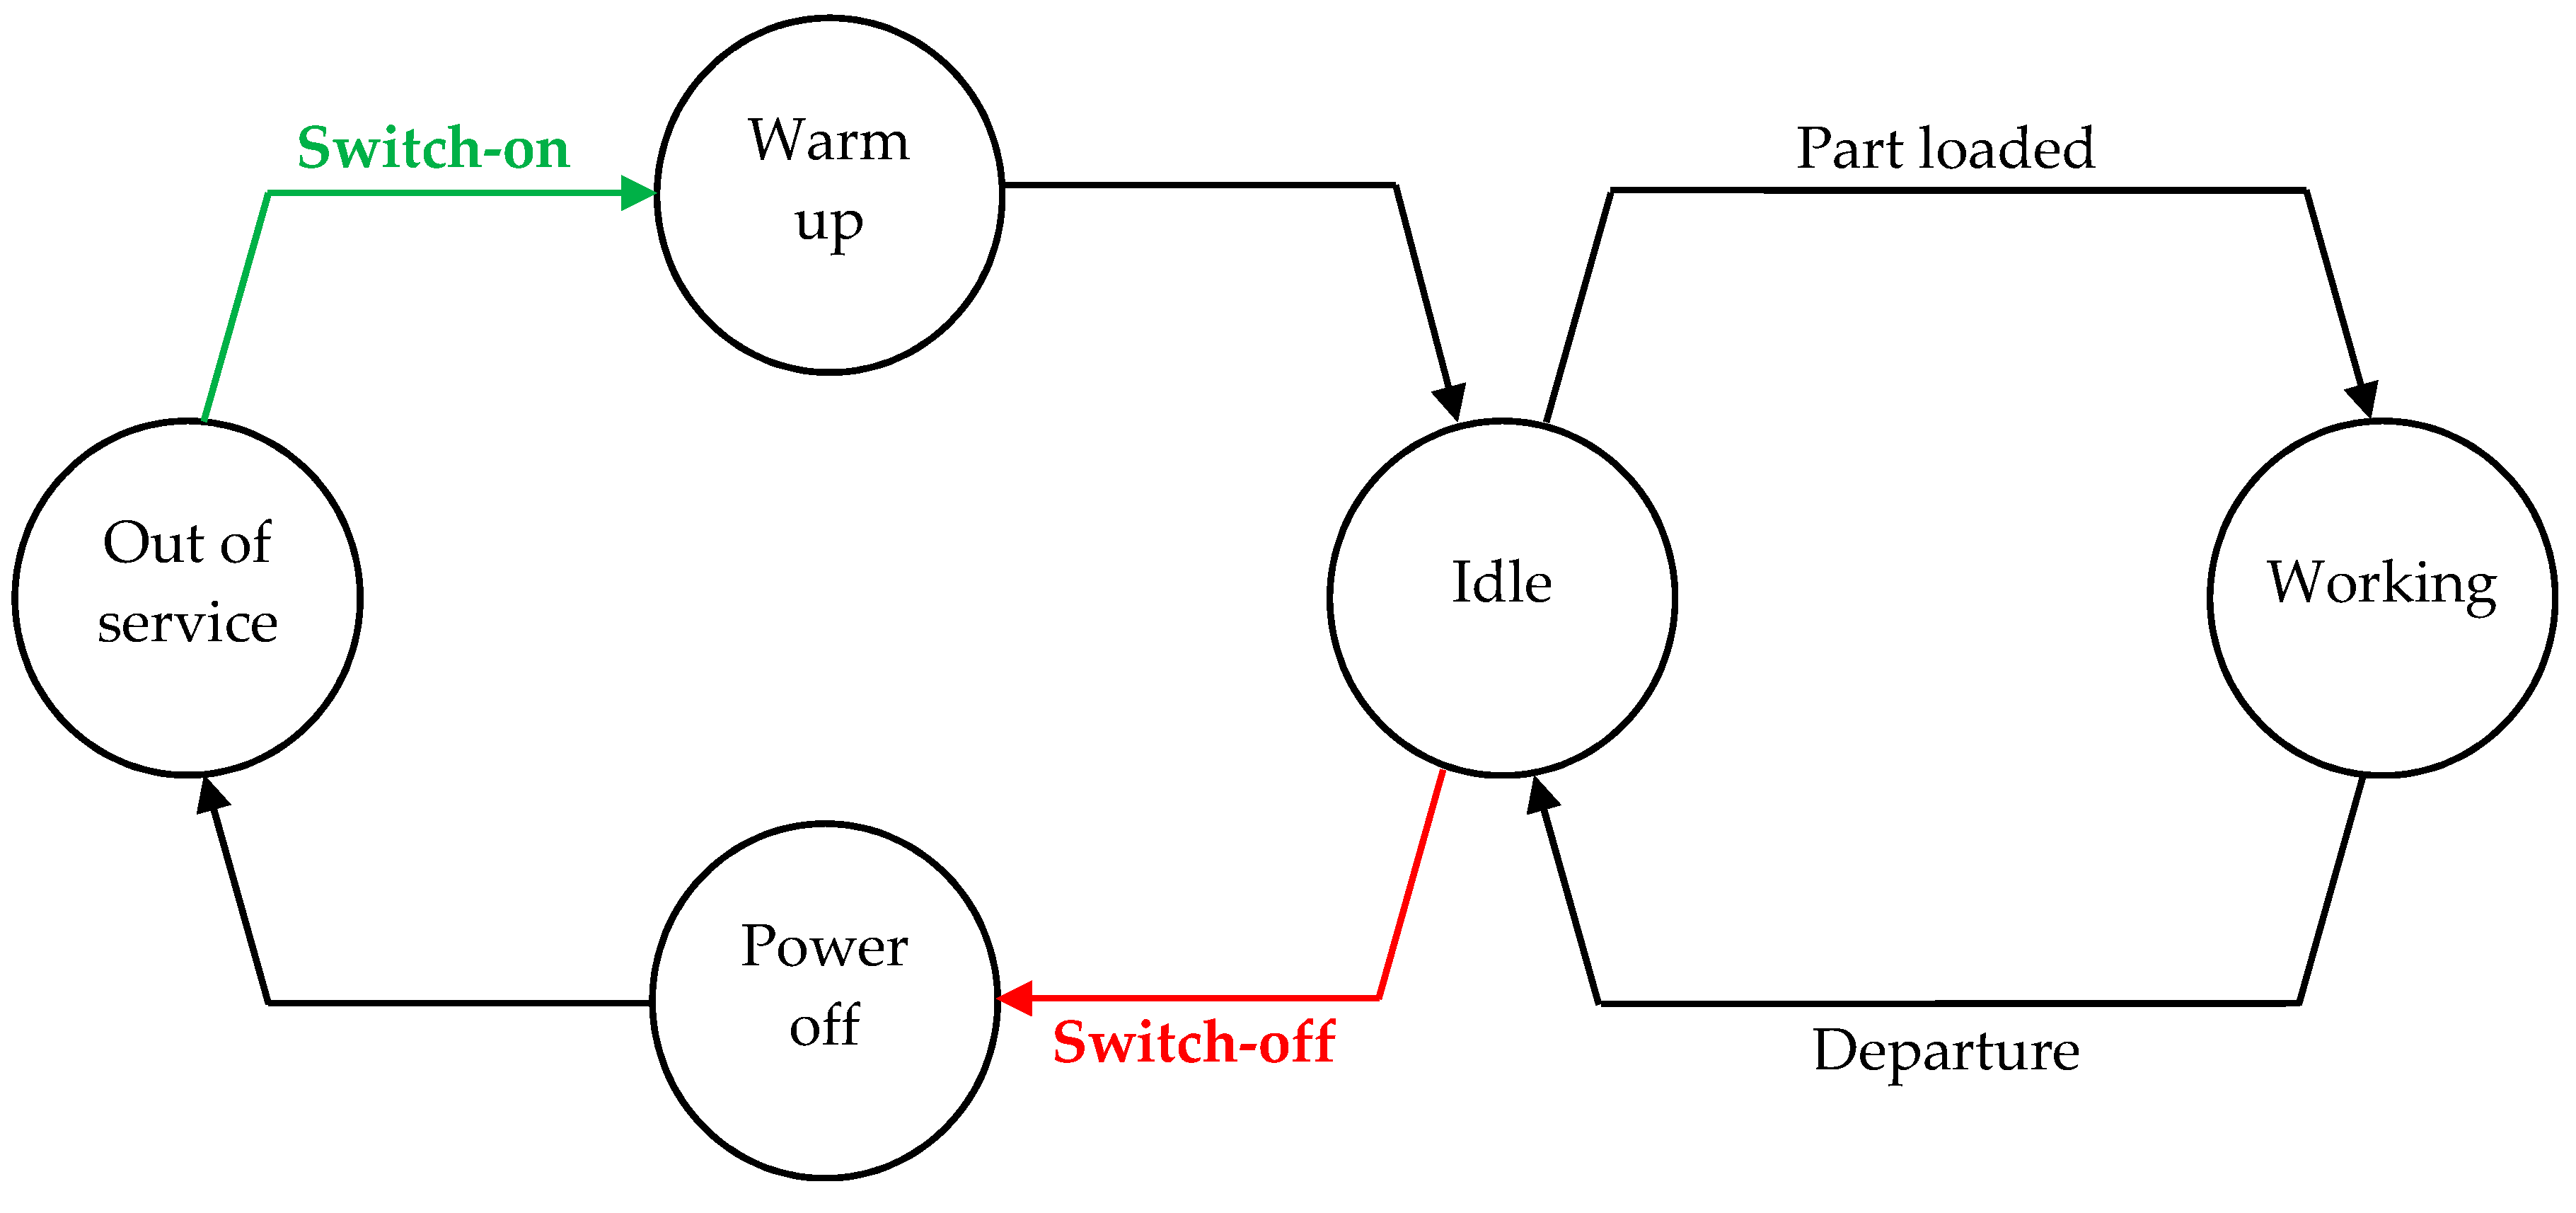
As described in the literature [23], switching off policies based on buffer level information can lead to significant energy savings without reducing productivity. The proposed policies are upstream (UP), downstream (DP), and upstream and downstream (UDP). In the upstream policy, the machine switches off when the upstream buffer is empty and switches on when the upstream buffer level is NUon. The level of downstream buffer controls the state in the downstream policy. The machine switches off when the threshold NDoff is reached and turns on when the number of pieces in the buffer is equal to NDon. According to Reference [15], the state of machine sj is defined as follows (Equation (12)):
The states 1, 2 and 3 are unproductive, i.e., no pieces are being processed when a machine is in one of these states. The states 1 and 2 are called inactive states. According to Reference [23], the upstream and downstream combines the UP and DP policies as follows (Equation (13)):
Figure 3 summarizes the states of the generic machine and the transition from one state to another.
4. Reference Context and Simulation Scenarios
Using the mathematical model described in Section 2, four production lines with 10 stations and 20 tasks to complete have been designed. The flow line only produces one product type.
The operation processing times and the precedence constraints are described in Table 1 and have been obtained from the simple assembly line balancing problem dataset (SALBP) according to Reference [29].
The basic assumptions for the line design are the following:
- ▪
- The stations can perform every possible operation assigned by the design model;
- ▪
- The precedence constraints are fixed;
- ▪
- No machine failure has been considered;
- ▪
- The operations processing times are deterministic and are the same for each station.
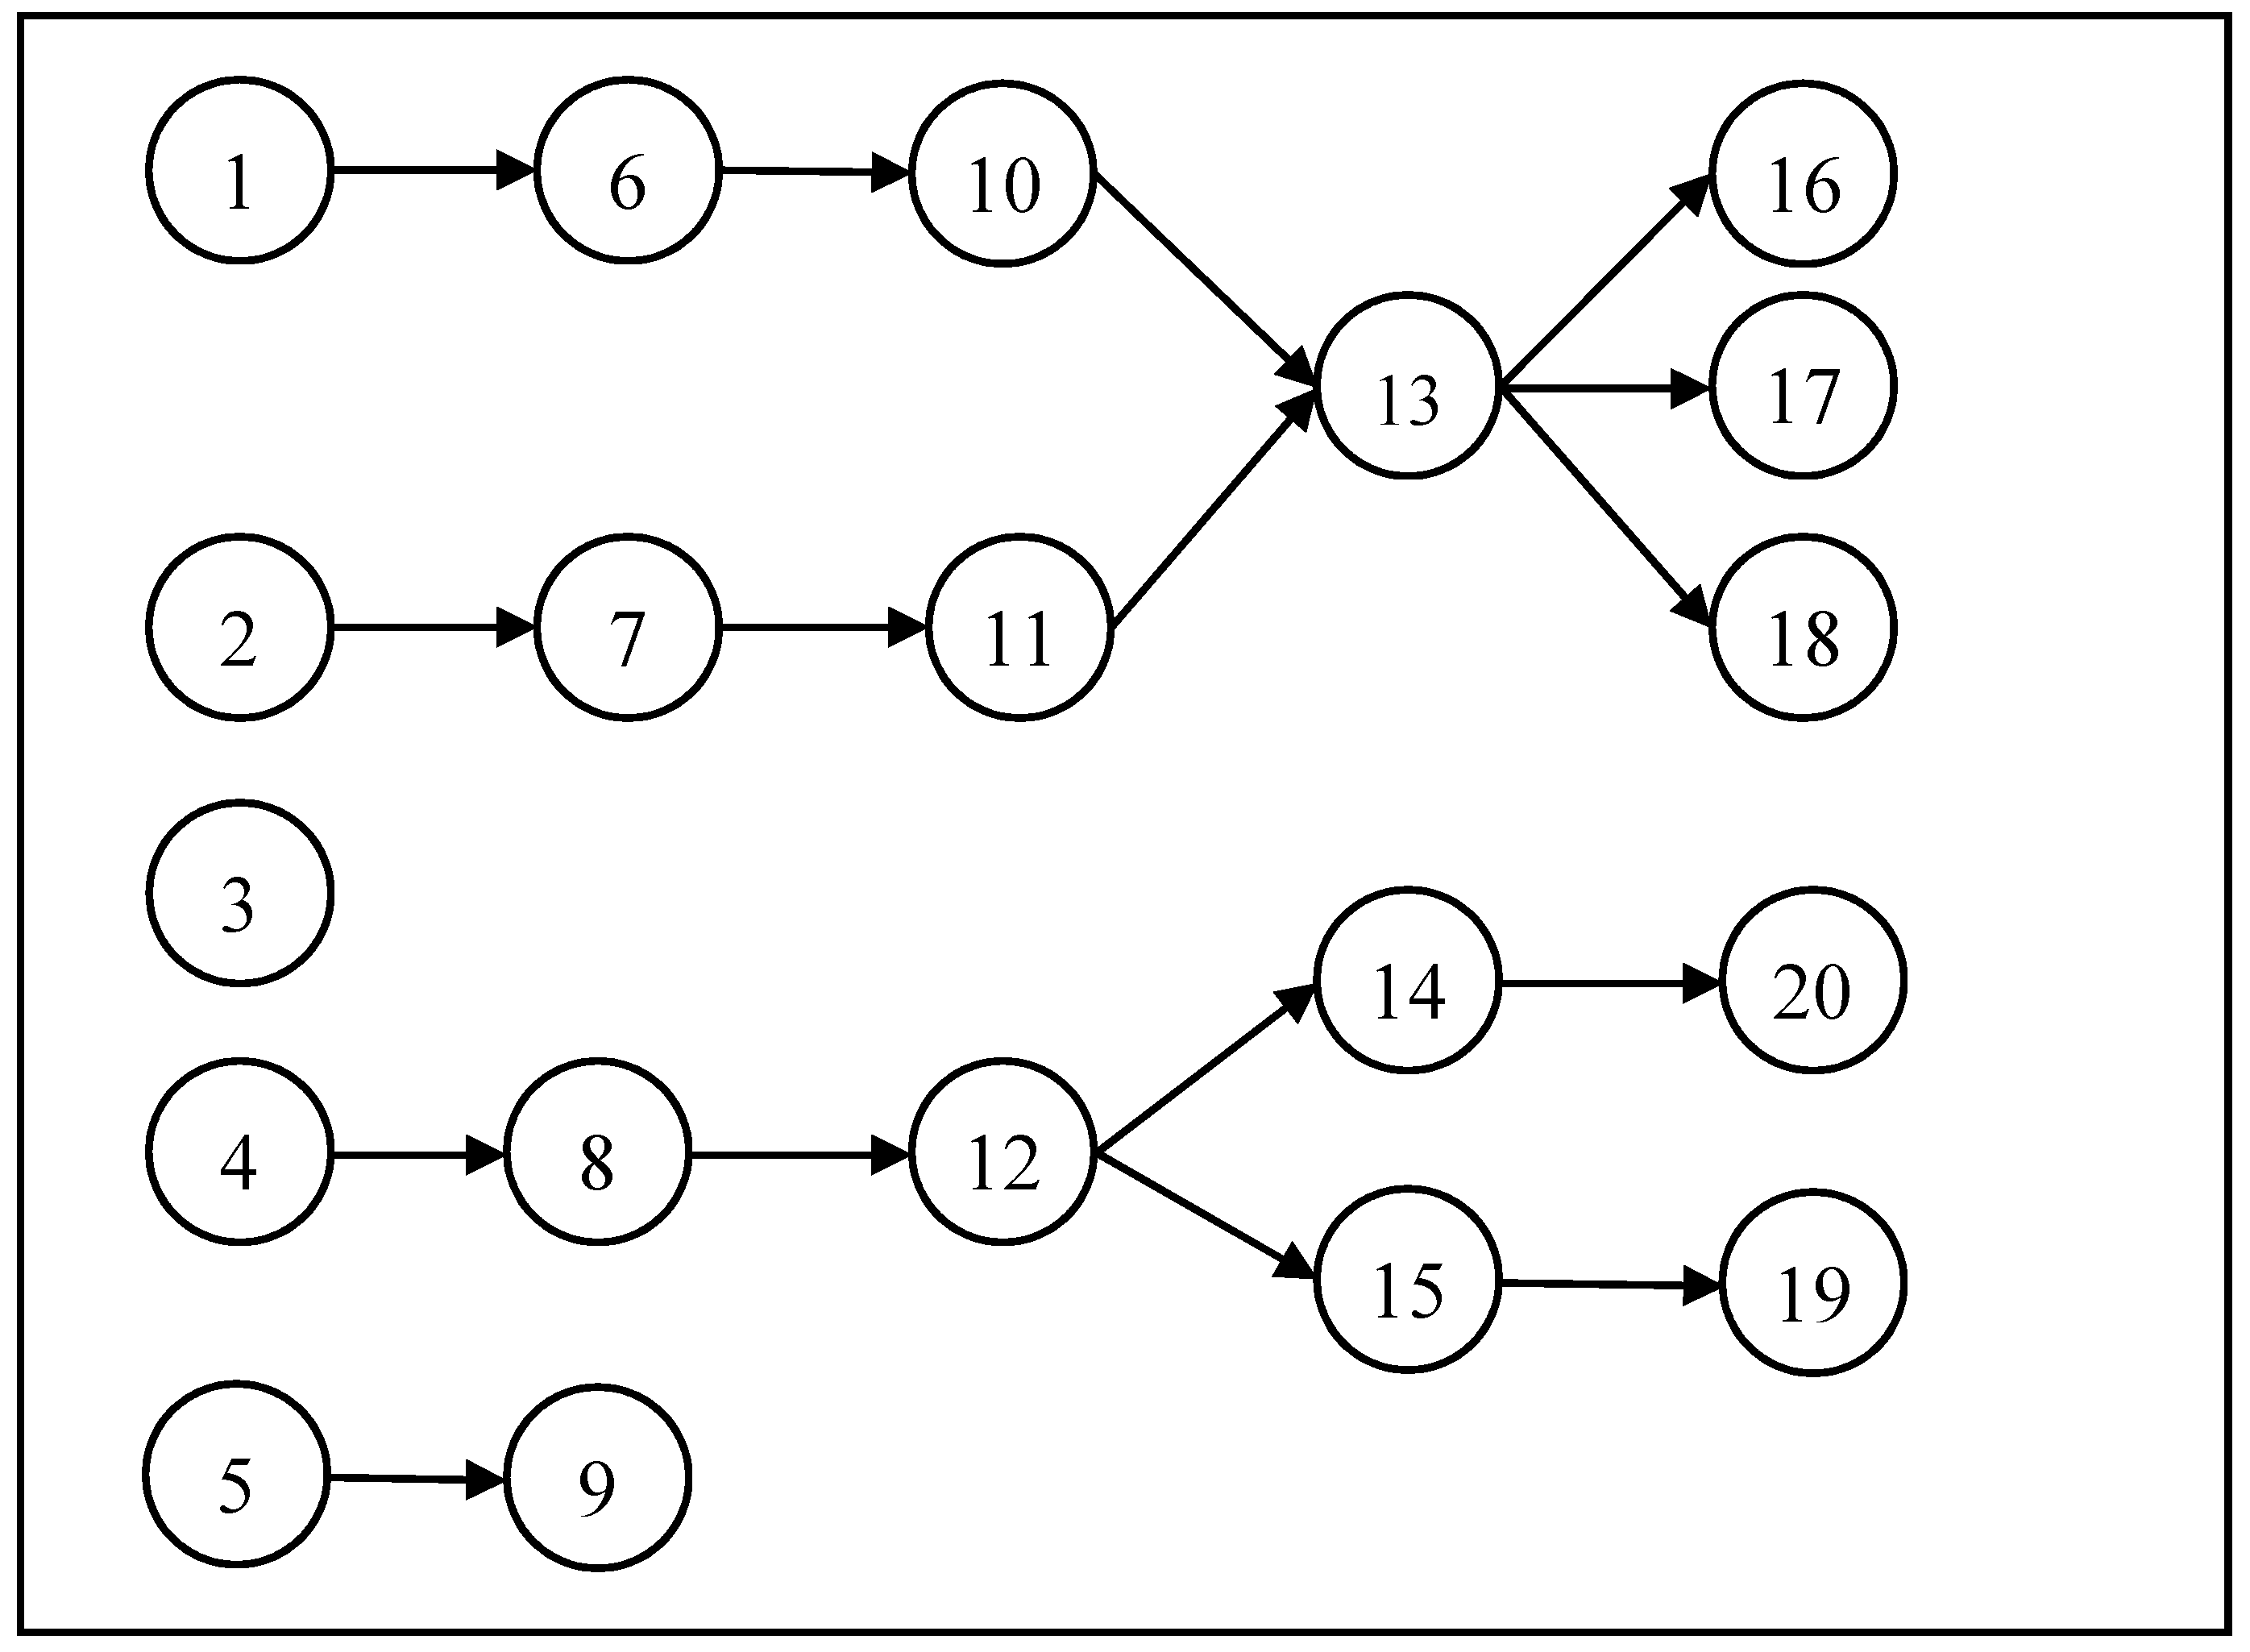
Figure 4 shows the precedence graph. In the precedence graph, each task is represented as a node, and each direct precedence constraint is illustrated as an arrow that links node i and k if the i-th operation must precede the k-th operation. For example, in Figure 4, operation 6 must be executed before operation 10.
Four flow lines are obtained in order to get respectively:
- Minimization of total idle time for each cycle with minimum Cycle Time (MinTTd);
- Maximization of distance between stations with a 2.5% increment of minimum Cycle Time (2.5% loss production rate, MaxD_2.5%);
- Maximization of distance between stations with a 5% increment of minimum Cycle Time (5% loss production rate, MaxD_5%);
- Maximization of distance between stations with a 10% increment of minimum Cycle Time (10% loss production rate, MaxD_10%).
The solution of the mathematical model, considering the previous constrains, gives the following flow line designs (Table 2); moreover, the station processing times and the station idle times have been reported in Table 2.
The first production line is considered to be the benchmark of the other production lines, because it gives a balanced production line with 10 stations and the minimum cycle time.
A discrete event simulation, implemented in Arena, has been used to evaluate the performances of the four flow line designs and to analyze the application of switch off policies in unbalanced production lines.
Each model has been simulated by considering machines in the “always on” (AO) state and the UPD switch off policy.
The basic assumptions of the AO model are:
- ▪
- Each station has a buffer;
- ▪
- The buffer capacity is fixed, and equal to K;
- ▪
- The buffer of the first station is always full, that is the raw material is always available;
- ▪
- The power absorbed in each state is equal for all machines.
In addition, for the models with switch off policies, the following conditions apply:
- ▪
- Each station is controlled by a switch off policy;
- ▪
- The control policy parameters (NUon, NDoff, NDon) are the same for stations from 2 to 9;
- ▪
- The first station has only DP policy;
- ▪
- The last station has only UP policy.
As described by Frigerio and Matta [15], the production line machines can be in the following states:
- –
- Working state: the machine is processing a piece and absorbs the power Pw;
- –
- Idle state: the machine is ready to work a part, and absorbs the power Pi;
- –
- Out-of-service (Inactive) state: the machine is not ready to process a part. In this state the machine absorbs the minimum amount of power Poff;
- –
- Warmup state: the machine changes its state from Out-of-service in idle or working state, consuming the power Pwu for the time to complete the warmup twu.
According to [23], the power required by a generic machine in each state is:
- –
- Pw = 12 kW;
- –
- Pi = 5.35 kW;
- –
- Poff = 0.52 kW;
- –
- Pwu = 6 kW for twu = 20 s.
To determine the best switch off control parameters, a full factorial design has been developed. The factors considered are NUon, NDoff, NDon, and three levels for each factor are evaluated as follows:
- –
- NUon = [1, 2, 3];
- –
- NDon = [4, 5, 6];
- –
- NDoff = [7, 8, 9];
According to Reference [23], the levels of buffer to switch off or switch on machines respect the following constraints (Equations (14)–(16)):
Figure 5 reports on the experiment results for model 1. The design with the lowest inactive time has a value of 0, the design with the highest inactive time has a value of 1. These results are used to set these parameters for the simulation tests.
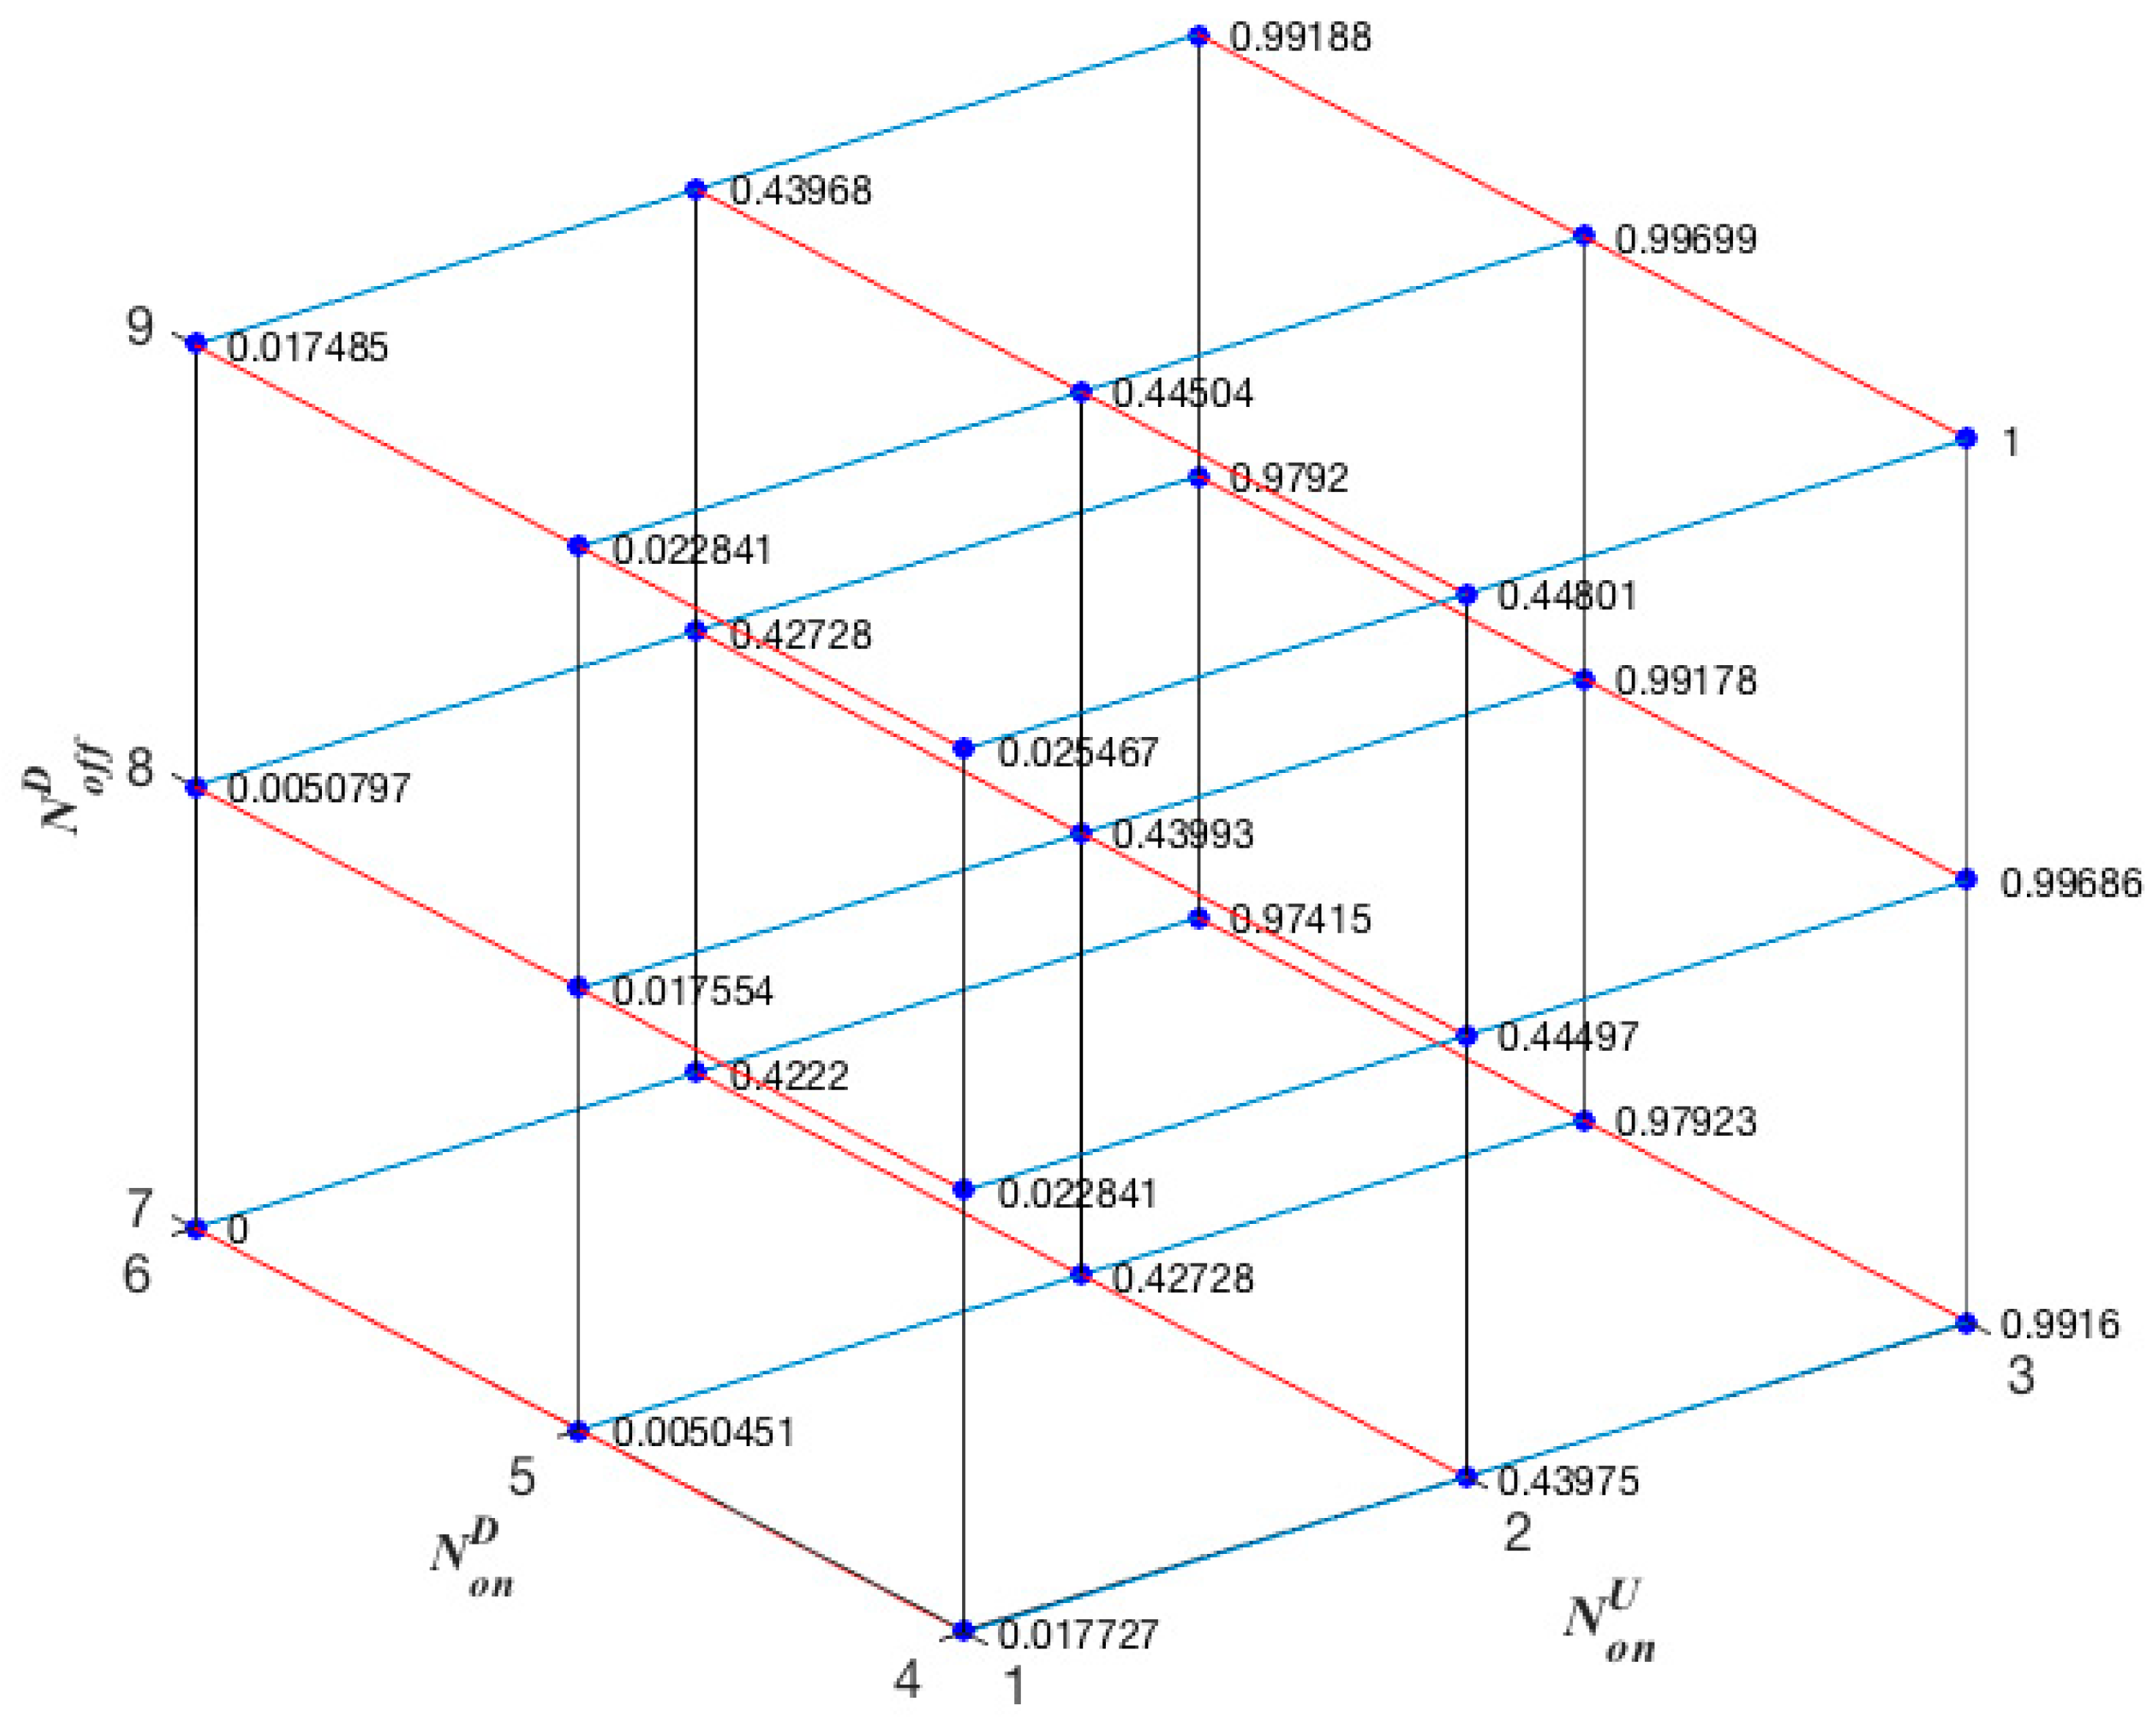
The results of the other experiments for models MaxD_2.5%, MaxD_5%, and MaxD_10% are reported in Appendix A.
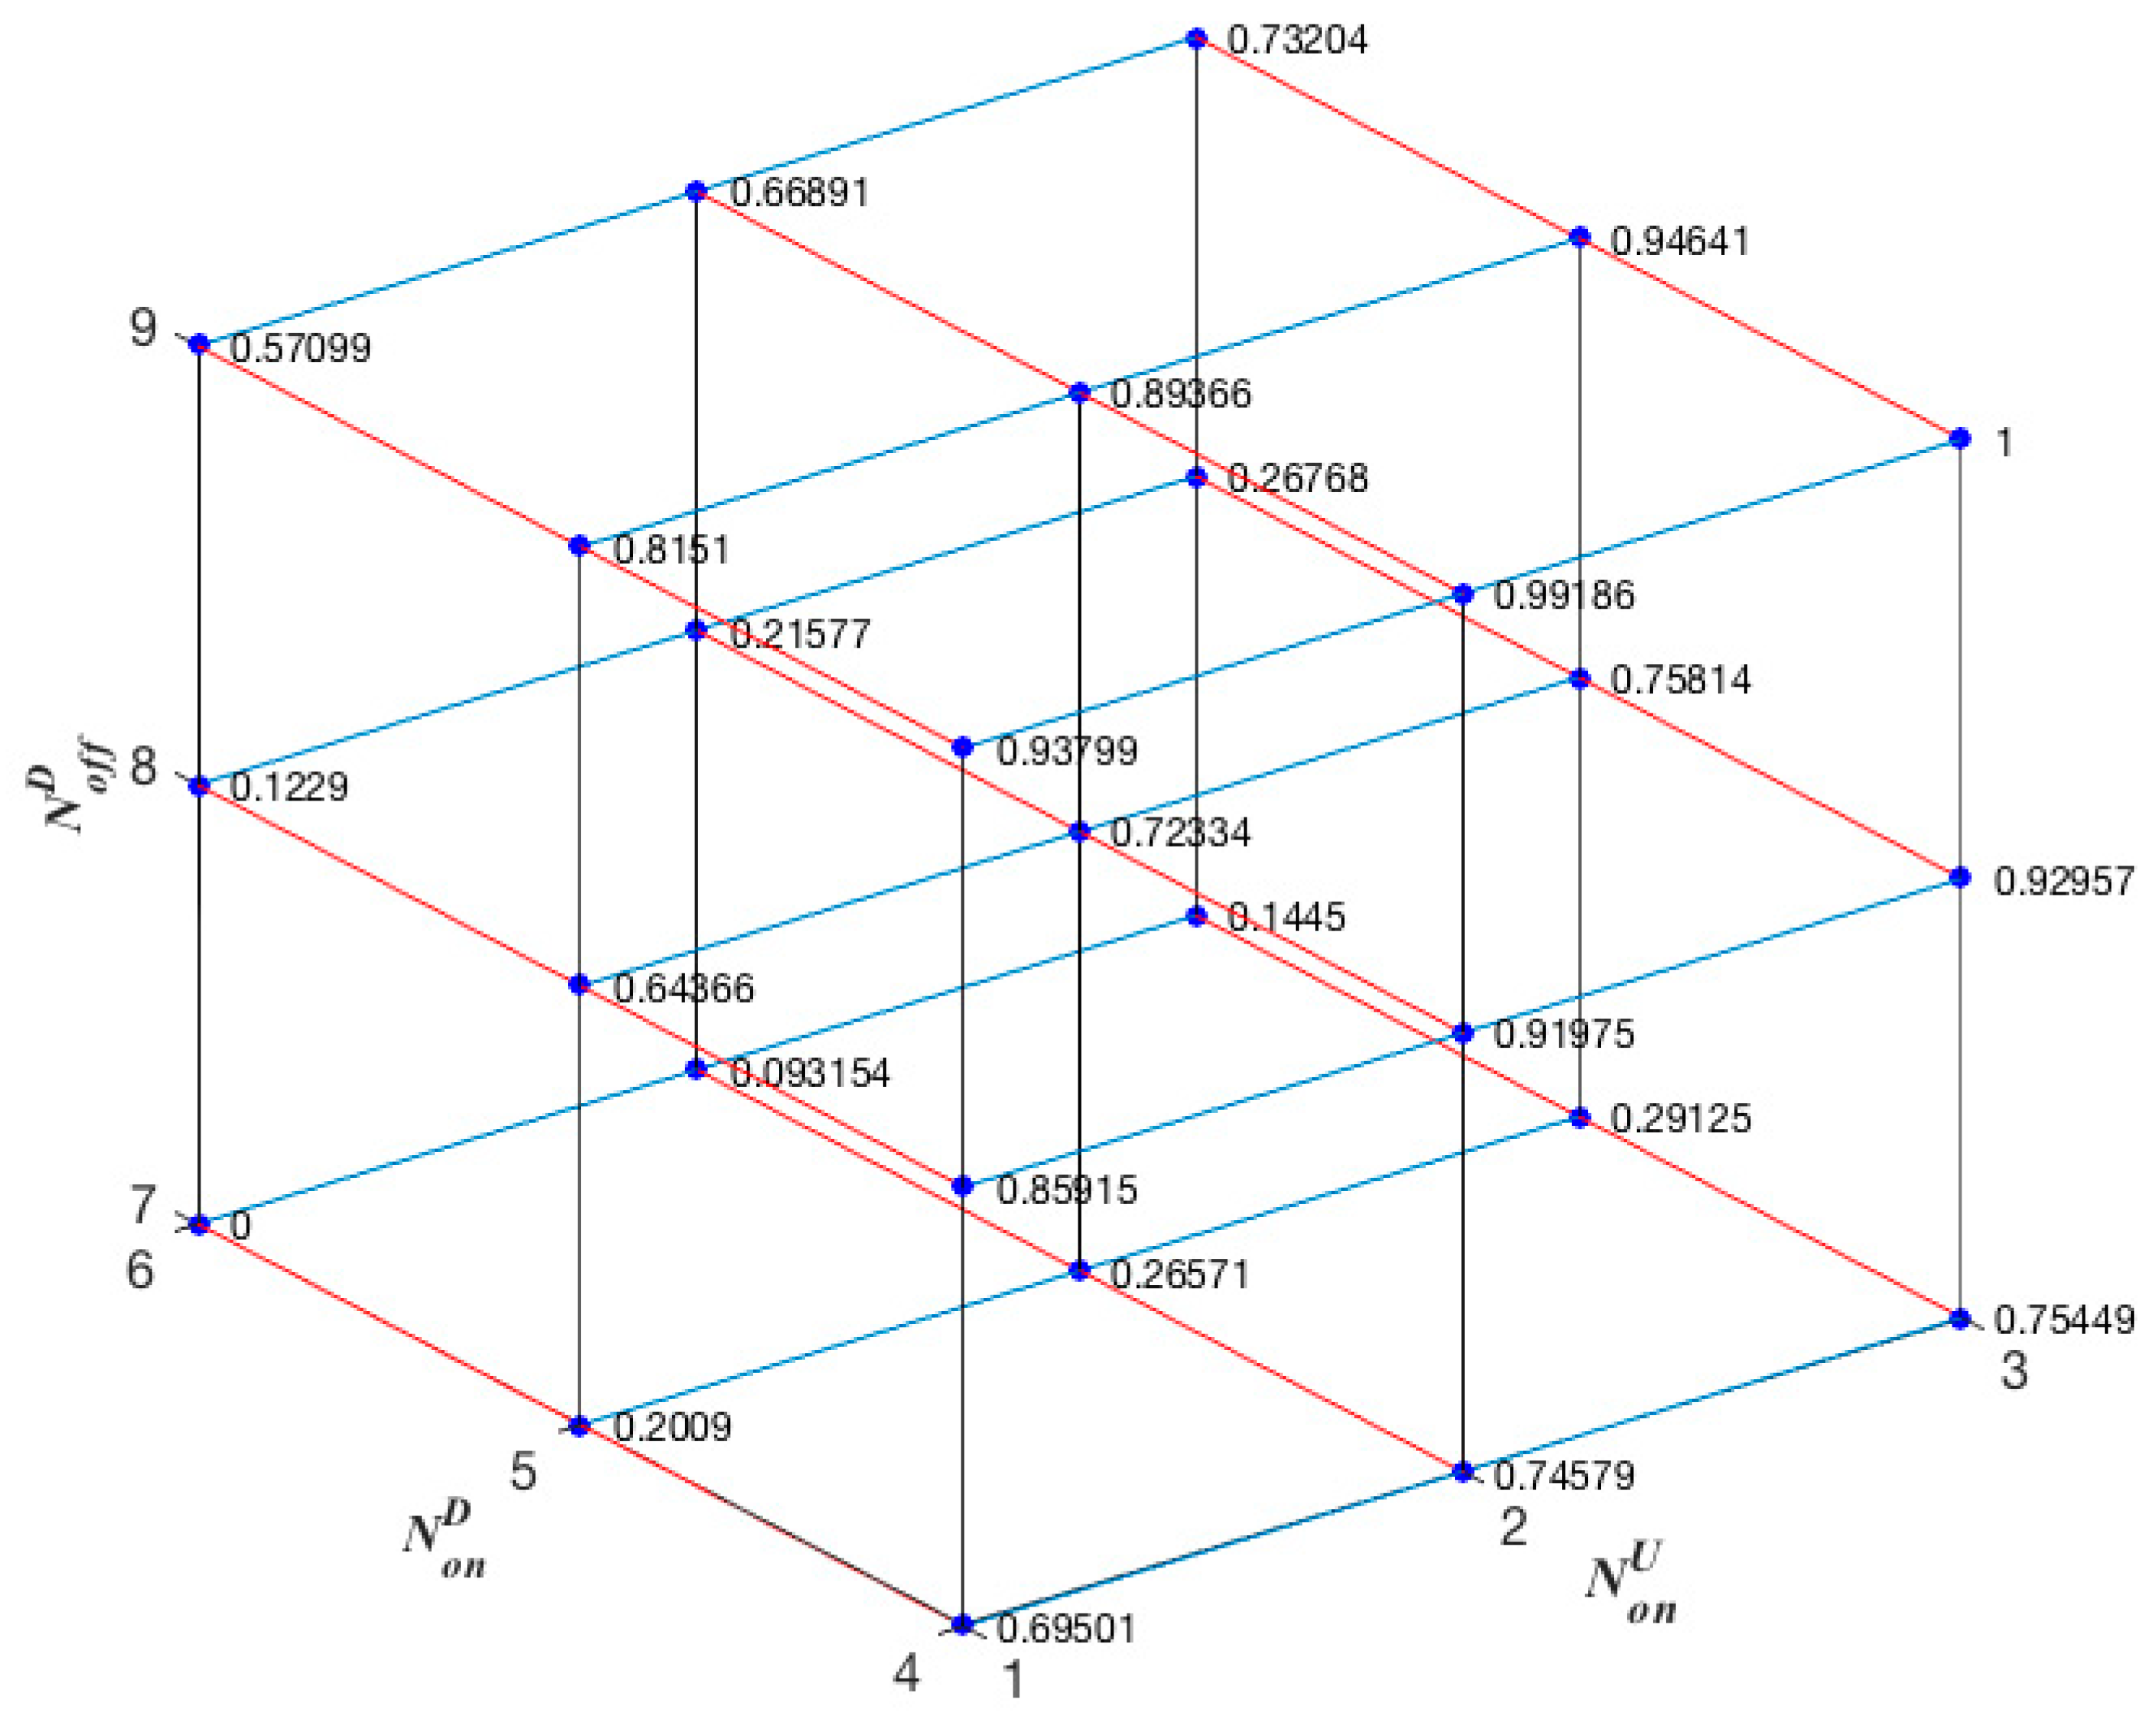
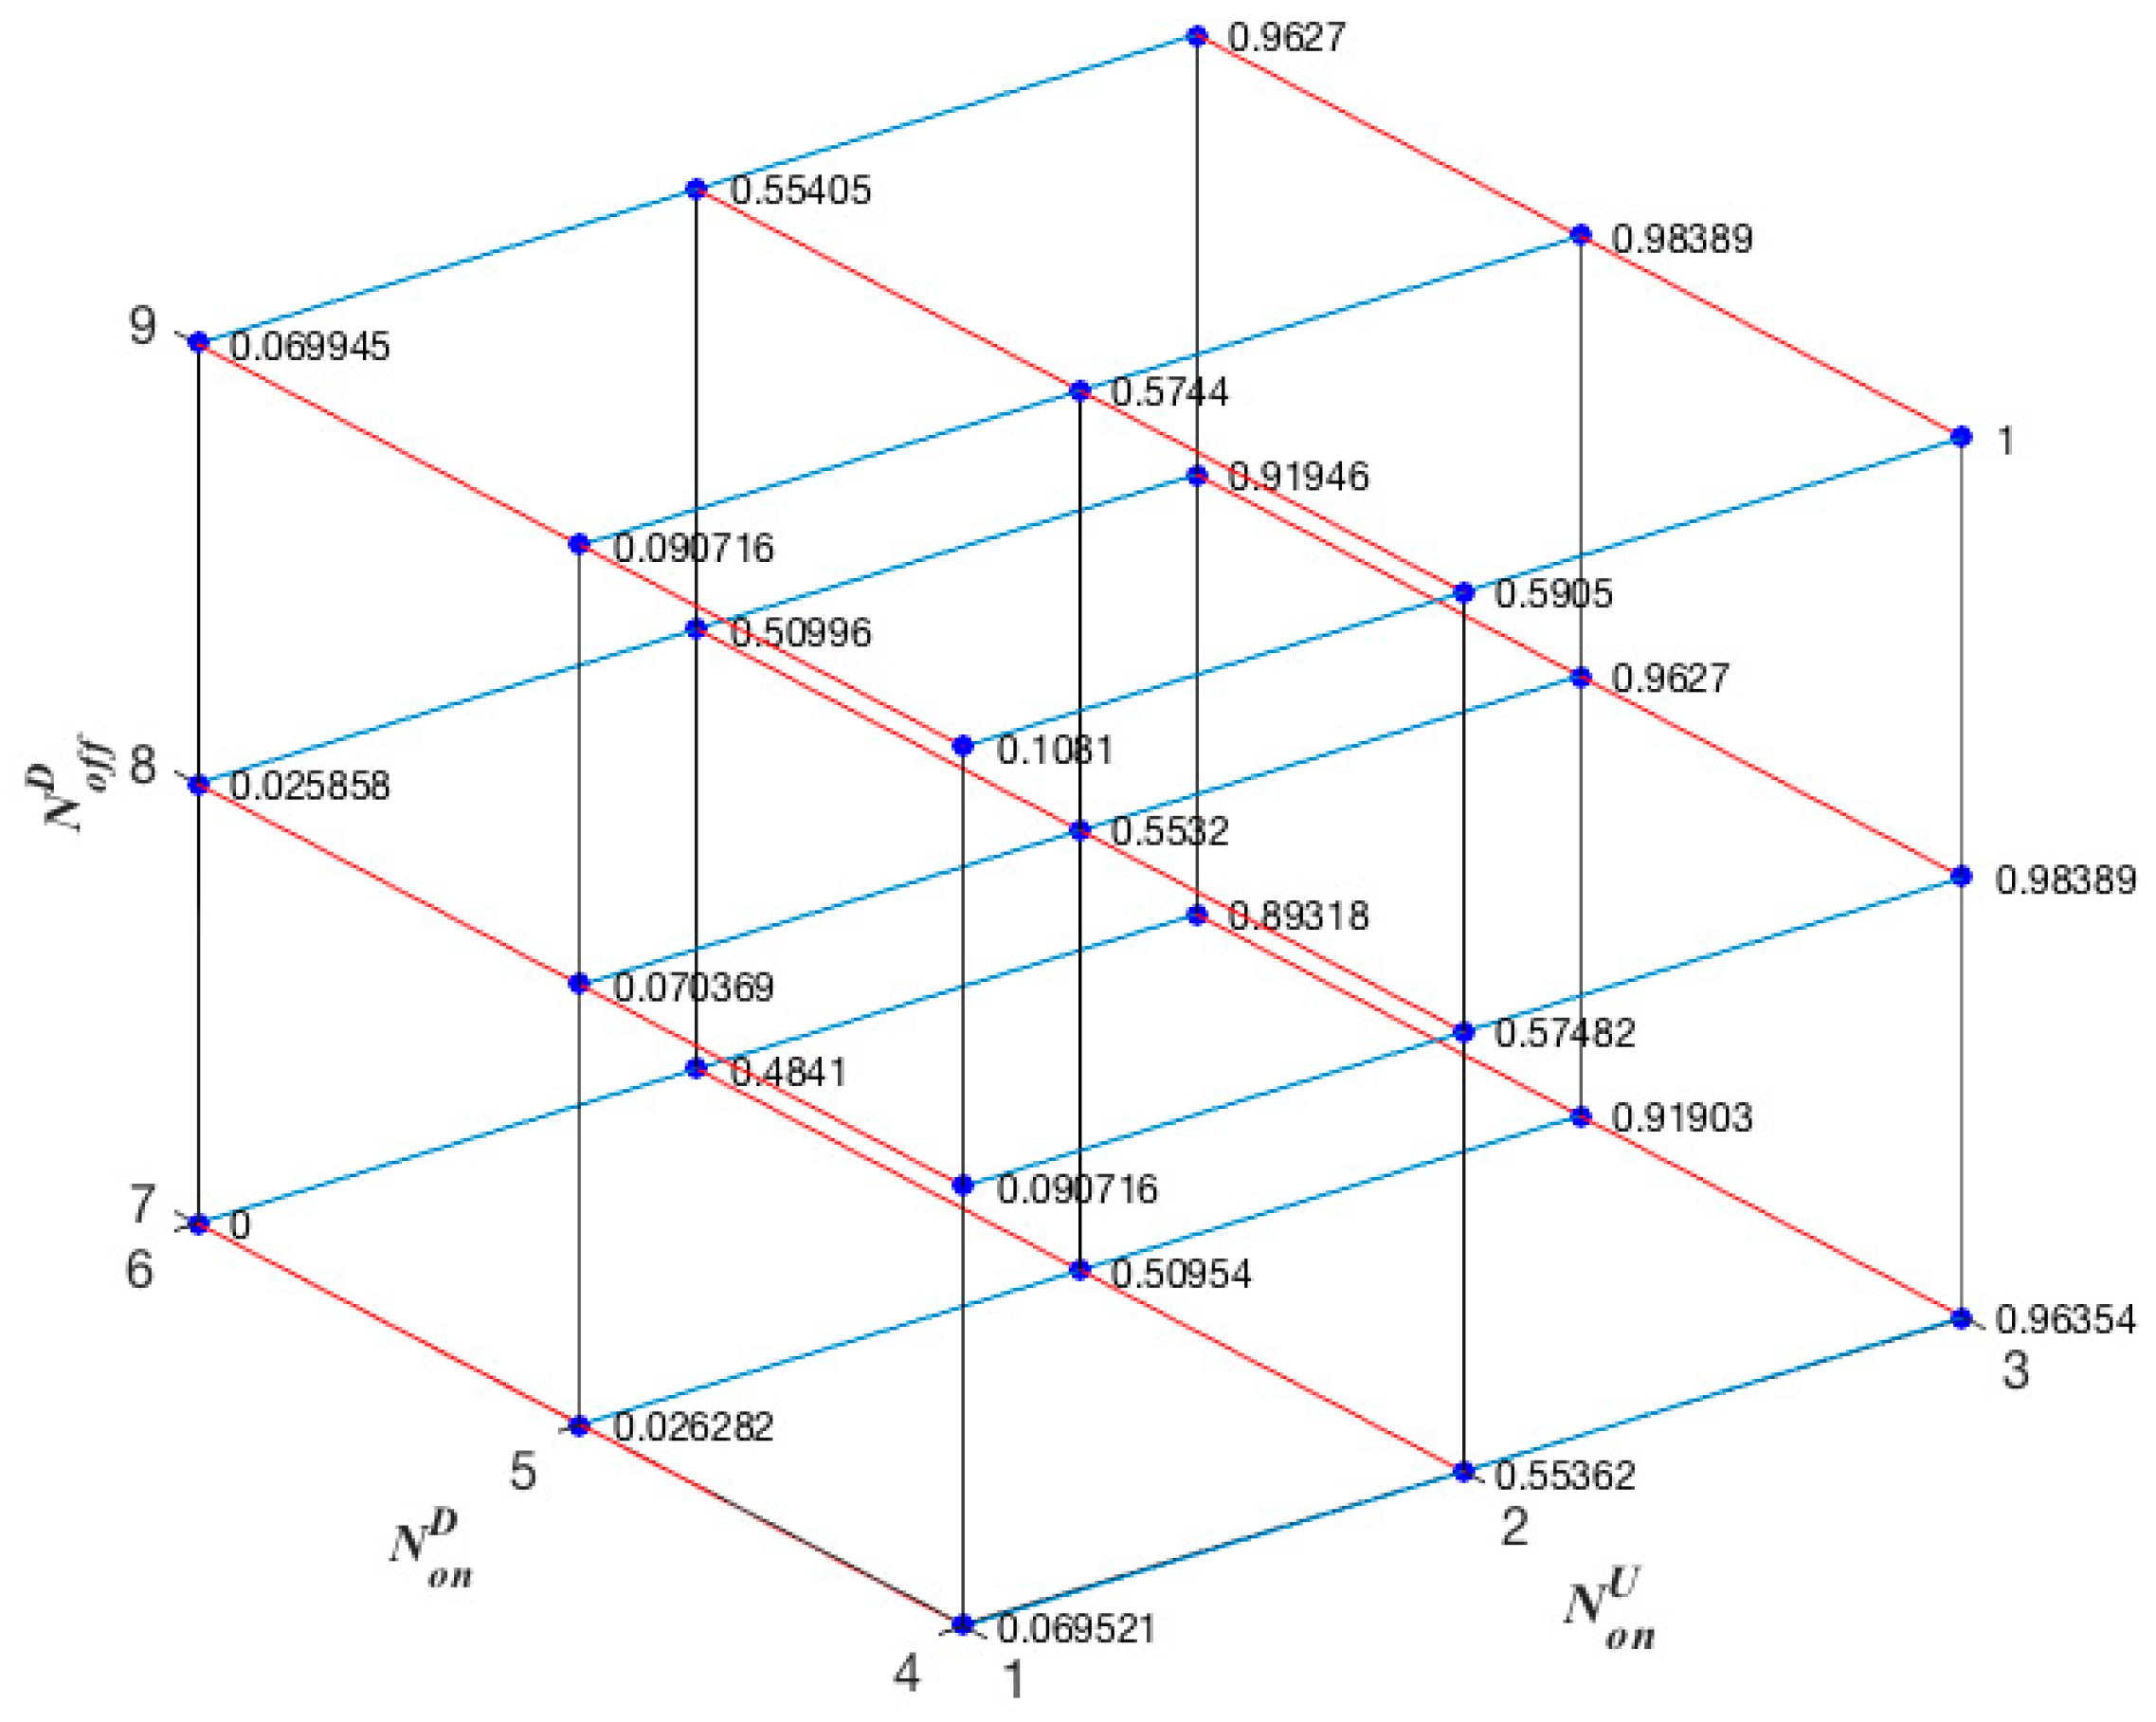
As shown in Figure 2, and in the figures (Figure A1, Figure A2 and Figure A3) in Appendix A, for all the four design models, the set NUon = 3, NDon = 4, NDoff = 9, gives the maximum time spent in the idle and inactive state. Therefore, the simulation scenarios and the evaluation of the performances have been obtained by considering the best control parameters. According to Reference [23], the discrete event simulation length is 107 s, and the initial transient is 105 s.
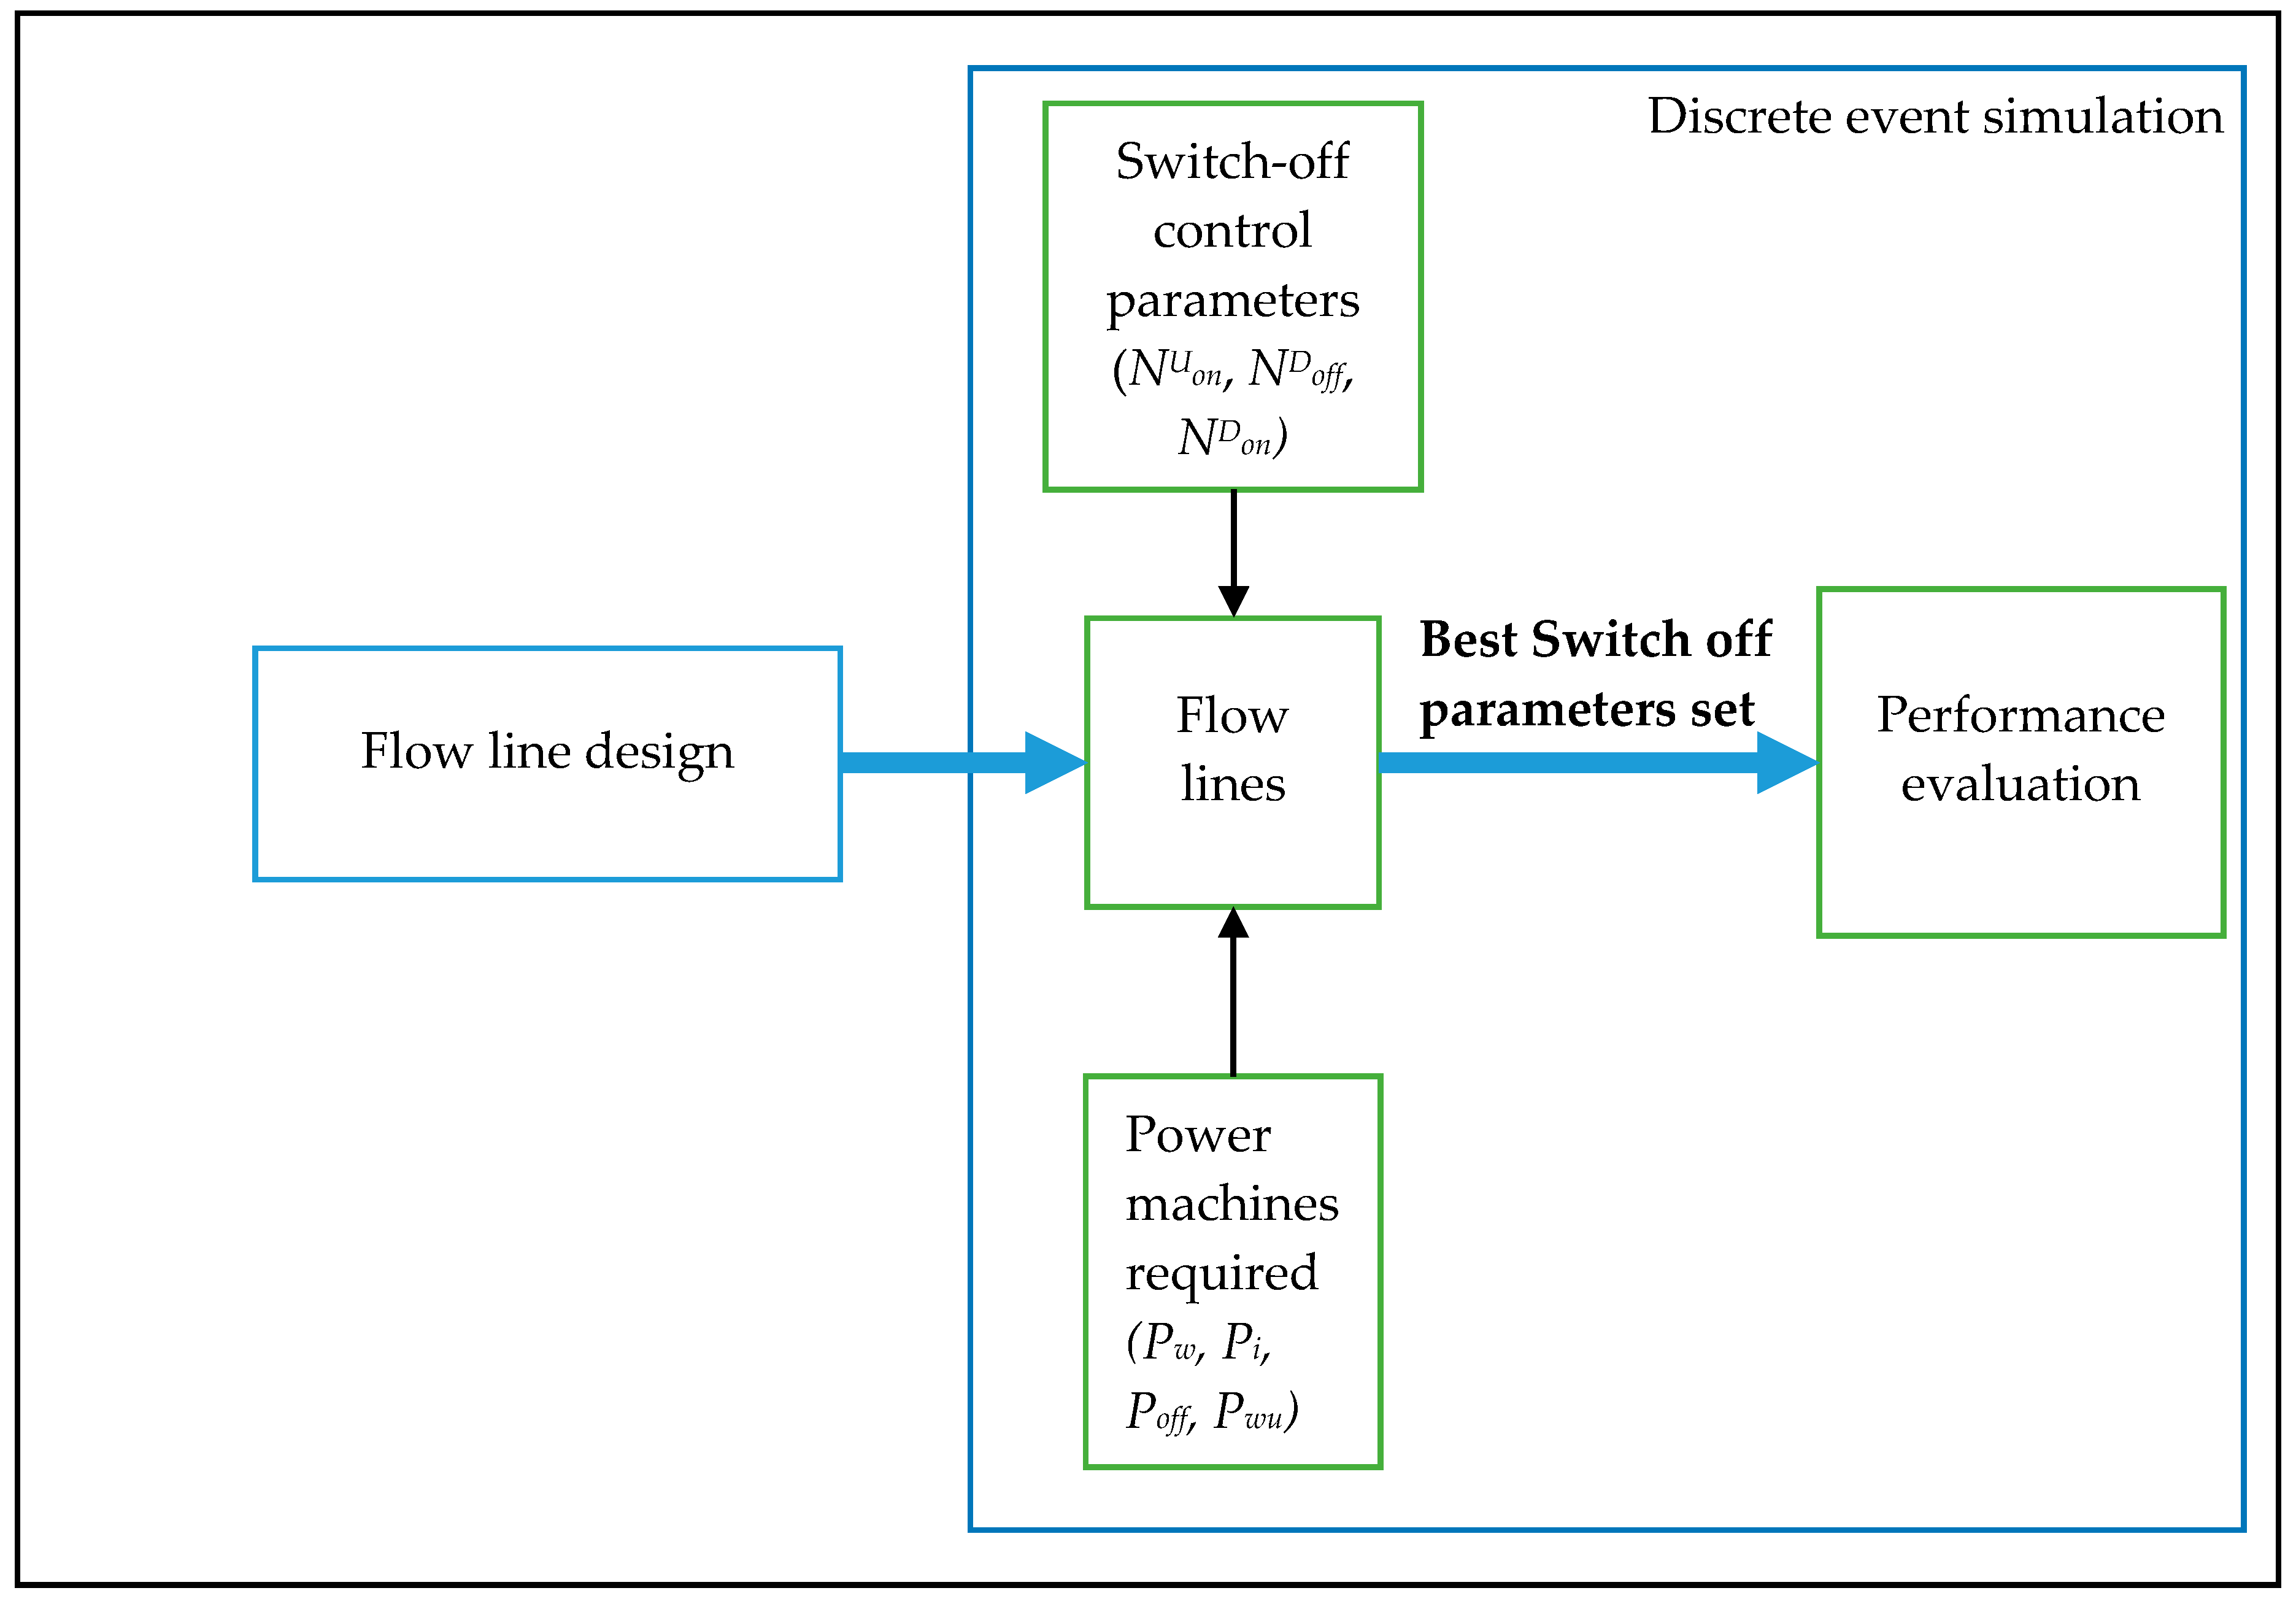
Figure 6 shows the setting of simulation scenarios and performance evaluations. Using mathematical optimization, the flow line design and the operations assignment to the stations have been achieved. Using discrete event simulation, the best set of switch off-parameters have been obtained. Finally, by employing this set, the performances of the four lines have been evaluated and compared.
5. Numerical Results
As shown in the following figure (Figure 7), an increment of the cycle idle time for each station has been achieved by choosing the maximization of the distance between stations as the objective function, instead of the minimization of idle time. The maximum increment of TTd has been obtained in the case where the cycle time has been increased by 10%.
The discrete event simulation results, as compared to the model MinTTd, are shown in Figure 8. The results in the figure only consider the effects of the unbalanced line on the idle time, so the simulations have been made by considering machines with an always on control policy. It can be noticed that the higher the idle time, the lower the throughput. Indeed, by increasing the distance, stations are in the idle state for longer than in a balanced flow line. Increased cycle time allows for mathematical optimization, which aims to maximize the distance between station process times and to have greater freedom in assigning operations to the machines. The 10% increase in cycle time (MaxD_10%) results in a flow line where the idle time has grown by 159%, but productivity has decreased by only 9%.
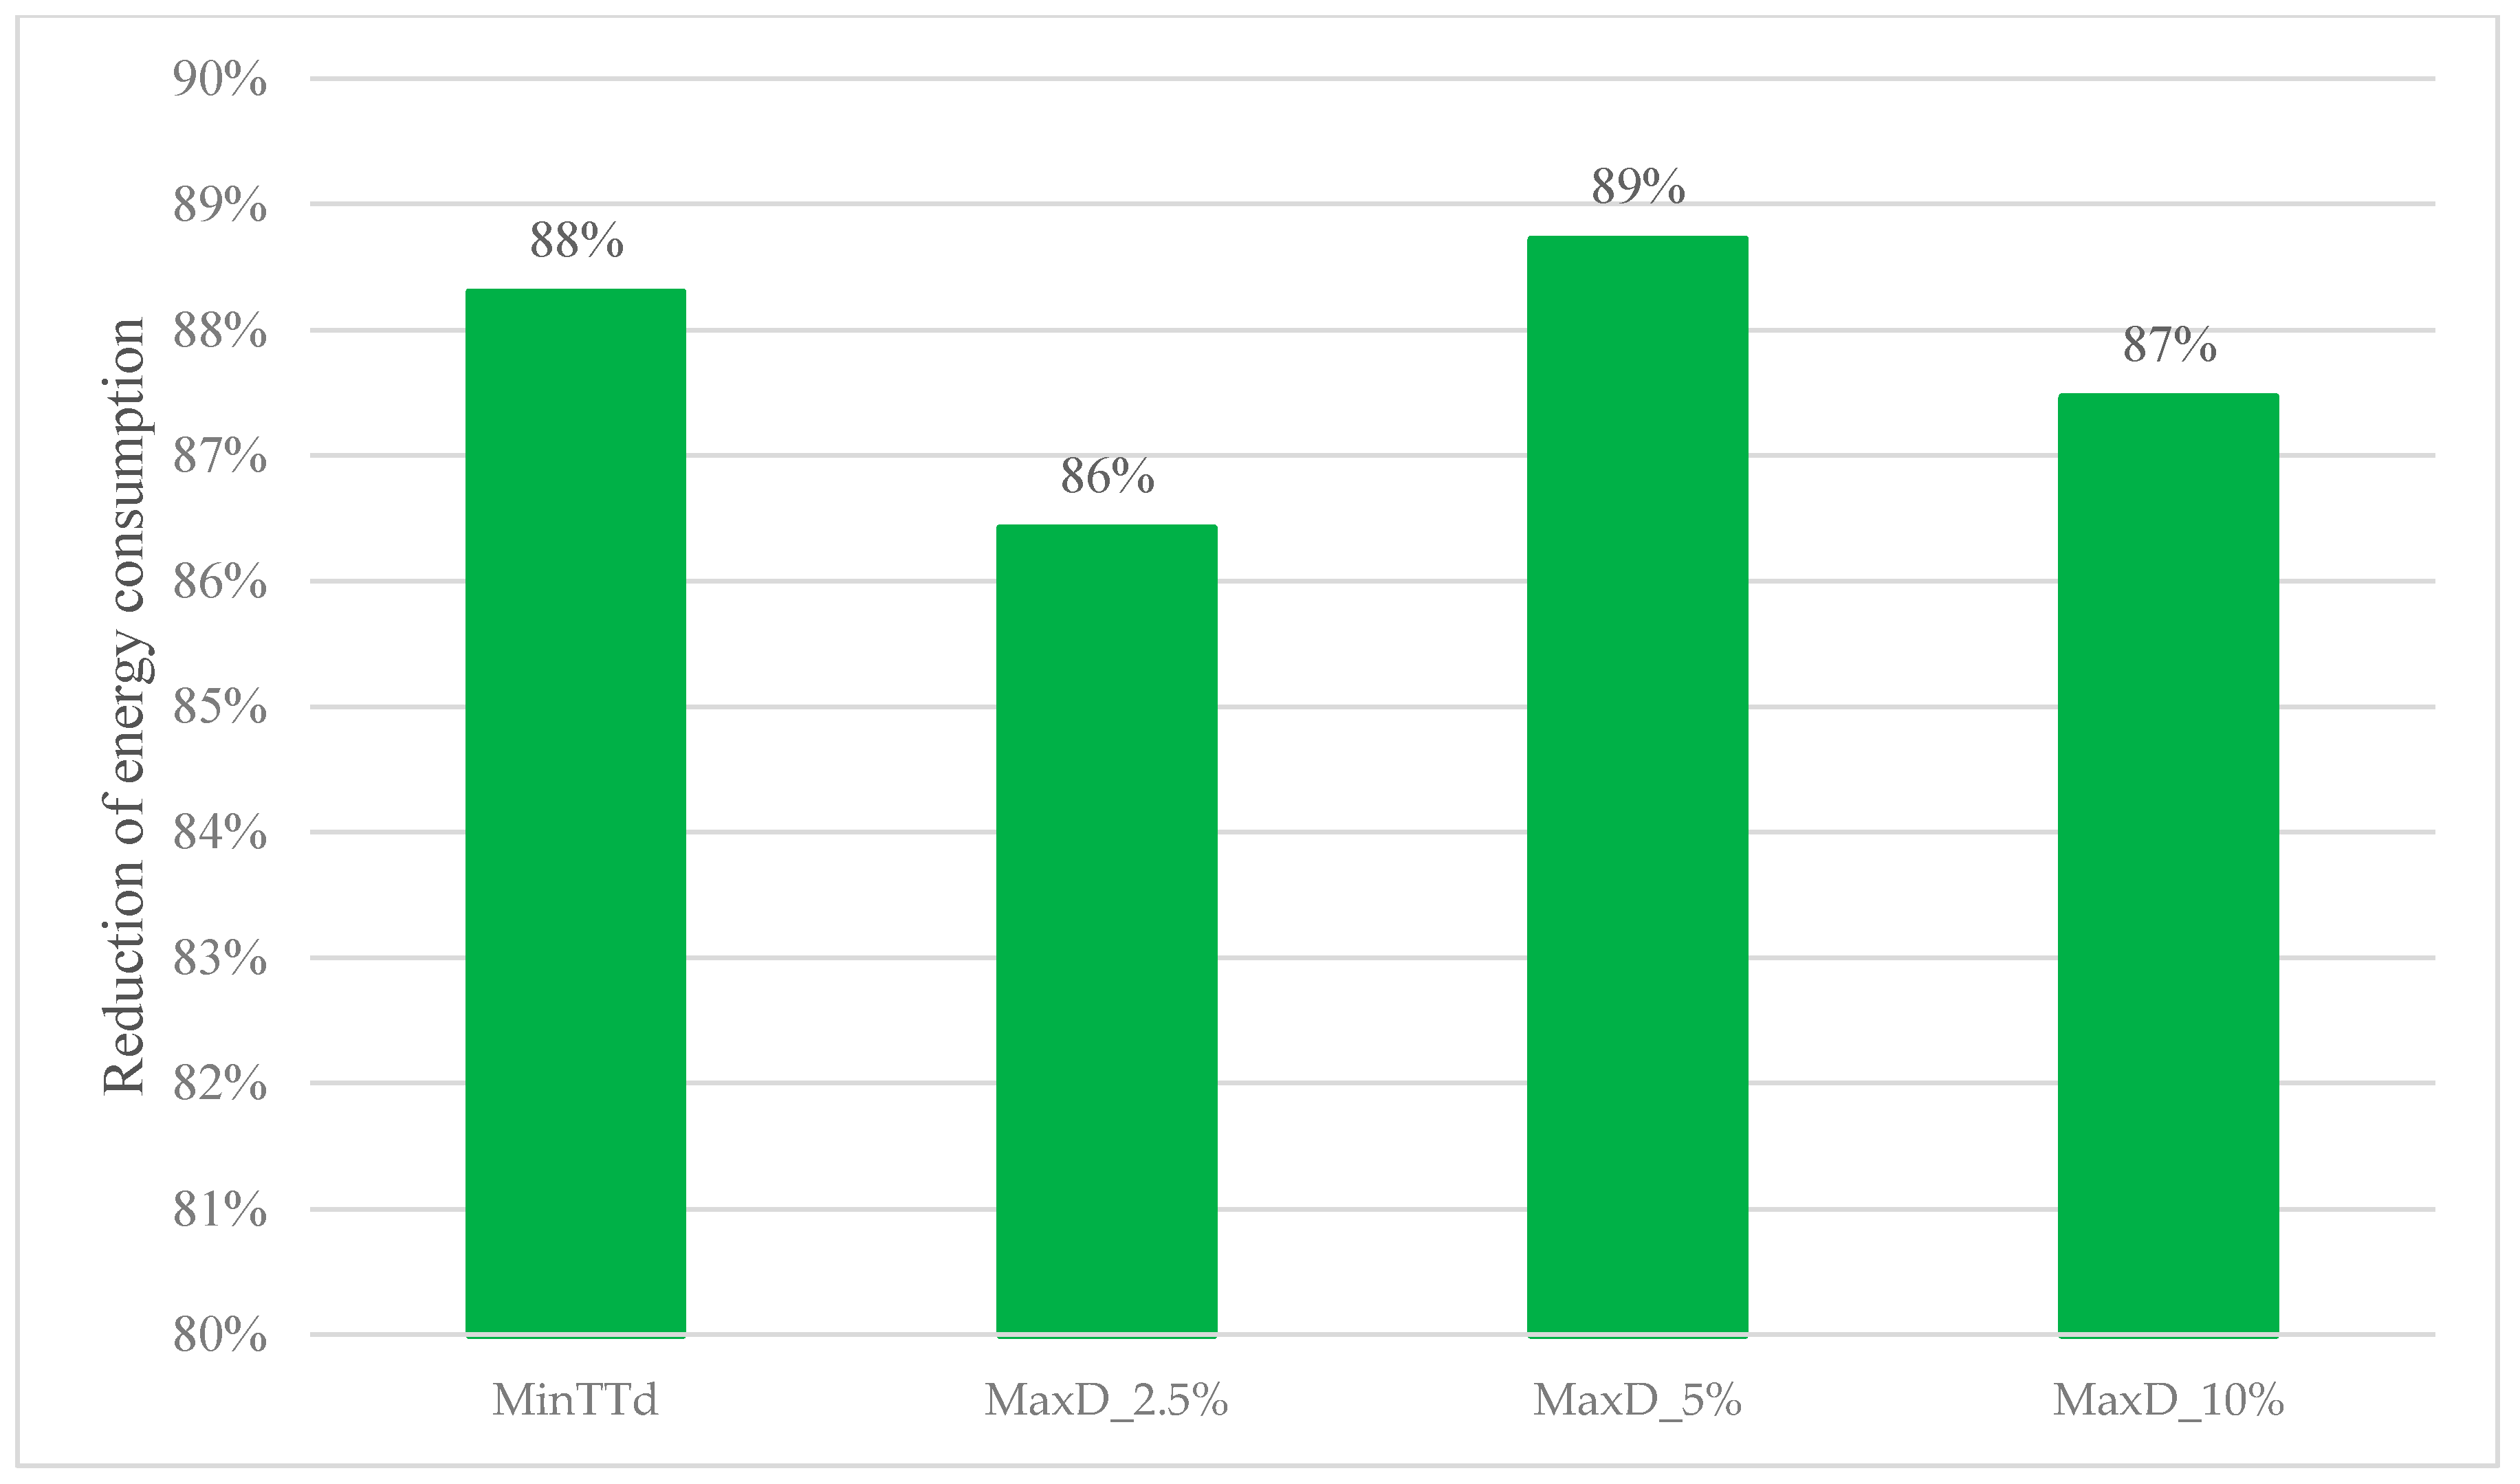
However, the increase in downtime leads to more energy consumption in a non-productive state. In order to reduce energy consumption, switch-off policies should be in place. The UDP policy achieves a significant reduction in energy consumption in non-productive states. In Figure 9, the energy consumption in unproductive states (Idle, Out-of-service, Warmup) of the four lines (MinTTd, MaxD_2.5%, MaxD_5%, MaxD_10%) are compared to a case with machines that are always on and those applying switch off policies. In all the cases analyzed, adopting a shutdown policy allows for a significant reduction in energy consumption in non-productive states, ranging from 86% to 89%.
For these reasons, switch-off policies in unbalanced flow lines are necessary and achieve a reduction in unproductive state energy consumption. If the machines are in always on states, the unbalancing flow line leads to a reduction in throughput and energy consumption due to more time being spent in the idle state. Staying for a long time in the idle state is detrimental, since in this state, the machine is ready to work and then absorbs power without producing. The switch-off policies warrant energy saving due to the lower energy consumption during warmup.
Designing an unbalanced flow line and controlling the machines state with a switch-off policy can lead to a reduction in total energy consumption, not only in unproductive states. Figure 10 shows the increment of energy consumption for an unbalanced flow line design with switch-off policies, compared to an always on balanced flow line. For this reason, designing a flow line to achieve a high unbalance under cycle time constraints, and applying a machine shutdown policy, leads to a reduction in total energy consumption.
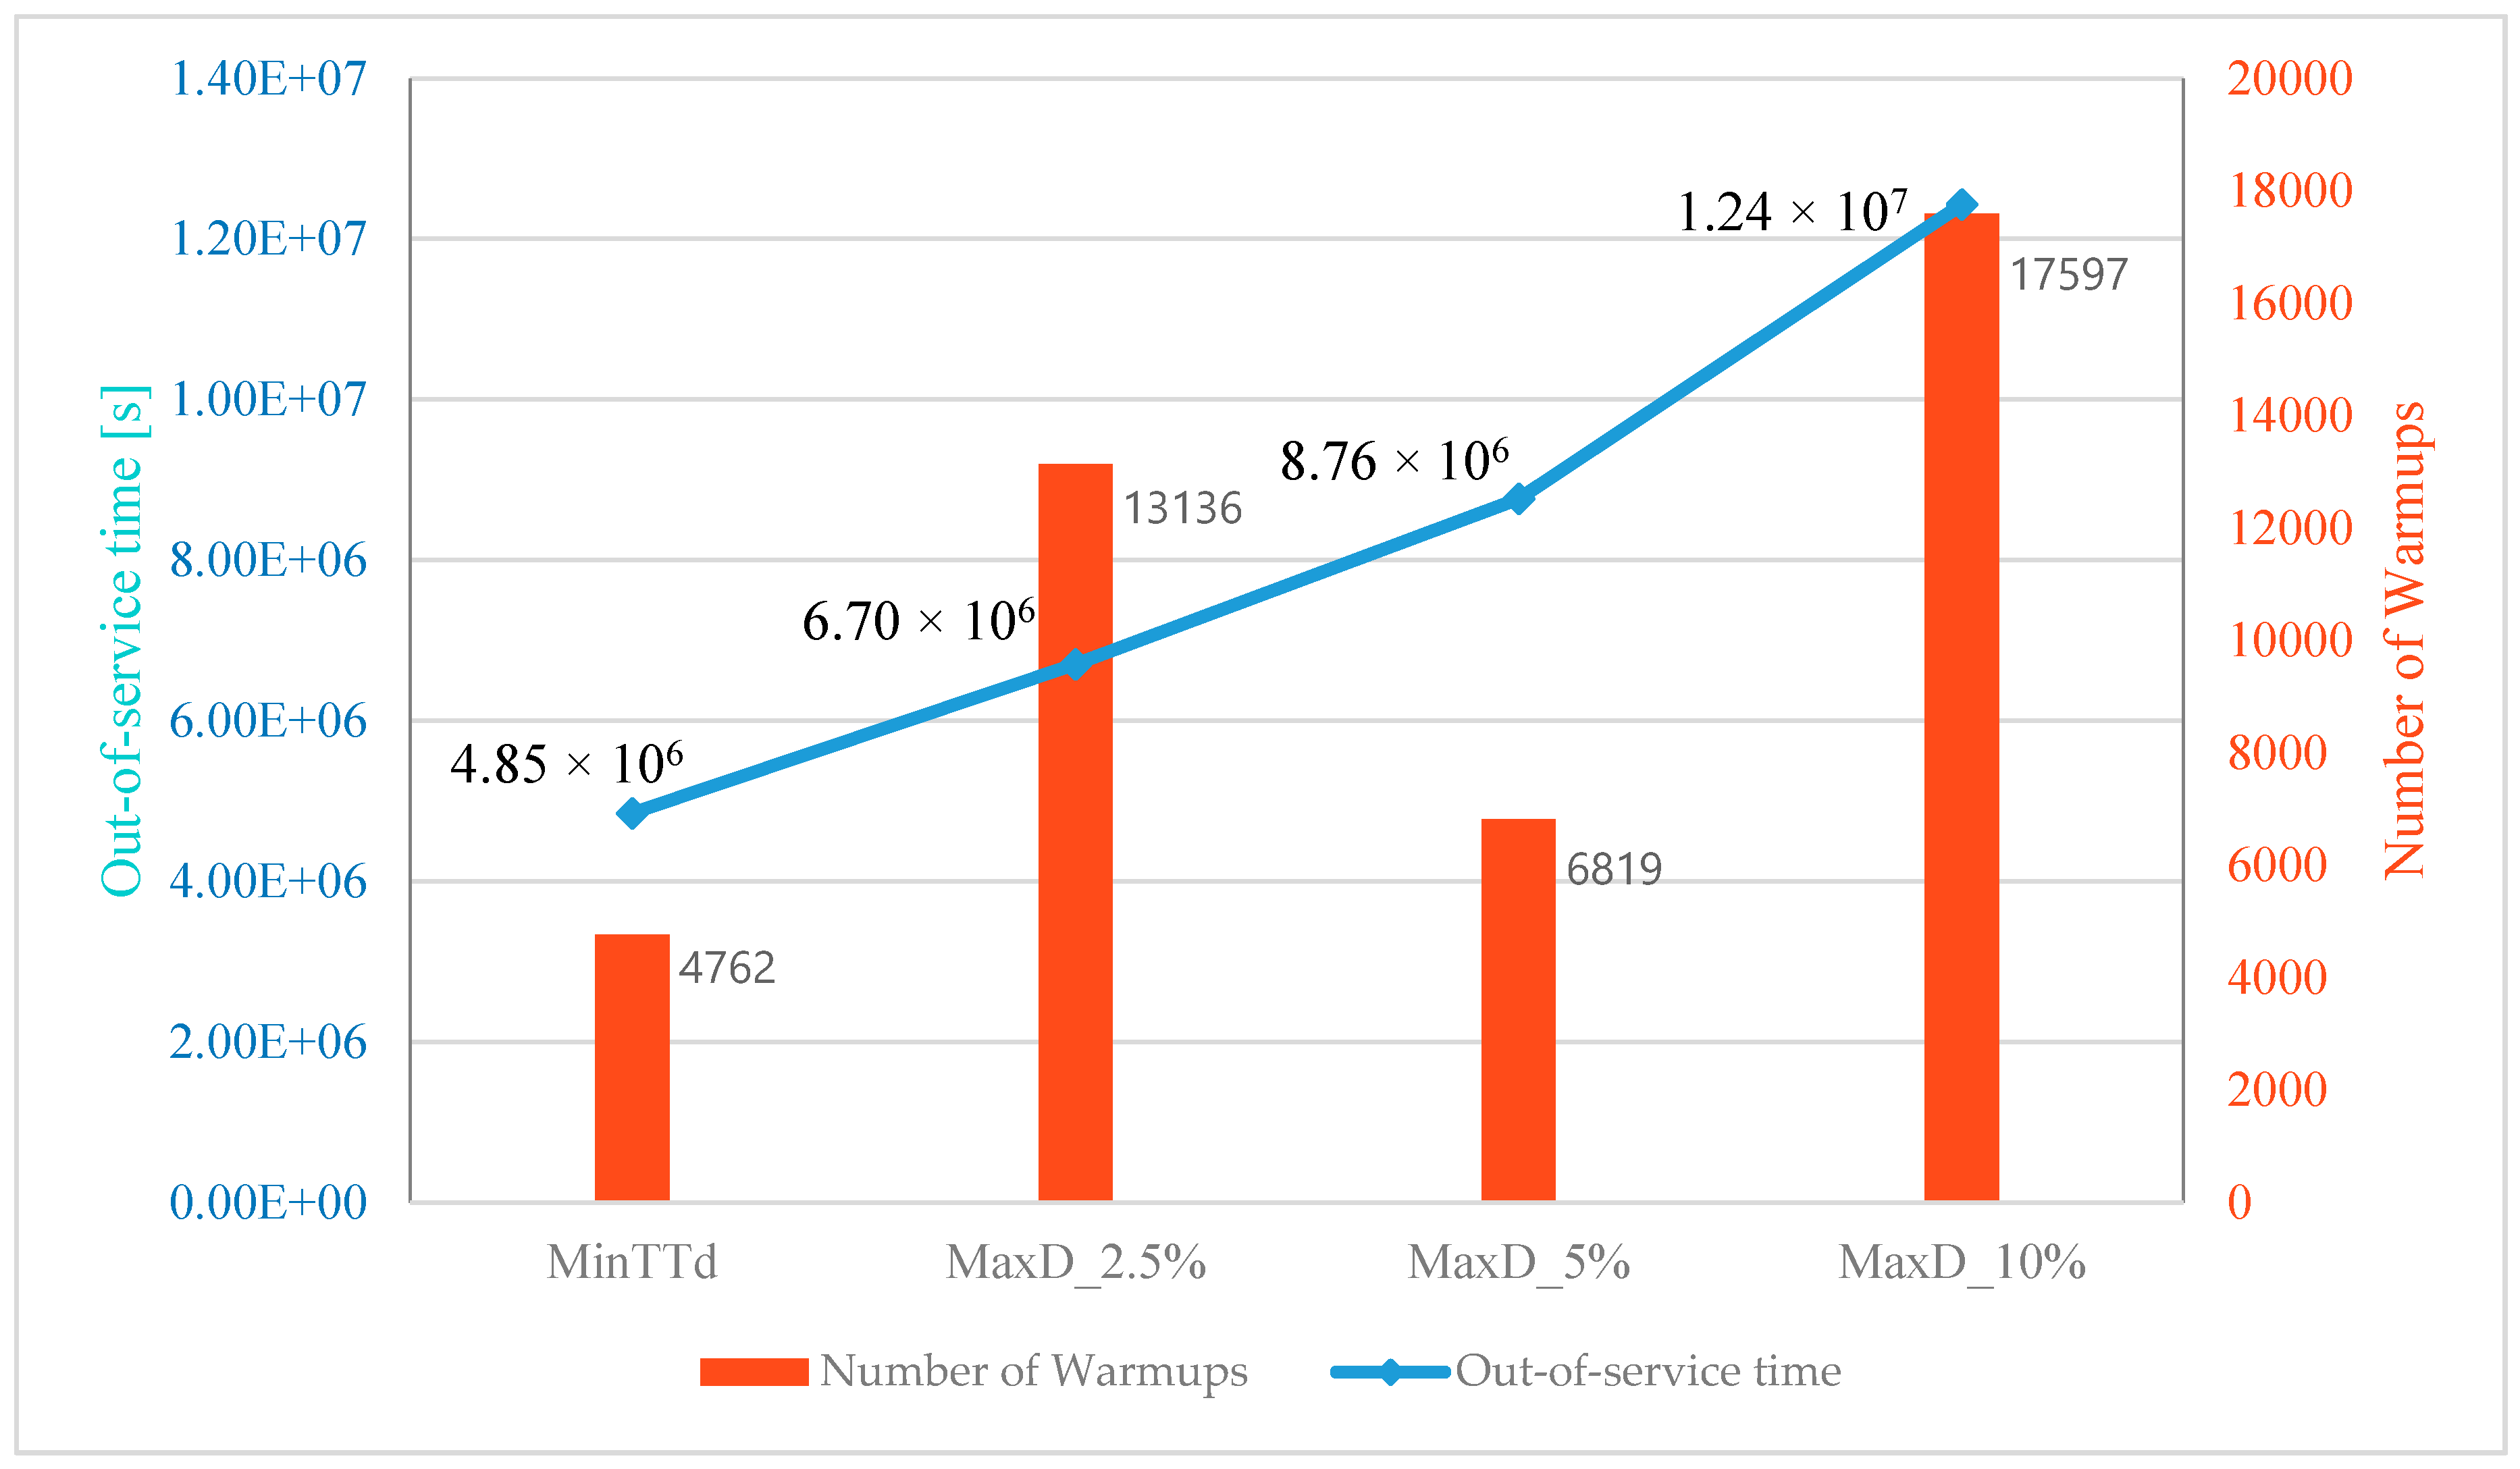
Figure 11 shows the total time that stations hold in the inactive state and the number of warmups.
Like the number of pieces in the buffer, the number of times that machines switch on depends on the position of the bottleneck. Machines turn on fewer times when using model MaxD_5% than model Max_2.5%, even if the total inactive time is longer, because the last station is the bottleneck. It can be seen that, if the bottleneck is among the first machines on the line, it can lead to a reduction of the work in process and storage costs. However, this leads to more switch-ons and higher energy consumption during warmup.
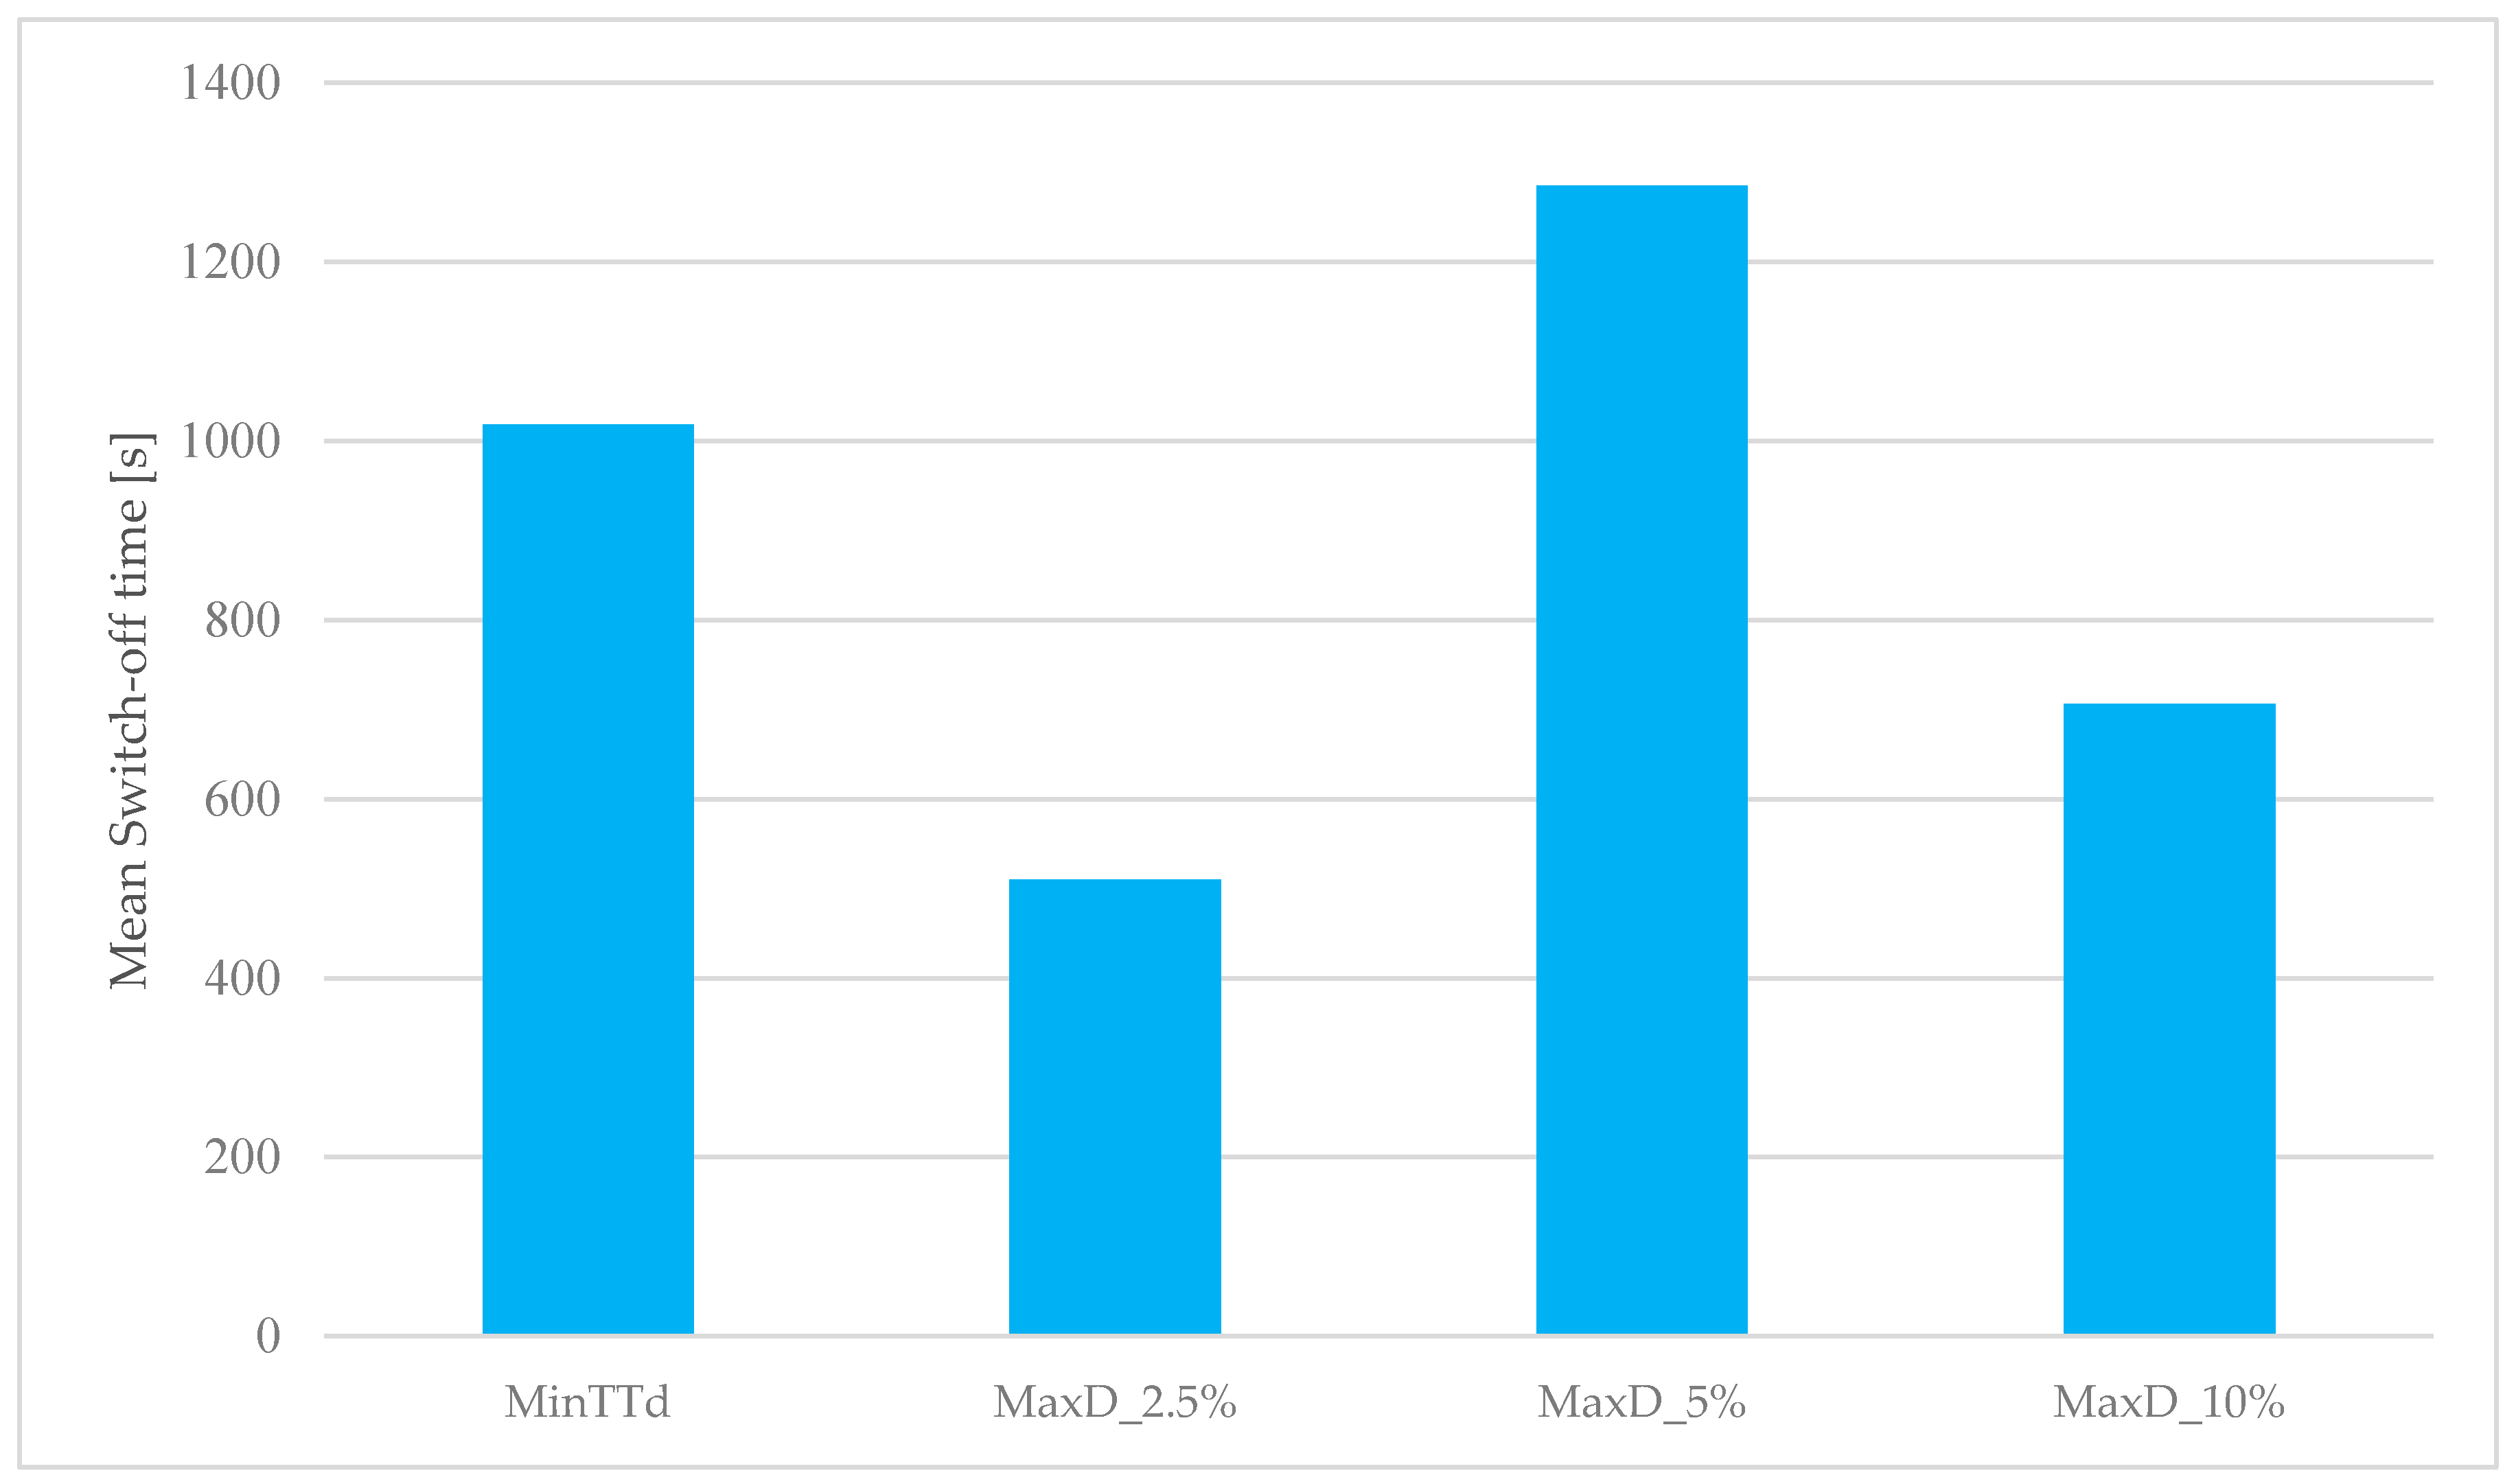
Figure 12 reports the switch-off mean times. It can be noticed that the model MaxD_5% gives the maximum value of the mean inactive time. Thus, this configuration leads to a high inactive time for each switch off. Instead, in the model MaxD_2.5%, the mean time in the inactive state is the lowest; the machines turn into off-state since there are only few pieces in the buffer. The UP policy achieves a reduction in the machine energy consumption removing resource starvation. Indeed, the machine turns off when the upstream buffer is empty and then does not wait in the idle state using a high quantity of energy.
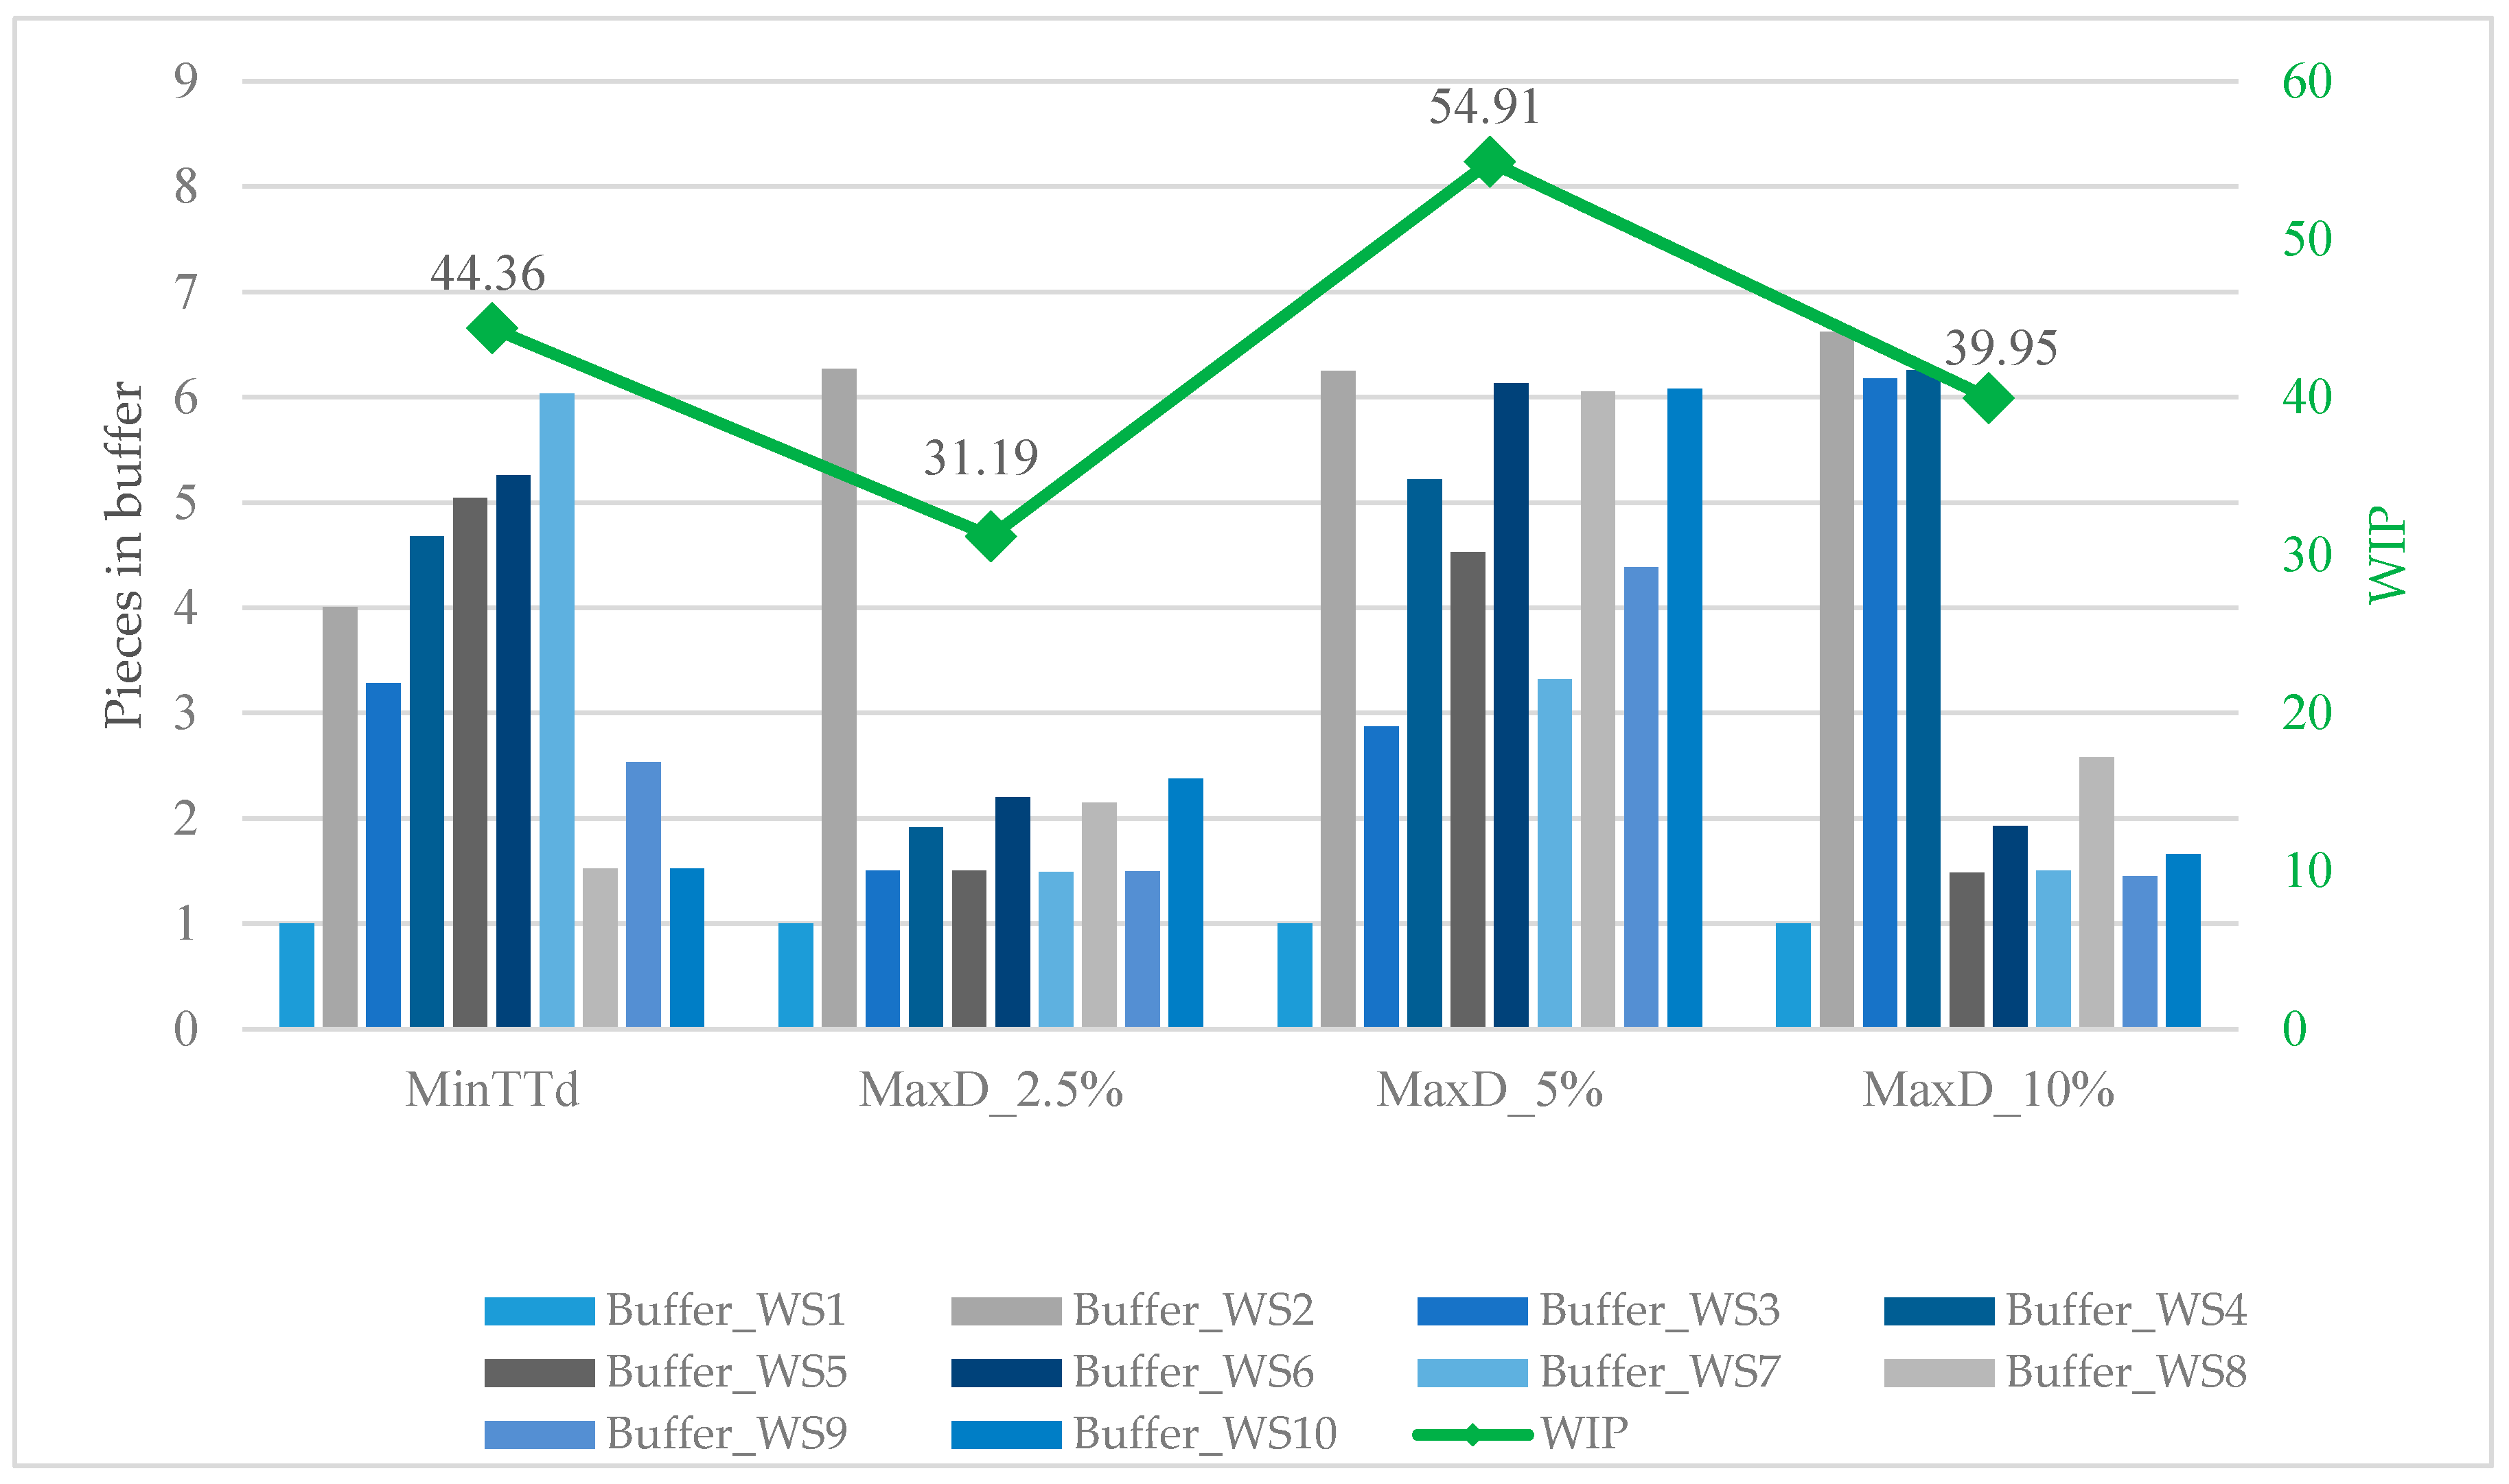
The following figure (Figure 13) shows the mean of the pieces in the buffers of the four models with the switch off policy. It can be noticed that the number of pieces in the buffers does not depend on the chosen objective function. Indeed, the number of elements in the buffers depends on the position of the bottleneck. In fact, in model MaxD_2.5%, as written in Table 2, the bottleneck is the second machine on the line. For these reasons, if the elements in the buffers are lower than NUon, then the UPD policy degrades for the machines below the bottleneck in the upstream policy. Future work may investigate the effect of changing the bottleneck position in an unbalanced flow line in order to obtain the best compromise between WIP (Work in Process) and the machines switch-off mean times.
6. Conclusions
A design model of flow lines to improve the efficiency of the switch-off policy has been proposed.
The model is based on the introduction of a couple of workstations; the first is more rapid than the second in order to facilitate the switch-off of the first machine. Moreover, the proposed model allows for the evaluation of the potential benefit of energy consumption with a determined reduction in the production rate. In unbalanced flow lines, the higher idle times lead to a reduction in the total energy required for the production. However, in the idle state, stations absorb energy without working. For these reasons, applying the switch-off policy in an unbalance flow line is necessary to reduce energy consumption in the unproductive state.
The design model is used with the discrete event simulation to highlight the energy saving with the different levels of production loss fixed. In response, our first research question asked: what is the impact of the design model proposed on the performance of the production line in terms of energy saving maximizing the production rate?
Using the simulation, we have demonstrated that the model proposed could improve the reduction of energy consumption of the flow line more than the design model that does not consider the possibility of introducing the switch-off policy.
However, in response to our second research question: can the constraint of a limited reduction loss improve significantly the energy saving of the production line obtaining an adequate trade off?
Our results have demonstrated that the model can support the decision about the better trade-off between the production rate level and energy consumption reduction. Moreover, the results highlighted the better choice, if the objective is also the reduction in the number of on/off activities that can affect the maintenance of the machines. The results show that the number of warmups can be reduced by properly choosing the bottleneck position, respecting the precedence constraints, in order to achieve further energy saving.
From a managerial viewpoint, the study was motivated by the important issue of energy consumption of flow lines. Our results suggests that: (i) the design model should be adapted to introduce the switch-off policy to obtain a higher benefit from the switch-off policies; (ii) it is possible to evaluate, with the use of the simulation, the effect of a targeted reduction of production rate (for example in a determined production planning period) to improve the energy consumption reduction; and (iii) the model proposed can be extended to different flow lines to support the decision making about the design and potential energy reduction.
A limitation of our study is that the machines were not affected by failures and the processing times are deterministic. Machine failures have a significant impact on productivity. For this reason, integrating maintenance during scheduled machine downtime can lead to a reduction in production losses. Therefore, future works will consider the unbalance flow line design in a pull system that also considers machine failures and stochastic processing times. Furthermore, different switch-off policies, for example, that also consider demand fluctuations for shutdowns, and their effect on throughput and on energy consumption, will be investigated.
Author Contributions
S.M. performed the experiments and wrote the paper, and P.R. designed the experiments and revised the paper. All authors have read and agreed to the published version of the manuscript.
Funding
This research received no external funding
Conflicts of Interest
The authors declare no conflict of interest.
Nomenclature
| C | Cycle time |
| Cmax | Maximum fixed cycle time |
| dj | Distance between nearby stations |
| i = 1,.., N | Operation index |
| j = 1,.., M | Station index |
| Kj | j-th buffer capacity |
| nj | Number of parts in j-th buffer |
| NDoff | Downstream buffer level to switch off |
| NDon | Downstream buffer level to switch on |
| NUon | Upstream buffer level to switch on |
| Pi | Power in idle state |
| Poff | Power in out-of-service state |
| Pw | Power in working state |
| Pwu | Power in warm up state |
| sj | State of the j-th station |
| Td,j | j-th station idle time |
| ti | i-th operation processing time |
| Tj | j-th station processing time |
| twu | Time in warm-up state |
| TTd | Cycle idle time |
| vik | Precedence constrains binary variable |
| WSj | j-th station |
| xij | Operation assignment binary variable |
Appendix A
Figure A1.
Experiments results for line design MaxD_2.5%.

Figure A2.
Experiments results for line design MaxD_5%.

Figure A3.
Experiments results for line design MaxD_10%.

References
- The Cadmus Group. Regional Electricity Emission Factors Final Report; The Cadmus Group: Boston, MA, USA, 1998. [Google Scholar]
- Deif, A.M. A system model for green manufacturing. J. Adv. Prod. Eng. Manag. 2011, 19, 1553–1559. [Google Scholar] [CrossRef] [Green Version]
- U.S. Energy Information Administration. Annual Energy Outlook 2019. Available online: https://www.eia.gov/outlooks/aeo/pdf/aeo2019.pdf (accessed on 5 December 2019).
- Cecimo. Concept Description for CECIMO’s Self-Regulatory Initiative (SRI) for the Sector Specific Implementation of the Directive 2005/32/EC; Cecimo: Brussels, Belgium, 2009; Available online: https://www.eup-network.de/fileadmin/user_upload/Produktgruppen/Lots/Working_Documents/Lot_ENTR_05_machine_tools/draft_self_regulation_machine_tools_2009-10.pdf (accessed on 12 December 2019).
- Cecimo. The European Machine Tool Sector and the Circular Economy; Cecimo: Brussels, Belgium, 2019; Available online: https://www.cecimo.eu/wp-content/uploads/2019/05/Circular-Economy-Report.pdf (accessed on 5 December 2019).
- Gahm, C.; Denz, F.; Dirr, M.; Tuma, A. Energy-Efficient Scheduling in Manufacturing Companies: A Review and Research Framework. Eur. J. Oper. Res. 2016, 248, 744–757. [Google Scholar] [CrossRef]
- Dahmus, J.B.; Gutowski, T.G. An Environmental Analysis of Machining. In Proceedings of the ASME 2004 International Mechanical Engineering Congress and Exposition, Manufacturing Engineering Materials Hand, Anaheim, CA, USA, 13–19 November 2004; pp. 643–652. [Google Scholar] [CrossRef] [Green Version]
- Gutowski, T.G.; Dahmus, J.B.; Thiriez, A. Electrical Energy Requirements for Manufacturing Processes. In Proceedings of the 13th CIRP International Conference of Life Cycle Engineering, Leuven, Belgium, 31 May–2 June 2006. [Google Scholar]
- Gutowski, T.G.; Dahmus, J.B.; Thiriez, A.; Branham, M.; Jones, A. A Thermodynamic Characterization of Manufacturing Processes. In Proceedings of the 2007 IEEE International Symposium on Electronics and the Environment, Orlando, FL, USA, 7–10 May 2007; pp. 137–142. [Google Scholar] [CrossRef]
- Gutowski, T.G.; Branham, M.S.; Dahmus, J.B.; Jones, A.J.; Thiriez, A.; Sekulic, D.P. Thermodynamic Analysis of Resources Used in Manufacturing Processes. Environ. Sci. Technol. 2009, 43, 1584–1590. [Google Scholar] [CrossRef] [PubMed]
- Li, W.; Zein, A.; Kara, S.; Herrmann, C. An Investigation into Fixed Energy Consumption of Machine Tools. In Proceedings of the 18th CIRP International Conference on Life Cycle Engineering—Glocalized Solutions for Sustainability in Manufacturing, Braunschweig, Germany, 2–4 May 2011; pp. 268–273. [Google Scholar] [CrossRef]
- Zhang, X.P.; Cheng, X.M. Energy Consumption, Carbon Emissions, and Economic Growth in China. Ecol. Econ. 2009, 68, 2706–2712. [Google Scholar] [CrossRef]
- Twomey, J.; Yildirim, M.B.; Whitman, L.; Liao, H.; Ahmad, J. Energy Profiles of Manufacturing Equipment for Reducing Energy Consumption in a Production Setting; Working Paper; Wichita State Univ.: Wichita, KS, USA, 2018. [Google Scholar]
- Weinert, N.; Mose, C. Investigation of Advanced Energy Saving Stand by Strategies for Production Systems. Procedia CIRP 2014, 15, 90–95. [Google Scholar] [CrossRef] [Green Version]
- Frigerio, N.; Matta, A. Energy-Efficient Control Strategies for Machine Tools with Stochastic Arrivals. IEEE Trans. Autom. Sci. Eng. 2015, 15, 50–61. [Google Scholar] [CrossRef] [Green Version]
- Frigerio, N.; Matta, A. Analysis on Energy Efficient Switching of Machine Tool with Stochastic Arrivals and Buffer Information. IEEE Trans. Autom. Sci. Eng. 2016, 13, 238–246. [Google Scholar] [CrossRef]
- Baybars, I. A Survey of Exact Algorithms for the Simple Assembly Line Balancing Problem. Manag. Sci. 1986, 32, 909–932. [Google Scholar] [CrossRef]
- Scholl, A. Balancing and Sequencing Assembly Lines, 2nd ed.; Physica-Verlag Heidelberg: Heidelberg, Germany, 1999. [Google Scholar]
- Boysen, N.; Fliedner, M.; Scholl, A. A Classification of Assembly Line Balancing Problems. Eur. J. Oper. Res. 2007, 183, 674–693. [Google Scholar] [CrossRef]
- Eghtesadifard, M.; Khalifeh, M.; Khorram, M. A Systematic Review of Research Themes and Hot Topics in Assembly Line Balancing through the Web of Science within 1990–2017. Comput. Ind. Eng. 2020, 139, 106–182. [Google Scholar] [CrossRef]
- Mashaei, M.; Lennartson, B. Energy Reduction in a Pallet-Constrained Flow Shop through On-Off Control of Idle Machines. IEEE Trans. Autom. Sci. Eng. 2013, 10, 45–56. [Google Scholar] [CrossRef]
- Jia, Z.; Zhang, L.; Arinez, J.; Xiao, G. Performance Analysis for Serial Production Lines with Bernoulli Machines and Real-Time Wip Based Machine Switch-On/Off control. Int. J. Prod. Res. 2016, 54, 1–17. [Google Scholar] [CrossRef]
- Su, H.; Frigerio, N.; Matta, A. Energy Saving Opportunities and Value of Information: A Trade-off in a Production Line. Procedia CIRP 2016, 48, 301–306. [Google Scholar] [CrossRef] [Green Version]
- Renna, P. Energy Saving by Switch-Off Policy in a Pull-Controlled Production Line. Sustain. Prod. Consum. 2018, 16, 25–32. [Google Scholar] [CrossRef]
- Duque, E.T.; Fei, Z.C.; Wang, J.F.; Li, S.Q.; Li, Y.F. Energy Consumption Control of One Machine Manufacturing System with Stochastic Arrivals Based on Fuzzy Logic. In Proceedings of the 2018 IEEE International Conference on Industrial Engineering and Engineering Management (IEEM), Bangkok, Thailand, 16–19 December 2018; pp. 1503–1507. [Google Scholar] [CrossRef]
- Wang, J.; Xue, J.; Duque, E.T.; Li, S.; Chang, Q. Fuzzy Decision of Machine Switch On-Off for Energy Efficient Operation of Manufacturing System. In Proceedings of the 2017 13th IEEE Conference on Automation Science and Engineering (CASE), Xi’an, China, 20–23 August 2017. [Google Scholar] [CrossRef]
- Wang, J.; Fei, Z.; Chang, Q.; Li, S.; Fu, Y. Multi-State Decision of Unreliable Machines for Energy-Efficient Production Considering Work-in-Process Inventory. Int. J. Adv. Manuf. Technol. 2019, 102, 1009–1021. [Google Scholar] [CrossRef] [Green Version]
- Marzano, L.; Frigerio, N.; Matta, A. Energy Efficient State Control of Machine Tools: A Time-Based Dynamic Control Policy. In Proceedings of the 2019 IEEE 15th International Conference on Automation Science and Engineering (CASE), Vancouver, BC, Canada, 22–26 August 2019; pp. 596–601. [Google Scholar] [CrossRef]
- Otto, A.; Otto, C.; Scholl, A. Systematic Data Generation and Test Design for Solution Algorithms on the Example of SALBPGen for Assembly Line Balancing. Eur. J. Oper. Res. 2013, 228, 33–45. [Google Scholar] [CrossRef]
Figure 1.
Distance between stations.

Figure 2.
Framework for flow line designs.

Figure 3.
Machine states.

Figure 4.
Precedence graph.

Figure 5.
Experiments results for line design MinTTd.

Figure 6.
Simulation process and performances evaluation.

Figure 7.
Increment of idle time for each cycle.

Figure 8.
Results with always on policy.

Figure 9.
Reduction of energy consumption in unproductive states using switch-off policies.

Figure 10.
Total energy reduction.

Figure 11.
Warmup and out-of-service time.

Figure 12.
Mean switch off time for the four lines design with UPD policies.

Figure 13.
Pieces in buffer and mean of the work in progress.


Table 1.
Operation processing time [s].
| Operations | Processing Time (s) | Precedence | Operation | Processing Time (s) | Precedence |
|---|---|---|---|---|---|
| 1 | 142 | - | 11 | 97 | 7 |
| 2 | 34 | - | 12 | 132 | 8 |
| 3 | 140 | - | 13 | 107 | 10, 11 |
| 4 | 214 | - | 14 | 132 | 12 |
| 5 | 121 | - | 15 | 69 | 12 |
| 6 | 279 | 1 | 16 | 169 | 13 |
| 7 | 50 | 2 | 17 | 73 | 13 |
| 8 | 282 | 4 | 18 | 231 | 13 |
| 9 | 129 | 5 | 19 | 120 | 15 |
| 10 | 175 | 6 | 20 | 186 | 14 |
Table 2.
Stations processing and idle times [s].
| MinTTd | MaxD_2.5% | MaxD_5% | MaxD_10% | |||||
|---|---|---|---|---|---|---|---|---|
| Station | Station Processing Time [s] | Station Idle Time [s] | Station Processing Time [s] | Station Idle Time [s] | Station Processing Time [s] | Station Idle Time [s] | Station Processing Time [s] | Station Idle Time [s] |
| 1 | 298 | 6 | 248 | 63 | 248 | 70 | 214 | 119 |
| 2 | 282 | 22 | 311 | 0 | 313 | 5 | 282 | 51 |
| 3 | 272 | 32 | 282 | 29 | 282 | 36 | 263 | 70 |
| 4 | 274 | 30 | 298 | 13 | 298 | 20 | 333 | 0 |
| 5 | 279 | 25 | 274 | 37 | 279 | 39 | 279 | 54 |
| 6 | 287 | 17 | 306 | 5 | 315 | 3 | 329 | 4 |
| 7 | 304 | 0 | 279 | 32 | 236 | 82 | 269 | 64 |
| 8 | 293 | 11 | 304 | 7 | 304 | 14 | 333 | 0 |
| 9 | 304 | 0 | 276 | 35 | 289 | 29 | 276 | 57 |
| 10 | 289 | 15 | 304 | 7 | 318 | 0 | 304 | 29 |
| TTd | 158 | 228 | 298 | 448 | ||||
© 2020 by the authors. Licensee MDPI, Basel, Switzerland. This article is an open access article distributed under the terms and conditions of the Creative Commons Attribution (CC BY) license (http://creativecommons.org/licenses/by/4.0/).
Share and Cite
MDPI and ACS Style
Renna, P.; Materi, S. Design Model of Flow Lines to Include Switch-Off Policies Reducing Energy Consumption. Appl. Sci. 2020, 10, 1475. https://doi.org/10.3390/app10041475
AMA Style
Renna P, Materi S. Design Model of Flow Lines to Include Switch-Off Policies Reducing Energy Consumption. Applied Sciences. 2020; 10(4):1475. https://doi.org/10.3390/app10041475
Chicago/Turabian StyleRenna, Paolo, and Sergio Materi. 2020. "Design Model of Flow Lines to Include Switch-Off Policies Reducing Energy Consumption" Applied Sciences 10, no. 4: 1475. https://doi.org/10.3390/app10041475
Note that from the first issue of 2016, this journal uses article numbers instead of page numbers. See further details here.