Approaches for Detailed Investigations on Transient Flow and Spray Characteristics during High Pressure Fuel Injection

 ,
, 
Abstract
:Featured Application
Abstract
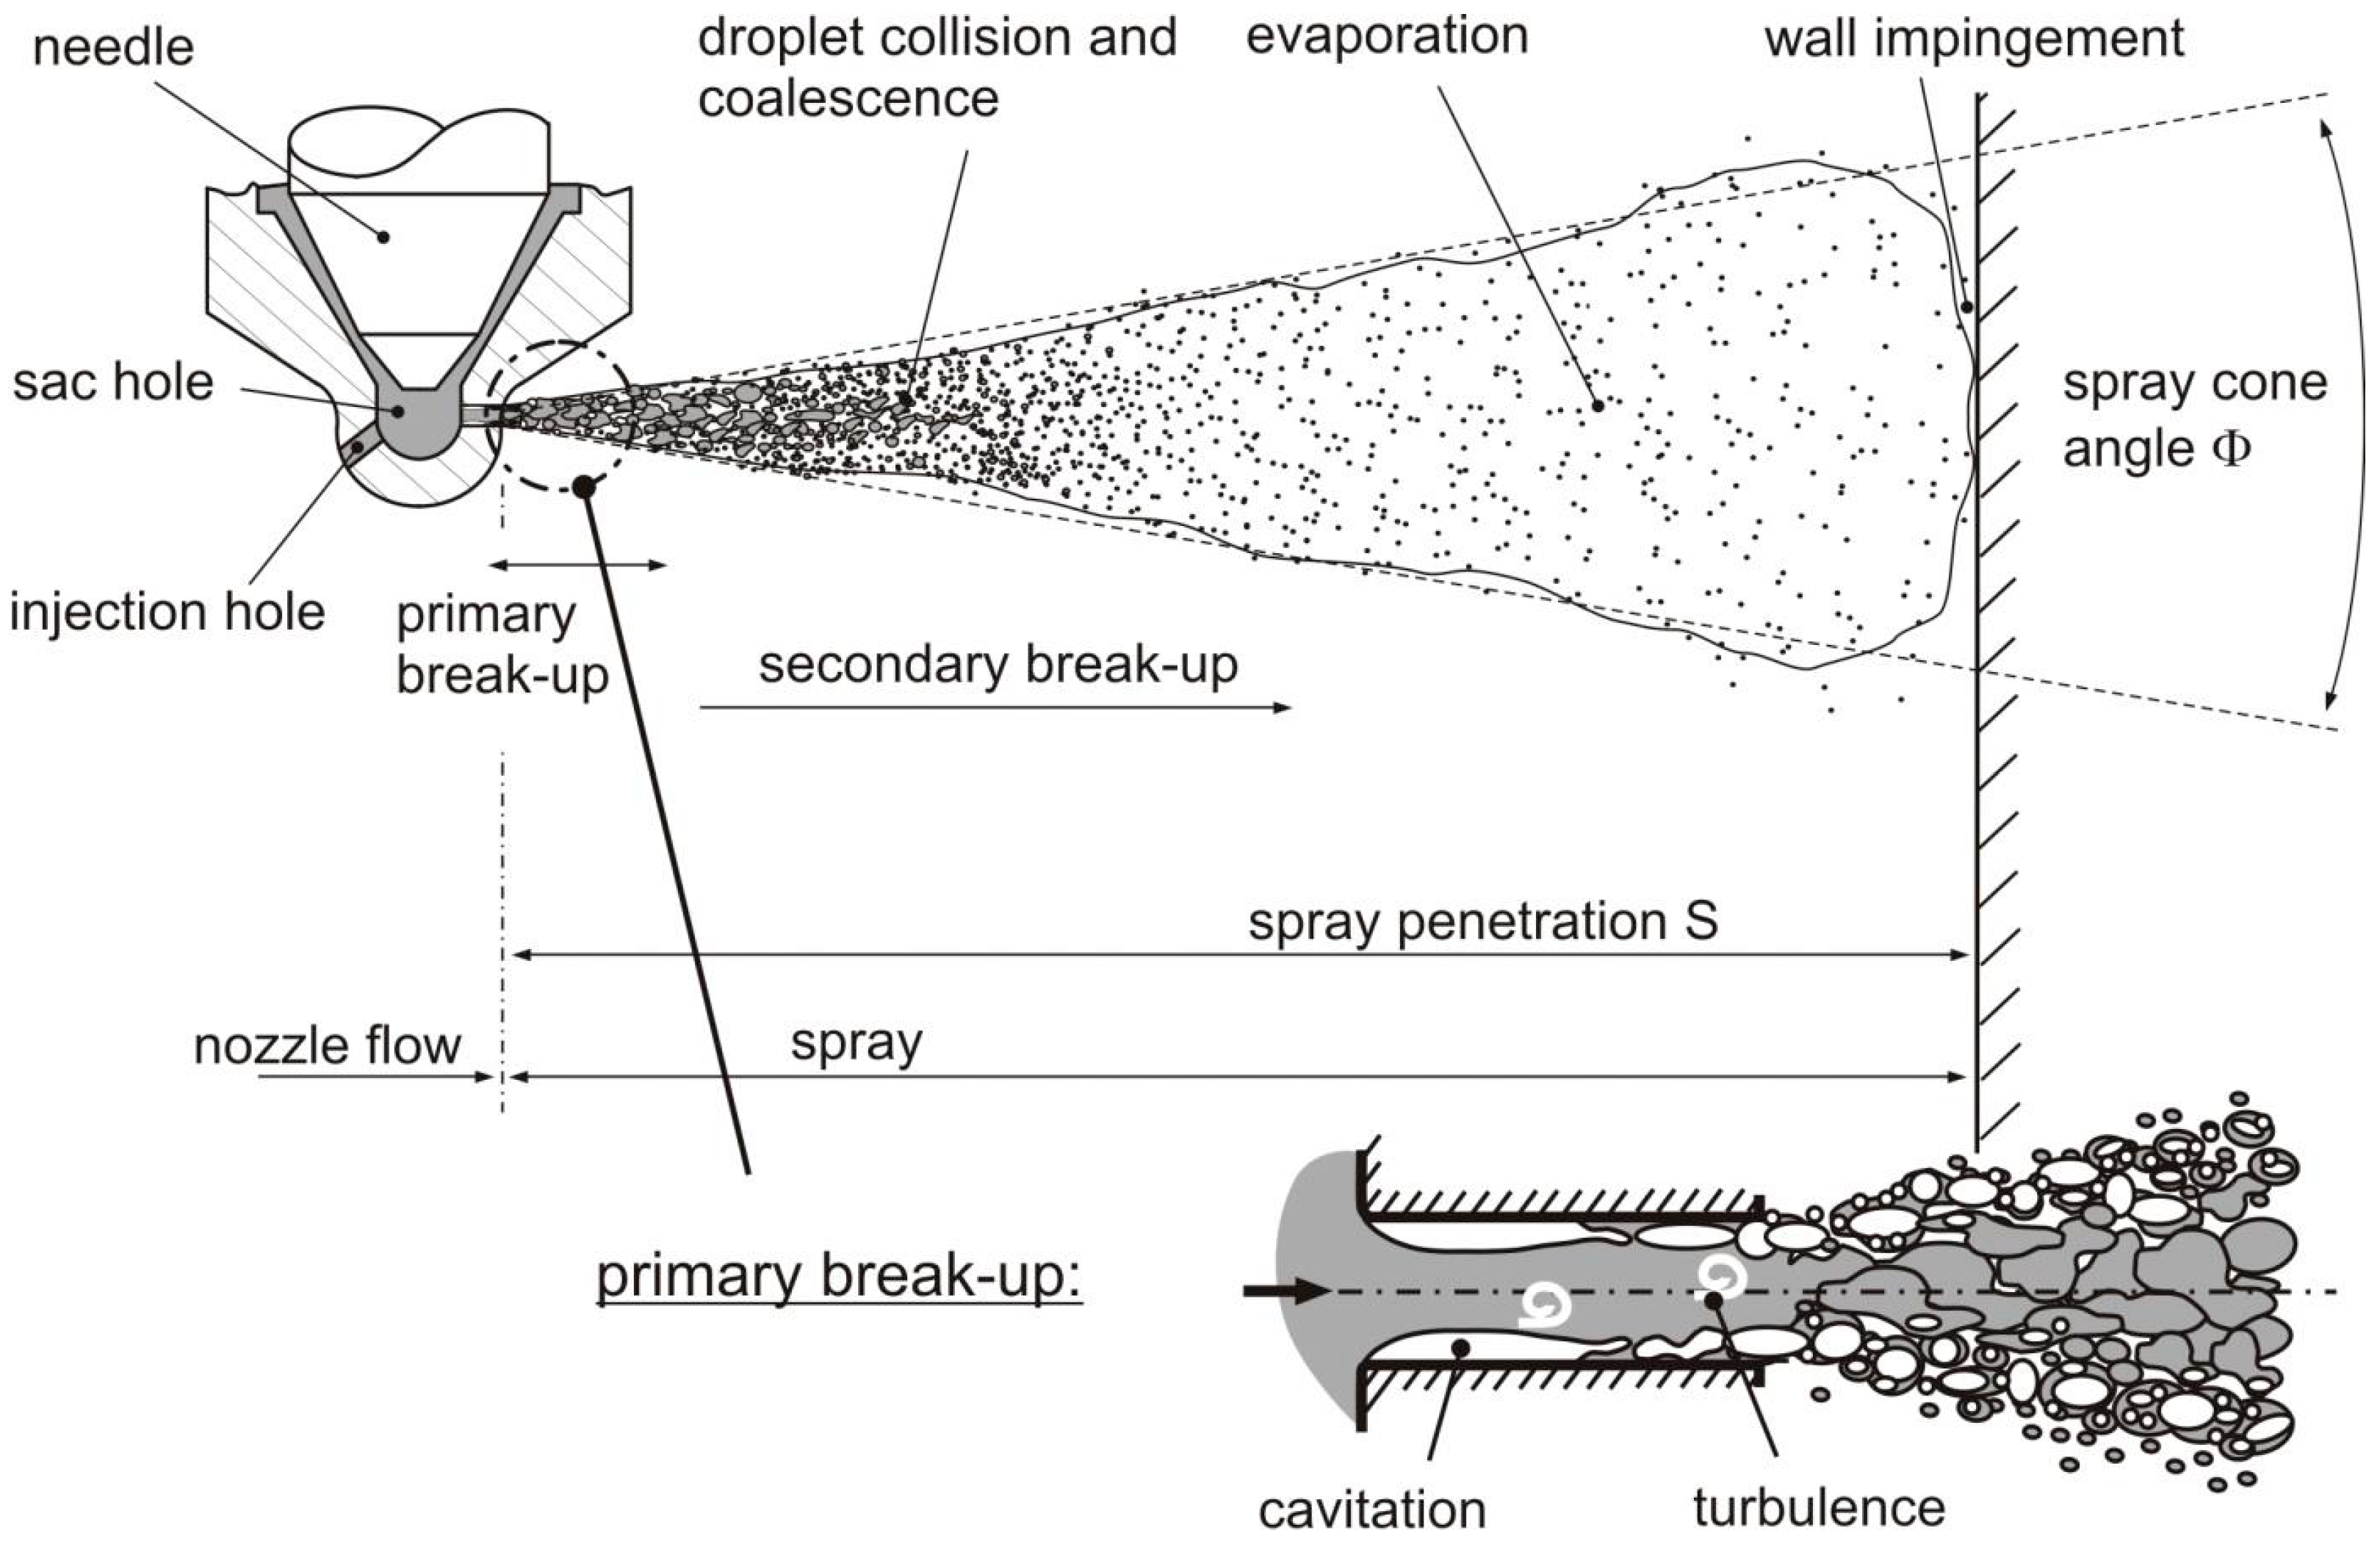
1. Introduction
2. Flow Inside the Nozzle
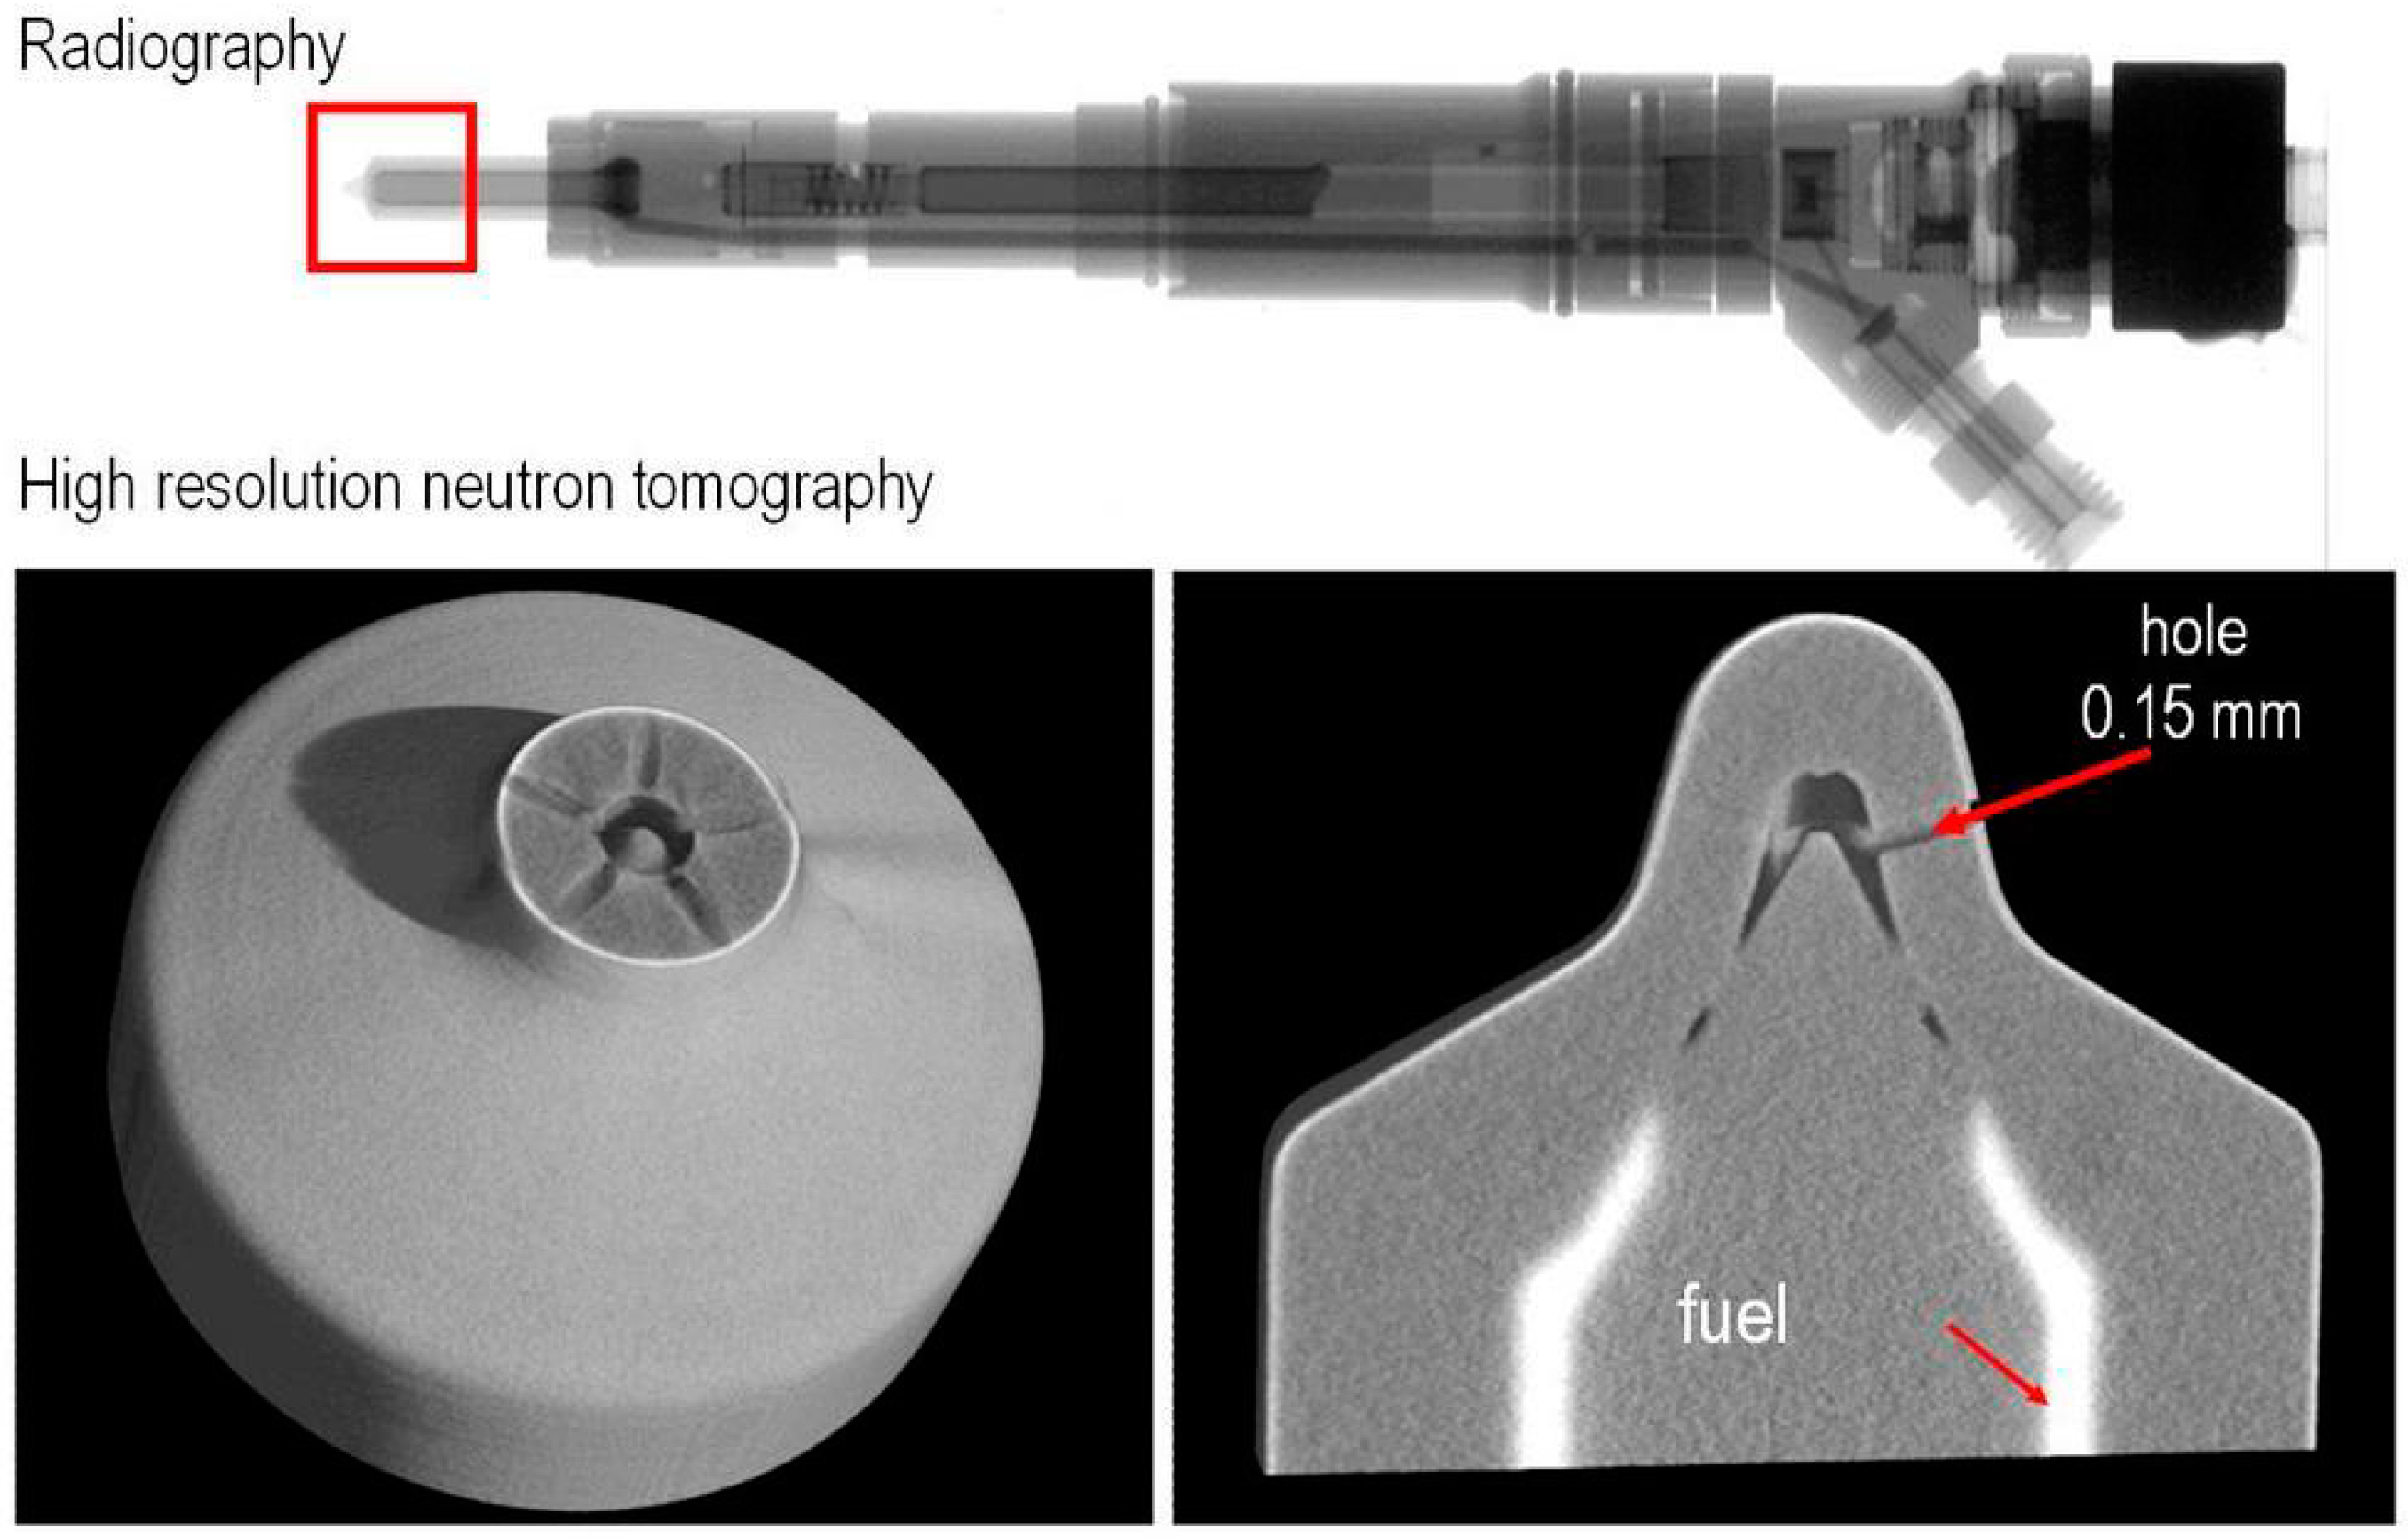
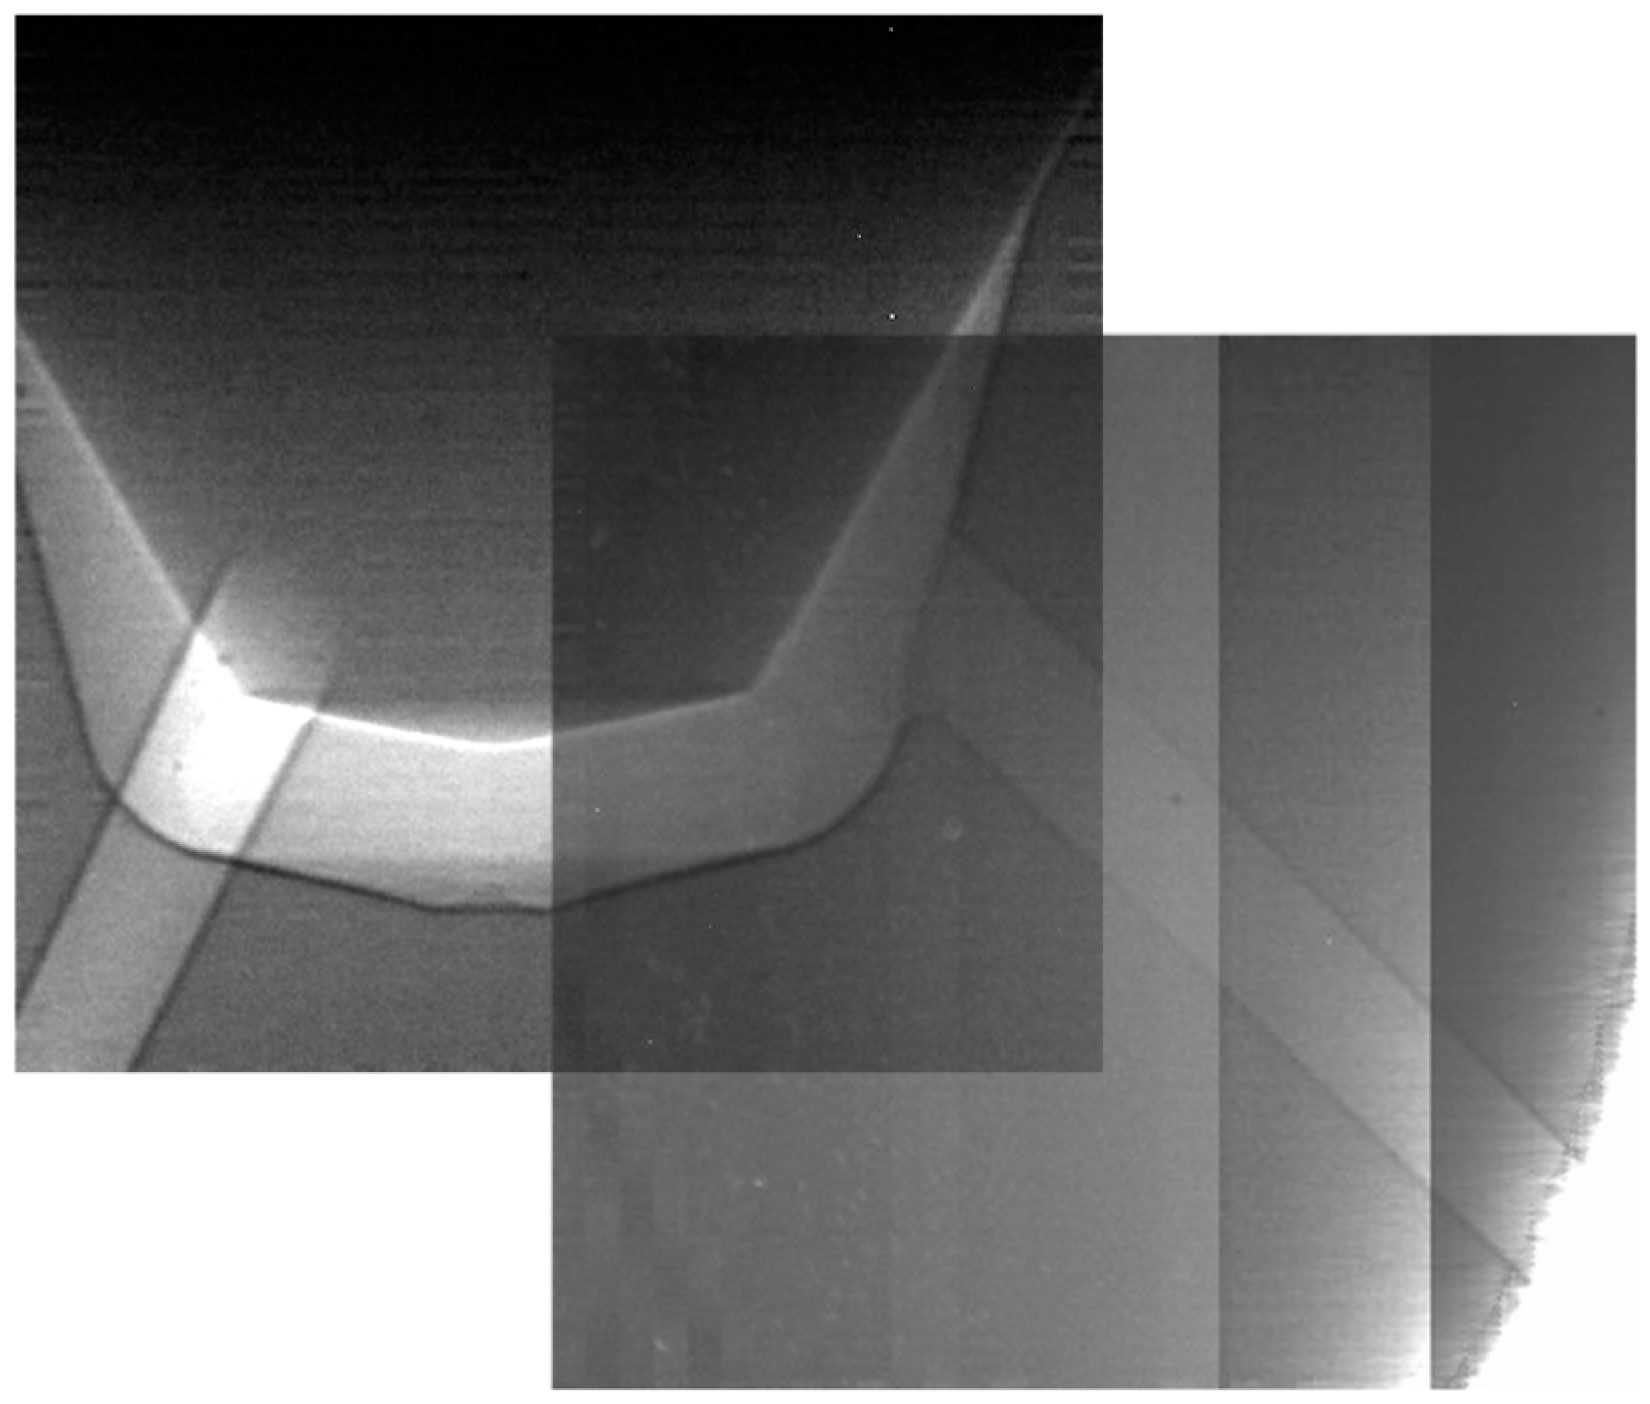
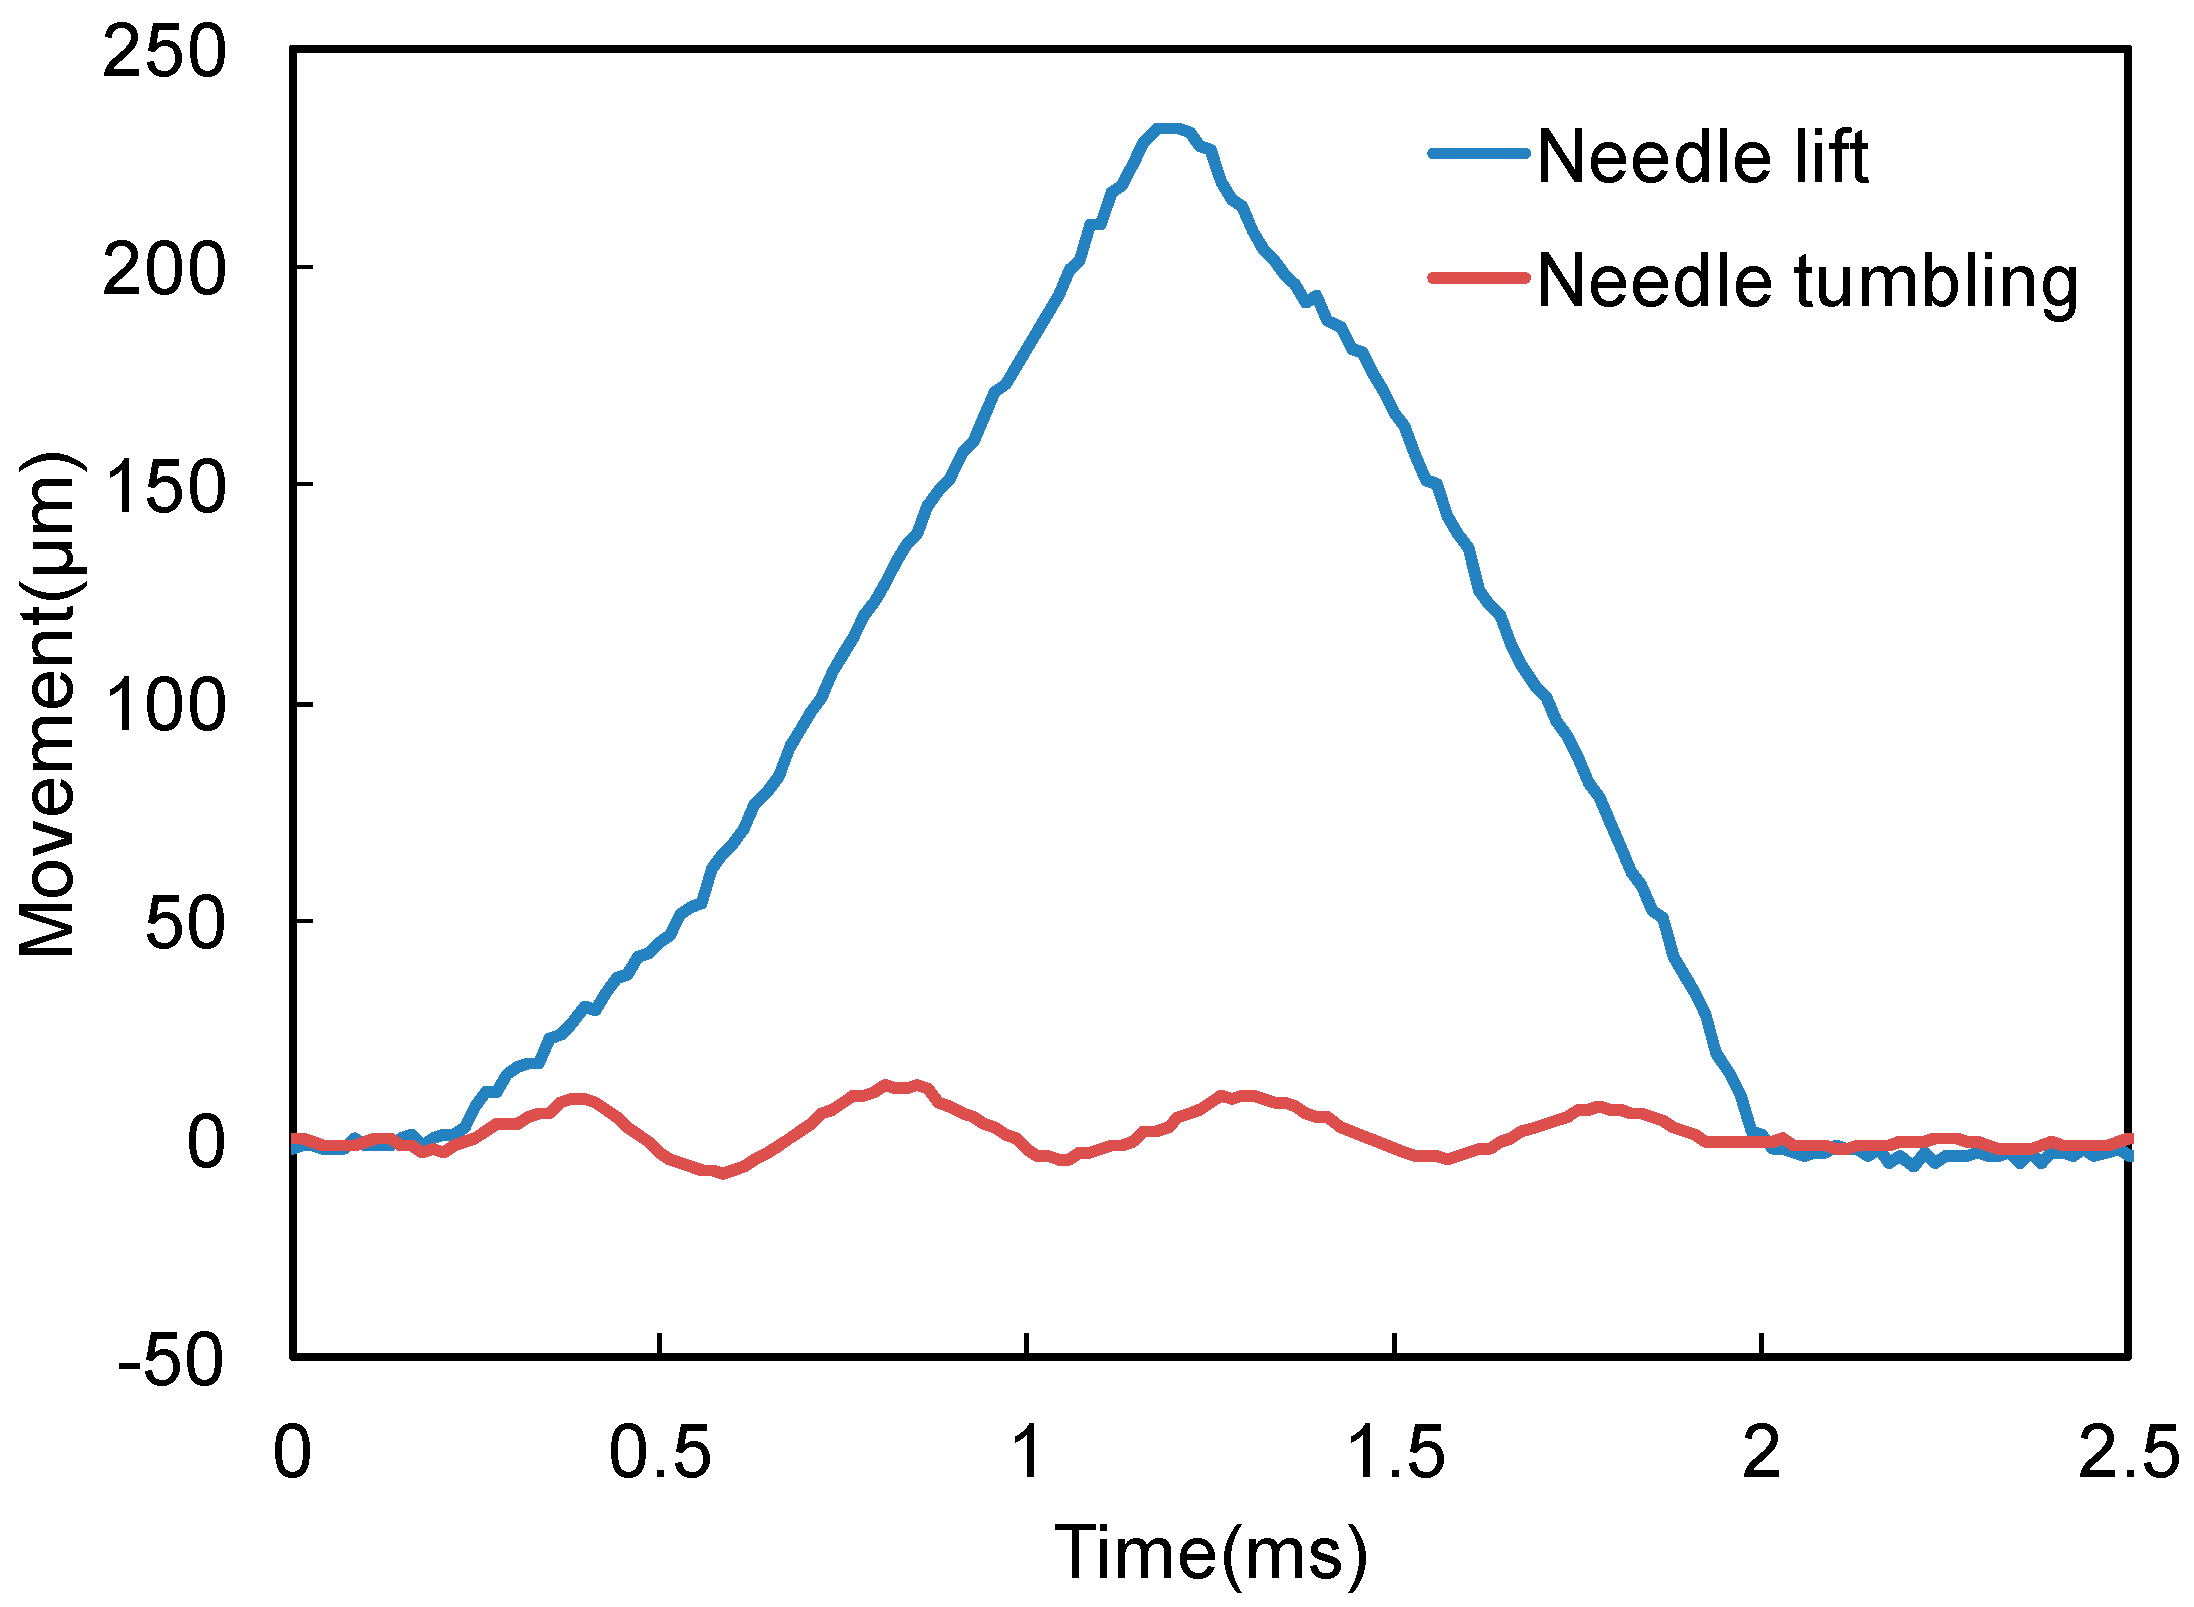
2.1. Neutron and X-ray Transmission Measurement
2.2. Numerical Simulation of Flow Inside Nozzle
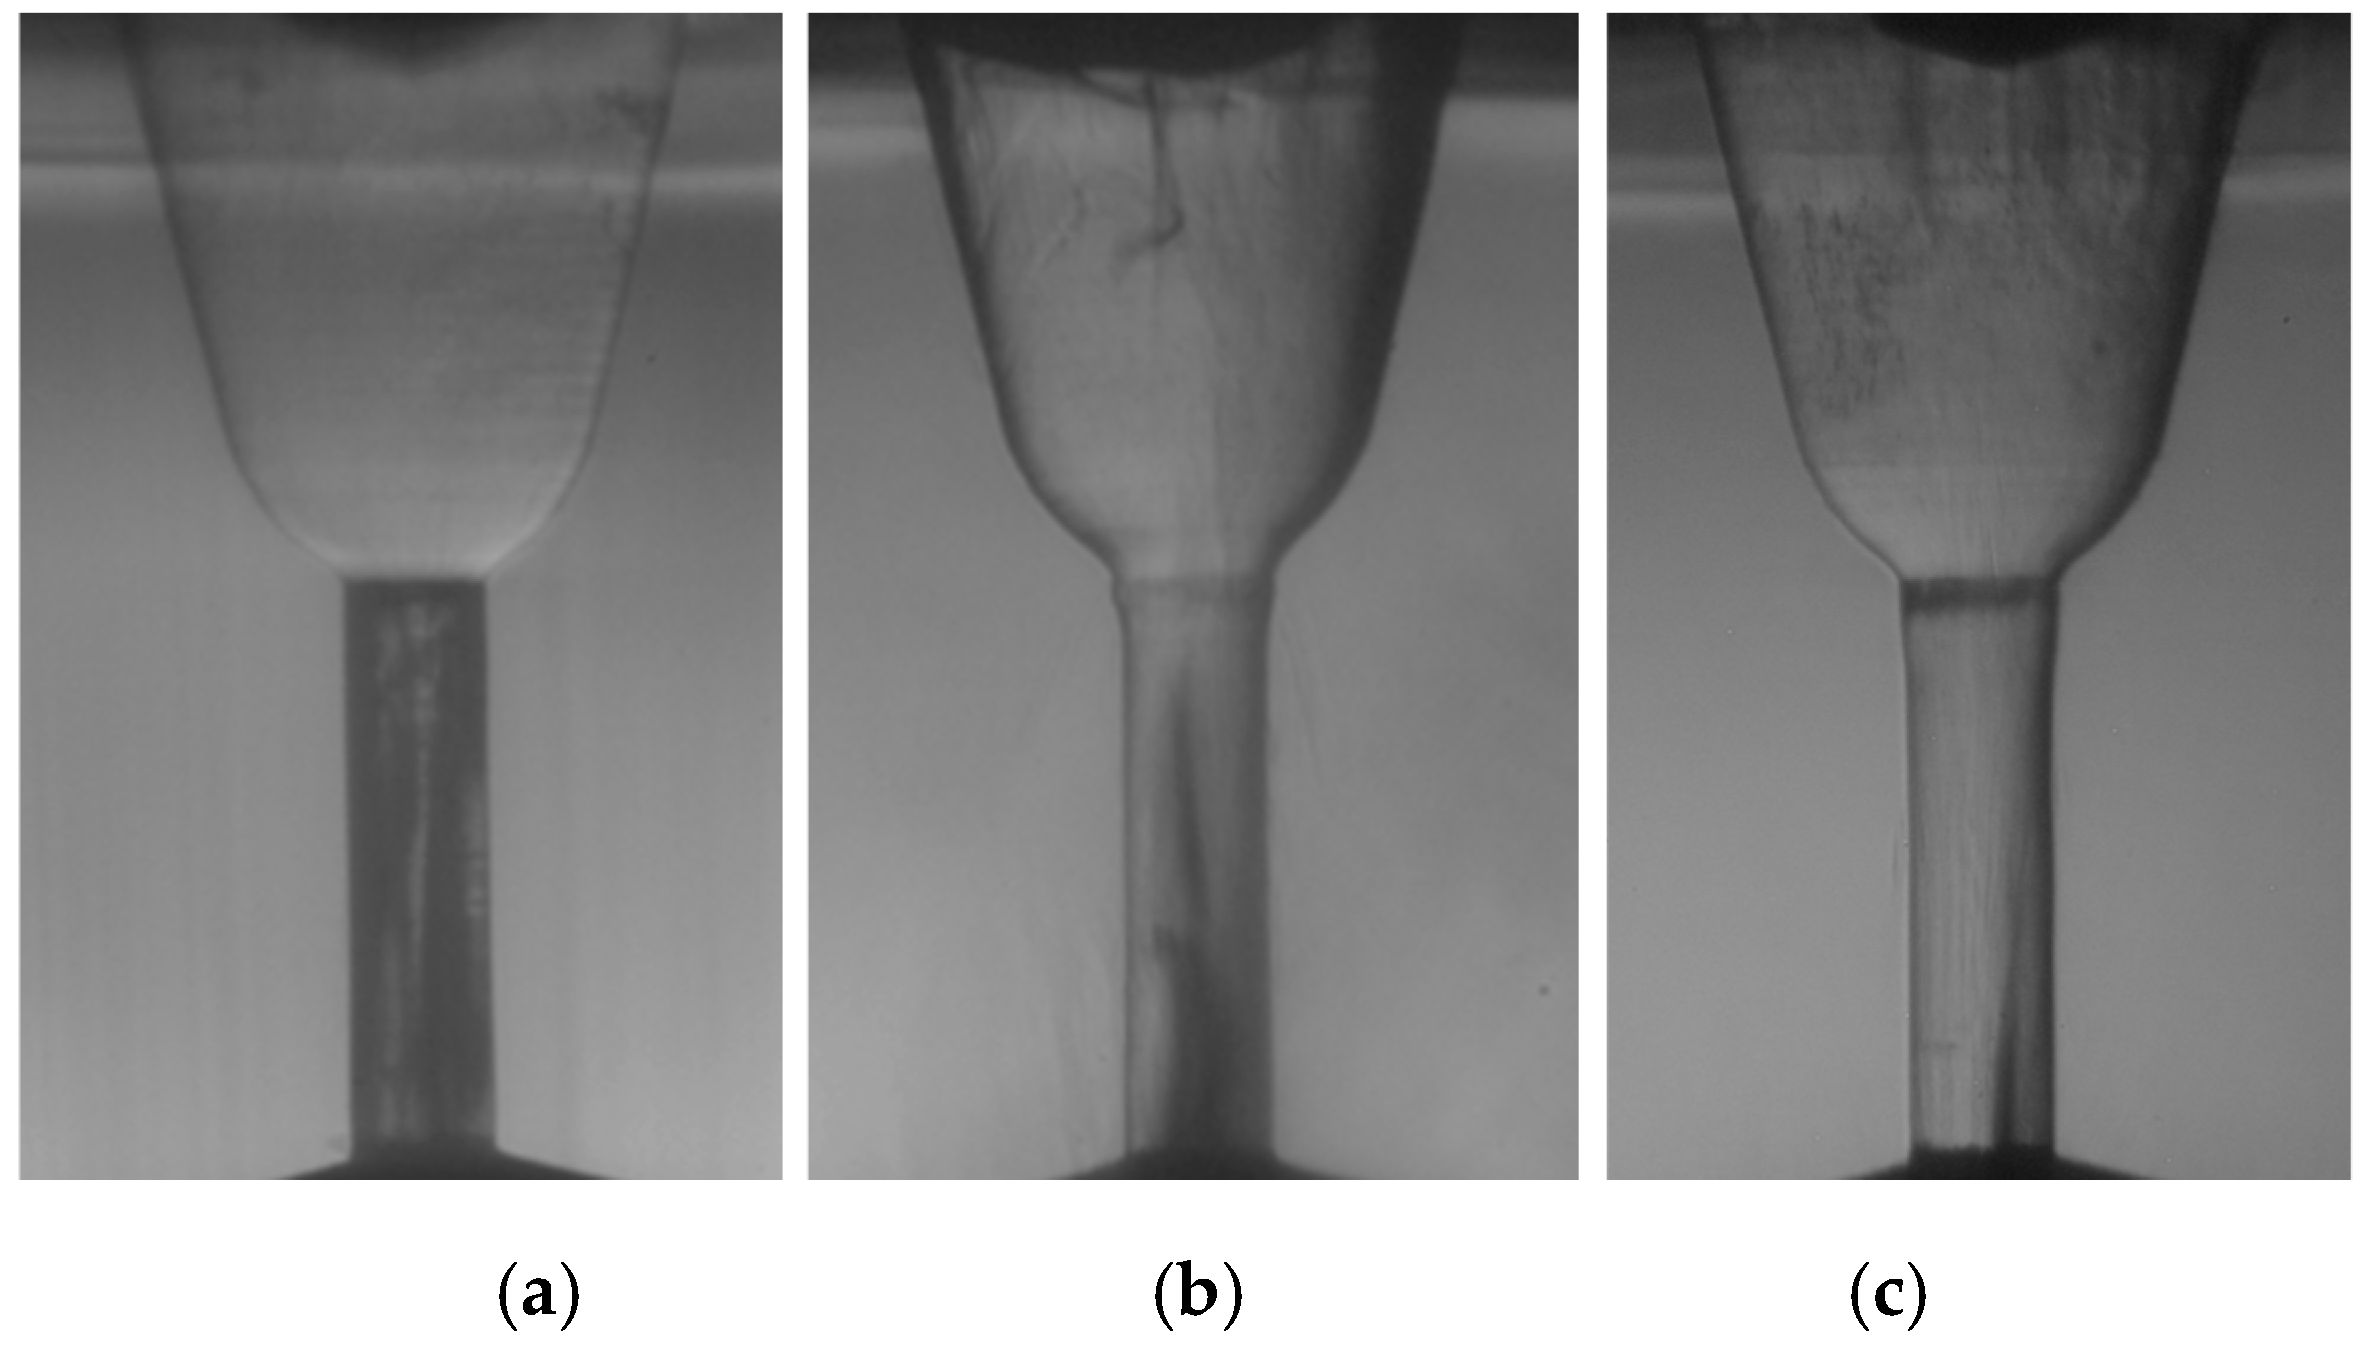
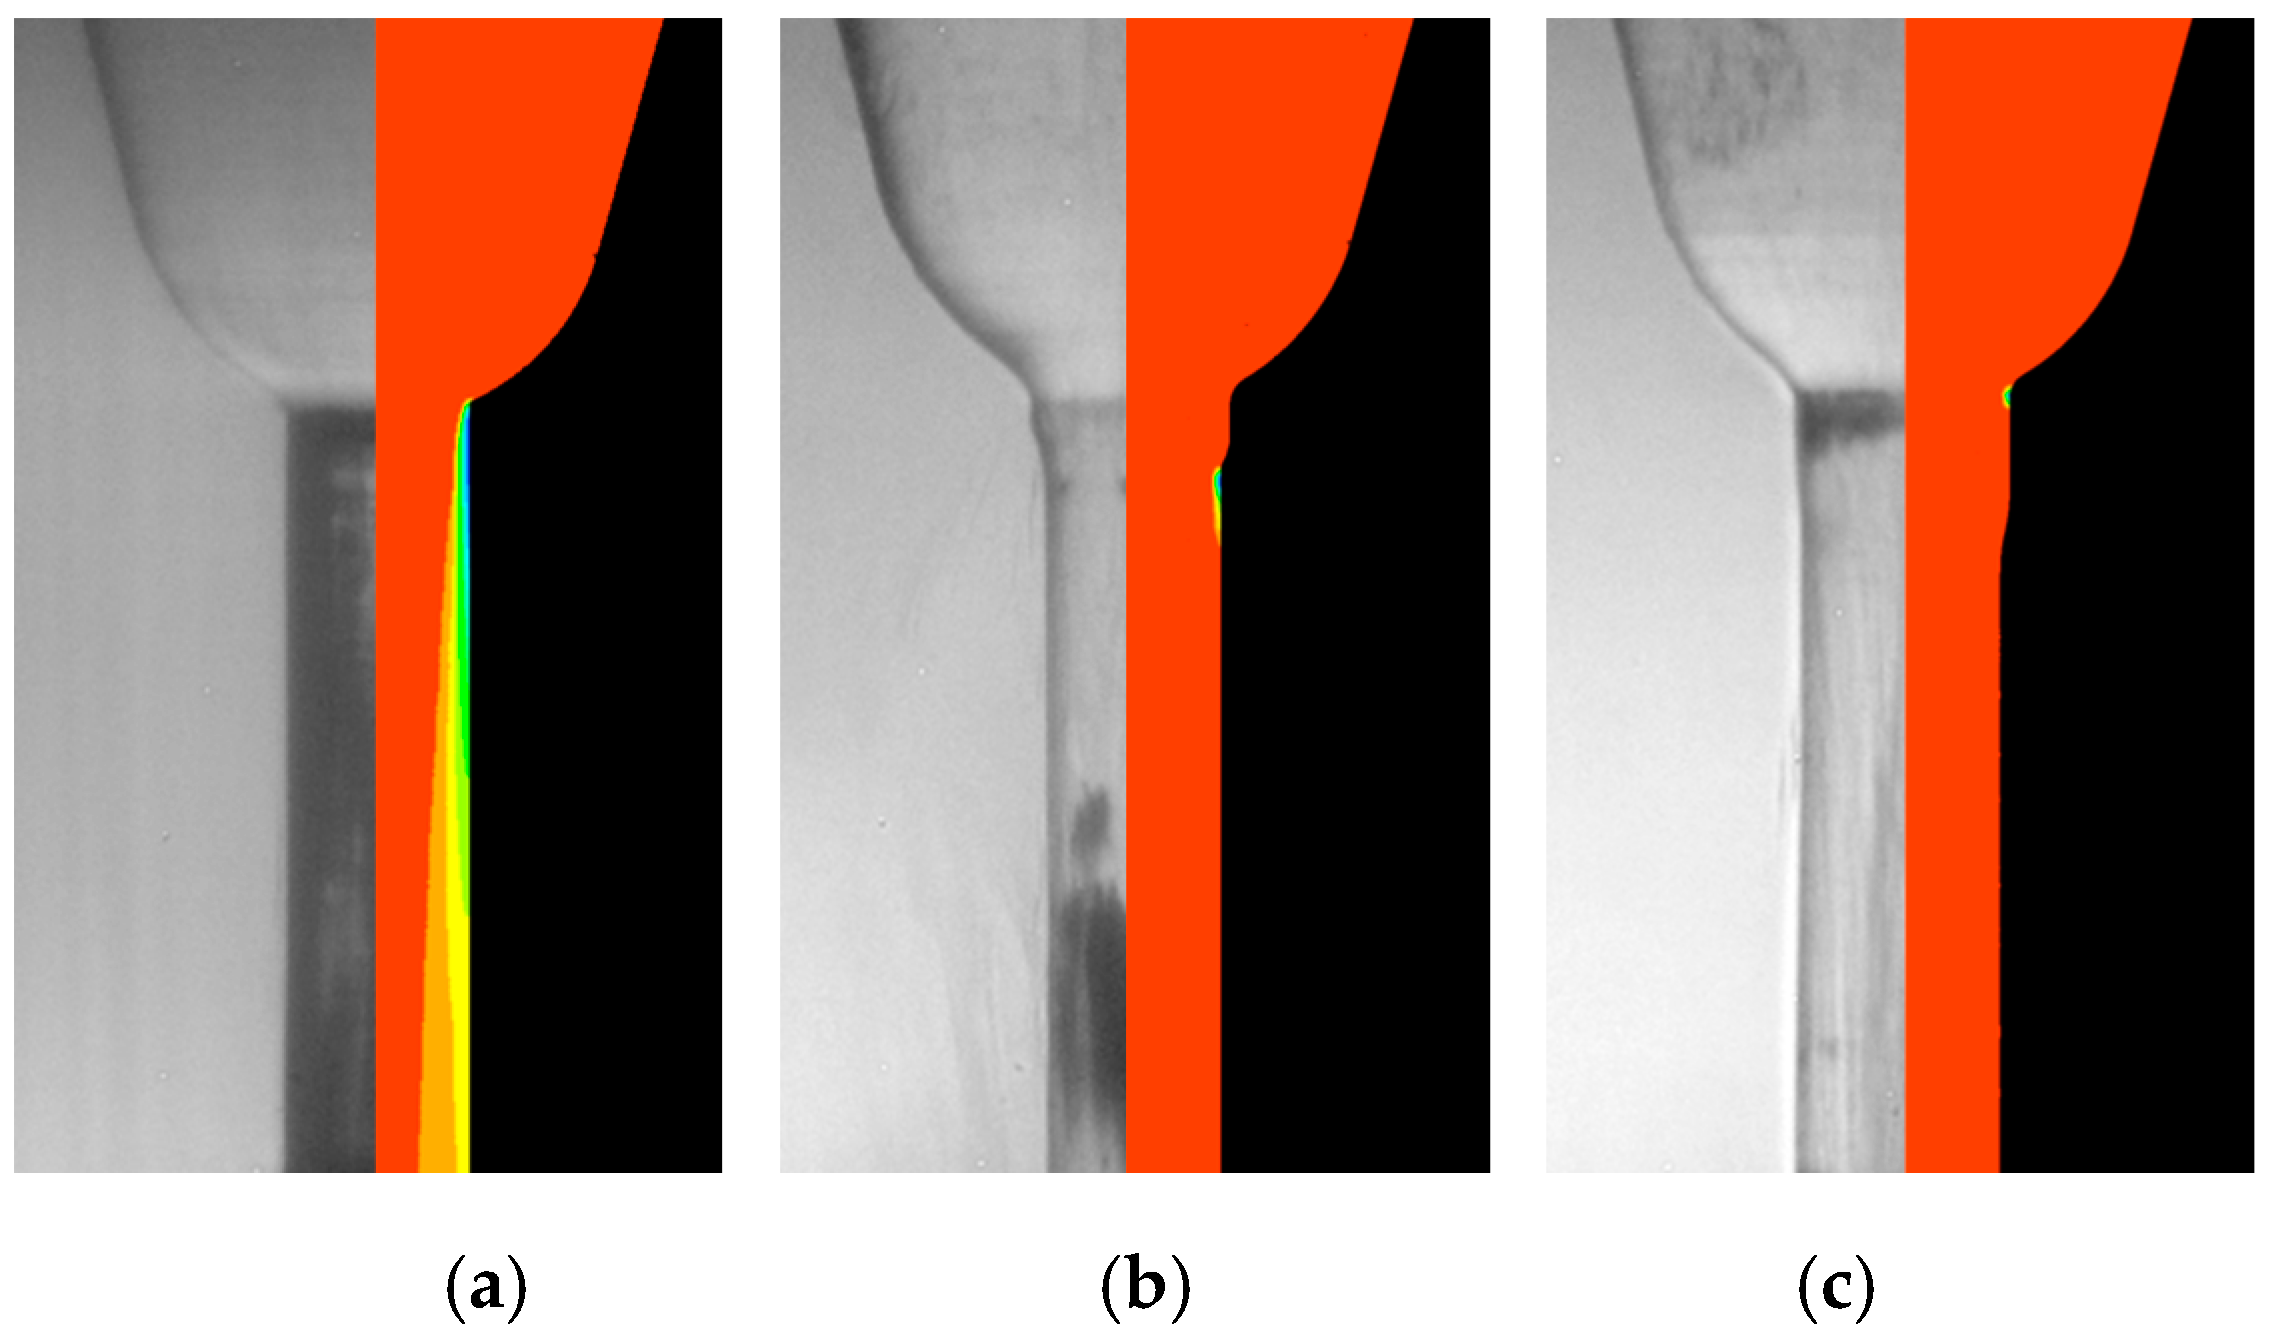
2.3. Transparent Nozzles
3. Spray Development from Nozzle Orifices
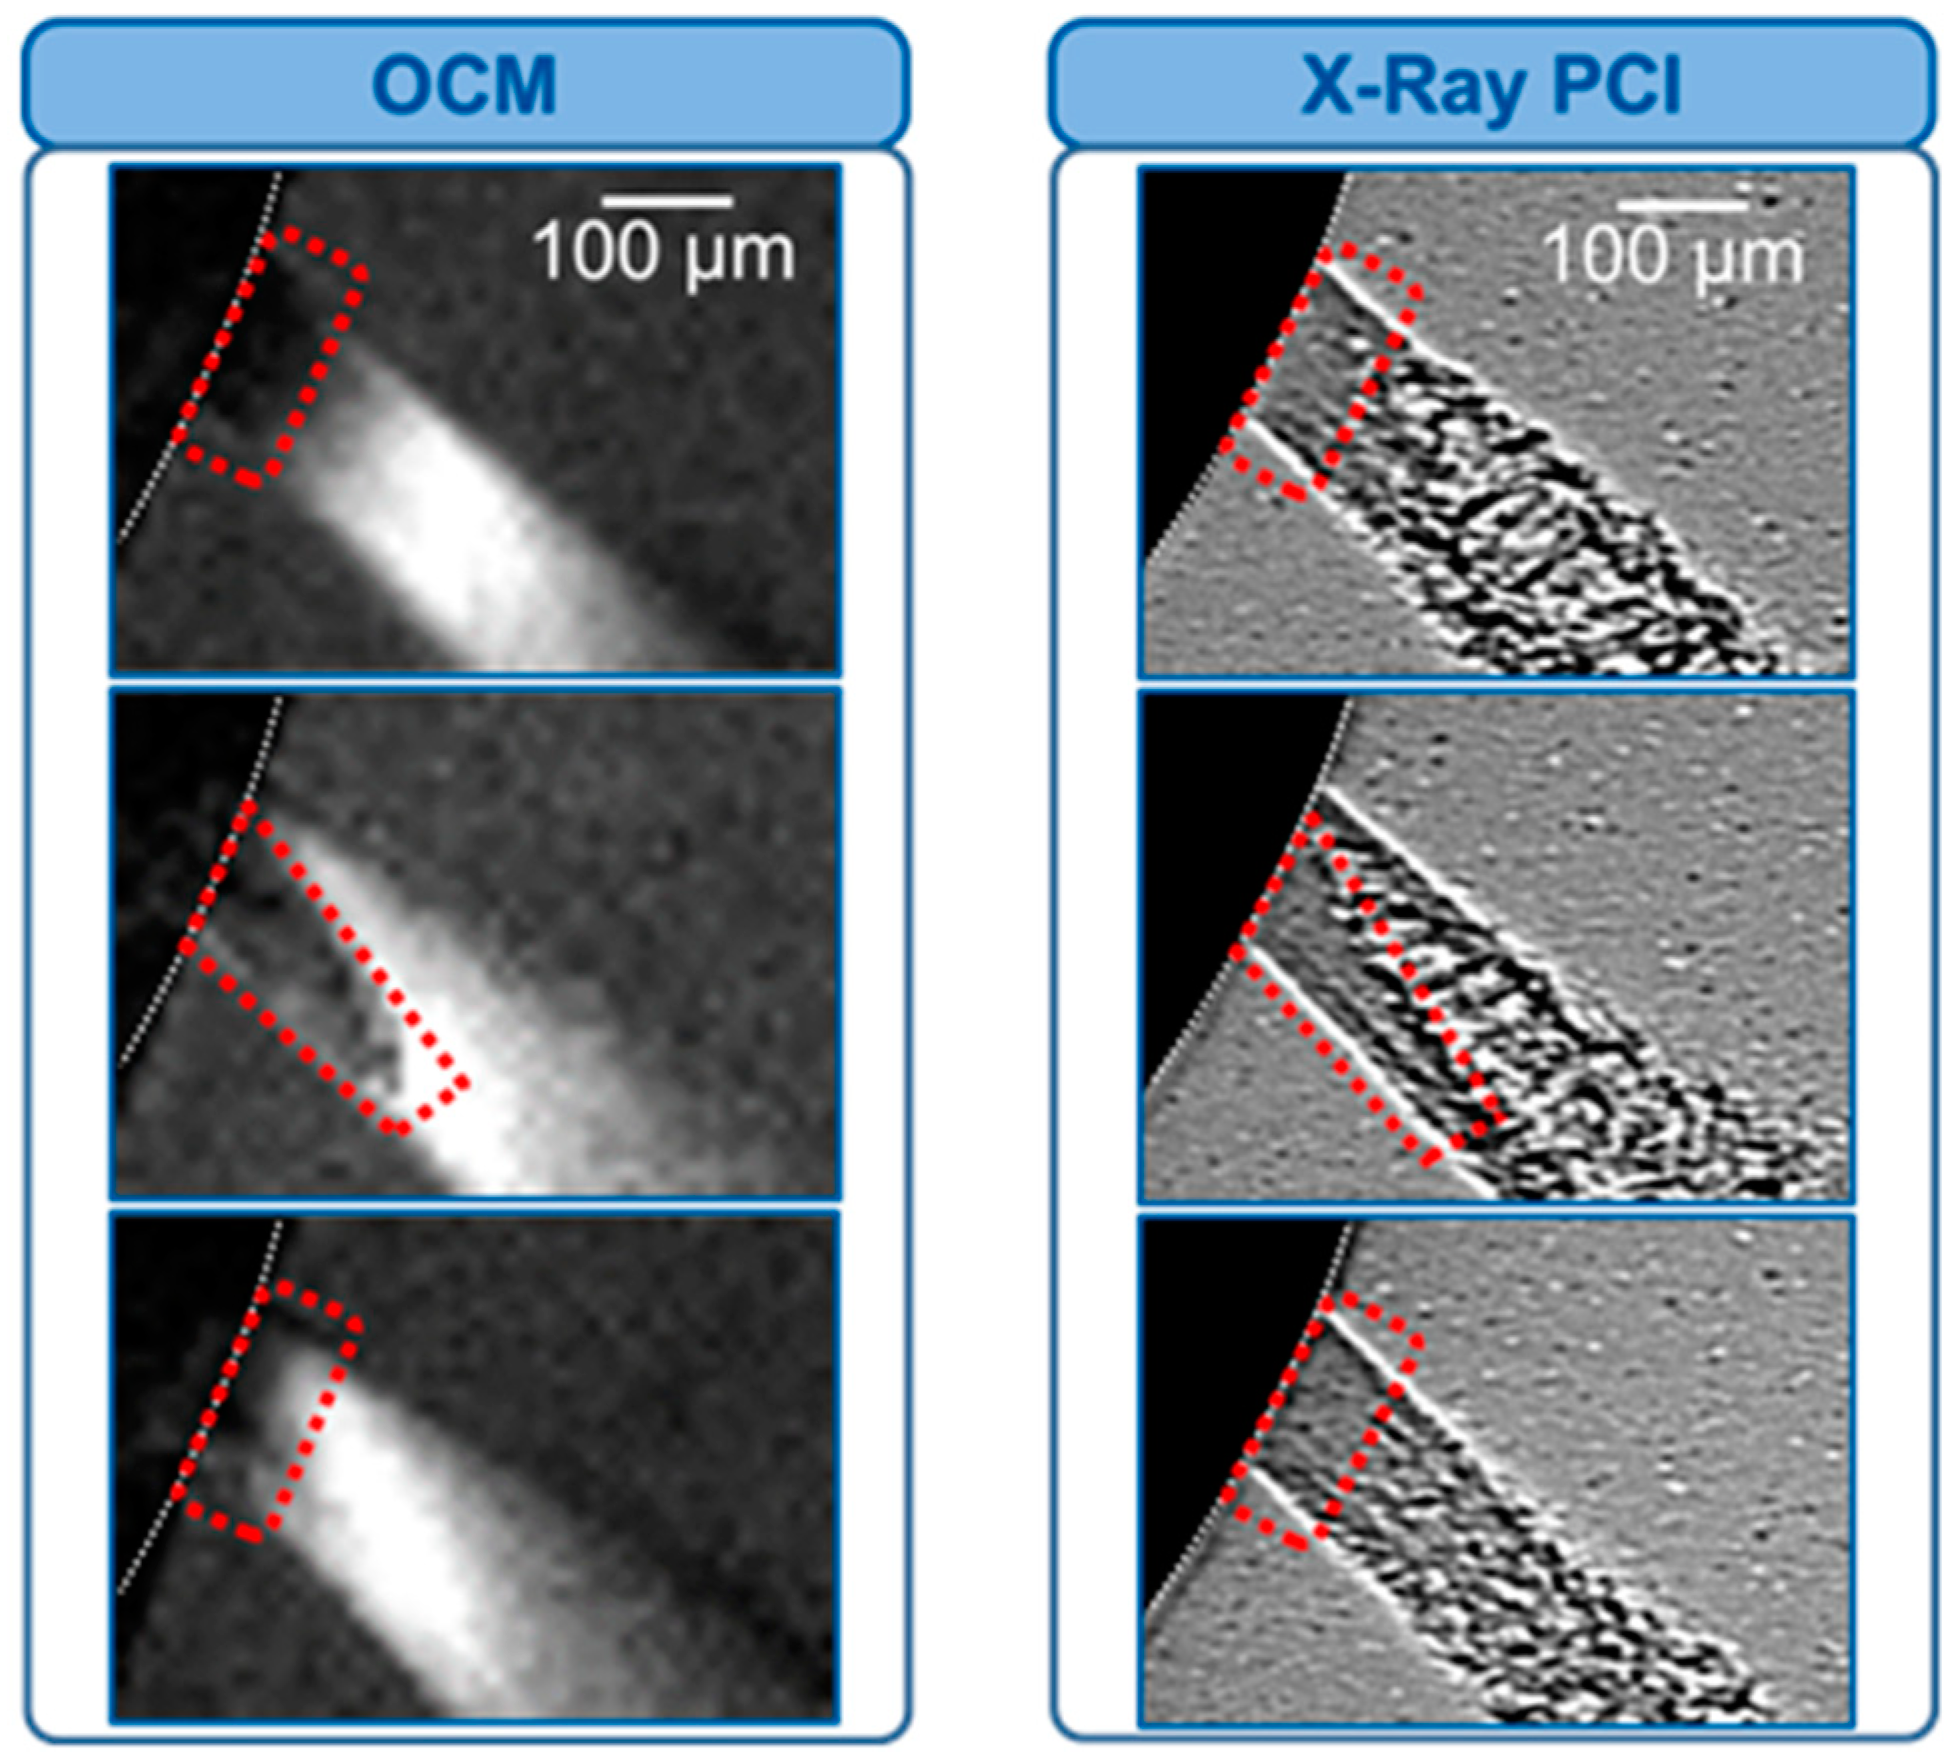
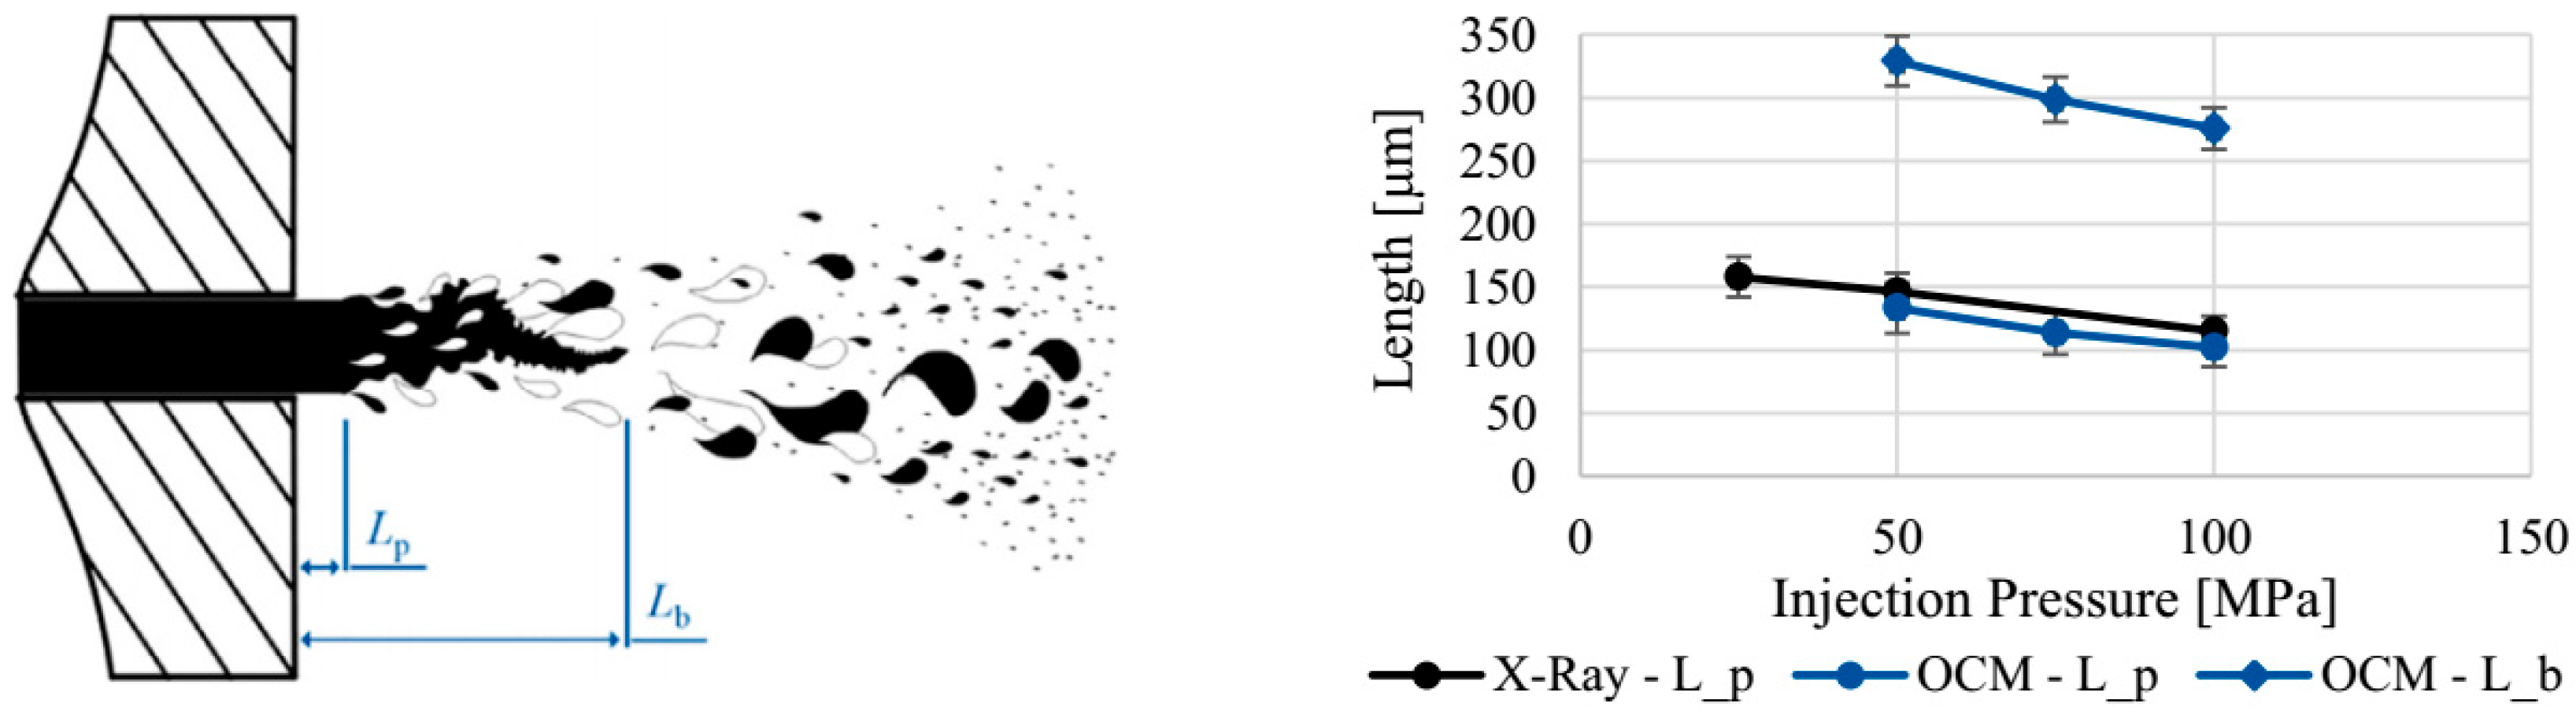
3.1. Determination of the Primary Spray Breakup with the Optical Connectivity Method
3.2. Near Nozzle Velocity Measurement with the Structural Image Velocimetry
3.3. Velocity and Size Measurement with Laser 2-Focus Velocimetry
4. Comprehensive Discussion on the Spray Processes near the Nozzle
5. Summarizing Discussion
Author Contributions
Funding
Acknowledgments
Conflicts of Interest
References
- Fansler, T.D.; Parrish, S.E. Spray Measurement Technology: A Review. Meas. Sci. Technol. 2015, 26, 1–34. [Google Scholar] [CrossRef]
- Linne, M. Imaging in the Optically Dense Regions of a Spray: A Review of Developing Techniques. Prog. Energy Combust. Sci. 2013, 39, 403–440. [Google Scholar] [CrossRef]
- Baumgarten, C. Mixture Formation in Internal Combustion Engines; Springer: Heidelberg, Germany, 2006. [Google Scholar]
- Som, S.; Aggarwal, S.K. Effects of Primary Breakup Modeling on Spray and Combustion Characteristics of Compression Ignition Engines. Combust. Flame 2010, 157, 1179–1193. [Google Scholar] [CrossRef]
- Yu, W.; Yang, W.; Mohan, B.; Tay, K.; Zhao, F.; Zhang, Y.; Chou, S.; Kraft, M.; Alexander, M.A.; Yong, A.; et al. Numerical and Experimental Study on Internal Nozzle Flow and Macroscopic Spray Characteristics of a Kind of Wide Distillation Fuel (WDF)—Kerosene 2016-01-0839. SAE Tech. Paper 2016. [Google Scholar] [CrossRef]
- Yu, W.; Yang, W.; Zhao, F. Investigation of internal nozzle flow, spray and combustion characteristics fueled with diesel, gasoline and wide distillation fuel (WDF) based on a piezoelectric injector and a direct injection compression ignition engine. Appl. Therm. Eng. 2017, 114, 905–920. [Google Scholar] [CrossRef]
- Lehmann, E.; Grünzweig, C.; Jollet, S.; Kaiser, M.; Hansen, H.; Dinkelacker, F. Visualization of Diesel Injector with Neutron Imaging. J. Phys. Conf. Ser. 2015, 656, 1–4. [Google Scholar] [CrossRef] [Green Version]
- MacPhee, A.G.; Tate, M.W.; Powell, C.F.; Yue, Y.; Renzi, M.J.; Ercan, A.; Narayanan, S.; Fontes, E.; Walther, J.; Schaller, J.; et al. X-ray Imaging of Shock Waves Generated by High-Pressure Fuel Sprays. Science 2002, 295, 1261–1263. [Google Scholar] [CrossRef] [Green Version]
- Kastengren, A.; Powell, C.F.; Wang, Y.; Im, K.S.; Wang, J. X-ray Radiography Measurements of Diesel Spray Structure at Engine-Like Ambient Density. Atomiz. Sprays 2009, 19, 1031–1044. [Google Scholar] [CrossRef]
- Im, K.S.; Cheong, S.K.; Powell, C.F.; Lai, M.C.D.; Wang, J. Unraveling the Geometry Dependence of In-Nozzle Cavitation in High-Pressure Injectors. Sci. Rep. 2013, 3, 1–5. [Google Scholar] [CrossRef] [Green Version]
- Torelli, R.; Magnotti, G.M.; Som, S.; Pei, Y.; Traver, M.L. Exploration of Cavitation-Suppressing Orifice Designs for a Heavy-Duty Diesel Injector Operating with Straight-Run Gasoline 2019-24-0126. SAE Tech. Paper 2019. [Google Scholar] [CrossRef]
- Lord Rayleigh: On the Pressure Developed in a Liquid during the Collapse of a Spherical Cavity. Philos. Mag. 1917, 34, 94–98. [CrossRef]
- Plesset, M.S. The Dynamics of Cavitation Bubbles. J. Appl. Mech. 1949, 16, 277–282. [Google Scholar] [CrossRef]
- Kawaharada, N.; Thimm, L.; Dinkelacker, F. Transient Cavitation Structure inside real Scale Transparent Nozzles. In Proceedings of the 20th ILASS-Asia & 28th ILASS-Japan Symposium, Ube, Japan, 21–23 December 2019; pp. 1–8. [Google Scholar]
- Diver, C.; Atkinson, J.; Befrui, B.; Helml, H.J.; Li, L. Improving the Geometry and Quality of a Micro-Hole Fuel Injection Nozzle by Means of Hydroerosive Grinding. Proc. Inst. Mech. Eng. Part B J. Eng. Manuf. 2007, 221, 1–9. [Google Scholar] [CrossRef]
- Bergstrand, P. The Effects of Orifice Shape on Diesel Combustion. SAE Trans. 2004, 113, 370–1379. [Google Scholar]
- Kawaharada, N.; Thimm, L.; Dinkelacker, F. Cavitation Investigation Database for Model Evaluations and Developments, Part 1. Mendeley Data 2020, v1. [Google Scholar] [CrossRef]
- Schnerr, G.H.; Sauer, J. Physical and Numerical Modeling of Unsteady Cavitation Dynamics. In Proceedings of the 4th International Conference on Multiphase Flow, New Orleans, LA, USA, 27 May–1 June 2001; pp. 1–12. [Google Scholar]
- Jollet, S.; Heilig, A.; Bitner, K.; Niemeyer, D.; Dinkelacker, F. Comparison of experiments and numerical simulations of high pressure transparent injection nozzles. In Proceedings of the 25th ILASS Europe, Chania, Crete, 1–4 September 2013; pp. 1–7. [Google Scholar]
- Jollet, S. Experimentelle und Numerische Untersuchungen der Instationären Dynamischen Innenströmung in Dieselinjektoren. Ph.D. Thesis, University Hannover, Hannover, Germany, 2014. PZH-TEWISS Verlag Garbsen, Germany: Berichte aus dem ITV, Band 1/2014 (In German). [Google Scholar]
- Villafranco, D.O.; Do, H.K.; Grace, S.M.; Ryan, E.M.; Holt, R.G. Assessment of Cavitation Models in the Prediction of Cavitation in Nozzle Flow. In Proceedings of the the ASME, Montreal, QC, Canada, 15–20 July 2018; pp. 1–10. [Google Scholar] [CrossRef]
- Cazzoli, G.; Falfari, S.; Bianchi, G.M.; Forte, C.; Catellani, C. Assessment of the Cavitation Models Implemented in OpenFOAM Under DI-like Conditions. Energy Procedia 2016, 101, 638–645. [Google Scholar] [CrossRef]
- Roosen, P. Einspritzstrahlstruktur vor Dieseldüsen. MTZ, Motortechn. Z. 1991, 52, 526–531. [Google Scholar]
- Charalampous, G.; Hardalupas, Y.; Taylor, A. Novel Technique for Measurements of Continuous Liquid Jet Core in an Atomizer. AIAA Journal. 2009, 47, 2605–2615. [Google Scholar] [CrossRef]
- Charalampous, G.; Hadjiyiannis, C.; Hardalupas, Y. Proper orthogonal decomposition analysis of photographic and optical connectivity time resolved images of an atomizing liquid jet. In Proceedings of the 24th ILASS Europe, Estoril, Portugal, 5–7 September 2011. [Google Scholar]
- Heilig, A.; Kaiser, M.; Dinkelacker, F. Near Nozzle High-Speed Measurements of the Intact Core for Diesel Spray. In Proceedings of the 12th ICLASS, Heidelberg, Germany, 2–6 September 2012; pp. 1–8. [Google Scholar]
- Heilig, A. Untersuchung des Primärzerfalls von Hochdruckdieselsprays Mittels Optischer Messtechnik. Ph.D. Thesis, University Hannover, Hannover, Germany, 2013. PZH-TEWISS Verlag, Germany: Berichte aus dem ITV, Band 1/2013 (In German). [Google Scholar]
- Heilig, A.; Kaiser, M.; Qian, D.; Dinkelacker, F. Optical Diagnostic Approaches of the Primary Breakup of Diesel Sprays. In Engine Combustion Processes Current Problems and Modern Techniques, XIth Congress. Ludwigsburg; ESYTEC: Erlangen, Germany, 2013; Volume 13.1, pp. 447–458. [Google Scholar]
- Kaiser, M.; Kawaharada, N.; Hara, T.; Gröger, K.; Dinkelacker, F. Introduction of the Remote Optical Connectivity Method. In Proceedings of the 13th ICLASS, Tainan, Taiwan, 23–27 August 2015; pp. 1–8. [Google Scholar]
- Gröger, K.; Kaiser, M.; Wang, J.; Dinkelacker, F. Comparison of the Optical Connectivity Method to X-Ray Spray Measurements in the Near Field of a Diesel Injector. Proc. Comb. Inst. 2019, 37, 3271–3278. [Google Scholar] [CrossRef]
- Payri, R.; Salvador, F.J.; Gimeno, J.; De la Morena, J. Analysis of diesel spray atomization by means of a near-nozzle field visualization technique. Atomiz. Sprays 2011, 21, 753–774. [Google Scholar] [CrossRef]
- Kastengren, A.; Powell, C.F. Synchrotron X-ray techniques for fluid dynamics. Exp. Fluids 2014, 55, 1686. [Google Scholar] [CrossRef]
- Chaves, H.; Knapp, M.; Kubitzek, A.; Obermeier, F. High Speed Flow Measurements within an Injection Nozzle. Spie Laser Anemometry Adv. Appl. 1993, 2052, 265–272. [Google Scholar]
- Chaves, H.; Kirmse, C.; Obermeier, F. Velocity measurements of dense diesel fuel sprays in dense air. At. Sprays 2004, 14, 589–609. [Google Scholar] [CrossRef]
- Schugger, C.; Renz, U. Influence of Spray Velocity and Structure on the Air Entrainment in the Primary Breakup Zone of High Pressure Diesel Sprays. In Proceedings of the ASME Internal Combustion Engine Division Fall Technical Conference, New Orleans, LA, USA, 8–11 September 2002; Paper No: ICEF2002-508. pp. 281–288. [Google Scholar] [CrossRef]
- Leick, P.; Bittlinger, G.; Tropea, C. Velocity measurement in the near nozzle region of common rail diesel sprays at elevated back-pressures. In Proceedings of the 19th ILASS Europe, Nottingham, UK, 6–8 September 2004; pp. 296–301. [Google Scholar]
- Hespel, C.; Blaisot, J.B.; Gazon, M.; Godard, G. Laser correlation velocimetry performance in diesel applications: Spatial selectivity and velocity sensitivity. Exp. Fluids 2012, 53, 245–264. [Google Scholar] [CrossRef]
- Weber, D.; Leick, P. Structure and Velocity Field of Individual Plumes of Flashing Gasoline Direct Injection Sprays. In Proceedings of the 26th ILASS, Bremen, Germany, 8–10 September 2014; pp. 1–12. [Google Scholar] [CrossRef]
- Gröger, K.; Kawaharada, N.; Klippenstein, A.; Dinkelacker, F. Velocity Measurement of High-Pressure Gasoline Direct Injections in the Primary Atomization Region on Flash Boiling Conditions. In Proceedings of the 29th ILASS Europe, Paris, France, 2–4 September 2019; pp. 1–8. [Google Scholar]
- Goldlücke, J.; Brüggemann, D.; Leidernberger, U.; Hüttl, C. Optical-Flow-Methode zur Strömungsanalyse in der motorischen Verbrennung. MTZ—Motortechn. Z. 2011, 72, 58–63. [Google Scholar] [CrossRef]
- Gröger, K. Entwicklung und Vergleich optischer Messverfahren zur Analyse des Düsennahen Strahlzerfalls von Diesel- und Ottoinjektoren. Ph.D. Thesis, University Hannover, Hannover, Germany, 2020. (In progress, In German). [Google Scholar]
- Neubauer, A. Messtechnische Erfassung Primärer Strahlstrukturen von Benzin- und Dieselsprays. Ph.D. Thesis, University Erlangen-Nürnberg, Erlangen, Germany, 2020. (In German). [Google Scholar]
- Schodl, R. A Laser-Dual-Beam Method for Flow Measurements in Turbomachines. In Proceedings of the ASME International Gas Turbine Conference and Products Show, Zurich, Switzerland, 30 March–4 April 1974; Paper-No: ASME 74-GT-157. pp. 1–7. [Google Scholar]
- Ueki, H.; Ishida, M.; Sakaguchi, D. Simultaneous Measurement of Particle Size and Velocity by Laser 2-Focus Particle Analyzer. In Proceedings of the 6th ICLASS, Rouen, France, 18–22 July 1994; pp. 483–490. [Google Scholar]
- Kawaharada, N.; Gröger, K.; Ueki, H.; Dinkelacker, F. Laser 2-Focus Velocimeter for Droplet Characterization in Dense Sprays. In Proceedings of the 19th International Symposium on Applications of Laser and Imaging Techniques to Fluid Mechanics, Lisbon, Portugal, 16–19 July 2018; pp. 1–13. [Google Scholar]


© 2020 by the authors. Licensee MDPI, Basel, Switzerland. This article is an open access article distributed under the terms and conditions of the Creative Commons Attribution (CC BY) license (http://creativecommons.org/licenses/by/4.0/).
Share and Cite
Kawaharada, N.; Thimm, L.; Dageförde, T.; Gröger, K.; Hansen, H.; Dinkelacker, F. Approaches for Detailed Investigations on Transient Flow and Spray Characteristics during High Pressure Fuel Injection. Appl. Sci. 2020, 10, 4410. https://doi.org/10.3390/app10124410
Kawaharada N, Thimm L, Dageförde T, Gröger K, Hansen H, Dinkelacker F. Approaches for Detailed Investigations on Transient Flow and Spray Characteristics during High Pressure Fuel Injection. Applied Sciences. 2020; 10(12):4410. https://doi.org/10.3390/app10124410
Chicago/Turabian StyleKawaharada, Noritsune, Lennart Thimm, Toni Dageförde, Karsten Gröger, Hauke Hansen, and Friedrich Dinkelacker. 2020. "Approaches for Detailed Investigations on Transient Flow and Spray Characteristics during High Pressure Fuel Injection" Applied Sciences 10, no. 12: 4410. https://doi.org/10.3390/app10124410