
A Novel Whale Optimization Algorithm for the Design of Tuned Mass Dampers under Earthquake Excitations


Facultad de Minas, Departamento de Ingeniería Civil, Universidad Nacional de Colombia, Sede Medellín, Medellín 75267, Colombia
*
Author to whom correspondence should be addressed.
Appl. Sci. 2021, 11(13), 6172; https://doi.org/10.3390/app11136172
Submission received: 28 May 2021
/
Revised: 21 June 2021
/
Accepted: 28 June 2021
/
Published: 2 July 2021
(This article belongs to the Topic Applied Metaheuristic Computing)
Abstract
:Featured Application
Adaptation of Whale Optimization Algorithm (WOA) for optimum design of TMDs. Seismic performance is assessed using real accelerograms and an irregular case study. Effective, fast, and reliable methodology comparing to others in the literature. Practical design recommendations are provided.
Abstract
This paper introduces a novel methodology for the optimum design of linear tuned mass dampers (TMDs) to improve the seismic safety of structures through a novel Whale Optimization Algorithm (WOA). The algorithm is aimed to reduce the maximum horizontal peak displacement of the structure, and the root mean square (RMS) response of displacements as well. Furthermore, four additional objective functions, derived from multiple weighted linear combinations of the two previously mentioned parameters, are also studied in order to obtain the most efficient TMD design configuration. The differential evolution method (DEM), whose effectiveness has been previously demonstrated for TMD applications, and an exhaustive search (ES) process, with precision to two decimal positions, are used to compare and validate the results computed through WOA. Then, the proposed methodology is applied to a 32-story case-study derived from an actual building, and multiple ground acceleration time histories are considered to assess its seismic performance in the linear-elastic range. The numerical results show that the proposed methodology based on WOA is effective in finding the optimal TMD design configuration under earthquake loads. Finally, practical design recommendations are provided for TMDs, and the robustness of the optimization is demonstrated.
1. Introduction
Structural control systems have turned into a standard technology to improve the dynamic response of civil engineering structures subjected to dynamic actions, such as wind forces or earthquake loads [1]. These control systems can be classified into four major groups: passive, active, hybrid, and semiactive controllers. Passive systems are widely accepted by the engineering community because of their mechanical simplicity, low power requirements, and controllable force capacity [2]. Among passive systems, one of the most commonly used and tested devices throughout the years has been the tuned mass damper (TMD). This system consists of attaching an additional mass linked to the main structure using a spring and a viscous damper, which is optimally tuned to one of the fundamental vibration frequencies of the system in order to transfer energy among the vibrating modes by making the structure more flexible [3]. The original TMD formulation was first proposed by Frahm in [4] as a vibration absorber with no damping to control periodic resonance vibrations. Subsequently, Ormondroyd and Den Hartog [5] developed the theory of vibration absorbers, including viscous damping to the system to be effective under different frequencies of random vibrations. Conventional tuning methodologies have been proposed thereafter, considering the harmonic loads, and random stationary and nonstationary white noise processes for single degree of freedom systems [6,7,8,9].
The first full-scale implementations of TMDs were aimed to control dynamic displacements caused by wind-induced vibrations. In that sense, TMDs have been deployed in several structures around the world, including the Centre Point Tower in Sydney, the Citicorp Center in New York, the Chiba Port Tower in Japan, the CN Tower in Canada, and, more recently, the Taipei 101 tower in Taiwan [10,11]. Several variations based on the conventional TMD formulation have been studied and applied thereafter, including pendulum-tuned mass dampers (PTMD) [12,13,14], tuned liquid column dampers (TLCD) [15,16,17], bidirectional TMDs [18] and hybrid, semi-active, and active TMDs [19,20,21]. However, some early investigations concluded that TMDs were not effective in reducing the response of buildings subjected to seismic excitation [22,23], which was due to two principal reasons. First, the limitations associated with the amount of mass added to the structural system, and, more importantly, that conventional TMDs can suppress effectively a single vibration mode. Instead, wide-band multi-modal damping can be achieved by complex systems, such as nonlinear TMDs [24,25], multiple positioned TMDs [26], or the amplification of the inertial mass in conventional TMDs using inerter devices (TMDIs) [27,28,29].
In spite of this, since the early 2000s, some researchers have proved the effectiveness of numerical iterative methods in the tuning of linear mass dampers for seismic applications. Classic techniques have been used for that purpose, such as minimax optimization [30], response surface methodology [31], and nonlinear gradient-based optimization [32]. Moreover, conventional population-based metaheuristics and evolutionary algorithms have been used to improve the computational efficiency in the tuning procedure; among them, particle swarm optimization [33,34]. harmony search [35,36,37,38,39,40], ant colony [41,42], flower pollination algorithm [43,44,45], bat algorithm [46], cuckoo search [47], genetic algorithms [48,49,50], and, more recently, chaotic optimization [51]. Furthermore, various of these investigations have included the effects of dynamic soil–structure interaction (SSI) [52,53,54,55]. Even though the tuning of linear TMDs on single degree of freedom systems is a very well addressed problem in the literature, most of these works were based on the assumption that closed-form expressions, like those presented in [6,7,8,9], are not valid for multi-degree of freedom systems subjected to actual seismic loads. On the contrary, the usage of metaheuristic techniques or evolutionary algorithms allows the best-fit design variables for linear TMDs to be determined, using actual accelerograms as input excitations.
In that sense, this study introduces a novel methodology for the optimal design of passive TMDs located at upper levels of high-rise buildings to improve the seismic safety of structures based on the Whale Optimization Algorithm (WOA) [56]. The algorithm is modified to reduce the maximum horizontal peak displacement of the structure, and the root mean square (RMS) response of displacements as well. Moreover, four additional objective functions, derived from multiple weighted linear combinations of these parameters, are also studied in order to obtain the most efficient TMD design configuration. The results from the WOA optimization are compared with the differential evolution method (DEM) [57], whose effectiveness has been demonstrated extensively for TMDs and TMDIs seismic applications in previous works [58,59], and an exhaustive search (ES) process with precision to two decimal positions. Then, the proposed methodology is applied to a 32-story case-study derived from an actual building structure, and various accelerograms of recorder earthquakes are considered to assess its seismic performance in the linear-elastic range. The results of the study show a large enhancement in the dynamic response of the building controlled by the WOA designed TMDs, achieving reductions in the maximum floor displacements of up to 43%. Finally, an attempt to establish a single set of design parameters for TMDs based on the methodology proposed by Fallah and Zamiri [60] is implemented to verify the robustness of the optimization.
2. Equations of Motion of n-DOF Building Structures Controlled via TMDs for Seismic Applications
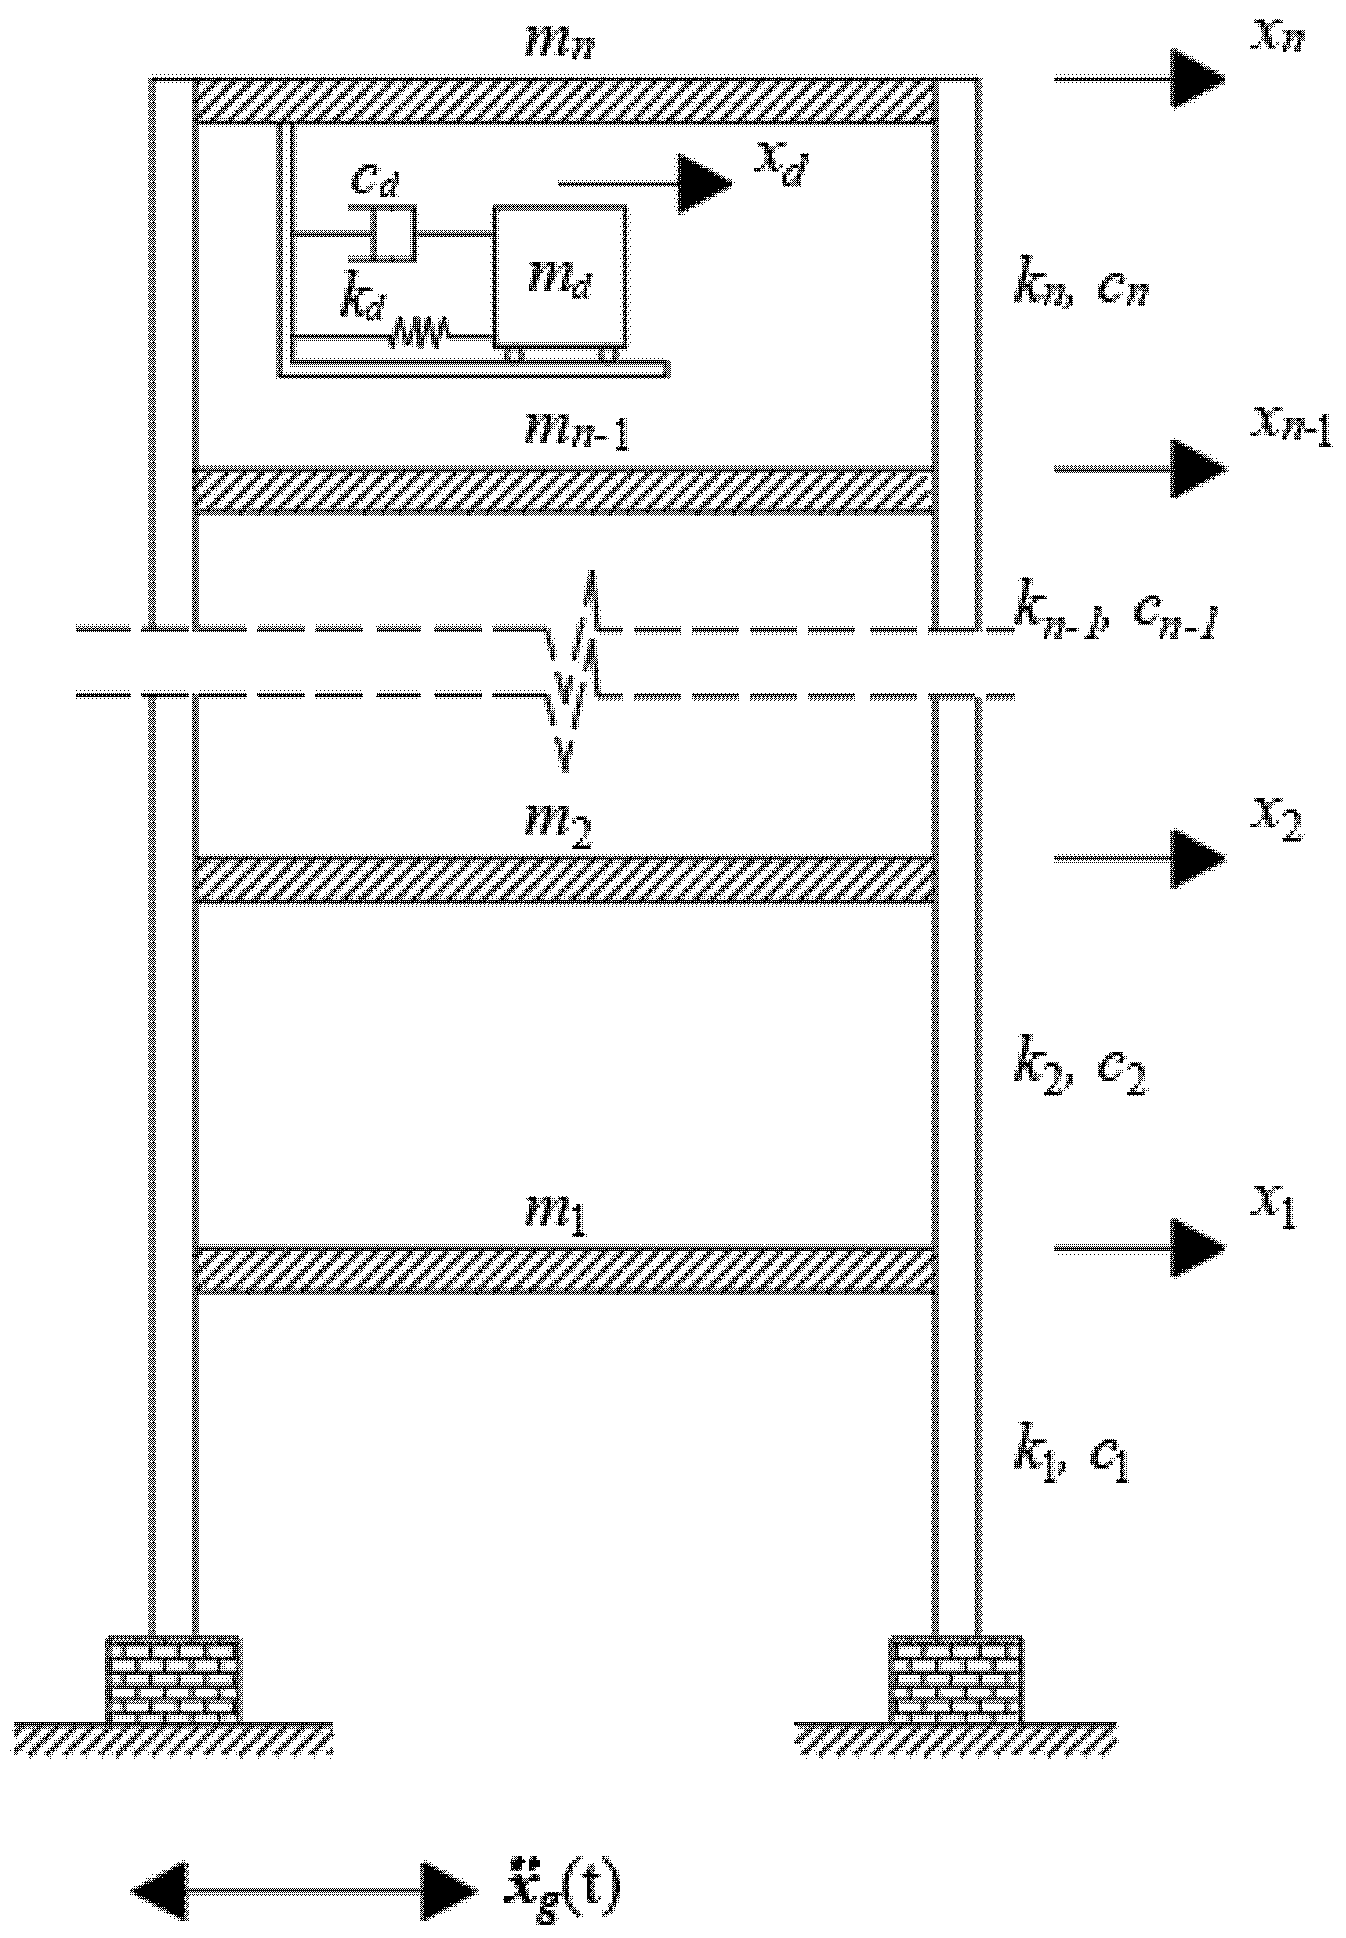
The equations of motion that govern the behavior of the n-DOF structural system equipped with a TMD located at the top floor of the building are deduced from the scheme depicted in Figure 1. The displacement at each story-level is represented by xi, while the stiffness, damping, and mass coefficients of each story-level of the building are defined as ki, ci, and mi, respectively. Besides, the TMD action is introduced as an extra DOF represented by xd, while the stiffness, damping, and mass parameters are identified as kd, cd, and md, respectively.
Subsequently, the structural system controlled via TMD can be modeled as a set of n + 1 degrees of freedom, whose equation of motion can be expressed as:
where, x(t), ẋ(t), and ẍ(t) are the n + 1-order vectors of displacement, velocity, and acceleration of the system; 1 is a unit vector, and ẍg(t) denotes the ground acceleration over time. On the other hand, the matrices M, C, and K represent the mass, damping, and stiffness matrices of the system, which can be expressed as:
It should be noted that matrices (2) to (4) are idealized as tridiagonal stiffness matrices typical of shear frame structures. Nevertheless, the main purpose of these mathematical expressions is to illustrate the inclusion of the TMD effect on a linear structural system with n horizontal degrees of freedom, and, therefore, it can be extended to other structural models such as 2-dimensional frames derived from actual building numerical models with a static condensation applied to all other vertical and rotational degrees of freedom. Now, the equation of motion of the system is modified to a space–state representation to determine the dynamic response of the linear system. Hence, the state vector z(t) is introduced as:
The above-mentioned vector involves the displacements and velocities of the controlled system. By deploying Equation (1), the state–space representation of the structural system controlled by TMD can be written as:
where 0 and I denote a zero matrix and an identity matrix, respectively. Subsequently, Equation (6) is rewritten as:
where A represents the transition state matrix, and B the location adjustment matrix of the external excitation in the structural system:
Taking inspiration from the tuning process of TMDs on single degree of freedom systems, and to simplify the optimization process, the kd and cd parameters can be rewritten as:
with ωs as the natural frequency of the structural system and f and ζd as the dimensionless frequency and damping ratios to be optimized. The reference value ωs will be assumed in this investigation as the corresponding frequency to the first vibration mode of the structure. Nevertheless, this is just an assumption to reduce significantly the search domain of the variables kd and cd since the optimization problem is focused on the tuning problem for TMDs on multi-degree-of-freedom systems.
3. Whale Optimization Algorithm
The Whale Optimization Algorithm (WOA) is a swarm-based metaheuristic recently proposed by Mirjalili and Lewis in [56], who developed the algorithm by taking inspiration from the bubble-net hunting strategy typically employed by humpback whales. In the last few years, other researchers have applied multiple modifications to the algorithm in order to solve various engineering optimization problems. For instance, Kaveh and Ghazaan [61] studied the sizing optimization of skeletal structures, Chen et al. [62] solved bar truss design and I-beam design problems, and Azizi et al. [63] optimized a fuzzy controller for seismically excited nonlinear structures.
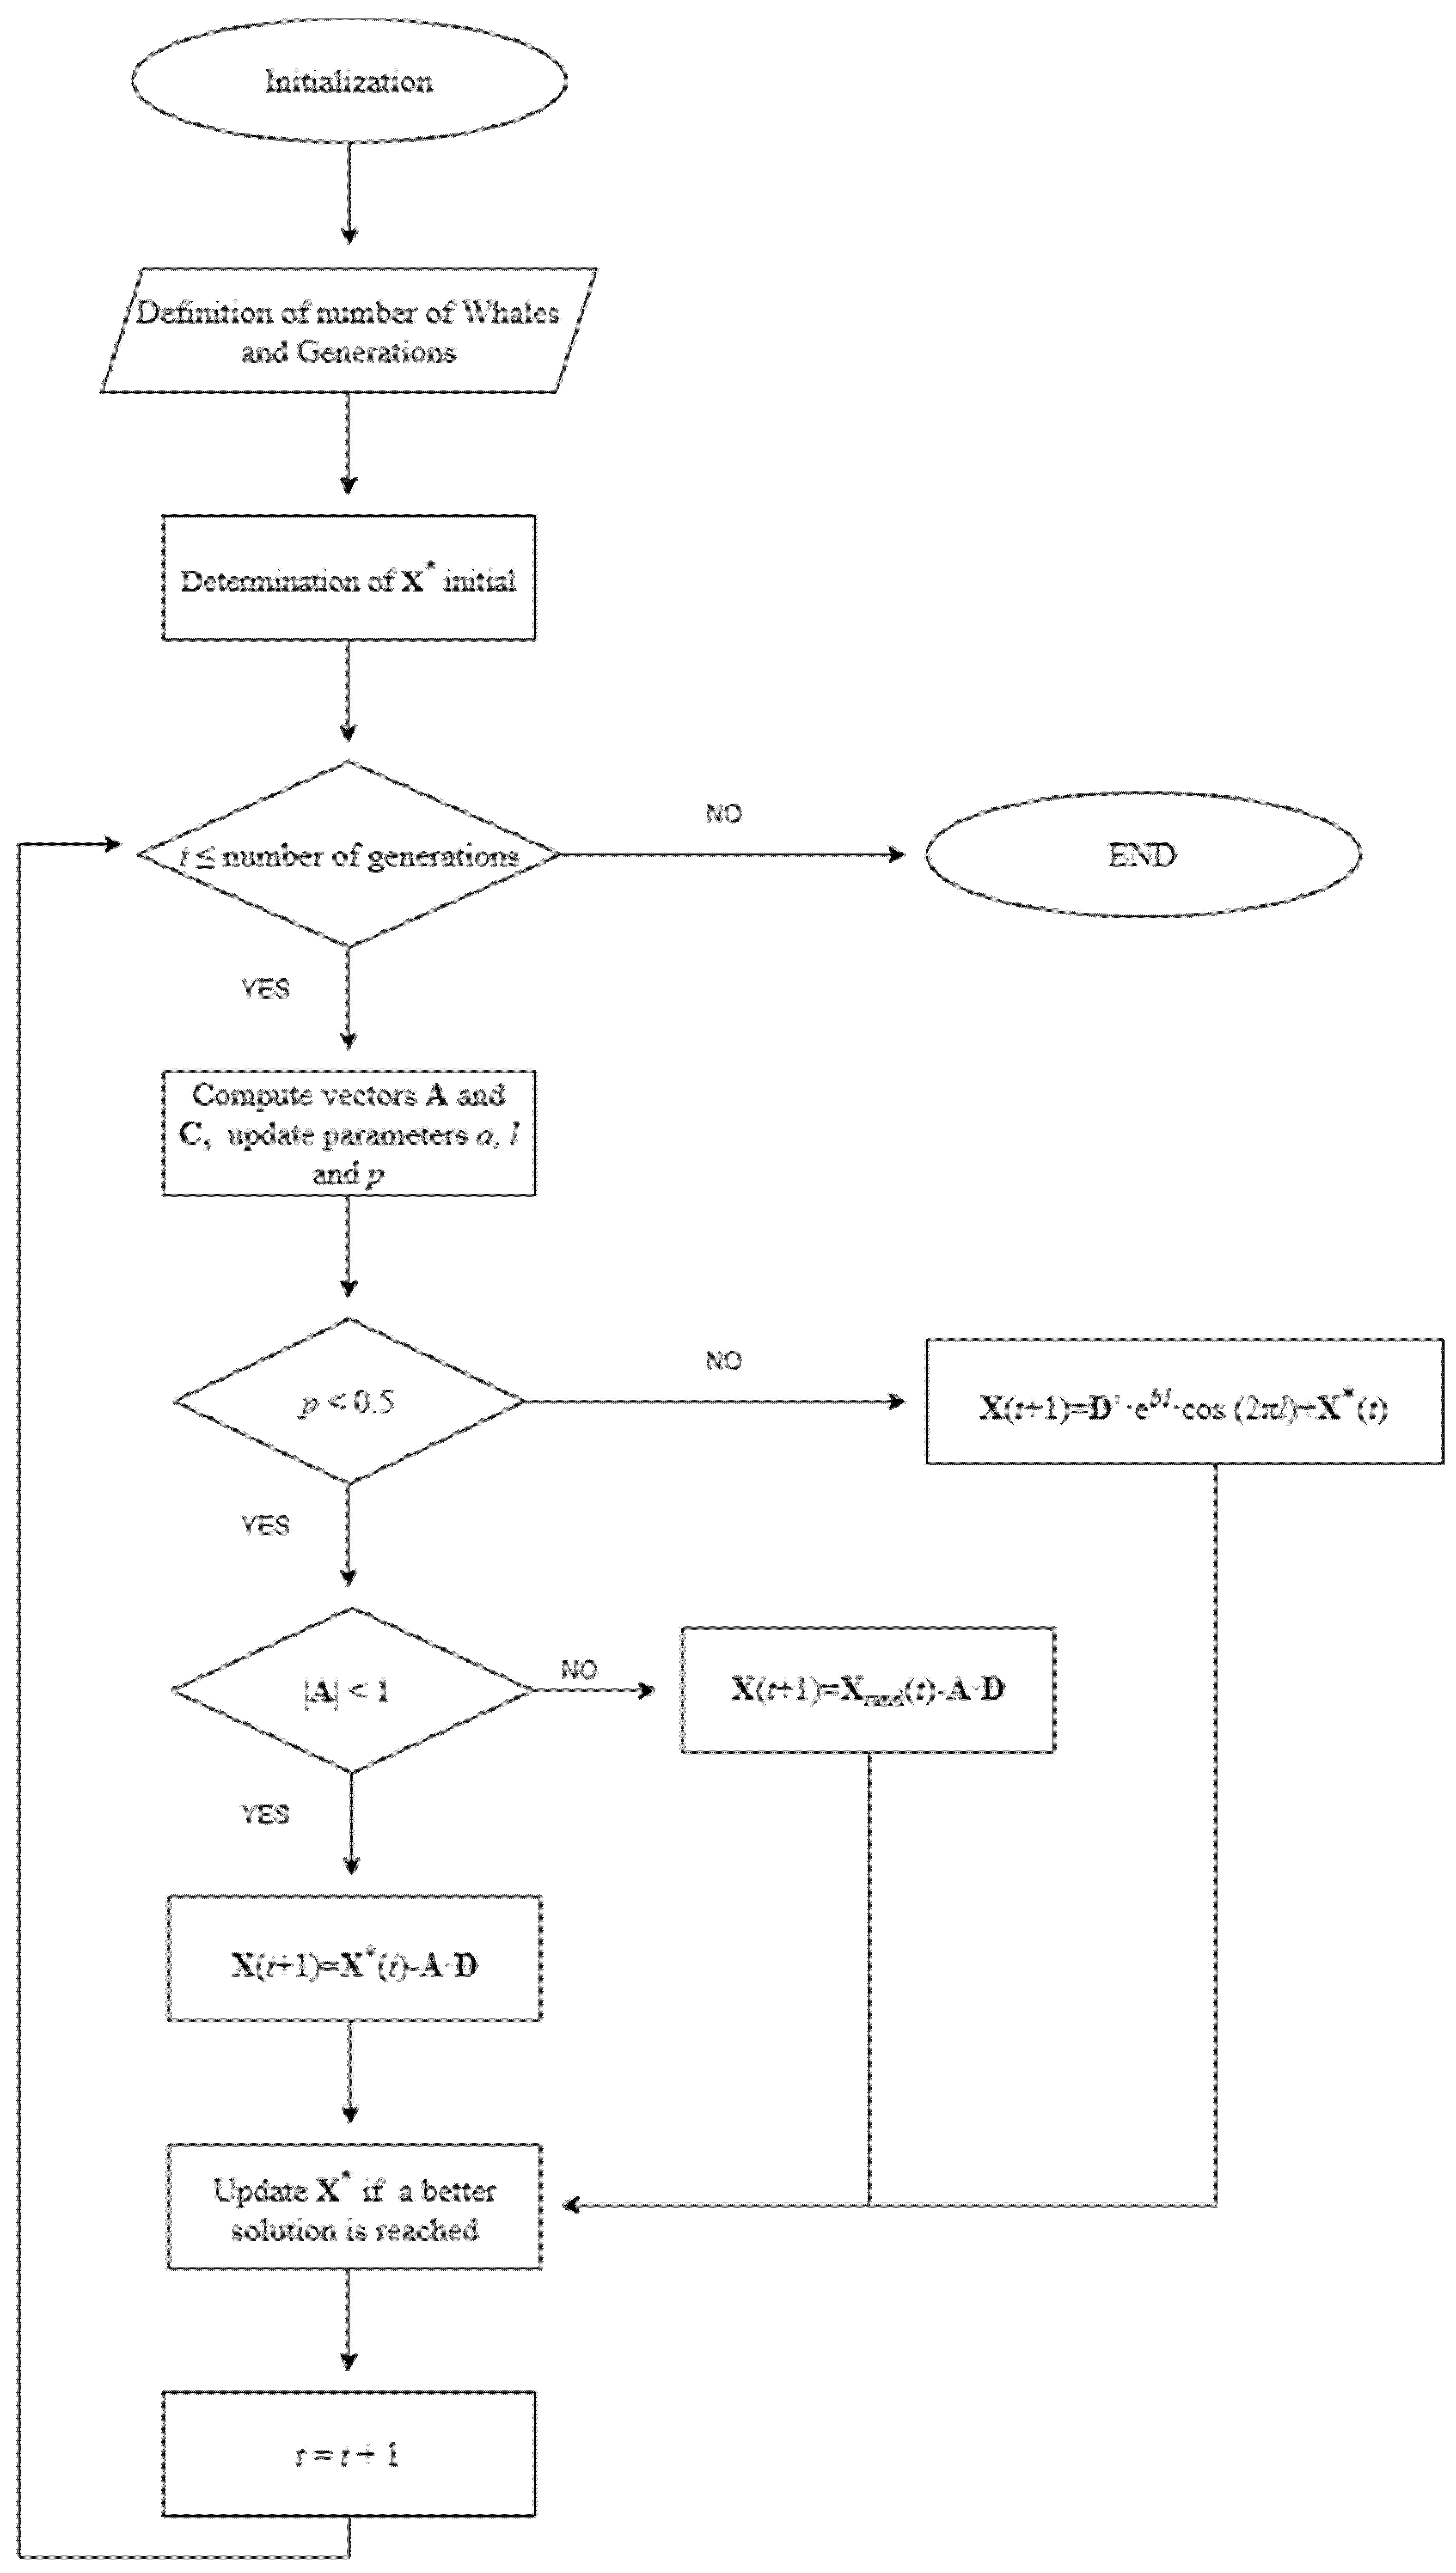
WOA strategy first defines a population of whales and evaluates a set of random solutions according to both the position of each whale and a certain objective function. By comparing the primary random solutions, WOA selects an initial best search agent. In each iteration, whales update their position with respect to either a randomly chosen search agent or the best solution obtained so far. Then, the new positions are calculated according to Equations (12) and (13):
where w is the current whale generation, and X* is the updated position vector of the best solution. In addition, the coefficient vectors Ψ and Γ are calculated as follows:
with r as a random value in the domain (0, 1). Besides, a denotes a sequentially decreasing number from 2 to 0 as whales generation w increases, to provide exploration and exploitation.
According to Mirjalili and Lewis [56], a random search agent is chosen when |Ψ| ≥ 1, while the best solution is selected when |Ψ| < 1 for updating the position of the search agents. The bubble-net feeding behavior of humpback whales serves as an inspiration to update the position of the search agents. It is assumed that there is the same probability of selecting between either a shrinking encircling mechanism or a spiral model, to improve the position of the search agents during the optimization procedure and get closer to the optimal solution. This concept is mathematically formulated as:
where b is a constant that defines the shape of the logarithmic spiral; l is a random number in the space (−1, 1); p is a random probability in (0, 1). In the adaptation of the algorithm, the constant b was set to 1 following the recommendations provided in [61,62,63]. On the other hand, the l and p parameters are chosen randomly in their respective domain for every generation w, in order to avoid convergence at local minimums and to improve the efficiency of the algorithm. Finally, Δ′ defines the distance of the ith whale to the best solution obtained so far, which could be calculated as:
Six objective functions are proposed in the optimization process to diminish the dynamic response of the structure when it is subjected to seismic excitations. These functions are associated with the reduction of the maximum horizontal peak of displacement of the structure, and the reduction of the root mean square (RMS) values of displacements. Certainly, there are other critical parameters to be analyzed in a robust structural design, such as inter-story drifts and peak floor accelerations, which are closely related to structural damage. Nevertheless, the criteria for selecting the horizontal peak displacements and RMS values of displacements as critical parameters in the tuning procedure responds to two principal reasons. Firstly, the reduction of absolute displacements in the objective functions contributes directly to diminishing the inter-story drift values and, more importantly, the main objective of this research is to propose a novel tuning methodology based on WOA, as well as proving its efficiency over other optimization techniques [30,31,32,33,34,35,36,37,38,39,40,41,42,43,44,45,46,47,48,49,50,51,52,53,54,55]. Moreover, the usage of multiple functions aims to determine which of these objective functions is more efficient, based on the evaluation and comparison on the decrease in the response of both previously mentioned parameters.
In that sense, the objective functions OA1 and OA2 correspond to the reduction of the maximum horizontal peak displacement in the entire structure, and the decrease in the RMS values of displacements, respectively:
Regarding the remaining four objective functions, these are defined as a variable weighted linear combination of the relationships between the above-mentioned parameters in Equations (18) and (19). These functions are defined as J1, J2, J3, and J4, and are described through expression (20):
where . denotes the uncontrolled response of the structure at the n degree of freedom of the structure, introduced to normalize the values of Ji function. Different from OA1 and OA2 functions, in which absolute values can be used to analyze the numerical results computed from the optimization process, the function Ji combines horizontal peak displacements and RMS values of displacements which are commonly different in magnitude. Hence, both values must be normalized to be properly weighted and combined thereafter.
The TMD tuning procedure in multi-degree of freedom systems is a two-dimensional optimization problem focused on finding the optimal kd and cd values for a fixed mass ratio (μ). As mentioned in Section 2, the optimization process is simplified by the inclusion of Equations (10) and (11). Hence, WOA is programed to find the optimal f and ζd values in the domain:
4. Numerical Example
In this section, the proposed methodology is applied to a 32-story case-study derived from an actual building in Medellin city, Colombia. The structure has a total elevation of 97 m, and the lateral force-resisting system consists of resistant moment frames. Besides, the structure has an irregular L-shape configuration in-plan, which makes it more vulnerable to seismic damage. The resulting mass, and stiffness matrix are 32 × 32 size, obtained by assuming in-plane infinitely rigid floor diaphragms and applying static condensation on the remaining vertical and rotational degrees of freedom. A complete characterization of the case-study can be found in the work presented by Caicedo et al. in [59]. Once the design parameters computed through WOA have been compared with the differential evolution method (DEM) and an exhaustive search (ES), the structural system is subjected to the action of the ground acceleration records used in the optimization process to assess its seismic performance by considering only the linear-elastic behavior of the structure. Then, the methodology proposed by Fallah and Zamiri [60] is adopted, in which, through a weighting procedure, a unique set of tuning parameters for a fixed µ value is proposed to verify the robustness of the design under different records than those used in the optimization process.
4.1. Benchmark Records
Four widely known accelerograms in the literature of recorded earthquakes were downloaded from the Pacific Earthquake Engineering Research (PEER) Centre database [64] to simulate the seismic action in the optimization process. The four records are labeled and described in Table 1.
The four accelerograms listed in Table 1 correspond to historical ground motions from different locations and, certainly, all four records present very different dynamic characteristics. Moreover, it is impossible to know a priori future ground motions that will affect the structural system. Therefore, it should be clarified that the intention of this research is not to reproduce a realistic tuning process for TMDs subjected to earthquake loads; on the contrary, and as with other recently proposed methodologies [44,45,46,51,58,59], this paper’s purpose is to prove the efficiency of the WOA to find the best-fit design variables for TMDs to improve the dynamic response of multi-story structures using actual accelerograms as input excitations, and examine extensively the dynamic behavior of the structure under the action of such accelerograms.
4.2. Calibration of the Algorithm
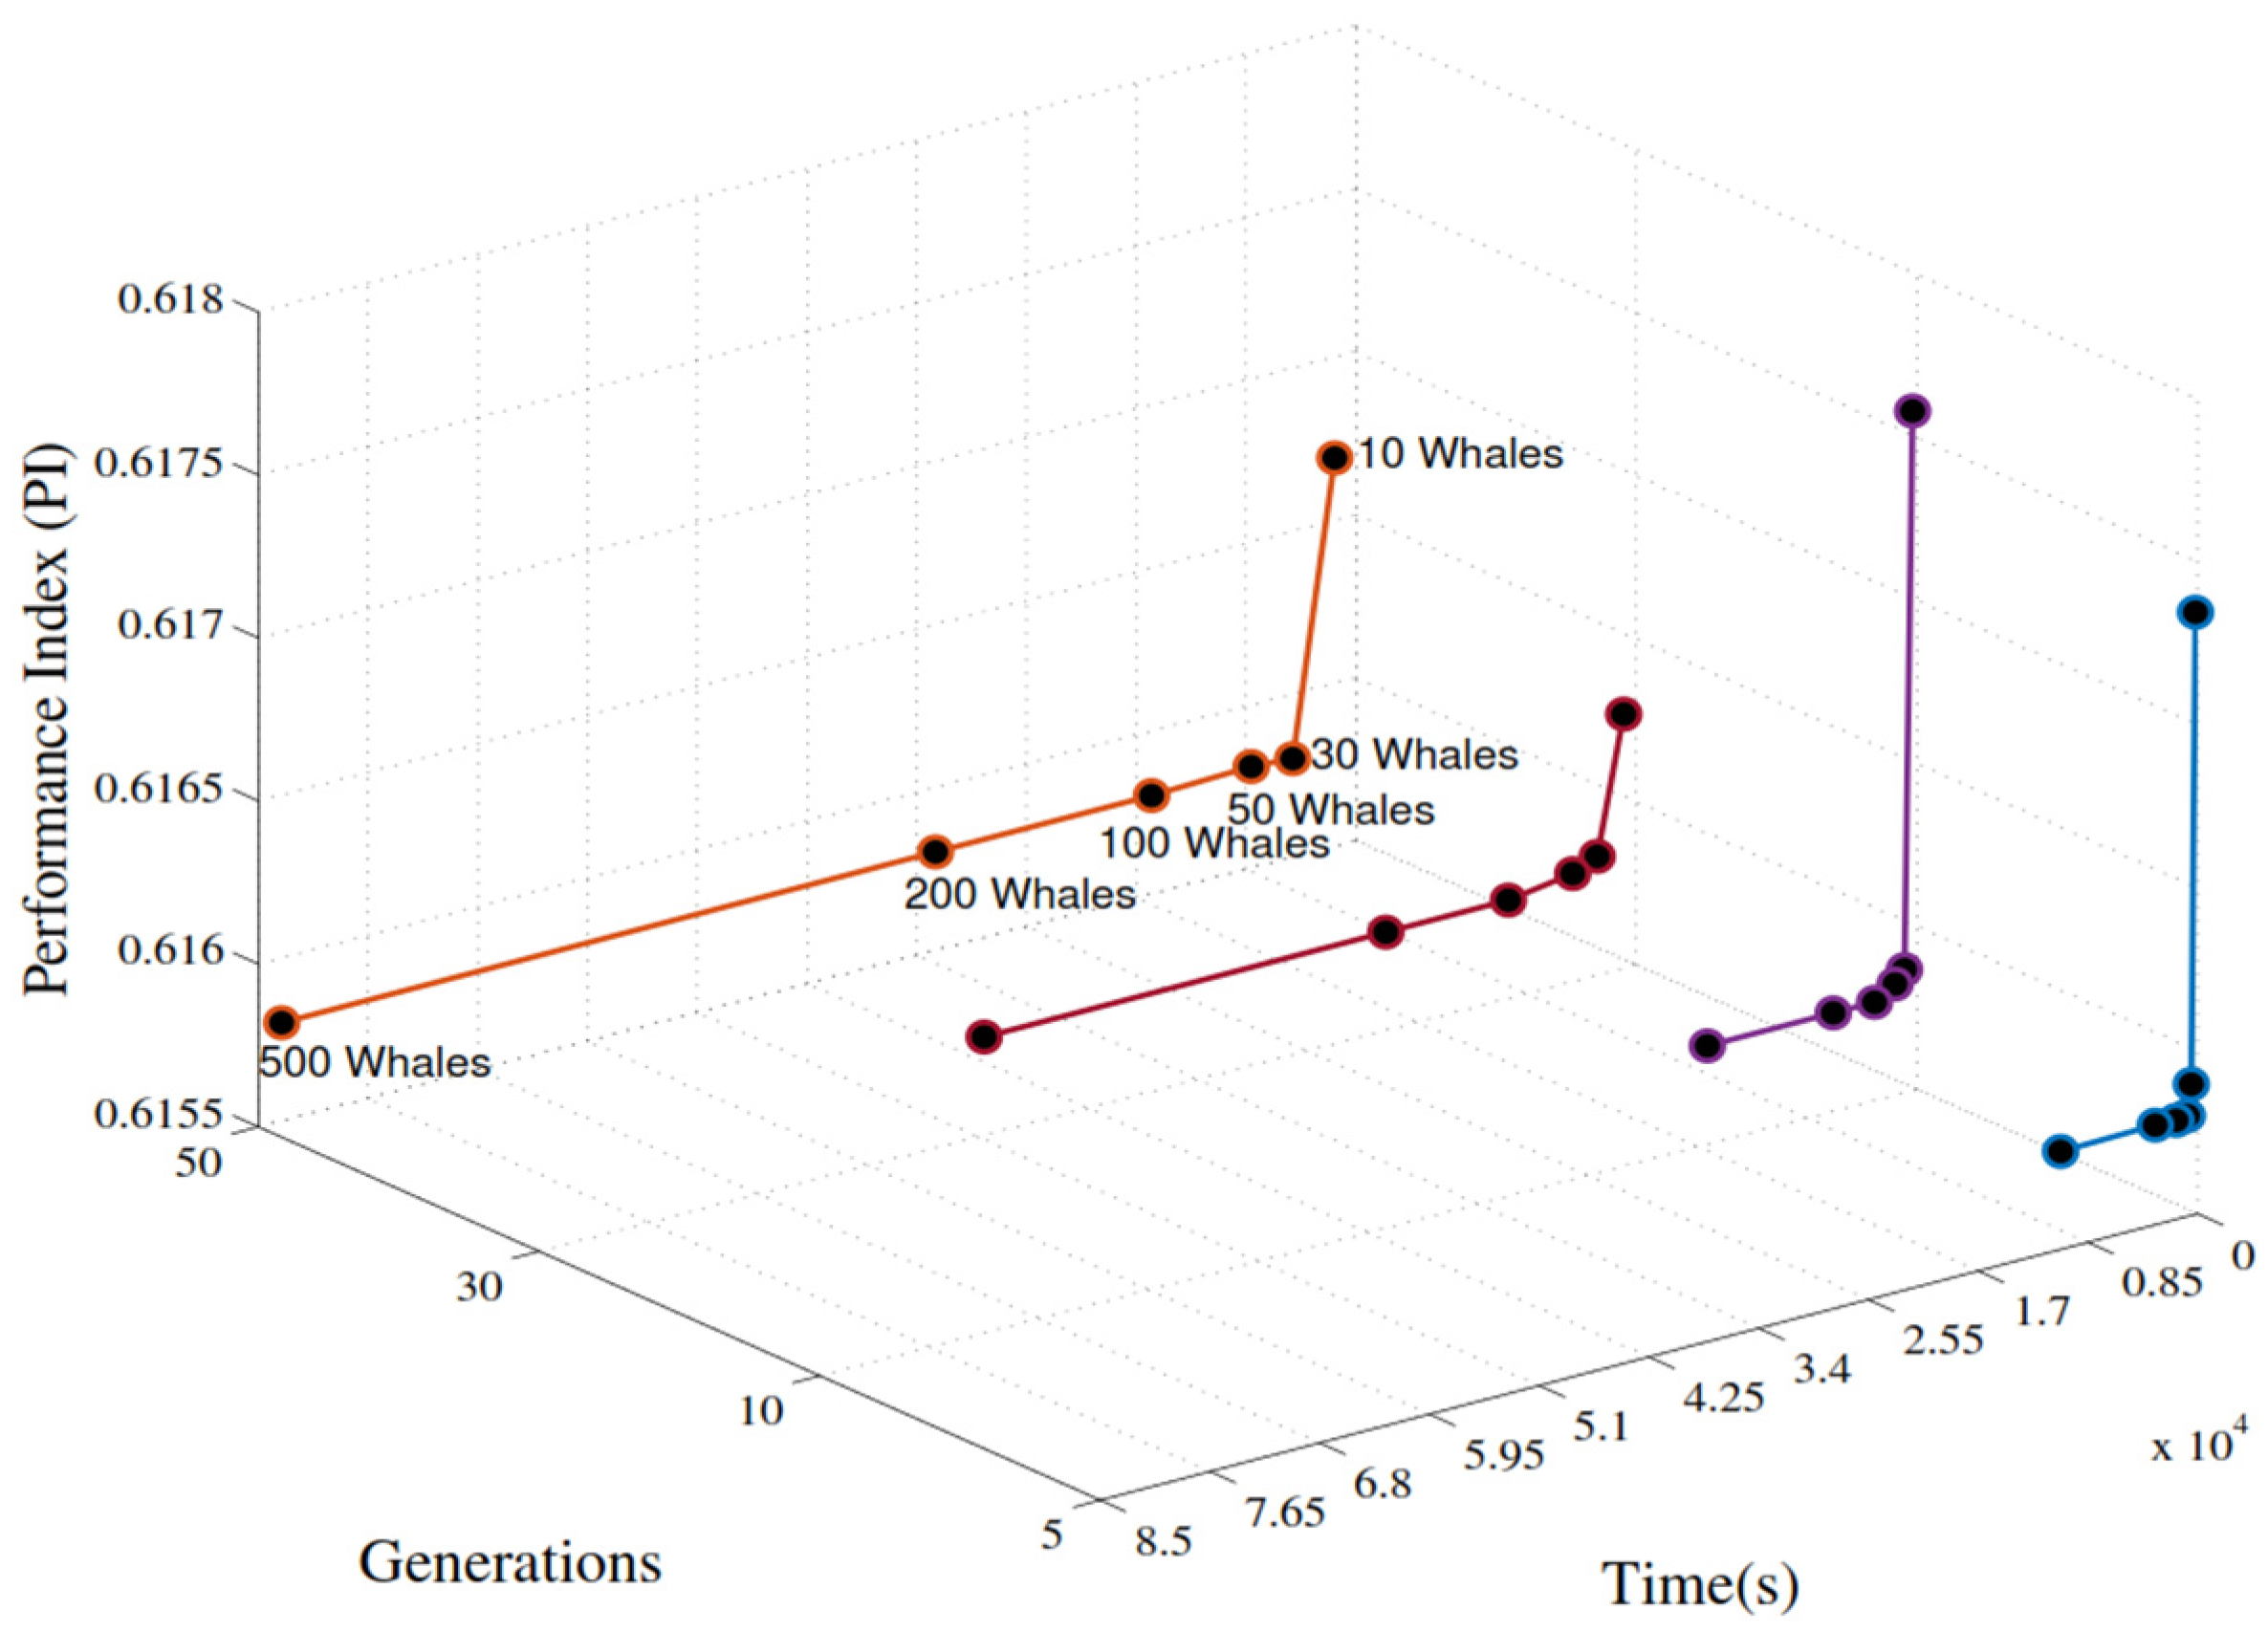
The main challenge of adapting the WOA methodology is to find a balance between the algorithm performance and the processing time. In that sense, multiple numerical simulations were carried out for the case study, using the objective function J1 and the Kobe excitation. Alternatives of 10, 30, 50, 100, 200, and 500 whales combined with 5, 10, 30, and 50 iterations were considered. Figure 3 depicts the performance index (PI), defined as the ratio between the maximum controlled and uncontrolled response of the system, and the processing time for every simulation.
Furthermore, Table 2 reports the design parameters calculated for each alternative, as a complement to the information detailed in Figure 3.
Based on the results presented in Figure 3 and Table 2, it is possible to state that, in terms of performance and time, the most attractive optimization alternatives are those that use five generations and 50 whales (Alternative A), and 10 generations and 30 whales (Alternative B). Comparing the performance of alternatives A and B with the one that presents the best PI reduction, which corresponds to 50 generations and 500 whales (alternative C), diminutions in the processing time of 98.98% and 98.82%, respectively, are obtained. In the same way, the differences in the PI values of alternatives A and B compared with alternative C are 0.0119% and 0.0124%, respectively. Considering these data and taking into account the stability of the methodology by employing a larger number of generations, alternative B is adopted in this work for the determination of optimal design parameters of TMDs.
4.3. Optimization Results
Table 3 presents the tuning parameters and the processing time for every iteration found for objective functions OA1 and OA2, and mass ratios μ = 0.02 and μ = 0.05, by applying the WOA methodology proposed herein. Additionally, a comparison is made with the DEM and an ES process with precision to two decimal positions. It should be noted that DEM has proved to be effective in solving the tuning problem of TMDs and TMDIs under actual earthquake excitations [58,59]; thus, it was selected to validate the WOA optimization results. Moreover, the work of Caicedo et al. [58] demonstrated the feasibility of DEM over other conventional tuning methodologies considering harmonic loads [6], white noise processes [7,8], and frequency domain analysis [9]. Similarly, Table 4 shows ζd and f parameters derived from J1, J2, J3, and J4 approaches.
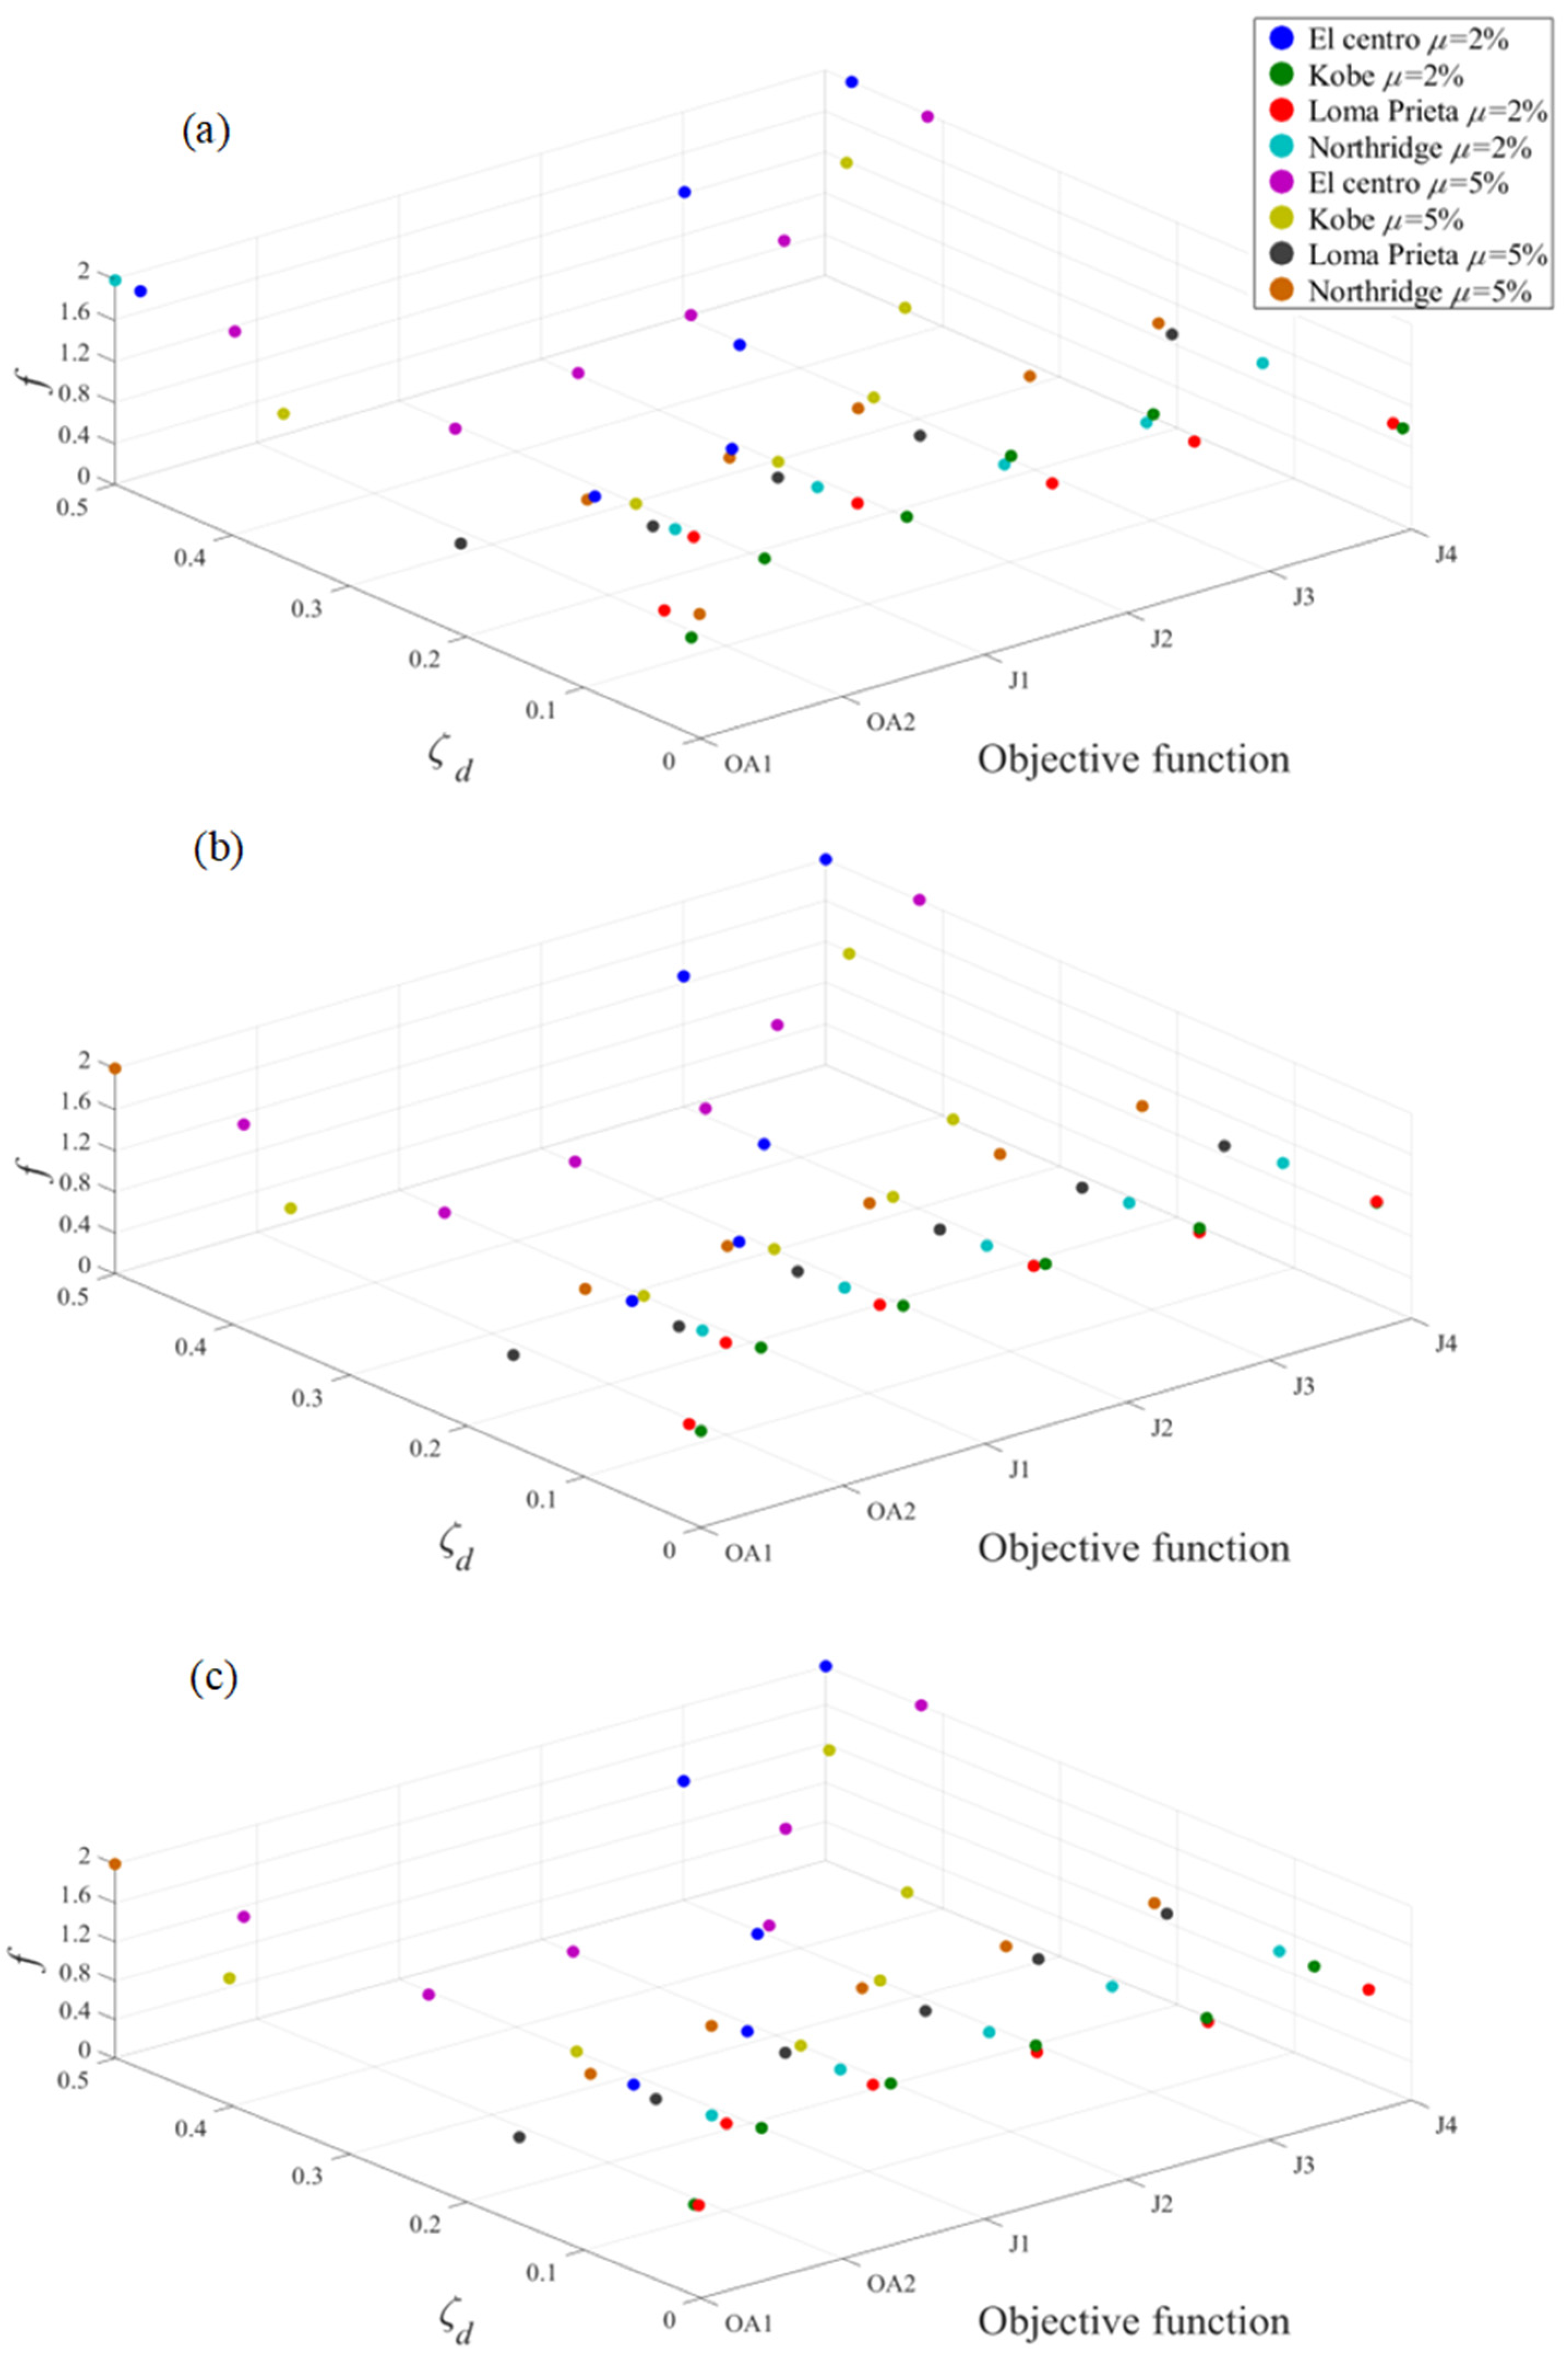
As expected, the results computed by WOA and the other two comparison methodologies show correspondence. From Table 3 and Table 4, it can be observed that some of the design variables approach the limits established previously in Equations (21) and (22). Such results are not realistic from a practical point of view, but they may be attributed to the impulsive nature of some of the seismic records used in the optimization process. However, in all cases the results are in excellent agreement with those computed through the DEM and the ES process, showing small differences from the third decimal position, which has no influence on the global response of the structural system. Furthermore, the numerical results reported by other works in which actual seismic records were used as excitation inputs [46,58,59,65] exhibited a similar trend, since some of the optimal values are also close to the bound limits defined for the optimization process. On the other hand, WOA exhibits notable advantages against ES and DEM, among them, less computational cost avoiding operations, like mutation or crossover, and reductions up to 45% in the processing time, approximately (see Table 3 and Table 4). Figure 4 illustrates the dispersion of optimal design values derived from the three optimization methodologies and the six objective functions used in this investigation.
4.4. Seismic Performance
Now, the seismic performance of the building is evaluated under the action of the four seismic records used in the optimization process. It is worth noting that the scope of this investigation is limited to the linear behavior of the structural system. Thus, the numerical model does not take into account any type of damage or yielding process affecting the structure. Furthermore, the computed displacements are presumable within the elastic behavior of the system.
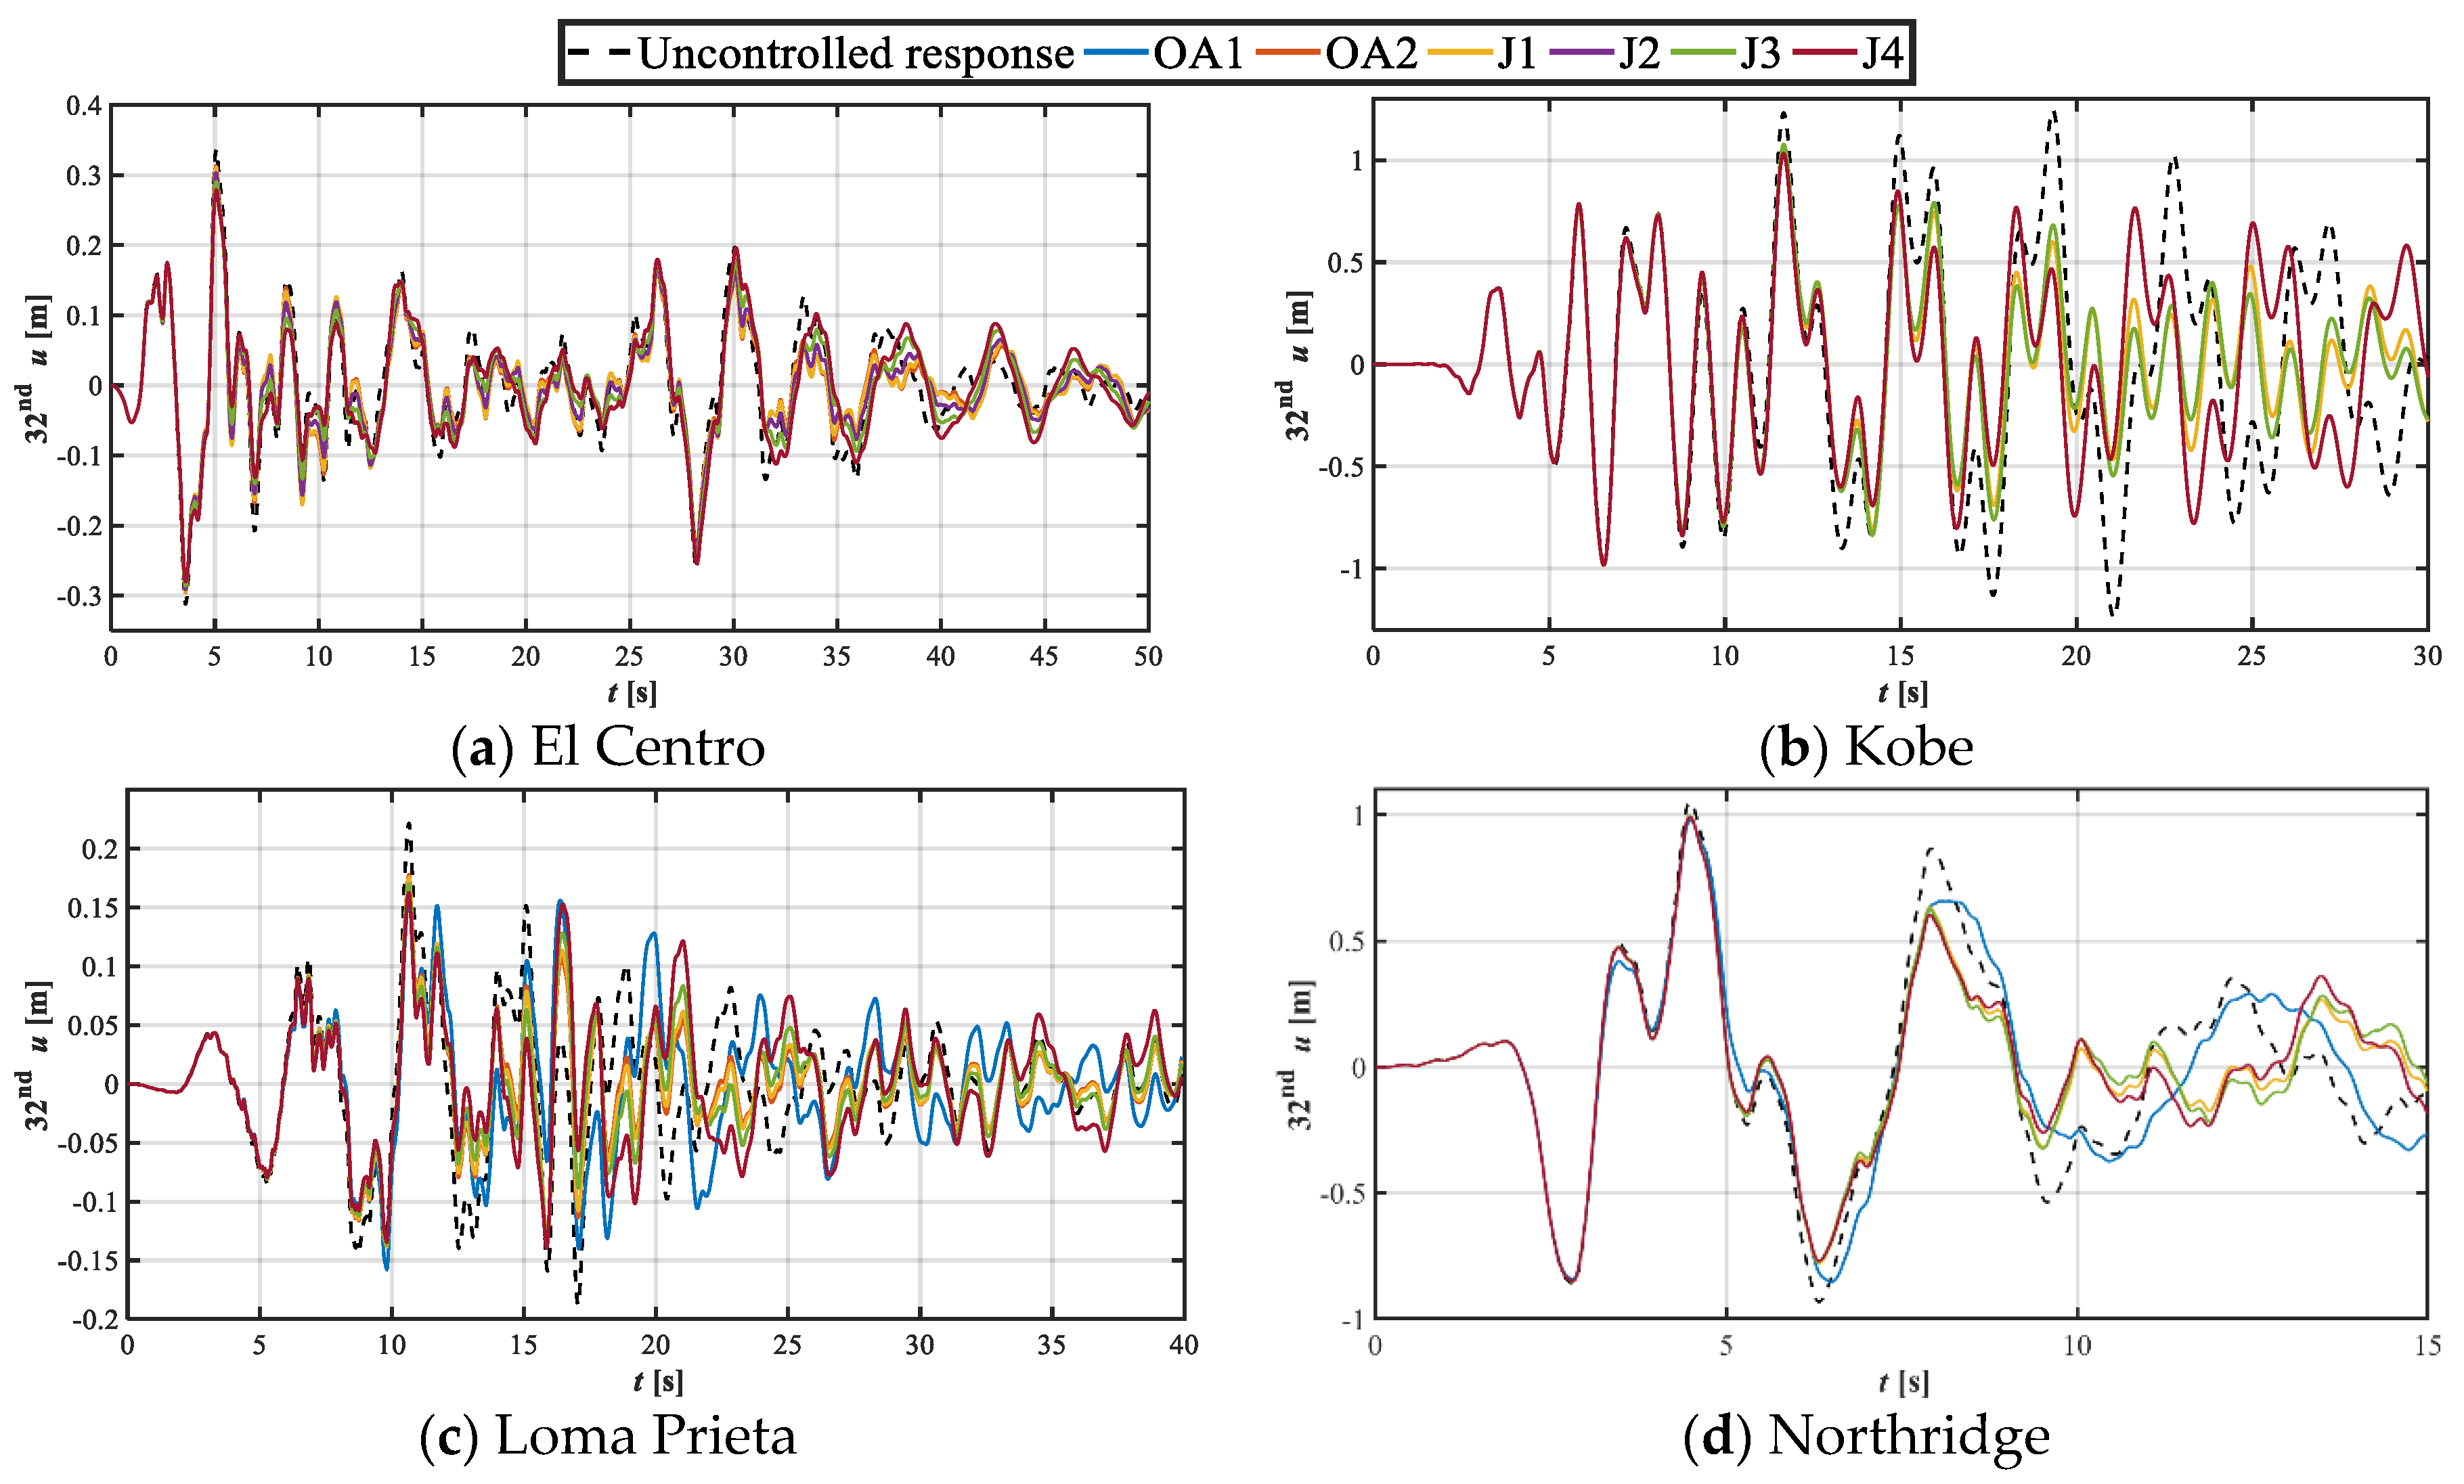
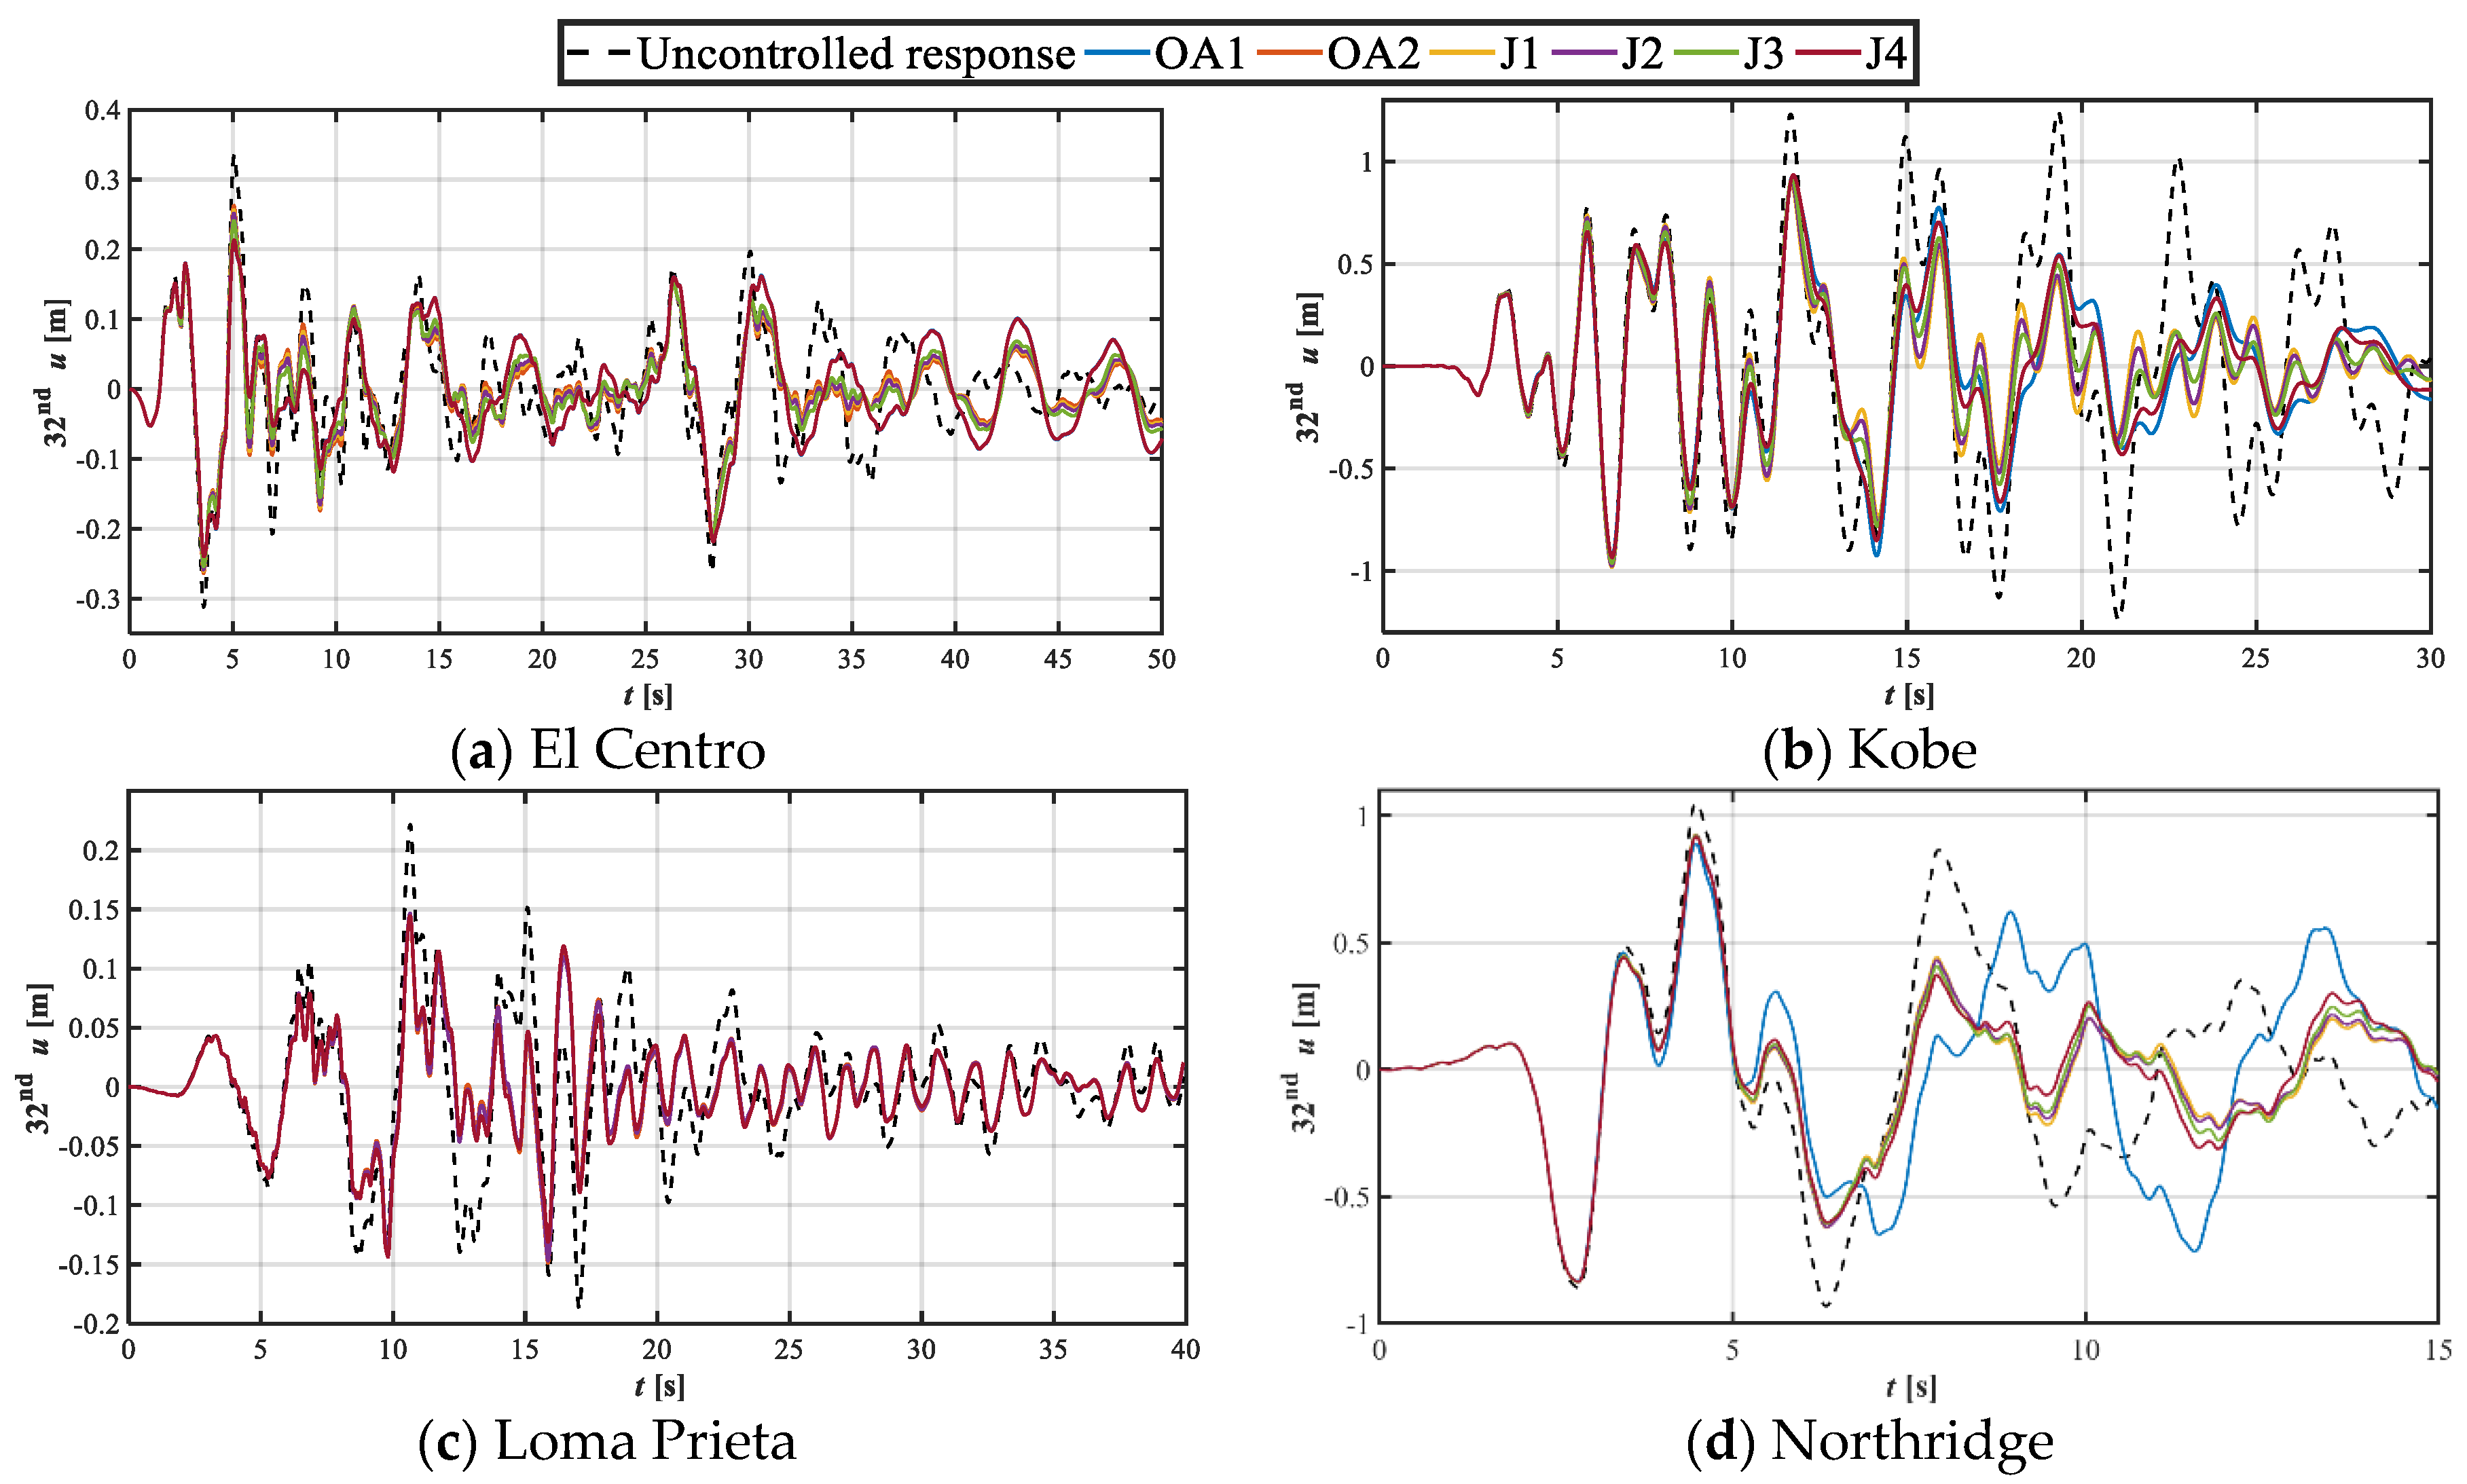
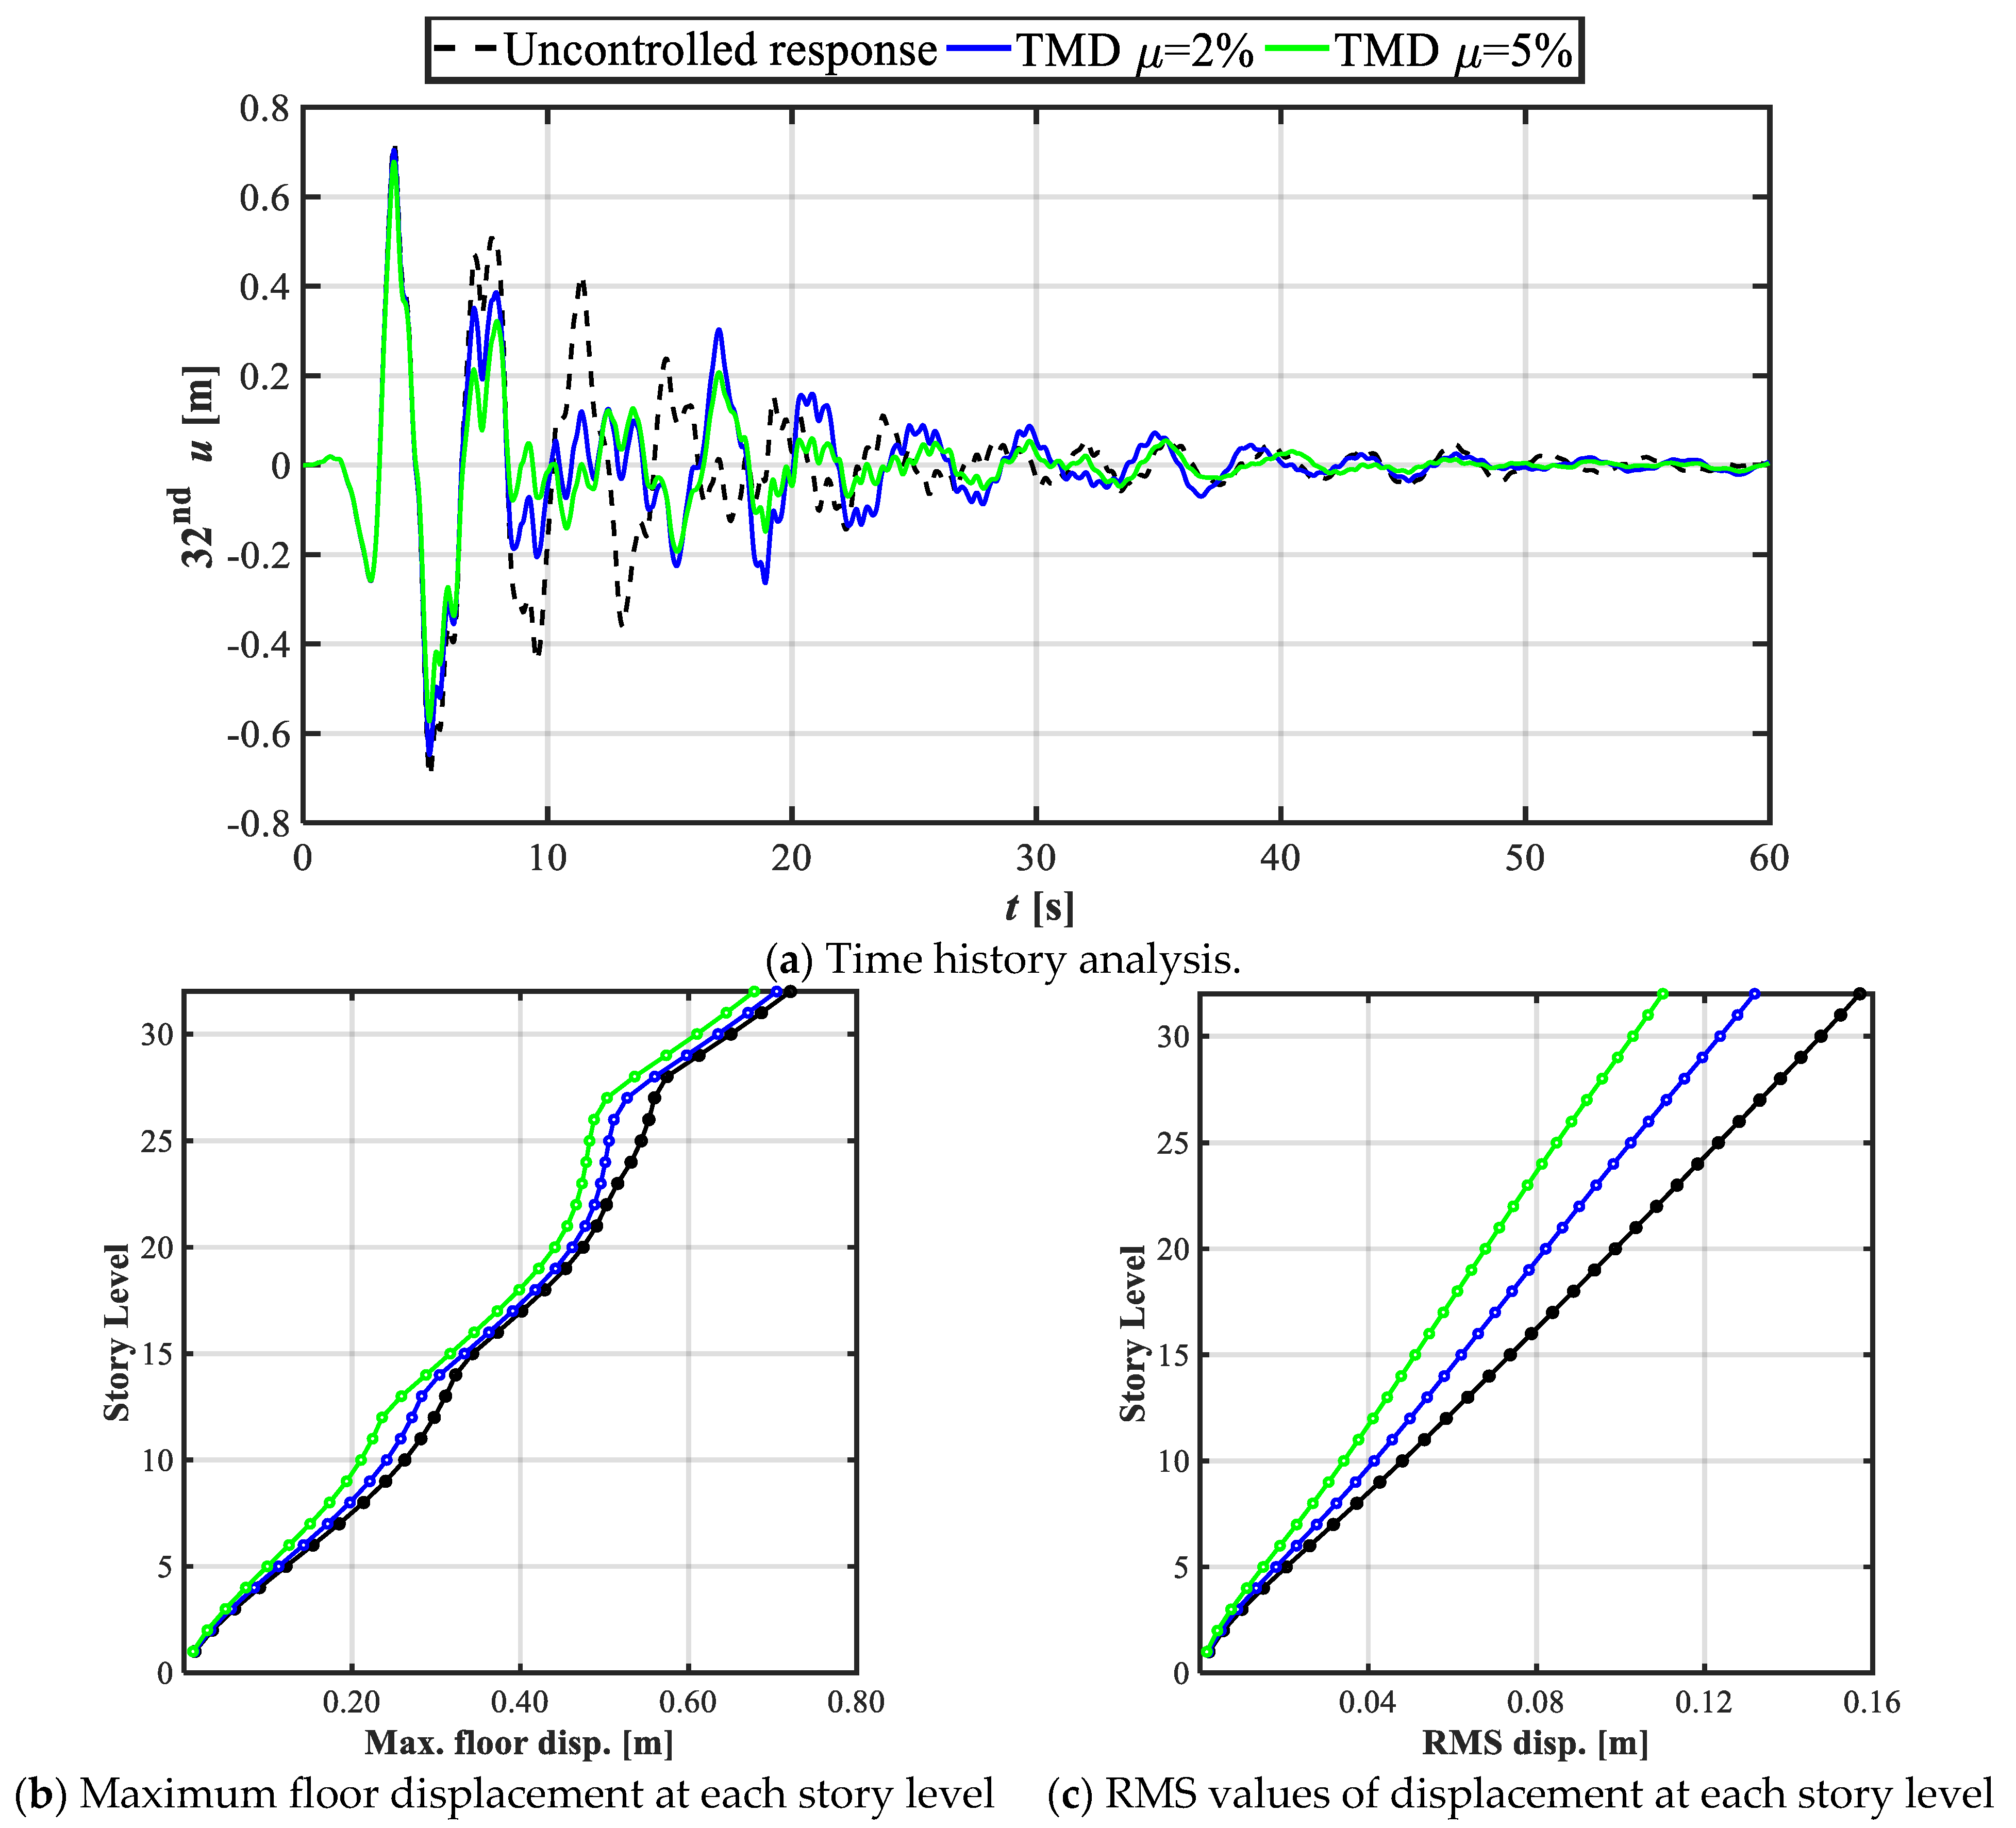
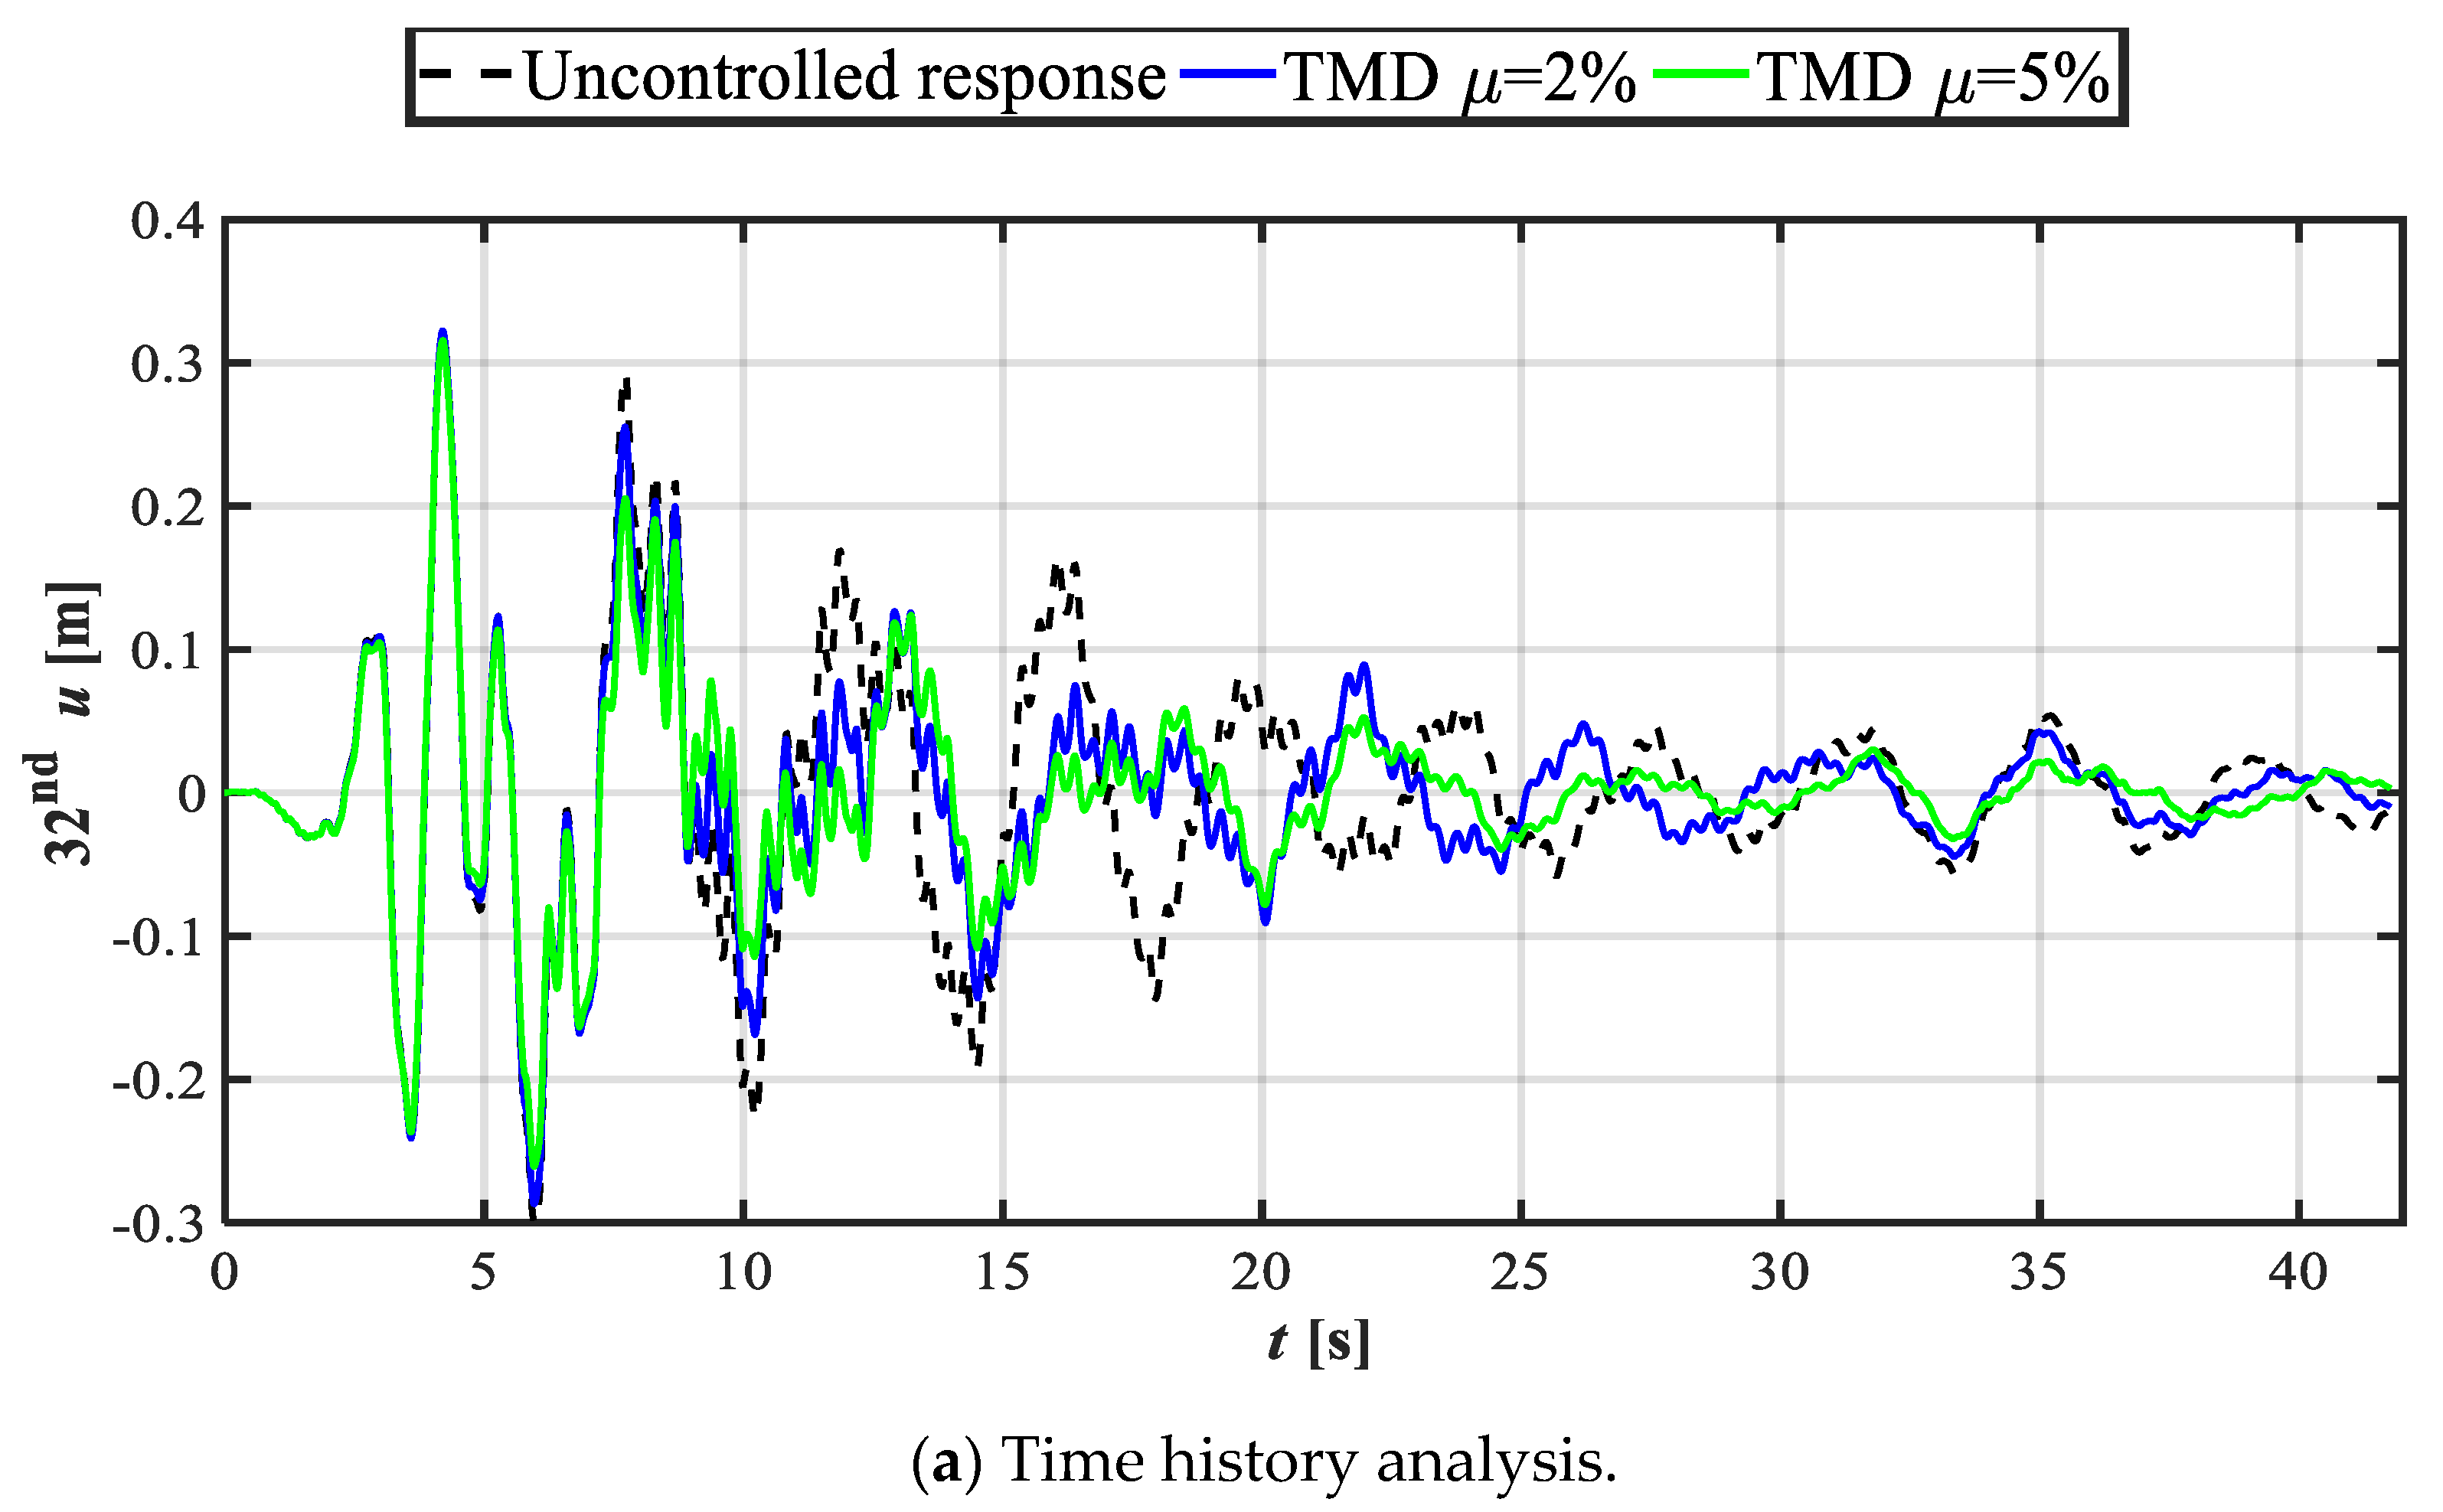
Figure 5 and Figure 6 show the history of displacements at the 32nd story of the building, for μ = 0.02 and 0.05, respectively. Even though both TMD options (μ = 0.02, and 0.05) can effectively reduce the dynamic response of displacements, it is visibly clear that TMDs with μ = 0.05 reach greater reductions in lateral displacements at the upper level of the structural system, regardless of the objective function.
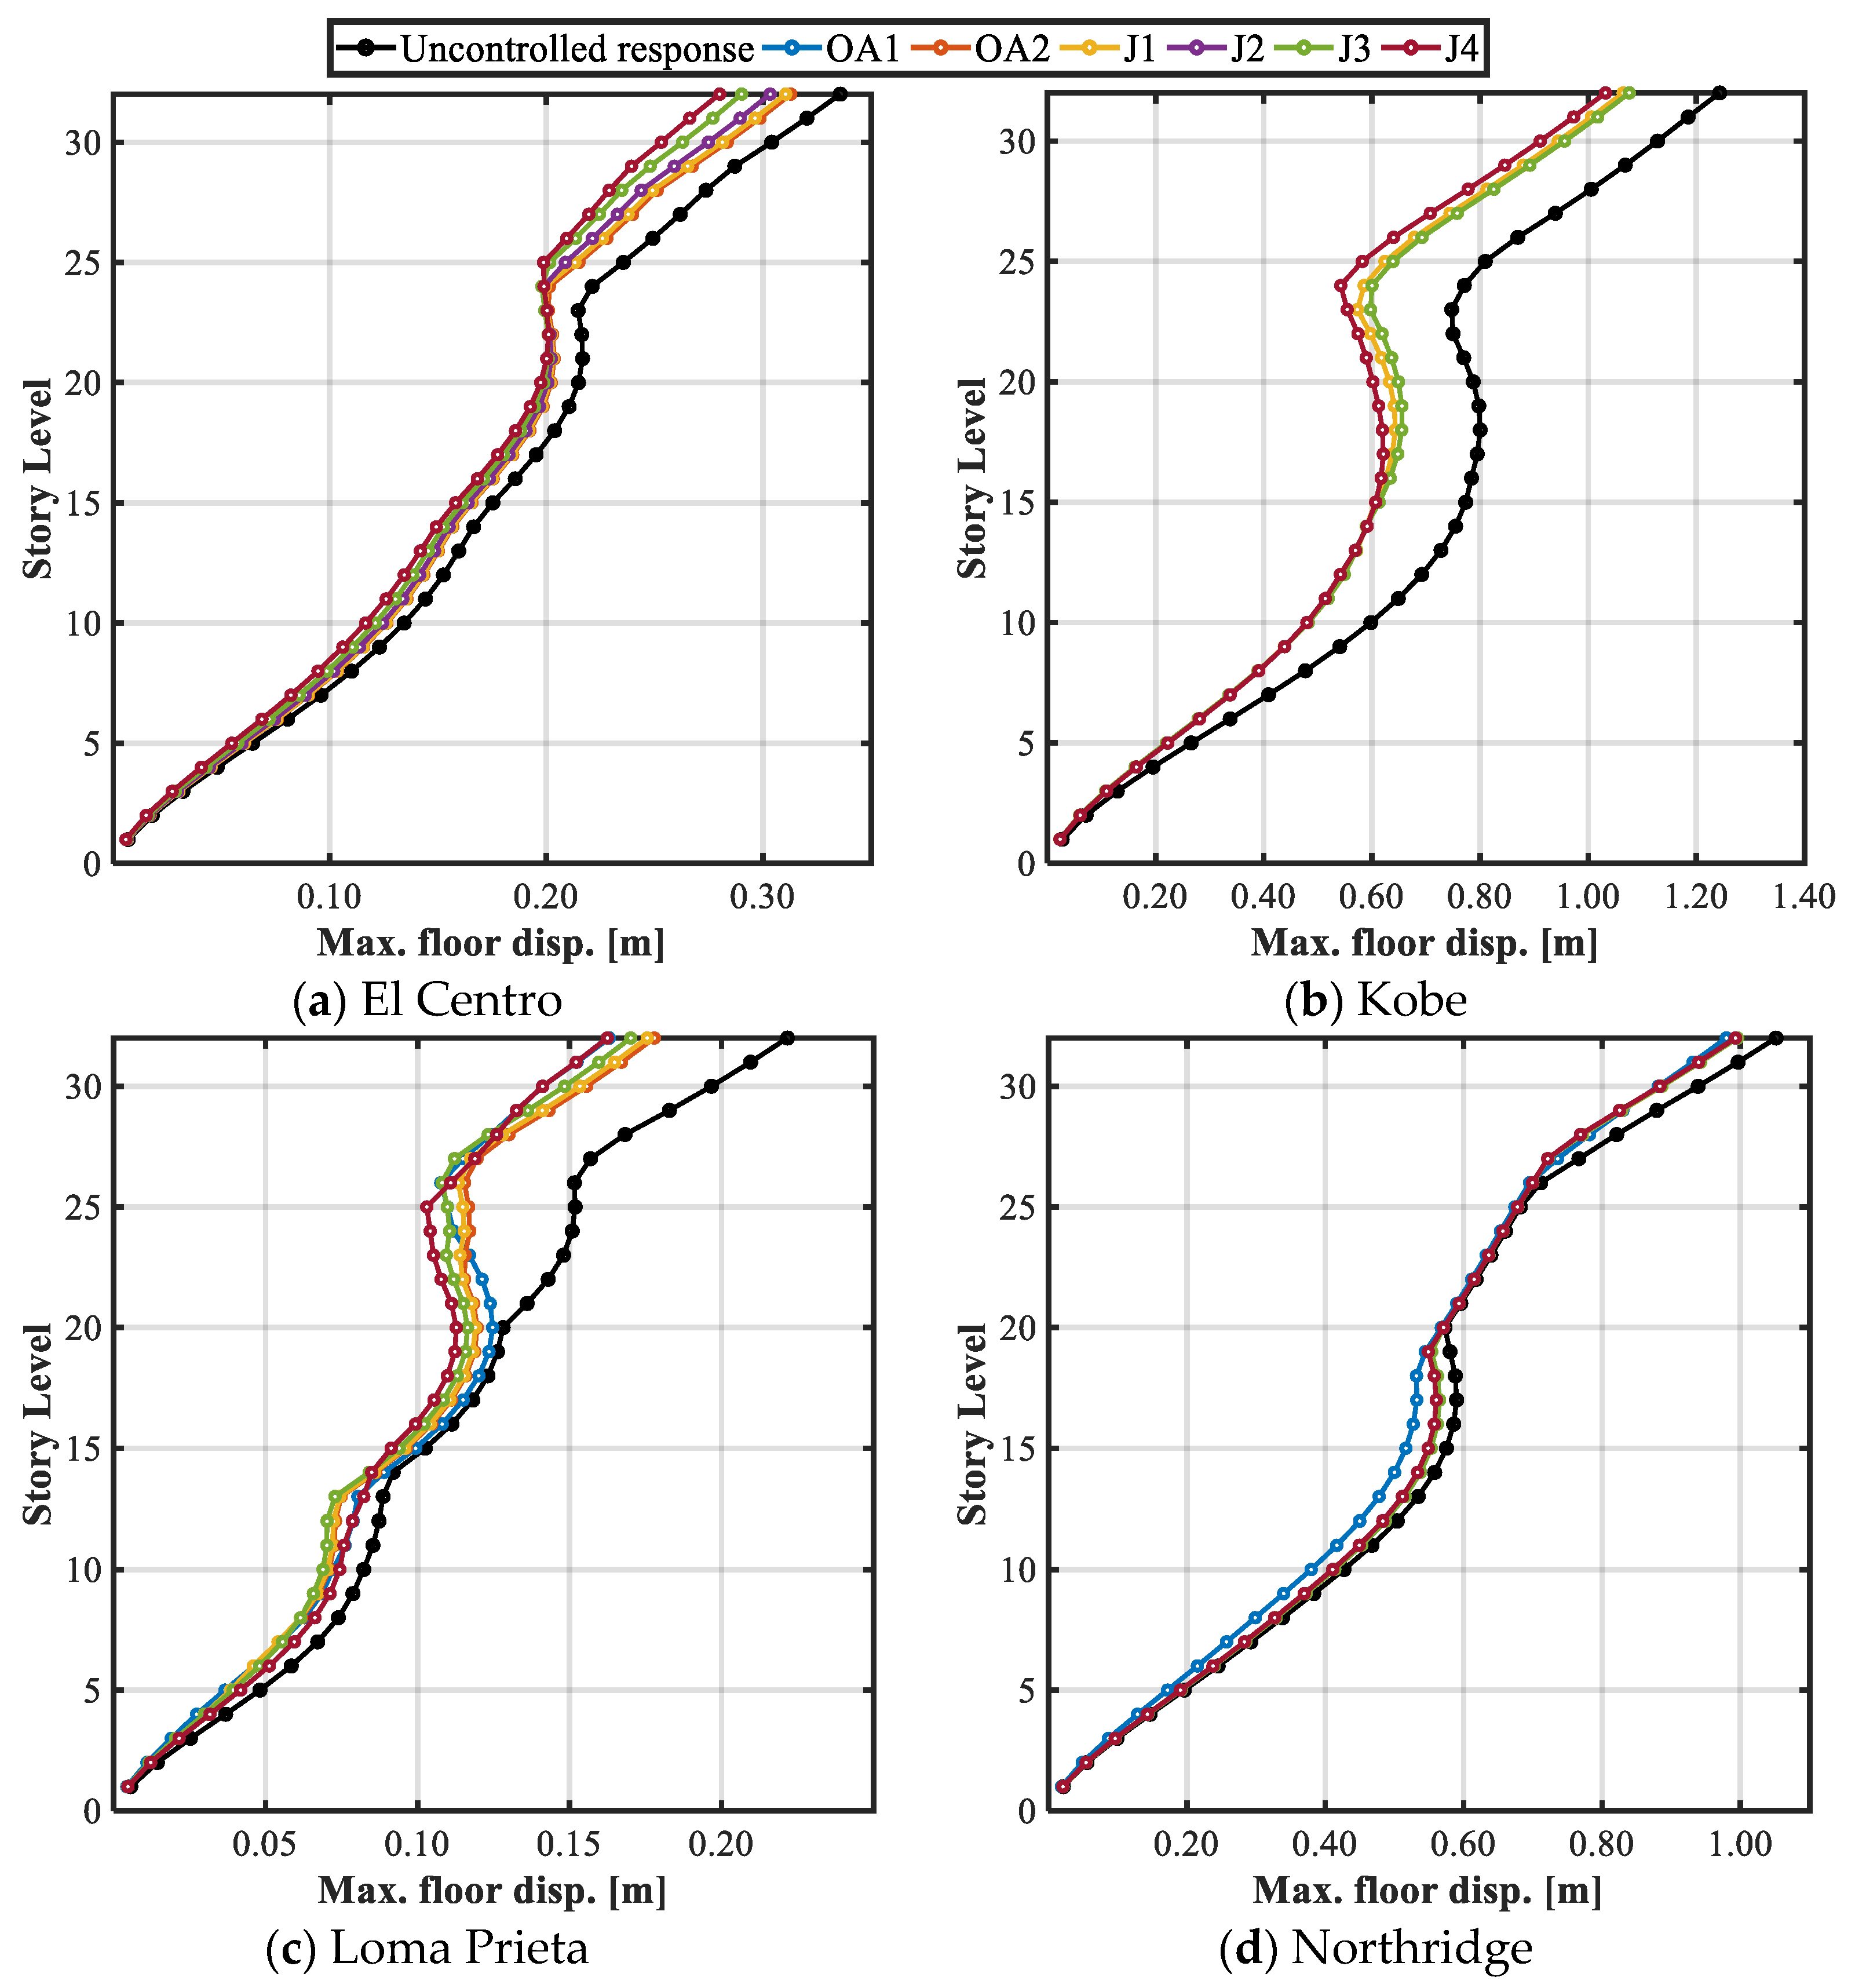
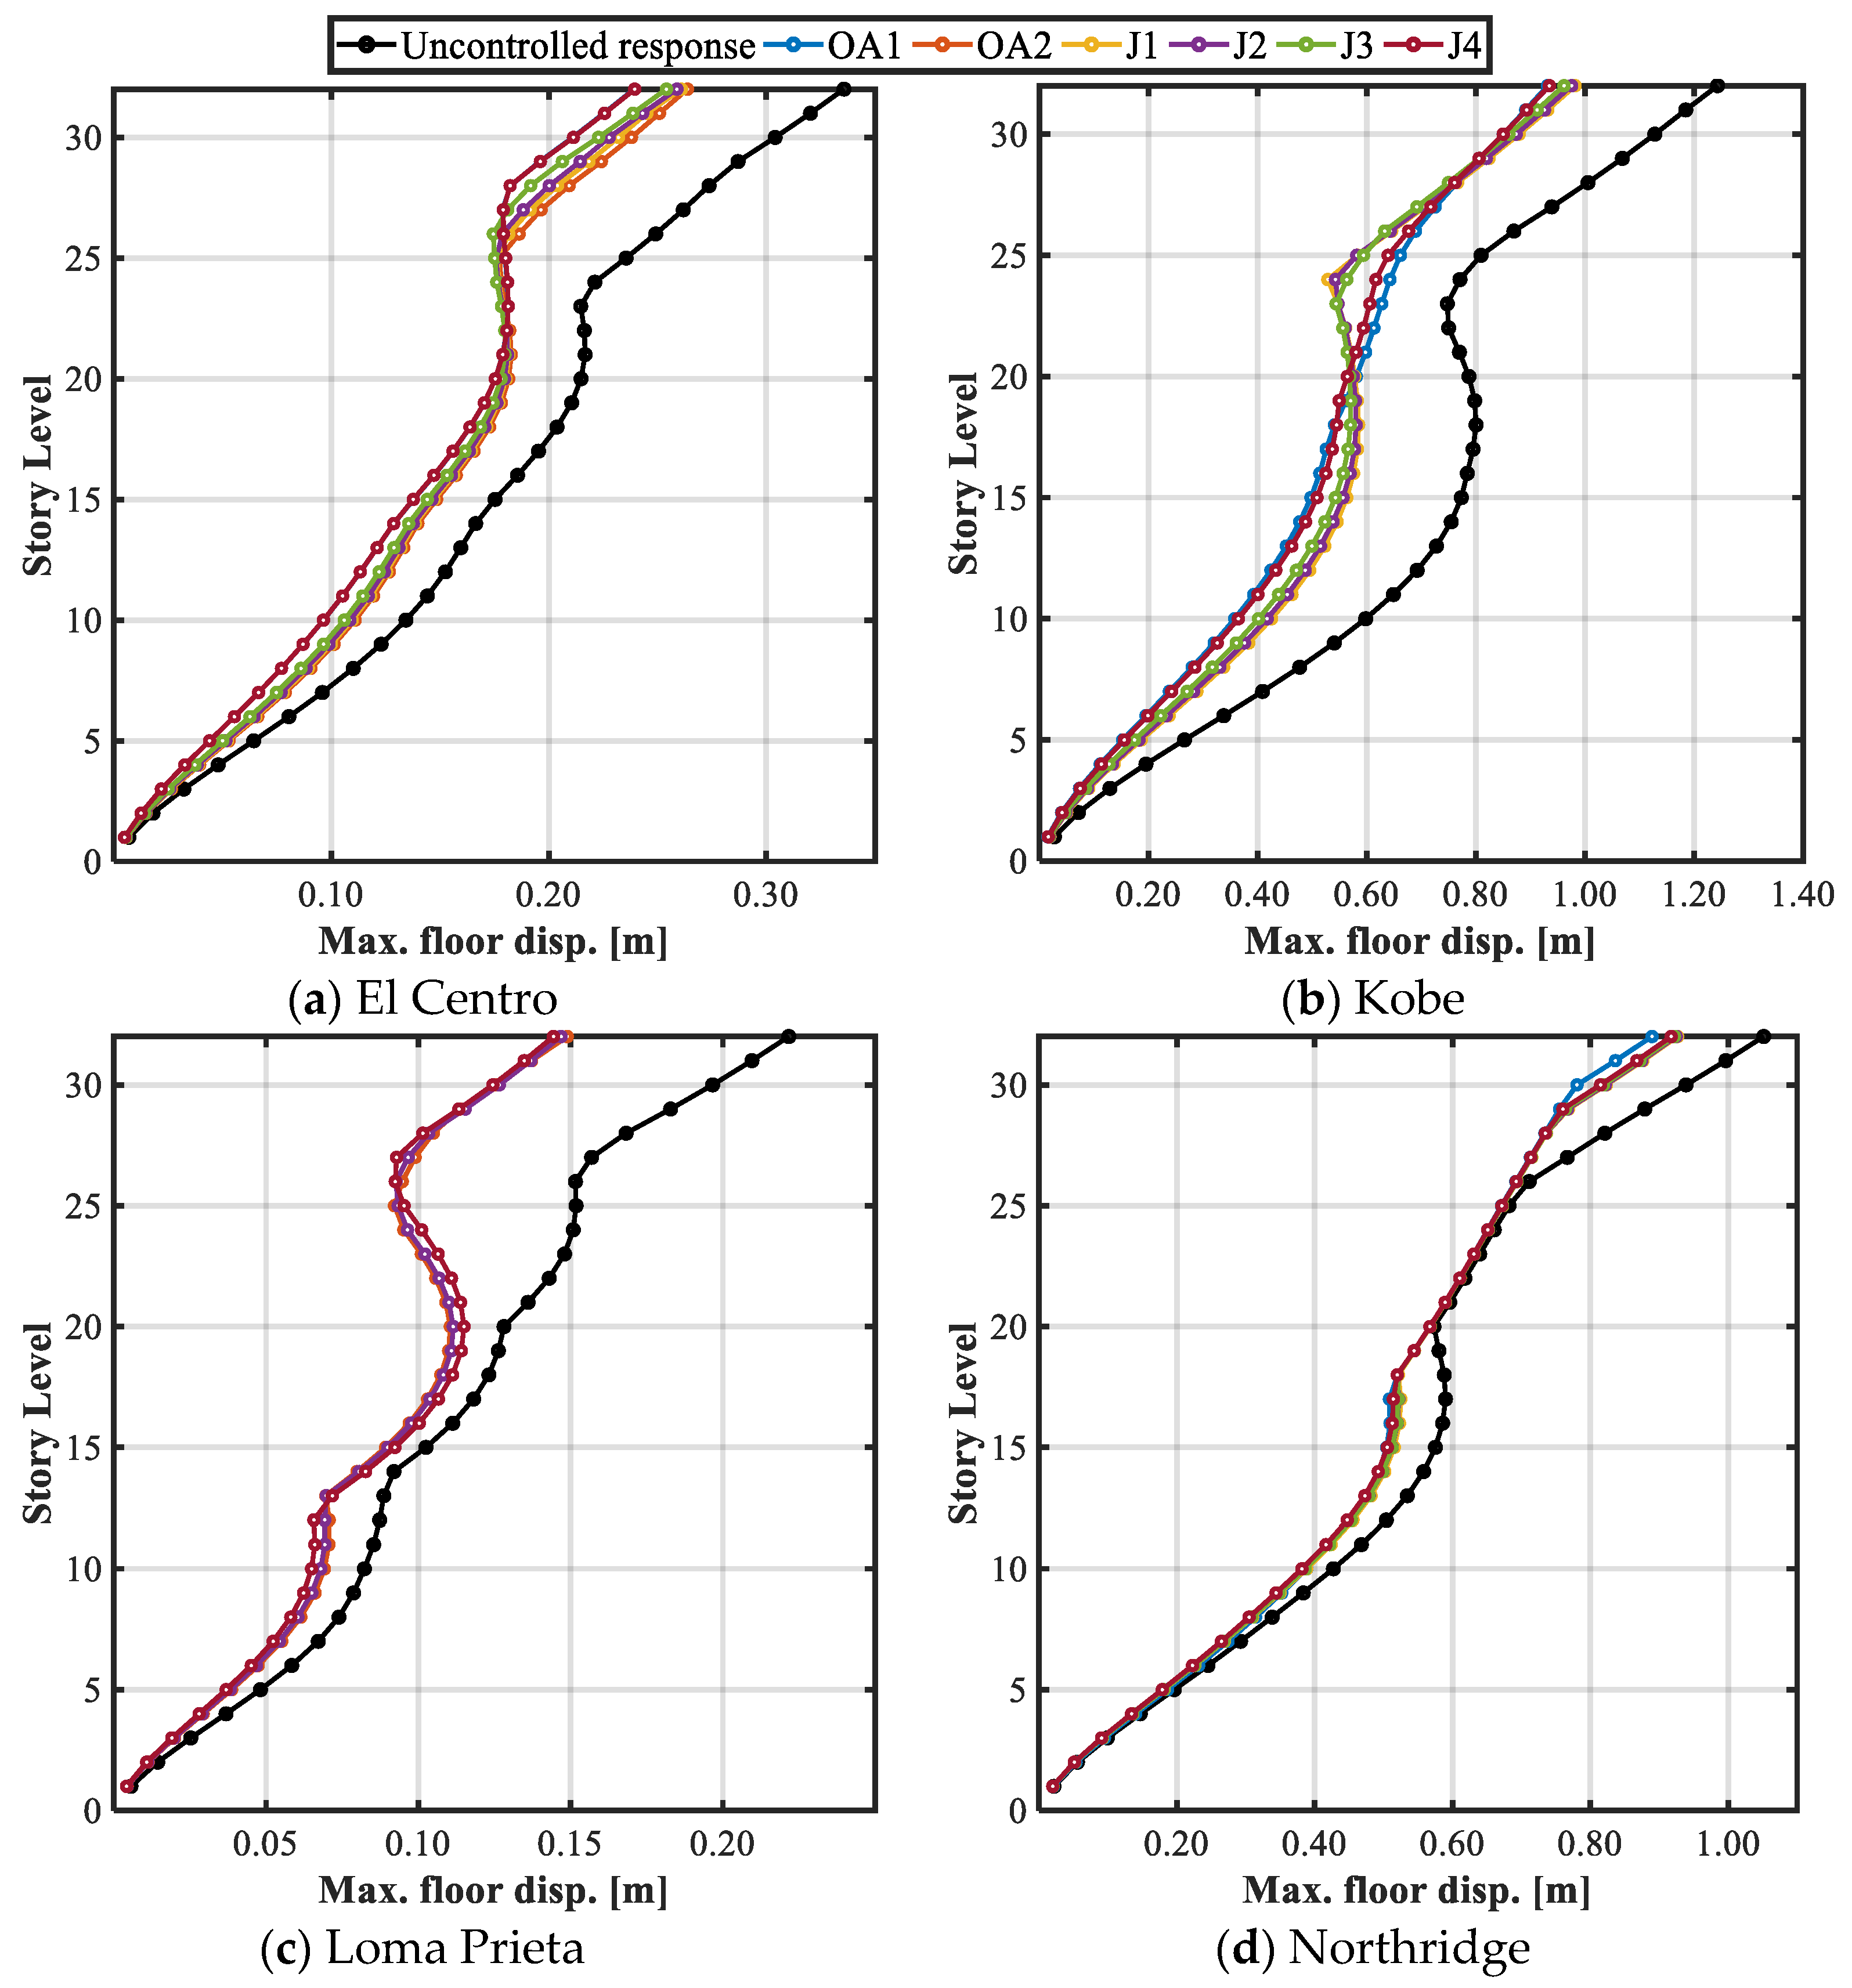
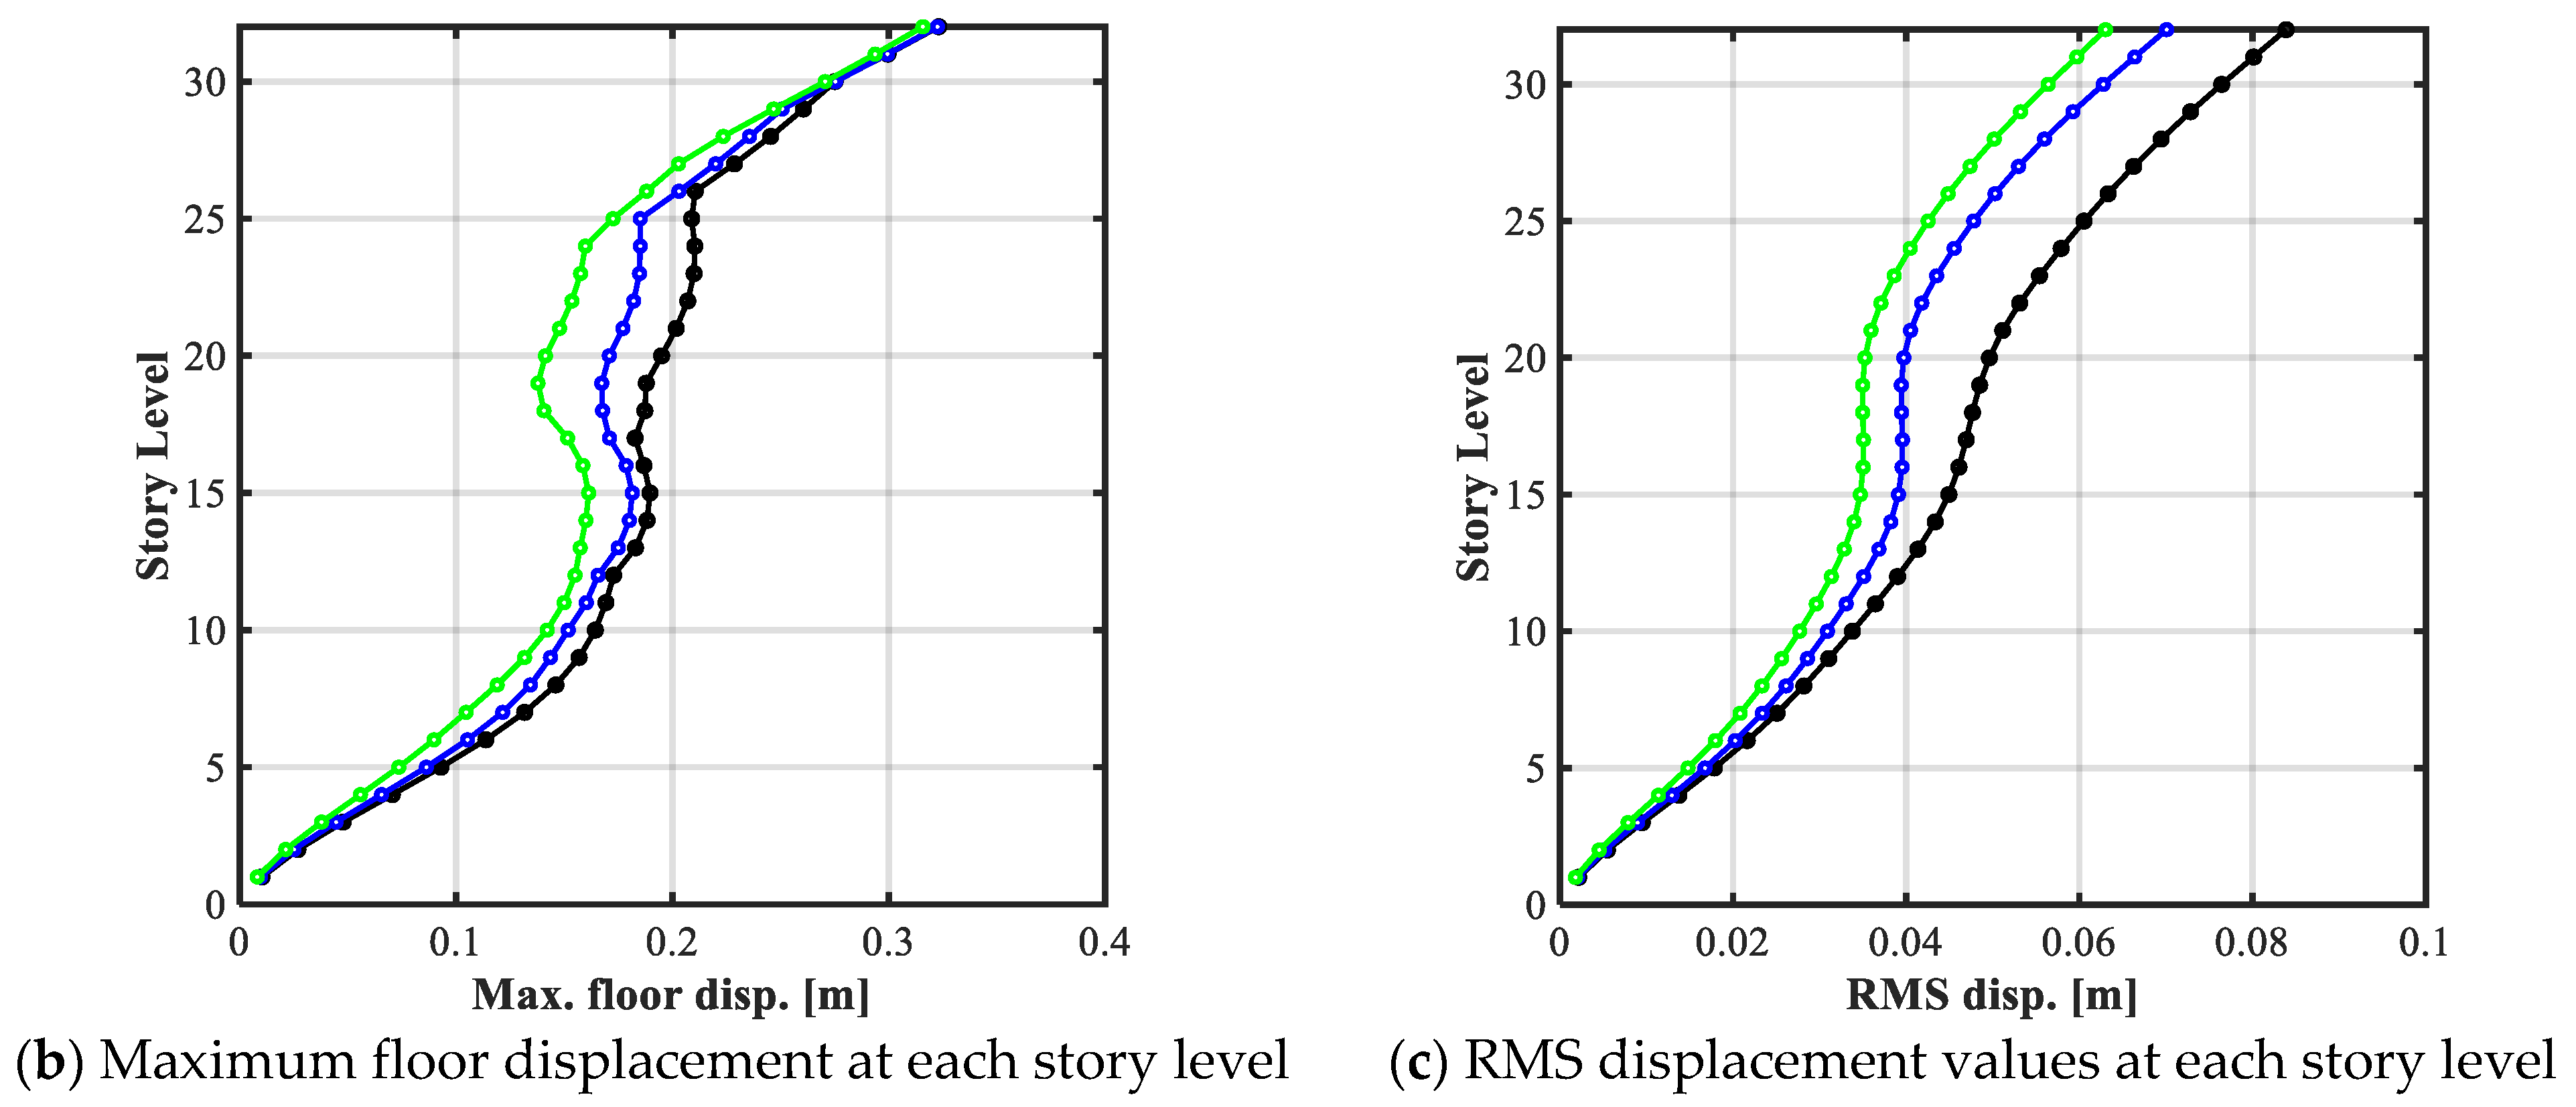
Figure 7 and Figure 8 present the comparison of the peak displacement for μ = 0.02 and 0.05, taking into account the six proposed objective functions. It is shown that the greatest reductions in the peak displacement at each story-level are achieved using the devices with the highest mass ratio, as reported in the literature [30,31,32,33,34,35,36,37,38,39,40,41,42,43,44,45,46,47,48,49,50]. Moreover, the greatest reductions are observed at the higher story-levels of the structure. This behavior can be better understood by analyzing the proposed objective functions, which are mainly focused on diminishing the dynamic response at the 32nd story of the building. Hence, the optimization process influences indirectly the response parameters of the floors near the upper level.
The numerical results show that, using μ = 0.02 TMD, the reduction of the maximum displacements of each floor of the structure is more effective using Kobe and Loma Prieta accelerograms than El Centro and Northridge cases. Moreover, it may be affirmed that the greatest reduction in displacement is approximately 32.13%, reached at the 25th story-level of the structure when it is controlled by the TMD designed by the J4 approach and using the Loma Prieta earthquake excitation. This reduction shows consistency, since the J4 approach gives the greatest possible weight to the reduction of the displacement peak over the RMS displacement values.
The greatest reductions in the horizontal peak displacement at the top-story level are attained using TMDs designed through the objective functions OA1 and J4. Using the El Centro earthquake, the horizontal peak displacement is reduced from 0.336 m to 0.280 m (16.60% reduction) using the function OA1 and J4 indistinctly; similar results are observed using the Kobe earthquake, where the peak displacement decreases from 1.243 m to 1.032 m (17% reduction). Now, under the Loma Prieta accelerograms, the maximum displacement reduces from 0.222 m to 0.162 m (27% reduction) using the objective function J4, while, for the Northridge excitation, the maximum displacement is decreased from 1.051 m to 0.980 m (7% reduction) with the OA1 approach.
The controlled response of the structure using optimally designed TMDs with μ = 0.05 is remarkable. The best performances are achieved with devices optimized through OA1 and J4 approaches, which are mainly focused on reducing the peak displacements, showing reductions of up to 43 and 42%, respectively. Nevertheless, the reductions in the maximum displacements at each floor achieved by the devices designed with the remaining objective functions are notable as well, exhibiting reductions up to 39, 38, 38, and 40% for the cases of optimization OA2, J1, J2, and J3, respectively. Once more, using the Northridge earthquake, the smallest reductions obtained ranged from 12 to 17% at the higher story-levels of the structure. Besides, for the three remaining accelerograms, the reductions in the maximum floor displacement oscillate between 20 and 43%.
Furthermore, the dynamic response of displacements observed in Figure 7 and Figure 8 denotes an S-shape trend. The curve shows a linear behavior between 1st and 20th story-levels; then, there is a setback in the curve between 27th and 32nd story-levels, where it becomes linear again, although with a different inclination from the first segment representing the greatest response reductions. This behavior is closely related to the whipping lash effect that has been previously observed in high rise buildings [66]. This behavior is largely caused by changes in the compressive strength in the concrete used in the column sections of the building, which causes changes in stiffness and the dynamic behavior of the structural system.
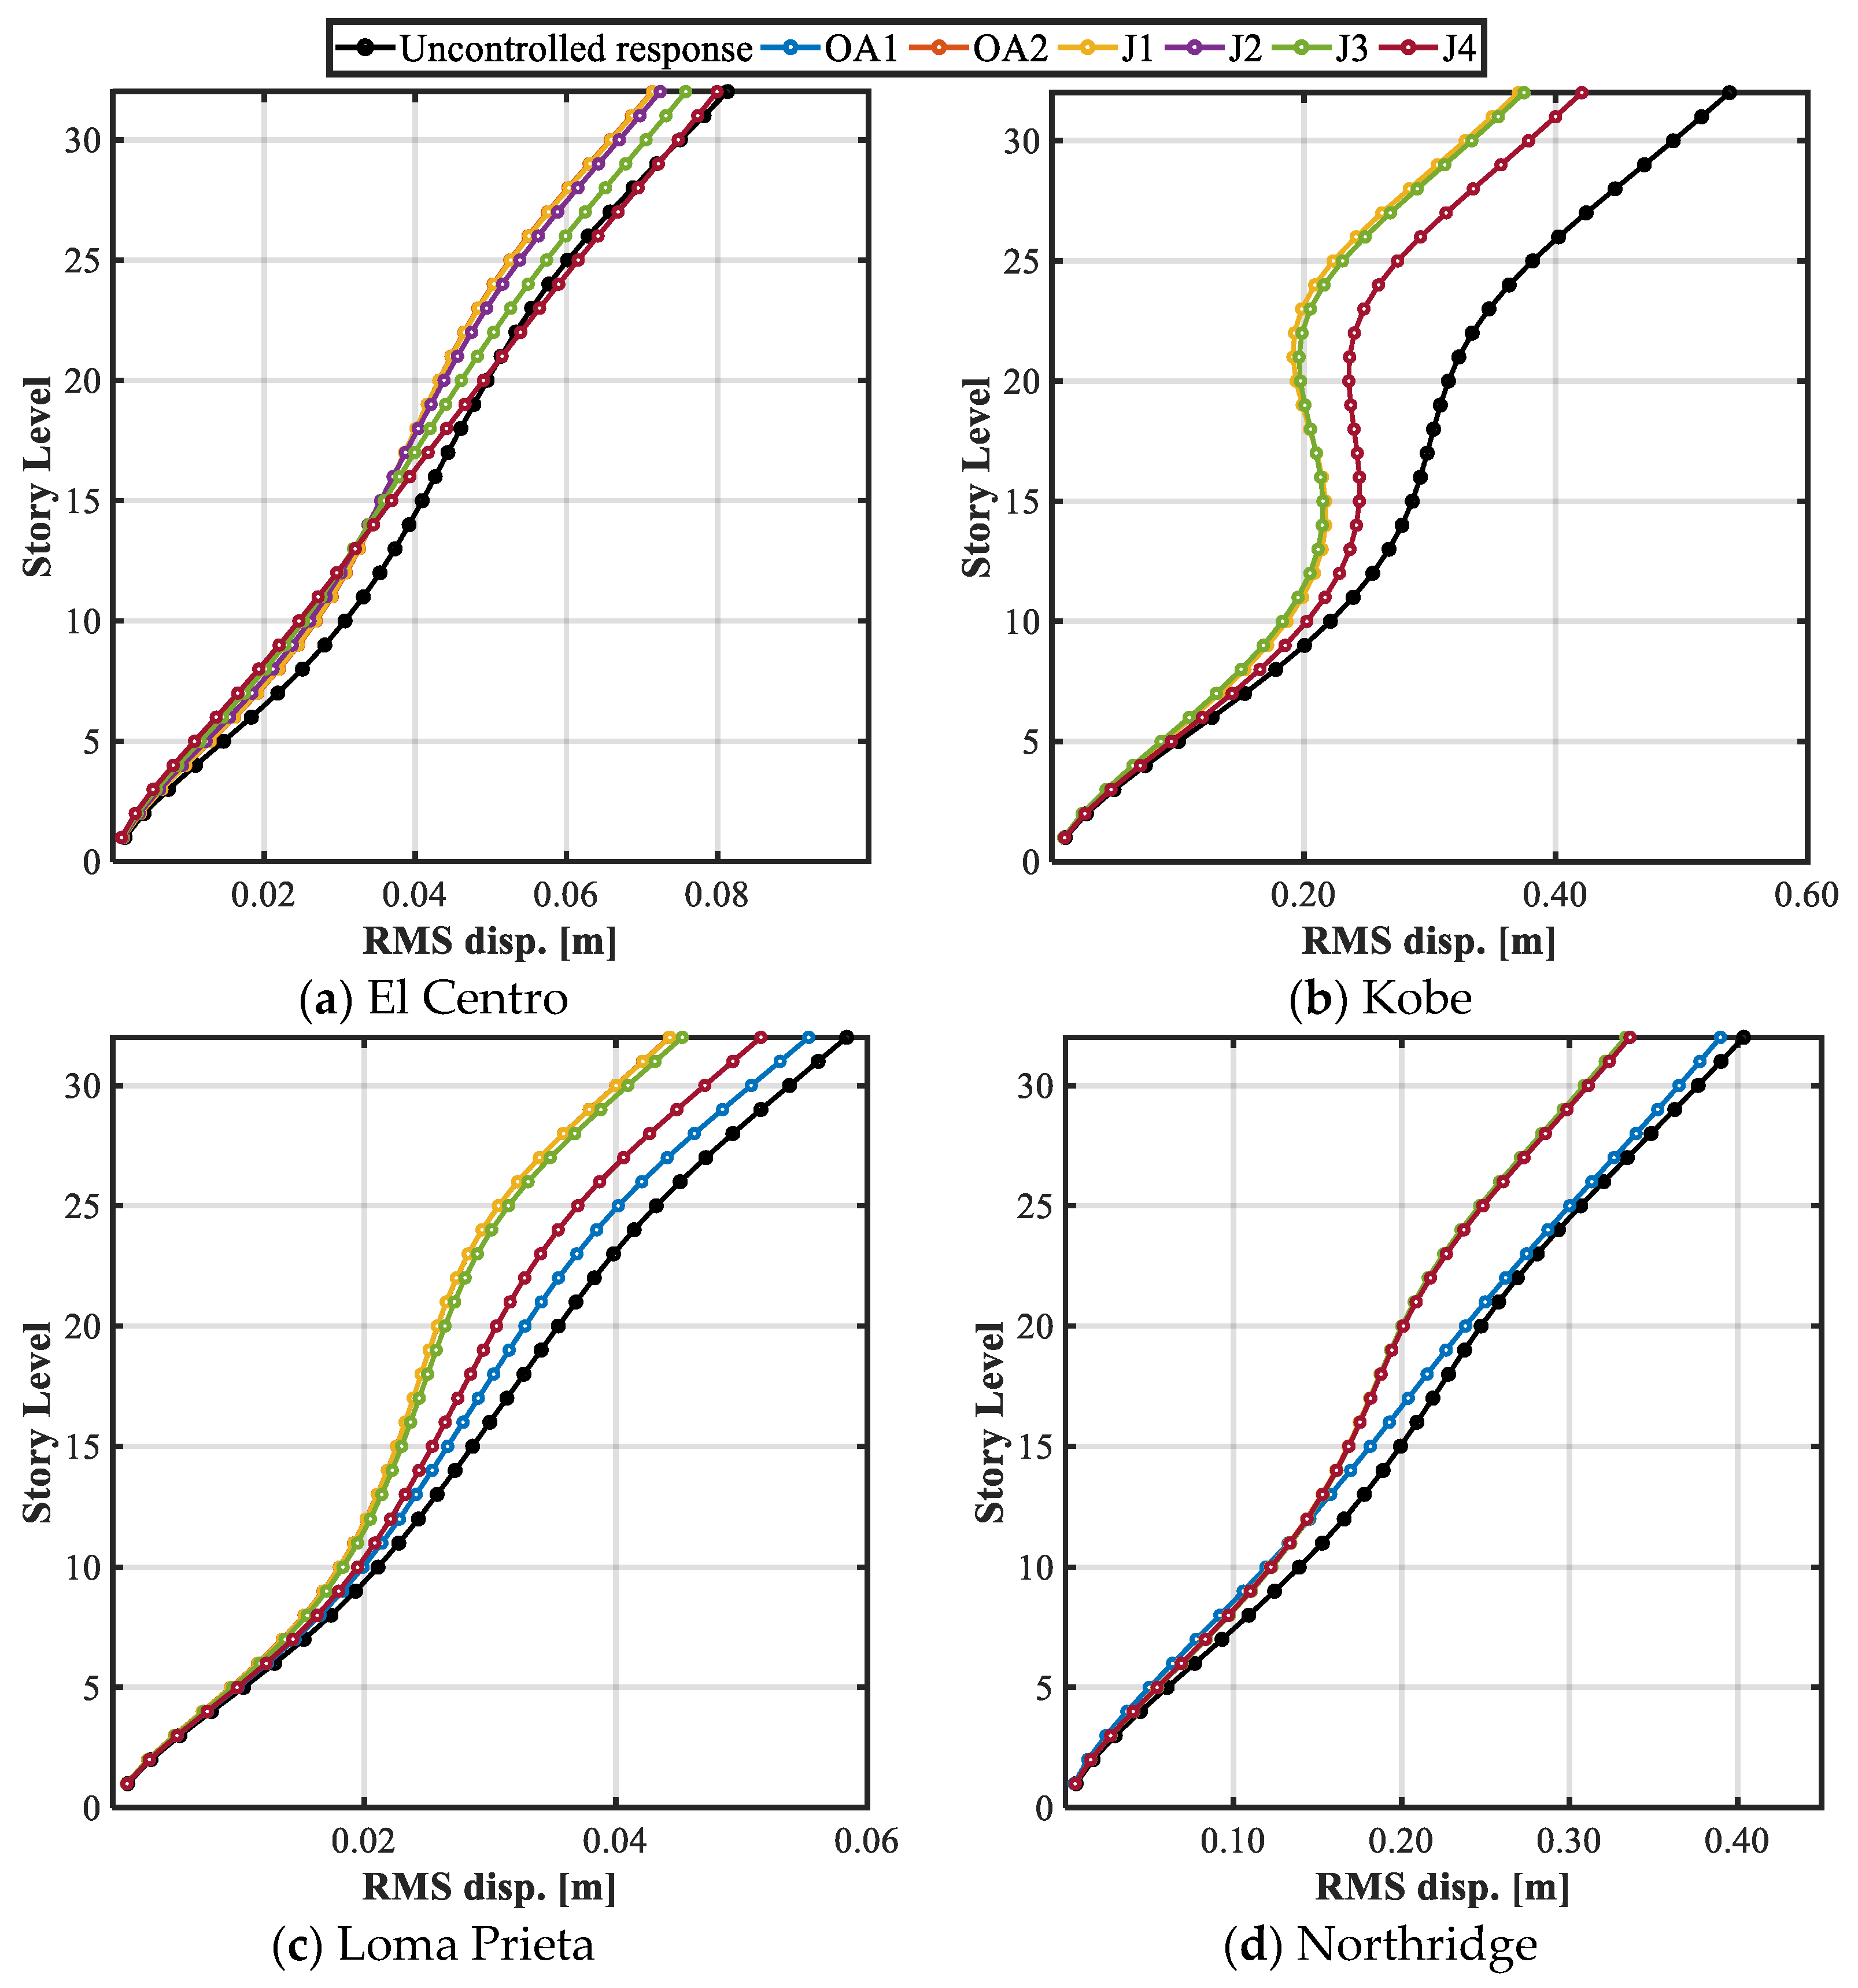
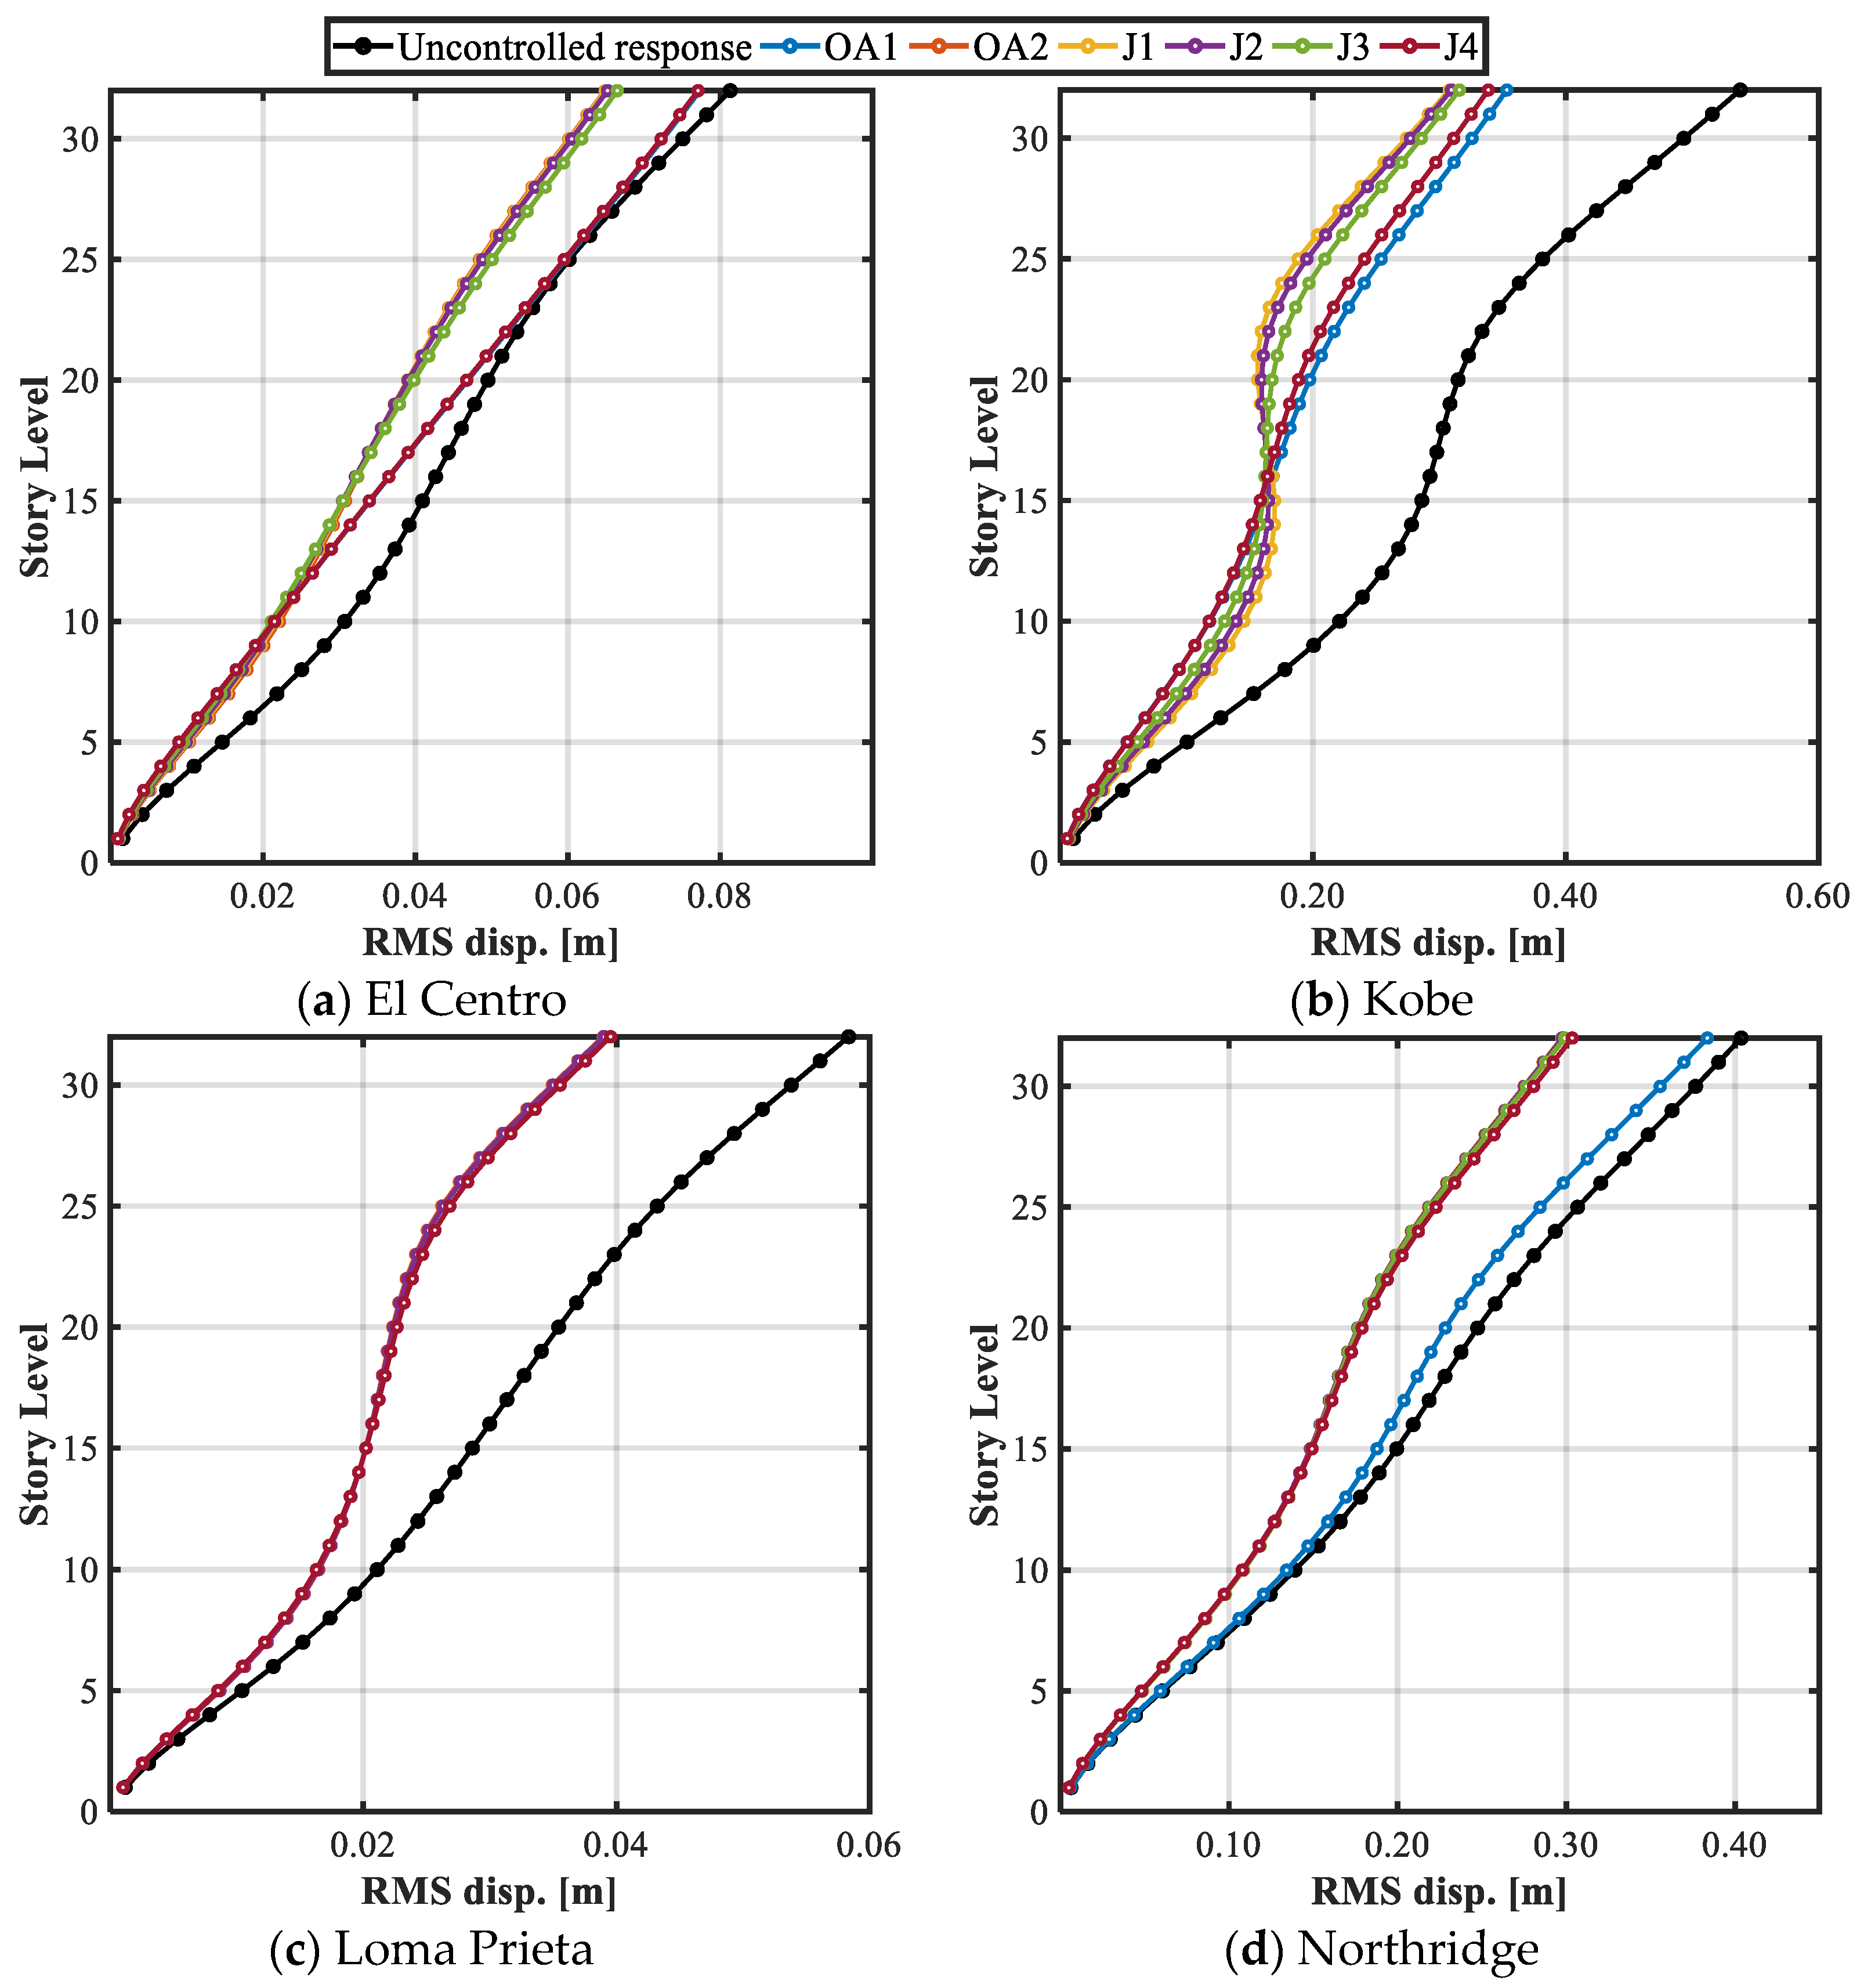
On the other hand, Figure 9 and Figure 10 present the behavior of the RMS values of the displacements at each level of the building controlled by TMDs with mass ratios μ = 0.02 and μ = 0.05, respectively.
Figure 9 shows reductions fluctuating from 19% (Northridge excitation at 23rd story-level) and 42% (Kobe excitation at 23rd story-level). Besides, the reductions in the RMS response of displacement of the roof story-level are 12, 31, 24, and 17% for the El Centro, Kobe, Loma Prieta, and Northridge accelerograms, respectively. The analysis of the RMS response of displacement curves at each floor allows the establishment that the control devices designed through the OA2, J1, and J2 approaches present the best performances when the RMS of displacements is analyzed; accordingly, TMDs designed with objective functions OA1 and J4 achieve lower reductions.
The best reductions in the RMS values of the displacements at each level of the structure are obtained when the building is equipped with TMDs with µ = 0.05. These reductions are attained using the OA2 and J1 approaches: 20, 42, 33, and 26% for the El Centro, Kobe, Loma Prieta, and Northridge accelerograms, respectively. Among these reductions, the most outstanding is attained under Kobe excitation, since the reductions between 15th to 32nd story-levels ranged between 40% (0.286 m to 0.170 m at 15th story-level) and 52% (0.334 m to 0.159 m at the 22nd story-level).
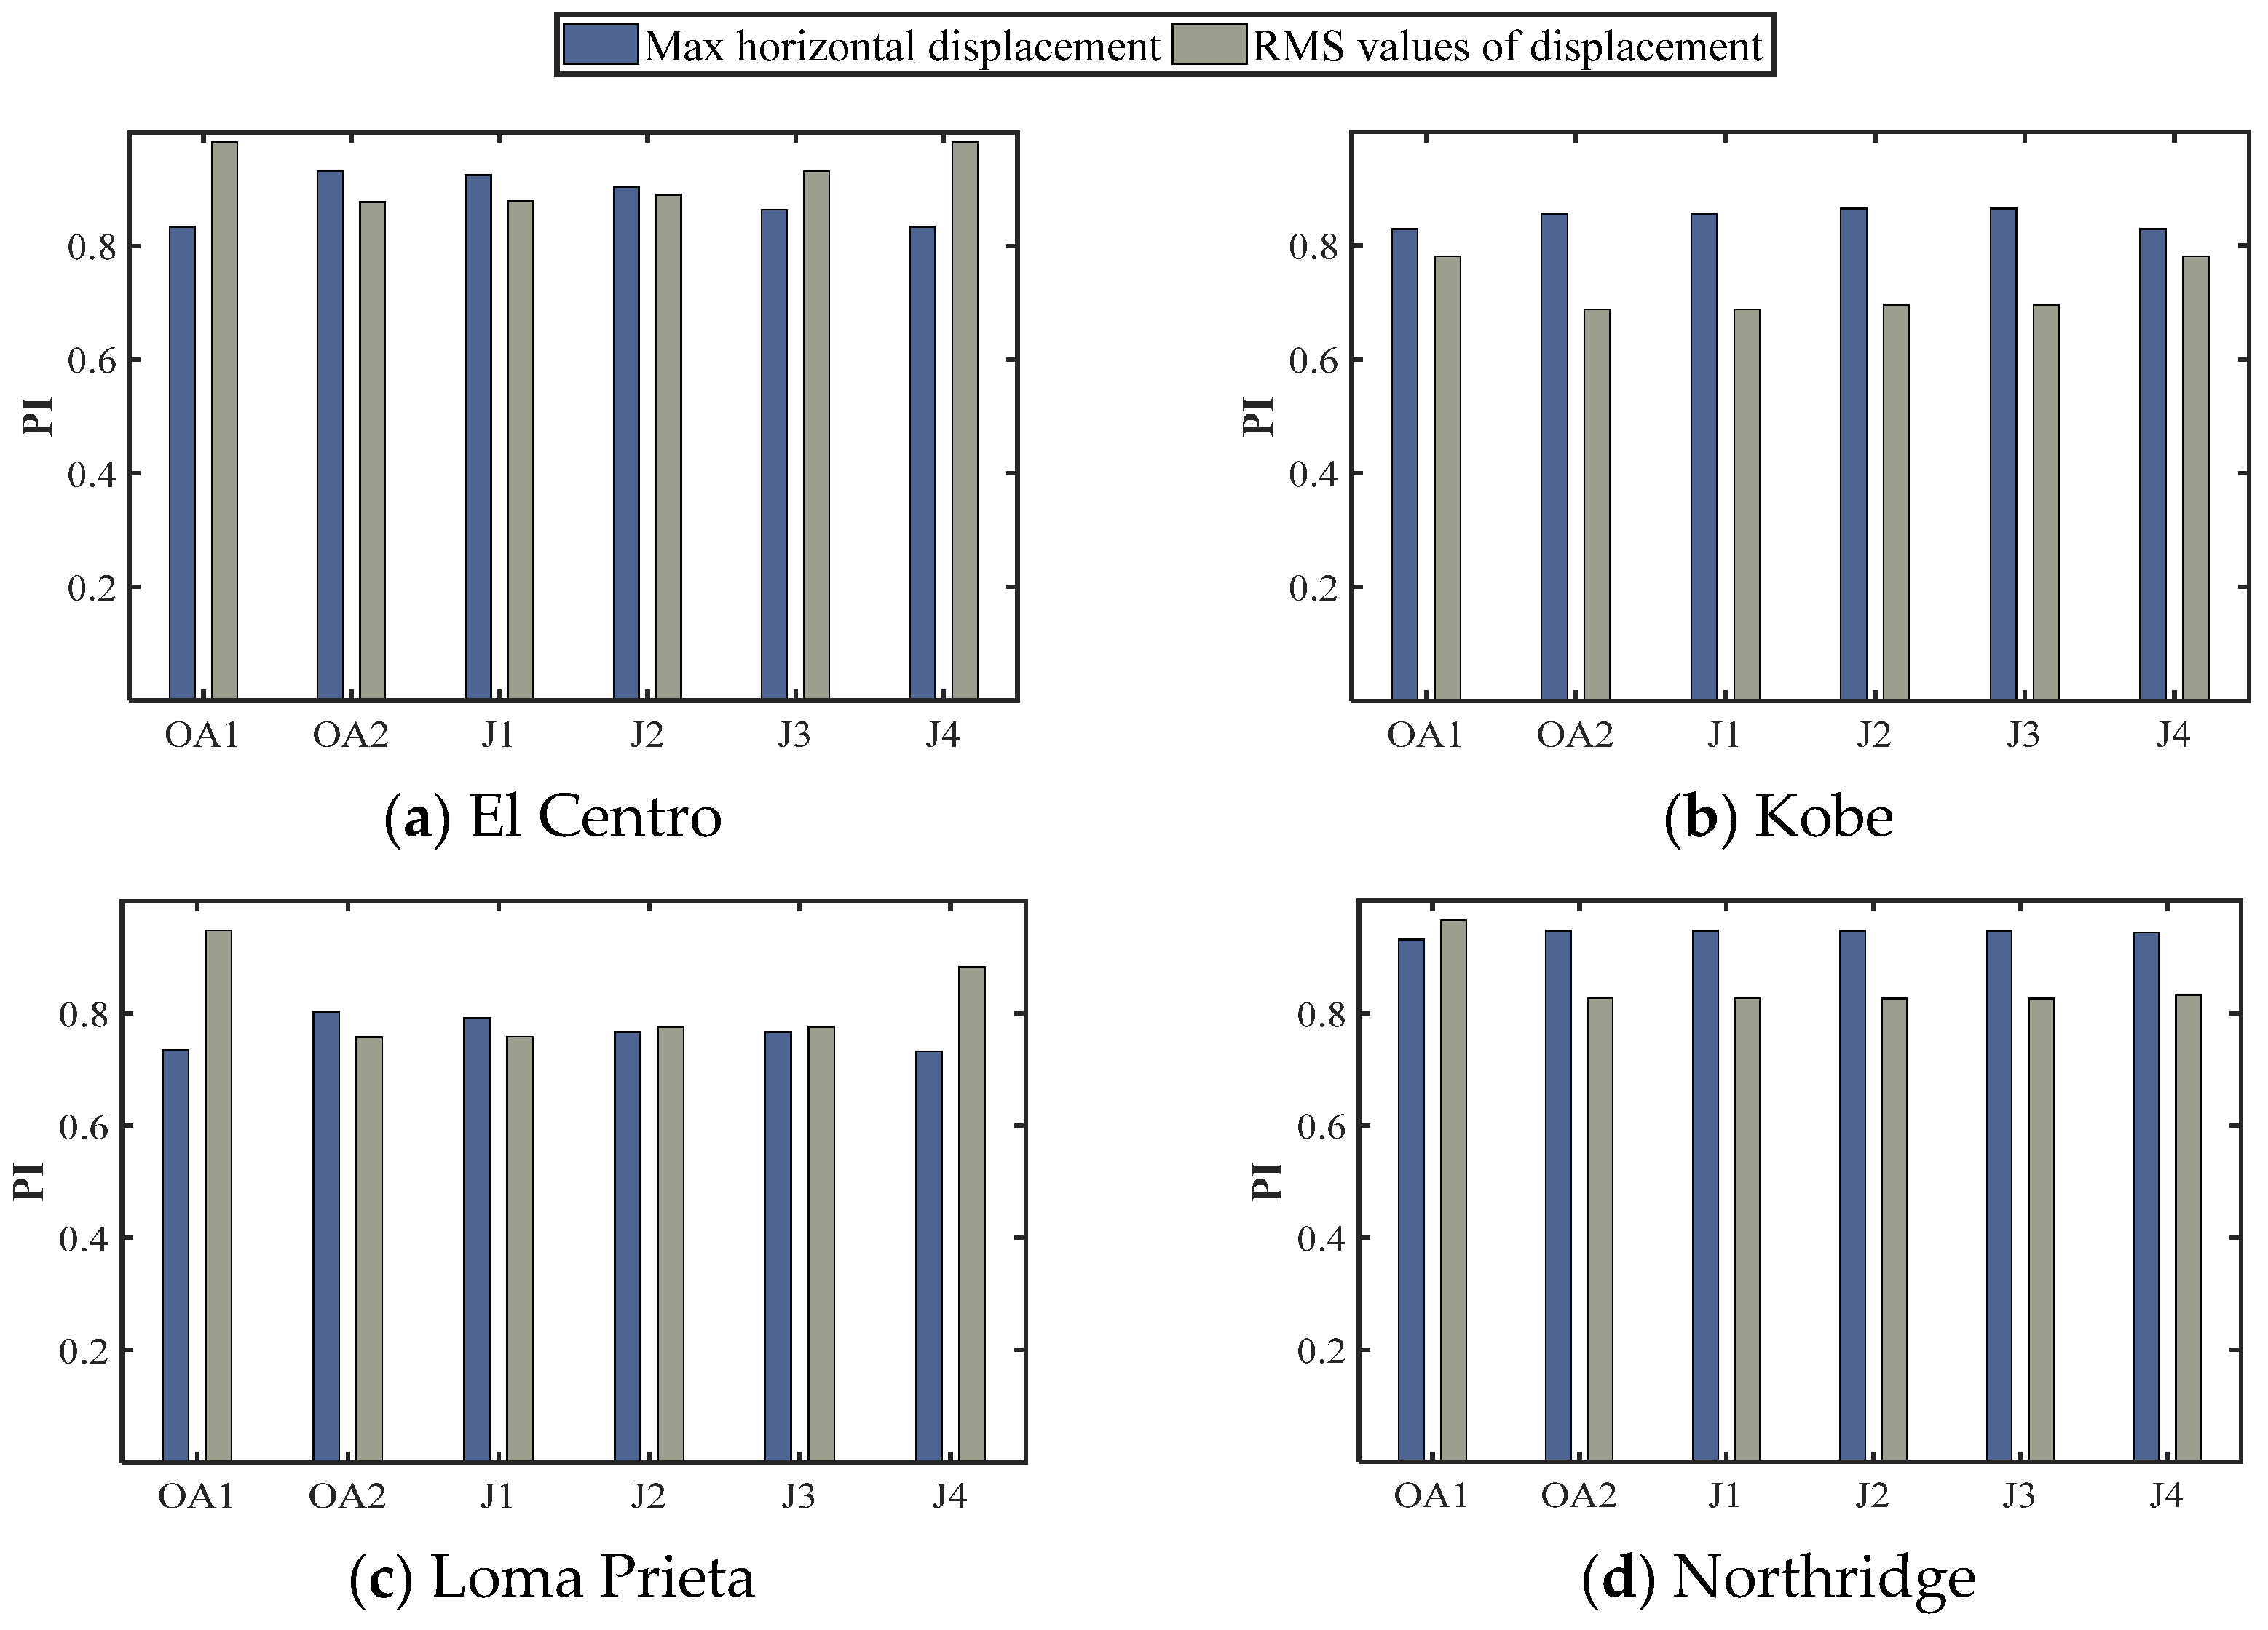
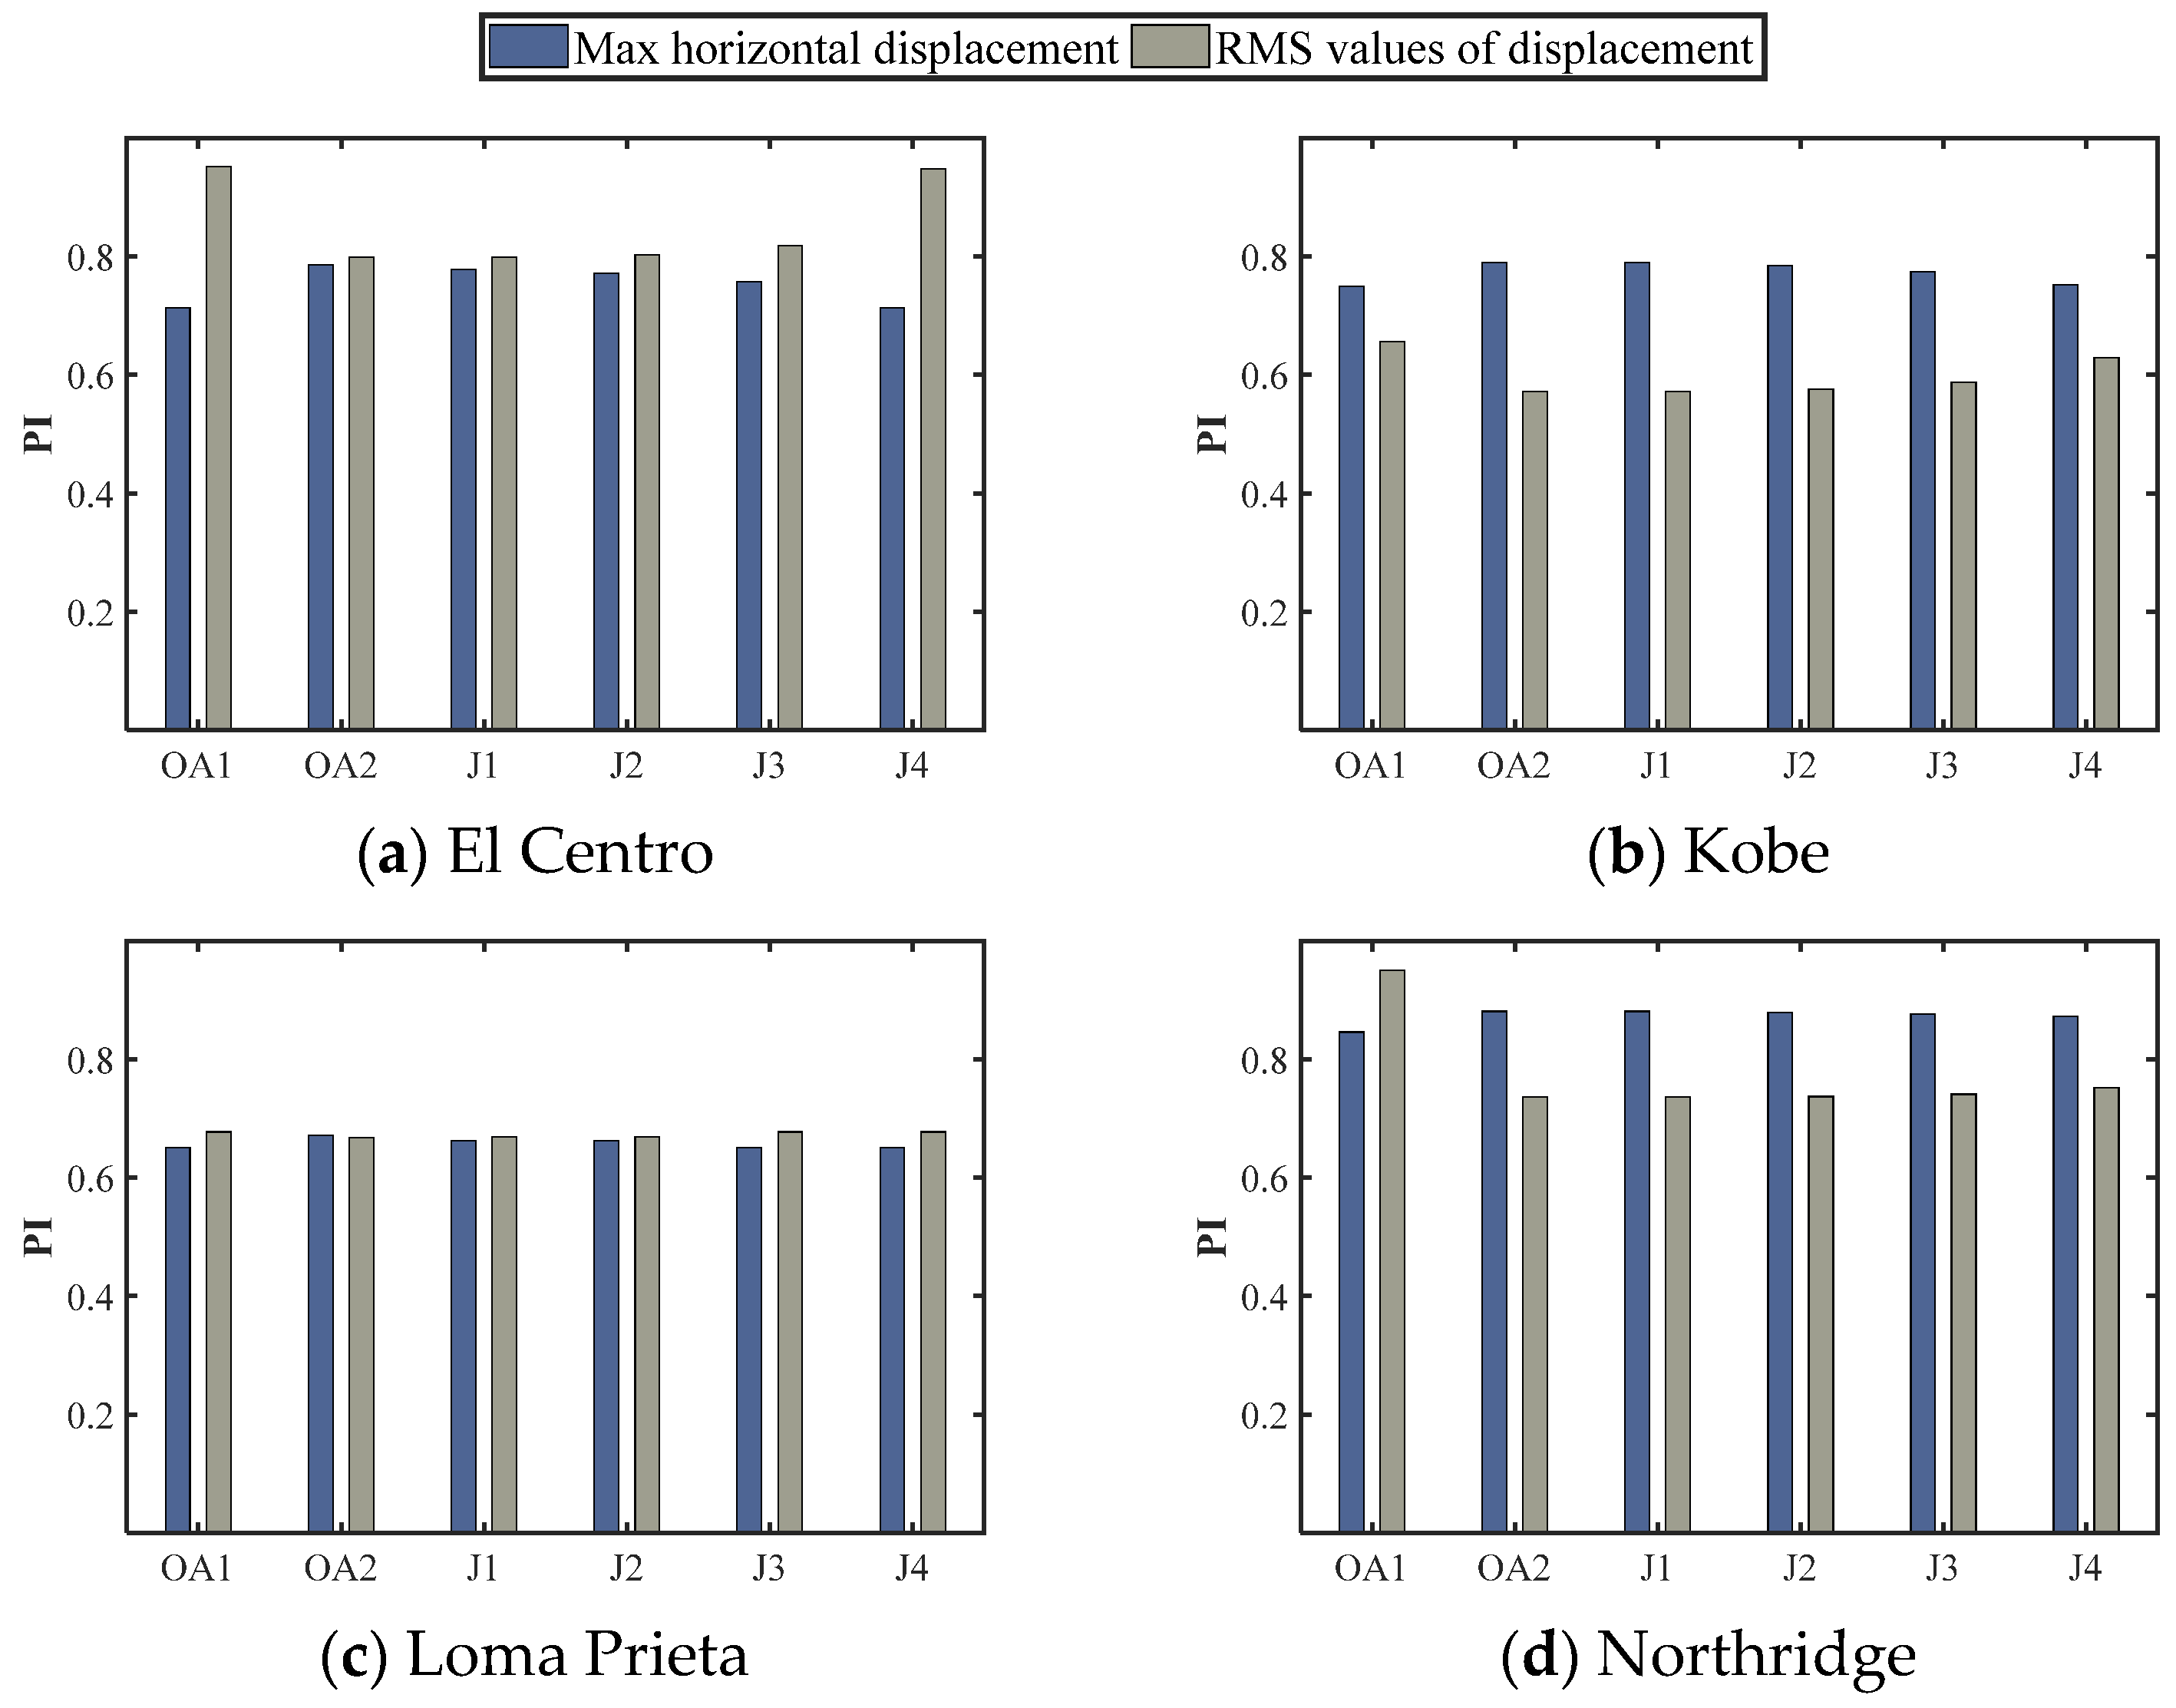
It can be noticed that the reductions in the RMS response of displacement at each floor of the structure exhibit a much more uniform and efficient behavior than the reductions of the maximum horizontal peak floor displacements, especially with µ = 0.05 TMDs, and objective functions OA2, which focus on reducing the RMS displacements, and J1, which gives the greatest weight to this parameter. Using the Kobe and Northridge records, the results report the highest response magnitudes and, at the same time, the TMDs exhibit the greatest performance. This behavior suggests that the objective functions for the optimal design of TMDs should be focused on minimizing the RMS values of displacements, or, instead, a linear combination in which the greatest weight is given to this parameter should be used. To verify this statement, Figure 11 and Figure 12 present a comparative analysis of the six objective functions and the attained PI.
Figure 11 and Figure 12 demonstrate that objective functions OA2, J1, and J2 lead to the most efficient design parameters for TMDs. Consequently, TMDs designed through these objective functions are the ones that best improve the seismic performance of the case-study by given major importance to reducing the RMS response of displacements. Furthermore, the PI values of the TMDs designed through OA2, J1, and J2 demonstrates that the control of the RMS values of displacements in the structure is the best possible within both evaluated parameters, which implies significant reductions in the dynamic response over time. Moreover, the horizontal peak response of displacements is markedly reduced as well. Hence, according to these results, it may be claimed that the objective function J1 is the most balanced and effective among the six objective functions analyzed in this paper, despite the small differences in performance with OA2 and J2.
4.5. Practical Design Recommendations
Once the optimal design parameters have been determined for each benchmark record, an attempt is made to establish a single set of optimal design parameters to work properly under any acceleration record. In that sense, the methodology proposed by Fallah and Zamiri in [60] is implemented for that purpose. This methodology establishes average design parameters according to the weighted response reduction percentages obtained previously. Therefore, the design parameters obtained from the objective function J1, which was the most effective to control the dynamic response of displacement, are replaced in Equations (23) and (24):
where Rmfd and RRMS denote, respectively, the reduction of the maximum floor displacement and the reduction of the maximum RMS displacement defined according to Equations (25) and (26). In addition, the counter i in the sum numbers the accelerograms used in the tuning process. More records in the optimization process will enhance the accuracy of the average design variables; however, for this example, only the numerical results computed from the records in Table 1 are considered. The computed set of average design parameters ζd avg and f avg are reported in Table 5.
Thereafter, the case-study is subjected to the action of the Petrolia and San Fernando acceleration records, whose details are presented in Table 6. The main purpose of using acceleration records different from the benchmark records used in the optimization process is to verify the performance of the structure and the robustness of the WOA methodology under any type of random excitation.
Figure 13 and Figure 14 illustrate the response of the structure with TMDs designed with the average design parameters subjected to Petrolia and San Fernando earthquakes, respectively. Similarly, Table 7 and Table 8 show the response reduction on the 32nd floor of the building. As it can be seen, the behavior of the structure controlled via the TMDs with the average design parameters exhibits notable reductions in the horizontal peak displacements and the RMS response of displacements. The decrease in the response is especially significant in the RMS values of displacement, which means that the use of the weighted procedure could be potentially applied for the design of TMDs in structures subjected to earthquake loads. Furthermore, future works should consider a large number of seismic records in order to obtain a more reliable set of design parameters that best fit a wide range of possible ground motions.
Reductions up to 6 and 30% are observed in horizontal peak displacements and RMS displacements, respectively, using the TMD designed with a unique set of parameters derived from the methodology described in [60]. Although the methodology was originally proposed for base isolation systems, it can be adapted for the tuning of linear mass dampers since, for both base isolation systems and TMDs, optimal design variables must be determined. At first glance, the reductions attained with the average design values are not substantial. However, in earthquake engineering practice, it is impossible to know the ground motion excitation that will affect the structural systems, and, accordingly, the Petrolia and San Fernando Earthquake present dynamic properties different from the records for which the TMD was originally tuned. Thus, although small, these results validate the robustness of the optimization based on WOA and demonstrated the efficiency of the algorithm over other metaheuristics, like DEM and conventional tuning methodologies based on closed-form expressions. Finally, to achieve a realistic tuning, other critical variables should be considered, and a more comprehensive analysis is required (e.g., analysis on the stochastic nature of the seismic site conditions).
5. Conclusions
In this study, a methodology for the selection of optimal design parameters for TMDs based on WOA to reduce the dynamic response of buildings subjected to seismic excitations was presented. Six different objective functions were proposed to be minimized in the WOA methodology. These functions were related to the reduction of the maximum horizontal peak displacement of the structure, the RMS response of displacements, and four more weighted linear combinations of the same parameters. The proposed methodology was applied to a 32-story case-study derived from an actual building structure, and subjected to different ground motion records.
According to the analysis on the dynamic history of displacements of the structure, it may be concluded that the J1 optimization approach, which gives 20% weight to the peak floor displacements and 80% weight to the RMS response of displacements, led to the best reductions in the transient response within both evaluated parameters, although a good performance was also exhibited using OA2 and J2 optimization approaches. Furthermore, a weighted procedure for determining an average design set of parameters for TMDs was explored. The methodology, proposed originally for base isolation systems, was adapted for the tuning of linear mass dampers, showing promising results that can be improved in forthcoming investigations by considering a large number of records in the tuning process. The proposed technique for obtaining design parameters of TMDs based on WOA is demonstrated to be successful, fast, and reliable by achieving percentages of reduction in the maximum floor displacement of up to 43% and RMS values of displacement of up to 52%.
The results of this research highlighted the advantages of the WOA over other well-known metaheuristics, such as DEM and other bio-inspired algorithms. The proposed technique exhibited less computational cost, avoiding operations like mutation or crossover, and reductions in the processing time up to 45% were observed. Finally, to perform a realistic tuning of TMDs through WOA, a more comprehensive analysis is required. Future works should take into account inter-story drifts and floor accelerations which are directly associated with the structural damage, as well as consider the nonlinear properties of the structural system. Further, the stochastic analysis of the seismic signal should also be considered by developing a sensitivity analysis (e.g., a greater number of records with greater probability of occurrence and its effects on the structure must be analyzed) and reproducing synthetic accelerograms based on the damping and frequency site conditions to be used in the tuning process via WOA.
Author Contributions
Conceptualization, L.A.L.-V. and D.C.; methodology, L.A.L.-V. and D.C.; software, L.A.L.-V. and D.C.; validation, D.C.; formal analysis, L.A.L.-V. and D.C.; investigation, L.A.L.-V. and D.C.; resources, L.A.L.-V., D.C. and Y.V.-G.; writing—original draft preparation, D.C.; writing—review and editing, L.A.L.-V., D.C. and Y.V.-G.; visualization, L.A.L.-V., D.C. and Y.V.-G.; supervision, L.A.L.-V. and Y.V.-G. All authors have read and agreed to the published version of the manuscript.
Funding
The research and publication of this study was funded by Convocatoria para el Apoyo a Proyectos de Investigación y Creación Artística en la Universidad Nacional de Colombia-Sede Medellín 2020 (grant no. 49741).
Institutional Review Board Statement
Not applicable.
Informed Consent Statement
Not applicable.
Data Availability Statement
All data included in this study are available upon request by contact with the corresponding author.
Acknowledgments
The authors wish to thank Universidad Nacional de Colombia Sede Medellín for the financial aid and support of this research.
Conflicts of Interest
The authors declare no conflict of interest.
References
- Buckle, I.G. Passive control of structures for seismic loads. Bull. N. Z. Soc. Earthq. Eng. 2000, 33, 209–221. [Google Scholar] [CrossRef] [Green Version]
- Spencer, B.F.; Nagarajaiah, S. State of the Art of Structural Control. J. Struct. Eng. 2003, 129, 845–856. [Google Scholar] [CrossRef]
- Cimellaro, G.P.; Marasco, S. Tuned-mass dampers. In Introduction to Dynamics of Structures and Earthquake Engineering; Springer: Cham, Germany, 2018; pp. 421–438. [Google Scholar]
- Frahm, H. Device for Damping Vibrations of Bodies. U.S. Patent No. 989,958, 18 April 1911. [Google Scholar]
- Ormondroyd, J.; Hartog, J.P.D. Theory of the dynamic vibration absorber. Trans. Am. Soc. Mech. Eng. 1928, 50, 9–22. [Google Scholar]
- den Hartog, J.P. Mechanical Vibrations; Dover Publications, Inc.: New York, NY, USA, 1985. [Google Scholar]
- Warburton, G.B. Optimum absorber parameters for minimizing vibration response. Earthq. Eng. Struct. Dyn. 1981, 9, 251–262. [Google Scholar] [CrossRef]
- Warburton, G.B. Optimum absorber parameters for various combinations of response and excitation parameters. Earthq. Eng. Struct. Dyn. 1982, 10, 381–401. [Google Scholar] [CrossRef]
- Sadek, F.; Mohraz, B.; Taylor, A.W.; Chung, R.M. A method of estimating the parameters of tuned mass dampers for seismic applications. Earthq. Eng. Struct. Dyn. 1997, 26, 617–635. [Google Scholar] [CrossRef]
- Holmes, J. Listing of installations. Eng. Struct. 1995, 17, 676–678. [Google Scholar] [CrossRef]
- Soto, M.G.; Adeli, H. Tuned mass dampers. Arch. Comput. Methods Eng. 2013, 20, 419–431. [Google Scholar] [CrossRef]
- Gerges, R.R.; Vickery, B.J. Optimum design of pendulum-type tuned mass dampers. Struct. Des. Tall Spéc. Build. 2005, 14, 353–368. [Google Scholar] [CrossRef]
- Setareh, M.; Ritchey, J.K.; Baxter, A.J.; Murray, T.M. Pendulum Tuned Mass Dampers for Floor Vibration Control. J. Perform. Constr. Facil. 2006, 20, 64–73. [Google Scholar] [CrossRef]
- Lourenco, R. Design Construction and Testing of an Adaptive Pendulum Tuned Mass Damper. Master’s Thesis, University of Waterloo, Waterloo, ON, Canada, 2011. [Google Scholar]
- Sakai, F. Tuned liquid column damper-new type device for suppression of building vibration. In Proceedings of the 1st International Conference on High-rise Buildings, Nanjing, China, 25–27 March 1989; pp. 926–931. [Google Scholar]
- Mondal, J.; Nimmala, H.; Abdulla, S.; Tafreshi, R. Tuned liquid damper. In Proceedings of the 3rd International Conference on Mechanical Engineering and Mechatronics, Prague, Czech Republic, 14–15 August 2014. Paper. No. 68. [Google Scholar]
- Di Matteo, A.; Furtmüller, T.; Adam, C.; Pirrotta, A. Optimal design of tuned liquid column dampers for seismic response control of base-isolated structures. Acta Mech. 2017, 229, 437–454. [Google Scholar] [CrossRef] [Green Version]
- Almazán, J.L.; De la Llera, J.C.; Inaudi, J.A.; López-García, D.; Izquierdo, L.E. A bidirectional and homogeneous tuned mass damper: A new device for passive control of vibrations. Eng. Struct. 2007, 29, 1548–1560. [Google Scholar] [CrossRef]
- Aldemir, U. Optimal control of structures with semiactive-tuned mass dampers. J. Sound Vib. 2003, 266, 847–874. [Google Scholar] [CrossRef]
- Pourzeynali, S.; Lavasani, H.; Modarayi, A. Active control of high rise building structures using fuzzy logic and genetic algorithms. Eng. Struct. 2007, 29, 346–357. [Google Scholar] [CrossRef]
- Lavasani, S.H.H.; Doroudi, R. Meta heuristic active and semi-active control systems of high-rise building. Int. J. Struct. Eng. 2020, 10, 232–253. [Google Scholar] [CrossRef]
- Kaynia, A.M.; Veneziano, D.; Biggs, J.M. Seismic Effectiveness of Tuned Mass Dampers. J. Struct. Div. 1981, 107, 1465–1484. [Google Scholar] [CrossRef]
- Sladek, J.R.; Klinger, R.E. Effect of tune mass dampers of seismic response. J. Struct. Eng. ASCE 1983, 109, 2004–2009. [Google Scholar] [CrossRef]
- Alexander, N.A.; Schilder, F. Exploring the performance of a nonlinear tuned mass damper. J. Sound Vib. 2009, 319, 445–462. [Google Scholar] [CrossRef]
- Li, L.; Du, Y. Design of Nonlinear Tuned Mass Damper by Using the Harmonic Balance Method. J. Eng. Mech. 2020, 146, 04020056. [Google Scholar] [CrossRef]
- Nigdeli, S.M.; Bekdaş, G. Optimum design of multiple positioned tuned mass dampers for structures constrained with axial force capacity. Struct. Des. Tall Spéc. Build. 2019, 28, e1593. [Google Scholar] [CrossRef]
- Marian, L.; Giaralis, A. Optimal design of a novel tuned mass-damper–inerter (TMDI) passive vibration control configuration for stochastically support-excited structural systems. Probabilistic Eng. Mech. 2014, 38, 156–164. [Google Scholar] [CrossRef]
- Giaralis, A.; Taflanidis, A. Optimal tuned mass-damper-inerter (TMDI) design for seismically excited MDOF structures with model uncertainties based on reliability criteria. Struct. Control. Health Monit. 2018, 25, e2082. [Google Scholar] [CrossRef]
- Ruiz, R.; Taflanidis, A.; Giaralis, A.; Lopez-Garcia, D. Risk-informed optimization of the tuned mass-damper-inerter (TMDI) for the seismic protection of multi-storey building structures. Eng. Struct. 2018, 177, 836–850. [Google Scholar] [CrossRef]
- Salvi, J.; Rizzi, E. Optimum tuning of Tuned Mass Dampers for frame structures under earthquake excitation. Struct. Control. Heal. Monit. 2015, 22, 707–725. [Google Scholar] [CrossRef]
- Islam, M.S.; Do, J.; Kim, D. Multi-Objective Optimization of TMD for Frame Structure Based on Response Surface Methodology and Weighted Desirability Function. KSCE J. Civ. Eng. 2017, 22, 3015–3027. [Google Scholar] [CrossRef]
- Salvi, J.; Rizzi, E.; Rustighi, E.; Ferguson, N.S. Optimum Tuning of Passive Tuned Mass Dampers for the Mitigation of Pulse-Like Responses. J. Vib. Acoust. 2018, 140, 061014. [Google Scholar] [CrossRef] [Green Version]
- Leung, A.Y.T.; Zhang, H.; Cheng, C.C.; Lee, Y.Y.R. Particle swarm optimization of TMD by non-stationary base excitation during earthquake. Earthq. Eng. Struct. Dyn. 2008, 37, 1223–1246. [Google Scholar] [CrossRef]
- Leung, A.; Zhang, H. Particle swarm optimization of tuned mass dampers. Eng. Struct. 2009, 31, 715–728. [Google Scholar] [CrossRef]
- Bekdaş, G.; Nigdeli, S.M. Estimating optimum parameters of tuned mass dampers using harmony search. Eng. Struct. 2011, 33, 2716–2723. [Google Scholar] [CrossRef]
- Bekdaş, G.; Nigdeli, S.M. Mass ratio factor for optimum tuned mass damper strategies. Int. J. Mech. Sci. 2013, 71, 68–84. [Google Scholar] [CrossRef]
- Nigdeli, S.M.; Bekdaş, G. Optimum tuned mass damper design in frequency domain for structures. KSCE J. Civ. Eng. 2017, 21, 912–922. [Google Scholar] [CrossRef]
- Bekdaş, G.; Nigdeli, S.M. Optimization of tuned mass damper with harmony search. In Metaheuristic Applications in Structures and Infrastructures; Gandomi, A.H., Yang, X.-S., Alavi, A.H., Talatahari, S., Eds.; Elsevier: Amsterdam, The Netherlands, 2013; pp. 345–371. [Google Scholar]
- Nigdeli, S.M.; Bekdaş, G. Tuning and position optimization of mass dampers for seismic structures. In Proceedings of the International Conference on Harmony Search Algorithm Springer, Singapore, 22–24 February 2017; pp. 232–239. [Google Scholar]
- Bekdaş, G.; Nigdeli, S.M.; Yang, X.S. Metaheuristic based optimization for tuned mass dampers using frequency domain responses. In Proceedings of the International Conference on Harmony Search Algorithm Springer, Singapore, 22–24 February 2017; pp. 271–279. [Google Scholar]
- Farshidianfar, A.; Soheili, S. Optimization of TMD parameters for earthquake vibrations of tall buildings including soil structure interaction. Iran Univ. Sci. Technol. 2013, 3, 409–429. [Google Scholar]
- Farshidianfar, A.; Soheili, S. Ant colony optimization of tuned mass dampers for earthquake oscillations of high-rise structures including soil-structure interaction. Soil Dyn. Earthq. Struct. 2013, 51, 14–22. [Google Scholar] [CrossRef]
- Nigdeli, S.M.; Bekdaş, G.; Yang, X.S. Optimum tuning of mass dampers for seismic structures using flower pollination algorithm. Int. J. Theor. Appl. Mech. 2016, 1, 264–268. [Google Scholar]
- Nigdeli, S.M.; Bekdaş, G.; Yang, X.S. Optimum tuning of mass dampers by using a hybrid method using harmony search and flower pollination algorithm. In Proceedings of the International Conference on Harmony Search Algorithm Springer, Singapore, 22–24 February 2017; pp. 222–231. [Google Scholar]
- Yucel, M.; Bekdaş, G.; Nigdeli, S.M.; Sevgen, S. Estimation of optimum tuned mass damper parameters via machine learning. J. Build. Eng. 2019, 26, 100847. [Google Scholar] [CrossRef]
- Bekdaş, G.; Nigdeli, S.M.; Yang, X.-S. A novel bat algorithm based optimum tuning of mass dampers for improving the seismic safety of structures. Eng. Struct. 2018, 159, 89–98. [Google Scholar] [CrossRef]
- Etedali, S.; Rakhshani, H. Optimum design of tuned mass dampers using multi-objective cuckoo search for buildings under seismic excitations. Alex. Eng. J. 2018, 57, 3205–3218. [Google Scholar] [CrossRef]
- Pourzeynali, S.; Salimi, S.; Kalesar, H.E. Robust multi-objective optimization design of TMD control device to reduce tall building responses against earthquake excitations using genetic algorithms. Sci. Iran. 2013, 20, 207–221. [Google Scholar]
- Pourzeynali, S.; Salimi, S. Multi-objective optimization design of control devices to suppress tall buildings vibrations against earthquake excitations using fuzzy logic and genetic algorithms. In Design Optimization of Active and Passive Structural Control Systems; Lagaros, N.D., Ed.; IGI Global: Hershey, PA, USA, 2015; pp. 180–215. [Google Scholar]
- Pal, S.; Singh, D.; Kumar, V. Hybrid SOMA: A tool for optimizing TMD parameters. In Proceedings of the Sixth International Conference on Soft Computing for Problem Solving, Singapore, 23–24 December 2017; Springer: Berlin/Heidelberg, Germany, 2017; pp. 35–41. [Google Scholar]
- Kaveh, A.; Javadi, S.; Moghanni, R.M. Optimal structural control of tall buildings using tuned mass dampers via chaotic optimization algorithm. Structures 2020, 28, 2704–2713. [Google Scholar] [CrossRef]
- Bekdaş, G.; Nigdeli, S.M. Metaheuristic based optimization of tuned mass dampers under earthquake excitation by considering soil-structure interaction. Soil Dyn. Earthq. Eng. 2017, 92, 443–461. [Google Scholar] [CrossRef]
- Salvi, J.; Pioldi, F.; Rizzi, E. Optimum Tuned Mass Dampers under seismic Soil-Structure Interaction. Soil Dyn. Earthq. Eng. 2018, 114, 576–597. [Google Scholar] [CrossRef]
- Bekdaş, G.; Nigdeli, S.M. An Optimum Tuning Application of Mass Dampers Considering Soil-Structure Interaction: Metaheuristic-Based Optimization of TMDs. In Handbook of Research on Predictive Modeling and Optimization Methods in Science and Engineering; Kim, D., Sekhar Roy, S., Länsivaara, T., Deo, R., Samui, P., Eds.; IGI Global: Hershey, PA, USA, 2018; pp. 44–73. [Google Scholar]
- Bekdaş, G.; Kayabekir, A.E.; Nigdeli, S.M.; Toklu, Y.C. Transfer function amplitude minimization for structures with tuned mass dampers considering soil-structure interaction. Soil Dyn. Earthq. Eng. 2019, 116, 552–562. [Google Scholar] [CrossRef]
- Mirjalili, S.; Lewis, A. The Whale Optimization Algorithm. Adv. Eng. Softw. 2016, 95, 51–67. [Google Scholar] [CrossRef]
- Storn, R.; Price, K.V. Differential Evolution—A Simple and Efficient Heuristic for global Optimization over Continuous Spaces. J. Glob. Optim. 1997, 11, 341–359. [Google Scholar] [CrossRef]
- Caicedo, D.; Lara-Valencia, L.; Blandon, J.; Farbiarz, Y. Differential Evolution for the Optimal Design of Tuned Mass Dampers in a Building of Medellin City. In Proceedings of the 17th World Conference on Earthquake Engineering, Sendai, Japan, 27 September–2 October 2020. [Google Scholar]
- Caicedo, D.; Lara-Valencia, L.; Blandon, J.; Graciano, C. Seismic response of high-rise buildings through metaheuristic-based optimization using tuned mass dampers and tuned mass dampers inerter. J. Build. Eng. 2021, 34, 101927. [Google Scholar] [CrossRef]
- Fallah, N.; Zamiri, G. Multi-objective optimal design of sliding base isolation using genetic algorithm. Sci. Iran. 2012, 20, 87–96. [Google Scholar] [CrossRef] [Green Version]
- Kaveh, A.; Ghazaan, M.I. Enhanced whale optimization algorithm for sizing optimization of skeletal structures. Mech. Base. Des. Struct. Mach. 2017, 45, 345–362. [Google Scholar] [CrossRef]
- Chen, H.; Xu, Y.; Wang, M.; Zhao, X. A balanced whale optimization algorithm for constrained engineering design problems. Appl. Math. Model. 2019, 71, 45–59. [Google Scholar] [CrossRef]
- Azizi, M.; Ejlali, R.G.; Ghasemi, S.A.M.; Talatahari, S. Upgraded whale optimization algorithm for fuzzy logic based vibration control of nonlinear steel structure. Eng. Struct. 2019, 192, 53–70. [Google Scholar] [CrossRef]
- Pacific Earthquake Engineering Research Center: Ground Motion Database. Available online: http://peer.berkeley.edu/peer_ground_motion_database (accessed on 11 November 2019).
- Lara-Valencia, L.; Caicedo, D.; Farbiarz, Y.; Brito, J.; Valencia-Gonzalez, Y. Design of a Tuned Mass Damper Inerter using optimization based on exhaustive search for the vibration control of a seismically excited structure. In Proceedings of the 17th World Conference on Earthquake Engineering, Sendai, Japan, 27 September–2 October 2020. [Google Scholar]
- Yang, L.J.; Liu, D.W.; Guo, Z.L.; Li, J.; Dai, B.H. Engineering Mechanics in Whipping Effect of High-Rise Building. Appl. Mech. Mater. 2014, 540, 173–176. [Google Scholar] [CrossRef]
Figure 1.
n-DOF system controlled via TMDs for seismic applications.

Figure 2.
Description of the WOA procedure.

Figure 3.
Calibration process of the optimization algorithm.

Figure 4.
Scatter graphs for TMD design parameters: (a) DE; (b) ES; (c) WOA.

Figure 5.
Displacement of the 32nd story of the structure equipped with TMDs with μ = 0.02.

Figure 6.
Displacement of the 32nd story of the structure equipped with TMDs with μ = 0.05.

Figure 7.
Maximum floor displacement at each story level of the structure equipped with TMDs with µ = 0.02.
Figure 7.
Maximum floor displacement at each story level of the structure equipped with TMDs with µ = 0.02.

Figure 8.
Maximum floor displacement at each story level of the structure equipped with TMDs with µ = 0.05.
Figure 8.
Maximum floor displacement at each story level of the structure equipped with TMDs with µ = 0.05.

Figure 9.
RMS displacement at each story level of the structure equipped with TMDs with µ = 0.02.

Figure 10.
RMS displacement at each story level of the structure equipped with TMDs with µ = 0.05.

Figure 11.
PI values for every optimization approach using TMDs with µ = 0.02.

Figure 12.
PI values for every optimization approach using TMDs with µ = 0.05.

Figure 13.
Performance of the structure equipped with TMDs with average design parameters subjected to Petrolia earthquake.
Figure 13.
Performance of the structure equipped with TMDs with average design parameters subjected to Petrolia earthquake.

Figure 14.
Performance of the structure equipped with TMDs with average design parameters subjected to San Fernando earthquake.
Figure 14.
Performance of the structure equipped with TMDs with average design parameters subjected to San Fernando earthquake.


Table 1.
Characterization of the benchmark records.
| Record | Event Name | Station | Component | PGA [g] | Duration [s] |
|---|---|---|---|---|---|
| 1 | El Centro | El Centro | S00E | 0.35 | 53.73 |
| 2 | Kobe | Takatori | 000 (CUE) | 0.61 | 30.03 |
| 3 | Loma Prieta | Capitolia | 90 DEG | 0.40 | 39.98 |
| 4 | Northridge | Rinaldi | S49W | 0.84 | 14.97 |
Table 2.
Complementary information on the calibration process.
| Generations | Number of Whales | f | ζd | PI | Time (s) |
|---|---|---|---|---|---|
| 5 | 10 | 0.98864896 | 0.22564242 | 0.617347181 | 169.58 |
| 30 | 1.00616516 | 0.17197331 | 0.615902907 | 504.07 | |
| 50 | 1.01274866 | 0.17694892 | 0.615874230 | 840.77 | |
| 100 | 1.00587946 | 0.18405395 | 0.615803508 | 1679.90 | |
| 200 | 1.00662822 | 0.18524315 | 0.615805754 | 3287.17 | |
| 500 | 1.00660307 | 0.18278162 | 0.615801297 | 10628.89 | |
| 10 | 10 | 1.00007356 | 0.23479706 | 0.617584632 | 336.71 |
| 30 | 1.00778482 | 0.17337128 | 0.615877755 | 982.16 | |
| 50 | 1.00759291 | 0.17604717 | 0.615840363 | 1712.72 | |
| 100 | 1.00688244 | 0.18293491 | 0.615801209 | 3295.85 | |
| 200 | 1.00677897 | 0.18340897 | 0.615801449 | 6502.30 | |
| 500 | 1.00691211 | 0.18258605 | 0.615801269 | 16239.38 | |
| 30 | 10 | 1.00318603 | 0.20829184 | 0.616279278 | 987.30 |
| 30 | 1.00560264 | 0.19178801 | 0.615864246 | 3040.44 | |
| 50 | 1.00602357 | 0.18895977 | 0.615830943 | 4927.09 | |
| 100 | 1.00689775 | 0.18258902 | 0.615801266 | 9913.04 | |
| 200 | 1.00682148 | 0.18313549 | 0.615801265 | 19411.94 | |
| 500 | 1.00687972 | 0.18277428 | 0.615801211 | 50530.47 | |
| 50 | 10 | 1.00153517 | 0.21820159 | 0.61668986 | 1614.58 |
| 30 | 1.00692485 | 0.18242744 | 0.615801361 | 4874.36 | |
| 50 | 1.00640186 | 0.18620664 | 0.615810253 | 8089.97 | |
| 100 | 1.00690462 | 0.18253989 | 0.615801298 | 15816.19 | |
| 200 | 1.00685867 | 0.18287912 | 0.615801204 | 32551.09 | |
| 500 | 1.00685883 | 0.18287700 | 0.615801204 | 83204.51 |
Table 3.
TMD design parameters optimized by objective function OA1 and OA2.
| μ = 0.02 | μ = 0.05 | |||||||||||||||||
|---|---|---|---|---|---|---|---|---|---|---|---|---|---|---|---|---|---|---|
| Earthquake Ground Motion | DEM | ES | WOA | DEM | ES | WOA | ||||||||||||
| ζd | f | Time (s) | ζd | f | Time (s) | ζd | f | Time (s) | ζd | f | Time (s) | ζd | f | Time (s) | ζd | f | Time (s) | |
| OA1 | ||||||||||||||||||
| El centro | 0.48 | 2.00 | 3821.31 | 0.50 | 2.00 | 18934.41 | 0.50 | 2.00 | 1721.31 | 0.40 | 2.00 | 3736.23 | 0.39 | 2.00 | 18647.96 | 0.39 | 2.00 | 1660.55 |
| Kobe | 0.01 | 0.95 | 2135.75 | 0.00 | 0.94 | 10582.55 | 0.01 | 0.94 | 962.05 | 0.36 | 1.40 | 2088.20 | 0.35 | 1.38 | 10422.45 | 0.40 | 1.31 | 928.09 |
| Loma Prieta | 0.03 | 1.09 | 2843.40 | 0.01 | 0.96 | 14088.92 | 0.00 | 0.95 | 1280.81 | 0.20 | 0.89 | 2780.10 | 0.16 | 0.89 | 13875.78 | 0.15 | 0.89 | 1235.60 |
| Northridge | 0.50 | 2.00 | 1064.68 | 0.50 | 2.00 | 5275.42 | 0.50 | 2.00 | 479.58 | 0.00 | 1.21 | 1040.97 | 0.50 | 2.00 | 5195.61 | 0.50 | 2.00 | 462.65 |
| OA2 | ||||||||||||||||||
| El centro | 0.21 | 0.90 | 3898.77 | 0.18 | 0.91 | 19003.27 | 0.18 | 0.91 | 1677.40 | 0.33 | 0.98 | 3816.45 | 0.34 | 0.98 | 18792.44 | 0.35 | 0.97 | 1699.75 |
| Kobe | 0.07 | 1.01 | 2179.04 | 0.07 | 1.00 | 10621.03 | 0.07 | 1.00 | 937.51 | 0.18 | 1.01 | 2133.04 | 0.17 | 1.01 | 10503.20 | 0.23 | 1.01 | 950.00 |
| Loma Prieta | 0.13 | 0.93 | 2901.04 | 0.10 | 0.90 | 14140.16 | 0.10 | 0.90 | 1248.14 | 0.16 | 0.86 | 2839.78 | 0.14 | 0.86 | 13983.28 | 0.16 | 0.85 | 1264.77 |
| Northridge | 0.14 | 0.93 | 1086.26 | 0.12 | 0.92 | 5294.60 | 0.11 | 0.92 | 467.35 | 0.22 | 0.84 | 1063.32 | 0.22 | 0.83 | 5235.86 | 0.22 | 0.84 | 473.58 |
Table 4.
TMD design parameters optimized by objective function J1, J2, J3, and J4.
| μ = 0.02 | μ = 0.05 | |||||||||||||||||
|---|---|---|---|---|---|---|---|---|---|---|---|---|---|---|---|---|---|---|
| Earthquake Ground Motion | DEM | ES | WOA | DEM | ES | WOA | ||||||||||||
| ζd | f | Time (s) | ζd | f | Time (s) | ζd | f | Time (s) | ζd | f | Time (s) | ζd | f | Time (s) | ζd | f | Time (s) | |
| J1 | ||||||||||||||||||
| El centro | 0.22 | 0.94 | 3901.19 | 0.21 | 0.93 | 19252.88 | 0.20 | 0.93 | 1757.29 | 0.35 | 1.03 | 3936.75 | 0.35 | 1.02 | 21074.23 | 0.35 | 1.02 | 1771.54 |
| Kobe | 0.07 | 1.01 | 2180.40 | 0.07 | 1.00 | 10760.54 | 0.08 | 1.00 | 982.16 | 0.18 | 1.01 | 2200.27 | 0.18 | 1.01 | 11778.50 | 0.17 | 1.01 | 990.12 |
| Loma Prieta | 0.11 | 0.94 | 2902.84 | 0.09 | 0.91 | 14325.89 | 0.10 | 0.91 | 1307.58 | 0.18 | 0.85 | 2929.30 | 0.16 | 0.89 | 15681.14 | 0.17 | 0.87 | 1318.19 |
| Northridge | 0.14 | 0.93 | 1086.93 | 0.12 | 0.93 | 5364.15 | 0.12 | 0.93 | 489.61 | 0.22 | 0.84 | 1096.84 | 0.22 | 0.84 | 5871.60 | 0.23 | 0.84 | 493.58 |
| J2 | ||||||||||||||||||
| El centro | 0.33 | 0.98 | 3898.77 | 0.31 | 0.98 | 20108.75 | 0.32 | 0.97 | 1715.43 | 0.37 | 1.06 | 3585.03 | 0.36 | 1.08 | 17755.27 | 0.31 | 1.10 | 1607.13 |
| Kobe | 0.10 | 1.04 | 2179.04 | 0.07 | 1.00 | 11238.90 | 0.08 | 0.99 | 958.76 | 0.22 | 1.03 | 2003.69 | 0.20 | 1.01 | 9923.52 | 0.21 | 1.01 | 898.24 |
| Loma Prieta | 0.06 | 0.95 | 2901.04 | 0.08 | 0.93 | 14962.74 | 0.08 | 0.93 | 1276.43 | 0.18 | 0.85 | 2667.59 | 0.16 | 0.89 | 13211.53 | 0.17 | 0.89 | 1195.85 |
| Northridge | 0.10 | 0.93 | 1086.26 | 0.12 | 0.93 | 5602.61 | 0.12 | 0.93 | 477.94 | 0.23 | 0.86 | 998.84 | 0.22 | 0.85 | 4946.89 | 0.23 | 0.85 | 447.77 |
| J3 | ||||||||||||||||||
| El centro | 0.50 | 1.22 | 3821.31 | 0.50 | 1.27 | 21056.73 | 0.50 | 1.22 | 1792.82 | 0.41 | 1.17 | 3727.83 | 0.42 | 1.19 | 18425.86 | 0.41 | 1.17 | 1653.28 |
| Kobe | 0.10 | 1.04 | 2135.75 | 0.06 | 0.99 | 11768.72 | 0.05 | 0.99 | 1002.02 | 0.31 | 1.03 | 2083.50 | 0.27 | 1.01 | 10298.31 | 0.31 | 1.02 | 924.03 |
| Loma Prieta | 0.06 | 0.95 | 2843.40 | 0.06 | 0.95 | 15668.12 | 0.05 | 0.95 | 1334.02 | 0.20 | 0.89 | 2773.84 | 0.16 | 0.89 | 13710.51 | 0.20 | 0.89 | 1230.19 |
| Northridge | 0.10 | 0.93 | 1064.68 | 0.12 | 0.94 | 5866.73 | 0.13 | 0.92 | 499.51 | 0.20 | 0.89 | 1038.63 | 0.23 | 0.87 | 5133.73 | 0.22 | 0.88 | 460.63 |
| J4 | ||||||||||||||||||
| El centro | 0.48 | 1.99 | 3898.77 | 0.50 | 2.00 | 17853.50 | 0.50 | 2.00 | 1622.96 | 0.41 | 1.98 | 3753.69 | 0.42 | 2.00 | 18590.50 | 0.42 | 2.00 | 1669.92 |
| Kobe | 0.01 | 0.95 | 2179.04 | 0.03 | 0.98 | 9978.42 | 0.08 | 0.97 | 907.08 | 0.48 | 1.19 | 2097.96 | 0.48 | 1.18 | 10390.33 | 0.50 | 1.15 | 933.33 |
| Loma Prieta | 0.02 | 0.95 | 2901.04 | 0.03 | 0.99 | 13284.63 | 0.04 | 0.96 | 1207.63 | 0.20 | 0.89 | 2793.09 | 0.16 | 0.89 | 13833.02 | 0.21 | 0.89 | 1242.58 |
| Northridge | 0.13 | 0.99 | 1086.26 | 0.11 | 0.97 | 4974.26 | 0.11 | 0.98 | 452.18 | 0.22 | 0.94 | 1045.84 | 0.23 | 0.93 | 5179.60 | 0.22 | 0.95 | 465.27 |
Table 5.
Average design parameters for TMDs with µ = 0.02 and µ = 0.05.
| µ | ζd avg | f avg |
|---|---|---|
| 0.02 | 0.103 | 0.967 |
| 0.05 | 0.209 | 0.929 |
Table 6.
Details of the new ground-motion records used.
| Record | Event Name | Station | Component | PGA (g) | Duration (s) |
|---|---|---|---|---|---|
| 1 | Petrolia | Cape Mendocino | 90 DEG | 0.66 | 59.98 |
| 2 | San Fernando | Pacoima | S74W | 1.08 | 41.74 |
Table 7.
Response parameters for the 32nd story of the structure subjected to Petrolia earthquake.
| TMD μ = 2% | |||||
| Max. Displacement | RMS Displacement | ||||
| Uncontrolled (m) | Controlled (m) | PI | Uncontrolled (m) | Controlled m) | PI |
| 0.7213 | 0.7047 | 0.9770 | 0.1569 | 0.1319 | 0.8406 |
| TMD μ = 5% | |||||
| Uncontrolled (m) | Controlled (m) | PI | Uncontrolled (m) | Controlled m) | PI |
| 0.7213 | 0.6781 | 0.9401 | 0.1569 | 0.1100 | 0.7013 |
Table 8.
Response parameters for the 32nd story of the structure subjected to San Fernando earthquake.
Table 8.
Response parameters for the 32nd story of the structure subjected to San Fernando earthquake.
| TMD μ = 2% | |||||
| Max. Displacement | RMS Displacement | ||||
| Uncontrolled (m) | Controlled (m) | PI | Uncontrolled (m) | Controlled (m) | PI |
| 0.3231 | 0.3225 | 0.9980 | 0.0839 | 0.0701 | 0.8354 |
| TMD μ = 5% | |||||
| Uncontrolled (m) | Controlled (m) | PI | Uncontrolled (m) | Controlled (m) | PI |
| 0.3231 | 0.3158 | 0.9772 | 0.0839 | 0.0630 | 0.7513 |
Publisher’s Note: MDPI stays neutral with regard to jurisdictional claims in published maps and institutional affiliations. |
© 2021 by the authors. Licensee MDPI, Basel, Switzerland. This article is an open access article distributed under the terms and conditions of the Creative Commons Attribution (CC BY) license (https://creativecommons.org/licenses/by/4.0/).
Share and Cite
MDPI and ACS Style
Lara-Valencia, L.A.; Caicedo, D.; Valencia-Gonzalez, Y. A Novel Whale Optimization Algorithm for the Design of Tuned Mass Dampers under Earthquake Excitations. Appl. Sci. 2021, 11, 6172. https://doi.org/10.3390/app11136172
AMA Style
Lara-Valencia LA, Caicedo D, Valencia-Gonzalez Y. A Novel Whale Optimization Algorithm for the Design of Tuned Mass Dampers under Earthquake Excitations. Applied Sciences. 2021; 11(13):6172. https://doi.org/10.3390/app11136172
Chicago/Turabian StyleLara-Valencia, Luis A., Daniel Caicedo, and Yamile Valencia-Gonzalez. 2021. "A Novel Whale Optimization Algorithm for the Design of Tuned Mass Dampers under Earthquake Excitations" Applied Sciences 11, no. 13: 6172. https://doi.org/10.3390/app11136172
Note that from the first issue of 2016, this journal uses article numbers instead of page numbers. See further details here.