A Modified Method for Evaluating Sustainable Transport Solutions Based on AHP and Dempster–Shafer Evidence Theory

1
School of Computer, Northwestern Polytechnical University, Xi’an 710072, China
2
School of Electronics and Information, Northwestern Polytechnical University, Xi’an 710072, China
*
Author to whom correspondence should be addressed.
Appl. Sci. 2018, 8(4), 563; https://doi.org/10.3390/app8040563
Submission received: 25 January 2018
/
Revised: 20 March 2018
/
Accepted: 3 April 2018
/
Published: 5 April 2018
(This article belongs to the Special Issue Smart Sustainable Manufacturing Systems)
Abstract
:With the challenge of transportation environment, a large amount of attention is paid to sustainable mobility worldwide, thus bringing the problem of the evaluation of sustainable transport solutions. In this paper, a modified method based on analytical hierarchy process (AHP) and Dempster–Shafer evidence theory (D-S theory) is proposed for evaluating the impact of transport measures on city sustainability. AHP is adapted to determine the weight of sustainability criteria while D-S theory is used for data fusion of the sustainability assessment. A Transport Sustainability Index (TSI) is presented as a primary measure to determine whether transport solutions have a positive impact on city sustainability. A case study of car-sharing is illustrated to show the efficiency of our proposed method. Our modified method has two desirable properties. One is that the BPA is generated with a new modification framework of evaluation levels, which can flexibly manage uncertain information. The other is that the modified method has excellent performance in sensitivity analysis.
1. Introduction
Transport has become the basis for the daily operation of society and economy, yet the reliance on transportation as a daily function is a substantive contributor to numerous problems faced by modern society, such as air pollution, noise, congestion, safety, travel delays, and many more [1,2]. To curb these growing problems, sustainable transport has entered the research field of transportation experts and has gradually gained increasing attention [3,4,5,6,7,8]. Sustainable transport is defined as “transportation that meets mobility needs while also preserving and enhancing human and ecosystem health, economic progress and social justice now and in the future [9]”. In other words, sustainable transport needs to promote sustainability in terms of society, environment, and economy. Research is under way to develop sustainable transport solutions, aiming to improve urban transport conditions either in terms of the environment, societal benefits, or the economy.
Instead, our attention is shifted to the evaluation of sustainable transport solutions—especially environment-friendly measures—as they influence city sustainability. These transport solutions include mode sharing such as car-sharing, bike-sharing [10], and park-and-ride systems [11]; intelligent transport solutions like electrical vehicles [12] and plug-in electric vehicles (PEVs) [13]; as well as multi-modal transport solutions [14,15,16], etc. A broad range of methods and techniques have been proposed to assess the impact of transport solutions on city sustainability. Jeon and Amekudzi [17] developed and determined indicator systems for measuring sustainability in transportation systems. Litman and Burwell [18] addressed the issues related to the definition, evaluation, and implementation of sustainable transportation. Forty-two techniques that could be used to evaluate the sustainability of urban transportation and 20 commentaries on the mentioned techniques were presented by Wellar [19] in the Transport Canada project.
Recently, Anjali Awasthi et al. [20] put forward a hybrid approach based on analytical hierarchy process (AHP) and Dempster–Shafer evidence theory (D-S theory) to evaluate the influence of environment-friendly transport measures on city sustainability. AHP was firstly used to structure and weight the criteria related to sustainability assessment. Then, the data from multiple information sources was combined using D-S theory and the utility estimation could be obtained. Finally, Transportation Sustainability Indexes (TSIs) with respect to the pre-test stage and post-test stage were compared to make a decision regarding whether the transportation measure had a positive impact on city sustainability and thus could be recommended for adoption in the city. The main advantage of this approach lies in the application of D-S theory to deal with uncertain and incomplete information.
However, the most important issue is not well addressed in Anjali Awasthi et al.’s method [20]: the representation of confidence in evaluation levels for utility is not basic probability assignments (BPAs), but only the probability function [21], which does not make full use of the feature of D-S theory. To address this issue, we propose a modified evidential model for evaluating sustainable transport solutions. The modified method can handle the referred issue in a simple but efficient way, which has two desirable properties: one is that the BPA is generated with a new modification framework of evaluation levels and hence it can flexibly manage uncertain information. The other is that the modified method has excellent performance in sensitivity analysis, which is conducted in terms of the conflictive information of the sustainability assessment and the weight changes of different criteria. Two techniques (AHP and D-S theory) are also referred, as AHP is an effective tool to determine the weight of different criteria in a multi-criteria decision-making (MCDM) problem and D-S theory can manage uncertain, ignorant, and missing information well that are very likely to happen in realistic situations [22,23,24,25,26,27,28,29].
The organization of the rest of this paper is as follows. Section 2 starts with a brief presentation of basic concepts. The proposed evidential model based on AHP and D-S theory to evaluate sustainable transport solutions is introduced in Section 3. Section 4 investigates the implementation of car-sharing in our proposed method. A discussion is presented in Section 5. In Section 6, the paper is ended with a brief summary.
2. Preliminaries
2.1. Dempster–Shafer Theory
Information in the real world is affected by a great deal of uncertainty. Many existing theories (e.g., probability theory, fuzzy numbers [30,31,32,33], Z-numbers [34,35,36], D-numbers [37,38,39], and Dempster–Shafer evidence theory) have been developed to represent various types of uncertainty. Dempster–Shafer evidence theory (D-S theory) can be regarded as a general extension of Bayesian theory. It was first proposed by Dempster in 1967 [40], and was developed to its present form by Glenn Shafer in 1976 [41]. D-S theory can present and handle uncertainty preferably than probability theory [42,43,44]. Moreover, it provides a combination rule to fuse different data from various information sources. D-S theory is now being studied for use in many fields, such as risk assessment [45,46], decision making [47,48,49], fault diagnosis [50,51], and others [52,53,54,55,56].
Let = be a finite nonempty set of n elements that are mutually exclusive and exhaustive, is the power set composed of elements of , and ∅ denotes the empty set. In D-S theory, mathematically a basic probability assignment (BPA) is a mapping: that satisfies
If m(A) > 0, A is called a focal element, and the set of all focal elements is named a body of evidence (BOE). The probability m(A) measures the belief exactly assigned to A and represents how strongly the evidence supports A. The mass of belief in an element of is quite similar to a probability distribution, but differs in the fact that the unit mass is distributed among the elements of , not only on single subsets but on composite hypotheses as well. This is why BPA can better represent the uncertainty of information.
Moreover, a combination tool is offered by D-S theory to fuse multiple belief assignments as follows:
where ⊕ represents the operator of combination. For two BOEs, Dempster’s rule of combination is defined as:
where
The denominator, , is a normalization factor. K is called the degree of conflict between BOEs [57,58]. Dempster’s rule strongly implies the agreement between diverse information and ignores the conflict between them. When information sources are in support of a similar proposition, it is able to reduce uncertainty in the combination result.
2.2. Analytic Hierarchy Process
Analytic hierarchy process (AHP), introduced by Thomas Satty (1980) [59], is an effective tool for dealing with complex decision making problem [60,61,62,63]. The weight determination process quantifies the subjective assessment of experts, and can check the consistency of decision-makers’ evaluation. Generally, the process of applying AHP can be divided into three steps.
Step 1: Constructing the pair-wise comparison judgement matrix.
Assume that n pieces of decision elements are presented as (, , , ⋯, ). In order to compute the weight of decision elements, a comparison judgement matrix represented as = is created:
, which satisfies:
Each entry represents the importance of the ith element on the jth element. If > 1, then the ith element is more important than the jth element, while if < 1, then the ith element is less important than the jth element. If two elements have the same importance, then the entry is 1. The relative importance between two decision elements is measured according to a numerical scale from 1 to 9, as shown in Table 1.
Step 2: Calculating the weight of decision elements.
The eigenvector of can be denoted as = (, , ,… , which is calculated using:
where is the largest eigenvalue of matrix . The eigenvector corresponding to the largest eigenvalue can be viewed as the final criterion for ranking goals.
Step 3: Checking the consistency index.
A consistency index (CI) is used to measure the consistency within each pair-wise comparison judgement matrix, which is defined as:
Accordingly, the consistency ratio (CR) can be calculated as follows:
where RI is the random index. RI and CR are related to the dimension of the matrix, which is listed in Table 2.
Generally, if CR > 0.1, the consistency of the pair-wise comparison matrix M is unacceptable and the elements in the matrix should be revised. Otherwise, M is considered acceptable and the eigenvector is treated as the weighing vector after normalization.
There are three main advantages in AHP: simplicity, practicability, and systematicness. Simplicity refers to the fact that the computation to determine the weight of criteria is concise and the result is clear in order to make decision-making convenient. Practicability means that AHP can deal with a wide range of problems compared to traditional optimization methods with the combination of qualitative and quantitative analysis. Systematicness can be understood to describe how AHP comprehensively regards the object as a system and then makes decisions according to the decomposition, comparison, and judgement.
3. The Proposed Method
The Framework of the Proposed Method
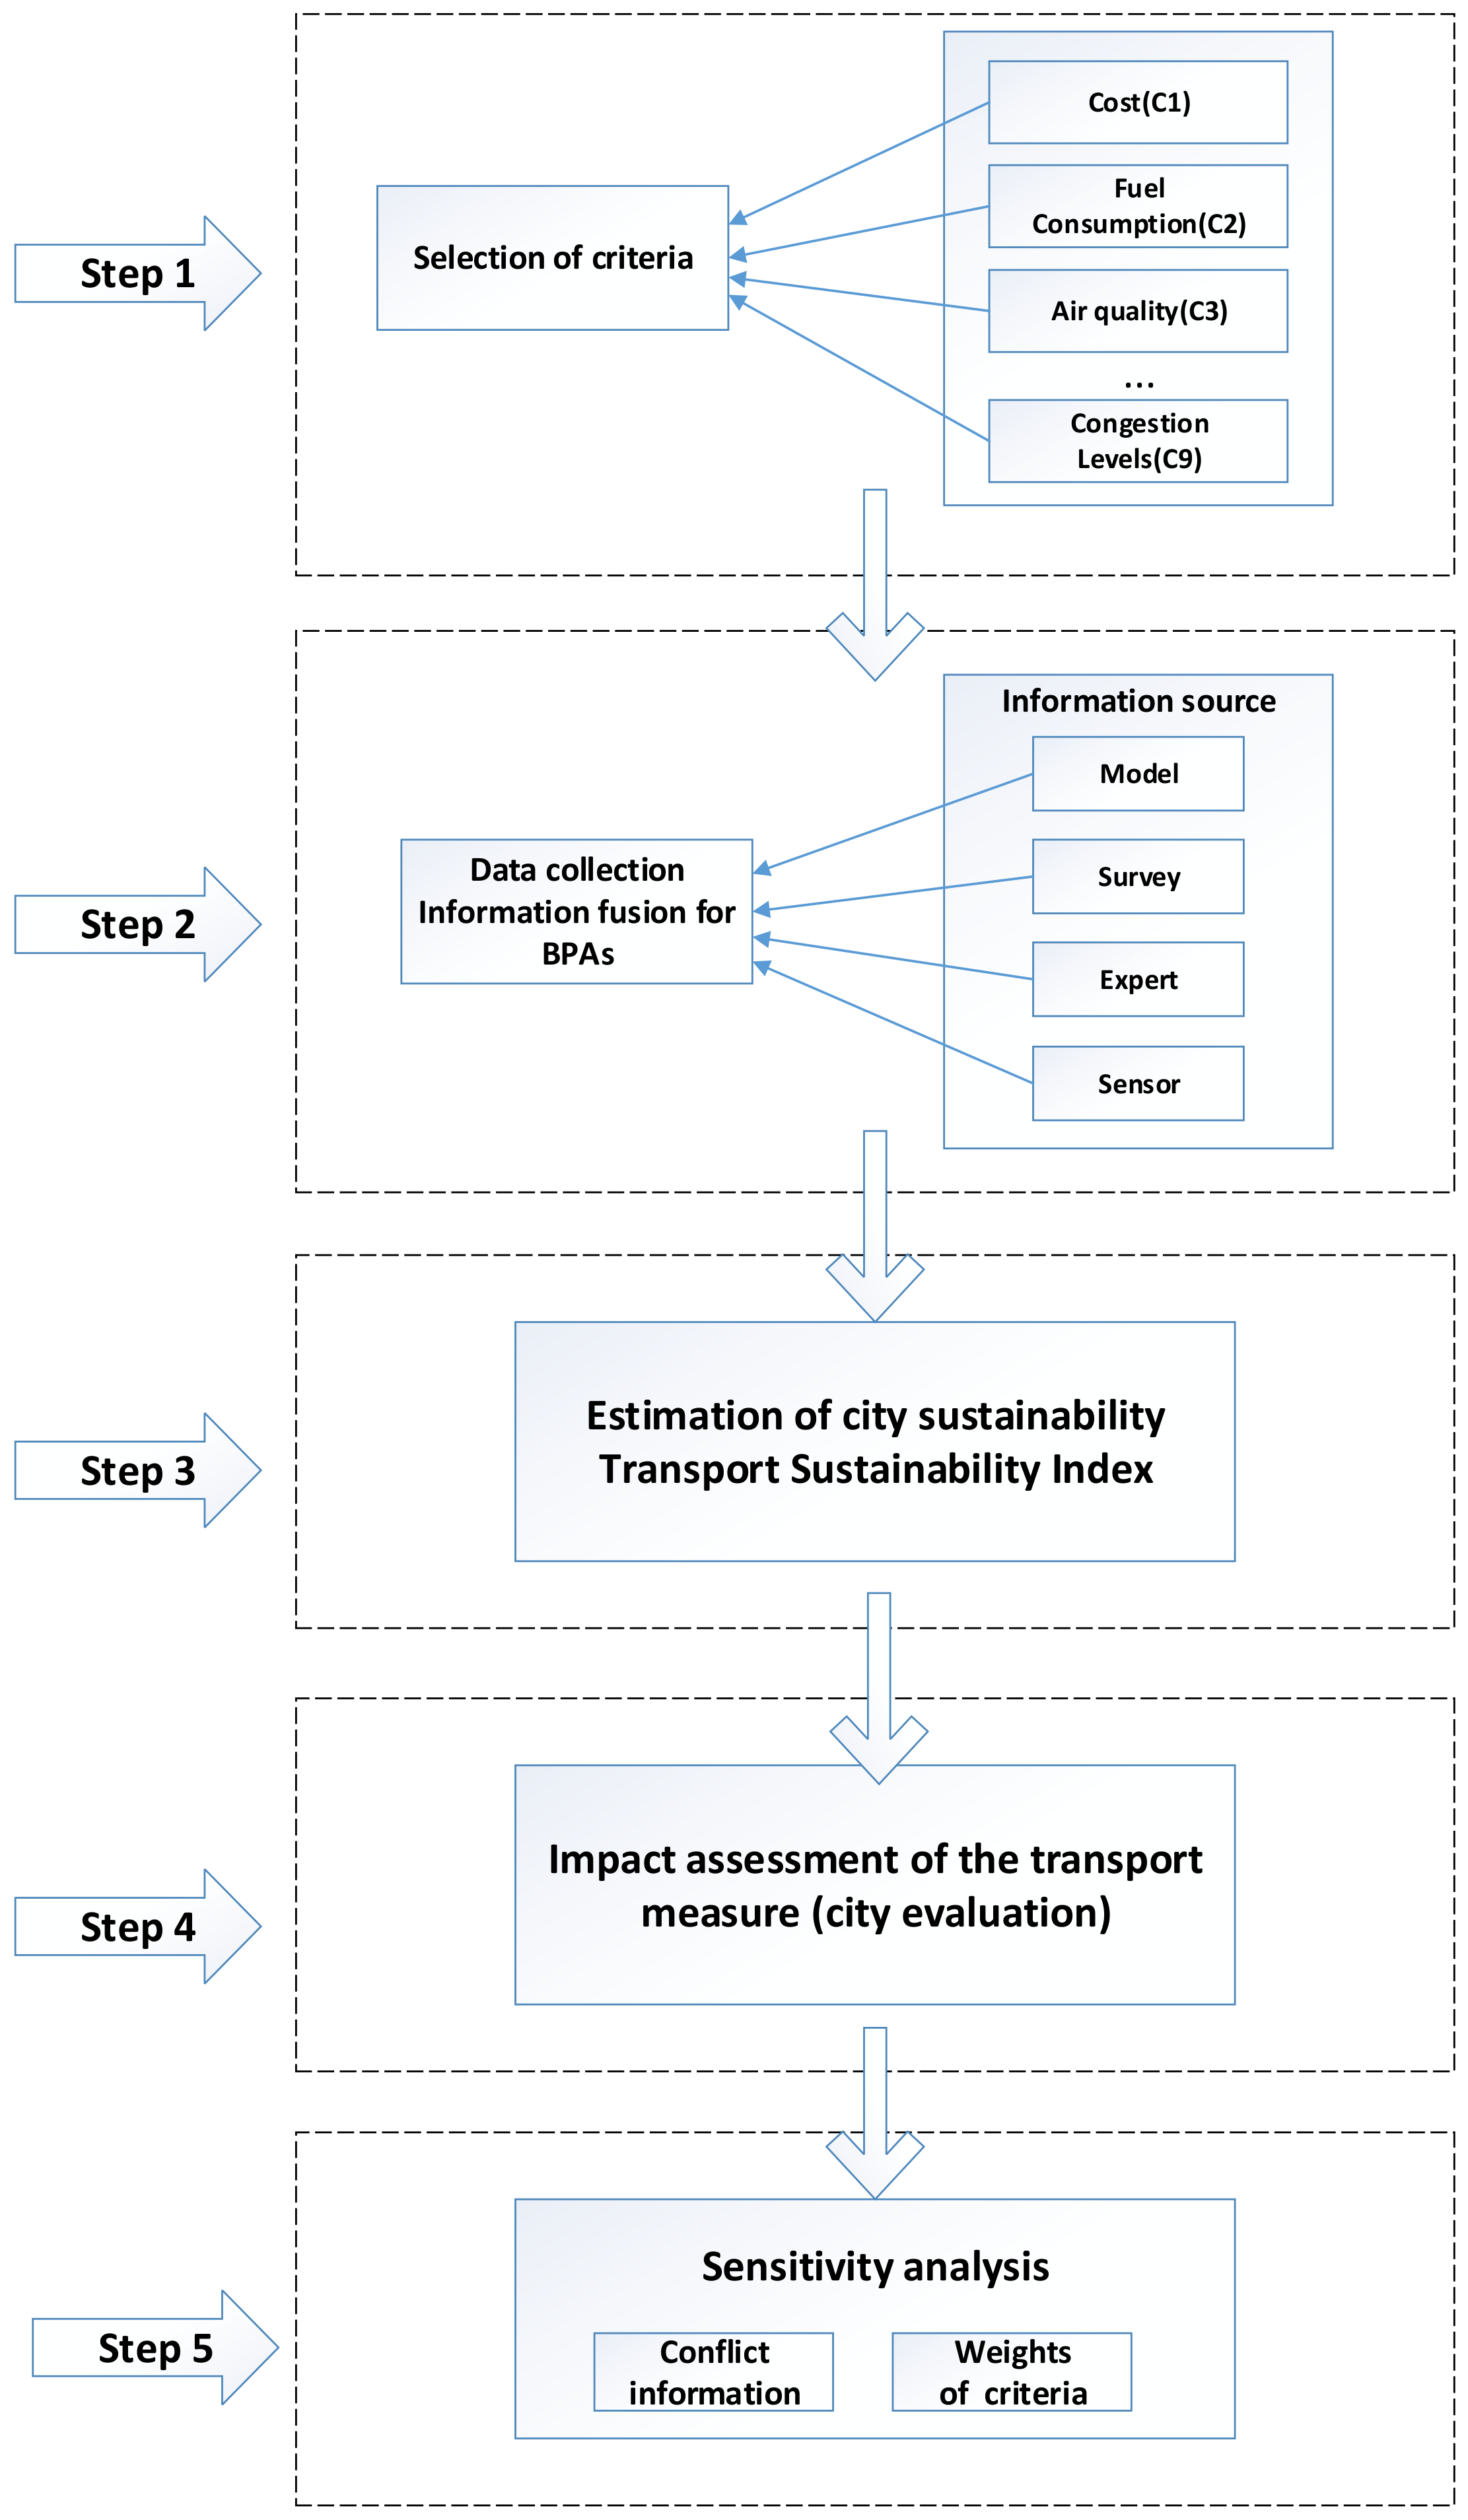
The motivation behind the development of the proposed method is to propose a generalized method based on belief functions to evaluate the sustainable transport solutions under consideration. The proposed method addresses both objectives. One is that the flexibility is improved since the method can deal with uncertainty and conflictive information due to D-S theory. The other is that the modified method has good performance in sensitivity analysis. The framework of our proposed method is shown in Figure 1.
Step 1: Selection of criteria.
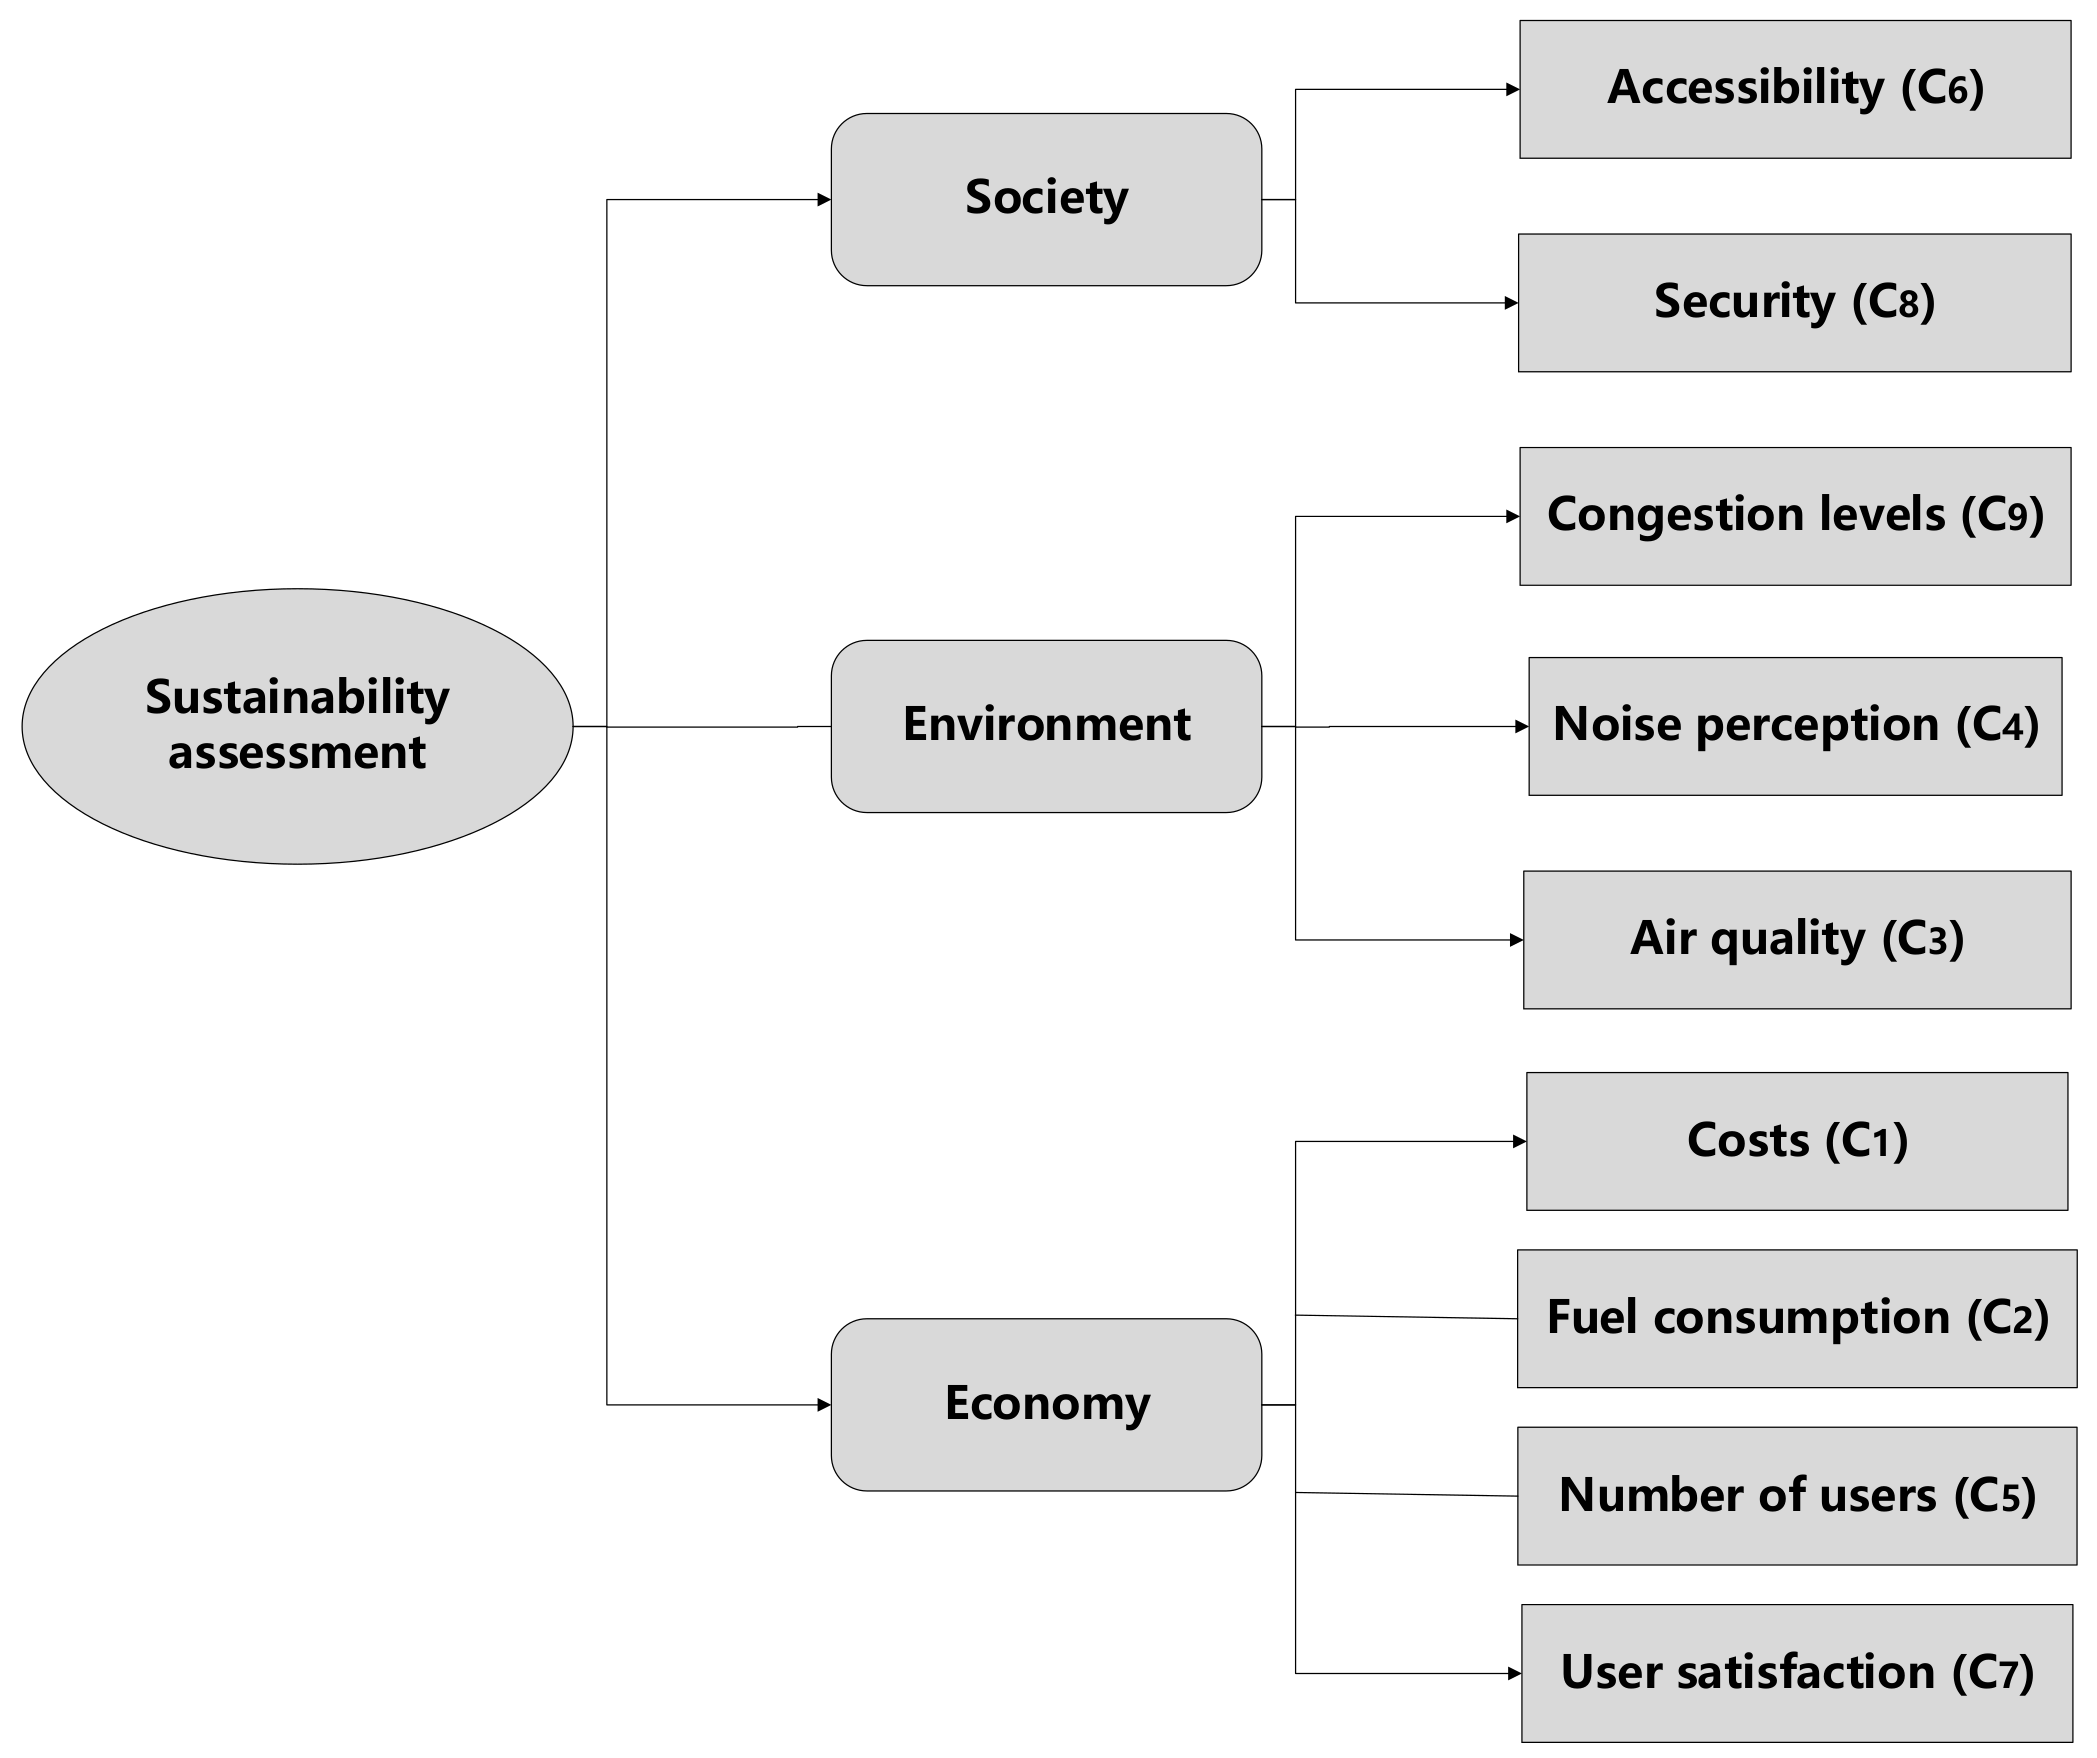
The elements of sustainability refer to the Brundtland report of 1987 [64], and social, economic, and environmental indicators were concluded by transport researchers. The more detailed elements on three indicators are based on specific situations. In [20], nine evaluation criteria for sustainability assessment are introduced—namely, cost (), fuel consumption (), air quality (), noise perception (), users numbers (), spatial accessibility (), satisfaction (), security (), and congestion level (), which are shown in Figure 2. AHP is used to determine the weight of different criteria, and detailed steps are represented in Section 2.2.
Step 2: Data collection and information fusion for BPAs.
After identifying evaluation criteria, data sets can be collected from various channels during the testing stage of the transportation measure. Anjali Awasthi et al. [20] mention four information sources: “Human experts”, “Sensors”, “Models” and “Survey”. For example, experts usually have professional related experience or knowledge on city transportation to guarantee the reliability of information. Surveys are conducted with city residents and the responses are further aggregated to obtain BPAs. Models can be determined by the type of given data. For example, input data can be the number of votes that support a certain transport solution on different criteria, and thus we can apply a probability model to construct BPAs. Sensors use a measurement technique to allocate BPA values to different criteria for the transportation measure under study. With respect to each criteria, BPAs from different information sources are aggregated using Dempster’s combination rule to generate a single belief function. The following will introduce the construction and representation of BPAs for collected data.
Experts allocate confidence to evaluation levels for each criteria. A new framework of evaluation level is proposed in this article: two evaluation levels, I and D. I means “increase” and D means “decrease”. The vector of utility related to evaluation levels is given by u: u = {u(I), u(D), u(I,D)}. In other words, there exists a frame of discernment represented as = {I, D}, = {{I}, {D}, {I, D}}, the belief distribution on evaluation levels is represented with a form of mass function (i.e., BPA).
For example, in terms of the criteria “Cost” for car-sharing, a BPA from expert is shown as follows:
This means that:
- (1)
- “car-sharing solution will increase utility in terms of cost with the belief degree 0.25”.
- (2)
- “car-sharing solution will decrease utility in terms of cost with the belief degree 0.25”.
- (3)
- “the expert does not know whether the utility will increase or decrease with the belief degree 0.5”.
Step 3: Utilities estimation.
For a certain transport solution, each criteria is either positively or negatively oriented with the utilities. For instance, a higher cost gets a lower utility while a higher air quality gets a higher utility. Complete utility values for nine criteria are shown in Table 3. Note that the number 1 represents the highest utility value, 0 represents the lowest utility value, and 0.3 represents an intermediate value chosen between 0 and 1. The global utility () for a criteria i can be calculated using the individual utility for evaluation levels ∈ {I, D} and the combined BPA. The formulation is as follows:
where p is equal to 3. = {I, D, {I,D}}, represents the individual utility of evaluation levels as shown in Table 3, and is the basic probability assignment related to each evaluation level .
Step 4: Estimation of city sustainability.
The global utilities for nine criteria can be used to estimate city sustainability at any given time t by a Transport Sustainability Index (TSI) [20]. Let us denote the global utilities for the criteria , , , ⋯, at time by (), (), (), ⋯, (). As a result, the transport sustainability index (TSI) at time is given by:
where is the weight of criteria obtained from AHP.
Step 5: Impact assessment of the transport measure.
The impact of the transportation measure on city sustainability is assessed by observing the change in TSI with respect to the pre-test and the post-test stages. Let represents a time instant in the pre-test stage and represent a time instant in the post-test stage, then the change in transport sustainability index over time interval [, ] is given by:
If Δ TSI > 0, we can conclude that the impact of the transportation measure on city sustainability is positive and thus the measure can be regarded as sustainable transport. If Δ TSI < 0, the measure will be rejected for recommendation due to unsustainability.
Step 6: Sensitivity analysis.
To check the effectiveness of our proposed method, two experiments of conflictive information and changed weights of criteria will be illustrated in this part to better compare the difference between the method of Anjali Awasthi et al. [20] and ours.
The first experiment is about conflictive information to address the question “How sensitive is the overall decision to conflictive information during the information fusion process?” Conflictive information arises very easily due to man-made error, a fault in the model, or the subjectivity of experts’ opinions. It is necessary to confirm that a method has redundancy to be more flexible and practical so that it has a more extensive application.
The second experiment is about the weight of criteria to address the question "How sensitive is the overall decision to small changes in the individual weight assigned during the pair-wise comparison process?" This question can be answered by slightly varying the values of weight and observing the effects on the decision. Moreover, because the weights of criteria are subjectively determined by experts using AHP, it is useful in situations where uncertainty exists in the definition of the importance of different factors.
4. Car-Sharing Application
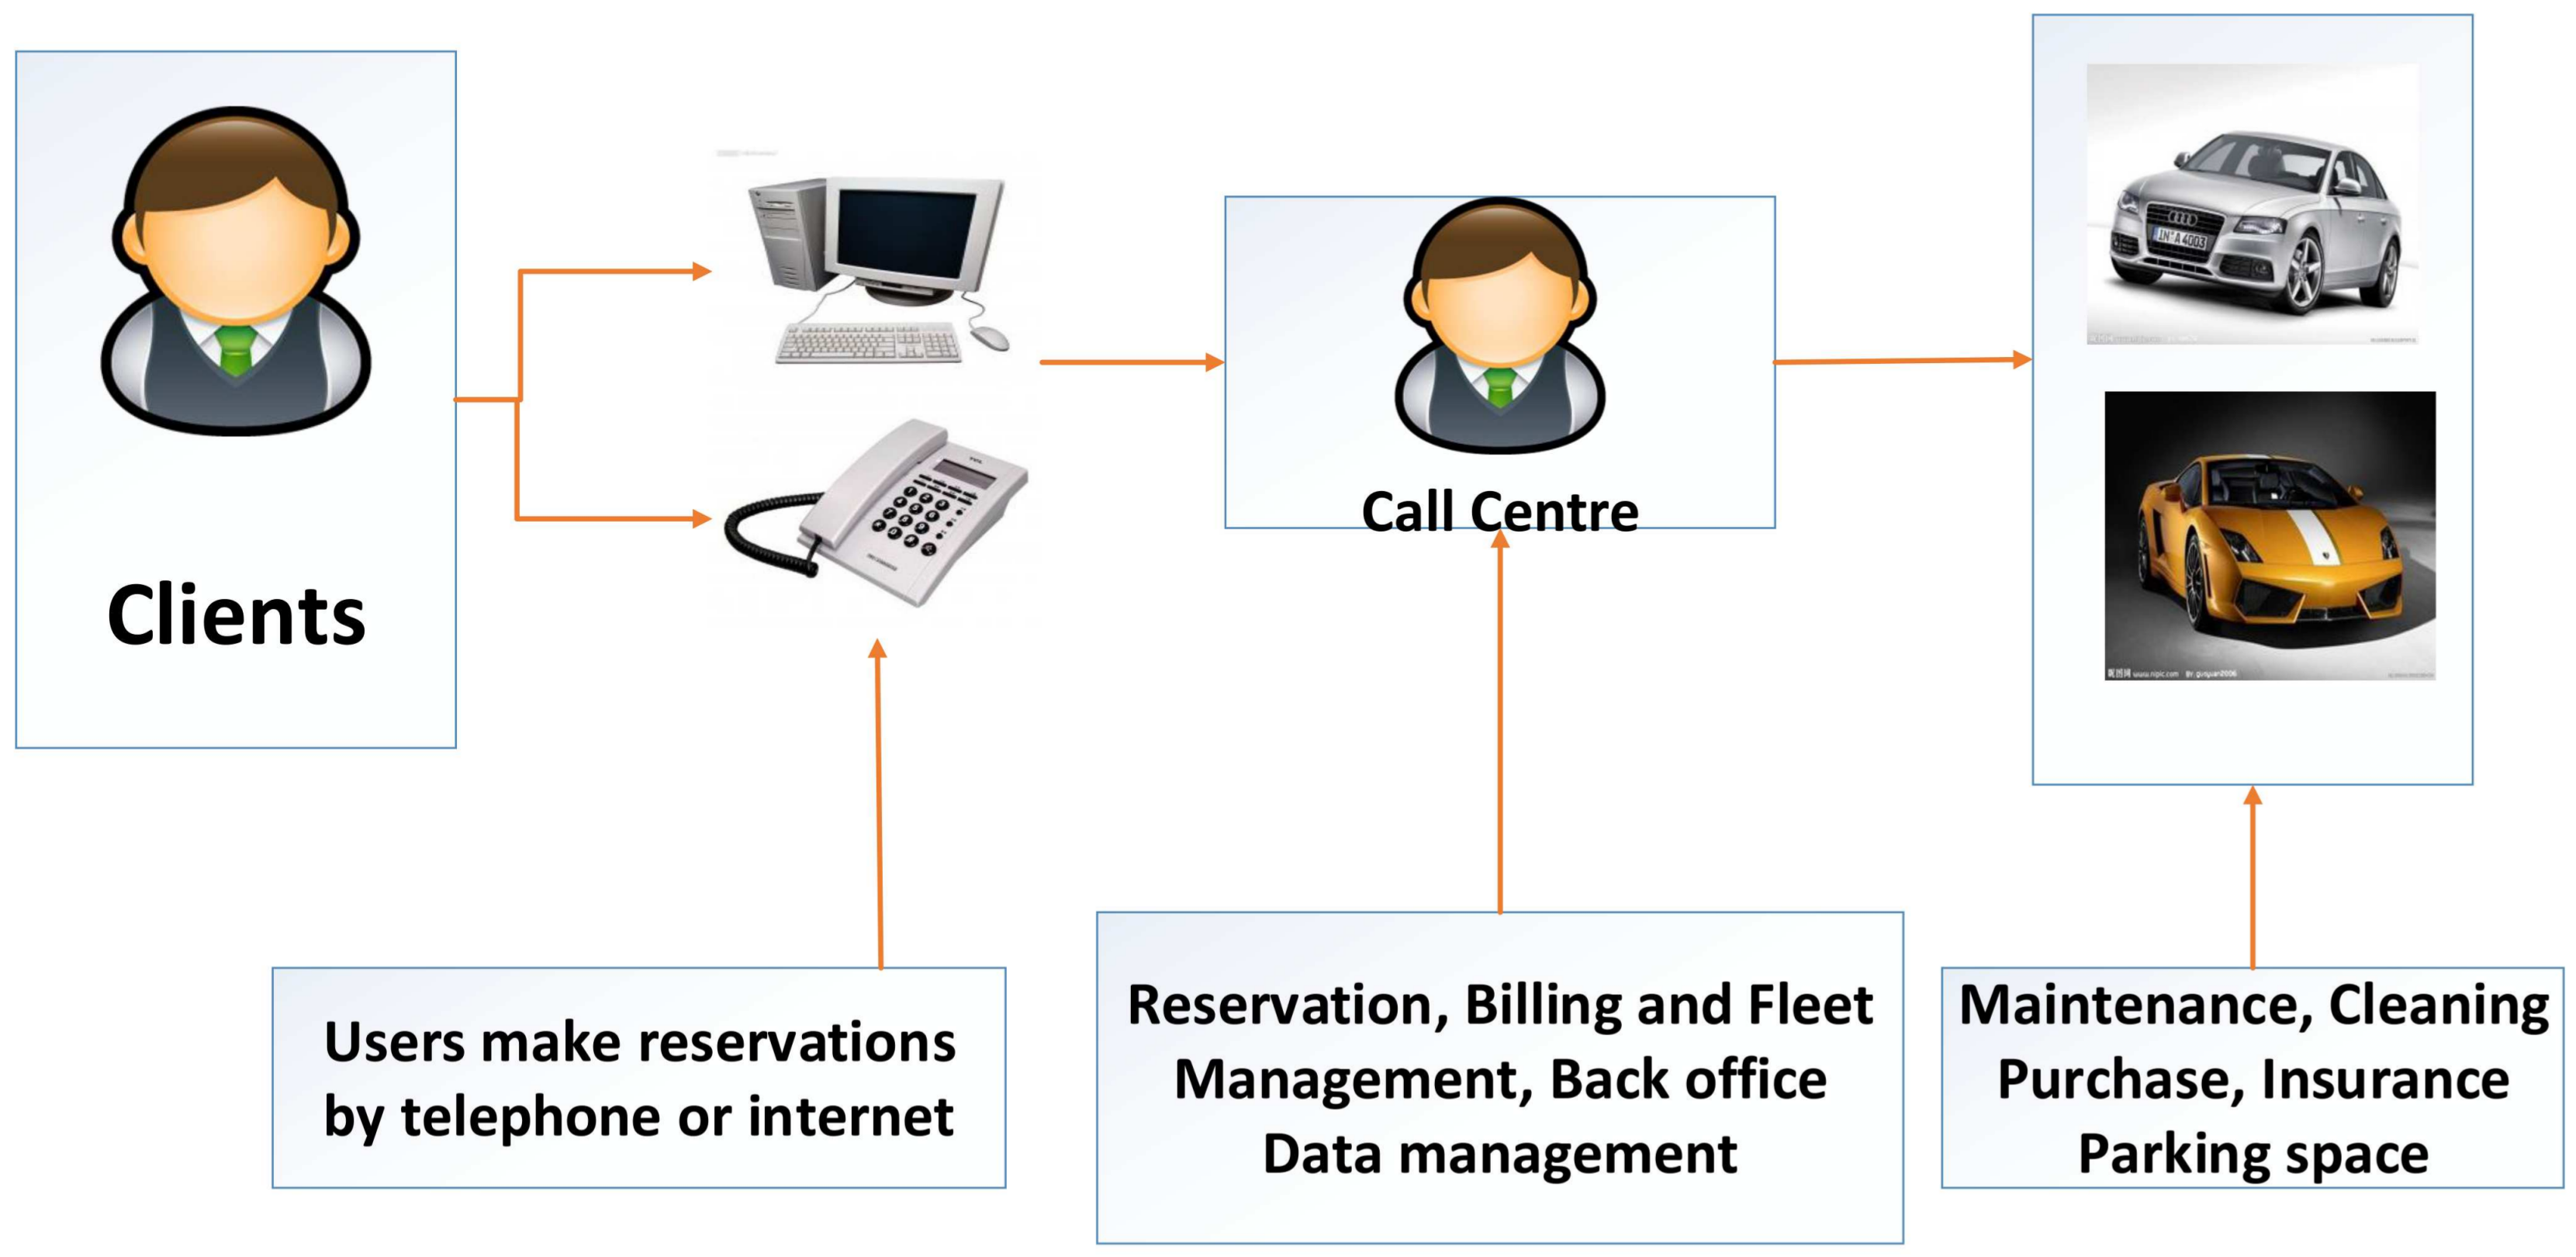
Car-sharing means that a car is shared with many people. It is an alternative system of car ownership. In other words, the driver of vehicle only has the use right but no ownership. Car-sharing is similar to chartering a rental car for a short time. Clients reserve the vehicle in advance by telephone or online and then can get access to the vehicle. In general, a company is used to coordinating the vehicle and is responsible for the insurance and parking of vehicles. Car-sharing is a feasible option to reduce vehicle emissions by minimising the number of private vehicle movements inside cities [65,66,67]. The architecture of a typical car-sharing organization (CSO) is illustrated in Figure 3.
The aim of this part is to evaluate the influence of car-sharing on city sustainability and provide valuable suggestions for the city transportation authority to determine whether car-sharing can be implemented in the city.
4.1. Selection of Criteria
In the car-sharing system, nine criteria as mentioned previously are identified for sustainable evaluation: criteria cost (), fuel consumption (), air quality (), noise perception (), users numbers (), spatial accessibility (), satisfaction (), security (), and congestion level ().
4.2. Data Collection and Information Fusion for BPAs
The data of BPAs on two evaluation levels (increase (I), decrease (D)) for nine criteria were collected from four information sources: expert, model, survey, and sensors/actual measurement. In order to provide convenience for calculation and comparison, note that the data at pre-test stage and post-test stage was from [20], yet there is a change in the framework of evaluation levels, and corresponding BPAs are shown respectively in Table 4 and Table 5. In [20], three evaluation levels were introduced: I (increase), N (no change), D (decrease). In our article, only levels I and D are considered, and the original data corresponding to level N is mapped to the set {I,D}, in which BPA representation is formed.
According to Equations (2)–(4), a comprehensive evaluation for each criterion can be calculated by Dempster’s combination rule. Consider the criterion “Cost” in Table 5; let us denote the BPA from Expert by , from Model by , from Survey by , and from Sensors by . The detailed procedure for data combination can be shown as follows:
1. Original BPAs from Table 5 is:
From the above analysis, a comprehensive BPA is obtained for the criteria “Cost” from four information sources. Likewise, the remaining BPAs for eight criteria can be computed. The aggregated BPA results for nine criteria at the pre-test and post-stage stages of car-sharing are represented in Table 6.
4.3. Utilities of Estimation
After BPAs for nine criteria are obtained, global utility of each criteria on car-sharing can be calculated using individual utility values from Table 3. For example, the global utility for criteria “Cost()” and criteria “Air quality()” are computed using Equation (11):
Similarly, global utilities of the remaining seven criteria can be computed. The results are shown in Table 7.
4.4. Estimation of City Sustainability
As mentioned before, a Transport Sustainability Index (TSI) can be used to measure city sustainability at any given time with global utilities. The Transport Sustainability Indexes of car-sharing at pre-test and post-test stages are denoted by TSI() and TSI(), respectively. Assuming an equal weight of 0.111 for all criteria, using global utilities (Table 7) and criteria weight, we have:
4.5. Impact Assessment of the Transport Measure (Transport Solution Evaluation)
From the above, we can obtain the TSI values for car-sharing at pre-test and post-test stages and easily find that TSI() > TSI(), 0.8292 > 0.7388. Therefore, a conclusion is drawn that the change brought by the transportation measure “car-sharing” is positive and thus car-sharing is suggested for adoption in the city.
4.6. Sensitivity Analysis
4.6.1. Experiment 1
From Table 4 and Table 5, we can find that most BPAs have a similar trend to support the same evaluation level. For example, in Table 5 for the criteria “Air quality ()”, most BPAs from four information sources have the most confidence in supporting the evaluation level “I”; for the criteria “Congestion levels ()”, the collected data show that there is strong confidence with the evaluation level “D”. However, in real life, it is noteworthy that incorrect data is possibly derived from human error, fault in the model, or the subjectivity of experts’ opinion. Regardless, conflictive data may occur. Experiments were performed to determine the sensitivity of the final decision with respect to conflictive BPAs, and a comparison between Anjali Awasthi et al.’s method [20] and our proposed method is given.
From Table 5, for the criteria “Number of users”, the model and sensor respectively provide a BPA: m(I) = 0.7, m(D) = 0.1, m() = 0.2; m(I) = 0.8, m(D) = 0.1, m() = 0.1. In this experiment, two new BPAs are substituted: m(I) = 0, m(D) = 0.1, m() = 0.9; m(I) = 0.9, m(D) = 0.1, m() = 0. The other two information sources “Expert” and “Survey” support the evaluation level “I” with a strong confidence = 0.8, = 0.6, while the new BPA from the model has the most confidence in supporting the set “”. Generally, it is called a piece of conflict evidence. Global utilities for nine criteria at the post-test stage with two methods are shown in Table 8 and Table 9.
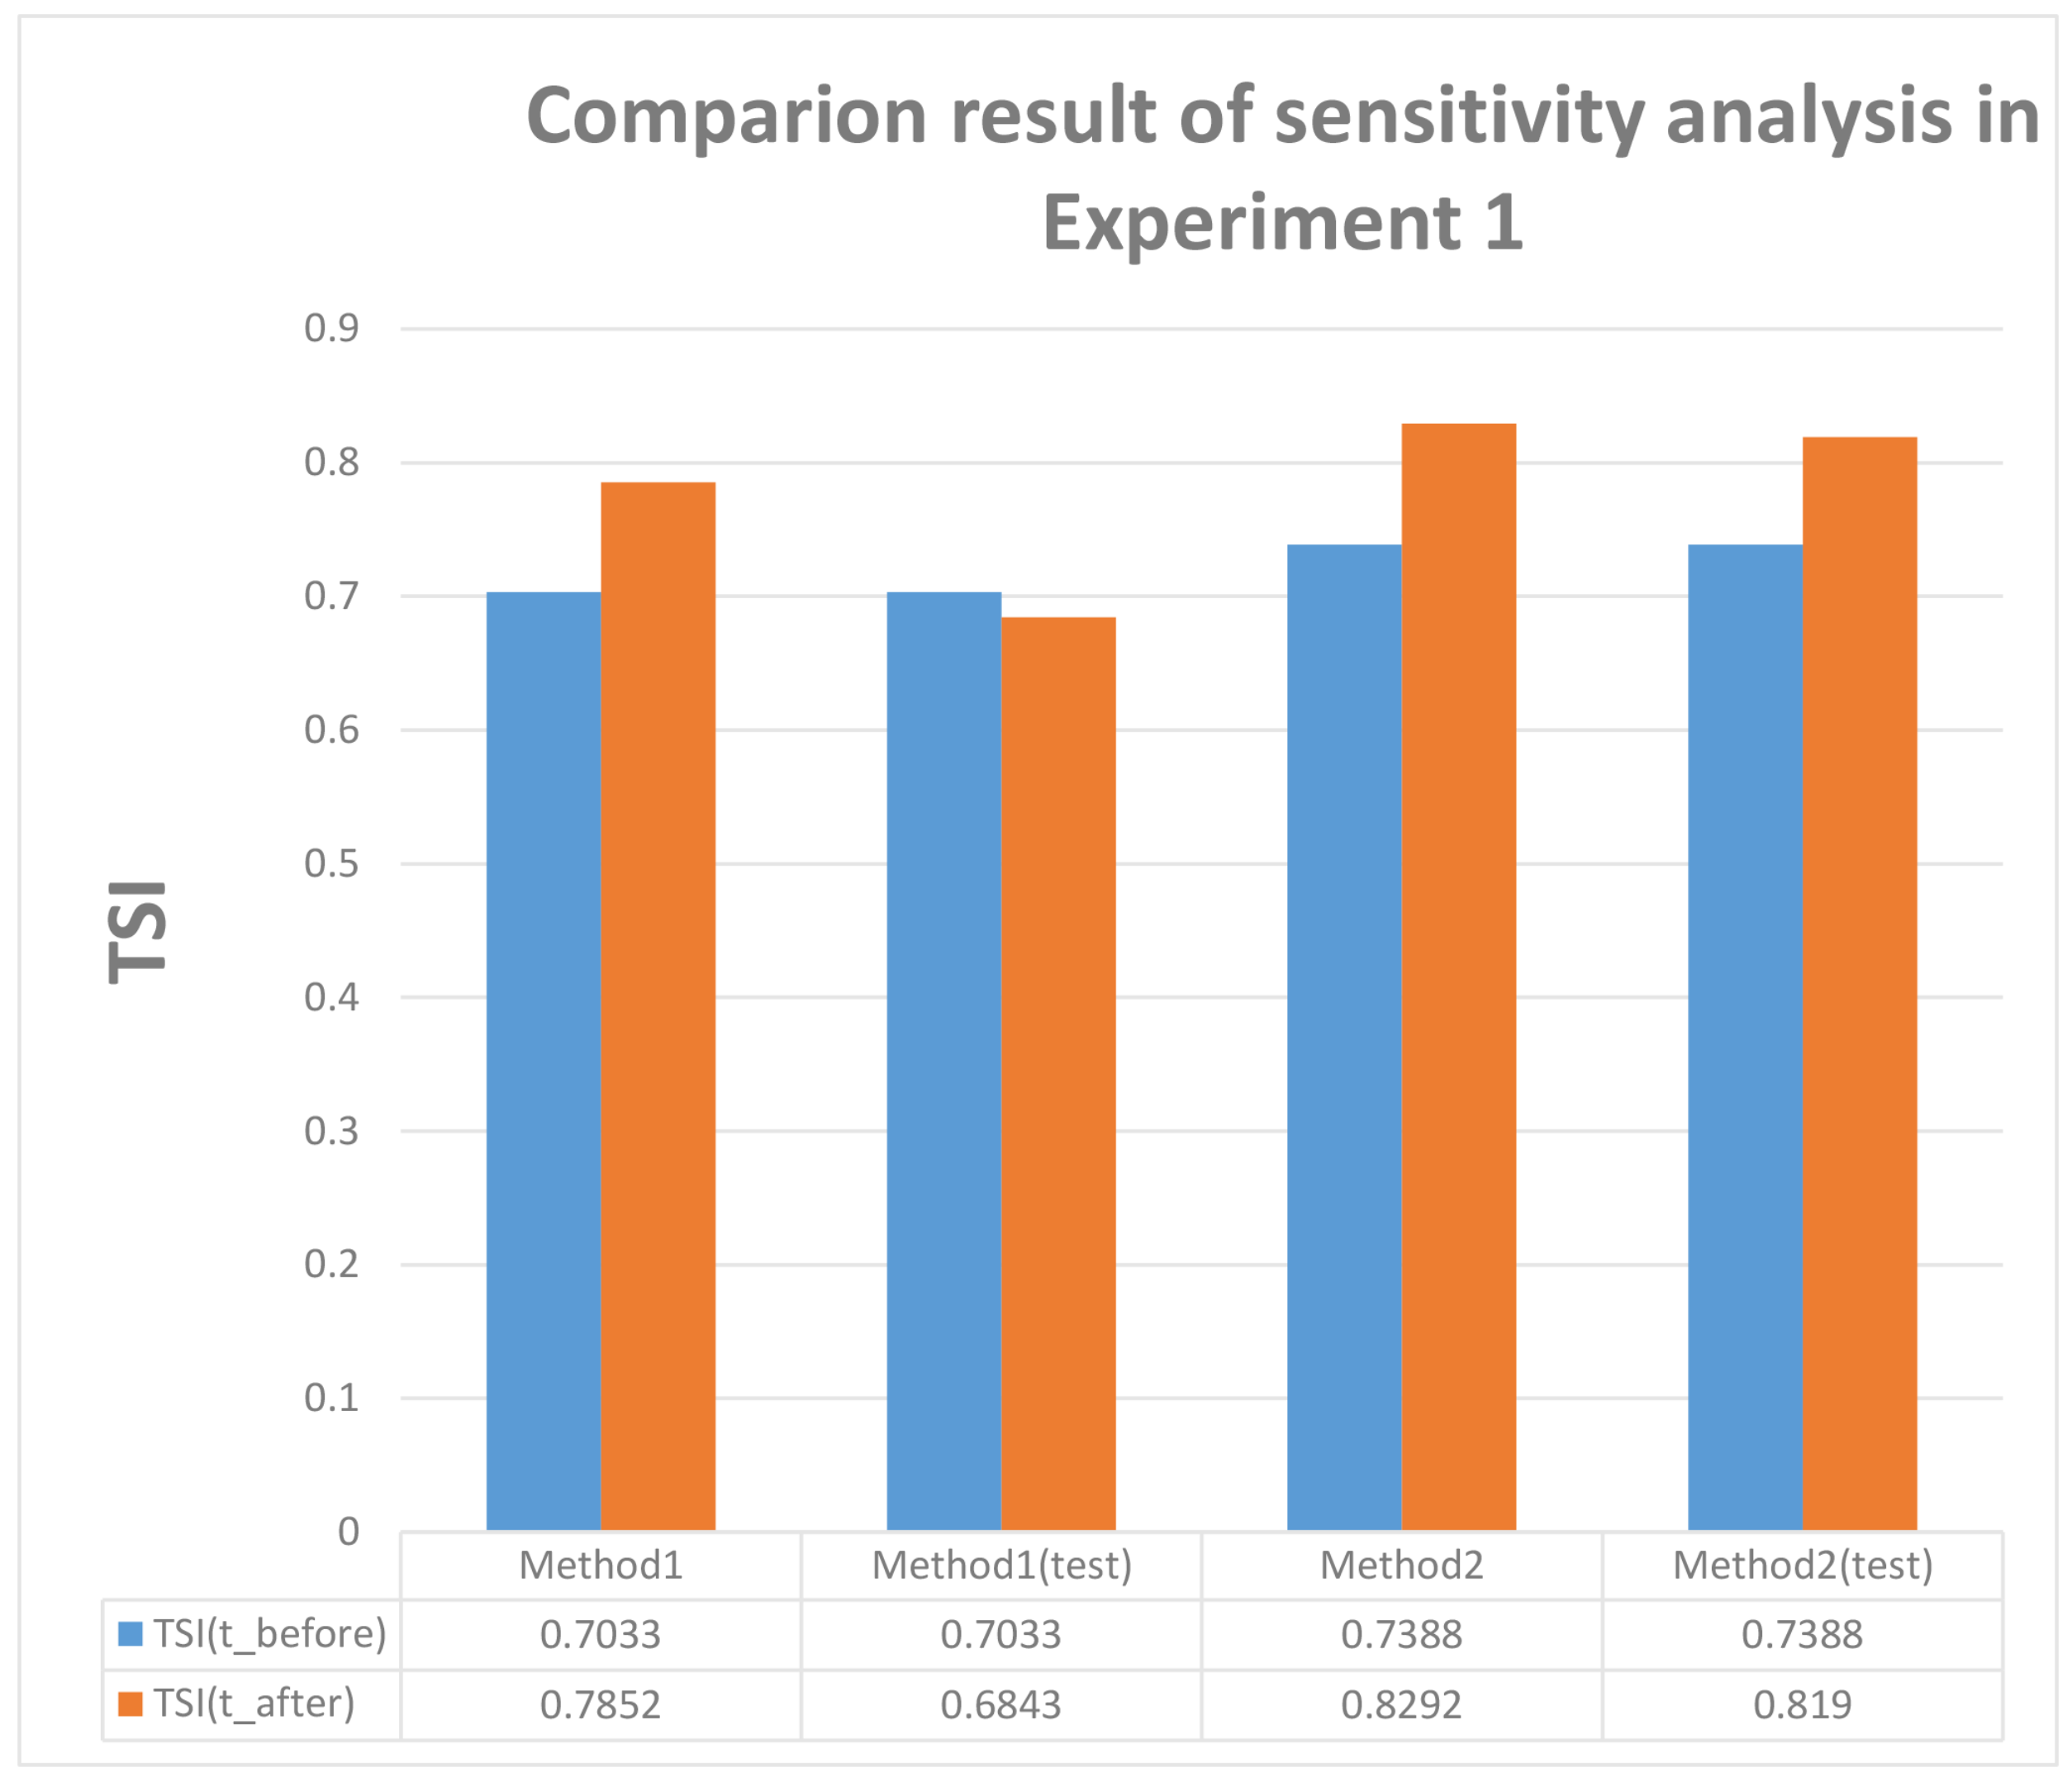
From Table 10 and Figure 4, it can be easily seen that before modifying the data, a positive impact on urban transportation can be obtained by testing the transportation solution, while a negative impact is found after the emergence of conflictive evidence in Anjali Awasthi et al.’s method [20]. However, in our proposed method, we can come to the same conclusion that the influence brought by car-sharing in the city is positive and therefore car-sharing is recommended for adoption, which demonstrates that the proposed method can handle conflictive data well.
The Transport Sustainability Index (TSI) at the post-test stage for the two methods and the comparison of the two methods are shown in Table 10.
4.6.2. Experiment 2
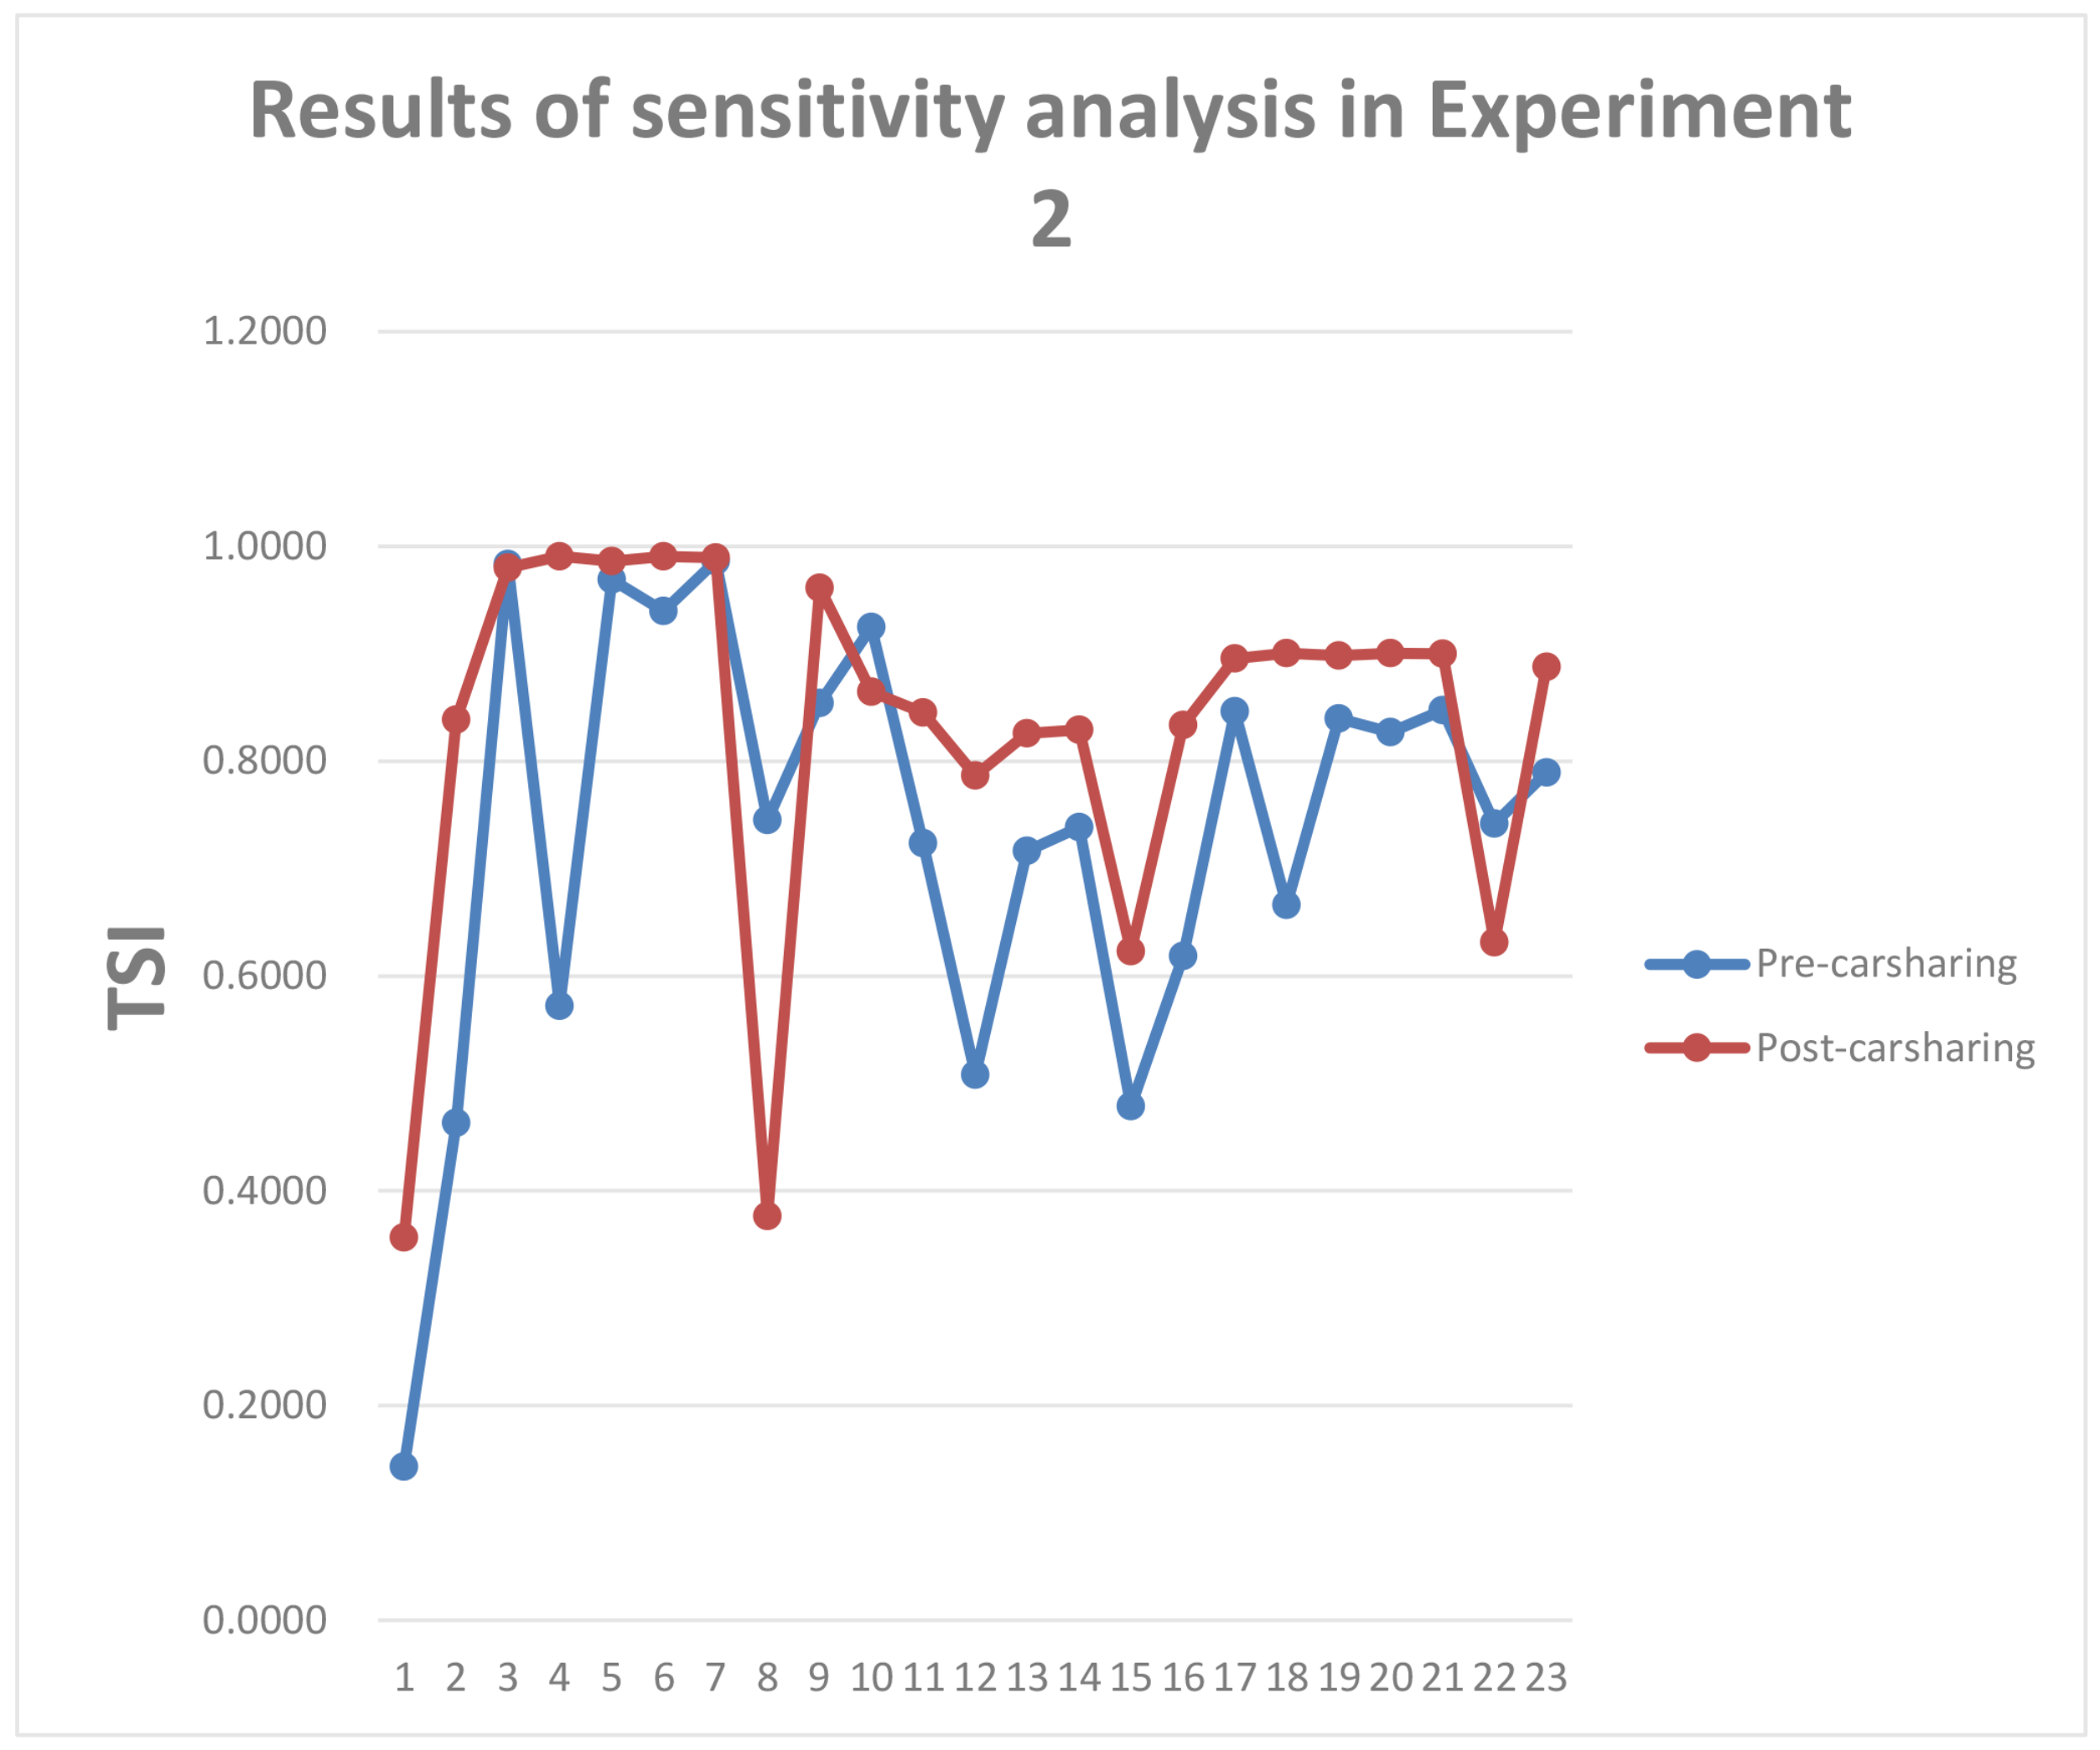
In this article, equal weight for different criteria is assumed to calculate the TSI at pre-test and post-test stages for simplicity. Experiments were conducted to determine the sensitivity of the final decision with respect to weight changes of different criteria. These experiments are represented in Table 11.
From Table 11, we can find that:
- (1)
- Experiments 1–9 consider one criterion at a time with a maximum weight = 1 and allocate weight = 0 to the remaining eight criteria.
- (2)
- Experiment 10 provides equal weight = 0.2 to the criteria with the high utility values for increase (I) for post-test stage (i.e., , , , , ). The weight of the remaining criteria is equal to 0.
- (3)
- Experiment 11 gives a random allocation of weight to different criteria.
- (4)
- Experiment 12 provides equal weight = 0.25 to the criteria with low utility values for increase (I) for the post-test stage (i.e., , , , ).
- (5)
- Experiment 13 distributes equal weight = 0.1 to criteria with high utility values for increase (I) for the post-test stage (i.e., , , , , ). Equal value = 0.125 is given to criteria with low utility values for increase (I) for post-test stage (i.e., , , , ).
- (6)
- Experiment 14 sets 0.111 as the weight of all criteria.
- (7)
- Experiments 15–23 provide weight = 0.25 over one criteria and distribute the remaining 0.5 weight over eight criteria, making their criteria weight = 0.0625.
The results are presented in Figure 5.
From Figure 5, we can find that most experiments support the conclusion that the Transportation Sustainability Index (TSI) at the post-test stage is higher than the pre-test stage regardless of the changes in criteria weight, which shows the robustness of our proposed method. As a result, we can draw the conclusion that car-sharing has a positive impact on improving transport conditions inside the city. Car-sharing is recommended for adoption.
5. Discussion
In our proposed model, analytic hierarchy process (AHP) and Dempster–Shafer evidence theory (D-S theory) are combined to evaluate the impact of transport measures on city sustainability. The desirable properties of the model are stated as follows:
Basic probability assignment (BPA) rather than probability function is used to represent the confidence of evaluation levels for all criteria. In Anjali Awasthi et al.’s method [20], three evaluation levels {I, N, D} are mentioned which satisfies the equation p(I) + p(N) + p(D) = 1; while in our method, m(I) + m(D) + m() = 1, which means that the unit mass is distributed among the singletons in and composite hypotheses as well. Through a modification, the probability function was transformed to BPA in D-S theory to better express the uncertainty. D-S theory has a strong function to manage uncertain information from various sources to make a decision. Furthermore, conflictive information can be handled well in our proposed method. As can be seen in Experiment 1, when conflictive data occur, two very different results are obtained in Anjali Awasthi et al.’s method [20], instead of the consistent result obtained in our proposed method.
Furthermore, in this article we come to the conclusion that car-sharing has a positive effect on city sustainability, which can be explained as follows: by reducing trips in private vehicle movements in the city, car-sharing can reduce vehicle emissions, as well as the occurrence of accidents and traffic congestion in the urban network to some extent. Moreover, car-sharing provides alternatives for humans’ travel and thus can bring convenience. In a word, car-sharing can promote city sustainability through the improvement of urban conditions in terms of social and environmental aspects.
6. Conclusions
In this article, a modified method for evaluating sustainable transport solutions combining AHP and Dempster–Shafer evidence theory is proposed. AHP is adopted to determine the weight of sustainability criteria while D-S theory is used for data fusion of sustainability assessment. A Transport Sustainability Index (TSI) is presented as a primary measure to determine whether transport solutions have a positive impact on city sustainability. Finally, a case study of car-sharing is illustrated to show the efficiency of our proposed method. Compared with existing methods, two advantages can be listed: one is that the BPA is generated with a new modification framework of evaluation levels, which can flexibly address uncertain information. The other is that the modified method has excellent performance in sensitivity analysis. The model can be widely used in evaluating the impact of environment-friendly transport measures on city sustainability.
References
Acknowledgments
The authors greatly appreciate the reviewers’ suggestions and the editor’s encouragement. The work is partially supported by National Natural Science Foundation of China (Program Nos. 61703338, 61671384).
Author Contributions
Luyuan Chen and Xinyang Deng conceived and designed the experiments; Luyuan Chen performed the experiments; Luyuan Chen and Xinyang Deng analyzed the data; Luyuan Chen wrote the paper; and Xinyang Deng conducted the writing instructions.
Conflicts of Interest
The authors declare no conflict of interest.
References
- Grant-Muller, S.; Usher, M. Intelligent Transport Systems: The Propensity for Environmental and Economic Benefits. Technol. Forecast. Soc. Chang. 2014, 82, 149–166. [Google Scholar] [CrossRef]
- Hsu, C.Y.; Yang, C.S.; Yu, L.C.; Lin, C.F.; Yao, H.H.; Chen, D.Y.; Lai, K.R.; Chang, P.C. Development of a Cloud-Based Service Framework for Energy Conservation in a Sustainable Intelligent Transportation System. Int. J. Prod. Econ. 2015, 164, 454–461. [Google Scholar] [CrossRef]
- Nita, M.R.; Badiu, D.L.; Onose, D.A.; Gavrilidis, A.A.; Gradinaru, S.R.; Nastase, I.I.; Lafortezza, R. Using Local Knowledge and Sustainable Transport to Promote a Greener City The Case of Bucharest, Romania. Environ. Res. 2018, 160, 331–338. [Google Scholar] [CrossRef] [PubMed]
- Chen, C.L. City-Hubs: Sustainable and Efficient Urban Transport Interchanges. J. Transp. Geogr. 2017, 65, 200–201. [Google Scholar] [CrossRef]
- Al-Atawi, A.M.; Kumar, R.; Saleh, W. Transportation Sustainability Index for Tabuk City in Saudi Arabia: An Analytic Hierarchy Process. Transport 2016, 31, 47–55. [Google Scholar] [CrossRef]
- Le Pira, M.; Inturri, G.; Ignaccolo, M.; Pluchino, A. Analysis of AHP Methods and the Pairwise Majority Rule (PMR) for Collective Preference Rankings of Sustainable Mobility Solutions. Transp. Res. Procedia 2015, 10, 777–787. [Google Scholar] [CrossRef]
- Gunarathna, P.; Hassan, R. Sustainability assessment tool for road transport asset management practice. Road Transp. Res. 2016, 25, 15–26. [Google Scholar]
- Xu, S.; Jiang, W.; Deng, X.; Shou, Y. A modified Physarum-inspired model for the user equilibrium traffic assignment problem. Appl. Math. Modell. 2018, 55, 340–353. [Google Scholar] [CrossRef]
- Deakin, M.; Curwell, S.; Lombardi, P. Sustainable urban development: the framework and directory of assessment methods. J. Environ. Assess. Policy Manag. 2002, 4, 171–197. [Google Scholar]
- Parkin, J.; Wardman, M.; Page, M. Estimation of the determinants of bicycle mode share for the journey to work using census data. Transportation 2008, 35, 93–109. [Google Scholar] [CrossRef]
- Danilina, N.; Vlasov, D. Development of “Park-and-Ride” system as a tool for sustainable access control managing. In Proceedings of the Iop Conference Series-Earth and Environmental Science, Malang, Indonesia, 6–7 March 2017; Volume 90. [Google Scholar]
- Shaukat, N.; Khan, B.; Ali, S.M.; Mehmood, C.A.; Khan, J.; Farid, U.; Majid, M.; Anwar, S.M.; Jawad, M.; Ullah, Z. A survey on electric vehicle transportation within smart grid system. Renew. Sustain. Energy Rev. 2018, 81, 1329–1349. [Google Scholar] [CrossRef]
- LucianoBarcellos de Paula, F.A.S. Algorithms applied in decision-making for sustainable transport. J. Clean. Prod. 2018, 176, 1133–1143. [Google Scholar] [CrossRef]
- Bovy, P.H.; Hoogendoorn-Lanser, S. Modelling route choice behaviour in multi-modal transport networks. Transportation 2005, 32, 341–368. [Google Scholar] [CrossRef]
- Sumalee, A.; Uchida, K.; Lam, W.H. Stochastic multi-modal transport network under demand uncertainties and adverse weather condition. Transp. Res. Part C Emerg. Technol. 2011, 19, 338–350. [Google Scholar] [CrossRef]
- Jourquin, B.; Limbourg, S. Equilibrium traffic assignment on large Virtual Networks: Implementation issues and limits for multi-modal freight transport. Eur. J. Transp. Infrastruct. Res. 2006, 6, 205–228. [Google Scholar]
- Mihyeon Jeon, C.; Amekudzi, A. Addressing sustainability in transportation systems: definitions, indicators, and metrics. J. Infrastruct. Syst. 2005, 11, 31–50. [Google Scholar] [CrossRef]
- Litman, T.; Burwell, D. Issues in sustainable transportation. Int. J. Glob. Environ. Issues 2006, 6, 331–347. [Google Scholar] [CrossRef]
- Wellar, B. Sampler of Commentaries on Methods and Techniques that Could Be Used in Making Decisions about Identifying, Adopting, or Implementing Sustainable Transport Practices; Wellar Consulting Inc.: Ottawa, ON, Canada, 2009. [Google Scholar]
- Awasthi, A.; Chauhan, S.S. Using AHP and Dempster–Shafer theory for evaluating sustainable transport solutions. Environ. Modell. Softw. 2011, 26, 787–796. [Google Scholar] [CrossRef]
- Aroian, L.A. The probability function of the product of two normally distributed variables. Ann. Math. Stat. 1947, 18, 265–271. [Google Scholar] [CrossRef]
- Deng, Y. Generalized evidence theory. Appl. Intell. 2015, 43, 530–543. [Google Scholar] [CrossRef]
- Xiao, F. An Improved Method for Combining Conflicting Evidences Based on the Similarity Measure and Belief Function Entropy. Int. J. Fuzzy Syst. 2018, 20, 1256–1266. [Google Scholar] [CrossRef]
- Xiao, F.; Zhan, C.; Lai, H.; Tao, L.; Qu, Z. New Parallel Processing Strategies in Complex Event Processing Systems with Data Streams. Int. J. Distrib. Sens. Netw. 2017, 13, 1–15. [Google Scholar] [CrossRef]
- Xu, H.; Deng, Y. Dependent Evidence Combination Based on Shearman Coefficient and Pearson Coefficient. IEEE Access 2018, 6, 11634–11640. [Google Scholar] [CrossRef]
- Deng, X.; Xiao, F.; Deng, Y. An improved distance-based total uncertainty measure in belief function theory. Appl. Intell. 2017, 46, 898–915. [Google Scholar] [CrossRef]
- Jiang, W.; Chang, Y.; Wang, S. A method to identify the incomplete framework of discernment in evidence theory. Math. Probl. Eng. 2017, 2017. [Google Scholar] [CrossRef]
- Jiang, W.; Hu, W. An improved soft likelihood function for Dempster-Shafer belief structures. Int. J. Intell. Syst. 2018. [Google Scholar] [CrossRef]
- Jiang, W.; Wang, S. An Uncertainty Measure for Interval-valued Evidences. Int. J. Comput. Commun. Control 2017, 12, 631–644. [Google Scholar] [CrossRef]
- Deli Irfan, C.N. Intuitionistic fuzzy parameterized soft set theory and its decision making. Appl. Soft Comput. 2015, 28, 109–113. [Google Scholar] [CrossRef]
- Zheng, X.; Deng, Y. Dependence Assessment in Human Reliability Analysis Based on Evidence Credibility Decay Model and IOWA Operator. Ann. Nuclear Energy 2018, 112, 673–684. [Google Scholar] [CrossRef]
- Zhang, R.; Ashuri, B.; Deng, Y. A novel method for forecasting time series based on fuzzy logic and visibility graph. Adv. Data Anal. Classif. 2017, 11, 759–783. [Google Scholar] [CrossRef]
- Jiang, W.; Wei, B. Intuitionistic fuzzy evidential power aggregation operator and its application in multiple criteria decision-making. Int. J. Syst. Sci. 2018, 49, 582–594. [Google Scholar] [CrossRef]
- Aliev, R.; Alizadeh, A.; Huseynov, O.; Jabbarova, K. Z-Number-Based Linear Programming. Int. J. Intell. Syst. 2015, 30, 563–589. [Google Scholar] [CrossRef]
- Zadeh, L.A. A note on Z-numbers. Inf. Sci. 2011, 181, 2923–2932. [Google Scholar] [CrossRef]
- Kang, B.; Chhipi-Shrestha, G.; Deng, Y.; Hewage, K.; Sadiq, R. Stable strategies analysis based on the utility of Z-number in the evolutionary games. Appl. Math. Comput. 2018, 324, 202–217. [Google Scholar] [CrossRef]
- Bian, T.; Zheng, H.; Yin, L.; Deng, Y. Failure mode and effects analysis based on D numbers and TOPSIS. Qual. Reliab. Eng. Int. 2018. [Google Scholar] [CrossRef]
- Xiao, F. An Intelligent Complex Event Processing with D Numbers under Fuzzy Environment. Math. Probl. Eng. 2016. [Google Scholar] [CrossRef]
- Deng, X.; Deng, Y. D-AHP method with different credibility of information. Soft Comput. 2018. [Google Scholar] [CrossRef]
- Dempster, A.P. Upper and lower probabilities induced by a multivalued mapping. Ann. Math. Stat. 1967, 38, 325–339. [Google Scholar] [CrossRef]
- Shafer, G. A Mathematical Theory of Evidence; Princeton University Press: Princeton, NJ, USA, 1976; Volume 1. [Google Scholar]
- Yager, R.; Fedrizzi, M.; Kacprzyk, J. Advances in the Dempster-Shafer Theory of Evidence; Wiley: Hoboken, NJ, USA, 1994. [Google Scholar]
- Zadeh, L.A. A Simple View of the Dempster-Shafer Theory of Evidence and Its Implication for the Rule of Combination. AI Mag. 1986, 7, 85. [Google Scholar]
- Deng, X. Analyzing the monotonicity of belief interval based uncertainty measures in belief function theory. Int. J. Intell. Syst. 2018. [Google Scholar] [CrossRef]
- Neshat, A.; Pradhan, B. Risk assessment of groundwater pollution with a new methodological framework: Application of Dempster-Shafer theory and GIS. Nat. Hazards 2015, 78, 1565–1585. [Google Scholar] [CrossRef]
- Duan, Y.; Cai, Y.; Wang, Z.; Deng, X. A novel network security risk assessment approach by combining subjective and objective weights under uncertainty. Appl. Sci. 2018, 8, 428. [Google Scholar] [CrossRef]
- Deng, X.; Jiang, W. Dependence assessment in human reliability analysis using an evidential network approach extended by belief rules and uncertainty measures. Ann. Nuclear Energy 2018, 117, 183–193. [Google Scholar] [CrossRef]
- Liu, T.; Deng, Y.; Chan, F. Evidential supplier selection based on DEMATEL and game theory. Int. J. Fuzzy Syst. 2018, 20, 1321–1333. [Google Scholar] [CrossRef]
- He, Z.; Jiang, W. An evidential dynamical model to predict the interference effect of categorization on decision making. Knowl.-Based Syst. 2018. [Google Scholar] [CrossRef]
- Xiao, F. A Novel Evidence Theory and Fuzzy Preference Approach-Based Multi-Sensor Data Fusion Technique for Fault Diagnosis. Sensors 2017, 17, 2504. [Google Scholar] [CrossRef] [PubMed]
- Xiao, F.; Aritsugi, M.; Wang, Q.; Zhang, R. Efficient Processing of Multiple Nested Event Pattern Queries over Multi-Dimensional Event Streams based on a Triaxial Hierarchical Model. Artif. Intell. Med. 2016, 72, 56–71. [Google Scholar] [CrossRef] [PubMed]
- Zhang, Q.; Li, M.; Deng, Y. Measure the structure similarity of nodes in complex networks based on relative entropy. Phys. A Stat. Mech. Appl. 2018, 491, 749–763. [Google Scholar] [CrossRef]
- Yin, L.; Deng, Y. Measuring transferring similarity via local information. Phys. A Stat. Mech. Appl. 2018, 498, 102–115. [Google Scholar] [CrossRef]
- Deng, X.; Han, D.; Dezert, J.; Deng, Y.; Shyr, Y. Evidence combination from an evolutionary game theory perspective. IEEE Trans. Cybern. 2016, 46, 2070–2082. [Google Scholar] [CrossRef] [PubMed]
- Deng, W.; Lu, X.; Deng, Y. Evidential Model Validation under Epistemic Uncertainty. Math. Probl. Eng. 2018. [Google Scholar] [CrossRef]
- Liang, W.; He, J.; Wang, S.; Yang, L.; Chen, F. Improved cluster collaboration algorithm based on wolf pack behavior. Clust. Comput. 2018. [Google Scholar] [CrossRef]
- Liu, W. Analyzing the degree of conflict among belief functions. Artif. Intell. 2006, 170, 909–924. [Google Scholar] [CrossRef] [Green Version]
- George, T.; Pal, N.R. Quantification of conflict in Dempster-Shafer framework: A new approach. Int. J. Gen. Syst. 1996, 24, 407–423. [Google Scholar] [CrossRef]
- Saaty, T.L. The Analytic Hierarchy Process: Planning, Priority Setting, Resources Allocation; McGraw: New York, NY, USA, 1980. [Google Scholar]
- Chin, K.S.; Wang, Y.M.; Poon, G.K.K.; Yang, J.B. Failure mode and effects analysis using a group-based evidential reasoning approach. Comput. Oper. Res. 2009, 36, 1768–1779. [Google Scholar] [CrossRef]
- Zhou, X.; Hu, Y.; Deng, Y.; Chan, F.T.S.; Ishizaka, A. A DEMATEL-Based Completion Method for Incomplete Pairwise Comparison Matrix in AHP. Ann. Oper. Res. 2018. [Google Scholar] [CrossRef]
- Jajac, N.; Knezic, S.; Babić, Z. Integration of multicriteria analysis into decision support concept for urban road infrastructure management. Croat. Oper. Res. Rev. 2010, 1, 74–82. [Google Scholar]
- Deng, X.; Jiang, W. An evidential axiomatic design approach for decision making using the evaluation of belief structure satisfaction to uncertain target values. Int. J. Intell. Syst. 2018, 33, 15–32. [Google Scholar] [CrossRef]
- Brundtland, G.H. Report of the World Commission on Environment and Development: “Our Common Future”; United Nations: New York, NY, USA, 1987. [Google Scholar]
- Awasthi, A.; Chauhan, S.S.; Hurteau, X.; Breuil, D. An analytical hierarchical process-based decision-making approach for selecting car-sharing stations in medium size agglomerations. Int. J. Inf. Decis. Sci. 2008, 1, 66–97. [Google Scholar] [CrossRef]
- Rohr, T.; Rovigo, M. Public service approach to car-sharing in mid-sized towns: The example of Belfort (France). IET Intell. Transp. Syst. 2017, 11, 403–410. [Google Scholar] [CrossRef]
- Fellows, N.; Pitfield, D. An economic and operational evaluation of urban car-sharing. Transp. Res. Part D Transp. Environ. 2000, 5, 1–10. [Google Scholar] [CrossRef]
Figure 1.
The framework of our proposed method. BPA: basic probability assignment.

Figure 2.
Evaluation criteria for sustainability assessment.

Figure 3.
The architecture of a typical car-sharing organization (CSO) [20].
Figure 3.
The architecture of a typical car-sharing organization (CSO) [20].

Figure 4.
The first comparison in the sensitivity analysis of two methods. Method 1: Anjali Awasthi et al.’s method. Method 2: Our proposed method.
Figure 4.
The first comparison in the sensitivity analysis of two methods. Method 1: Anjali Awasthi et al.’s method. Method 2: Our proposed method.

Figure 5.
Results of sensitivity analysis in Experiment 2.


Table 1.
Pair-wise comparison scale for analytical hierarchy process (AHP) preference.
| Value of | Interpretation |
|---|---|
| 1 | i and j are equally important |
| 3 | i is slightly more important than j |
| 5 | i is more important than j |
| 7 | i is strongly more important than j |
| 9 | i is absolutely more important than j |
| 2, 4, 6, 8 | intermediate values between the two adjacent judgements |
Table 2.
Values of the random index (RI).
| Dimension | 2 | 3 | 4 | 5 | 6 | 7 | 8 | 9 | 10 |
|---|---|---|---|---|---|---|---|---|---|
| RI | 0.00 | 0.58 | 0.90 | 1.12 | 1.24 | 1.32 | 1.41 | 1.45 | 1.51 |
Table 3.
Utility values for criteria [20].
Table 3.
Utility values for criteria [20].
| Evaluation Criteria | Utility Values u(I), u(D), u(I,D) |
|---|---|
| Cost (), Fuel consumption (), Noise perception (), Congestion level () | (0, 1, 0.3) |
| Air quality (), Users numbers (), Spatial accessibility (), Satisfaction (), Security () | (1, 0, 0.3) |
Table 4.
Data collection of BPAs at the pre-test stage [20].
Table 4.
Data collection of BPAs at the pre-test stage [20].
| Evaluation Criteria | Expert | Model | Survey | Sensors | ||||||||
|---|---|---|---|---|---|---|---|---|---|---|---|---|
| I | D | I | D | I | D | I | D | |||||
| 0.25 | 0.25 | 0.5 | 0.6 | 0.2 | 0.2 | 0.5 | 0.2 | 0.3 | 0.5 | 0.15 | 0.35 | |
| 0.3 | 0.3 | 0.4 | 0.4 | 0.2 | 0.4 | 0.4 | 0.2 | 0.4 | 0.2 | 0.5 | 0.3 | |
| 0.65 | 0.15 | 0.2 | 0.7 | 0.2 | 0.1 | 0.6 | 0.2 | 0.2 | 0.8 | 0.1 | 0.1 | |
| 0.25 | 0.65 | 0.1 | 0.8 | 0.1 | 0.1 | 0.5 | 0.2 | 0.3 | 0.1 | 0.8 | 0.1 | |
| 0.7 | 0.2 | 0.1 | 0.2 | 0.1 | 0.7 | 0.8 | 0.1 | 0.1 | 0.6 | 0.1 | 0.3 | |
| 0.5 | 0.3 | 0.2 | 0.6 | 0.1 | 0.3 | 0.5 | 0.2 | 0.3 | 0.7 | 0.1 | 0.2 | |
| 0.6 | 0.1 | 0.3 | 0.7 | 0.1 | 0.2 | 0.6 | 0.1 | 0.3 | 0.8 | 0.1 | 0.1 | |
| 0.4 | 0.3 | 0.3 | 0.4 | 0.2 | 0.4 | 0.4 | 0.2 | 0.4 | 0.5 | 0.3 | 0.2 | |
| 0.4 | 0.4 | 0.2 | 0.1 | 0.5 | 0.4 | 0.2 | 0.5 | 0.3 | 0.2 | 0.6 | 0.2 | |
Table 5.
Data collection of BPAs at the post-test stage [20].
Table 5.
Data collection of BPAs at the post-test stage [20].
| Evaluation Criteria | Expert | Model | Survey | Sensors | ||||||||
|---|---|---|---|---|---|---|---|---|---|---|---|---|
| I | D | I | D | I | D | I | D | |||||
| 0.3 | 0.2 | 0.5 | 0.4 | 0.2 | 0.4 | 0.2 | 0.1 | 0.7 | 0.1 | 0.3 | 0.6 | |
| 0.2 | 0.5 | 0.3 | 0.1 | 0.5 | 0.4 | 0.2 | 0.3 | 0.5 | 0.2 | 0.4 | 0.4 | |
| 0.6 | 0.1 | 0.3 | 0.7 | 0.1 | 0.2 | 0.6 | 0.2 | 0.2 | 0.7 | 0.2 | 0.1 | |
| 0.1 | 0.6 | 0.3 | 0.1 | 0.8 | 0.1 | 0.2 | 0.7 | 0.1 | 0.2 | 0.6 | 0.2 | |
| 0.8 | 0.1 | 0.1 | 0.7 | 0.1 | 0.2 | 0.6 | 0.3 | 0.1 | 0.8 | 0.1 | 0.1 | |
| 0.6 | 0.1 | 0.3 | 0.8 | 0.1 | 0.1 | 0.6 | 0.3 | 0.1 | 0.7 | 0.1 | 0.2 | |
| 0.7 | 0.1 | 0.2 | 0.8 | 0.1 | 0.1 | 0.6 | 0.2 | 0.2 | 0.6 | 0.1 | 0.3 | |
| 0.25 | 0.4 | 0.35 | 0.3 | 0.3 | 0.4 | 0.2 | 0.3 | 0.5 | 0.2 | 0.4 | 0.4 | |
| 0.2 | 0.5 | 0.3 | 0.1 | 0.7 | 0.2 | 0.2 | 0.6 | 0.2 | 0.2 | 0.4 | 0.4 | |
Table 6.
The aggregated BPA results for nine criteria.
| Evaluation Criteria | Pre-Test Stage | Post-Test Stage | ||||
|---|---|---|---|---|---|---|
| I | D | I | D | |||
| 0.8413 | 0.1365 | 0.0222 | 0.5645 | 0.3226 | 0.1129 | |
| 0.5039 | 0.4488 | 0.0472 | 0.1234 | 0.8225 | 0.0541 | |
| 0.9831 | 0.0161 | 0.0008 | 0.9796 | 0.0189 | 0.0015 | |
| 0.4260 | 0.5714 | 0.0026 | 0.0088 | 0.9908 | 0.0004 | |
| 0.9680 | 0.0285 | 0.0035 | 0.9861 | 0.0132 | 0.0008 | |
| 0.9375 | 0.0550 | 0.0075 | 0.9907 | 0.0089 | 0.0004 | |
| 0.9855 | 0.0117 | 0.0027 | 0.9891 | 0.0098 | 0.0010 | |
| 0.7379 | 0.2388 | 0.0233 | 0.3566 | 0.5778 | 0.0657 | |
| 0.1377 | 0.8503 | 0.0120 | 0.0343 | 0.9598 | 0.0060 | |
Table 7.
Global utilities for nine criteria.
| Evaluation Criteria | At the Pre-Test Stage | At the Post-Test Stage |
|---|---|---|
| 0.1432 | 0.3565 | |
| 0.4630 | 0.8387 | |
| 0.9834 | 0.9800 | |
| 0.5722 | 0.9909 | |
| 0.9691 | 0.9863 | |
| 0.9398 | 0.9908 | |
| 0.9864 | 0.9894 | |
| 0.7449 | 0.3763 | |
| 0.8539 | 0.9615 |
Table 8.
The testing BPA fusion results.
| Evaluation Criteria | Anjali Awasthi et al.’s Method | Our Proposed Method | ||||
|---|---|---|---|---|---|---|
| I | D | I | D | |||
| 0.0274 | 0.9589 | 0.0137 | 0.2258 | 0.5053 | 0.2689 | |
| 0.0146 | 0.4380 | 0.5474 | 0.2296 | 0.3596 | 0.4108 | |
| 0.9910 | 0.0067 | 0.0022 | 0.5893 | 0.2087 | 0.2018 | |
| 0.0020 | 0.0030 | 0.9951 | 0.2026 | 0.2399 | 0.5574 | |
| 0 | 0 | 1.0000 | 0.6913 | 0.1894 | 0.1932 | |
| 0.9956 | 0.0030 | 0.0015 | 0.5946 | 0.2373 | 0.1681 | |
| 0.9931 | 0.0059 | 0.0010 | 0.5771 | 0.2566 | 0.1661 | |
| 0.0661 | 0.6167 | 0.3172 | 0.2529 | 0.3743 | 0.3727 | |
| 0.0089 | 0.0536 | 0.9375 | 0.2290 | 0.3350 | 0.4359 | |
Table 9.
Global utilities of testing for nine criteria with two methods.
| Evaluation Criteria | Anjali Awasthi et al.’s Method | Our Proposed Method |
|---|---|---|
| 0.1432 | 0.3565 | |
| 0.4630 | 0.8387 | |
| 0.9834 | 0.9800 | |
| 0.5722 | 0.9909 | |
| 0 | 0.9846 | |
| 0.9398 | 0.9908 | |
| 0.9864 | 0.9894 | |
| 0.7449 | 0.3763 | |
| 0.8539 | 0.9615 |
Table 10.
Comparison of the two methods.
| Anjali Awasthi et al.’s Method | Our Proposed Method | |
|---|---|---|
| TSI() | 0.7033 | 0.7388 |
| TSI() | 0.6843 | 0.8190 |
| Δ TSI | TSI() > TSI() | TSI() < TSI() |
| Transport solution evaluation | Negative | Positive |
| Transport solution evaluation (without conflict) | Positive | Positive |
Table 11.
Different weight for nine criteria [20].
Table 11.
Different weight for nine criteria [20].
| Experiment 2 | Weights of Criteria | ||||||||
|---|---|---|---|---|---|---|---|---|---|
| 1 | 1 | 0 | 0 | 0 | 0 | 0 | 0 | 0 | 0 |
| 2 | 0 | 1 | 0 | 0 | 0 | 0 | 0 | 0 | 0 |
| 3 | 0 | 0 | 1 | 0 | 0 | 0 | 0 | 0 | 0 |
| 4 | 0 | 0 | 0 | 1 | 0 | 0 | 0 | 0 | 0 |
| 5 | 0 | 0 | 0 | 0 | 1 | 0 | 0 | 0 | 0 |
| 6 | 0 | 0 | 0 | 0 | 0 | 1 | 0 | 0 | 0 |
| 7 | 0 | 0 | 0 | 0 | 0 | 0 | 1 | 0 | 0 |
| 8 | 0 | 0 | 0 | 0 | 0 | 0 | 0 | 1 | 0 |
| 9 | 0 | 0 | 0 | 0 | 0 | 0 | 0 | 0 | 1 |
| 10 | 0 | 0 | 0.2 | 0 | 0.2 | 0.2 | 0.2 | 0.2 | 0 |
| 11 | 0.1 | 0.1 | 0.2 | 0.2 | 0.05 | 0.1 | 0.05 | 0.1 | 0.1 |
| 12 | 0.25 | 0.25 | 0 | 0.25 | 0 | 0 | 0 | 0 | 0.25 |
| 13 | 0.125 | 0.125 | 0.1 | 0.125 | 0.1 | 0.1 | 0.1 | 0.1 | 0.125 |
| 14 | 0.111 | 0.111 | 0.111 | 0.111 | 0.111 | 0.111 | 0.111 | 0.111 | 0.111 |
| 15 | 0.5 | 0.0625 | 0.0625 | 0.0625 | 0.0625 | 0.0625 | 0.0625 | 0.0625 | 0.0625 |
| 16 | 0.0625 | 0.5 | 0.0625 | 0.0625 | 0.0625 | 0.0625 | 0.0625 | 0.0625 | 0.0625 |
| 17 | 0.0625 | 0.0625 | 0.5 | 0.0625 | 0.0625 | 0.0625 | 0.0625 | 0.0625 | 0.0625 |
| 18 | 0.0625 | 0.0625 | 0.0625 | 0.5 | 0.0625 | 0.0625 | 0.0625 | 0.0625 | 0.0625 |
| 19 | 0.0625 | 0.0625 | 0.0625 | 0.0625 | 0.5 | 0.0625 | 0.0625 | 0.0625 | 0.0625 |
| 20 | 0.0625 | 0.0625 | 0.0625 | 0.0625 | 0.0625 | 0.5 | 0.0625 | 0.0625 | 0.0625 |
| 21 | 0.0625 | 0.0625 | 0.0625 | 0.0625 | 0.0625 | 0.0625 | 0.5 | 0.0625 | 0.0625 |
| 22 | 0.0625 | 0.0625 | 0.0625 | 0.0625 | 0.0625 | 0.0625 | 0.0625 | 0.5 | 0.0625 |
| 23 | 0.0625 | 0.0625 | 0.0625 | 0.0625 | 0.0625 | 0.0625 | 0.0625 | 0.0625 | 0.5 |
© 2018 by the authors. Licensee MDPI, Basel, Switzerland. This article is an open access article distributed under the terms and conditions of the Creative Commons Attribution (CC BY) license (http://creativecommons.org/licenses/by/4.0/).
Share and Cite
MDPI and ACS Style
Chen, L.; Deng, X. A Modified Method for Evaluating Sustainable Transport Solutions Based on AHP and Dempster–Shafer Evidence Theory. Appl. Sci. 2018, 8, 563. https://doi.org/10.3390/app8040563
AMA Style
Chen L, Deng X. A Modified Method for Evaluating Sustainable Transport Solutions Based on AHP and Dempster–Shafer Evidence Theory. Applied Sciences. 2018; 8(4):563. https://doi.org/10.3390/app8040563
Chicago/Turabian StyleChen, Luyuan, and Xinyang Deng. 2018. "A Modified Method for Evaluating Sustainable Transport Solutions Based on AHP and Dempster–Shafer Evidence Theory" Applied Sciences 8, no. 4: 563. https://doi.org/10.3390/app8040563
Note that from the first issue of 2016, this journal uses article numbers instead of page numbers. See further details here.