An Automated IoT Visualization BIM Platform for Decision Support in Facilities Management


Department of Civil Engineering, National Chiao Tung University, 1001 University Road, Hsinchu 30010, Taiwan
*
Author to whom correspondence should be addressed.
Appl. Sci. 2018, 8(7), 1086; https://doi.org/10.3390/app8071086
Submission received: 24 May 2018
/
Revised: 28 June 2018
/
Accepted: 1 July 2018
/
Published: 4 July 2018
(This article belongs to the Special Issue Selected Papers from the 2017 International Conference on Inventions)
Abstract
:Building information modeling (BIM) is the digital representation of physical and functional characteristics (such as geometry, spatial relationship, and geographic information) of a facility to support decisions during its life cycle. BIM has been extended beyond 3D geometrical representations in recent years, and now includes time as a fourth dimension and cost as a fifth dimension, as well as such other applications as virtual reality and augmented reality. The Internet of Things (IoT) has been increasingly applied in various products (smart homes, wearables) to enhance work productivity, living comfort, and entertainment. However, research addressing the integration of these two technologies (BIM and IoT) is still very limited, and has focused exclusively on the automatic transmission of sensor information to BIM models. This paper describes an attempt to represent and visualize sensor data in BIM with multiple perspectives in order to support complex decisions requiring interdisciplinary information. The study uses a university campus as an example and includes several scenarios, such as an auditorium with a dispersed audience and energy-saving options for rooms with different functions (mechanical/electrical equipment, classrooms, and laboratory). This paper also discusses the design of a common platform allowing communication among sensors with different protocols (Arduino, Raspberry Pi), the use of Dynamo to accept sensor data as input and automatically redraw visualized information in BIM, and how visualization may help in making energy-saving management decisions.
1. Introduction
With the advance of technology, data has grown exponentially during the past few years [1], which has spurred growing attention to data visualization in such fields as commercial finance, economics, medical MRI (Magnetic resonance imaging) applications [2] and so on. Data visualization allows the analysis and presentation of heterogeneous data in abstract form using computer graphics and interactive technologies [3]. In addition, data collection methods have evolved from traditional wired transmission to open wireless technologies such as RFID (Radio Frequency IDentification) labels and embedded sensor and actuator nodes. Driven by the recent development of a variety of enabling wireless technologies, the IoT (Internet of Things) has stepped out of its infancy, and is expected to be the next revolutionary technology that will create the fully integrated internet of the future [4].
The building information modeling (BIM) concept was originally introduced in the book “Building Product Models” by Eastman [5], which describes the basic concept of architectural information modeling, relevant model components, and information exchange. BIM is a smart model-based process that seeks to achieve such goals as decreasing project cost, increasing productivity and quality, and shortening project delivery time [6]. Thanks to BIM’s simulation of architecture in a virtual environment, digital modeling, accurate inclusion of geometric shapes and related data, and support of design, procurement, production and construction activities, this technology has become the focus of great attention in the fields of architecture, engineering and construction [7,8]. BIM is also a common knowledge resource that can be used to share and provide reliable information on a facility throughout the building life cycle, and can be used to retain, transfer and reapply information at all stages of the traditional building life cycle [9].
BIM is chiefly used to express elements/objects complying with specific information standards (such as Industry Foundation Classes, IFCs). The IFC standard provides a logical hierarchy of building elements/objects through the definitions of various domains [10], and enables professionals to exchange information within a defined scope when they carry out feasibility studies, design or construction simulation, and operation [11]. The IFC data model is universal, designed to support the full range of modeling operations required by the construction industry, and allows the intuitive viewing of others’ content in stereoscopic 3D [12]. As a result, it facilitates immediate and intuitive communication and discussion without need for abstract and specialized symbols. This can effectively reduce the occurrence of errors and flaws, and allows the quick resolution of disagreements and mistakes among professionals. BIM employing the IFC standard can therefore minimize or eliminate costs and waste of time resulting from extensive rework. By using BIM models instead of paper blueprints, and by leveraging appropriate algorithms (such as frequency domain decomposition, FDD), facility managers can reconcile real components with the corresponding three-dimensional models, and can take advantage of the system to promptly execute plans of action [13].
BIM models are useful and effective in assessing the energy efficiency of buildings [14] through the use of design parameters associated with a model, such as the shape, orientation, materials and windows of a building, as well as external environmental information relevant to the building (such as sun location, solar radiation, temperature and humidity). Thorough assessment and modification of an early design can accordingly result in a more comfortable built environment and energy savings [15].
While the BIM modeling technology encompasses building information and visualization, it lacks the means to incorporate information concerning the immediate environment into the model, and must be aided by a plug-in (e.g., Revit API, Firefly) if it is to achieve a further step towards intelligent building. K.M. Kensek (2014) confirmed the effectiveness of the scripting language Dynamo as a parametric design tool in a case study, and successfully used data from Arduino environmental sensors (humidity, sunlight and CO2) in a BIM model, while changing 3D model parameters [16].
Emad Al-Qattan et al. (2017) established two prototypes for the purpose of preliminary research. Prototype 1 used the software tools Revit (Autodesk BIM authoring tool) and Dynamo (visual programming environment for Revit) for modeling, while Prototype 2 used the software tools Rhino (3D modeling environment) and Grasshopper (visual programming environment). This research effort proposed considering physical interaction, in addition to computer programming, as an alternative method of establishing parametric models, which presents architects with significant difficulties. The prototypes demonstrated a new approach for determining the type of object relationships, generating parametric equations, and application in the context of design [17].
M. Rahmani Asl et al. (2015) suggested that simulation analysis data can serve as important design criteria when designers are designing a building, and proposed and employed a BIM-based performance optimization (BPOpt) framework; this framework used Dynamo to collect sensor data from buildings, and can optimize buildings’ energy performance and spatial daylighting based on simulated environmental data [18].
Several researchers have attempted to integrate sensor information with BIM information such as visualizations ([19]) and building management systems ([20,21]). J.M.D. Delgado et al. (2018) [19] found that the data obtained from a building’s structural health diagnosis could not be effectively and systematically integrated with other relevant monitoring data to support asset management, and proposed a dynamic parametric BIM approach making use of time-series sensor data to support data-driven and dynamic visualization. This approach involves the dynamic visualization of key structural performance parameters, and achieves real-time updating, long-term management of data, and model transformation via the IFC format, while also serving to increase the value of data. J.I. Lather (2017) [20] developed a framework using three-dimensional spatial characteristics and sensor location data, and incorporated building management system (BMS) sensor data to make it easier for users and managers to perform facility management; a case study was employed to explore the use of data from various sensors during the operating phase. McCaffrey, R (2015) [21] developed a web-based graphical user interface (GUI) integrating BIM with BMS data in order to help managers and users perform visual browsing of spatial data, and to make building performance information more readily accessible to all building stakeholders, which can both boost energy management awareness and also support decision-making during the operating stage.
Since the aforementioned studies explore BIM applications targeting a single building and its occupants or stakeholders, their methods cannot be applied directly to a school campus, which usually involves multiple buildings with different ages, and multiple occupant/stakeholder groups, structures, equipment, and facility management protocols.
Most existing cases in the literature successfully solved target facility management problems through the use of numerical computations using data from sensors monitoring building spaces. However, failure to integrate the data with a BIM model of the building will hinder the facility manager’s ability to identify potential problems intuitively. This study therefore proposes a platform able to integrate sensor information with BIM. The proposed platform has a threefold objective—integration, visualization, and multiple contexts as follows:
- Automated integration: automatically collects data from physical sensors installed in a space, and stores the data in the BIM model of the space.
- Automated visualization: automatically calculates an index value based on the collected sensor data, and computationally visualizes the value with a color palette scheme.
- Multiple contexts: allows a user to switch between different contexts that require different subsets of the sensors (e.g., comfort, energy saving, the WELL Building Standard perspectives) installed in the space.
2. Research Methodologies and Experimental Design
2.1. Parametric Design-Based Approach
Dynamo (a free plug-in for Revit) is a parametric design software that can work closely with BIM-based software such as Revit, and allows a designer to programmatically create 3D BIM components automatically based on certain parameters. It also constitutes a visual programming language providing visual block palettes. The Firefly suite is a set of computer code fragments employed to bridge the gaps between BIM-based parametric design software such as Dynamo or Grasshopper [16,17,18], a sensor microcontroller such as Arduino, and other input/output devices, such as webcams and mobile phones. Users can employ the Revit API to use individual objects or families of objects to perform parametric object-family operations. Object-based parametric modeling is the foundation of BIM technology [22], and Dynamo can be used to bring procedural information into the BIM environment. A designer can perform Dynamo independently in defining the building process and modifying various architectural components in Revit. Dynamo enables designers to set up automated computing processes or platforms through a node-based visual compilation interface, so that designers can perform data processing and correlate structural and geometric parameter controls [23].
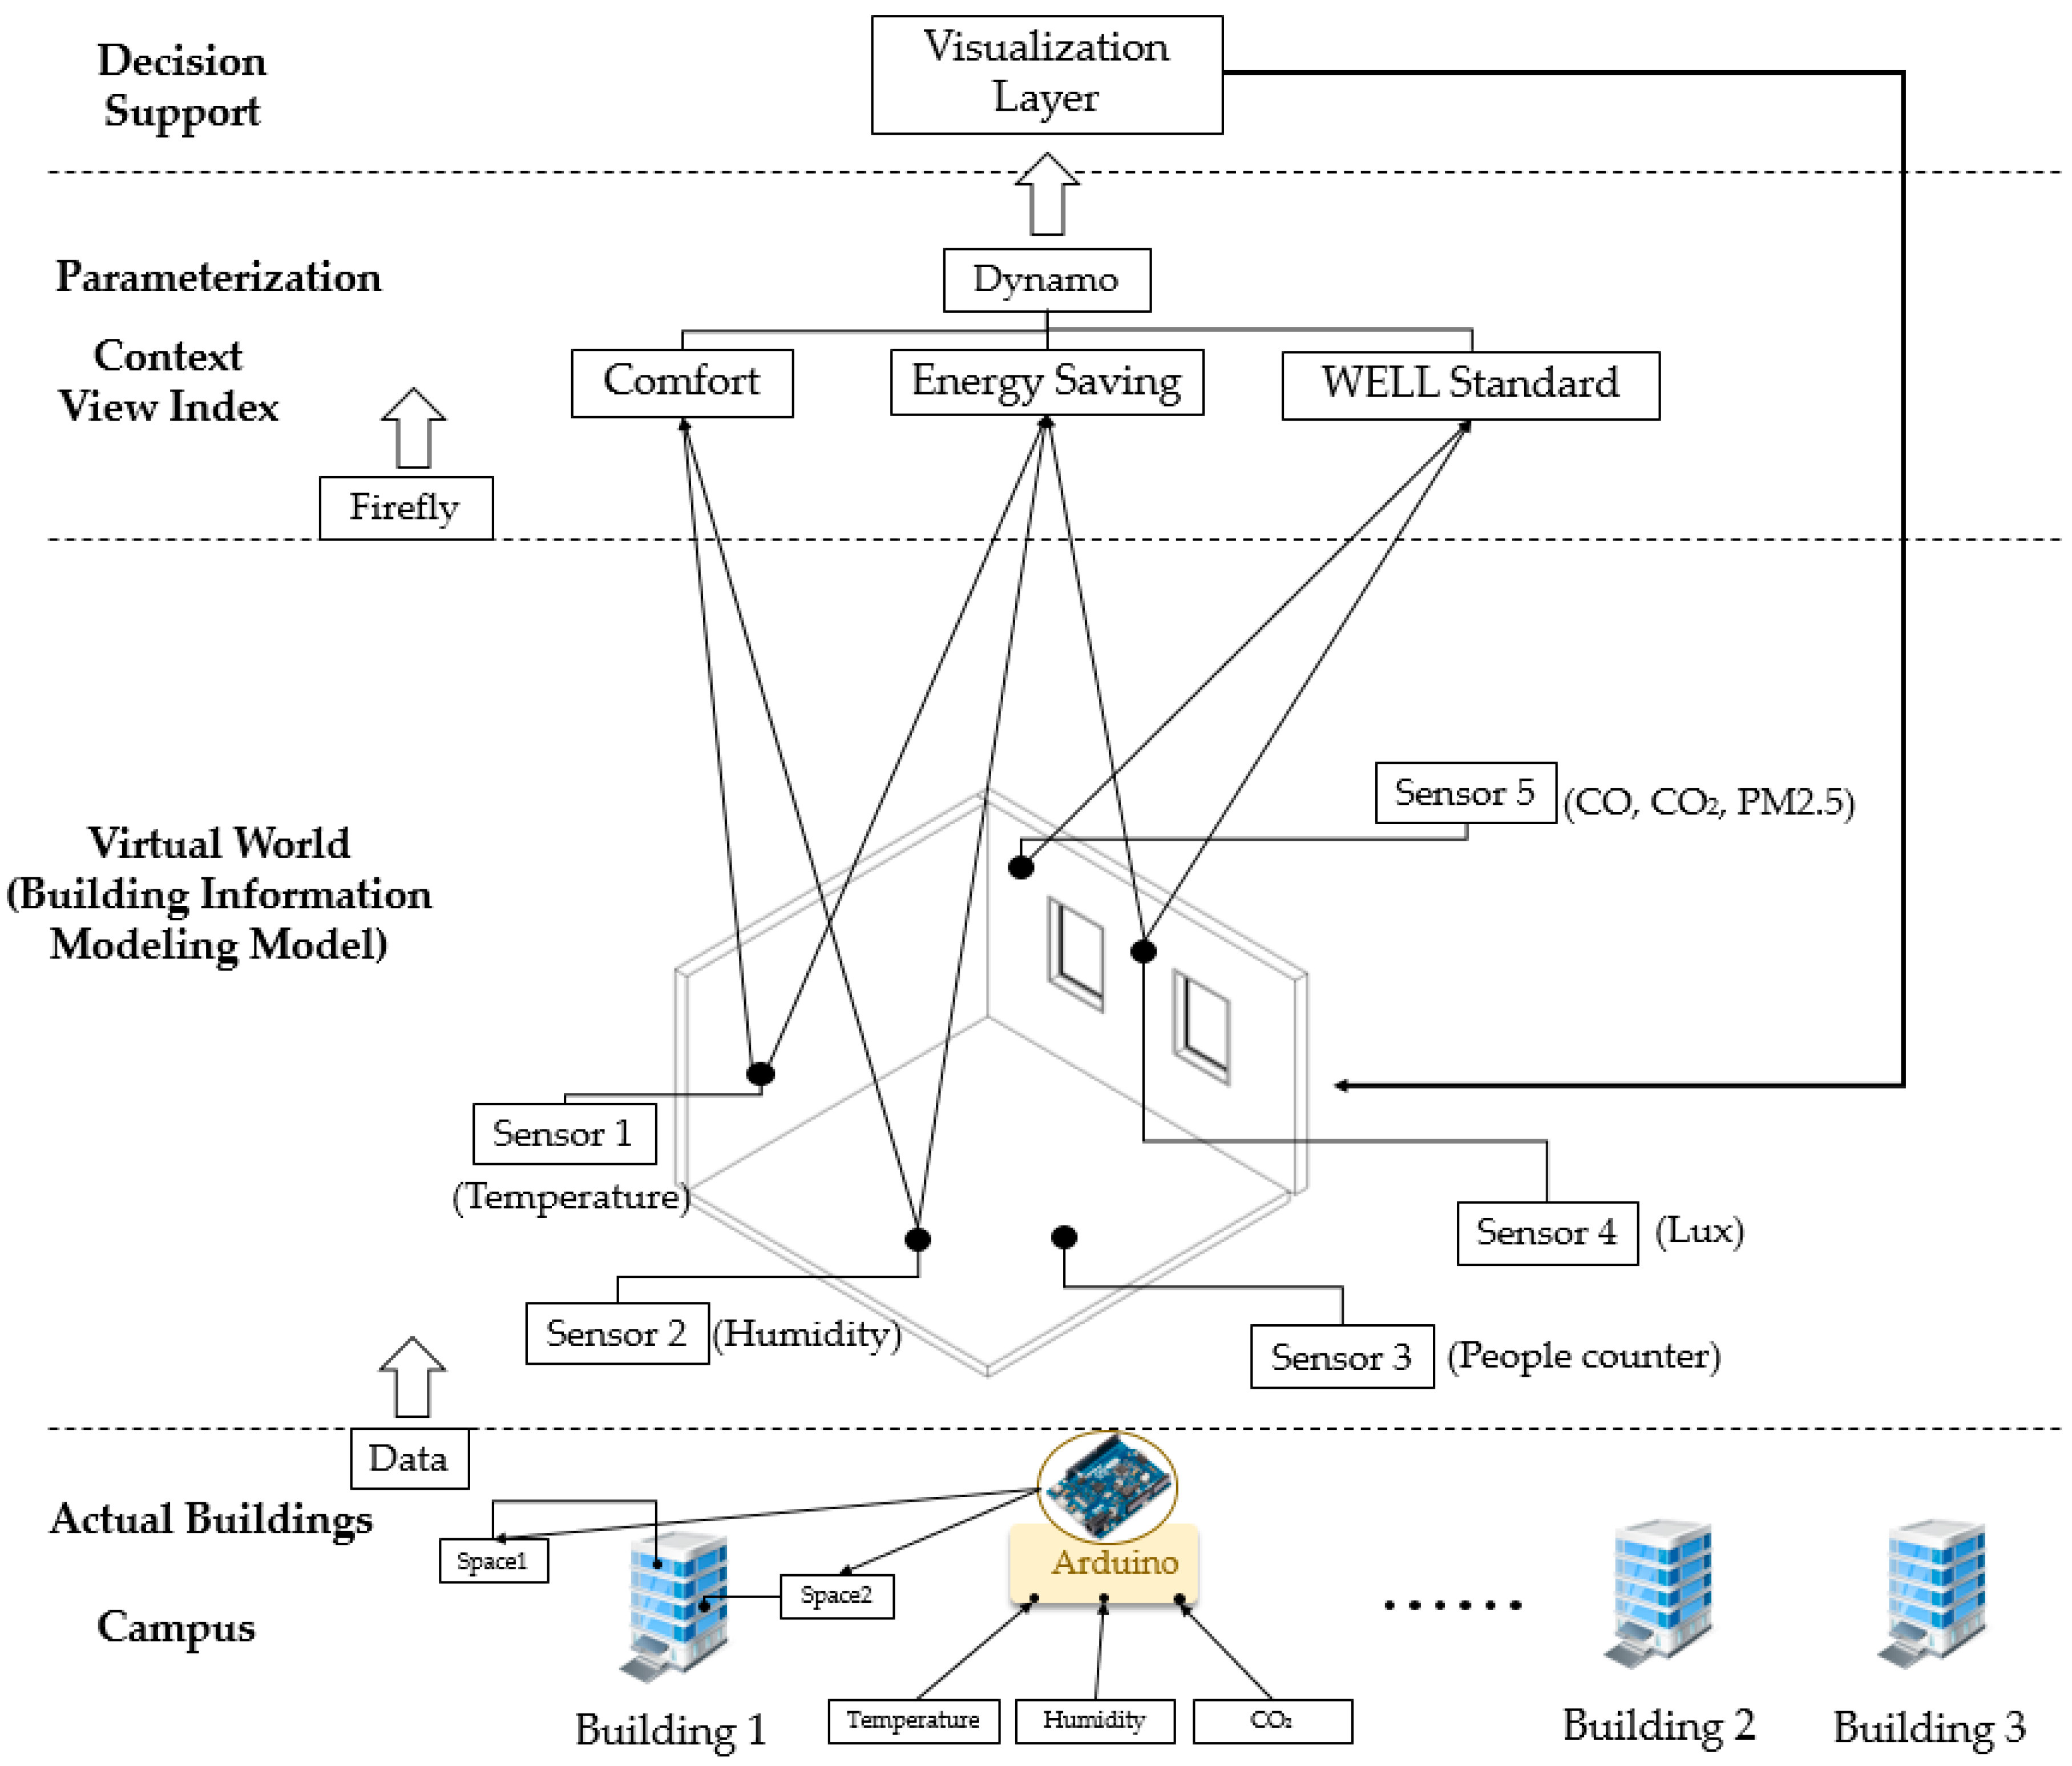
Figure 1 shows our three-part platform design. The first part consists of the automation platform and the second part performs visualization.
- Actual buildings (campus): The campus includes buildings, and sensors and Arduino were deployed in indoor spaces to perform environmental data collection.
- Virtual world (BIM model): After establishing a virtual 3D space and sensor locations, we input real environmental data into the virtual environment through Firefly.
- Data reception and transmission: The Firefly suite is a set of computer code fragments employed to bridge the gaps between BIM-based parametric design software such as Dynamo or Grasshopper [17], a sensor microcontroller such as Arduino, and other input/output devices, such as webcams and mobile phones.
- Parameterization: Depending on decision-making goals in different situations, the operating rules of custom nodes were established using Dynamo, which includes a context view index (including comfort, energy saving, and the WELL Standard).
- Decision support: visualization layer input to the BIM model.
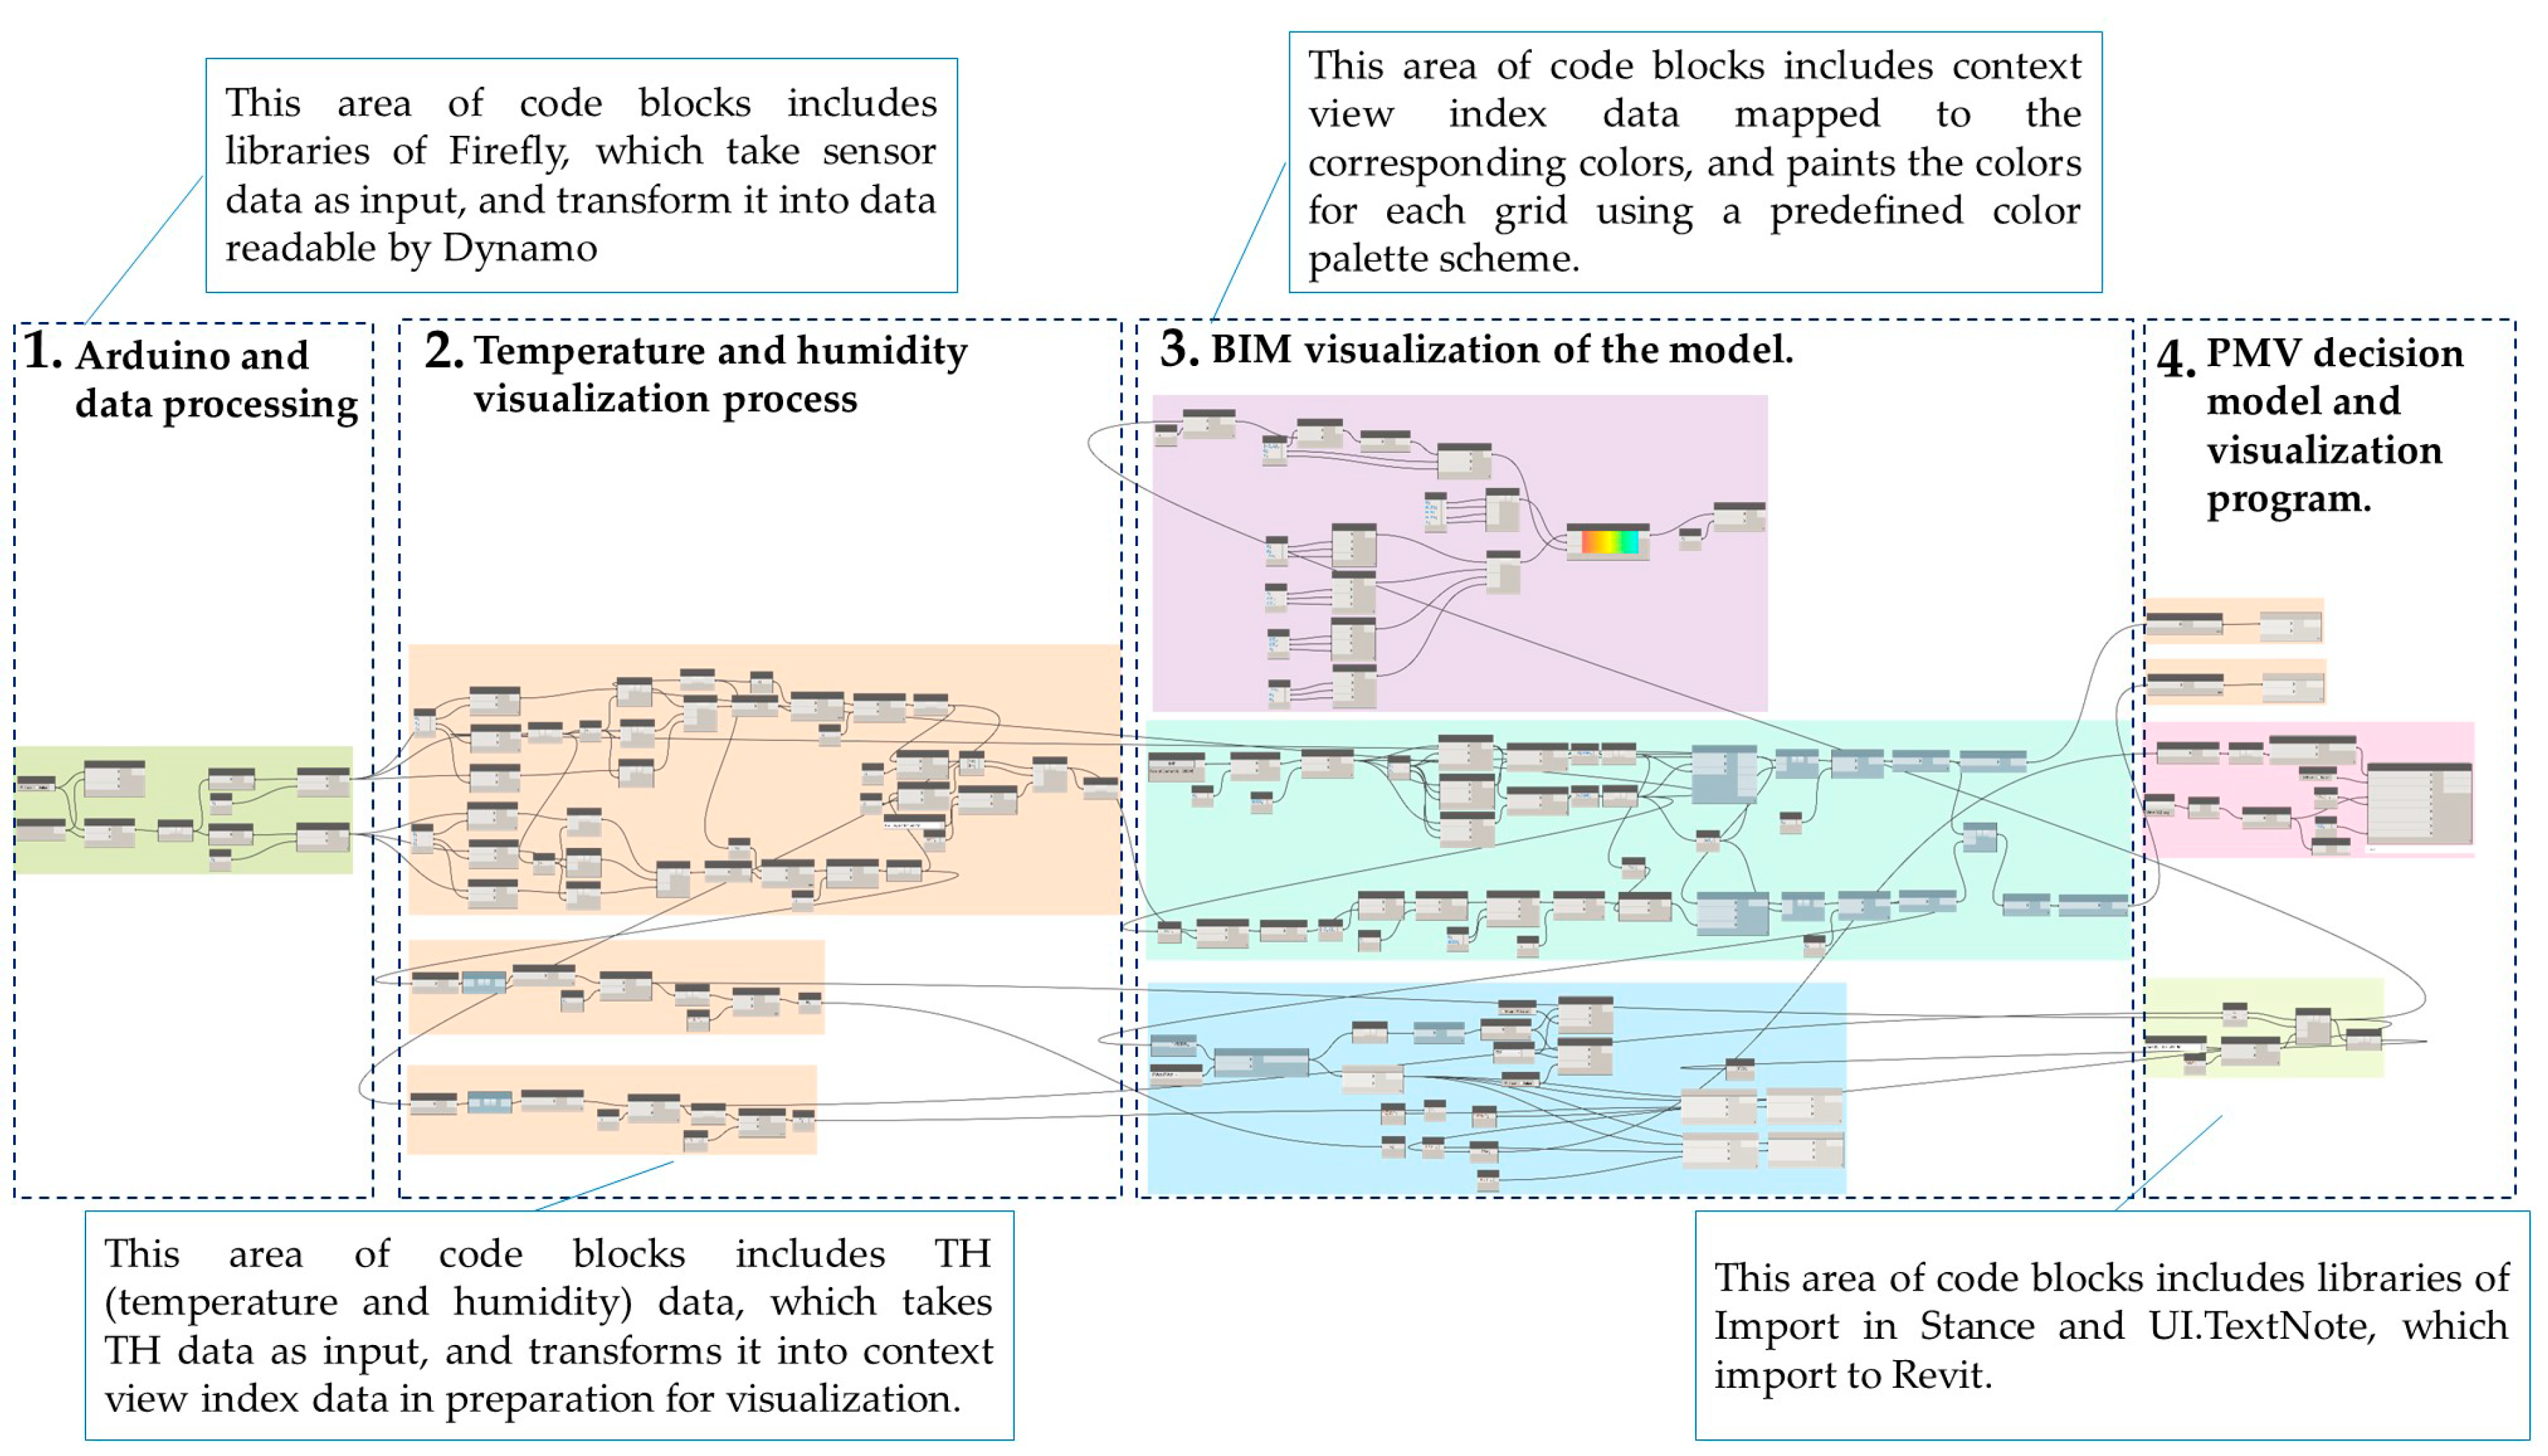
The proposed platform’s four modules consisted of sensor data collection, sensor data integration, parametric control mechanism, and visualization modules. Figure 2 shows the flow of data from generation by sensors to visualization by the BIM model’s interface. The first step was use of the Dynamo environment to establish an Arduino link. The second step was to initiate the data visualization process (including context view index). The third step was to render graphs and the 3D results of graphing in the workspace. The last step was use of the Python programming language to conduct PMV (Predicted Mean Vote) analysis through the use of custom nodes.
2.2. Experimental Design
2.2.1. Scenario Assumptions
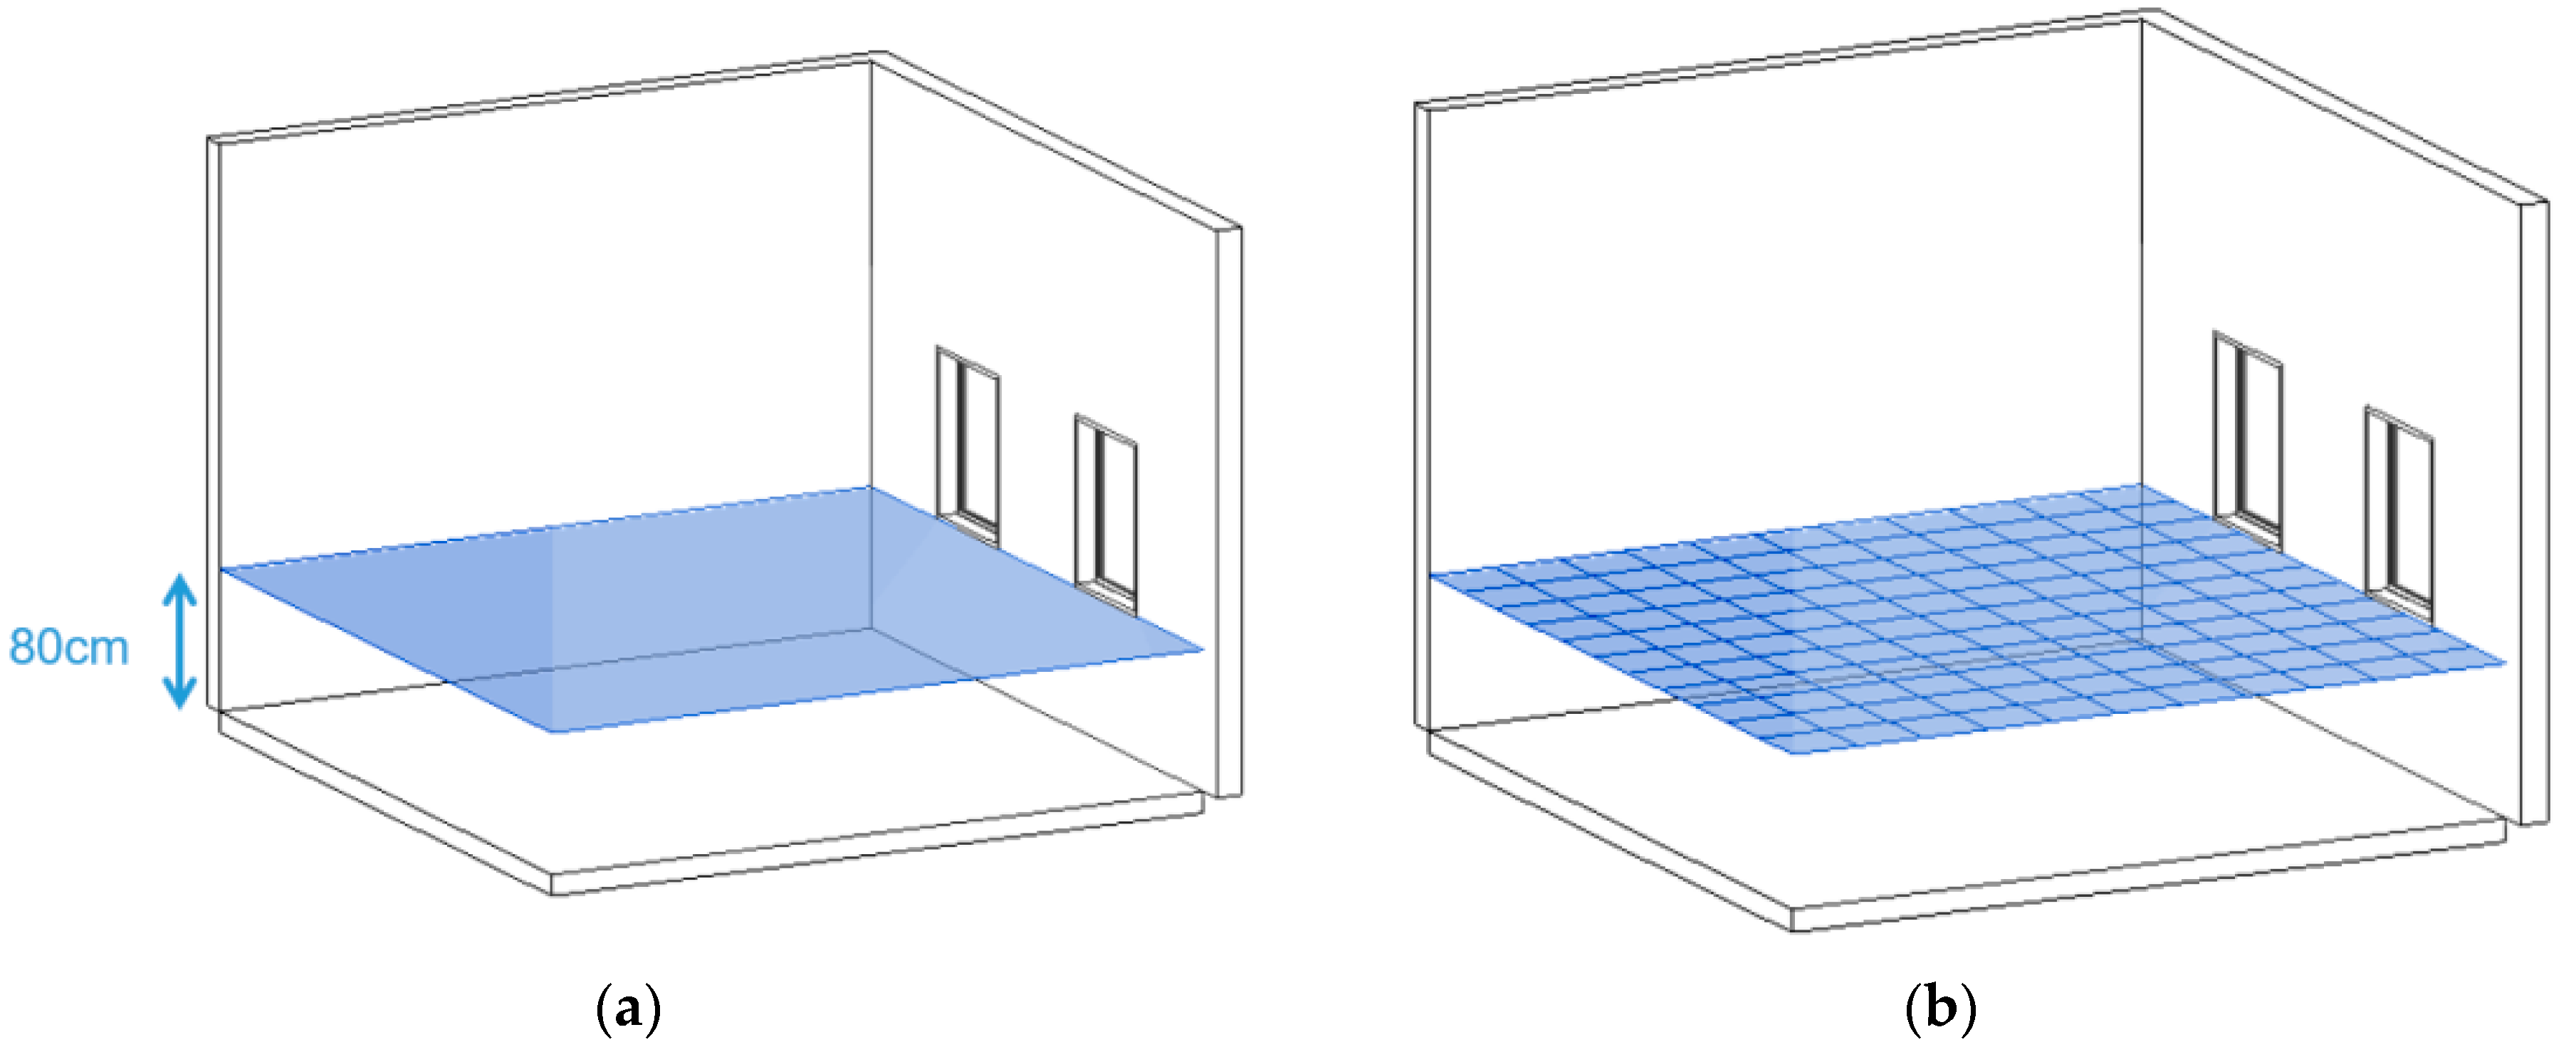
This study targeted student lectures in a typical classroom, and assumed that their comfort was only affected by the temperature and humidity at a height of 80–130 cm above the ground (see Figure 3). Figure 4 shows how the planar space of the target classroom was divided into a grid to facilitate visualization. As the fineness of the grid for a given plane increases, the smoothness of visualization also increases, but at the cost of increased computing load. The sensors were installed in a total of nine locations along the edges and in the center and corners of the campus research laboratory for the purpose of the experiment (see Figure 5).
2.2.2. Arduino Microcontroller
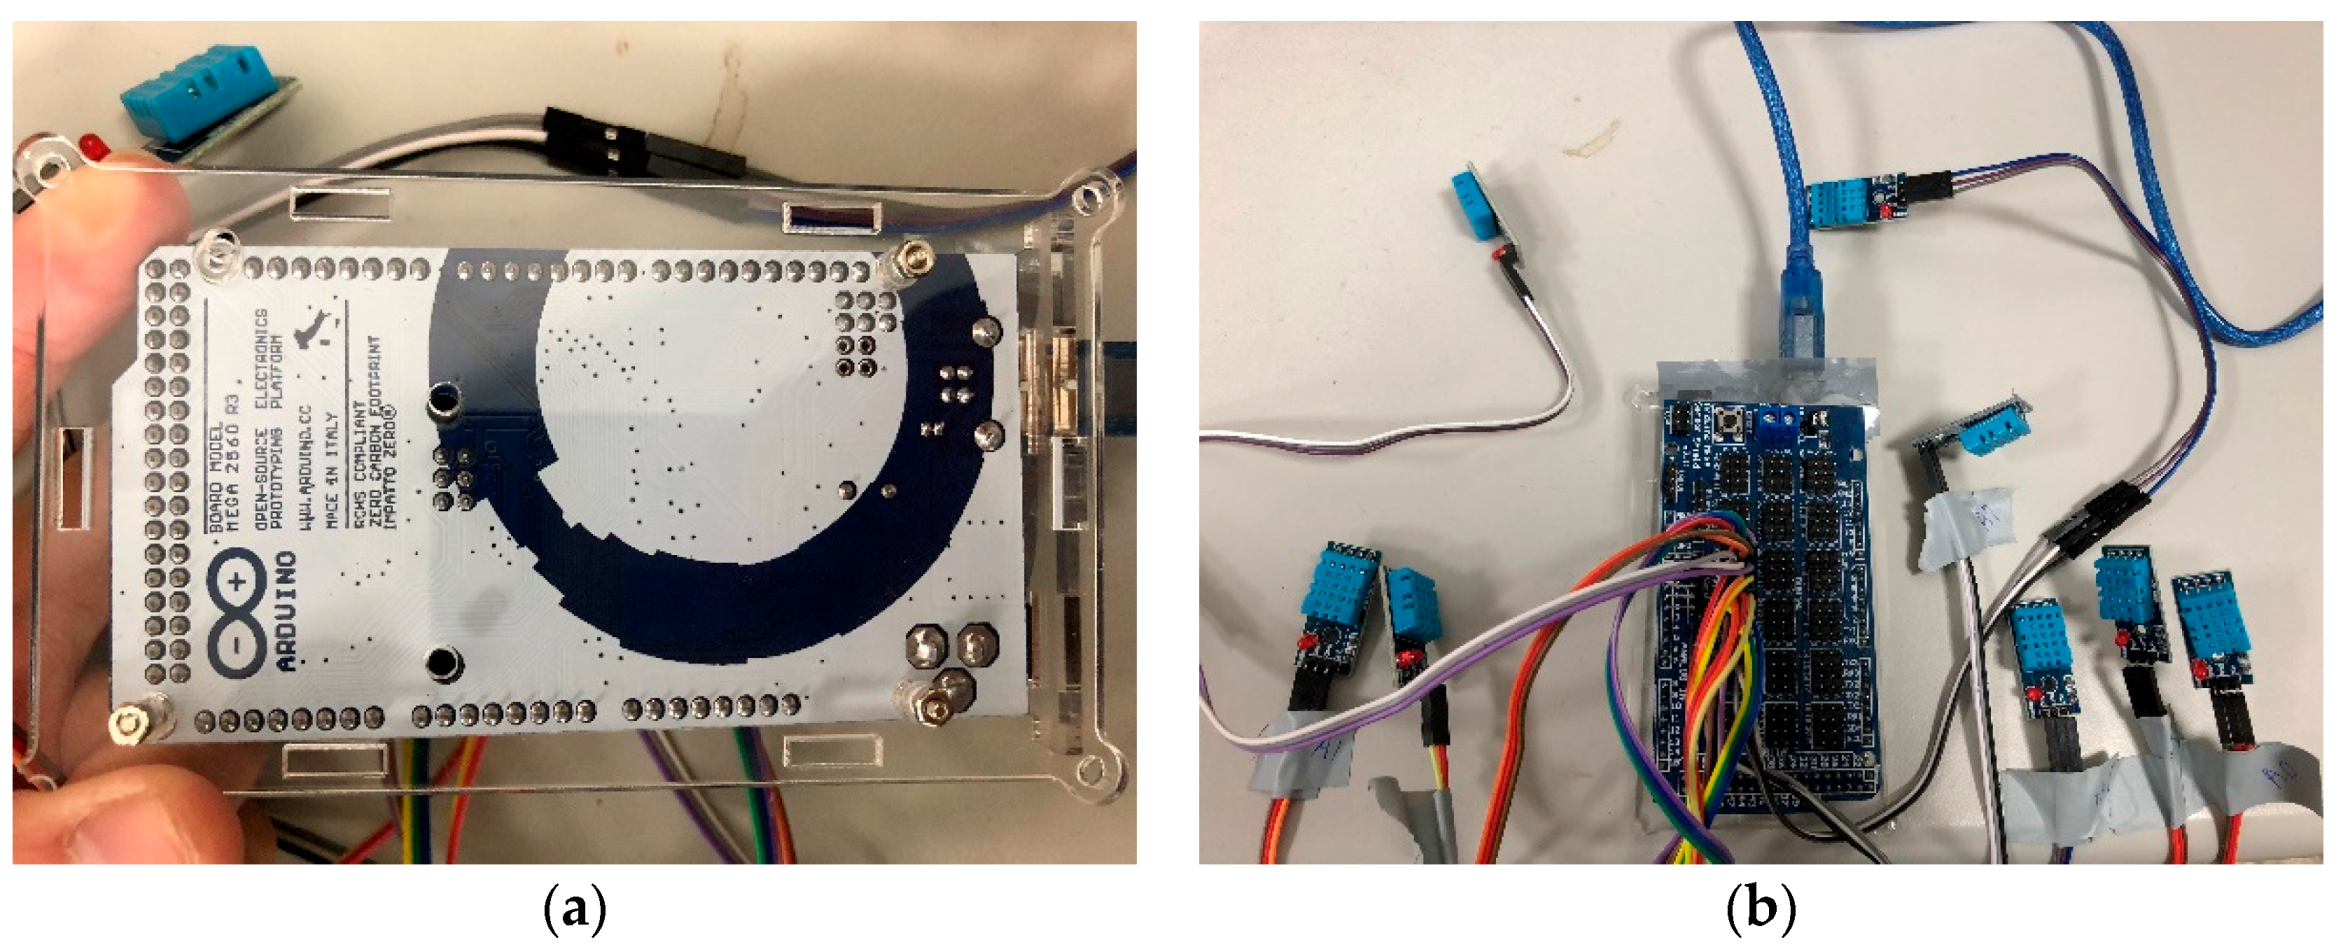
This paper used the Arduino Mega 2560 R3 microcontroller board, which was connected to sensors (DHT-11) measuring the temperature and humidity of the indoor space (see Figure 6). The temperature and humidity measurement ranges and accuracy were as follows [24]:
- Humidity measurement range: 20–90% RH.
- Humidity measurement accuracy: ± 5% RH.
- Temperature measurement range: 0–50 °C.
- Temperature measurement accuracy: ± 2 °C.
- Power supply range: 3–5 V
2.2.3. Dynamo Automation Platform
This study used Dynamo to establish a temperature and humidity data automation platform. Arduino microcontrollers were employed to collect temperature and humidity data in the classroom. The transmission interface established by this platform performed data processing and color spatial visualization, and it could automatically input data into the BIM model. The platform was established employing the following four steps:
- Use the Firefly suite to create a node linking Dynamo and Arduino, forming a basis for interactive prototyping and importing environmental data into Dynamo (see Figure 7).
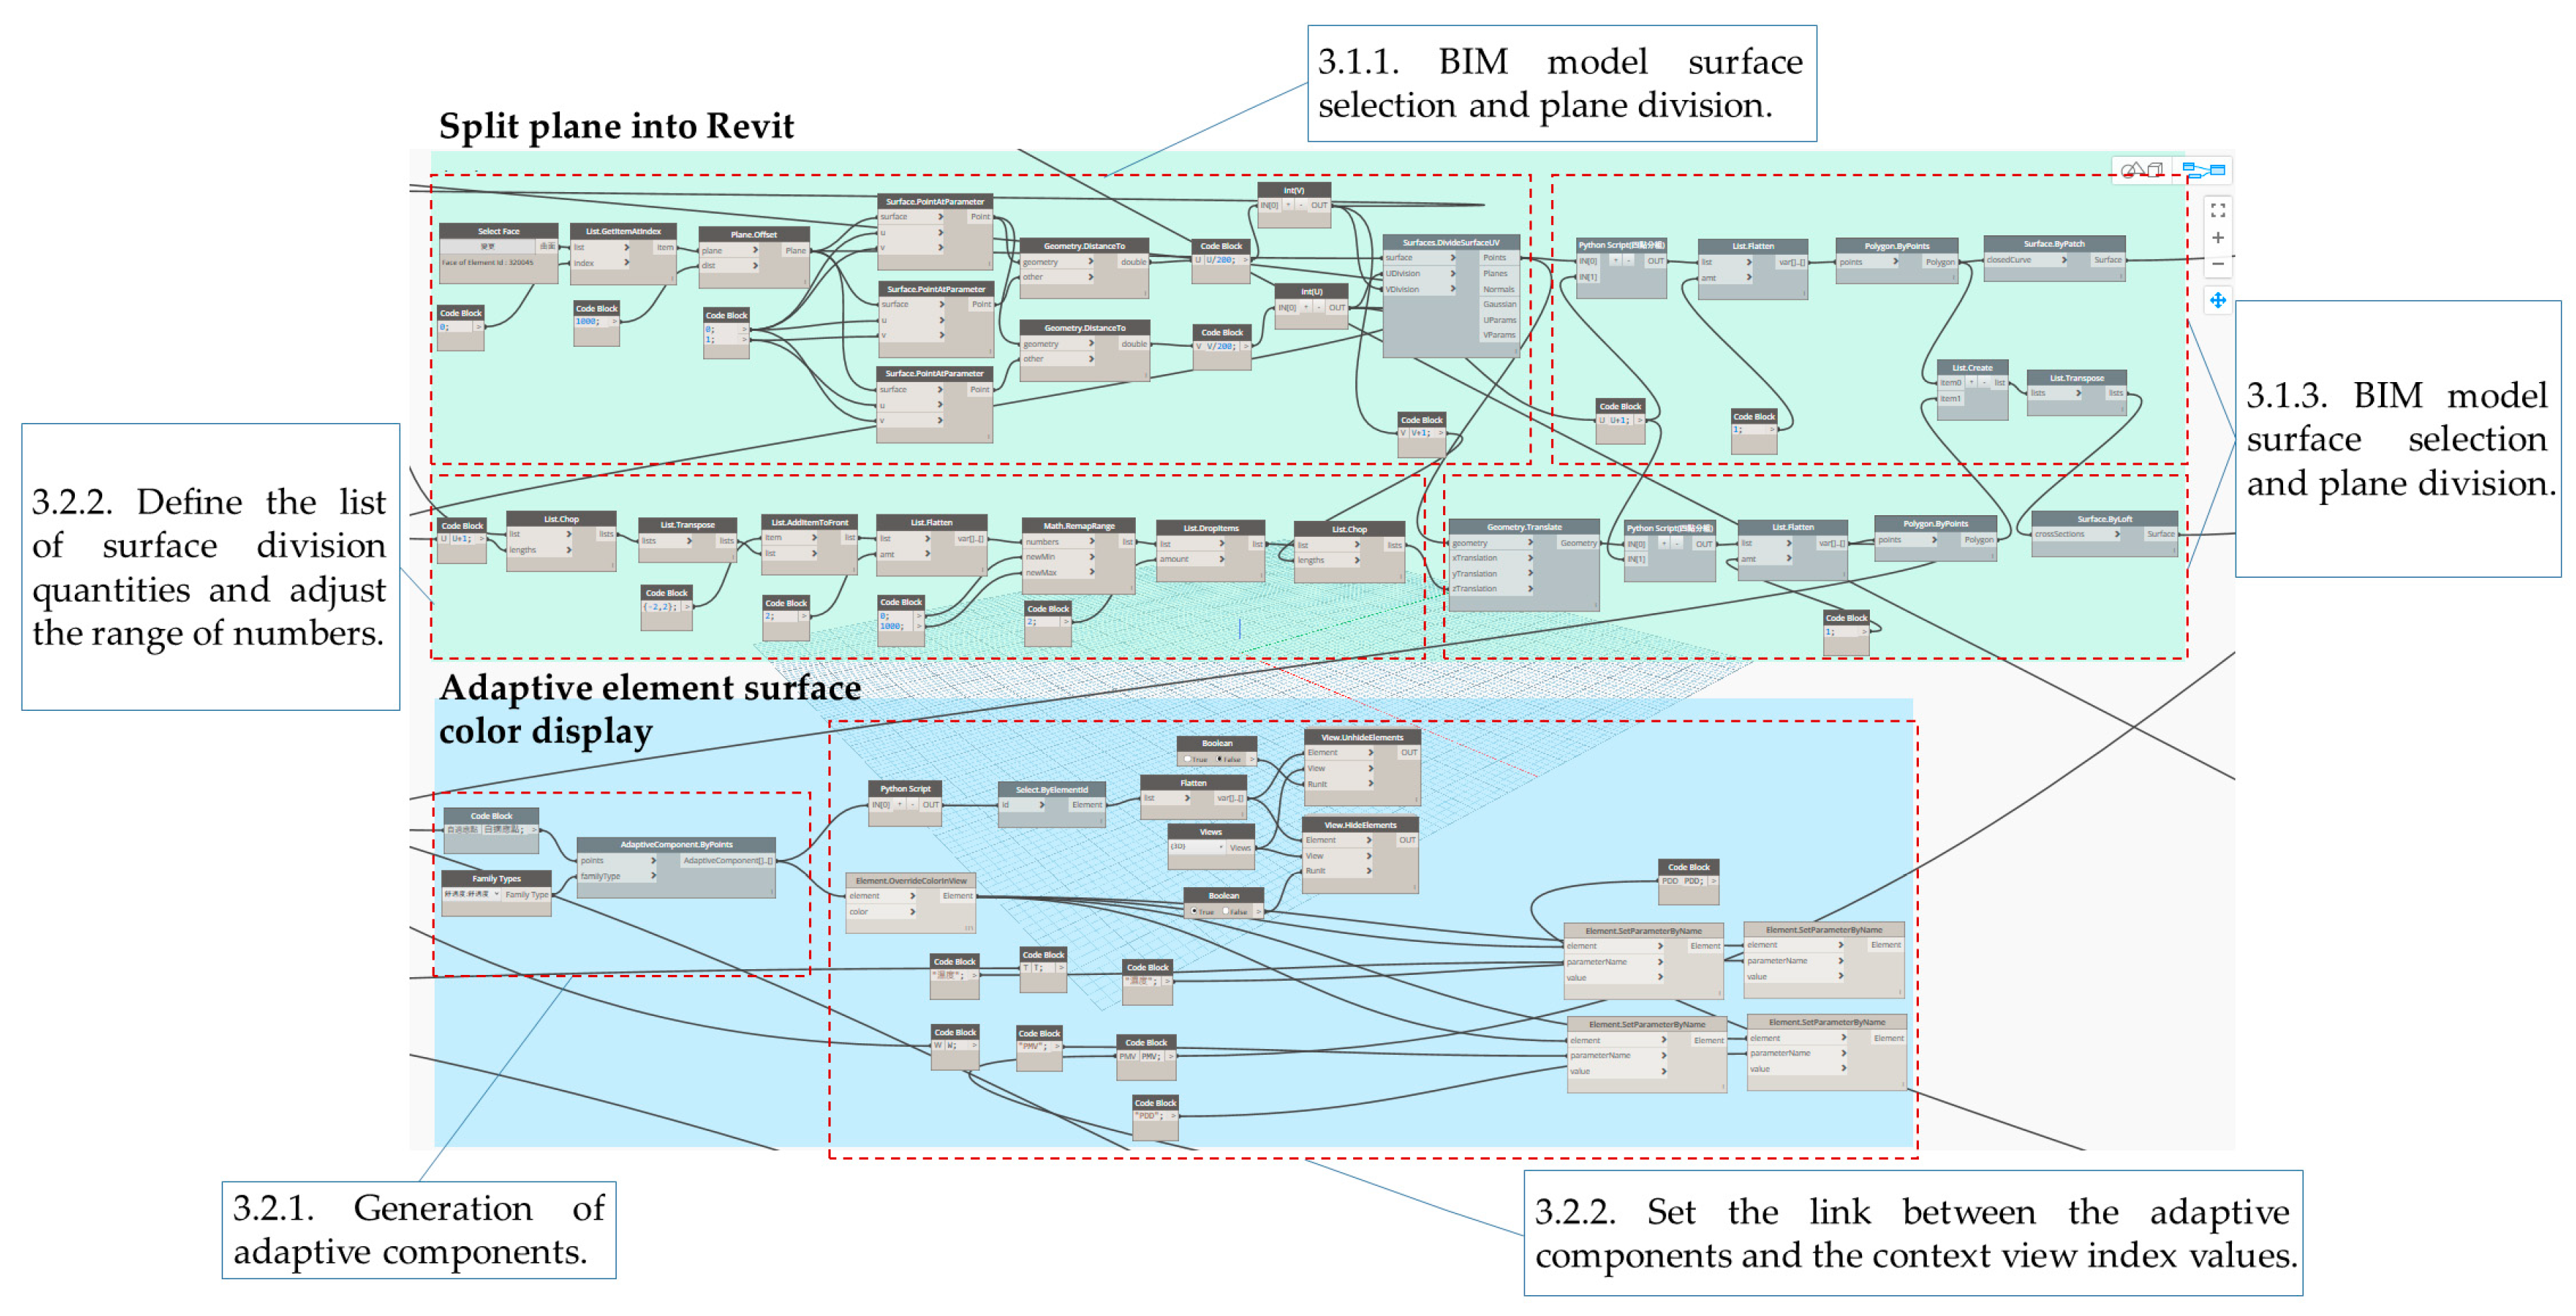
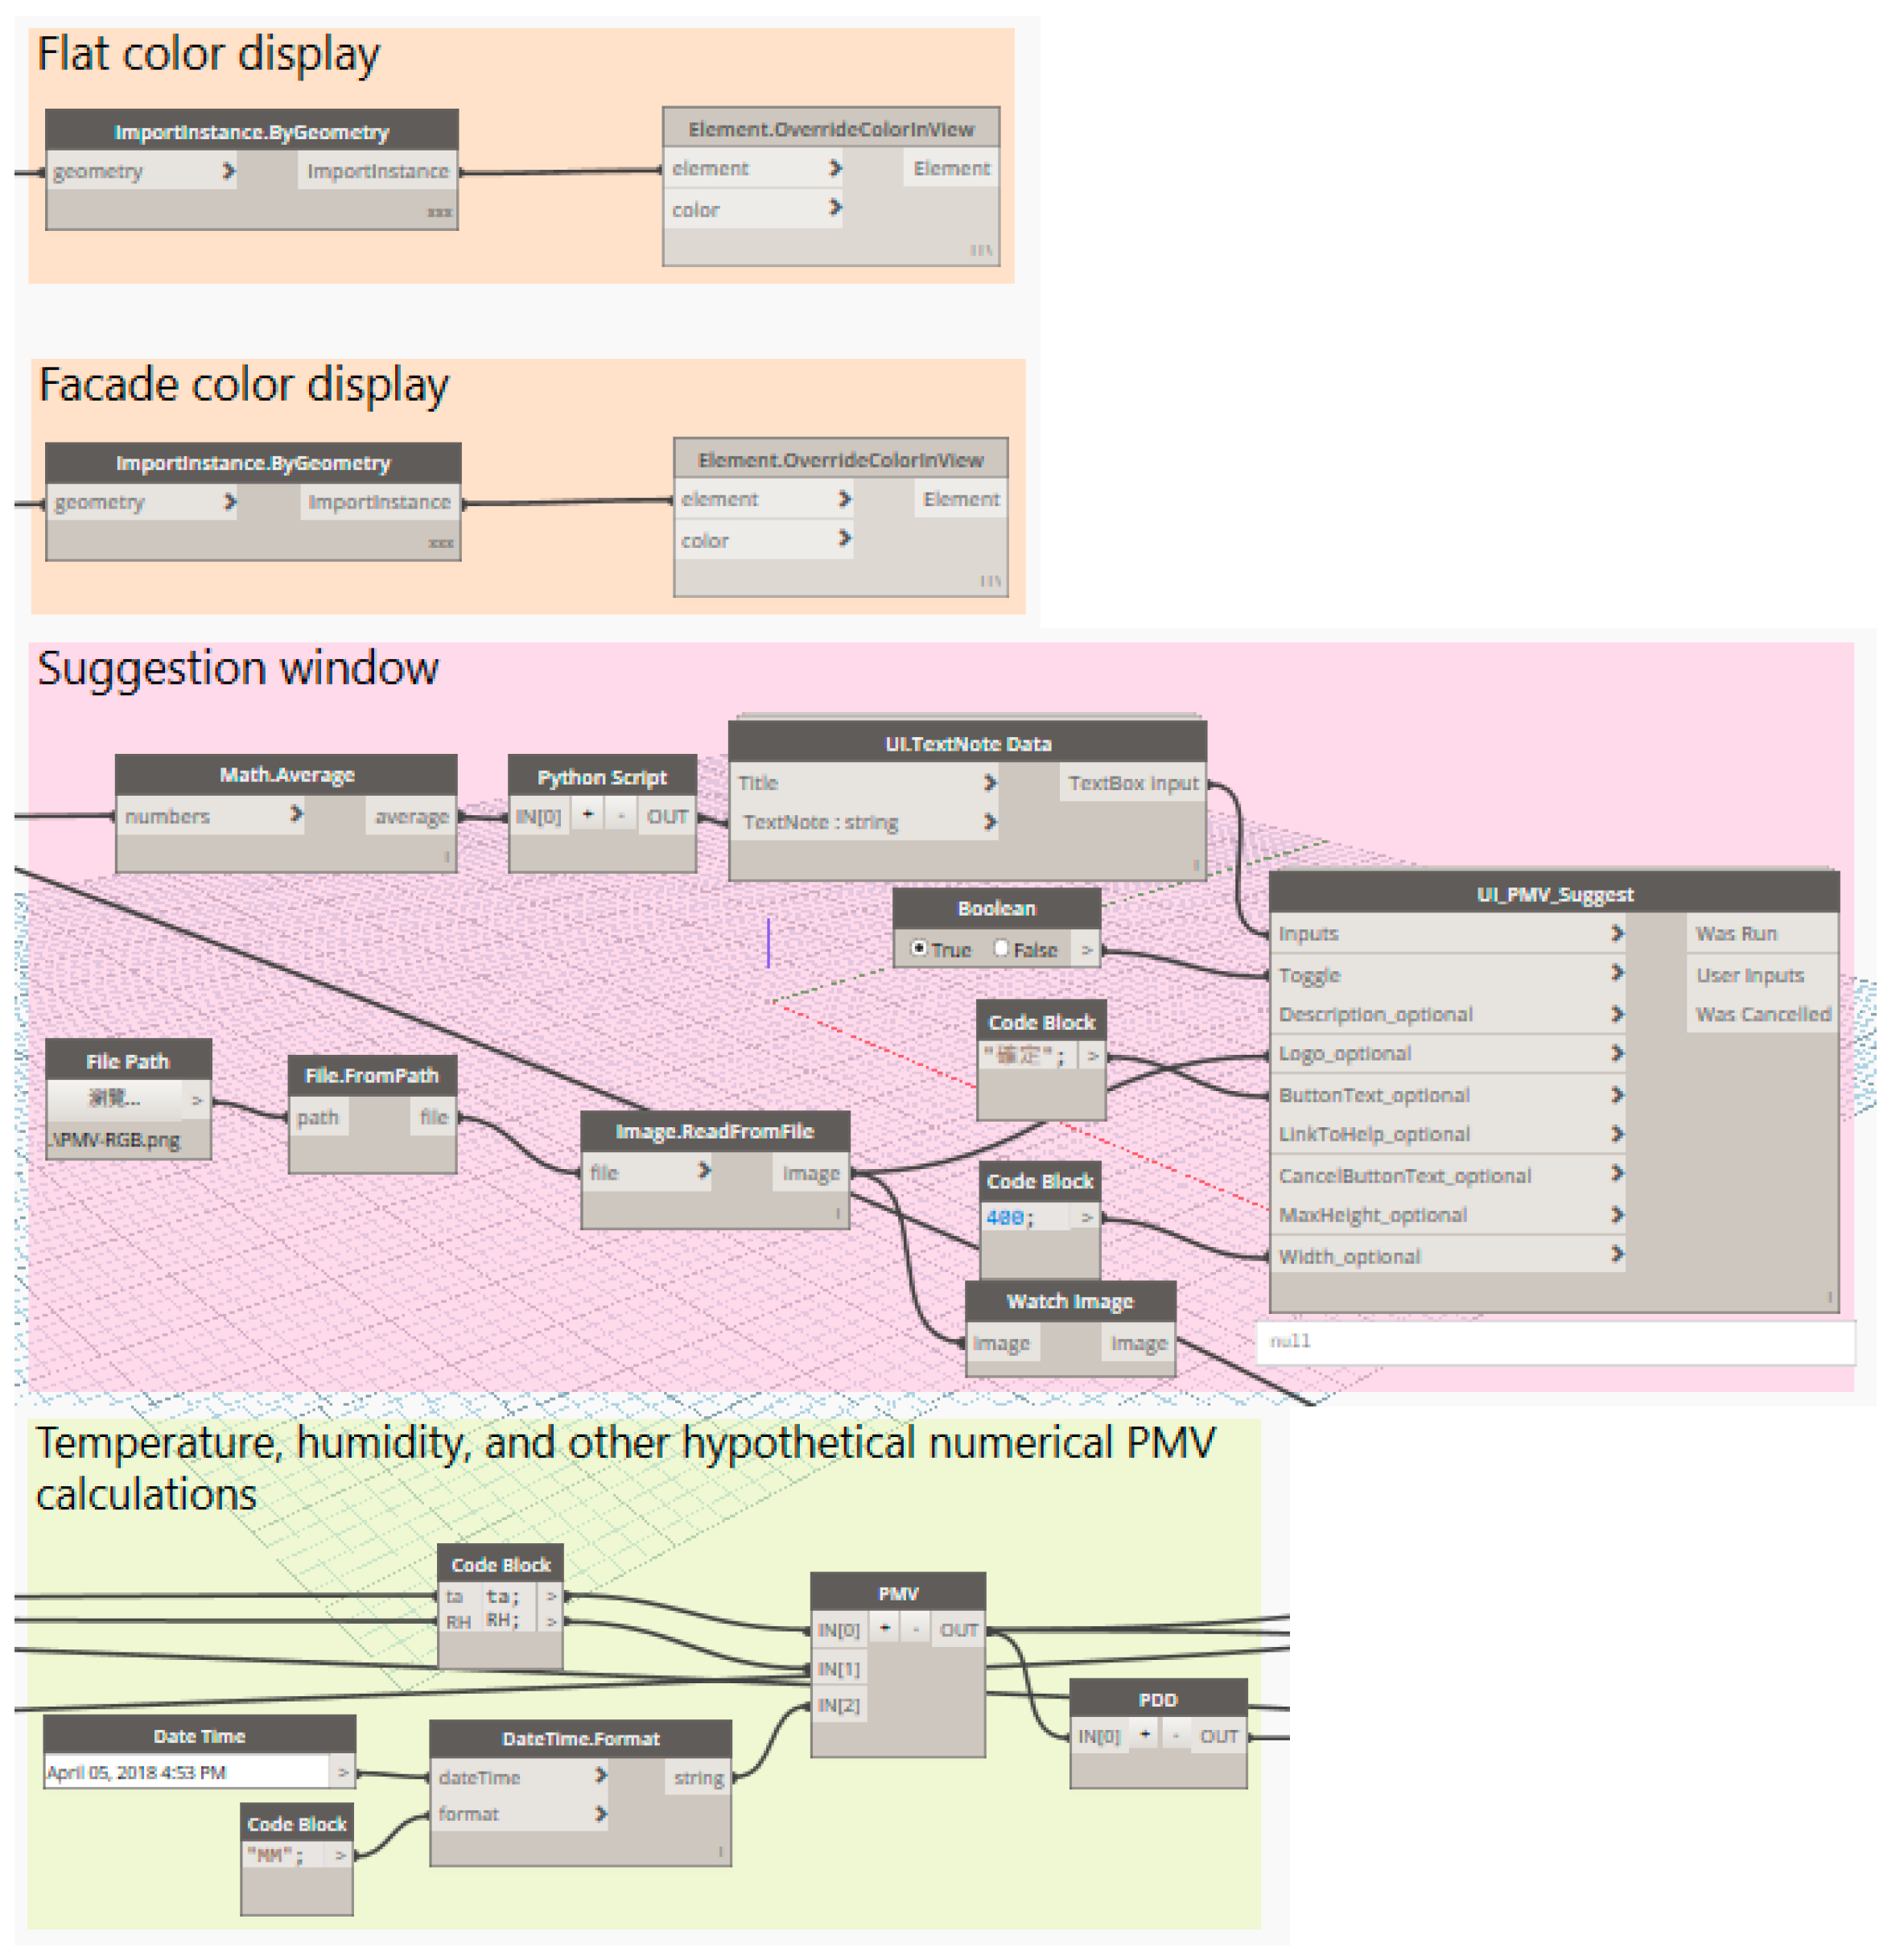
- The code fragments first create a layer component in BIM at the predefined elevation, collect sensor data and calculate the context view index (PMV) for each grid in the layer using interpolation, and then paint the corresponding color for each grid based on the predefined color palette scheme. The result of this step creates a thermography-like image and allows a user to visually see the distribution of the desired context view index value of the space in BIM (see Figure 10).
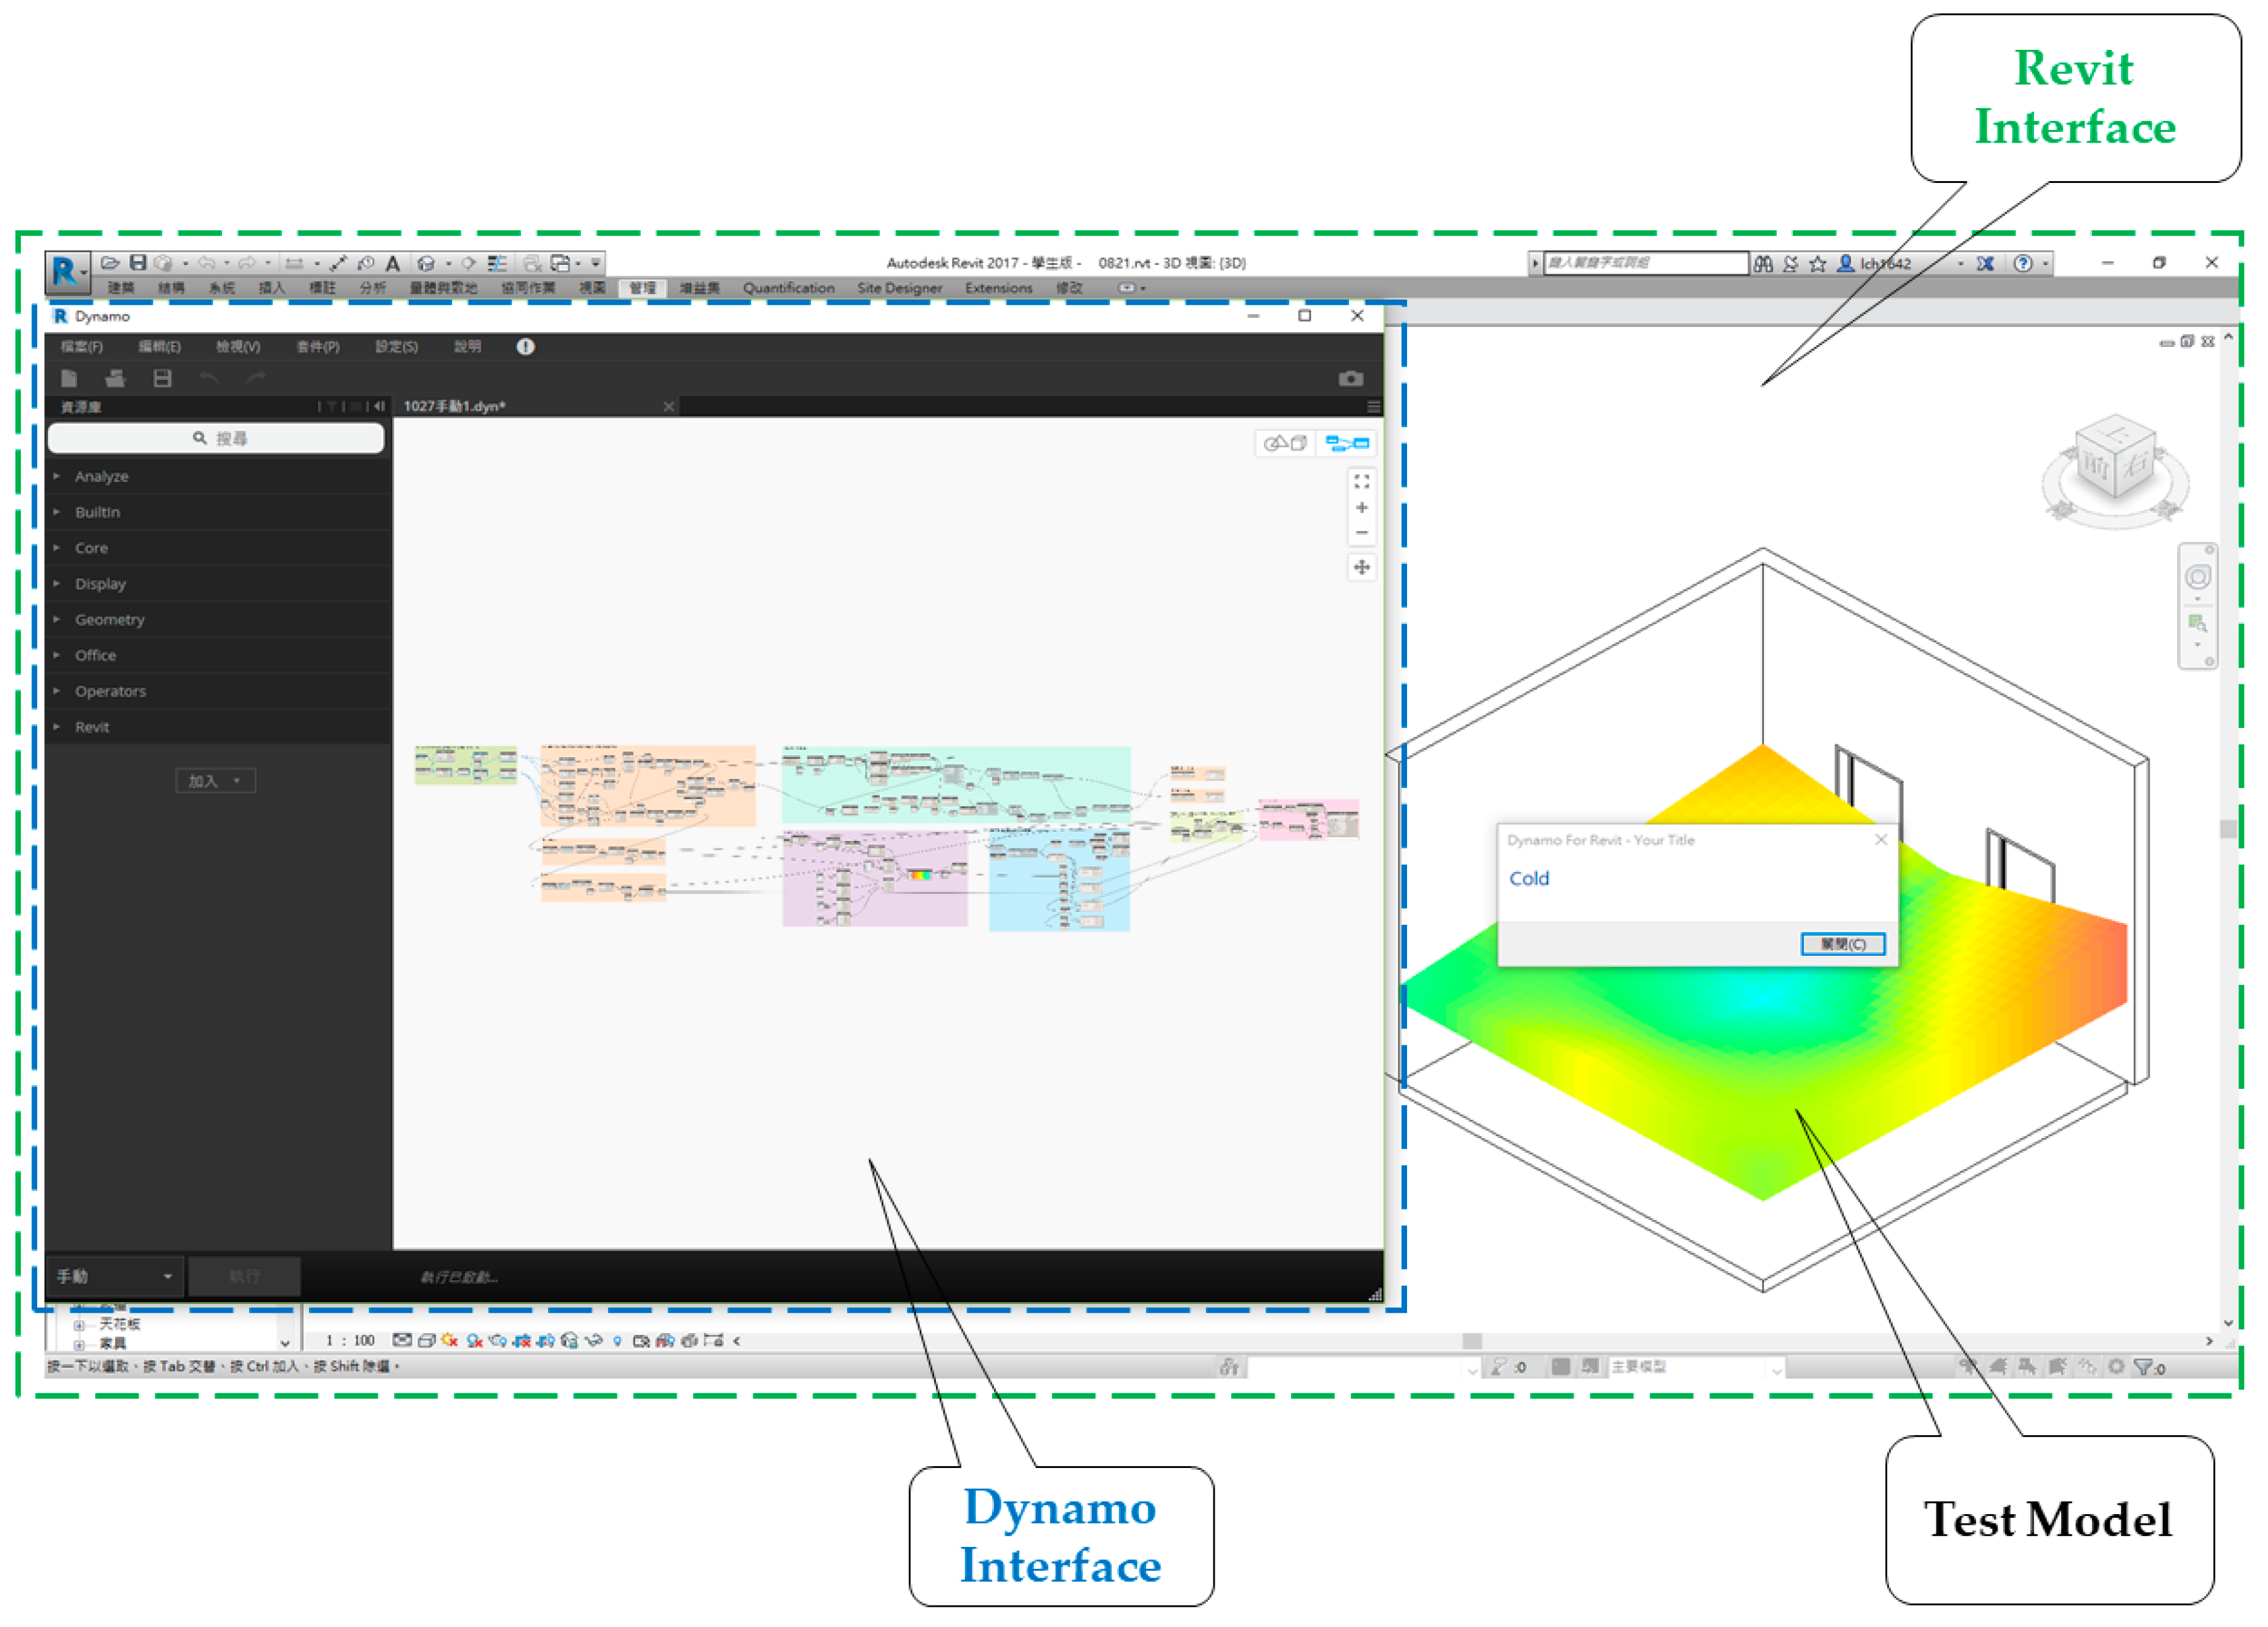
- Decisions concerning the indoor comfort pointer are based on predicted mean vote (PMV), and the results of analysis can be presented in the BIM model on this platform as shown in Figure 11. Note that PMV is a common metric for assessing the comfort level of an indoor environment, and has been adopted in ISO 7730 [25].
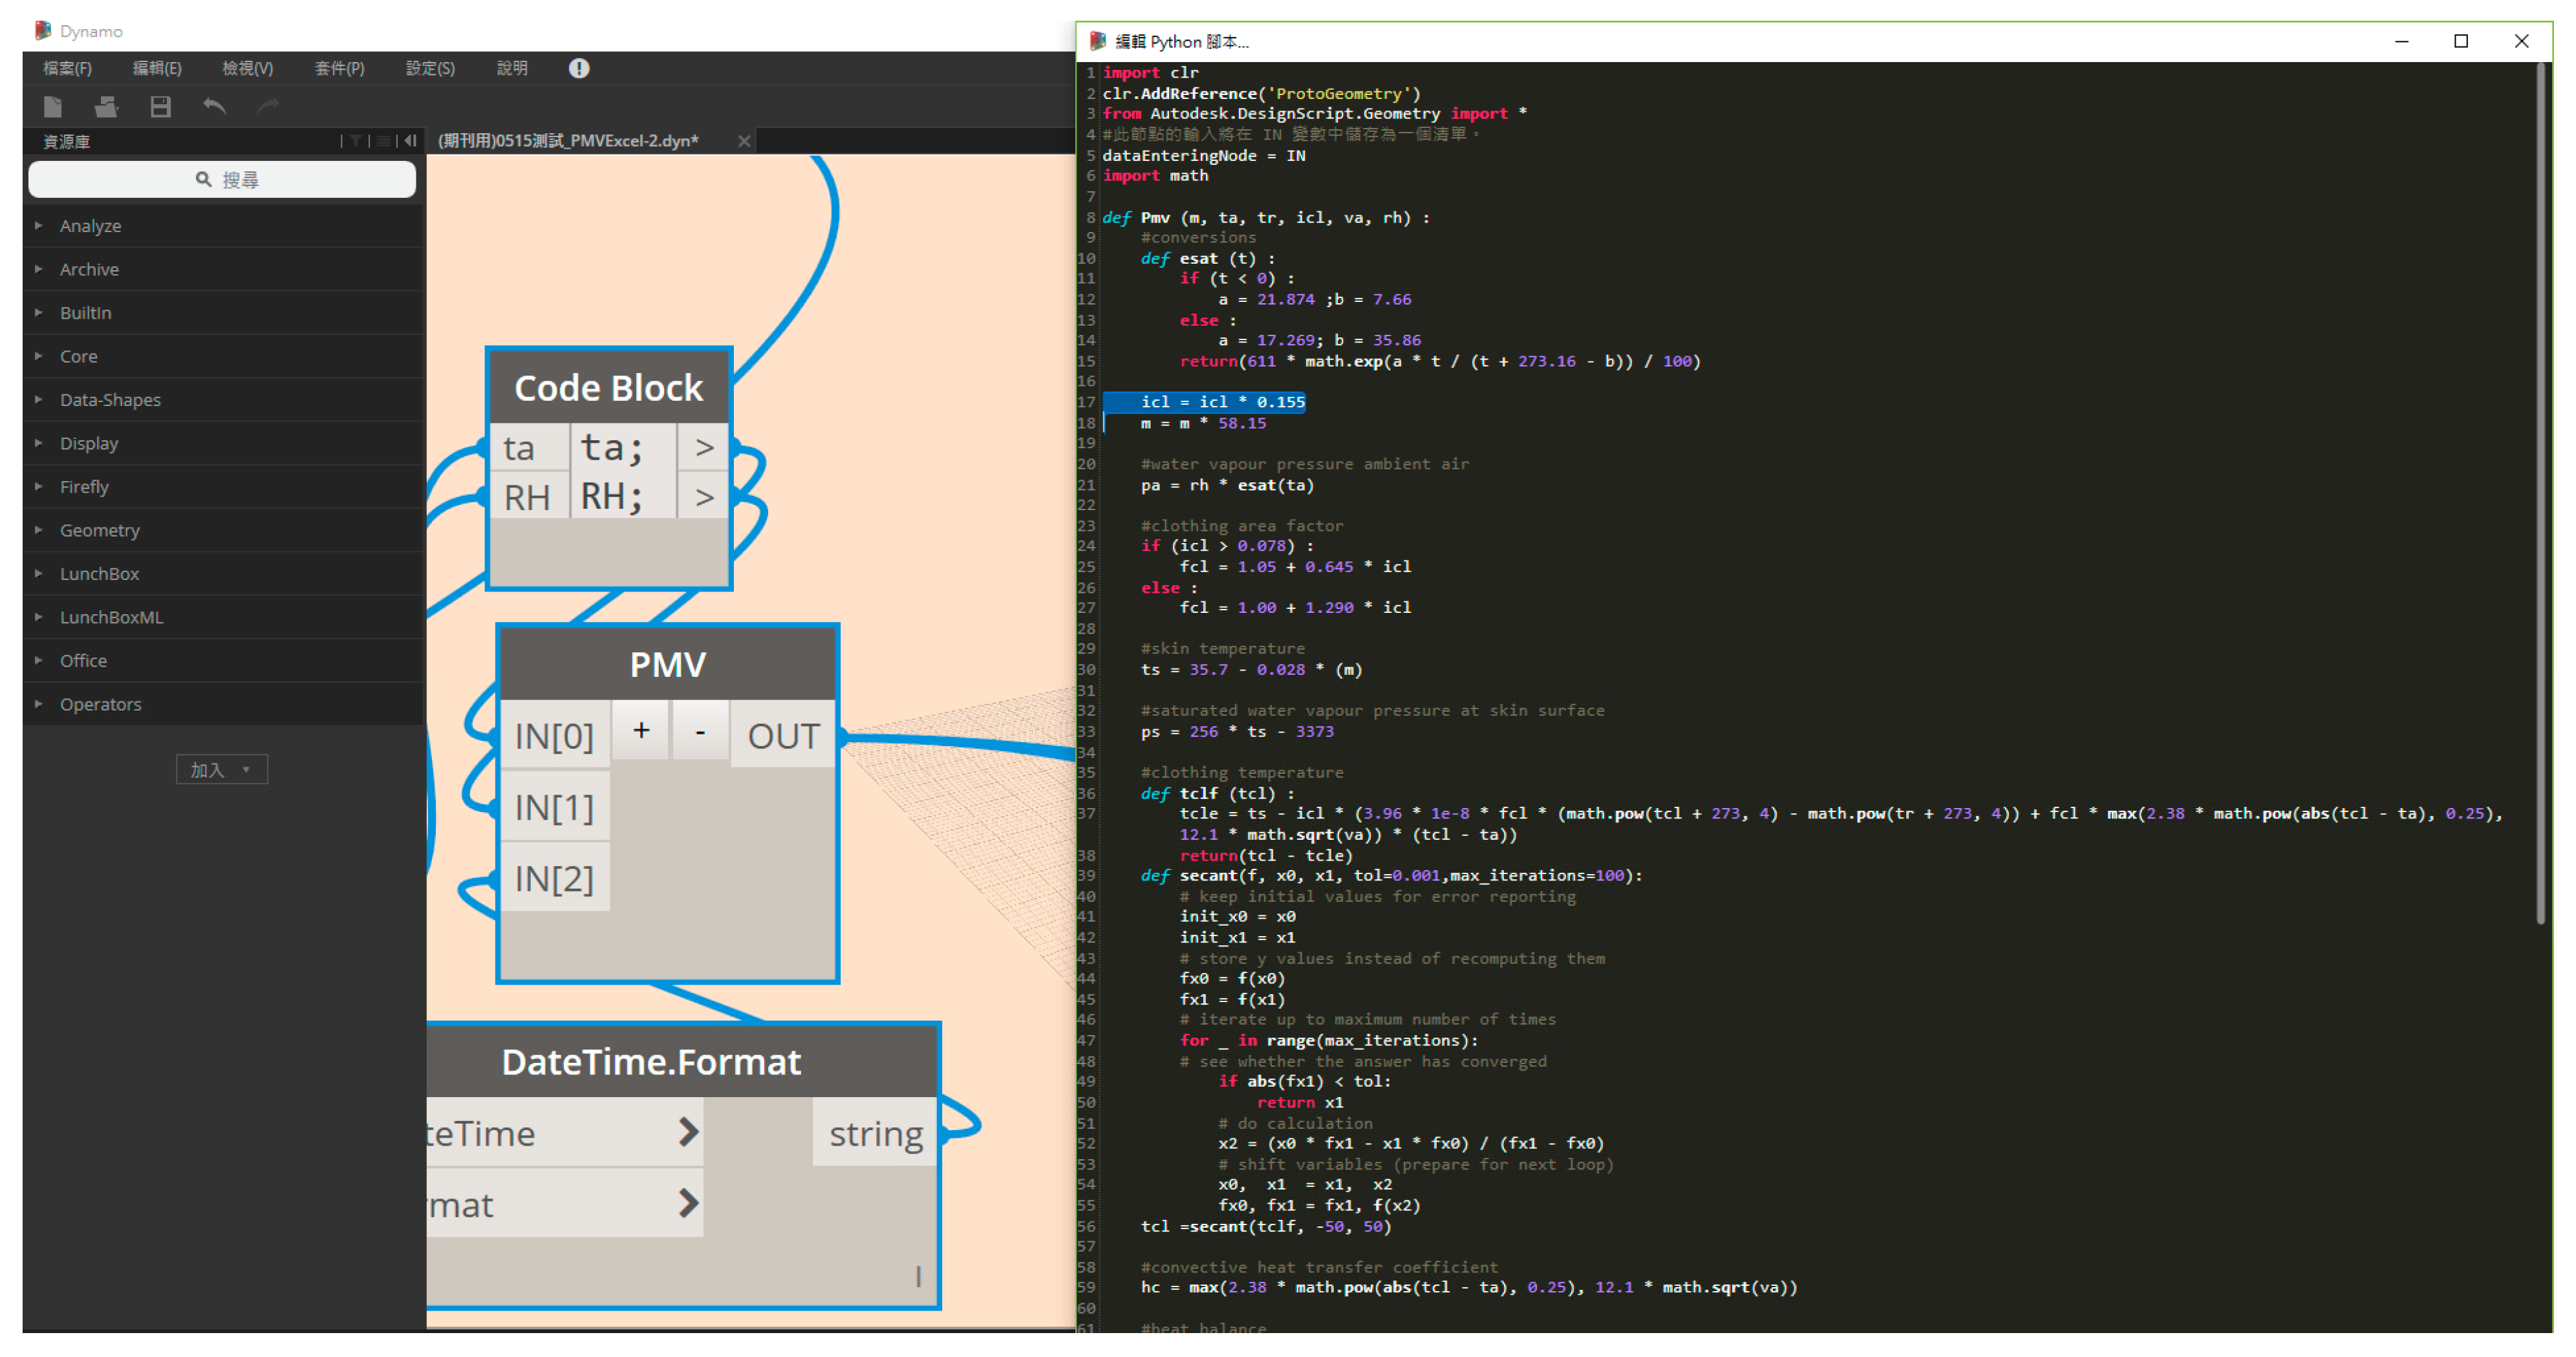
The PMV formula used in this study is shown in Equations (1)–(4). When PMV = 0, the indoor environment is in the best thermal comfort state [26]. According to ISO 7730, an ideal PMV value is between −0.5 and +0.5 [25]. PMV can be calculated based on factors including the body’s metabolic rate and clothing insulation, as well as environmental parameters (air temperature, average radiant temperature, relative air velocity and humidity). As illustrated in Figure 12, a PMV formula can be written in Python and nested in Dynamo to create a node for reading the PMV.
where
PMV = [1.303 exp(−0.306 M) + 0.028] {(M − W) − 3.05 × 10−3 × [5733 − 6.99(M − W) − Pa] − 0.42[(M − W) − 58.15] − 1.7 × 10⁻⁵M(5867 − Pa) − 0.0014M(34 − ta) − 3.96 10−8 fcl [(tcl + 273)4 − (tr + 273)4] − fcl hc (tcl−ta)},
tcl = 35.7 − 0.028(M − W) − Icl{3.96 10−8 fcl[(tcl + 273)4 − (tr + 273)4] + fcl hc(tcl−ta)},
M: metabolic heat rate, ranging from 46 to 232 (W/m2);
W: effective mechanical power (W/m2);
Icl: clothing insulation (m2K/W);
fcl: clothing surface area factor;
tcl: clothing surface temperature (°C);
ta: air temperature (°C);
hc: convection heat transfer coefficient (W/m2K);
tr: mean radiant temperature (°C);
va: relative wind speed (m/s);
Pa: water vapor partial pressure (Pa);
RH: humidity (%).
This study adopted the following values suggested by the Taiwan Central Weather Bureau [27] for the four parameters required in the PMV formula:
- M was set as 70 (w/m2) because students mostly performed stationary tasks (such as typing on laptop computers, reading and writing) in the classroom.
- W was set as 0 (W/m2) because this is usually assumed to be 0 (W/m2) when assessing indoor comfort.
- Icl was set to 0.11 (m2k/W) because the experiment was conducted during the winter, and the students usually wore long-sleeved clothing.
- va was set to 0.1 (m/s) for the wind speed in winter.
Table 2 shows the corresponding comfort level for each range of PMV values. Our platform allows users to visualize the distribution of comfort level for a space by calculating and colorizing the PMV values for each grid square based on the sensor data collected in the proximity of that grid square [26]. Figure 13 shows the visualized results in the BIM test model.
3. Case Demonstration
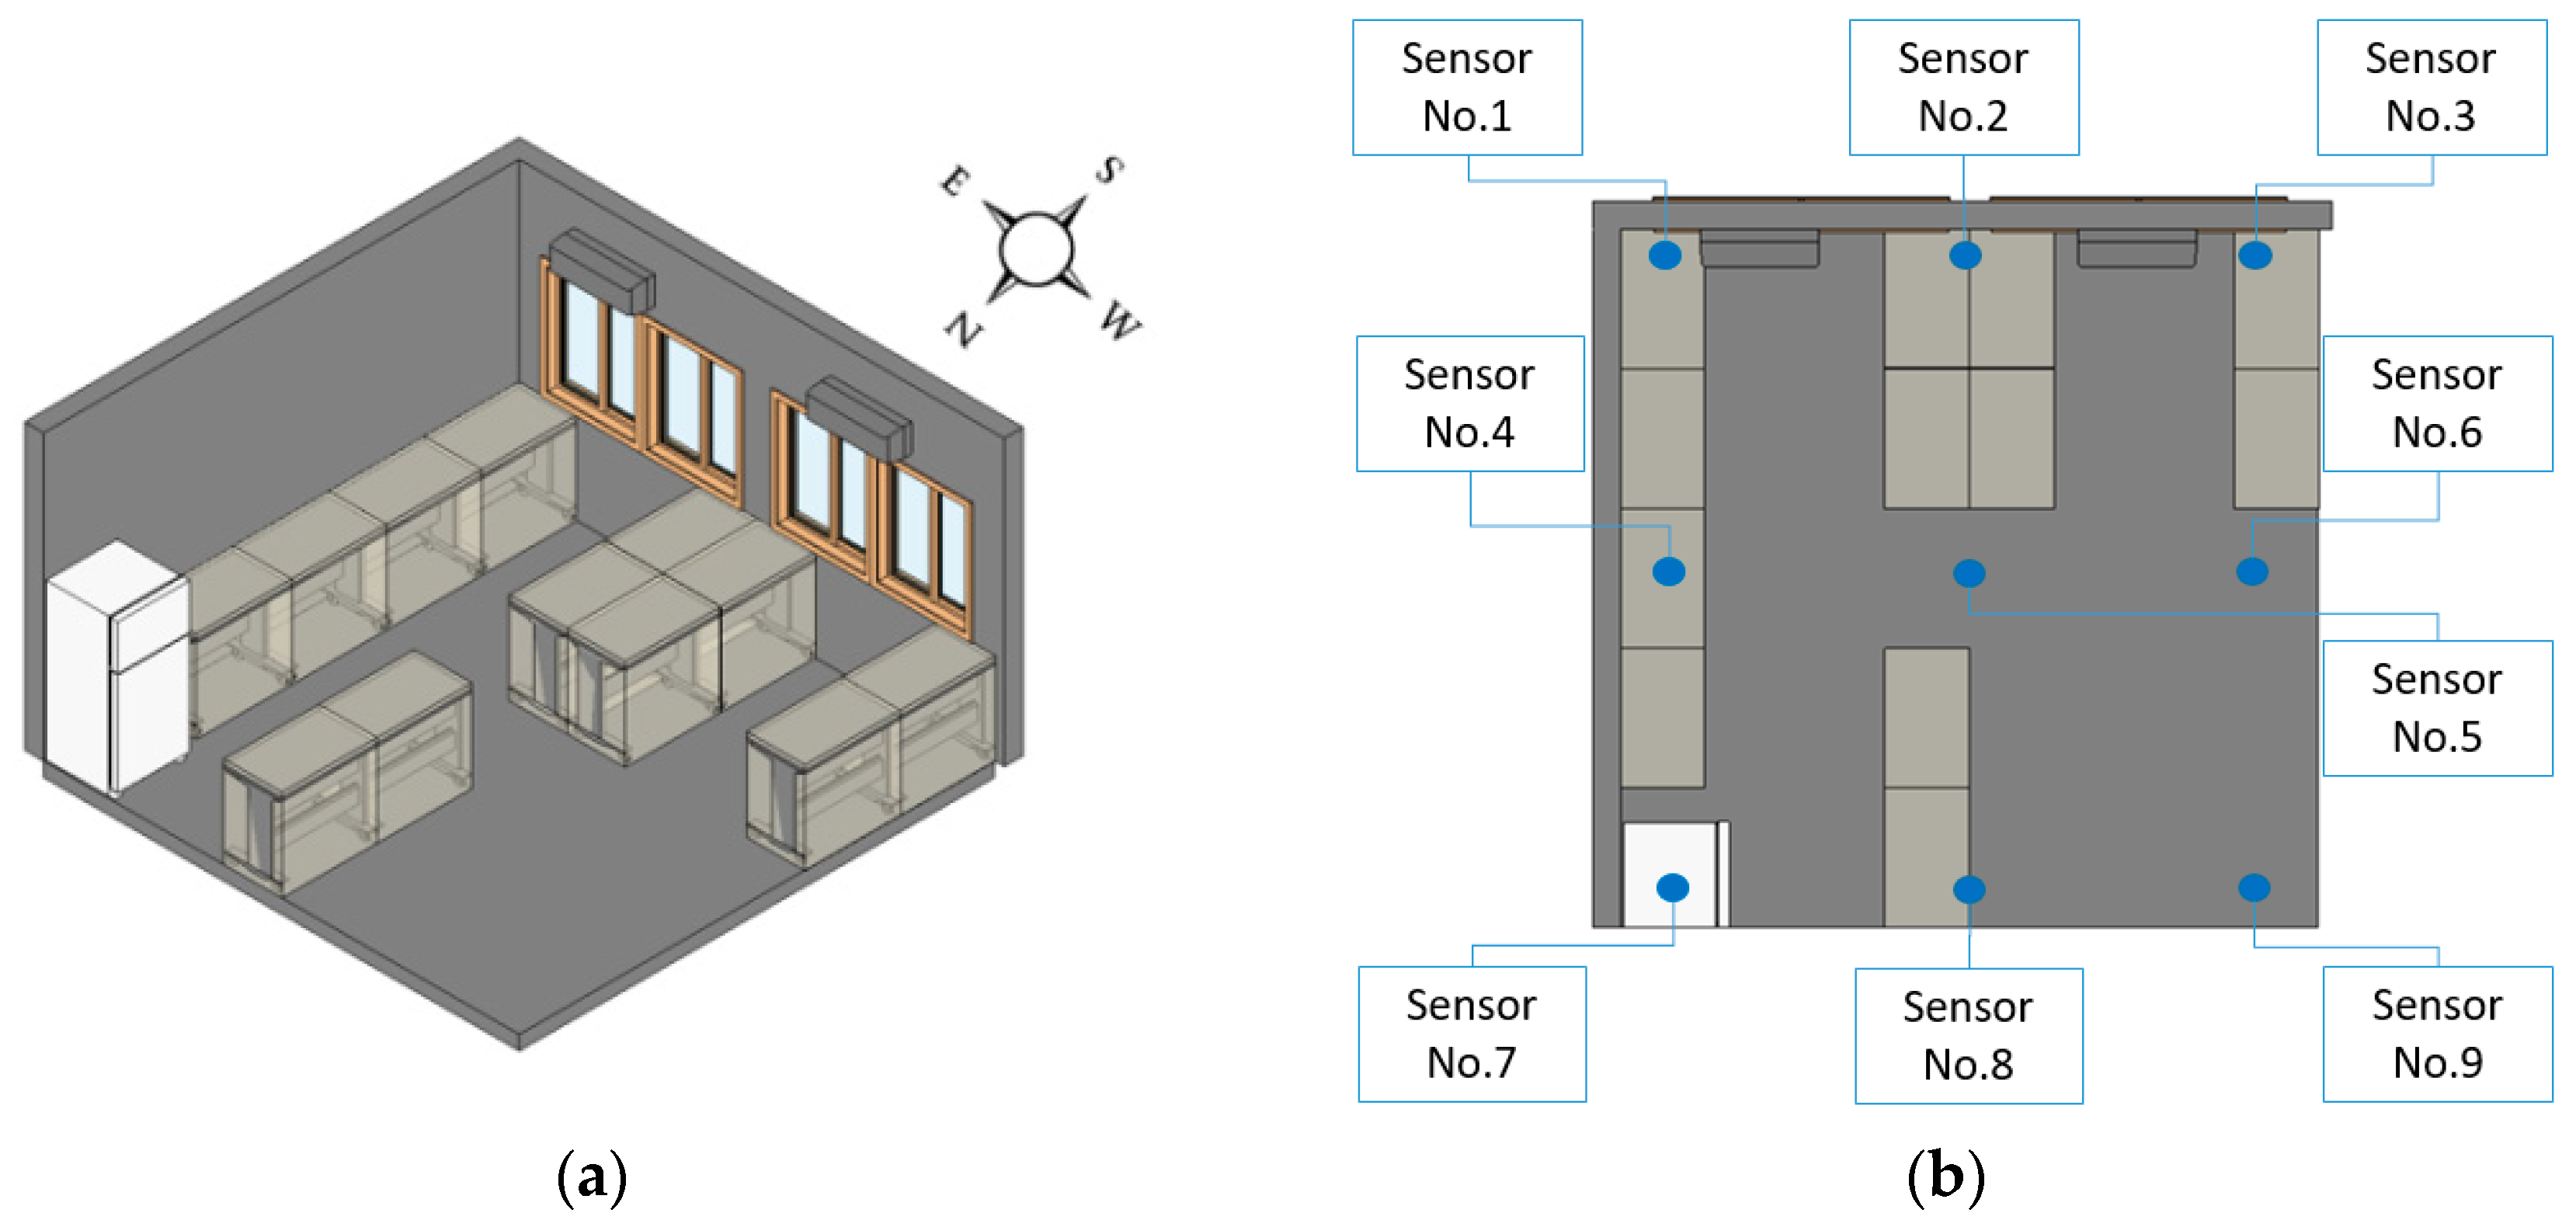
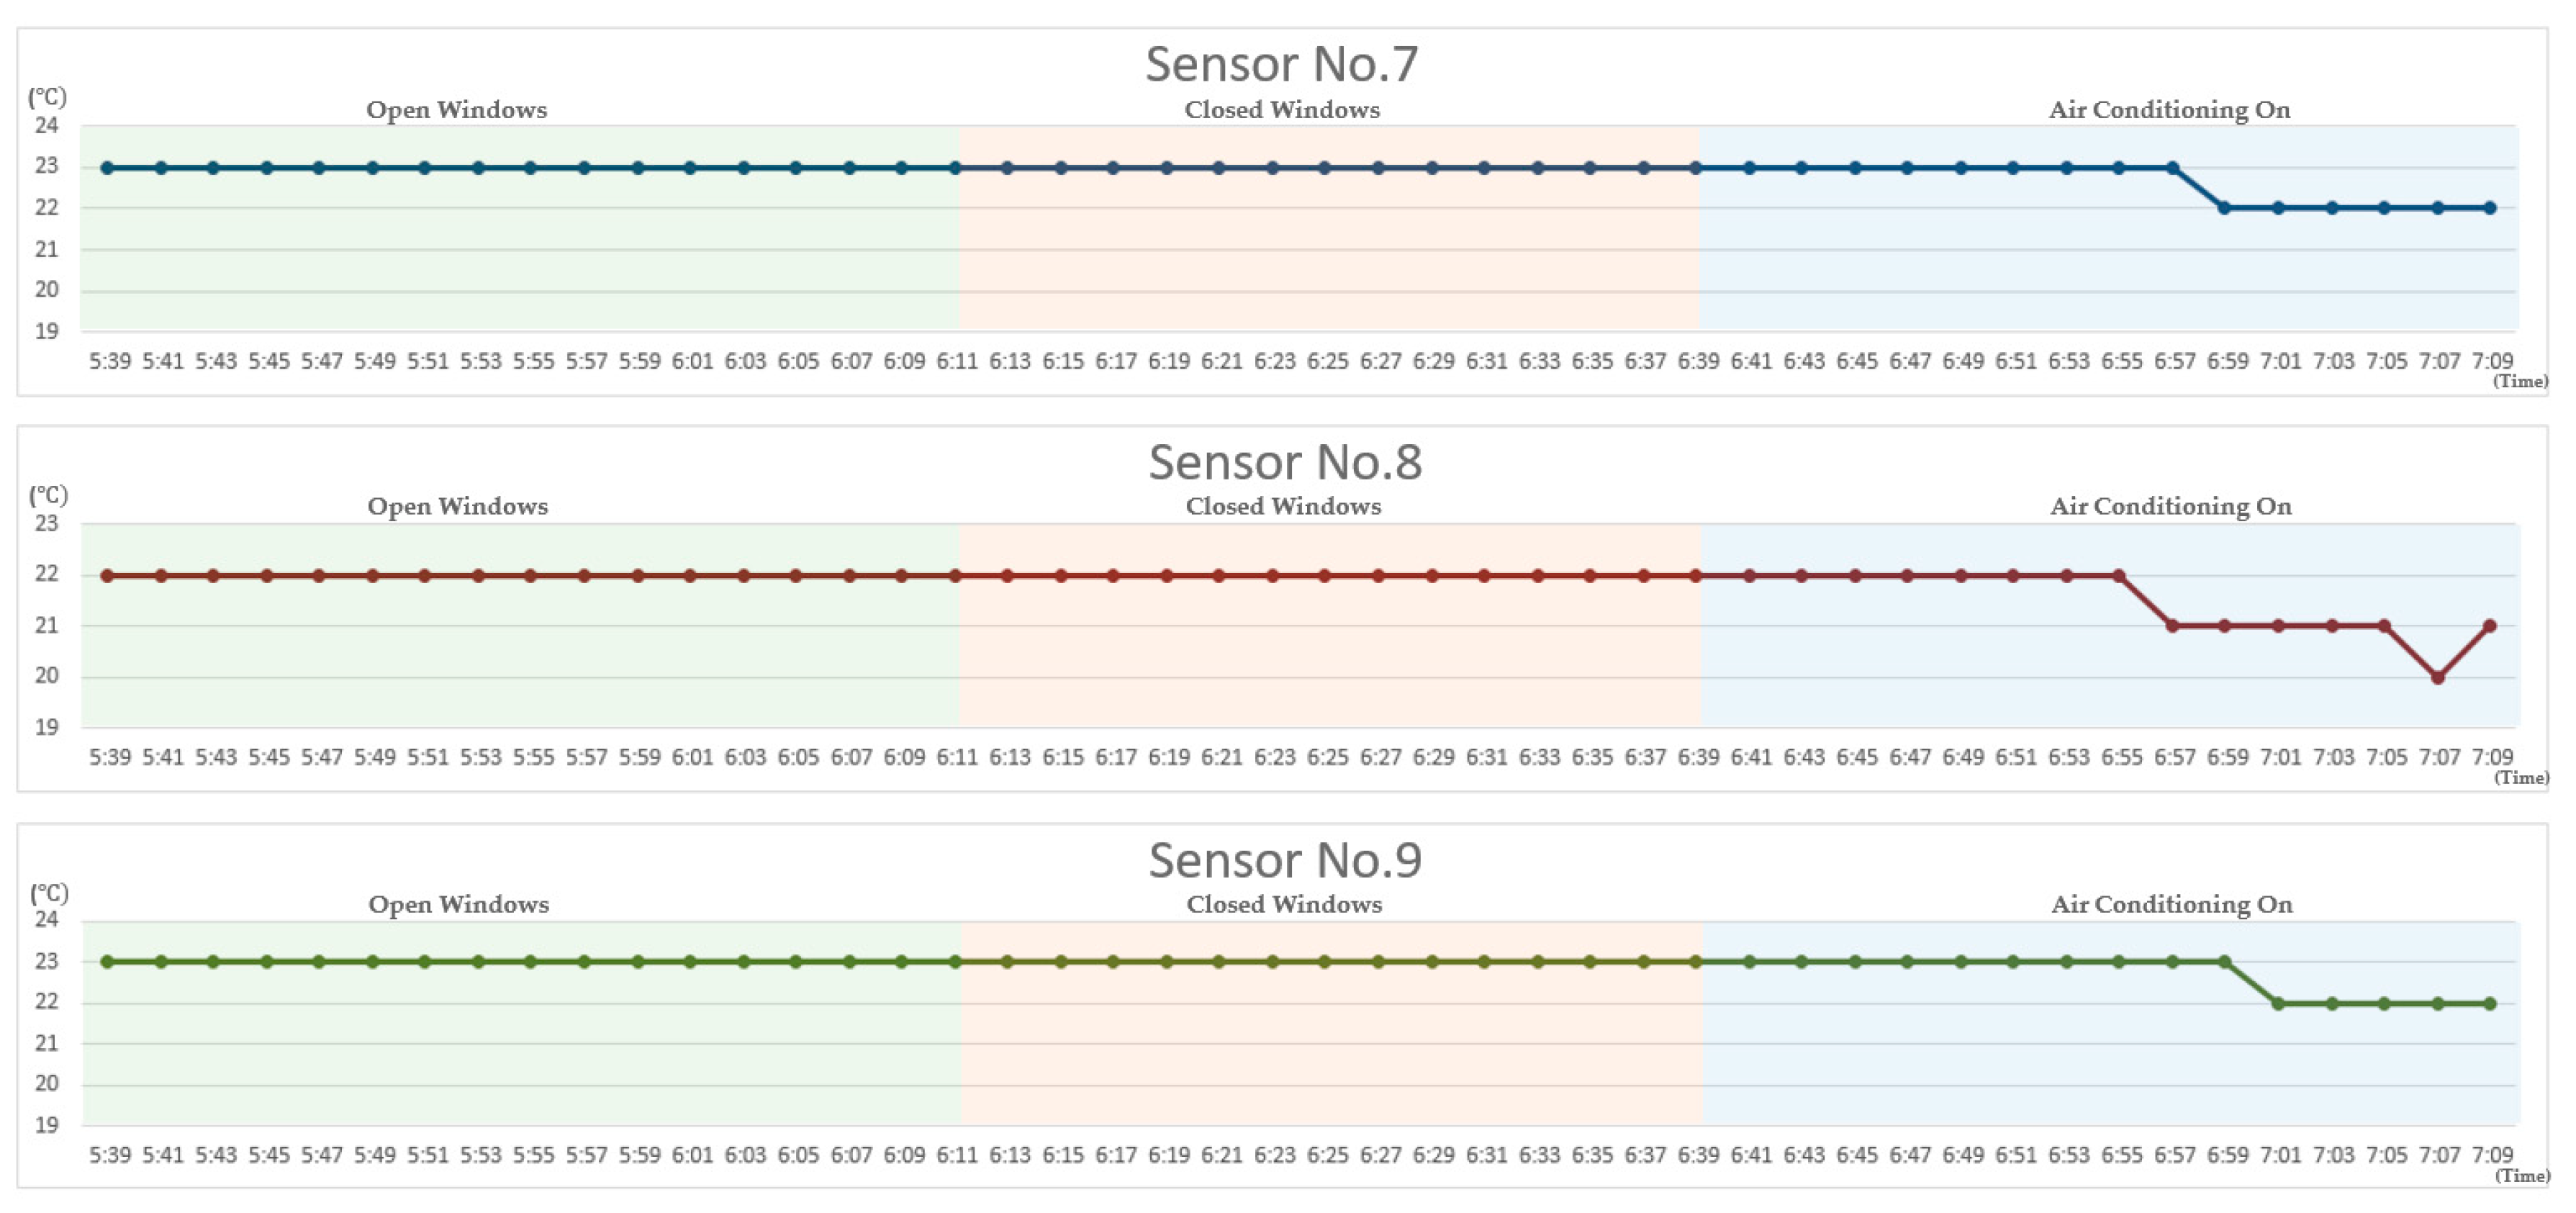
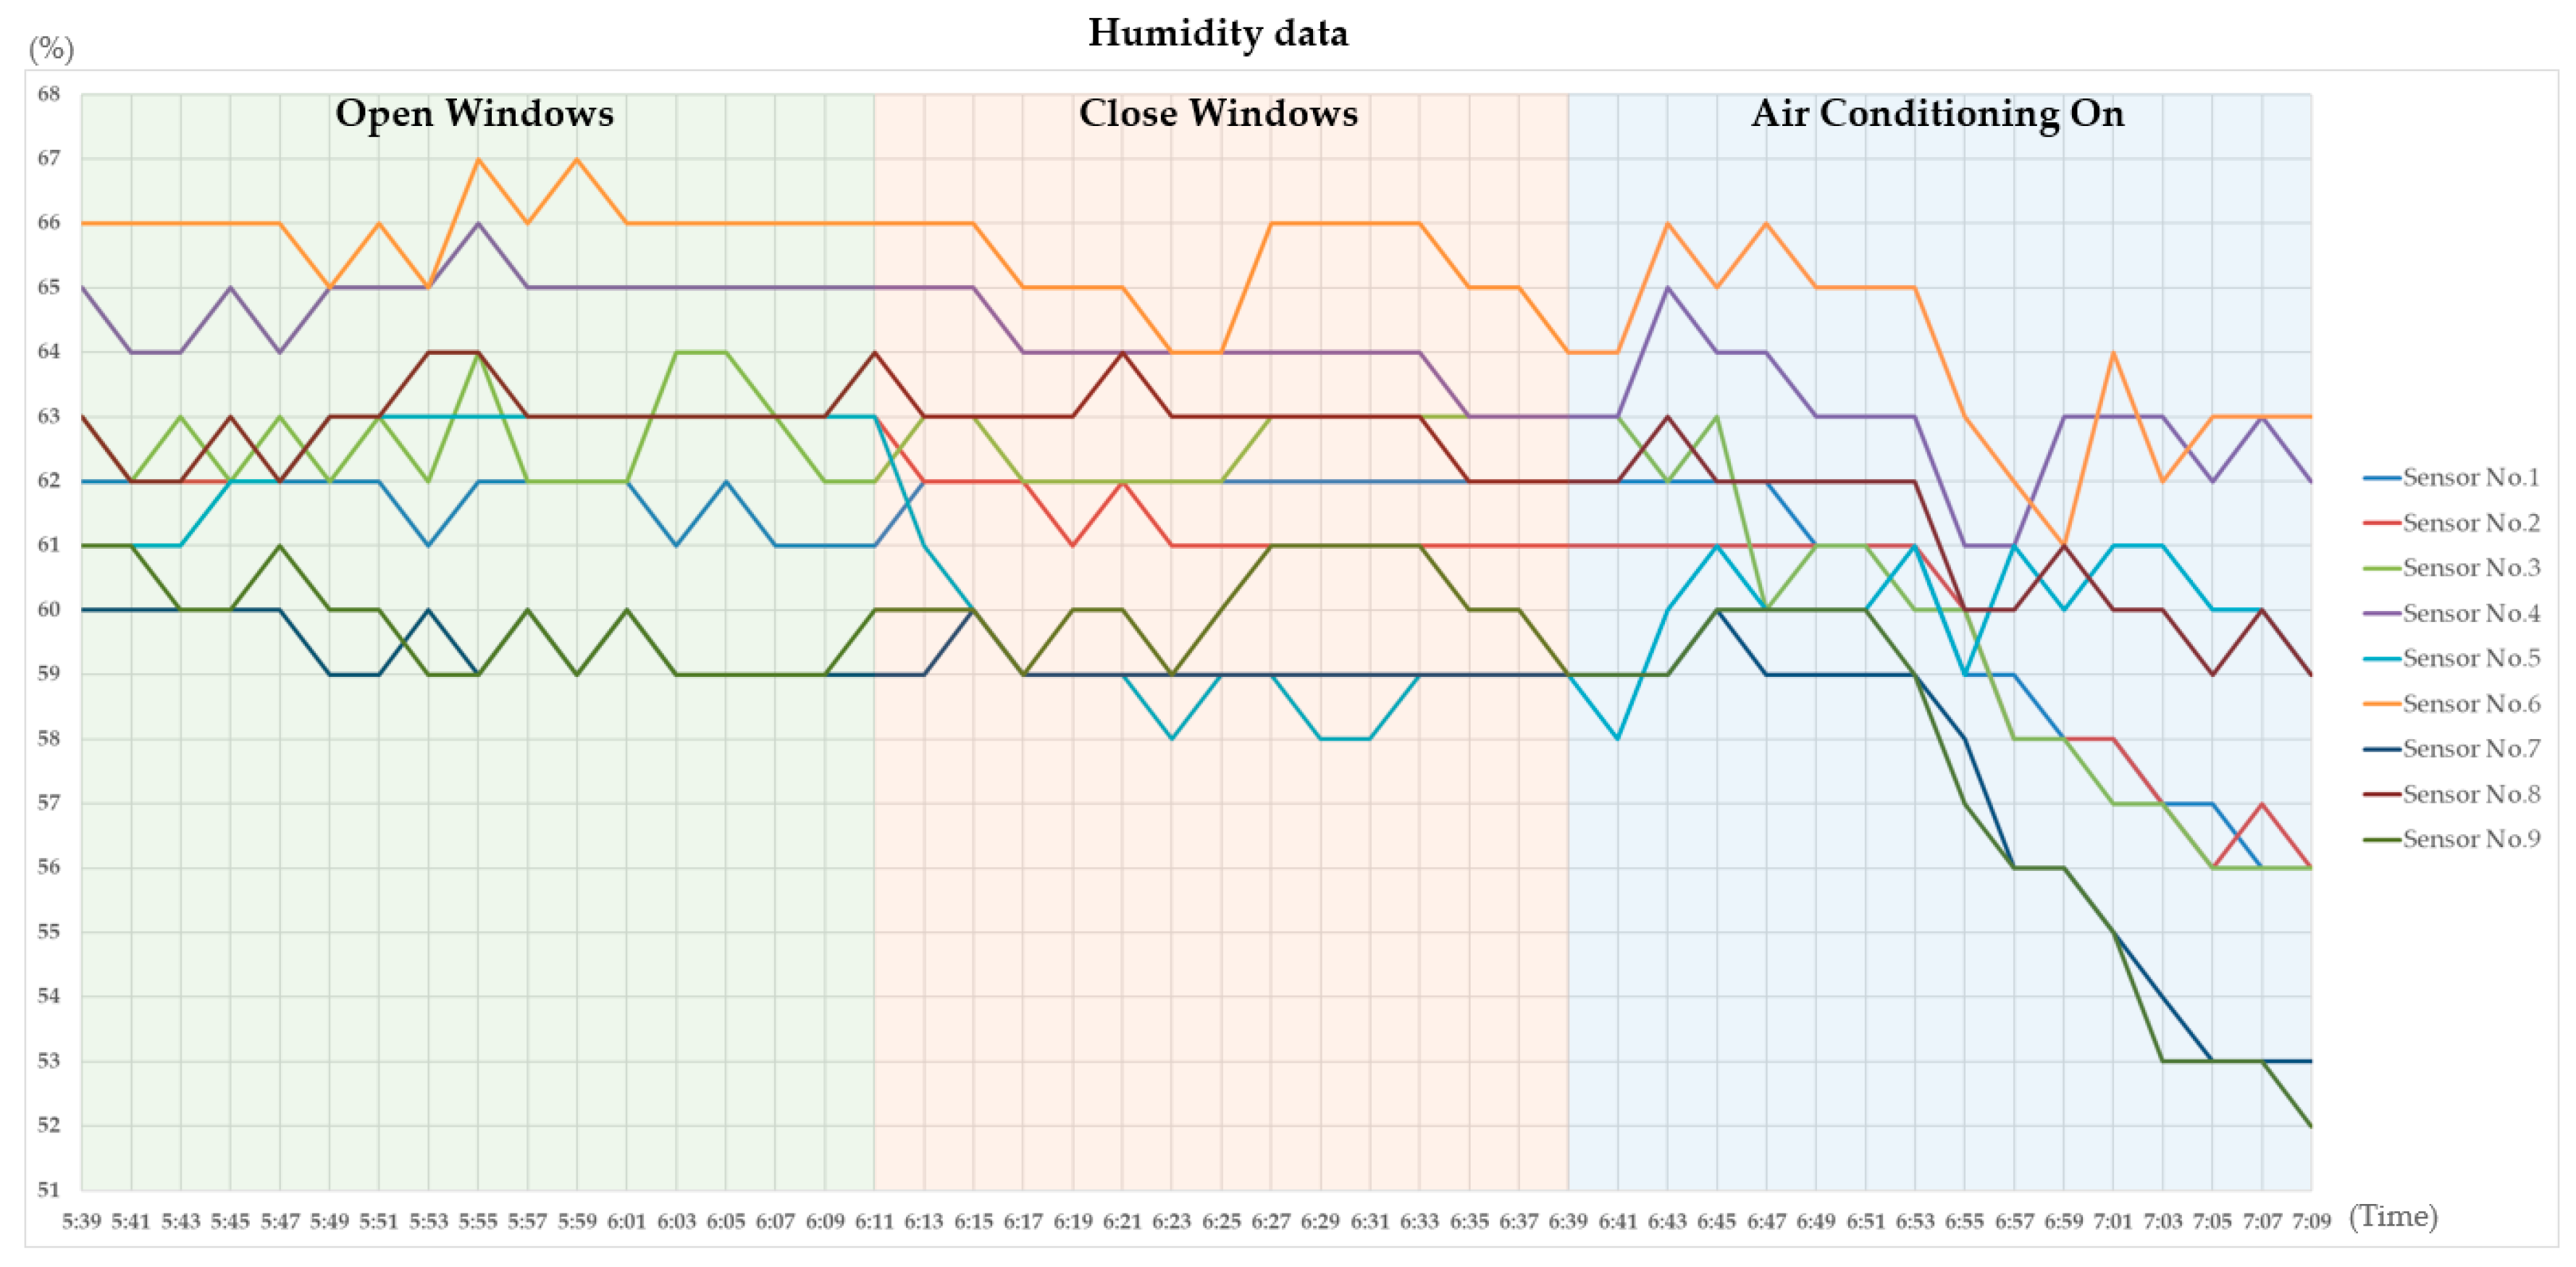
This section uses an actual case to demonstrate the use of the proposed IoT visualization platform, which includes multiple temperature and humidity sensors and an Arduino microcontroller, and shows how a facility manager may adjust the layout of a space based on the visualized PMV comfort values. The case involved a laboratory located in the Engineering II Building on the campus of National Chiao Tung University, Hsinchu, Taiwan. Figure 14 shows the laboratory’s spatial layout and the location of the sensors. Figure 15 and Figure 16 show sample temperature and humidity data for each two-minute interval during the two-hour period from 5:39 p.m. to 7:09 p.m. on 30 December 2017. Note that the windows were opened from 5:39 p.m. to 6:09 p.m., and closed from 6:11 p.m. to 6:39 p.m. The air conditioner was turned on with the windows closed from 6:41 p.m. to 7:09 p.m.
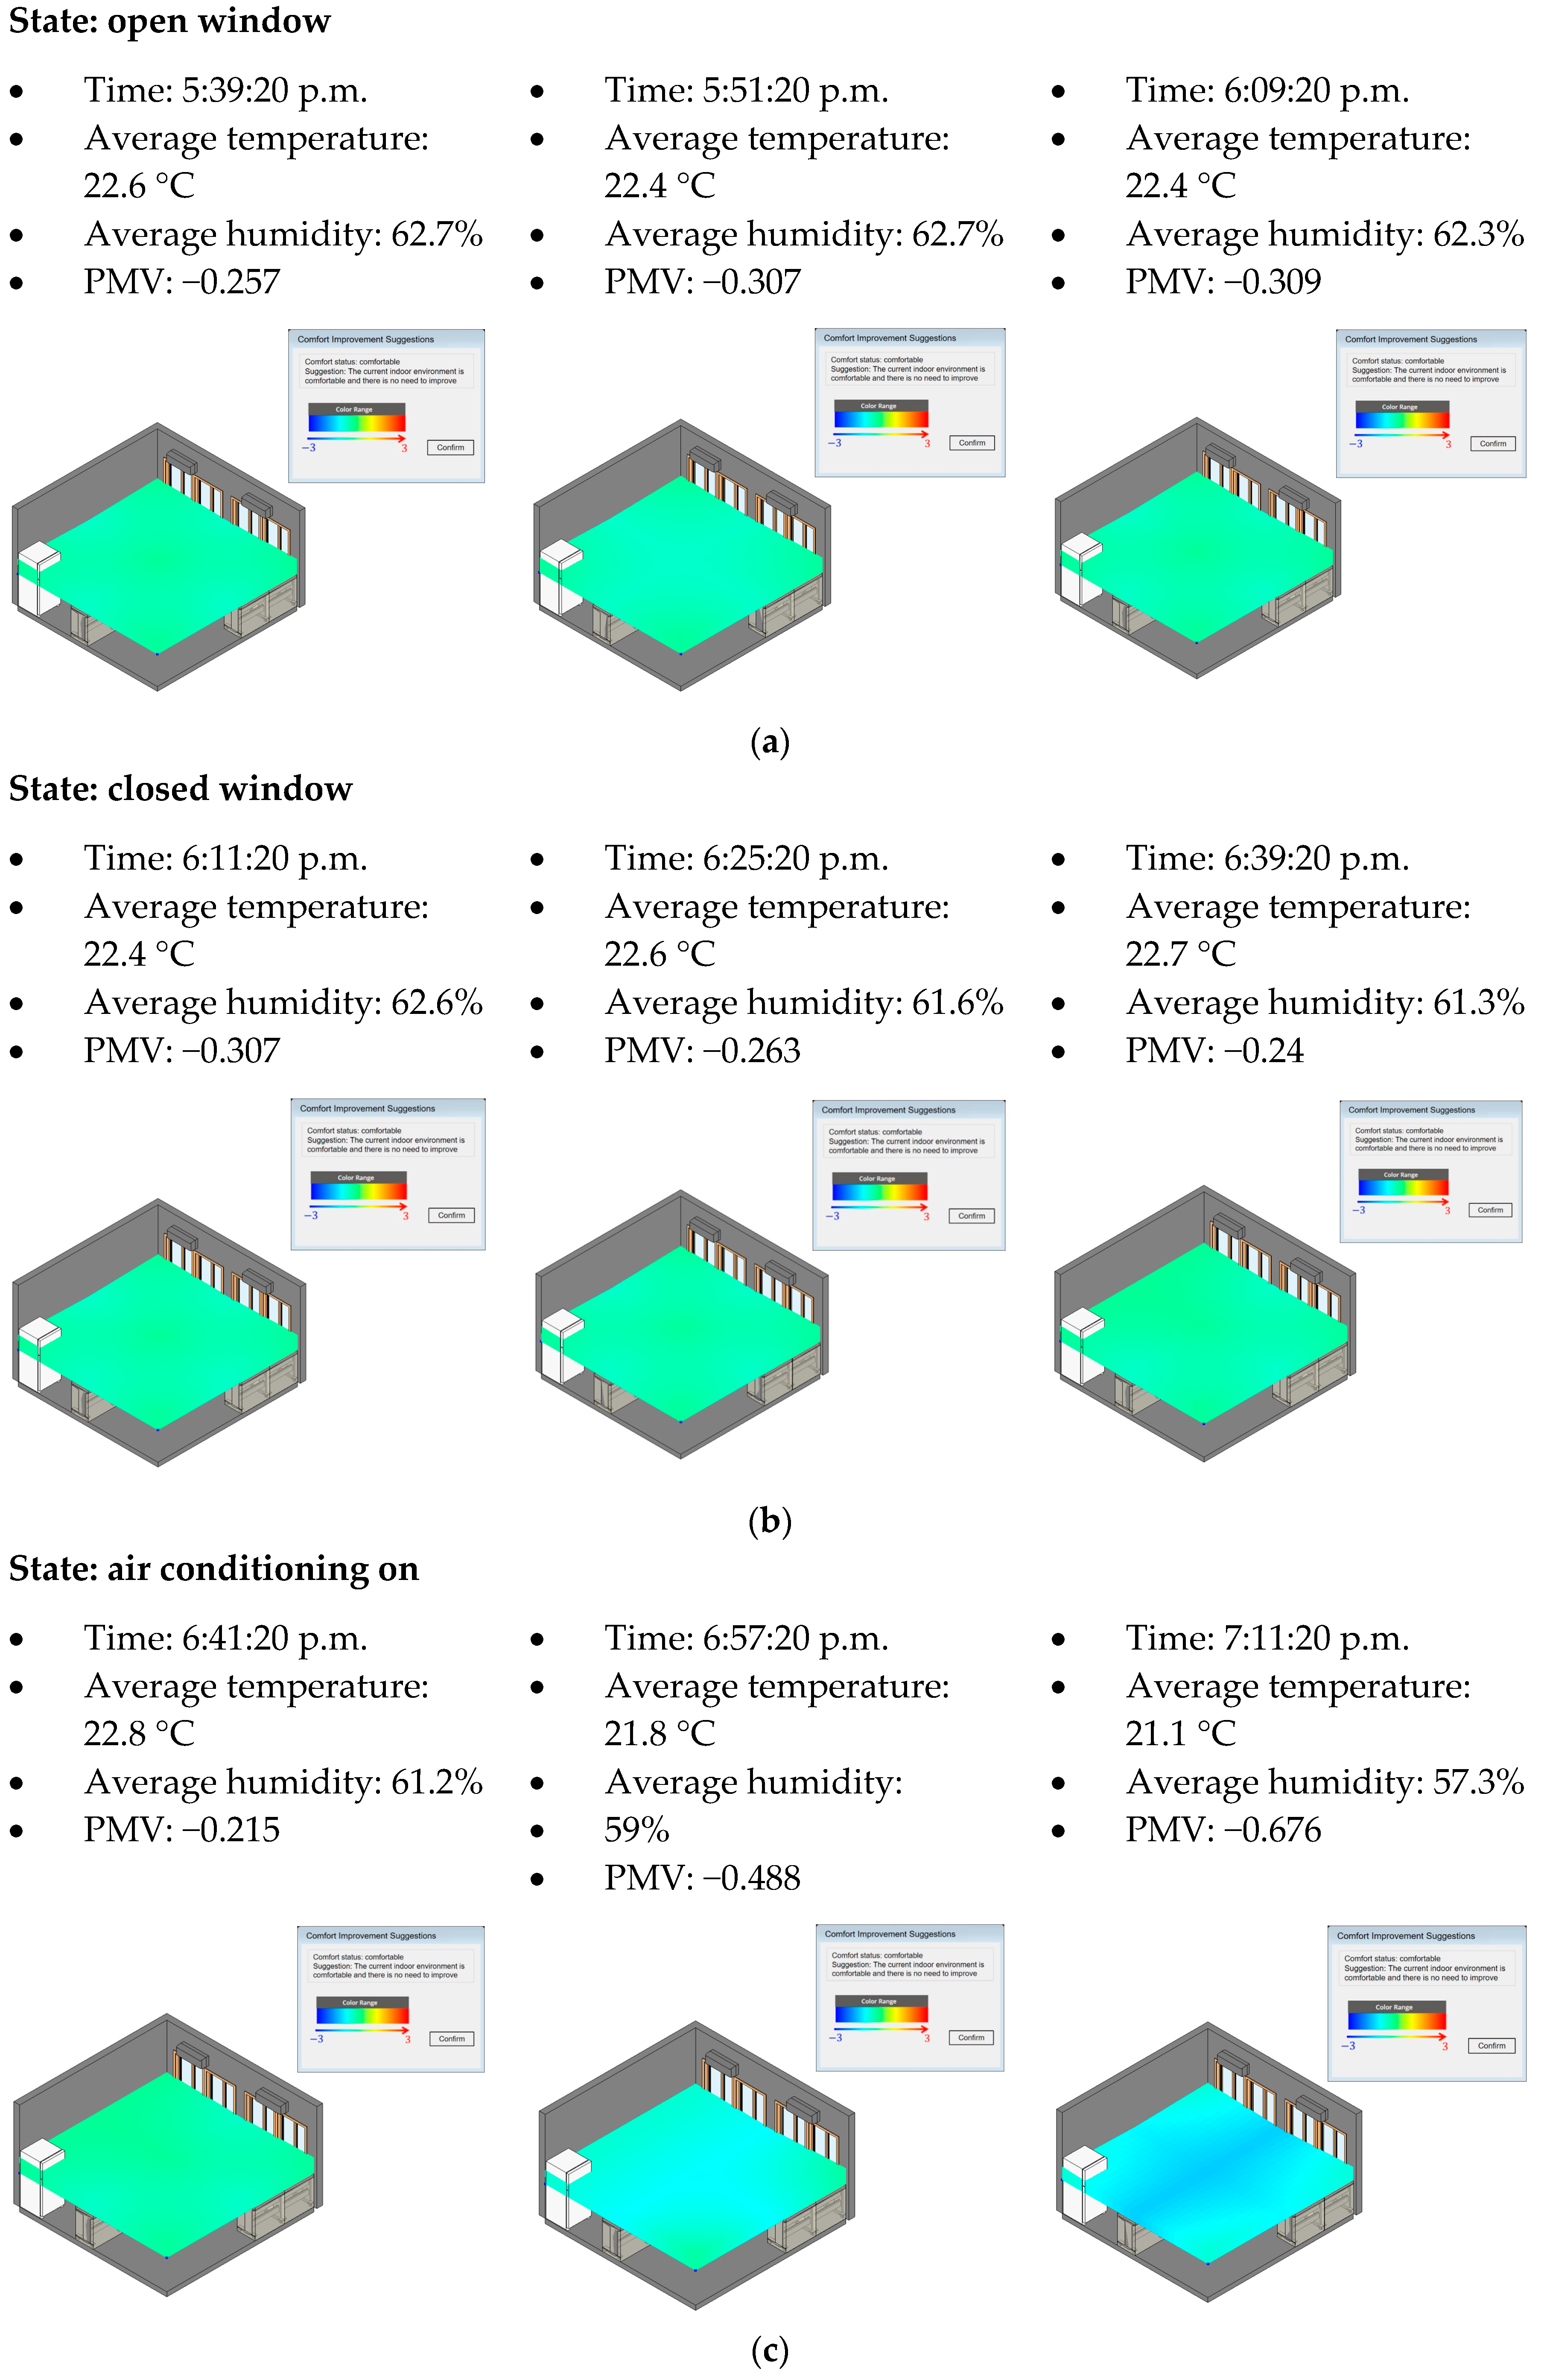
Figure 17 show snapshots of the visualized comfort level during different conditions, such as when the windows are open, when the windows are closed, and when the air conditioning is on, with the corresponding comfort level and improvement suggestions made by the platform developed in this study shown by the side. The PMV value did not change significantly during the entire duration of the experiment, except when the air conditioning was turned on, which resulted in a lower PMV value (−0.676) because the room became slightly colder. Nevertheless, small changes occurred in the PMV value when the room went from the open-window (−0.309) to the closed-window state (−0.24). The greatest difference in PMV value occurred during the shift between the air-conditioned and closed-window states; both temperature and humidity apparently decreased, as shown in Figure 16, and the PMV value also decreased, as can be seen from the change in visualized color in Figure 17.
The experiment was conducted during the winter in Taiwan, and the results showed that differences in temperature and humidity were not apparent during a short period of time in this semitropical area. When the air conditioner was turned on, both the temperature and humidity appeared to decrease, but according to the PMV value, the room remained comfortable during all three states. In some cases, such as in a large space with limited number of air conditioners, the visualized comfort level may show an uneven distribution; in these cases the facility manager may choose to change spatial usage by assigning the most comfortable area for use by activities and the less comfortable area for use for storage, which will maximize comfort for most occupants.
Regardless of the sensors’ locations, whether the windows were opened or not did not affect the temperature and humidity data collected by the sensors. Although it can be seen from Figure 14, Figure 15 and Figure 16 that sensors 1, 2 and 3 were the three sensors closest to the windows, these sensors had almost the same temperature and humidity readings after the windows were closed.
It can be seen from Figure 16 that the deviation in humidity in the air-conditioned state was much greater than in either the open-window or closed-window states. This is because the air conditioners mechanically blew cool air with greater force than the natural breeze, and thus created greater deviations in humidity distribution. As all the humidity values dropped as the room shifted from the open-window state to the air-conditioned state, the humidity readings of sensors 7 and 9 dropped even more. This can be explained by the location of sensors 7 and 9 against the wall, at the end of the air conditioners’ air trail. Because the authors had expected that sensors 1 and 3 should have the largest drop due to being closest to the air conditioners, this finding was somewhat surprising. Determining the actual reasons for results of this type will require experiments that are more precise and involve more sensors. However, one possible explanation is that sensors 1 and 3, instead of being located directly on the dry air trail of the air conditioners, are actually located on the side of air conditioners’ air trail, which decreased the effect of the humidity drop. On the other hand, although sensors 7 and 9 were furthest from the air conditioners, the drying effect may be enhanced at that location due to the accumulation of dry air against the wall.
4. Discussion
4.1. Comparison with Conventional Sensor Data Representation
In order to compare the representation of sensor data on the proposed platform with that on a conventional platform, Table 3 compares the proposed platform with the sensor display system [28] of a special exhibition at the National Palace Museum, which is the largest museum in Taiwan in terms of size and number of articles in its collection. The exhibition space was equipped with 13 sensors, of which nine were installed inside individual glass display boxes. The system display shows that while the conventional display focuses on individual instantaneous data or a time series of data from individual sensors, the proposed platform displays integrated values in a colorful three-dimensional fashion as a layer in a three-dimensional space. This provides the facility manager with a better means of visualizing and identifying potential facility management problems. The context view index shows that the conventional system can only provide data from individual sensors, while the proposed platform can not only display a color visualization of data from each individual sensor, but also the visualization of the PMV context view, which consists of the integrated data values from related sensors. The predefined formula for the desired context view can also be easily adapted to different contexts (such as WELL health indexes).
4.2. Reusability of the Proposed System
The case presented in this study demonstrates the use of the proposed system to integrate sensors and visualize the sensor data from the context of the comfort of a particular space. This section discusses how the system can be adapted to (1) monitor a different space employing the same context view, and (2) monitor a different space with a different context view.
In general, to adapt the proposed system to a different desired context, one only needs to provide the BIM model and a new set of sensors suitable for the desired context view; to change the calculation formula specified in the custom nodes in Dynamo, one needs to change the formula predefined in the context viewer computation block, which is written in the Python language. A basic understanding of Python is thus a requirement for adaptation. When applying the system to a different space with the same context view (such as comfort PMV index), the sensors and microcontroller can be physically moved to the new target space, and a BIM model provided for that space. When applying the system to a different space with a different context view, such as when concerned about the air quality in an auditorium, the air quality index in the WELL Building Standard [29] can be used as the context view; in this case, a different set of sensors, such as PM2.5, PM10, and carbon monoxide sensors, can be deployed in the auditorium, and the formula in the context viewer computation block of the data visualization process can be changed in accordance with the new air quality index (such as by using the weighted average of sensor values or the number of satisfactory and nonsatisfactory sensors). Of course, in this example, a BIM model of the auditorium would need to be constructed if not already available.
5. Conclusions
This study proposed a platform for transforming sensor data to context-based visualized data (comfort level in this case) and presenting the resulting color visualization via a BIM model. Such visualization allows a facility manager to see the distribution of values from the perspective of the desired context, and thus make appropriate adjustments.
In the future, our research project will continue to experiment with different types of spaces with different settings and use scenarios. The project also plans to interview the school facility manager to obtain feedback suggestions. In addition, we will also expand the platform’s sensing capabilities to such other contexts as energy saving and lighting comfort. In the future, the platform will allow facility managers to see different color visualization schemes by switching between different contexts.
The contribution of this study is the proposal of the concept of integrating sensor information and an architectural model, while adding visual layers expressing different perspectives on top of a BIM model to support facility management decisions, and demonstrating the feasibility of the concept using existing software tools.
Author Contributions
R.-J.D. developed the conceptual model. K.-M.C. provided extensive technical support in the form of a survey of the literature and theoretical analysis. Y.-J.W. implemented the model and performed the experiment. K.-M.C. and R.-J.D. wrote the paper.
Funding
This research received the funding from the Ministry of Science and Technology.
Acknowledgments
This study was funded by the Ministry of Science and Technology, Taiwan under contract number MOST 106-2622-8-009-017, for which the authors are deeply grateful.
Conflicts of Interest
The authors declare no conflicts of interest.
References
- McCormick, B.H. Visualization in scientific computing. ACM SIGBIO Newslett. 1988, 10, 15–21. [Google Scholar] [CrossRef]
- Schroeder, W.J.; Lorensen, B.; Martin, K. The Visualization Toolkit: An Object-Oriented Approach to 3D Graphics; Kitware: New York, NY, USA, 2004. [Google Scholar]
- Munzner, T. Process and pitfalls in writing information visualization research papers. In Information Visualization; Springer: Berlin/Heidelberg, Germany, 2008; pp. 134–153. [Google Scholar]
- Gubbi, J.; Buyya, R.; Marusic, S.; Palaniswami, M. Internet of Things (IoT): A vision, architectural elements, and future directions. Future Gener. Comput. Syst. 2013, 29, 1645–1660. [Google Scholar] [CrossRef] [Green Version]
- Eastman, C.M. Building Product Models: Computer Environments, Supporting Design and Construction; CRC Press: Boca Raton, FL, USA, 1999. [Google Scholar]
- Azhar, S.; Hein, M.; Sketo, B. Building information modeling: Benefits, risks and challenges. In Proceedings of the 44th Associated Schools of Construction National Conference, Auburn, AL, USA, 2–5 April 2008. [Google Scholar]
- Azhar, S. Building information modeling (BIM): Trends, benefits, risks, and challenges for the AEC industry. Leadersh. Manag. Eng. 2011, 11, 241–252. [Google Scholar] [CrossRef]
- Eastman, C.M.; Eastman, C.; Teicholz, P.; Sacks, R. BIM Handbook: A Guide to Building Information Modeling for Owners, Managers, Designers, Engineers and Contractors; John Wiley & Sons: Hoboken, NJ, USA, 2011. [Google Scholar]
- Azhar, S.; Khalfan, M.; Maqsood, T. Building information modeling (BIM): Now and beyond. Constr. Econ. Build. 2015, 12, 15–28. [Google Scholar]
- IFC2x4, Industry Foundation Classes Release 4 (IFC4). Available online: http://www.buildingsmart-tech.org/specifications/ifc-releases/ifc2x4-release/summary (accessed on 11 March 2013).
- IAI. _2007_. IFC/ifcXML specifications. Available online: http://www.iai-international.org (accessed on 30 October 2009).
- Venugopal, M.; Eastman, C.M.; Sacks, R.; Teizer, J. Semantics of model views for information exchanges using the industry foundation class schema. Adv. Eng. Informat. 2012, 26, 411–428. [Google Scholar] [CrossRef]
- Golabchi, A.; Akula, M.; Kamat, V. Automated building information modeling for fault detection and diagnostics in commercial HVAC systems. Facilities 2016, 34, 233–246. [Google Scholar] [CrossRef]
- Che, L.; Gao, Z.; Chen, D.; Nguyen, T.H. Using building information modeling for measuring the efficiency of building energy performance. In Proceedings of the International Conference on Computing in Civil and Building Engineering (ICCCBE), Nottingham, UK, 30 June–2 July 2010; pp. 165–170. [Google Scholar]
- Chwieduk, D.A. Recommendation on modeling of solar energy incident on a building envelope. Renew. Energy 2009, 34, 736–741. [Google Scholar] [CrossRef]
- Kensek, K.M. Integration of Environmental Sensors with BIM: Case studies using Arduino, Dynamo, and the Revit API. Informes Constr. 2014, 66, 536. [Google Scholar] [CrossRef]
- Emad, A.-Q.; Wei, Y.; Philip, G. Establishing parametric relationships for design objects through tangible interaction. In Proceedings of the 22nd International Conference of the Association for Computer-Aided Architectural Design Research in Asia(CAADRIA), Protocols, Flows and Glitches, Suzhou, China, 5–8 April 2017; Janssen, P., Loh, P., Raonic, A., Schnabel, M.A., Eds.; The Association for Computer-Aided Architectural Design Research in Asia (CAADRIA): Hong Kong, China, 2017; pp. 147–157. [Google Scholar]
- Asl, M.R.; Zarrinmehr, S.; Bergin, M.; Yan, W. BPOpt: A framework for BIM-based performance optimization. Energy Build. 2015, 108, 401–412. [Google Scholar] [Green Version]
- Delgado, J.M.D.; Butler, L.J.; Brilakis, I.; Elshafie, M.; Middleton, C. Structural performance monitoring using a dynamic data-driven BIM environment. J. Comput. Civil Eng. 2018, 32, 04018009. [Google Scholar] [CrossRef]
- Lather, J.I.; Amor, R.; Messner, J.I. A Case Study in Data Visualization for Linked Building Information Model and Building Management System Data. In Proceedings of the ASCE International Workshop on Computing in Civil Engineering 2017, Seattle, WA, USA, 25–27 June 2017. [Google Scholar]
- Mccaffrey, R.; Coakley, D.; Keane, M.; Melvin, H. Development of a Web-based BMS Data Visualization Platform Using Building Information Models. In Proceedings of the CIBSE 2015 Technical Symposium, London, UK, 16–17 April 2015. [Google Scholar]
- Dynamo BIM. Available online: http://dynamobim.org/ (accessed on 20 December 2012).
- Huang, S.-C. A BIM Workflow for Responsive Energy-Efficient Façade. Master’s Thesis, National Cheng Kung University, Tainan, Taiwan, 2016. [Google Scholar]
- ARDUINO MEGA 2560 REV3. Available online: https://store.arduino.cc/usa/arduino-mega-2560-rev3 (accessed on 11 October 2017).
- ISO-7730. Ergonomics of the Thermal Environment—Analytical Determination and Interpretation of Thermal Comfort Using Calculation of the PMV and PPD Indices and Local Thermal Comfort Criteria, 3rd ed.; ISO: Geneva, Switzerland, 2005. [Google Scholar]
- Fanger, P.O. Thermal Comfort: Analysis and Applications in Environmental Engineering; McGraw-Hill Book Company: New York, NY, USA, 1972; p. 244. ISBN 8757103410. [Google Scholar]
- Lin, Y.-P. The Design and Implement of the Automatic Energy Saving System Based on Environmental Comfort. Master’s Thesis, National Chin-Yi University of Technology, Taichung City, Taiwan, 2016. [Google Scholar]
- Cheng, C.-M.; Ma, H.-X.; Hsu, Y.-L. The pilot test of the environmental monitoring system of the Palace Museum in the framed studio. In Gerontechnology Research in Yuan Ze University; Yuan Ze University: Taoyuan, Taiwan, 2005. [Google Scholar]
- International Well Building Institute (IWBI). WELL Building Standard. Available online: http://standard.wellcertified.com/air/air-quality-standards (accessed on 6 May 2016).
Figure 1.
Visualization framework.

Figure 2.
Data visualization process (Dynamo build method and structure).

Figure 3.
Layout of experimental research environment.

Figure 4.
(a) Diagram of environmental data body-feeling range; (b) diagram of cutting plane grid.

Figure 5.
Distribution of sensor locations.

Figure 6.
(a) Arduino Mega 2560 R3; (b) Arduino connection to DHT-11 temperature and humidity sensor.
Figure 6.
(a) Arduino Mega 2560 R3; (b) Arduino connection to DHT-11 temperature and humidity sensor.

Figure 7.
Arduino and Dynamo linking process.

Figure 8.
Calculation of grid data by interpolation.

Figure 9.
Grid data and RGB conversion.

Figure 10.
Adaptive components and addition of a plane in the Revit process diagram.

Figure 11.
PMV analysis and improvement suggestions.

Figure 12.
Creating a PMV formula module in Dynamo.

Figure 13.
PMV analysis results in the BIM model.

Figure 14.
(a) Spatial layout of the research laboratory; (b) sensor locations.

Figure 15.
Temperature data for sensors 1–9.


Figure 16.
Humidity data for sensors 1–9.

Figure 17.
(a) PMV visualization results for the open-window state; (b) closed-window state; and (c) air conditioning-on state.
Figure 17.
(a) PMV visualization results for the open-window state; (b) closed-window state; and (c) air conditioning-on state.


Table 1.
Comparison with differences in past research results.
| Author | K.M. Kensek (2014) [16] | Emad Al-Qattan et al. (2017) [17] | M. Rahmani Asl et al. (2015) [18]. | Chang, K.M. et al. (2018) |
|---|---|---|---|---|
| Building Life-Cycle Stage | Design stage | Design stage | Design stage | Operation and maintenance stage |
| Sensors | Light, humidity, CO2 | Ribbon sensor | Daylight | Humidity, temperature |
| Research Tool | Arduino, Revit, Dynamo, Rhino, Grasshopper | Arduino, Revit, Dynamo, Rhino, Grasshopper | Revit, Dynamo | Arduino, Revit, Dynamo, |
| Automated Integration | Yes | Yes | Exported as a CSV file | Yes |
| Automated Visualization | Yes | No | Yes | Yes |
| Multiple Contexts | A link from the Revit model to a physical model | Generative modeling | Energy performance factor, daylighting performance factor | PMV (Predicted Mean Vote) comfort index |
Table 2.
PMV index and comfort table.
| PMV Index | −3 | −2 | −1 | 0 | 1 | 2 | 3 |
|---|---|---|---|---|---|---|---|
| Comfort feeling | Cold | Cool | Slightly cool | Neutral | Slightly warm | Warm | Hot |
Table 3.
Comparison of the results of past case studies and this research project.
| System Name | National Palace Museum Collection Environmental Monitoring System [28] | Automated IoT Visualization BIM Platform |
|---|---|---|
| System display |  |  |
| Context view index | Temperature, humidity | Temperature, humidity, PMV, other (customized) |
© 2018 by the authors. Licensee MDPI, Basel, Switzerland. This article is an open access article distributed under the terms and conditions of the Creative Commons Attribution (CC BY) license (http://creativecommons.org/licenses/by/4.0/).
Share and Cite
MDPI and ACS Style
Chang, K.-M.; Dzeng, R.-J.; Wu, Y.-J. An Automated IoT Visualization BIM Platform for Decision Support in Facilities Management. Appl. Sci. 2018, 8, 1086. https://doi.org/10.3390/app8071086
AMA Style
Chang K-M, Dzeng R-J, Wu Y-J. An Automated IoT Visualization BIM Platform for Decision Support in Facilities Management. Applied Sciences. 2018; 8(7):1086. https://doi.org/10.3390/app8071086
Chicago/Turabian StyleChang, Kai-Ming, Ren-Jye Dzeng, and Yi-Ju Wu. 2018. "An Automated IoT Visualization BIM Platform for Decision Support in Facilities Management" Applied Sciences 8, no. 7: 1086. https://doi.org/10.3390/app8071086
Note that from the first issue of 2016, this journal uses article numbers instead of page numbers. See further details here.