Ranking Authors in an Academic Network Using Social Network Measures
by
 , and
, and
Fizza Bibi
1, 
Hikmat Ullah Khan
1,*,
Tassawar Iqbal
1,
Muhammad Farooq
1,
Irfan Mehmood
2,* and
Yunyoung Nam
3,* 1
Department of Computer Science, COMSATS University Islamabad, Wah Campus, Wah Cant 47040, Pakistan
2
Department of Software, Sejong University, Seoul 143-747, Korea
3
Department of Computer Science and Engineering, Soonchunhyang University, Asan 31538, Korea
*
Authors to whom correspondence should be addressed.
Appl. Sci. 2018, 8(10), 1824; https://doi.org/10.3390/app8101824
Submission received: 23 July 2018
/
Revised: 17 September 2018
/
Accepted: 18 September 2018
/
Published: 4 October 2018
Abstract
:Online social networks are widely used platforms that enable people to connect with each other. These social media channels provide an active communication platform for people, and they have opened new venues of research for the academic world and business. One of these research areas is measuring the influential users in online social networks; and the same is true for academic networks where finding influential authors is an area of interest. In an academic network, citation count, h-index and their variations are used to find top authors. In this article, we propose the adoption of established social network measures, including centrality and prestige, in an academic network to compute the rank of authors. For the empirical analysis, the widely-used dataset of the Digital Bibliography and Library Project (DBLP) is exploited in this research, and the micro-level properties of the network formed in the DBLP co-authorship network are studied. Afterwards, the results are computed using social network measures and evaluated using the standard ranking performance evaluation measures, including Kendall correlation, Overlapping Similarlity (OSim) and Spearman rank-order correlation. The results reveal that the centrality measures are significantly correlated with the citation count and h-index. Consequently, social network measures have potential to be used in an academic network to rank the authors.
1. Introduction
In the present era, online social networks are widely-used platforms that enable people to connect with other people for exchanging ideas, views and setting public opinion. Types of online social networks include, but are not limited to, Facebook, Flicker, Twitter, YouTube, etc. According to the statistics, Facebook had about 2.2 billion monthly active users in March 2018. Similarly, the total number of monthly active users of Twitter in January 2018 was 330 million, who share about 500 million tweets per day. Flicker is used by 92 million people worldwide and is a great place to store and share photos online [1]. These online social networking sites provide an active communication platform for people, and they have opened new venues of research for the academic world and businesses. One of these research areas is finding the influential users in the online social networks. According to the related research studies [2,3,4,5,6], the influence of top users is measured with the help of various techniques, such as the feature-based technique or link-based technique. Moreover, in all these techniques, the focus has been to find the top active or influential users.
Like online social networks, there are a number of online academic networks. These are also represented by the relationship among the entities or nodes, such as paper, author, journal or conference. These entities or nodes are connected through two types of relationships: co-citation and co-author, and result in two subtypes of academic network, which are the co-citation network and co-authorship network, respectively. In the citation network, one author cites the publication of other authors, whereas in the co-author network, links are formed between authors based on a publication. As in online social networks, finding influential authors in an academic network is an active research area as well, and the co-authorship network has been used to find the influential authors or the ranking of authors. The research domain of ranking of authors has vast applications such as finding the top supervisor in a specific research domain, offering research jobs, grant funding for research projects and nominating top authors for research awards [7]. In this regard, to rank the authors, using various indexing techniques, such as the h-index [8], g-index [9], m-index [10], R-index [11] and AR-index [11], are used. However, all these indexing techniques evaluate the author to only gauge the influence of authors, but rarely consider discipline or domain along with the impact of authors. To address this problem, centrality measure techniques from social network measures are borrowed. Moreover, authors have used PageRank [12] along with the centrality measure and compared the results with citation count. In another study [13], the authors used a technique from social network measures, i.e., Eigenvector to rank the journals of the PLOS database and compared the result with the citation count within a given journal. Moreover, the techniques borrowed from social network measures often focus on macro-level properties of the co-authorship network, yet no attention is paid to micro-level properties.
In this article, we propose the adoption of established social network measures in order to compute the centrality and significance of an author. Our contributions may be summarized as follows:
- We analyze the co-author network within the Digital Bibliography and Library Project (DBLP) research community at the macro-level by applying centrality measures (betweenness centrality, closeness centrality, degree centrality) and prestige measures (PageRank, Eigenvector) for author ranking.
- We also study the micro-level network properties of the co-author network using the average path length, the largest connected component and the average degree of a network.
- The results, compared with standard baseline methods using the standard performance evaluation measures, confirm that the network centrality measure provides an effective guideline to find the list of ranked authors.
The rest of the article is organized as follows: In Section 2, a literature review of social network measures and academic network metrics is described. The methodology is described in Section 3, which covers the proposed framework, the adoption of social network measures, a brief description of the dataset and the detail of the performance evaluation measures, used for ranking of authors. In Section 4, results are discussed and compared with the baseline indexes. Finally, the conclusions and future work directions are discussed in Section 5.
2. Related Work
In this section, we describe the earlier studies about the use of social network measures in different domains. In the first subsection, related literature from academic network is discussed. In the second subsection, related work from academic network measures is discussed, which are used to rank the authors in an academic network.
2.1. Academic Network Measures
In order to find the productivity and the impact of an author, different indexing schemes are introduced. In this regard, Hirsch [8] proposed the h-index to rank the authors and is considered a pioneer.The h-index takes into account both citation count and publication count. The h-index is intended to measure both the quality and quantity of a scientific output. On the one hand, the h-index is most widely-used indexing technique; on the other hand, it has some shortcomings. One of the shortcomings is that once a paper is selected in the h-index, no further importance is given to that paper even if the paper doubles its citation [14]. To address the issue of the h-index, Egghe proposed another indexing technique named the g-index. It is an improved version of the h-index, and it firstly arranges the documents in decreasing order of their citation received as in the h-index. Afterwards, the g-index is calculated, which is the largest document number such that the top publications collectively receive at least g2 citations. Although the g-index is widely used to find the impact of authors, it could not gain popularity like the h-index, because one very highly cited paper may affect the values of the g-index. Moreover, using the h-index, new authors could not get the desired credit, leading to another shortcoming of the h-index. The m-index [10] solved this issue by the clear distinction between old and new authors. It is computed by dividing the h-index by the number of the research’s years as an author. Although the m-index is an enhanced version of h-index, for the m-index, a small change in the h-index values leads to a big change in the m-quotient, which is one of the major drawbacks of the m-index. The third issue linked with the h-index is that it cannot differentiate between the authors having the same h-index, but variation in the citation received. To overcome this issue, Jin et al. proposed a novel indexing technique named the R-index [11]. It is computed by calculating the h-index, adding all the citation counts involved in the h-index and finally calculating the square root of the cumulative sum of citations. Afterwards, a variation of the R-index was proposed by Jin et al. [11], named the AR-index, which takes into account the age of the article. In this regard, another indexing technique called the DS-index [7] was proposed. It differentiates among the authors having a very small change in the citation count. In the related literature, Arindam Pal and Sushmita Ruj proposed a graph-based analytics framework [15] to assign scores and to rank the paper, venue and author. The graph-based analytics framework used an algorithm that only considered the linked structures of the underlying graphs.
2.2. Social Network Measures
The related literature presents the use of various social network measures such as degree centrality, closeness centrality, betweenness centrality, PageRank and Eigenvector for finding the influential users. The social network measures rank users by their position in social networks. Thus, based on the position of a user, speed of information spread is affected by the user’s centrality, which is an important attribute in a social network [16]. Centrality shows how important a user is for spreading the information over the social network. Moreover, the centrality value is affected by the graph layout and weights. Centrality has numerous measures for finding the influential users. Degree centrality [17] is the first measure, defined as the number of direct neighbors of any vertex or node. It measures the density of a graph. The second measure is closeness centrality [18], which is defined as the length of the minimum path to the other vertices. Subsequently, it measures how quickly data can proliferate from a vertex through the system. Betweenness centrality is the third measure, which requires numerous expensive shortest distance calculations [19]. Betweenness centrality measures how many times a particular node act as a bridge. An extension of degree centrality is the Eigenvector, another measure of centrality. In [20], a node is important if it is linked to another important node. Thus, it measures the influence of a node. The last measure is the PageRank algorithm, which is used to rank web pages. It is a widely-used measure utilized by the Google search engine for positioning websites according to their ranks. PageRank is a graph-based ranking algorithm, usually applied to directed graphs; however, its application to undirected graphs [21] is also possible. All these centrality measures are used to find the influential users. Diverse points of view of influence are being examined in academic networks. In the relevant literature, examples of academic network analysis include judgments of rising stars [22], link influence [23] and finding top conferences [24].
2.3. Applications of Social Network Measures
The social network measures are applied in different domains. To identify the influential users, Jianqiang, Xialin and Feng proposed the modified version of PageRank, named UIRank (user influence rank algorithm) in a micro-blog through the relationship of user interactions [25]. The results show that the UIRank algorithm outperformed other related algorithm in precision, recall and accuracy. Zhao et al. exploited social network measures such as degree centrality, PageRank and betweenness centrality for the analyzing urban traffic flow [26]. Kaple, Kulkarni and Potika also used social network measures to discover future needs in order to manage resources efficiently [27]. The authors applied PageRank on smarts city data to find the influence on the behavior and choices of citizens and to increase the engagement of citizens in elections. Moreover, social network centrality measures are also used in the field of neural networks. Fletcher and Wennekers [28] examined the layout and activities of neurons with the help of the centrality of a neuron. The topological layout of a neural network explains the activity of the neurons within it. Fletcher applied an array of centrality measures, including betweenness, Eigenvector, Katz, PageRank, In-degree, closeness, hyperlink-induced topic search (HITS) and NeuronRank, to fire neural networks with different connectivity schemes. The results show that Katz centrality was the best predictor with optimized correlation in all the cases studied. Katz centrality produced best results because Katz centrality nicely captures disinhibition in neural networks.
2.4. Applications of Social Network Measures in Academic Network
Applications of social network measures in academic networks is also well recognized. For instance, Crossley et al. used social network measures for information exchanges between users, to understand the student retention in a massive open online course (MOOC) or to identify the student arrangements associated with course completion in an MOOC [29]. In an MOOC, betweenness centrality is computed to determine the central nodes. The participant’s connections with other nodes are computed using closeness centrality. According to the results, a higher value of closeness centrality represents a participant’s stronger connection to all other participants in a discussion. Moreover, for ranking of journals, Griffin et al. [30] used social network measures such as closeness, betweenness and degree. Similarly, Barnett et al. [31] used degree centrality, Eigenvector centrality and betweenness centrality to rank the journals. To identify the important keywords within documents, the authors in [32,33] used different social network measures. In this regard, Diallo et al. used the network centrality measures such as Eigenvector to identify the key paper within a journal [13]. Betweenness centrality was used by Chen to detect the emerging trends and patterns in scientific literature over time [34]. In academic networks, network centrality metrics, such as betweenness, determine the significance of papers within the community by examining their co-citation networks or their co-author network for social network analysis based on the flow of information between publications [35].
3. Materials and Methods
In this section, the proposed framework is explained, and social network measures used in this research are described in detail. Furthermore, the dataset used in this research study is discussed. In the last section, performance evaluation measures are discussed.
3.1. Proposed Framework
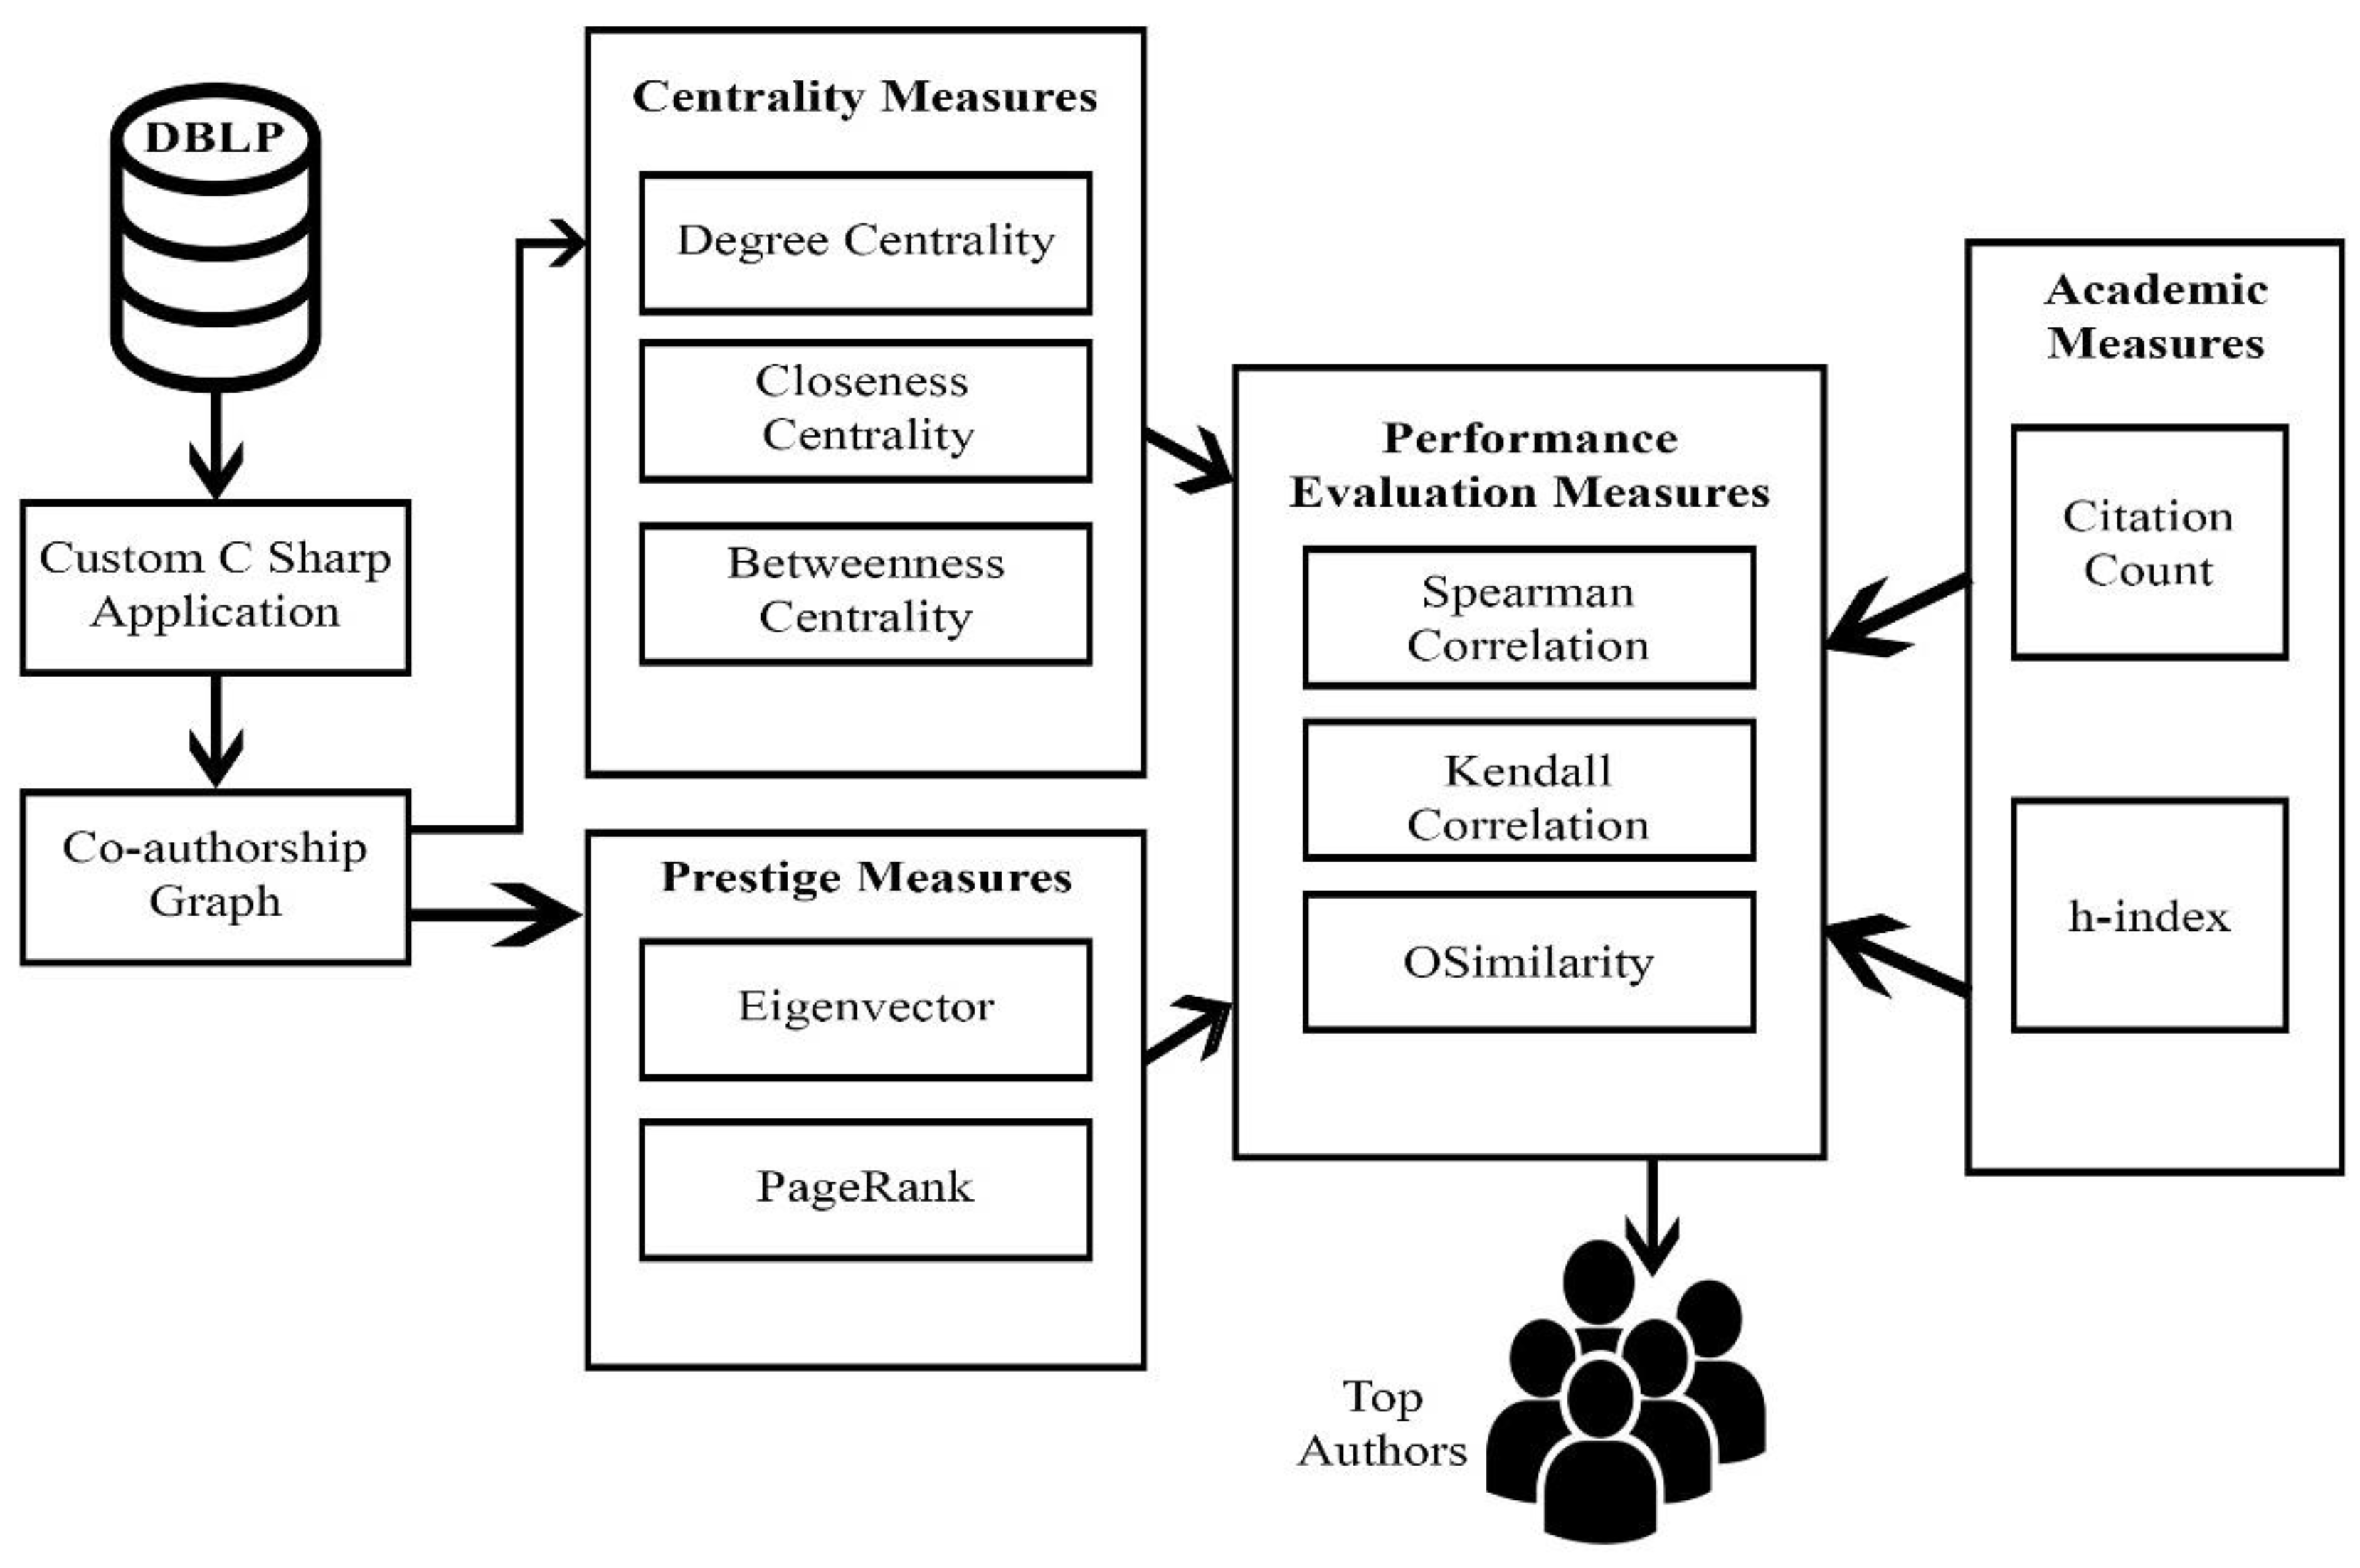
The proposed framework for finding the top authors using social network measures is shown in Figure 1. Firstly, data pre-processing is performed, where the extracted dataset available in XML form is transformed into the graph-based dataset using a custom-developed routine in Microsoft Visual Studio C.Net. Secondly, data analysis is carried out, which includes the calculation of micro-level measures including average path length and largest connected component. Thirdly, for finding top ranked author data, we apply the social network measures such as centrality measure and prestige measure to the dataset. Finally, the computed results are compared with the baseline techniques such h-index and citation count using the performance evaluation measures: Kendall rank order correlation, OSim (also known as Overlapping Similarity or OSimilarlity) [36] and Spearman’s rank order correlation.
3.2. Network Centrality Measures
Two measures, including centrality analysis and prestige analysis, are borrowed from social network analysis [12] and are applied in academic networks for ranking of authors. The centrality analysis determines the central position of an author in spreading the information over the network; whereas, the prestige analysis defines the importance of an author in a given network. Both measures are defined in detail in the following subsections.
3.2.1. Degree Centrality
Degree centrality of an author is defined as the total number of co-authors that are directly attached to a particular author. The degree centrality is computed using Equation (1).
where represents an author in a set of authors and represents the degree of an author . The higher the degree of an author, the more the author central in a co-authorship network and tends to influence others at a greater capacity.
3.2.2. Closeness Centrality
Closeness is used to measure the importance of an author, which determines how much an author is close to the central position. For instance, an author who has a direct connection with many other authors has a high closeness centrality value, while an author that indirectly connects with many other authors has a lower value. Thus, the closeness centrality of an author is the average length of the shortest path between the author and all other authors in the academic network. Closeness centrality is computed using Equation (2).
where represents the closeness centrality of the given author and is the distance between two given authors in the network of authors.
3.2.3. Betweenness Centrality
Betweenness centrality measures the number of times an author acts as a bridge or the shortest path between two other authors. Betweenness centrality is computed using Equation (3).
where represents the betweenness centrality of the given author. represents the total number of shortest paths from author to author , and shows the number of those links that pass through author .
3.2.4. PageRank
PageRank is used to determine the importance of an author within a graph. PageRank is computed using Equation (4).
where is the damping factor, is used to represent the PageRank of author and represents the out-degree of author .
3.2.5. Eigenvector
To find the influence of authors in an academic network, the Eigenvector is another measure. Authors with a high Eigenvector are recurrently co-authored with other significant authors and are considered significant. Thus, a highly-cited author contributes more to the account of the author being cited. In other words, a highly-cited author is connected with other highly-cited authors. The Eigenvector is computed by using Equation (5).
where represents the Eigenvector of an author ; is a constant; represents the adjacency matrix; and represents the Eigenvector of the author .
3.3. Dataset
The DBLP (Digital Bibliography and Library Project) dataset, started in 1993 at the University of Trier, Germany, was used in this research. The DBLP is a computer science bibliography, which is a widely used in academic research [7].
The dataset was downloaded in the form of XML format, having a size of 2.93 GB. The downloaded dataset firstly was converted into the relational database and secondly converted into a graph structure of nodes. Finally, we created the co-authorship network in the form of a graph using an application developed in Microsoft Visual Studio C Sharp.Net. In this newly created graph, for a given publication, all the authors will be connected in an undirected graph. For instance, if a paper is written by three authors, then three undirected edges will connect all three authors. As our research is confined to finding the influence among co-authors, considering those authors who publish alone is beyond the scope of this research study. All the characteristics of the dataset are shown in Table 1. The original DBLP dataset extracted from the source consisted of 3,818,185 research publications and 1,351,586 authors. To find the influential authors, experience was taken into account, and papers of the authors having a minimum of 20 years of research experience were considered. Resultantly, we came up with a dataset of 153,432 papers and 9072 authors. In addition, papers with single authorship were beyond our scope;thus, only those papers having at least two authors were considered, and we finally came up with a reduced dataset of 139,794 authors and 8959 authors.
3.4. Performance Evaluation Metrics
For performance evaluation, we applied three different measures, including Spearman rank order correlation, OSim and Kendall rank order correlation. These measures are discussed in the following subsections.
3.4.1. Spearman Rank Order Correlation
This represents the correlation between strength and direction of association between the two ranked lists [37]. It is calculated using Equation (6).
3.4.2. OSimilarity
This measures the statistical relationship dependence between two ordered lists or variables. The nature of the relationship between the variables is assessed by the use of a monotonic function that preserves the order of the input data. The coverage similarity of the two-ordered lists and for top values is measured using OSim [36]. It is calculated using Equation(7).
3.4.3. Kendall Rank Order Correlation
This is a non-parametric and distribution-free test of independence that measures the association between two ordered lists or variables. It represents the variance analysis that helps in ranking differences between the ordered lists. It measures the similarity of the ordering of the data when ranked by each of the quantities [38]. It is computed using Equation(8).
where represents the concordant pairs and represents the discordant pairs. Concordant pair means the ranks for both elements agree. Discordant means the ranks for both elements disagree.
3.4.4. Difference between Spearman and Kendall Correlations
The Spearman correlation is the difference between the rank orders. It detects the rare and unusual sensitivities that have very big discrepancies. However, Spearman’s correlation is easier to calculate than Kendall’s tau. In fact, the Kendall correlation is the difference between concordant and discordant pairs divided by the sum of concordant and discordant pairs. Thus, Kendall’s tau has a more intuitive interpretation, and it represents the proportion of concordant pairs relative to discordant pairs. In addition, outputs better estimates of the corresponding population parameters, especially with smaller sample sizes. Consequently, it shows higher accuracy when the samples are smaller.
4. Results and Discussion
In this section, firstly, the experiments performed at the micro-level to extract the basic layout of the DBLP dataset are discussed, and the results related to average collaboration, largest connected component, average degree and average path length are explained. In the second subsection, macro-level properties were discussed over the DBLP dataset. The results of the centrality measure and prestige measures have been computed using Gephi, whereas the citation count and h-index values have been computed using the dataset. The results were correlated with the baseline such as citation count and h-index using Spearman rank order, Kendall rank order and OSim.
4.1. Micro-Level Overview of the Dataset
The micro-level properties of the dataset were computed using Gephi, which is a well-known tool for network-based analysis [39]. All the computed micro-level properties are shown in Table 2. There was a total of 39,497 papers in this network. The paper per author ratio was 4.42 papers, while the number of co-authors in a paper was 3.79 authors, and an author had 5.733 co-authors on average. The results showed that co-authorship has increased in the last decade from 2.24 [12] to 5.73. In [12], Ying Ding used the Library and Information Science (LIS) co-authorship network and found that papers per author ratio, authors per paper ratio and average co-authors were 2.40, 1.80 and 2.24, respectively. These results showed lower values as compared to the results computed in this research, as shown in Table 2. This means that now, the research domain of computer science has more collaborative work as compared to ten years ago. The largest connected component was the single largest component of connected authors that filled the maximum author volume of the graph. According to our results, the largest component of the network had a value of 17.17% of the total authors in the network, which shows that the DBLP collaborative network was not the largest connected component graph. Nascimento [40] reported that in Special Interest Group on Management of Data (SIGMOD), the largest component of the network had a value of 60% of all the authors in the network. The reported results showed that the value of the largest connected component was high. This high value was because of the nature of the bibliography, as it is a special interest group that shares common interests of the authors. In another research work, Newman [41] discussed the four co-authorship networks in biology, physics, high-energy physics and computer science databases, and it was found that the results of the largest component were 92.6%, 85.4%, 88.7% and 57.2%, respectively. The reported results were significantly higher than our results; however, a very high or very low value of the largest component does not confirm goodness or badness of the network; rather, a higher value is meant as convergence to the same interest, and a low value represents the diversity. Thus, as the discipline of computer science and information technology has a vast range of different interest groups, its largest connected component value is likely to be low as compared to other disciplines discussed in [40].
Another characteristic of co-author network is average path length. According to the computed results, the average path length of the DBLP co-authorship network was 4.10, which was lower than the results (9.68) reported in the previous study [12] conducted in 2007. This shows that in the present era, authors collaborate more frequently and more widely with each other as compared to the past. Moreover, the values show that in the recent era, the information technology domain has become more collaborative as compared to previous research literature.
4.2. Network Analysis Using Centrality Measures
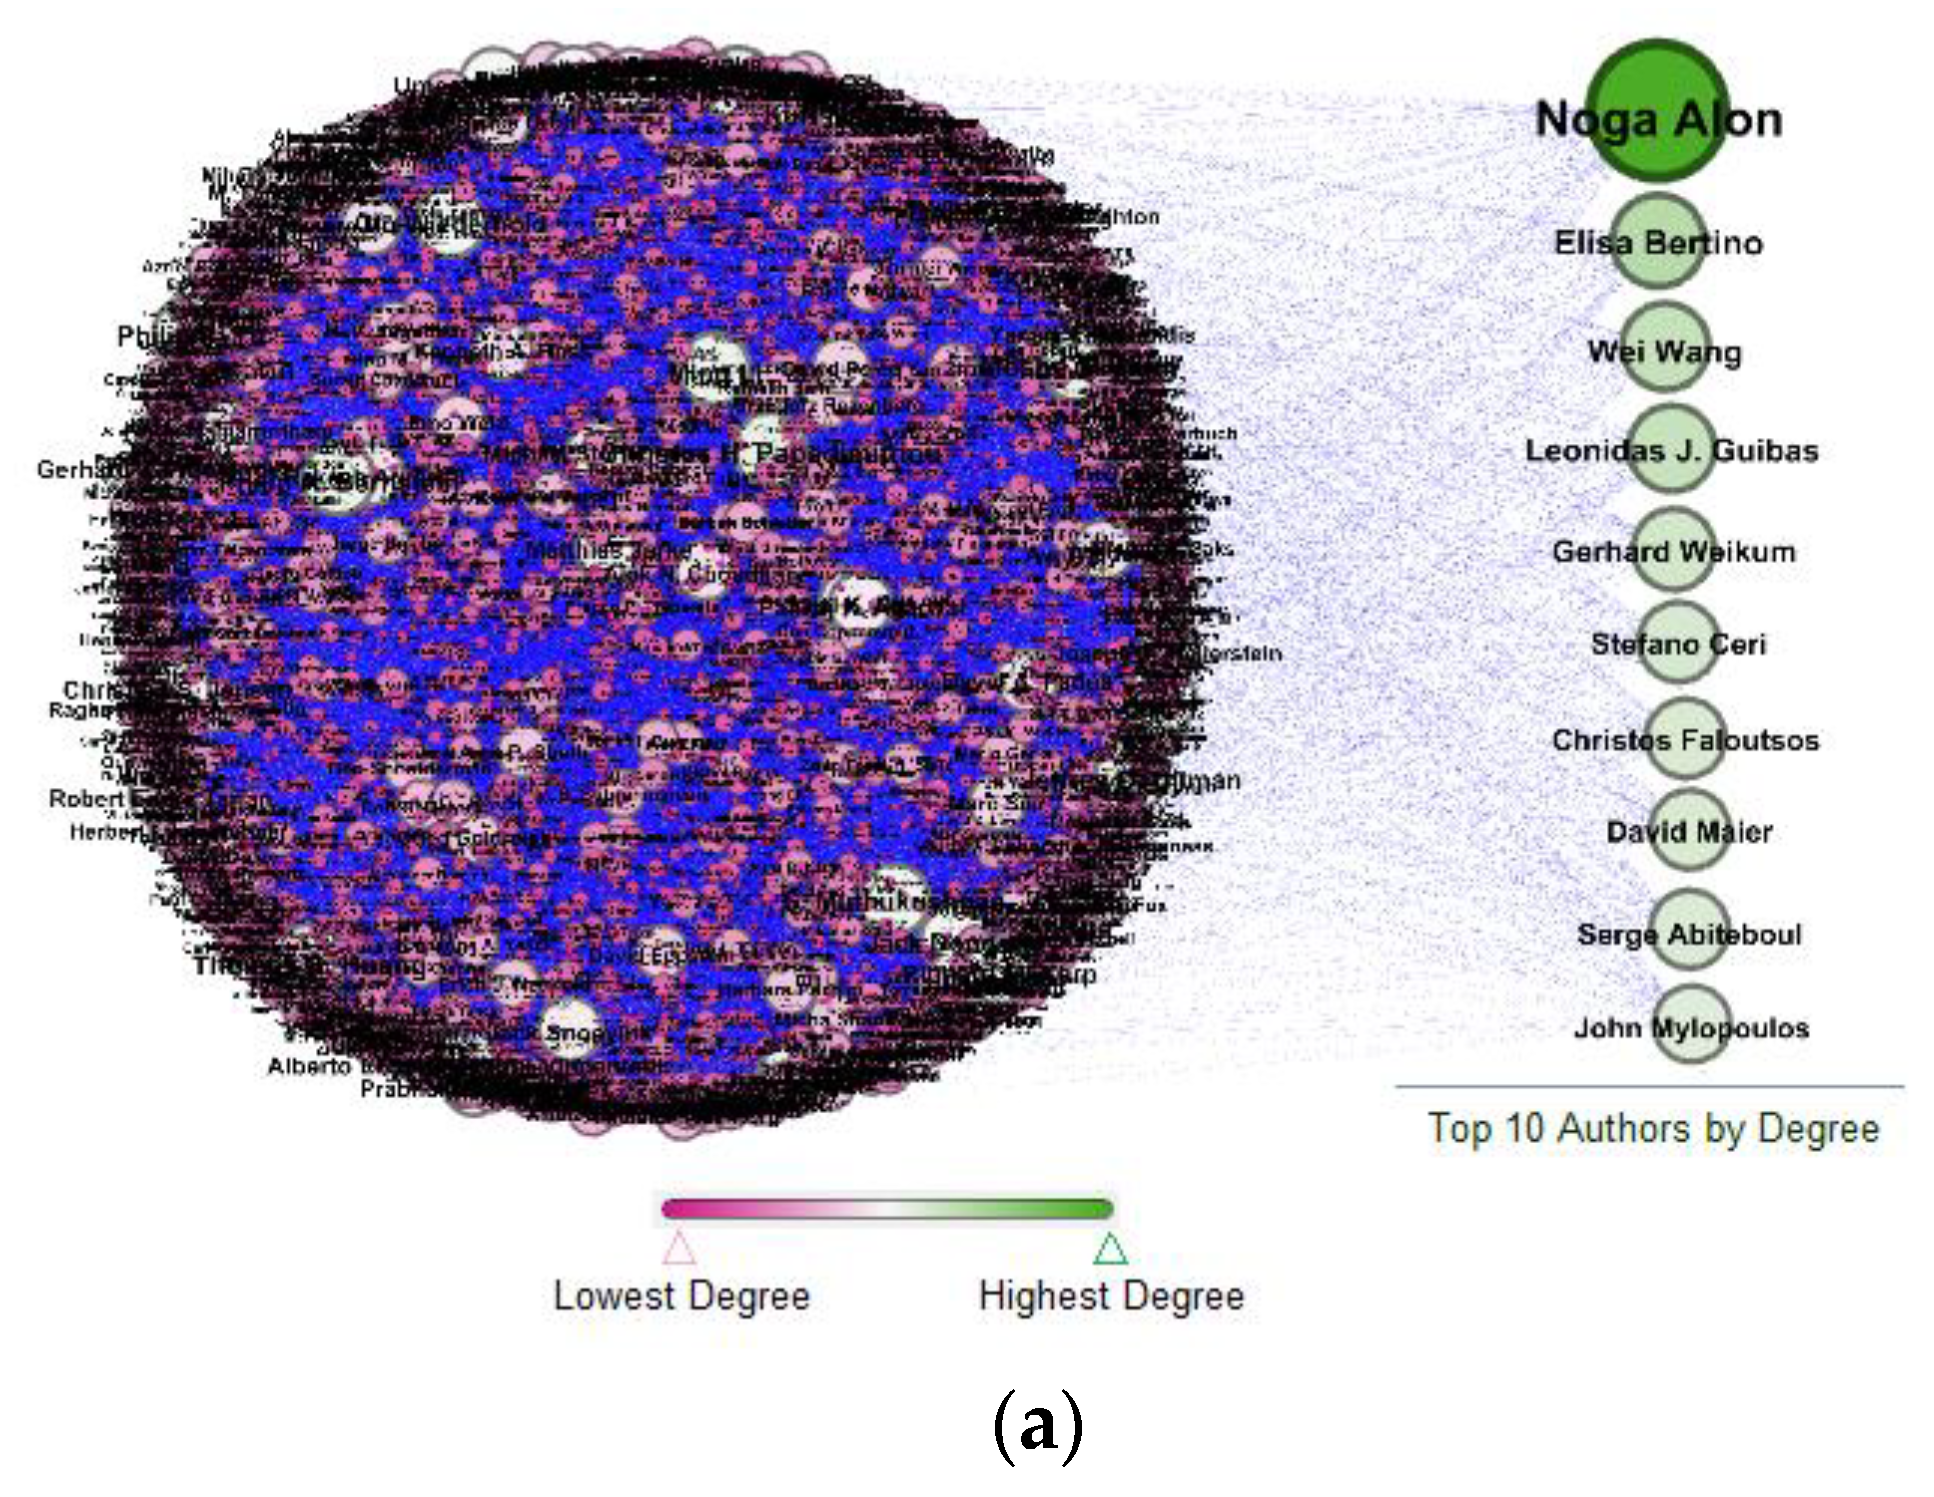
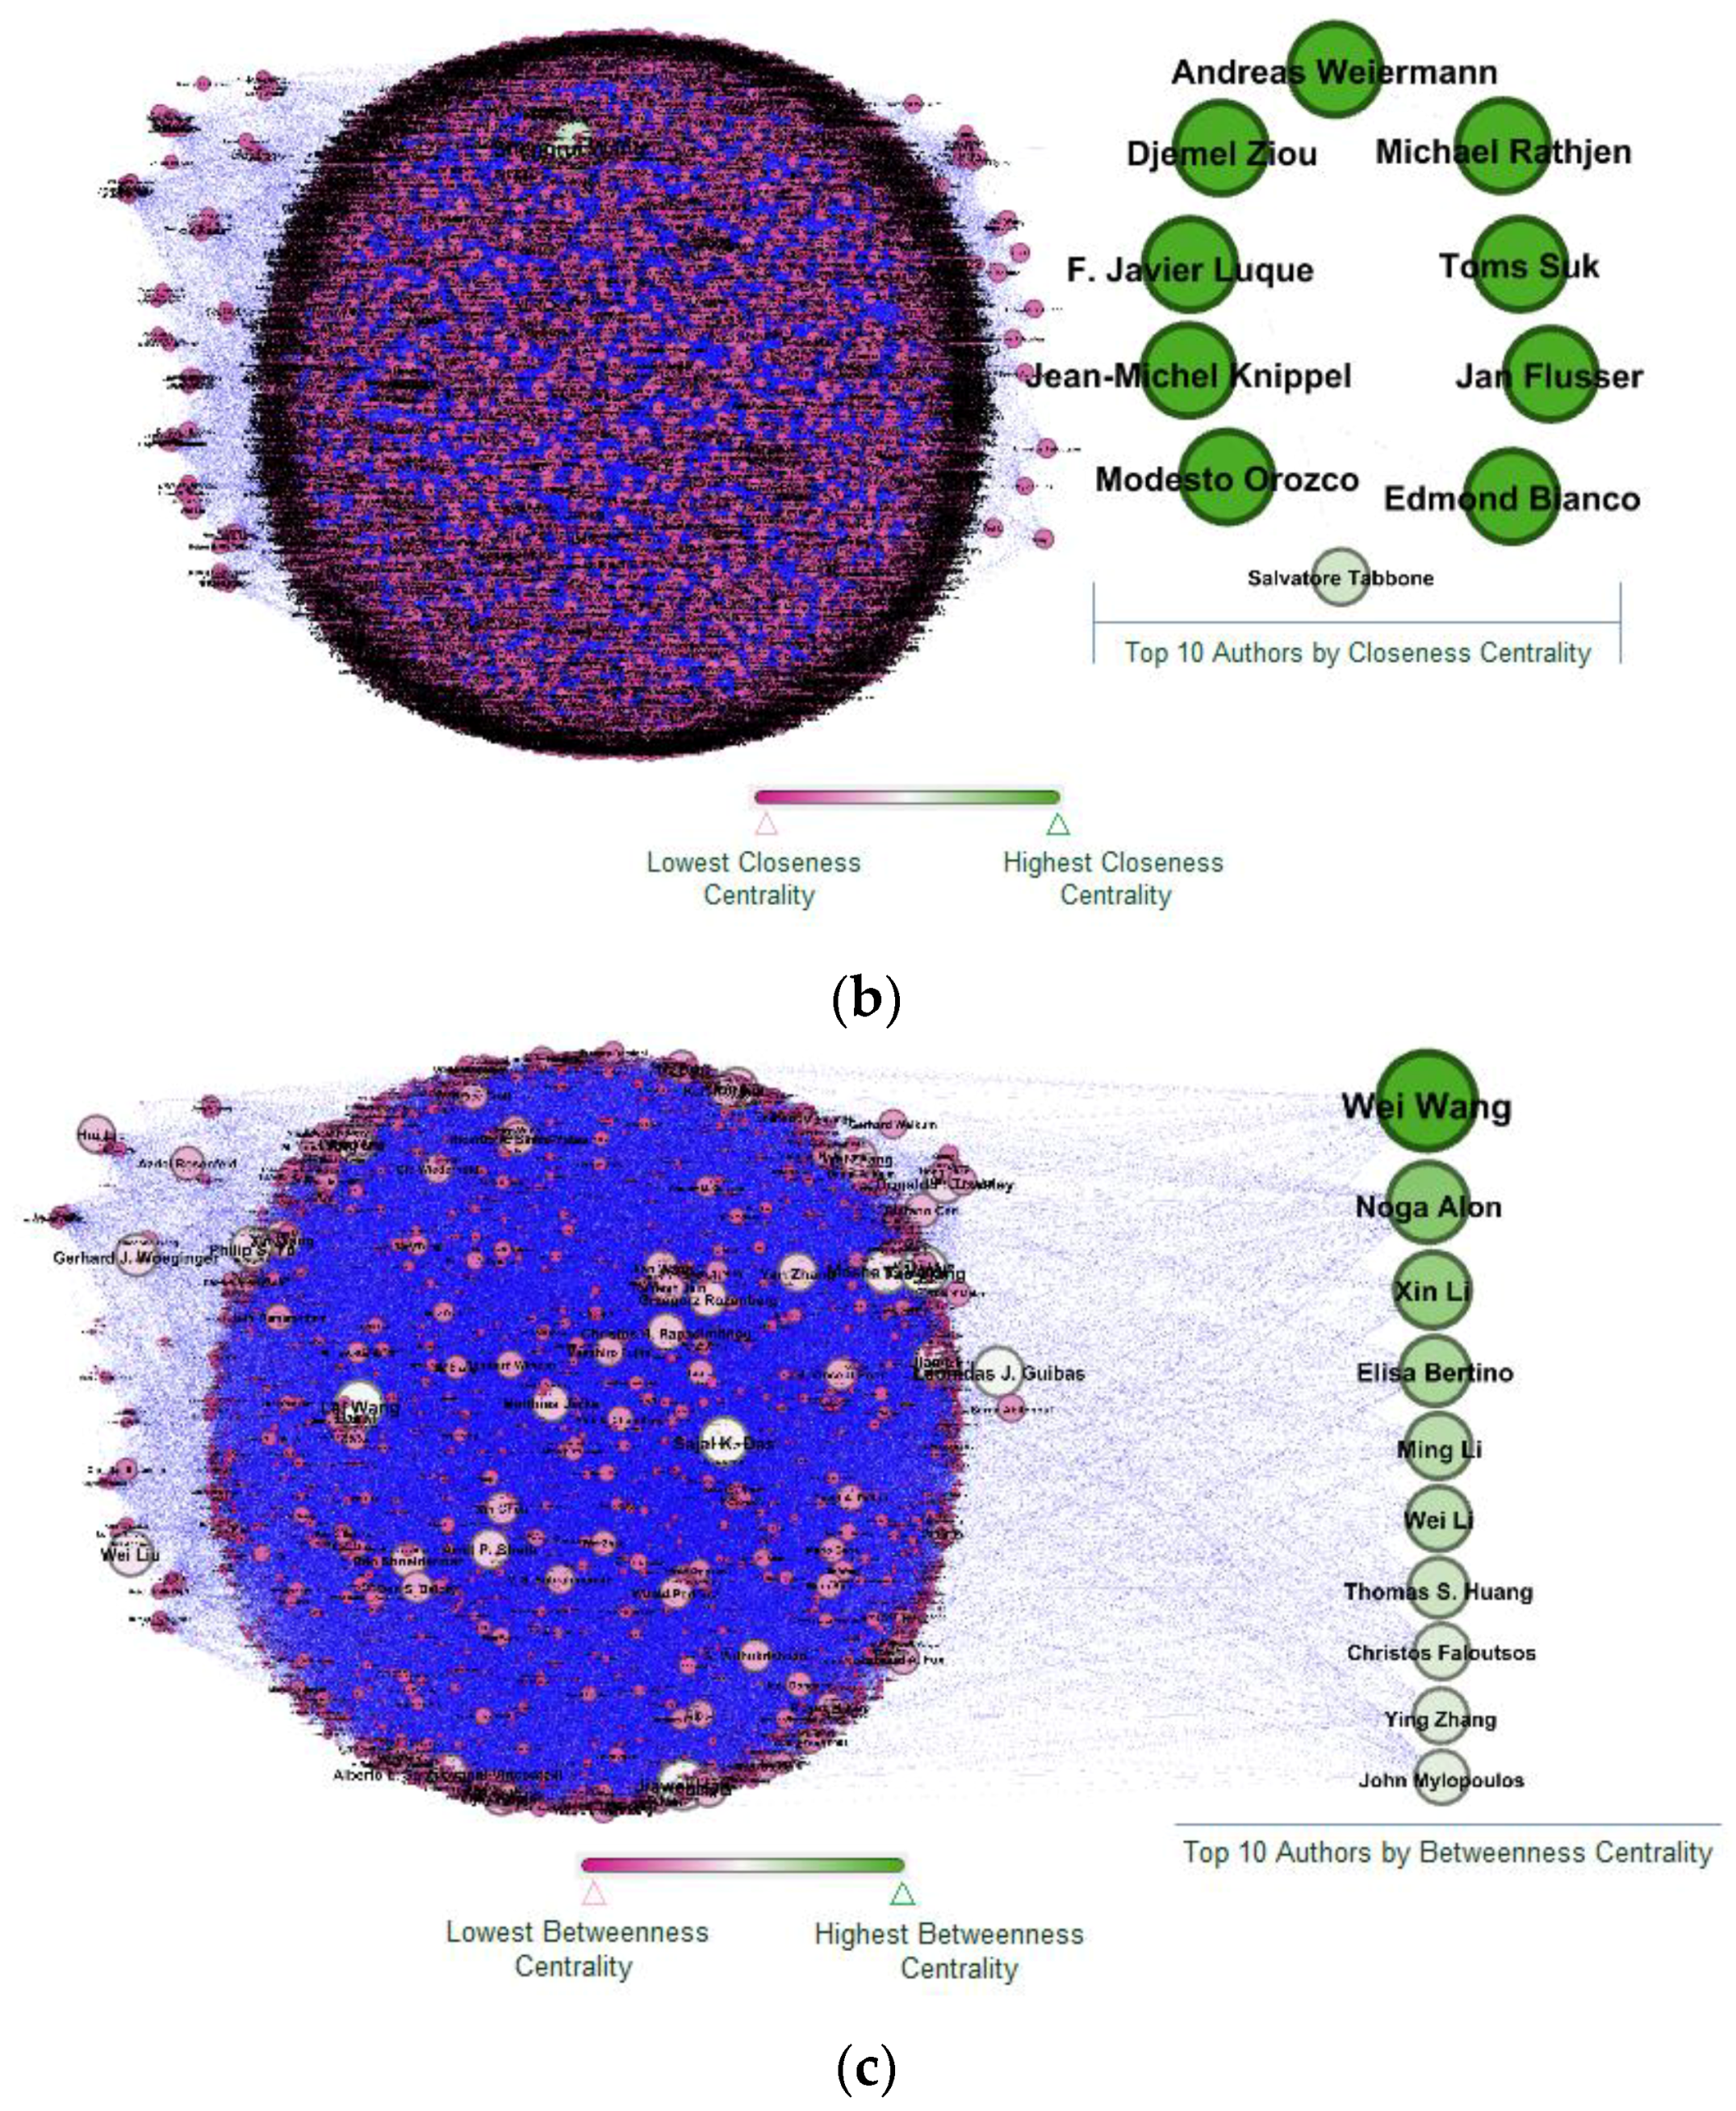
The original DBLP dataset with 3,818,185 research publications and 1,351,586 authors was used for network analysis. As per our analysis, the top 10 authors based on degree centrality are shown in Appendix A, Part (a), where Noga Alon had the highest degree centrality with a value of 158, which represents that Noga Alon was more central in a co-authorship network and tended to influence others to a greater degree. Consequently, the degree centrality values for all the top authors represented their frequent collaboration. Similarly, closeness centrality values are shown in Appendix A, Part (b), where Andreas Welermann, Djemel Ziou and all other authors had direct connections with many other authors and have high closeness centrality values. The rest of the authors in a network had lower values because they had indirect connections with many other authors in a network. The highest closeness centrality values for all top authors represented the independence of the individual authors. Betweenness centrality was the third measure, presented in Appendix A, Part (c), where Wei Wang had the highest betweenness centrality value and had the shortest path between two other authors in a network. The highest value of betweenness centrality for the top authors represented the flow of knowledge between other authors. In addition, the detailed analyses using centrality measures to find the top author using the reduced dataset are given in following sections.
4.3. Finding Top Authors Based on Social Network Measures
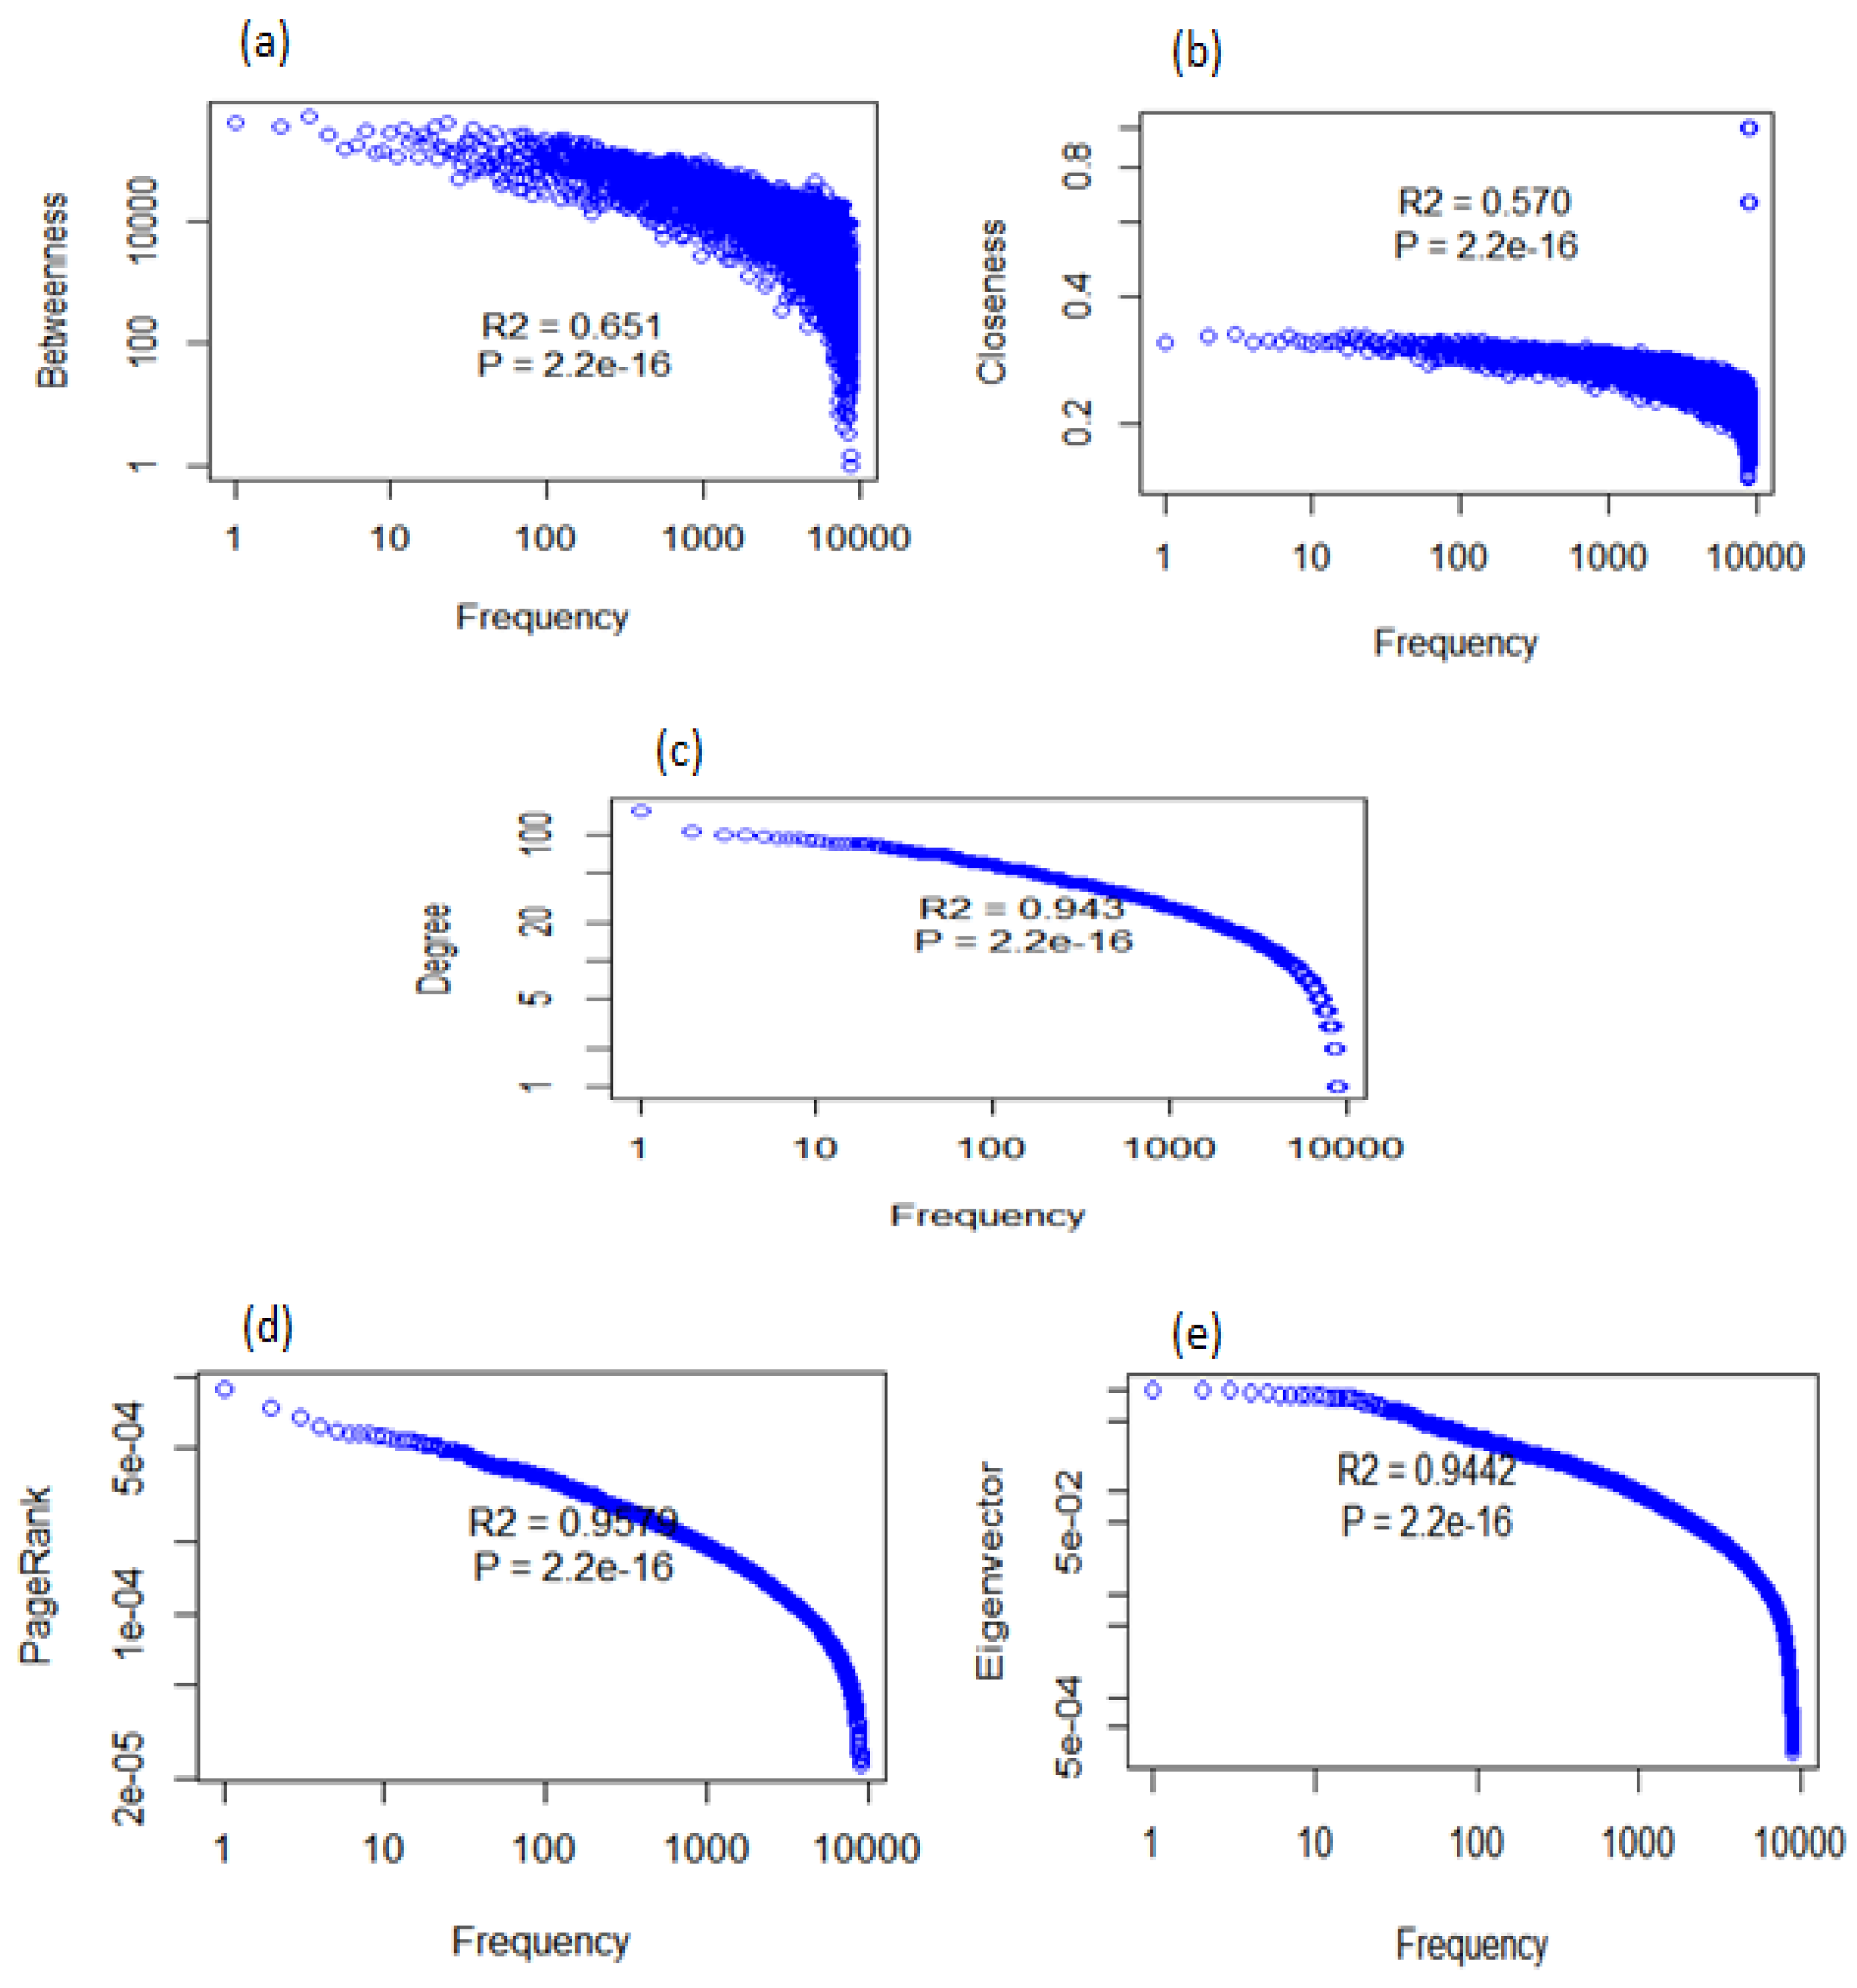
In this article, we computed the centrality of an author by using centrality measures such as betweenness centrality, closeness centrality and degree centrality. We also computed the prestige of an author by using PageRank and Eigenvector. Power law analysis [42] is an important statistical measure of social network analysis. It is carried out to show whether the degree and other measures follow the power law, i.e., the distribution on a log-log scale for the network (co-author network in our case). Our results verify that the computed measures followed the power law. The power law analysis of the social network measures is shown is shown in Figure 2. Figure 2a,b shows that the distribution partially follows power law. Due to a very large number of data points, the distribution stayed smooth for a relatively high frequency.
Figure 2c–e follow the power law, which shows that fewer authors had a high value of degree centrality, PageRank and Eigenvector. The value of R2, which is known as the “co-efficient of regression”, represents the accuracy of the curve with respect to the data. It ranges from zero to one. It tells that how much variation is explained by the model. Therefore, 0.651 means that betweenness explains 65% of the variation within the data. Similarly, 0.57, 0.943, 0.947 and 0.944 mean that closeness centrality, degree centrality, PageRank and Eigenvector explain 57%, 94%, 95% and 94%, respectively, of the variation within the data.A higher value represents more accurate results, which reveals a very high level of accuracy;whereas, the p-value tells us about the F statistics hypothesis testing. If the p-value is less than the significance level (0.05), then the model fits the data well. In our scenario, we had a high R2 value and a low p-value, that is 0.00000332, which states that the model explained much of the variation within the data and that this was significant.
4.4. Finding Top Authors Based on Centrality Measures
The results of the top 20 authors based on degree centrality, betweenness centrality and closeness centrality were calculated with the help of the co-authorship network and are shown in Table 3. The authors appearing consecutively in three centrality measures are shown prominently in bold font, and authors appearing in two centrality measures are marked with bold and italic font. According to the results, a few authors were consecutively highly ranked using all three centrality measures. The results are presented in the form of the triple of degree centrality, betweenness centrality and closeness centrality, respectively in parenthesis, of an author; for instance, for Elisa Bertino (2-3-16), Wei Wang (3-1-12), Christos Faloutsos (8-6-14), Ming Li (15-4-13), Philip S.Yu (16-11-19), Jiawei Han (19-9-17). Degree centrality values for all six authors represented their frequent collaboration; betweenness centrality values for each author showed the flow of knowledge between other authors; closeness centrality values for all six authors represented the independence of the individual author.
Similarly, a few authors were consecutively highly ranked using two centrality measures. This means that some top authors according to the degree and betweenness centrality measures had a low closeness centrality value. For instance, Noga Alon had a high degree centrality, indicating that he had collaborated with many authors (147 authors), but his closeness centrality was relatively low, which ranked 25 out of 6441, which is why the author was not shown in the top 20 in Table 3. The reason behind the low closeness centrality was that a few of his co-authors (Micha Sharir, Michael Krivelevich, Amos Fiat, etc.) were located in Israel; thus, he was close to Israeli authors, whereas distant from the authors of other regions.
4.5. Comparison of Centrality Measures with the Baseline (Citation Count)
The results of the top 40 authors based on the citation count along with their rank of all three centrality measures are shown in Table 4. In this study, for comparative analysis of the results, citation count was used as a benchmark, as previously used in existing studies [11]. The results show that the citation rank was more in-line with the rank of degree centrality as compared to the other two measures of centrality.
However, in some cases, the authors with a high citation rank had low centrality rankings, as shown in Table 4. For instance, Jim Gray, Raymond A. Lorie, E. F. Codd, Won Kim and Nathan Goodman had a high citation count, but were very low for all three centrality measures. According to the results, Jim Gray had only seven co-authors who were located in America, and most of them were not cut-points; thus, he did not have a high centrality value. Cut-points are a kind of node whose removal increases the number of components. Jim Gray had four co-authors, H. Raymond Strong from New York, Gabor Herman from London, Limeshawar Dayal from North America and Rakesh Agrawal from New York. Moreover, Jim Gray had co-authored one paper in 2005, which had been cited 772 times. Because of the high citation of the paper, his citation count was high and his co-authorship was very limited; thus, he had low rank centrality measures for degree (62), betweenness (81) and closeness centralities (535). Similarly, Raymond A. Lorie had a publication count of 22, and a few of his publications were highly cited; he had eight co-authors only in the dataset. Furthermore, E. F. Codd had six papers in the dataset, and he had four co-authors.On the other hand, some authors had a high degree centrality, but low betweenness and closeness centrality. For instance, Michael J. Carey, Hector Garcia-Molina, Rakesh Agrawal and Raghu Ramakrishnan, although their centrality rankings corresponded to their citation rankings, only a portion of their publications were incorporated in our dataset, which may have affected the ranking results.
4.6. Finding Top Authors Based on Prestige Measures
The results of the top 20 authors based on PageRank and Eigenvector calculated with the help of the co-authorship network are shown in Table 5. An author appearing consecutively in two prestige measures is shown prominently in bold font.According to the results, a few authors were consecutively highly ranked using both prestige measures. The results are presented in the form of the dual of PageRank and Eigenvector in parenthesis for an author; for instance, for Noga Alon (1-11), Wei Wang (2-13), Philip S.Yu (11-3), Stefano Ceri (13-12), Gerhard Weikum (15-2), Serge Abiteboul (17-8), and David Maier (18-1); where PageRank and Eigenvector values for all seven authors represent their prestige and importance within the given set of knowledge.
4.7. Comparison of Prestige Measures Using the Baseline (H-Index)
Table 6 lists the top 40 authors based on their h-index scores. The h-index [7] is a measure that considers both the productivity, as well as the citation received by the publications or an author. For comparison, the h-index is used as a benchmark, which is a widely-used metric by Google Scholar and other sources of scholarly literature to find the significance of research work of an author. The h-index is compared with prestige measures to check the prestige of an author. In Table 6, for each author, their respective centrality ranking within the top 40 rank is displayed in bold font along with their h-index rank. Table 6 shows some differences between the rankings of the h-index and centrality measures. The top three authors based on the h-index such as Won Kim, Catriel Beeri and Yehoshua Sagiv had low centrality. Won Kim, who enjoyed an h-index of 21 and had a substantial number of publications, i.e., 46, had fewer co-authors. The less number of co-authors may result in a low prestige score as computed from the values of the PageRank and Eigenvector of Won Kim, having low values of 185 and 195, respectively. Similarly, Catriel Beeri and Yehoshua Sagiv had 10 and 23, respectively, co-authors in the dataset and therefore a lower prestige score.
4.8. Comparing Social Network Measures with Academics Indexes
The results of centrality and prestige measures were validated against the academic measures. For validation, Spearman, Kendall and OSim rank order correlations between prestige measures (PageRank and Eigenvector) and the h-index were used. We also found the correlation of degree centrality, betweenness and closeness with citation count using same correlation techniques.
The results of all three performance evaluation measures are described in Table 7, Table 8 and Table 9. According to the results, two prestige measures had a significant high correlation with the h-index for a p-value of 0.01, where the correlation coefficient of the Eigenvector was higher than PageRank. The high correlation of the h-index with prestige suggests that prestige measures have the potential to rank authors. In addition, according to the results of OSim based on the top 250 authors, the h-index and Eigenvector had the highest similarity with a value of 67%, whereas PageRank and Eigenvector had a similarity of 59%. Finally, the h-index and PageRank had the lowest similarity with a value of 52%.
Similarly, the results of all three correlation measures are described in Table 10, Table 11 and Table 12. According to the results, three centrality measures had a significant high correlation with the citation count at a p-value of 0.01, where the correlation coefficient of degree centrality was higher than other two centrality measures. The high correlation of citation count with centrality measures suggests that centrality measures also have potential to be used for authors’ ranking. Moreover, the computed OSim values based on the top 250 authors, degree and closeness had the highest similarity with a value of 75%, whereas degree and betweenness had a similarity of 63%.
5. Conclusions and Future Work
This research study used social network measures to find the centrality and prestige of authors in an academic network. The results using both the centrality and prestige measures show that rank lists computed using all three centrality measures are consistent with each other. The results of the centrality and prestige measures are validated against the academic measures. The results show that the degree centrality, betweenness centrality and closeness centrality measures are significantly correlated with citation counts. Among these three measures, degree centrality has a high correlation with the citation count. It confirms that that the degree centrality has potential to be used for author ranking. However, in some cases, a few authors have a higher citation count, but they have low rank in the centrality measures. This shows that citation count measures the quality and influence of articles, whereas social network measures the quality of articles and the impact of the author’s discipline, because citations and centralities measure different contents. Moreover, the results show that in the case of prestige measures, high correlation exists between Eigenvector and the h-index; whereas in the case of centrality measures, high correlation exists between degree centrality and citation count. According to the results, the degree centrality measures a scholar’s co-authorship capacity; closeness centrality measures a scholar’s position in a co-author network and the closest distance with other co-authors in the field; and betweenness centrality measures an author’s importance for other authors in their virtual communication. Hence, centrality has its value in impact evaluation, since it integrates both article impact and author’s field impact.
In the future, we aim to prepare the knowledge network by creating journal- and conference-level citation linkage, and then, the development of sub-disciplines will be identified. We will explore how research domains in in computer science have evolved in the last two decades. This research study only considers authors in co-authorship networks without their affiliation, so in the future, we aim to consider the affiliation of the authors. We also aim to further explore the co-authorship network in order to find the actual contribution of an author within a research article.
Author Contributions
The concept was given by H.U.K. and F.B.; The implementation was done by M.F. and F.B.; The writing, original draft presentation was done by F.B. and T.I.; Supervised by H.U.K. and T.I.; Y.N. and I.M. performed the final writing, review and editing.
Funding
This research was funded by the Soonchunhyang University Research Fund and the MSIP (Ministry of Science, ICT and Future Planning), Korea, grant number IITP-2018-2014-1-00720 and the APC was funded by IITP-2018-2014-1-00720.
Acknowledgements
This work was supported by the Soonchunhyang University Research Fund and also supported by the MSIP (Ministry of Science, ICT and Future Planning), Korea, under the ITRC (Information Technology Research Center) support program (IITP-2018-2014-1-00720) supervised by the IITP (Institute for information & communications Technology Promotion).
Conflicts of Interest
The authors declare that they have no competing financial interests.
Appendix A
Figure A1.
Part (a): Top 10 authors based on degree centrality, Part (b): Top 10 authors based on closeness centrality, Part (c): Top 10 authors based on betweenness centrality.
Figure A1.
Part (a): Top 10 authors based on degree centrality, Part (b): Top 10 authors based on closeness centrality, Part (c): Top 10 authors based on betweenness centrality.


References
- King, D.L. Landscape of social media for libraries. Lib. Technol. Rep. 2015, 51, 10–15. [Google Scholar]
- Aiello, L.M.; Barrat, A.; Cattuto, C.; Schifanella, R.; Ruffo, G. Link creation and information spreading over social and communication ties in an interest-based online social network. EPJ Data Sci. 2012, 1, 12. [Google Scholar] [CrossRef]
- Khan, H.U.; Daud, A.; Malik, T.A. MIIB: A Metric to identify top influential bloggers in a community. PLoS ONE 2015, 10, e0138359. [Google Scholar] [CrossRef] [PubMed]
- Khan, H.U.; Daud, A.; Ishfaq, U.; Amjad, T.; Aljohani, N.; Abbasi, R.A.; Alowibdi, J.S. Modelling to identify influential bloggers in the blogosphere: A survey. Comput. Hum. Behav. 2017, 68, 64–82. [Google Scholar] [CrossRef]
- Ishfaq, U.; Khan, H.U.; Iqbal, K. Modeling to find the top bloggers using sentiment features. In Proceedings of the International Conference on Computing, Electronic and Electrical Engineering (ICE Cube), Quetta, Pakistan, 11–12 April 2016; pp. 227–233. [Google Scholar]
- Khan, R.; Khan, H.U.; Faisal, M.S.; Iqbal, K.; Malik, M.S.I. An Analysis of Twitter users of Pakistan. Int. J. Comput. Sci. Inf. Secur. 2016, 14, 855. [Google Scholar]
- Farooq, M.; Khan, H.U.; Iqbal, S.; Munir, E.U.; Shahzad, A. DS-Index: Ranking Authors Distinctively in an Academic Network. IEEE Access 2017, 5, 19588–19596. [Google Scholar] [CrossRef]
- Hirsch, J.E. An index to quantify an individual’s scientific research output. Proc. Natl. Acad. Sci. USA 2005, 102, 16569. [Google Scholar] [CrossRef] [PubMed] [Green Version]
- Bornmann, L.; Marx, W. The h index as a research performance indicator. Eur. Sci. Ed. 2011, 37, 77–80. [Google Scholar]
- Burrell, Q.L. Hirsch’s h-index: A stochastic model. J. Informetr. 2007, 1, 16–25. [Google Scholar] [CrossRef]
- Jin, B.; Liang, L.; Rousseau, R.; Egghe, L. The R-and AR-indices: Complementing the h-index. Chin. Sci. Bull. 2007, 52, 855–863. [Google Scholar] [CrossRef]
- Yan, E.; Ding, Y. Applying centrality measures to impact analysis: A coauthorship network analysis. J. Assoc. Inf. Sci. Technol. 2009, 60, 2107–2118. [Google Scholar] [CrossRef] [Green Version]
- Diallo, S.Y.; Lynch, C.J.; Gore, R.; Padilla, J.J. Identifying key papers within a journal via network centrality measures. Scientometrics 2016, 107, 1005–1020. [Google Scholar] [CrossRef]
- Egghe, L. Theory and practise of the g-index. Scientometrics 2006, 69, 131–152. [Google Scholar] [CrossRef] [Green Version]
- Pal, A.; Ruj, S. A Graph Analytics Framework for Ranking Authors, Papers and Venues. arXiv. 2017. Available online: https://arxiv.org/abs/1708.00329 (accessed on 7 January 2018).
- Weng, J.; Lim, E.-P.; Jiang, J.; He, Q. Twitterrank: Finding topic-sensitive influential twitterers. In Proceedings of the Third ACM International Conference on Web search and data mining, New York, NY, USA, 4–6 February 2010; pp. 261–270. [Google Scholar]
- Ji, X.; Wang, B.; Liu, D.; Chen, G.; Tang, F.; Wei, D.; Tu, L. Improving interdependent networks robustness by adding connectivity links. Physica A 2016, 444, 9–19. [Google Scholar] [CrossRef]
- Pratiwi, A.; Suzuki, A. Effects of farmers’ social networks on knowledge acquisition: Lessons from agricultural training in rural Indonesia. J. Econ. Struct. 2017, 6, 8. [Google Scholar] [CrossRef]
- Then, M.; Günnemann, S.; Kemper, A.; Neumann, T. Efficient Batched Distance, Closeness and Betweenness Centrality Computation in Unweighted and Weighted Graphs. Datenbank-Spektrum 2017, 17, 169–182. [Google Scholar] [CrossRef]
- Park, D.; Bae, A.; Schich, M.; Park, J. Topology and evolution of the network of western classical music composers. EPJ Data Sci. 2015, 4, 2. [Google Scholar] [CrossRef]
- Mihalcea, R. Graph-based ranking algorithms for sentence extraction, applied to text summarization. In Proceedings of the ACL 2004 on Interactive Poster and Demonstration Sessions, Barcelona, Spain, 21–26 July 2004; p. 20. [Google Scholar]
- Li, L.; Wang, X.; Zhang, Q.; Lei, P.; Ma, M.; Chen, X. A quick and effective method for ranking authors in academic social network. In Multimedia and Ubiquitous Engineering; Springer: Berlin, Germany, 2014; pp. 179–185. [Google Scholar]
- Brandao, M.A.; Moro, M.M. Affiliation Influence on Recommendation in Academic Social Networks. In Proceedings of the 6th Alberto Mendelzon International Workshop on Foundations of Data Management, Ouro Preto, Brazil, 27–30 June 2012; pp. 230–234. Available online: http://ceur-ws.org/Vol-866/poster5.pdf (accessed on 11 January 2018).
- Farooq, M.; Khan, H.U.; Shahzad, A.; Iqbal, S.; Akram, A.U. Finding the top conferences using novel ranking algorithm. Int. J. Adv. Appl. Sci. 2017, 4, 148–152. [Google Scholar] [Green Version]
- Zhao, J.Q.; Gui, X.L.; Feng, T. A New Method of Identifying Influential Users in the Micro-Blog Networks. IEEE Access 2017, 5, 3008–3015. [Google Scholar]
- Zhao, S.; Zhao, P.; Cui, Y. A network centrality measure framework for analyzing urban traffic flow: A case study of Wuhan, China. Physica A 2017, 478, 143–157. [Google Scholar] [CrossRef]
- Kaple, M.; Kulkarni, K.; Potika, K. Viral Marketing for Smart Cities: Influencers in Social Network Communities. Proceedings of IEEE Third International Conference on Big Data Computing Service and Applications (BigDataService), San Francisco, CA, USA, 6–9 April 2017; pp. 106–111. [Google Scholar]
- Fletcher, J.M.; Wennekers, T. From structure to activity: Using centrality measures to predict neuronal activity. Int. J. Neural Syst. 2018, 28, 1750013. [Google Scholar] [CrossRef] [PubMed]
- Crossley, S.; Dascalu, M.; McNamara, D.; Baker, R.; Trausan-Matu, S. Predicting Success in Massive Open Online Courses (MOOCs) Using Cohesion Network Analysis. Available online: http://dspace.ou.nl/handle/1820/9653 (accessed on 7 January 2018).
- Griffin, D.J.; Bolkan, S.; Holmgren, J.L.; Tutzauer, F. Central journals and authors in communication using a publication network. Scientometrics 2016, 106, 91–104. [Google Scholar] [CrossRef]
- Barnett, G.A.; Huh, C.; Kim, Y.; Park, H.W. Citations among communication journals and other disciplines: A network analysis. Scientometrics 2011, 88, 449–469. [Google Scholar] [CrossRef]
- Beliga, S.; Meštrović, A.; Martinčić-Ipšić, S. An overview of graph-based keyword extraction methods and approaches. J. Inf. Organiz. Sci. 2015, 39, 1–20. [Google Scholar]
- Khan, G.F.; Wood, J. Information technology management domain: Emerging themes and keyword analysis. Scientometrics 2015, 105, 959–972. [Google Scholar] [CrossRef]
- Chen, C. CiteSpace II: Detecting and visualizing emerging trends and transient patterns in scientific literature. J. Assoc. Inf. Sci. Technol. 2006, 57, 359–377. [Google Scholar] [CrossRef] [Green Version]
- Leydesdorff, L. Betweenness centrality as an indicator of the interdisciplinarity of scientific journals. J. Assoc. Inf. Sci. Technol. 2007, 58, 1303–1319. [Google Scholar] [CrossRef] [Green Version]
- Haveliwala, T.H. Topic-sensitive pagerank: A context-sensitive ranking algorithm for web search. IEEE Trans. Knowl. Data Eng. 2003, 15, 784–796. [Google Scholar] [CrossRef] [Green Version]
- Fieller, E.C.; Hartley, H.O.; Pearson, E.S. Tests for rank correlation coefficients. I. Biometrika 1957, 44, 470–481. [Google Scholar] [CrossRef]
- Abdi, H. The Kendall rank correlation coefficient. In Encyclopedia of Measurement and Statistics; Sage: Thousand Oaks, CA, USA, 2007; Available online: https://www.utdallas.edu/~herve/Abdi-KendallCorrelation2007-pretty.pdf (accessed on 7 January 2018).
- Bastian, M.; Heymann, S.; Jacomy, M. Gephi: An open source software for exploring and manipulating networks. Icwsm 2009, 8, 361–362. [Google Scholar]
- Nascimento, M.A.; Sander, J.; Pound, J. Analysis of SIGMOD’s co-authorship graph. ACM Sigmod Rec. 2003, 32, 8–10. [Google Scholar] [CrossRef]
- Newman, M.E. Scientific collaboration networks. I. Network construction and fundamental results. Phys. Rev. E 2001, 64, 016131. [Google Scholar] [CrossRef] [PubMed]
- McGlohon, M.; Akoglu, L.; Faloutsos, C. Statistical properties of social networks. In Social Network Data Analytics; Springer: Berlin, Germany, 2011; pp. 17–42. [Google Scholar]
Figure 1.
Ranking authors using social network measures. DBLP, the Digital Bibliography and Library Project.
Figure 1.
Ranking authors using social network measures. DBLP, the Digital Bibliography and Library Project.

Figure 2.
Power law analysis of (a) betweenness, (b) closeness, (c) degree, (d) PageRank and (e) Eigenvector.
Figure 2.
Power law analysis of (a) betweenness, (b) closeness, (c) degree, (d) PageRank and (e) Eigenvector.


Table 1.
Characteristics of the DBLP dataset.
| Attributes | Values |
|---|---|
| Vertex Type | Publication |
| Edge Type | Co-authorship |
| Size | 8959 Vertices (author) |
| Volume | 61,009 Edges (co-author) |
| Format | Undirected |
| Average Degree | 13.62 |
Table 2.
Statistics of the DBLP co-authorship network.
| Parameter | Values |
|---|---|
| Number of papers | 139,794 |
| Number of authors | 9589 |
| Average co-author | 5.733 |
| Paper per author | 4.42 |
| Author per paper | 3.79 |
| Average degree | 13.62 |
| Largest component | 17.7% |
| Average path length | 4.10 |
| Diameter | 10 |
Table 3.
Author rank according to centrality measures.
| Rank | Authors | Degree | Authors | Betweenness | Authors | Closeness |
|---|---|---|---|---|---|---|
| 1 | Noga Alon | 158 | Wei Wang | 517,151.36 | Djemel Ziou | 1 |
| 2 | Elisa Bertino | 108 | Noga Alon | 424,478.79 | Modesto Orozco | 1 |
| 3 | Wei Wang | 102 | Elisa Bertino | 369,459.22 | Jan Flusser | 1 |
| 4 | Leonidas J. Guibas | 101 | Ming Li | 349,935.03 | F. Javier Luque | 1 |
| 5 | Gerhard Weikum | 96 | Thomas S. Huang | 319,949.56 | Edmond Bianco | 1 |
| 6 | Stefano Ceri | 94 | Christos Faloutsos | 298,375.65 | Jean-Michel Knippel | 1 |
| 7 | David Maier | 93 | John Mylopoulous | 286,749.37 | Andreas Weiermann | 1 |
| 8 | Christos Faloutsos | 93 | Leonidas J. Guibas | 266,976.11 | Michael Rathjen | 1 |
| 9 | Serge Abiteboul | 92 | Jiawei Han | 266,191.03 | Toms Suk | 1 |
| 10 | John Mylopoulous | 90 | Moshe Y. Vardi | 235,958.04 | Shengrui Wang | 0.6666 |
| 11 | Richard T. Snodgrass | 88 | Philip S. Yu | 223,704.21 | Salvatore Tabbone | 0.6666 |
| 12 | Thomas S. Huang | 87 | C. H. Papadimitriou | 194,705.29 | Wei Wang | 0.3261 |
| 13 | C. H. Papadimitriou | 87 | Stefano Ceri | 179,227.78 | Ming Li | 0.3226 |
| 14 | Moshe Y. Vardi | 86 | Kurt Mehlhorn | 178,960.63 | Christos Faloutsos | 0.3215 |
| 15 | Ming Li | 85 | Gerhard Weikum | 150,870.43 | Xin Li | 0.3207 |
| 16 | Philip S.Yu | 85 | Serge Abiteboul | 146,865.46 | Elisa Bertino | 0.3203 |
| 17 | Jeffrey D. Ullman | 85 | David Maier | 133,393.66 | Jiawei Han | 0.3194 |
| 18 | Kurt Mehlhorn | 85 | Richard T. Snodgrass | 115,250.13 | Wei Li | 0.3168 |
| 19 | Jiawei Han | 85 | Phillip A. Bernstein | 112,711.00 | Philip S. Yu | 0.3164 |
| 20 | Philip A. Bernstein | 85 | Jeffrey D. Ullman | 106,383.54 | Hao Wang | 0.3154 |
Table 4.
Top 40 authors based on the citation count.
| Authors | Citation Count | Centrality Measures Rank | |||
|---|---|---|---|---|---|
| Counts | Ranking | Degree | Closeness | Betweenness | |
| Jeffrey D. Ullman | 3412 | 1 | 13 | 38 | 117 |
| Michael Stonebraker | 2605 | 2 | 25 | 68 | 267 |
| David J. Dewitt | 2271 | 3 | 38 | 100 | 827 |
| Philip A. Bernstein | 1913 | 4 | 13 | 24 | 104 |
| Jim Gray | 1878 | 5 | 62 | 81 | 535 |
| David Maier | 1613 | 6 | 7 | 12 | 74 |
| Serge Abiteboul | 1570 | 7 | 8 | 39 | 58 |
| Raymond A. Lorie | 1494 | 8 | 83 | 1992 | 2481 |
| E. F. Codd | 1465 | 9 | 93 | 3844 | 6597 |
| Michael J. Carey | 1439 | 10 | 27 | 85 | 455 |
| Won Kim | 1392 | 11 | 63 | 239 | 278 |
| Nathan Goodman | 1360 | 12 | 82 | 1333 | 5342 |
| Hector Garcia-Molina | 1333 | 13 | 19 | 64 | 495 |
| Yehoshua Sagiv | 1288 | 14 | 63 | 357 | 1031 |
| Catriel Beeri | 1273 | 15 | 85 | 383 | 751 |
| Rakesh Agrawal | 1263 | 16 | 24 | 42 | 221 |
| Raghu Ramakrishnan | 1102 | 17 | 33 | 78 | 269 |
| Umeshwar Dayal | 1069 | 18 | 18 | 15 | 91 |
| Franois Bancilhon | 1066 | 19 | 70 | 921 | 2667 |
| Donald D. Chamberlin | 978 | 20 | 87 | 245 | 8083 |
| Christos Faloutsos | 964 | 21 | 7 | 5 | 8 |
| Richard Hull | 962 | 22 | 15 | 231 | 346 |
| Ronald Fagin | 950 | 23 | 53 | 336 | 759 |
| Jennifer Widom | 932 | 24 | 44 | 119 | 1022 |
| Shamkant B. Navathe | 886 | 25 | 42 | 76 | 82 |
| Moshe Y. Vardi | 843 | 26 | 12 | 13 | 17 |
| Stefano Ceri | 842 | 27 | 6 | 31 | 37 |
| Bruce G. Lindsay 0001 | 839 | 28 | 57 | 476 | 1827 |
| Jeffrey F. Naughton | 828 | 29 | 44 | 124 | 1253 |
| Hamid Pirahesh | 818 | 30 | 60 | 550 | 3224 |
| C. Mohan | 813 | 31 | 61 | 400 | 1182 |
| Eugene Wong | 806 | 32 | 87 | 1858 | 4390 |
| Abraham Silberschatz | 797 | 33 | 41 | 71 | 333 |
| Peter P. Chen | 776 | 34 | 81 | 2320 | 2274 |
| Alberto O. Mendelzon | 767 | 35 | 58 | 283 | 972 |
| Nick Roussopoulos | 724 | 36 | 61 | 176 | 606 |
| Alfred V. Aho | 716 | 37 | 71 | 370 | 862 |
| Patrick Valduriez | 715 | 38 | 78 | 378 | 651 |
| Carlo Zaniolo | 704 | 39 | 72 | 489 | 2093 |
| H. V. Jagadish | 692 | 40 | 32 | 48 | 372 |
Table 5.
Top 20 authors based on prestige measures.
| Author Rank | Authors | PageRank | Authors | Eigenvector |
|---|---|---|---|---|
| 1 | Noga Alon | 0.000897 | David Maier | 1 |
| 2 | Wei Wang | 0.000740 | Gerhard Weikum | 0.983821 |
| 3 | Elisa Bertino | 0.000674 | Philip S. Yu | 0.964201 |
| 4 | Thomas S. Huang | 0.000617 | Richard T. Snodgrass | 0.940632 |
| 5 | Xin Li | 0.000587 | Hector Garcia-Molina | 0.911671 |
| 6 | Leonidas J. Guibas | 0.000583 | Jeffrey D. Ullman | 0.904665 |
| 7 | John Mylopoulos | 0.000583 | Laura M. Haas | 0.901954 |
| 8 | Ming Li | 0.000573 | Serge Abiteboul | 0.898823 |
| 9 | Wei Li | 0.000569 | Rakesh Agrawal | 0.876175 |
| 10 | Christos Faloutsos | 0.000566 | Michael Stonebraker | 0.875162 |
| 11 | Philip S. Yu | 0.000548 | Noga Alon | 0.865516 |
| 12 | Jiawei Han | 0.000542 | Stefano Ceri | 0.854511 |
| 13 | Stefano Ceri | 0.000536 | Wei Wang | 0.849239 |
| 14 | Ying Zhang | 0.000535 | Joseph M. Hellerstein | 0.842421 |
| 15 | Gerhard Weikum | 0.000534 | Michael J. Carey | 0.823152 |
| 16 | Jack Dongarra | 0.000522 | Yannis E. Ioannidis | 0.81877 |
| 17 | Serge Abiteboul | 0.000521 | Michael J. Franklin | 0.813585 |
| 18 | David Maier | 0.000515 | Jim Gray | 0.782725 |
| 19 | Kurt Mehlhorn | 0.000515 | David J. DeWitt | 0.762307 |
| 20 | Alberto L. Vincentelli | 0.000513 | Timos K. Sellis | 0.756364 |
Table 6.
Top 40 authors based on the h-index.
| Author | H-Index | Prestige Measures | ||
|---|---|---|---|---|
| Counts | Ranking | PageRank | Eigenvector | |
| Jeffrey D. Ullman | 28 | 1 | 30 | 6 |
| Michael Stonebraker | 27 | 2 | 60 | 10 |
| David J. DeWitt | 24 | 3 | 113 | 19 |
| Philip A. Bernstein | 22 | 4 | 27 | 3 |
| Won Kim | 21 | 5 | 187 | 195 |
| Catriel Beeri | 20 | 6 | 174 | 87 |
| Yehoshua Sagiv | 20 | 6 | 127 | 100 |
| Michael J. Carey | 20 | 6 | 63 | 15 |
| Rakesh Agrawal | 20 | 6 | 56 | 9 |
| Serge Abiteboul | 19 | 10 | 334 | 2896 |
| Nathan Goodman | 19 | 10 | 324 | 854 |
| Umeshwar Dayal | 19 | 10 | 34 | 21 |
| Ronald Fagin | 19 | 10 | 127 | 93 |
| Jim Gray | 18 | 14 | 98 | 18 |
| David Maier | 18 | 14 | 17 | 1 |
| Raghu Ramakrishnan | 18 | 14 | 87 | 24 |
| Hector Garcia-Molina | 18 | 14 | 41 | 5 |
| Christos Faloutsos | 18 | 14 | 9 | 37 |
| Jeffrey F. Naughton | 18 | 14 | 145 | 22 |
| Jennifer Widom | 17 | 20 | 142 | 23 |
| Bruce G. Lindsay | 17 | 20 | 196 | 56 |
| C. Mohan | 17 | 20 | 209 | 153 |
| Shamkant B. Navathe | 16 | 23 | 71 | 260 |
| Hamid Pirahesh | 16 | 23 | 221 | 48 |
| Raymond A. Lorie | 15 | 25 | 323 | 916 |
| Franois Bancilhon | 15 | 25 | 258 | 194 |
| Richard Hull | 15 | 25 | 150 | 200 |
| Alberto O. Mendelzon | 15 | 25 | 198 | 112 |
| Peter Buneman | 15 | 25 | 195 | 138 |
| Carlo Zaniolo | 15 | 25 | 268 | 378 |
| Moshe Y. Vardi | 15 | 25 | 20 | 38 |
| Yannis E. Ioannidis | 15 | 25 | 60 | 16 |
| H. V. Jagadish | 15 | 25 | 86 | 29 |
| Stefano Ceri | 14 | 34 | 12 | 12 |
| Nick Roussopoulos | 14 | 34 | 200 | 125 |
| Abraham Silberschatz | 14 | 34 | 110 | 50 |
| Arie Shoshani | 14 | 34 | 217 | 573 |
| Gio Wiederhold | 14 | 34 | 27 | 26 |
| Eugene Wong | 13 | 39 | 350 | 989 |
| Goetz Graefe | 13 | 39 | 382 | 611 |
Table 7.
Spearman correlation between PageRank, Eigenvector and the h-index.
| Technique | H-Index | PageRank | Eigenvector |
|---|---|---|---|
| H-index | 1 | 0.84 ** | 0.79 ** |
| PageRank | - | 1 | 0.83 ** |
| Eigenvector | - | - | 1 |
** Correlation is significant at the level of 0.01.
Table 8.
Kendall correlation between PageRank, Eigenvector and the h-index.
| Technique | H-Index | PageRank | Eigenvector |
|---|---|---|---|
| H-index | 1 | 0.72 ** | 1.0 ** |
| PageRank | - | 1 | 1.0 ** |
| Eigenvector | - | - | 1 |
** Correlation is significant at the level of 0.01.
Table 9.
OSim between PageRank, Eigenvector and the h-index.
| Technique | H-Index | PageRank | Eigenvector |
|---|---|---|---|
| H-index | 1 | 0.52 | 0.67 |
| PageRank | - | 1 | 0.59 |
| Eigenvector | - | - | 1 |
Table 10.
Spearman correlation between degree, betweenness, closeness and citation count.
| Technique | Citation Count | Degree | Betweenness | Closeness |
|---|---|---|---|---|
| Citation Count | 1 | 0.63 ** | 0.45 ** | 0.59 ** |
| Degree | - | 1 | 0.88 ** | 0.87 ** |
| Betweenness | - | - | 1 | 0.81 ** |
| Closeness | - | - | - | 1 |
** Correlation is significant at the level of 0.01.
Table 11.
Kendall correlation between degree, betweenness, closeness and citation count.
| Technique | Citation Count | Degree | Betweenness | Closeness |
|---|---|---|---|---|
| Citation Count | 1 | 1.0 ** | 0.19 ** | 0.29 ** |
| Degree | - | 1 | 0.72 ** | 1.00 ** |
| Betweenness | - | - | 1 | 0.62 ** |
| Closeness | - | - | - | 1 |
** Correlation is significant at the level of 0.01.
Table 12.
OSim between degree, betweenness, closeness and citation count.
| Technique | Citation Count | Degree | Betweenness | Closeness |
|---|---|---|---|---|
| Citation Count | 1 | 0.63 | 0.40 | 0.53 |
| Degree | - | 1 | 0.66 | 0.75 |
| Betweenness | - | - | 1 | 0.55 |
| Closeness | - | - | - | 1 |
© 2018 by the authors. Licensee MDPI, Basel, Switzerland. This article is an open access article distributed under the terms and conditions of the Creative Commons Attribution (CC BY) license (http://creativecommons.org/licenses/by/4.0/).
Share and Cite
MDPI and ACS Style
Bibi, F.; Khan, H.U.; Iqbal, T.; Farooq, M.; Mehmood, I.; Nam, Y. Ranking Authors in an Academic Network Using Social Network Measures. Appl. Sci. 2018, 8, 1824. https://doi.org/10.3390/app8101824
AMA Style
Bibi F, Khan HU, Iqbal T, Farooq M, Mehmood I, Nam Y. Ranking Authors in an Academic Network Using Social Network Measures. Applied Sciences. 2018; 8(10):1824. https://doi.org/10.3390/app8101824
Chicago/Turabian StyleBibi, Fizza, Hikmat Ullah Khan, Tassawar Iqbal, Muhammad Farooq, Irfan Mehmood, and Yunyoung Nam. 2018. "Ranking Authors in an Academic Network Using Social Network Measures" Applied Sciences 8, no. 10: 1824. https://doi.org/10.3390/app8101824
Note that from the first issue of 2016, this journal uses article numbers instead of page numbers. See further details here.