Seismic b-Value for Foreshock AE Events Preceding Repeated Stick-Slips of Pre-Cut Faults in Granite


1
Geological Survey of Japan, National Institute of Advanced Industrial Science and Technology, AIST Central #7, Higashi 1-1-1, Tsukuba, Ibaraki 305-8567, Japan
2
State Key Laboratory of Earthquake Dynamics, Institute of Geology, China Earthquake Administration, Beijing 100029, China
*
Author to whom correspondence should be addressed.
Appl. Sci. 2018, 8(12), 2361; https://doi.org/10.3390/app8122361
Submission received: 11 October 2018
/
Revised: 9 November 2018
/
Accepted: 20 November 2018
/
Published: 23 November 2018
(This article belongs to the Special Issue Application of Acoustic Emission (AE) on Rock Samples)
Abstract
:In this study, the b-values for acoustic emission (AE) events during stick-slip cycles of pre-cut faults in granite (as an analogue of unfavorably oriented immature faults) under triaxial compression (confining pressure: 40 MPa) are investigated. Using a multi-channel AE waveform recording system and two peak detectors, we recorded AE waveforms at 16 bits and at a sampling rate of 25 MHz, as well as the maximum amplitude of AE events with a dynamic range of 55 dB. For stick-slip events, the b-value decreases from 1.2 to 1.5 to approximately 0.6 as the shear stress increases, and then quickly jumps back to 1.0 to 1.3 immediately prior to the dynamic stress drop. The minimum b-value coincides with the maximum event rate and a stress level of 70 to 95% of the shear strength. It is also observed that the AE activity during each cycle was linked with the pre-failure fault slip, which accounts for 30% of the dynamic slip. Our results on b-value evaluation preceding repeated stick-slips can be used as an indicator of the degree of fault maturity and shear stress acting on the fault, which is important in seismic hazard assessment and earthquake prediction, especially for the injection-induced seismicity for fields in which reactivated shear rupture of unfavorable and immature faults or tensile fractures is important.
1. Introduction
Reactivation of pre-existing immature and/or unfavorably oriented faults is an important issue in earthquake seismology, particularly in cases of seismicity induced by fluid injection or extraction in applications such as enhanced geothermal systems, shale gas fracking, nonconventional oil/gas production, and sequestration of CO2 and other fluid wastes into deep formations [1,2]. The conditions for shear rupturing along favorably oriented (easiest to be reactivated under the present-day regional stress environment) and well-developed faults (weakened by fault gauges and smooth fault surfaces) provides the lower limiting bound to overpressures, which is a key parameter in the design and management of injection applications. In geothermally active areas, earthquakes that occurred on unfavorably oriented faults are considered to be evidence of over-pressurized fluids and have attracted increasing attention (e.g., [3,4,5,6]). At the same time, immature and/or unfavorably oriented faults, especially those distributed in sedimentary formations, are also important because such faults are locked and show very low levels of background seismicity, but might be reactivated due to man-made local pore pressure and stress changes [2]. Much more attention should be paid to such faults in geomechanical analyses and risk assessments of related applications.
Acoustic emission (AE) events have been observed during frictional sliding on pre-cut faults in laboratory rock specimens. In addition to rock blocks, the roughness of the fault surface, geometric features (bend and orientation) of the fault, gouge, and loading speed have been investigated [7,8,9]. Variations in b-value during stress buildup and release were observed in laboratory-created fault zones [10]. In a very recent study, the temporal evolution of the seismic b-value during stable and unstable frictional sliding experiments on layers of glass beads in a double-direct shear configuration was investigated [11]. Thus far, AE activity related to the stick-slip of unfavorably oriented faults has not been systematically investigated in the laboratory. The authors, therefore, carried out AE studies using rock specimens containing artificially pre-cut faults as well as naturally created faults in well-controlled laboratory conditions [12]. In the present study, stick-slip tests were performed on a rough fault pre-cut at 45° in granitic specimens. Such a fault can be considered to be an analogue of unfavorably orientated immature faults.
2. Specimens and Experimental Setup
This paper focus on the results of three experiments conducted on intact (SA) or pre-cut (S1 and S2) cylindrical specimens 50 mm in diameter and 125 mm in length. These specimens were cored from a single granite block. The rock block is a homogeneous and fine-grained granite, which shows very weak anisotropy and low density of pre-existing microcracks [12]. The pre-cut surface had an angle of 45° with respect to the axis, which is the direction of the greatest principal stress under the experimental conditions. All specimens were naturally dried under ambient conditions. The fine-grained granite had a relatively low density of pre-existing microcracks, as indicated by the high P-wave velocity of approximately 6.0 km/s. The results for an intact specimen were used for reference and for estimating fault slip in the pre-cut specimens. The typical range for the frictional coefficient for faults in the upper crust is 0.6 to 0.75. The early results of the present study, including data for specimens pre-cut at 50°, showed that the friction coefficient for the pre-cut faults in the granite specimens does not depend on the fault angle, but drops from approximately 0.75 to 0.6 after a few stick-slip iterations [12], and falls within the typical range in the upper crust. Based on the Mohr–Coulomb failure criteria, the optimal angle between the fault plane and the maximum principal stress axis is approximately 25°–30°. The primary results show that the pre-cut faults in our test specimens were deemed to be unfavorably oriented, and their friction strength is expected to be 50% greater than that for an optimally oriented fault [12].
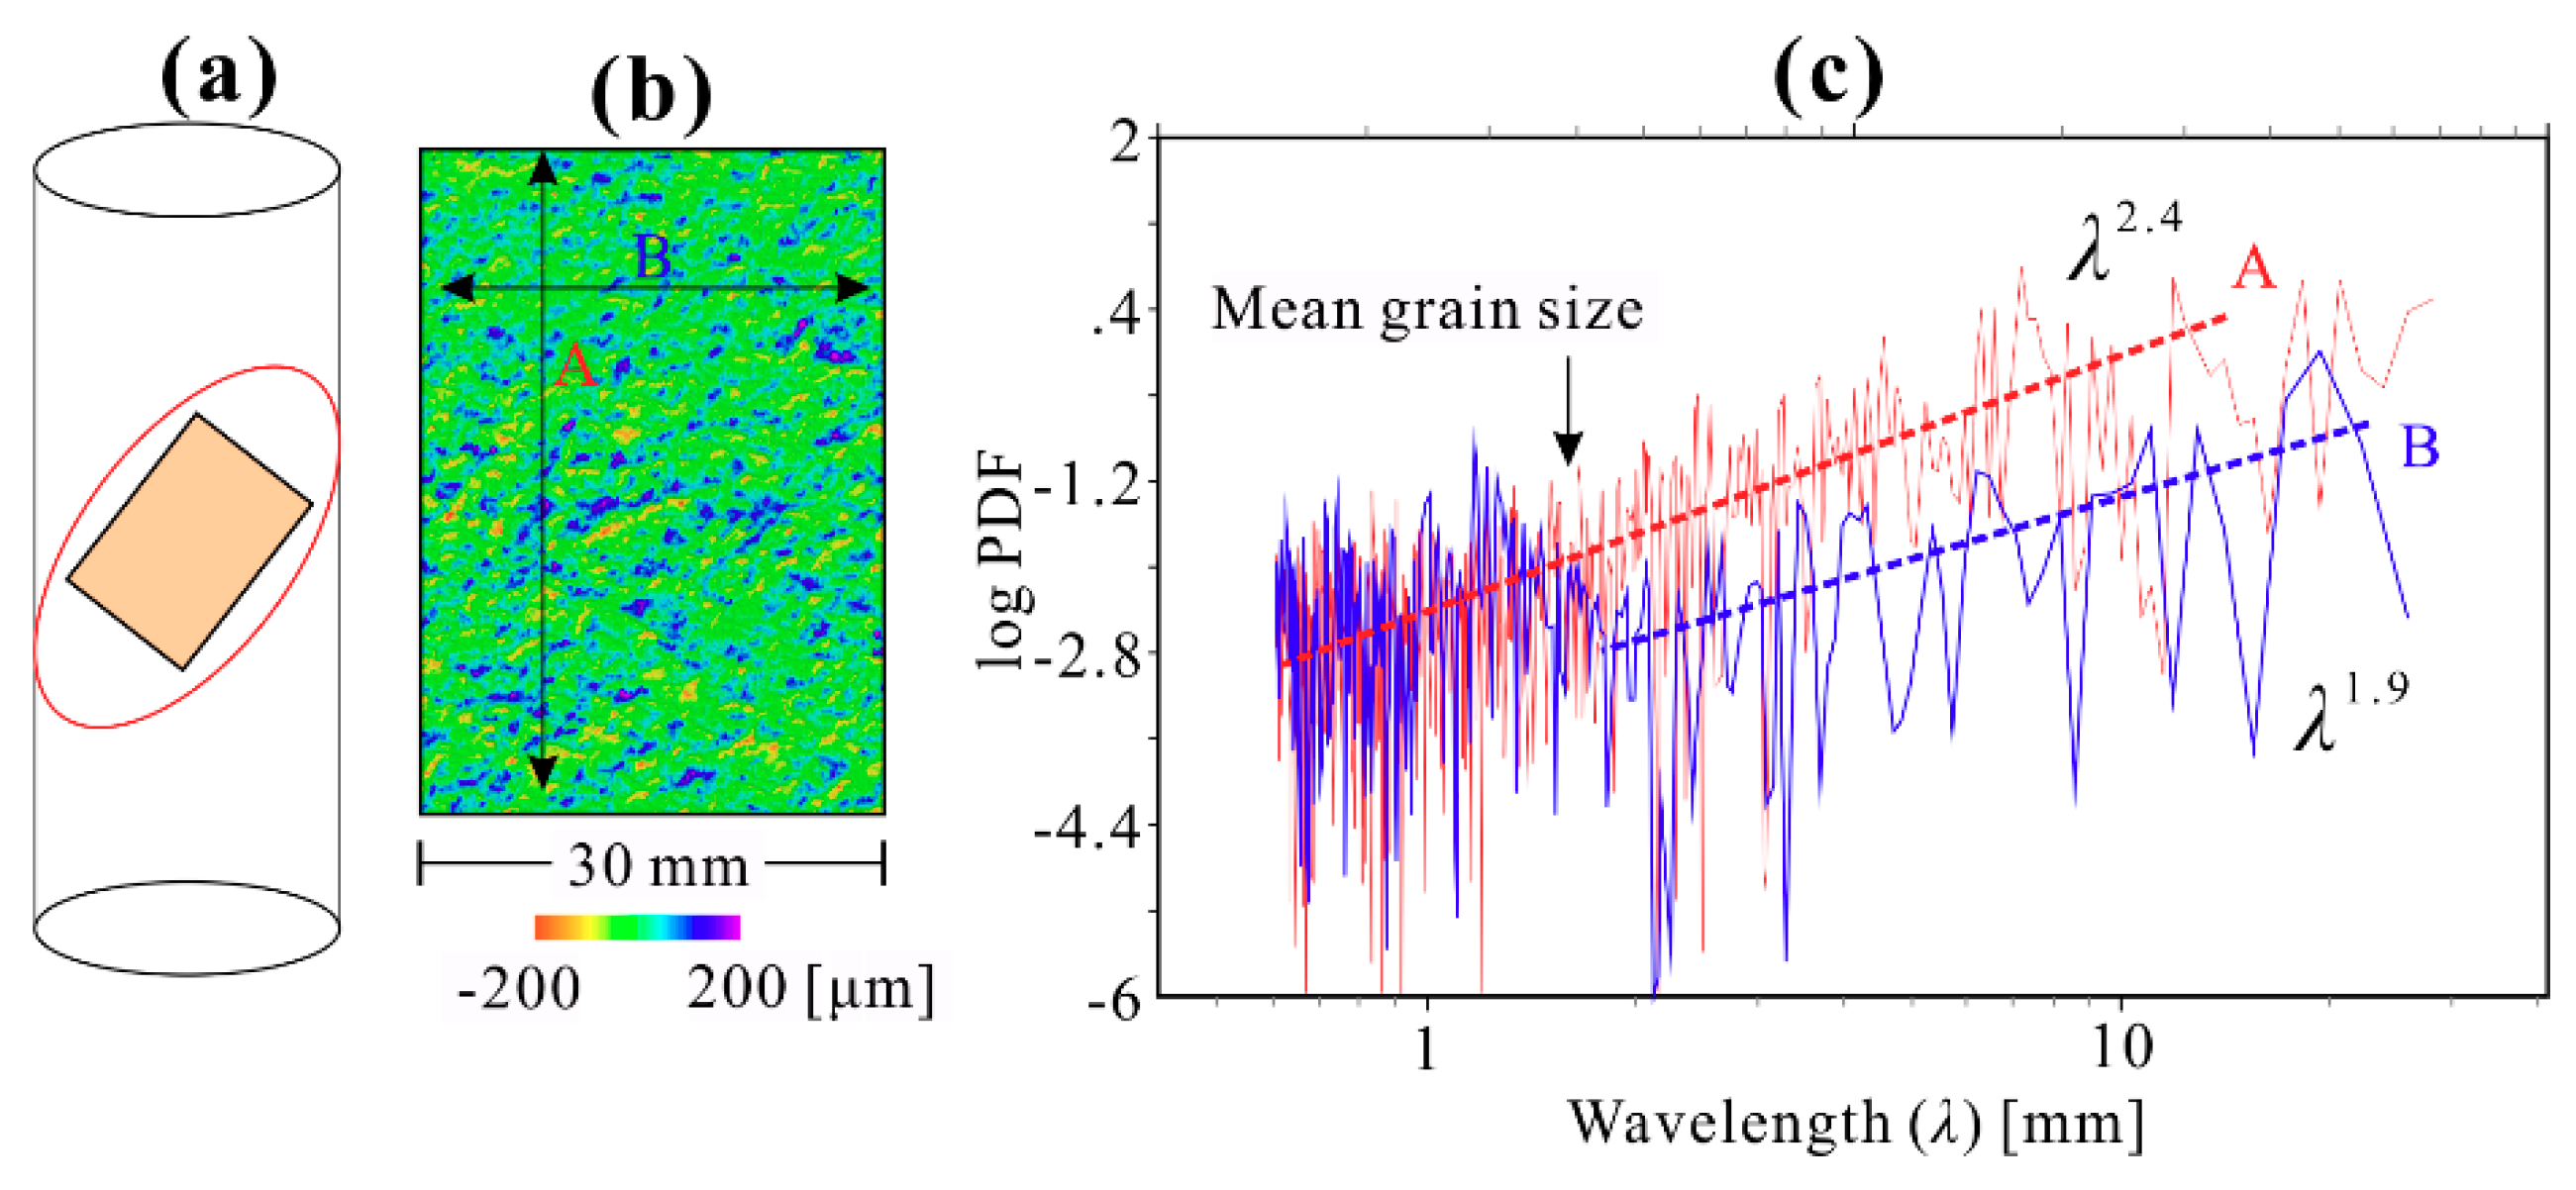
The roughness of the pre-cut surfaces was measured using a laser scanner. As shown in Figure 1, the power spectral density function follows a power law: . Thus, the generalized Hurst exponent (H, [0, 1]) and the fractal dimension (D) can be determined, because these parameters are correlated with each other: β = 2H + 1 and D = d + 1 − H. The estimated fractal dimension along the dip direction (slip direction during the experiment) was 1.30, and that for strike direction was 1.55. Since the fractal features of the fault surface are key to the similarity (scale independence) between faults of different size, the pre-cut specimens used in the present study can be considered to be an analogue of natural faults.
The loading and AE monitoring systems used in the present study were similar to those used in previous studies [13]. First, specimens were hydrostatically compressed by gradually increasing the confining pressure to 40 MPa. The axial load was then increased at a rate of 10 MPa/min, while the confining pressure was kept constant. In our loading system, the axial force is balanced by a spring, which is simply compressed by a stepping motor. After a stress drop, the force of the spring does not change, so the reloading speed is very fast (5.5 MPa/s), and the time interval between two consecutive stick-slip events is a few tens of seconds. Thus, time-dependent healing can be ignored.
3. AE Data and Methods
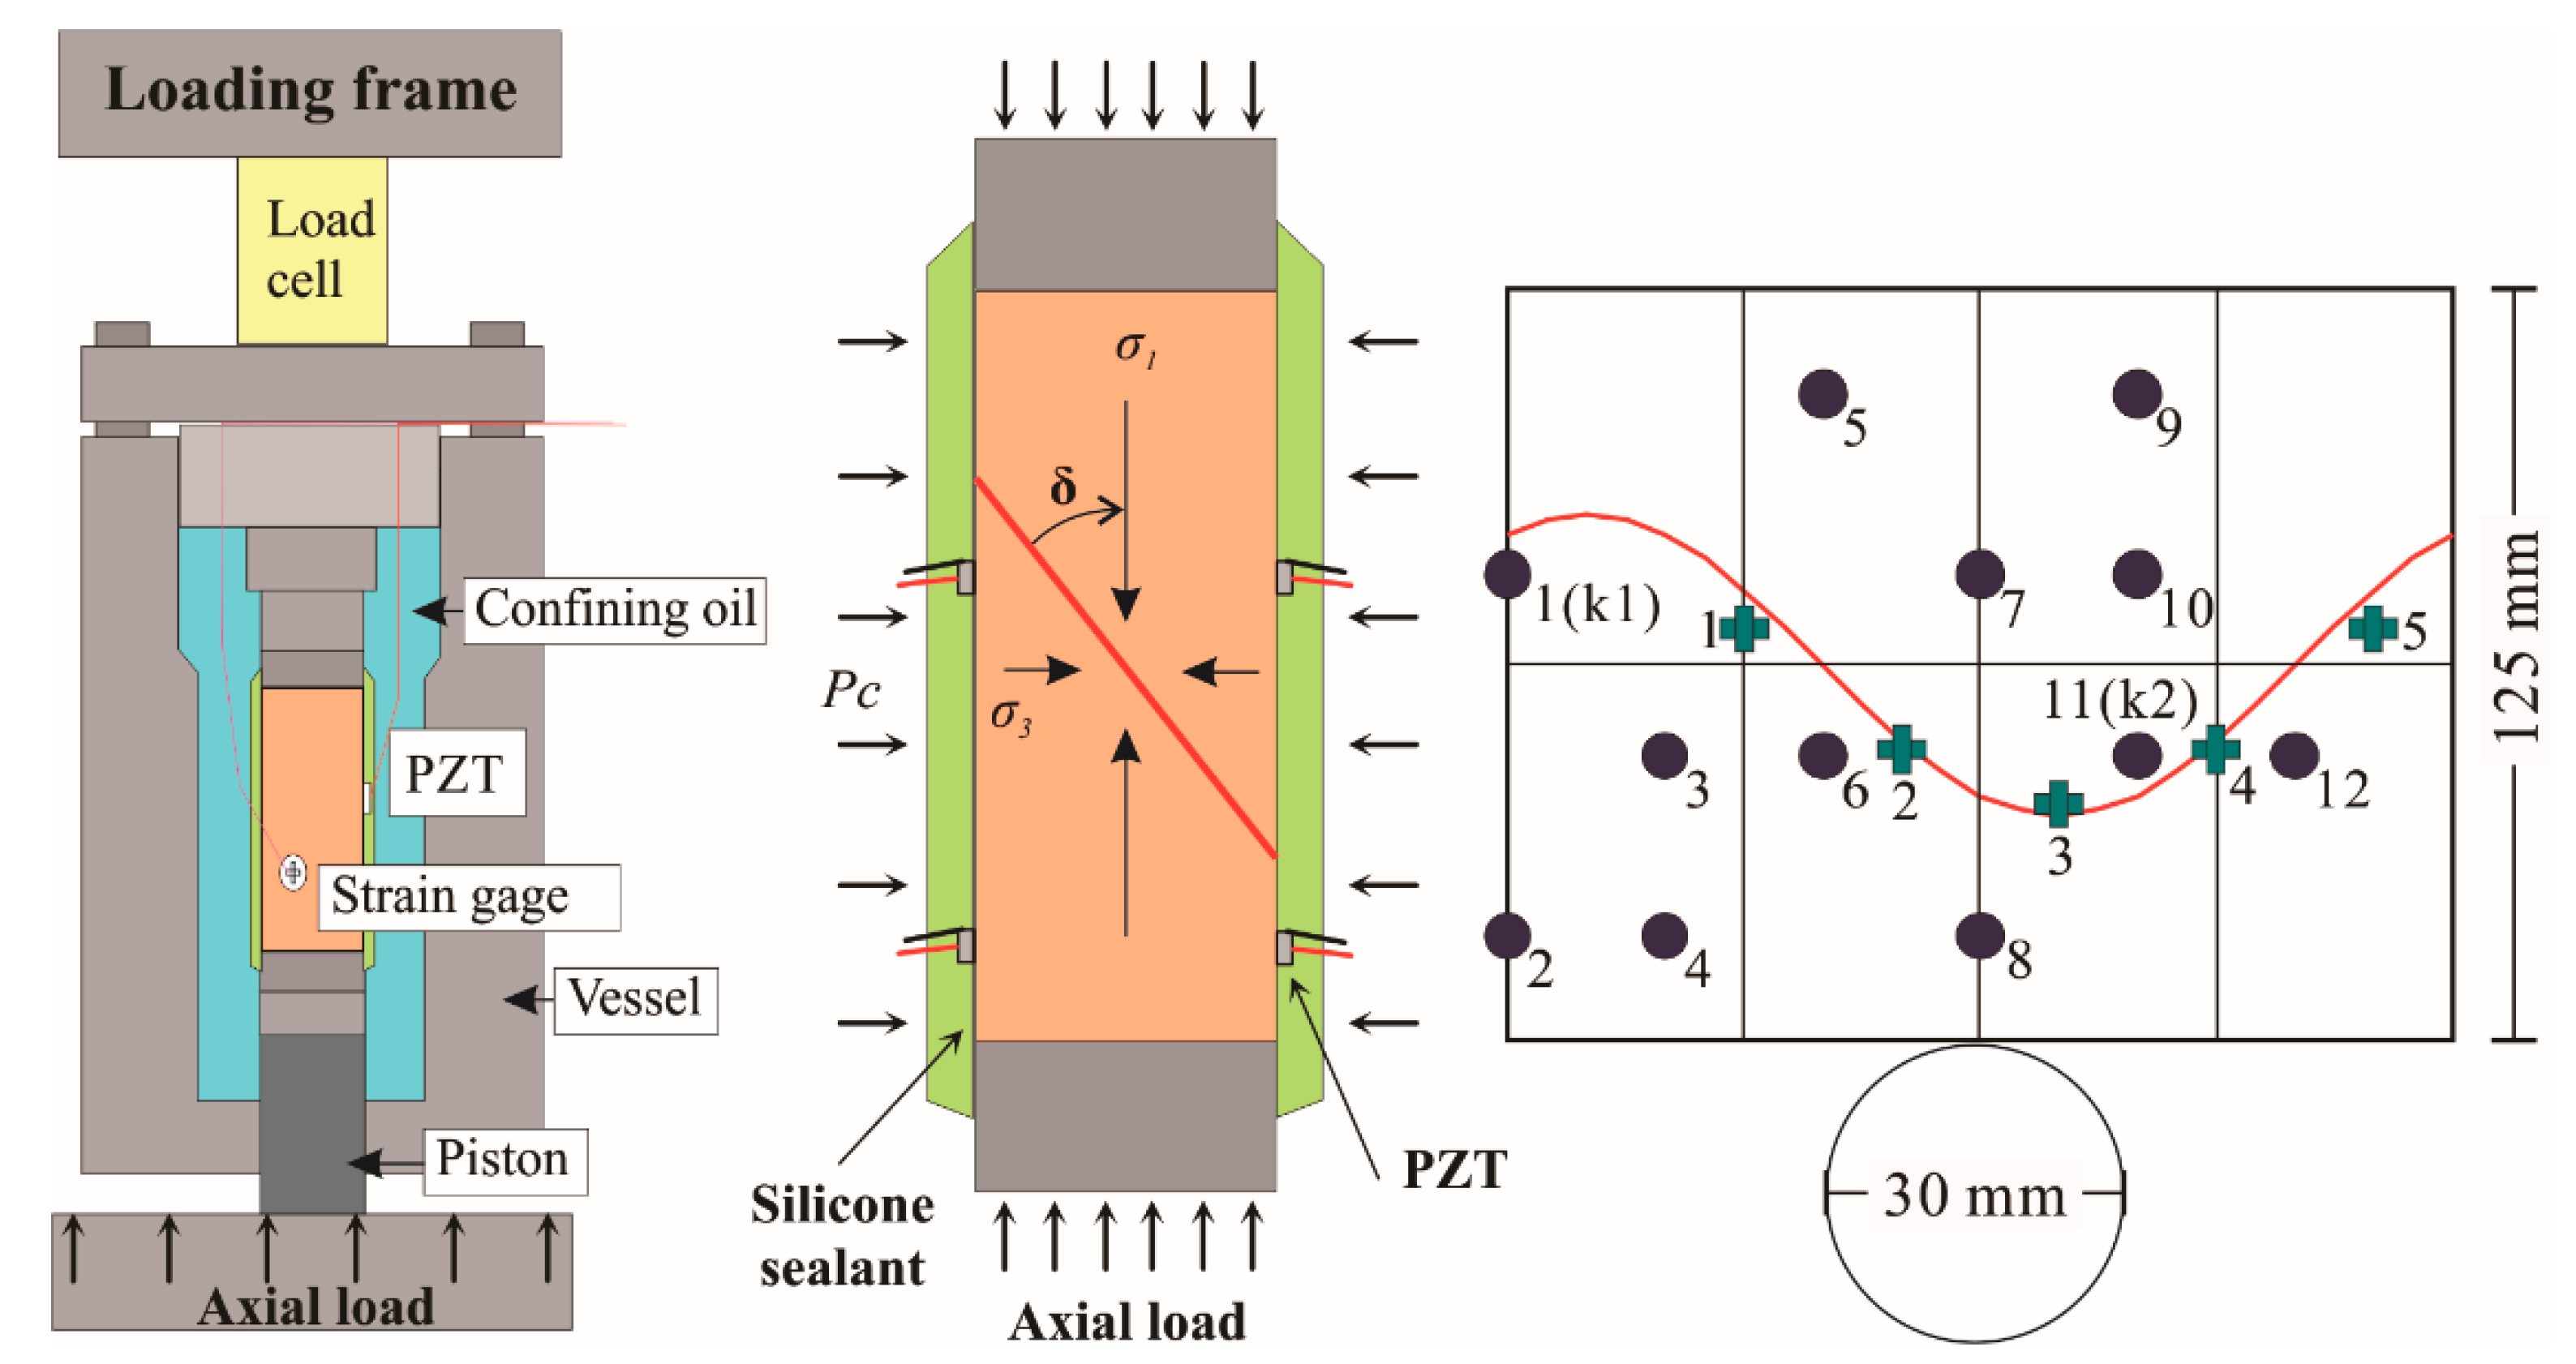
In order to record ultrasonic signals radiating from microcracking and stick-slip events, and as a pulse source for performing velocity measurements, 12 piezoelectric transducers (PZT) (diameter: 5 mm, resonant frequency: 2 MHz) were mounted on the curvilinear surface of the specimen using epoxy agent (Figure 2). The specimen and two end pieces were coated with silicone sealant to prevent confining oil from leaking into the specimen. The specimens can handle a total shear displacement of approximately 2 mm, which is sufficient for up to approximately 20 stick-slip events. Our new waveform recorder has 24 A/D channels with a sampling rate of up to 100 MHz, a dynamic range of 16 bits, and 256 mega words of onboard memory for each channel. In the present study, the AE signal from each sensor is pre-amplified by 40 dB and then digitized at a sampling rate of 25 MHz and a sample length of 4096 points (approximately 160 microseconds), including 1600 points of pre-trigger data.
The maximum amplitudes of AE signals from two selected sensors, which were mounted on the central surface of the specimen (indicated as k1 and k2 in Figure 2), were recorded by the peak detectors after a pre-amplifier of 20 dB. The noise level for AE signals is approximately 40 dB or less after applying the 20 dB pre-amplifiers. Thus, the threshold for the peak detectors was set at 45 dB, yielding an effective dynamic range of 55 dB (=100 − 45 dB). Based on the definition of the body-wave earthquake magnitude, the magnitude (M) of an AE event is determined according to the log of the maximum amplitude (Amax) of the AE signal (it is somewhat reflecting the vibration velocity of the elastic wave [13]), as follows:
where A0 is the threshold for detection, and M0 is a constant (approximately −10, in our system) for converting the obtained value to a magnitude that is roughly comparable with the magnitude of an earthquake. Normally, M0 = 0 is used, and Equation (1) yields a relative magnitude that can be used for calculation of seismic b-values in the Gutenberg-Richter magnitude-frequency relation.
where N is the number of events of magnitude M or greater, and a and b are constants. In order to investigate the temporal evolution of the b-value, we calculated b-values using both the maximum likelihood method for a running window of an equal number of events (n) with a running step of n/4 events (75% overlap). The approximate standard error of the b-value estimation is . A larger window size results in smoother evolution of the b-value. In the present study, n = 1000 was used for a long-term view, while n = 250 was used to explore b-value variation for each stick-slip event. We performed this analysis using various values of n and found that n = 250 was a good choice for exploring the details of b-value evolution with sufficiently small errors. Due to attenuation, some small events could be recorded by only one peak detector close to the AE hypocenter. As a result, the number of events counted by two detectors could be different. However, we confirmed that the two datasets yielded consistent results for the temporal variation of the b-value [7].
Waveform data were recorded for the purposes of hypocenter determination and source mechanism solution, which require clear first motion at more than four sensors. Hence, we designed a complex triggering logic for the waveform recording system. First, three pairs of sensors were selected as triggering sensors. Signals from the triggering sensors were fed to a trigger unit. An OR logic was used within each pair, and an AND logic was used among the three pairs. In order to avoid biased triggering, the three pairs were required to be homogeneously distributed on the specimen surface. The triggering threshold level, which is normally approximately 10 times higher than that for the peak detector, was determined. As a result, the AE hypocenter data constituted a subset of relatively large events among the AE count data. The higher threshold and complex triggering configuration ensured that AE events were collected without significant bias throughout the specimen space.
Axial load and strain data were digitized at a sampling rate up to 10 KHz. While confining pressure, which was kept constant during the experiments, was recorded at 5 Hz. Both shear stress (τ) and normal stress (σ) can be calculated from axial stress and confining pressure. Hence, an apparent frictional coefficient (μ = τ/σ) could be estimated from the shear stress and normal stress. The obtained coefficient was considered as either static or dynamic ones according to the slip velocity of the fault. The axial shortening of the specimen was estimated from piston displacement and was calibrated using the elastic portion of the mean axial strain. Since the results for the intact specimen were used for the calculation of elastic shorting, it is possible to make rough fault slip in the pre-cut specimens.
4. Results
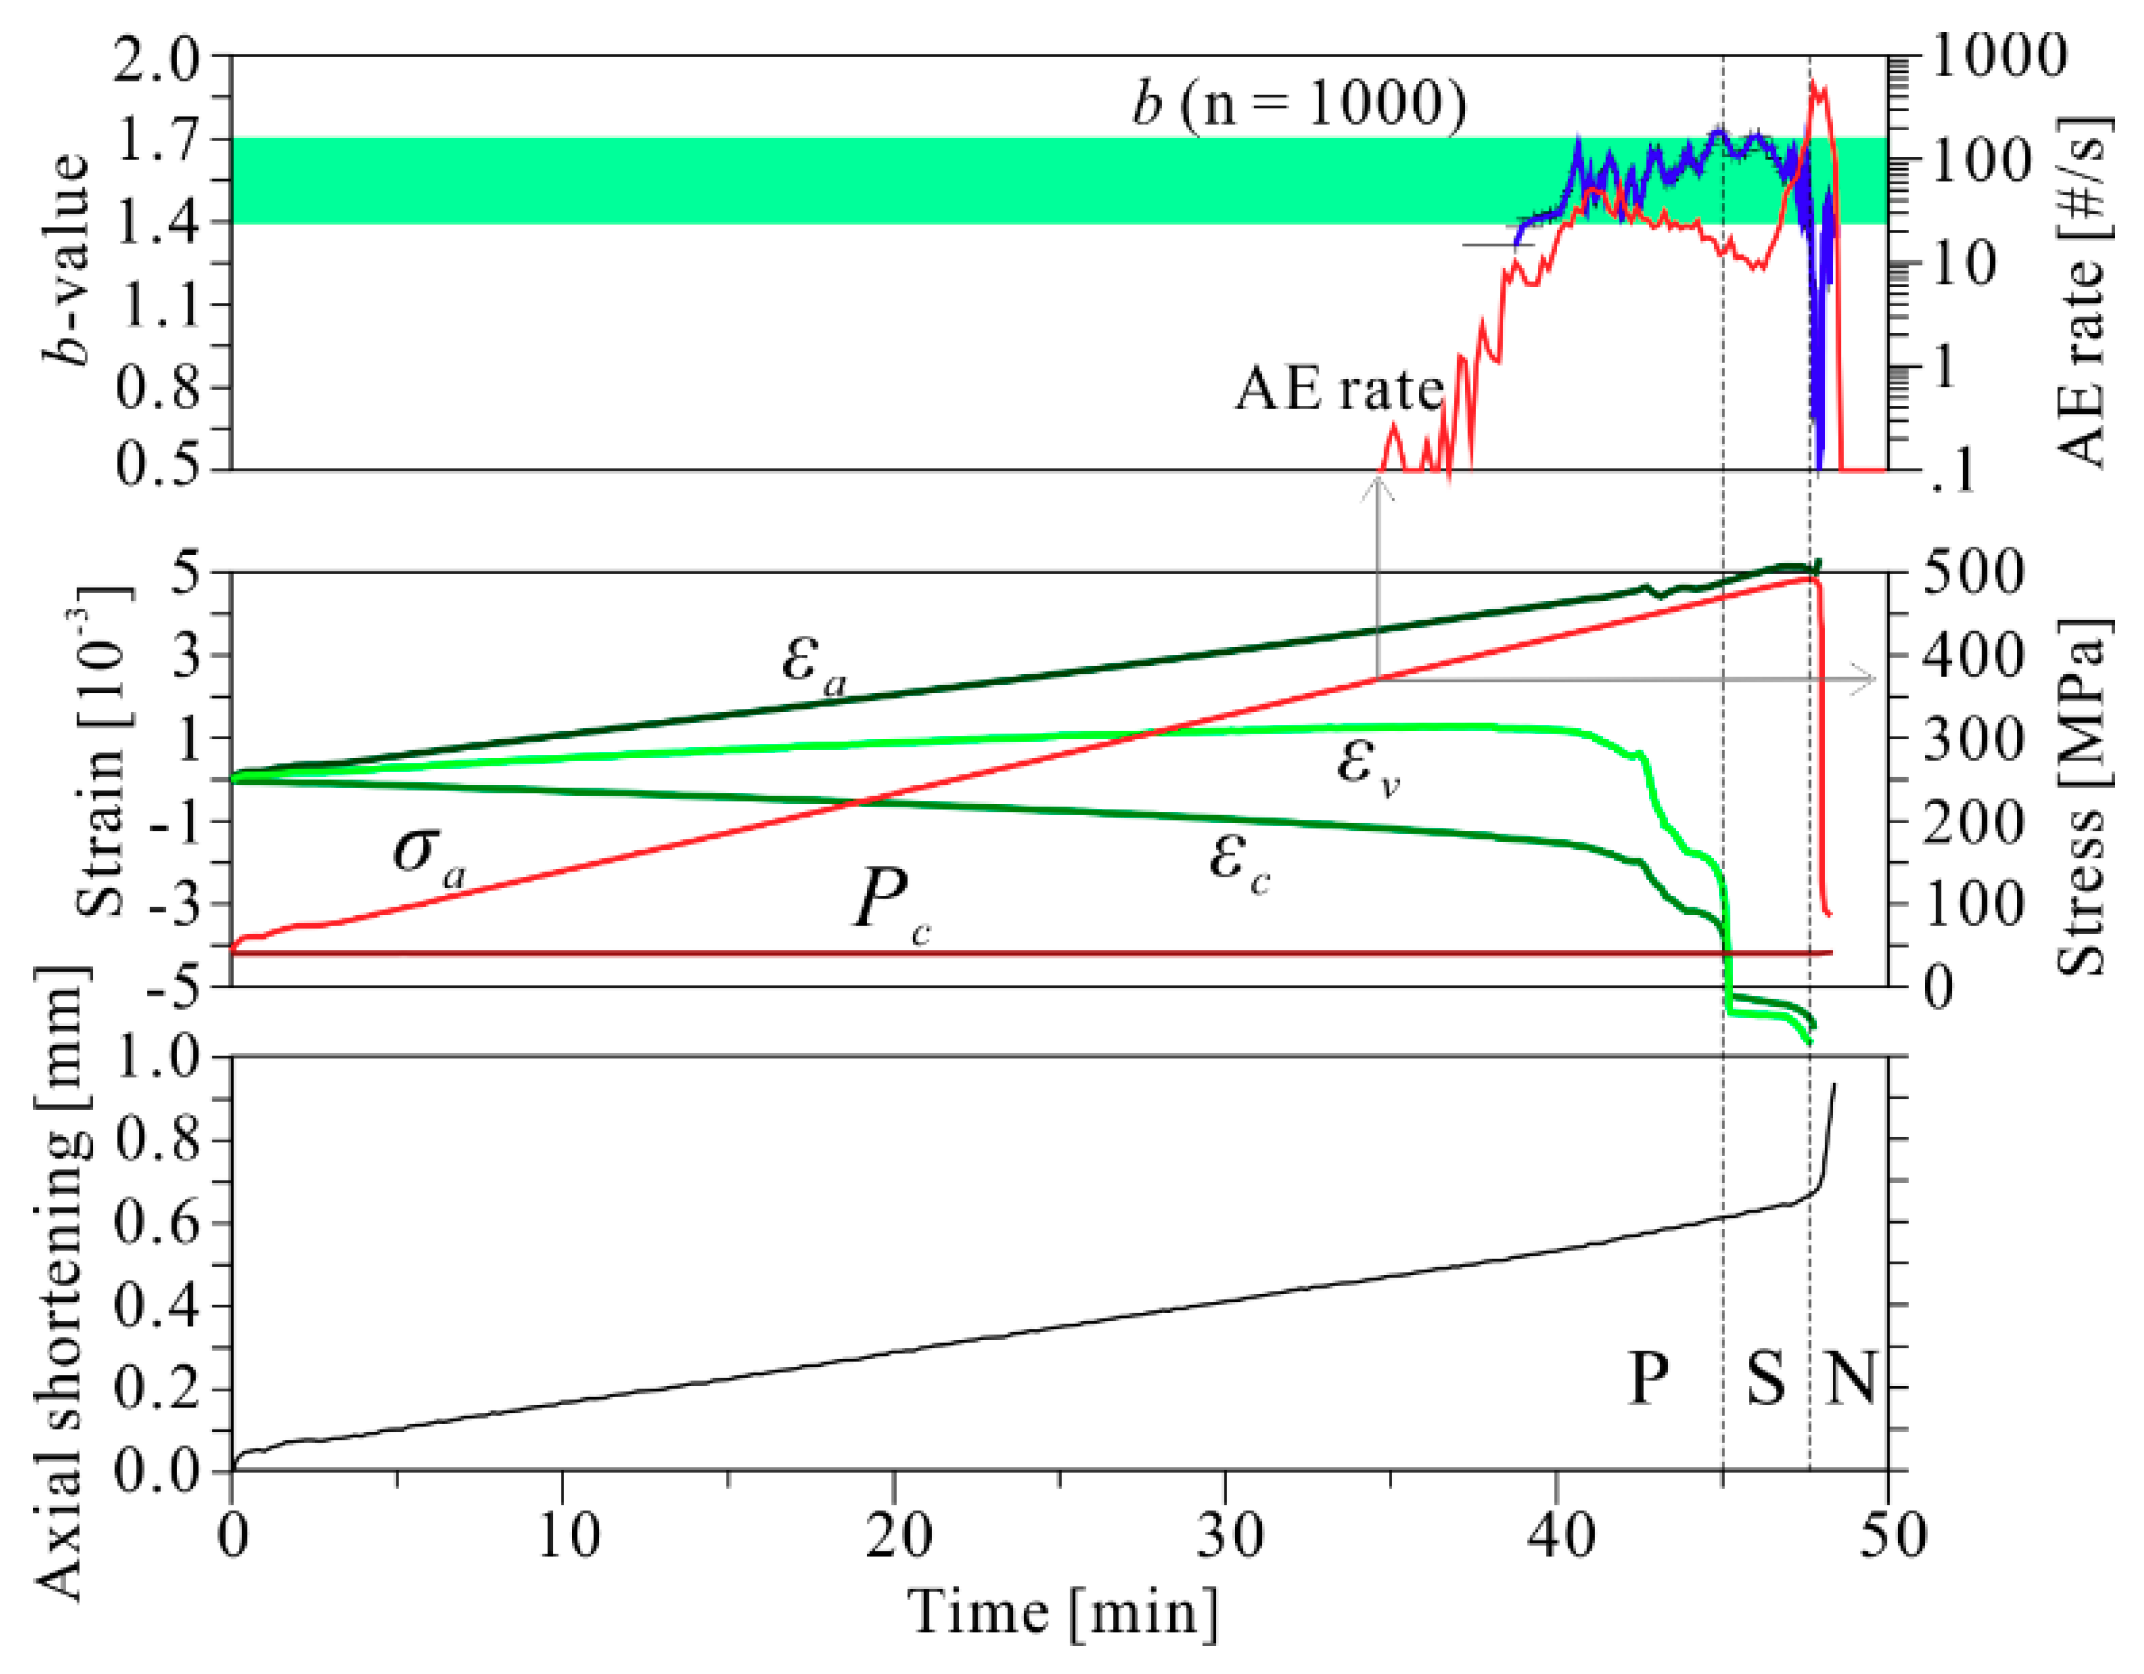
As in previous studies [13], the b-value, event rate, and strain data for the intact specimen (SA) had three distinct phases: the primary, secondary, and nucleation phases (indicated by P, S, and N, respectively in Figure 3). The b-values were estimated using the maximum likelihood method for a running window of 1000 events with a step of 256 events. Acoustic emission rates were calculated for every 10 s. Axial, circumferential, and volumetric strains were obtained as the average of data recorded by six pairs of stain gauges, glued directly onto the surface of the specimen. The axial shortening of the specimen was estimated from piston displacement and was calibrated using the elastic portion of the mean axial strain. Acoustic emission activity was initiated when the axial stress reached 75% (approximately 370 MPa) of the failure strength (495 MPa). The AE initiation also coincides with the start of dilatation, as indicated by the mean volumetric strain. In the primary phase, the b-values increase with increasing stress from approximately 1.4 to 1.7 and then decrease during the secondary phase from approximately 1.7 to 1.0. Finally, the b-values drop quickly to approximately 0.5 during the nucleation phase and grow quickly during the final failure stage.
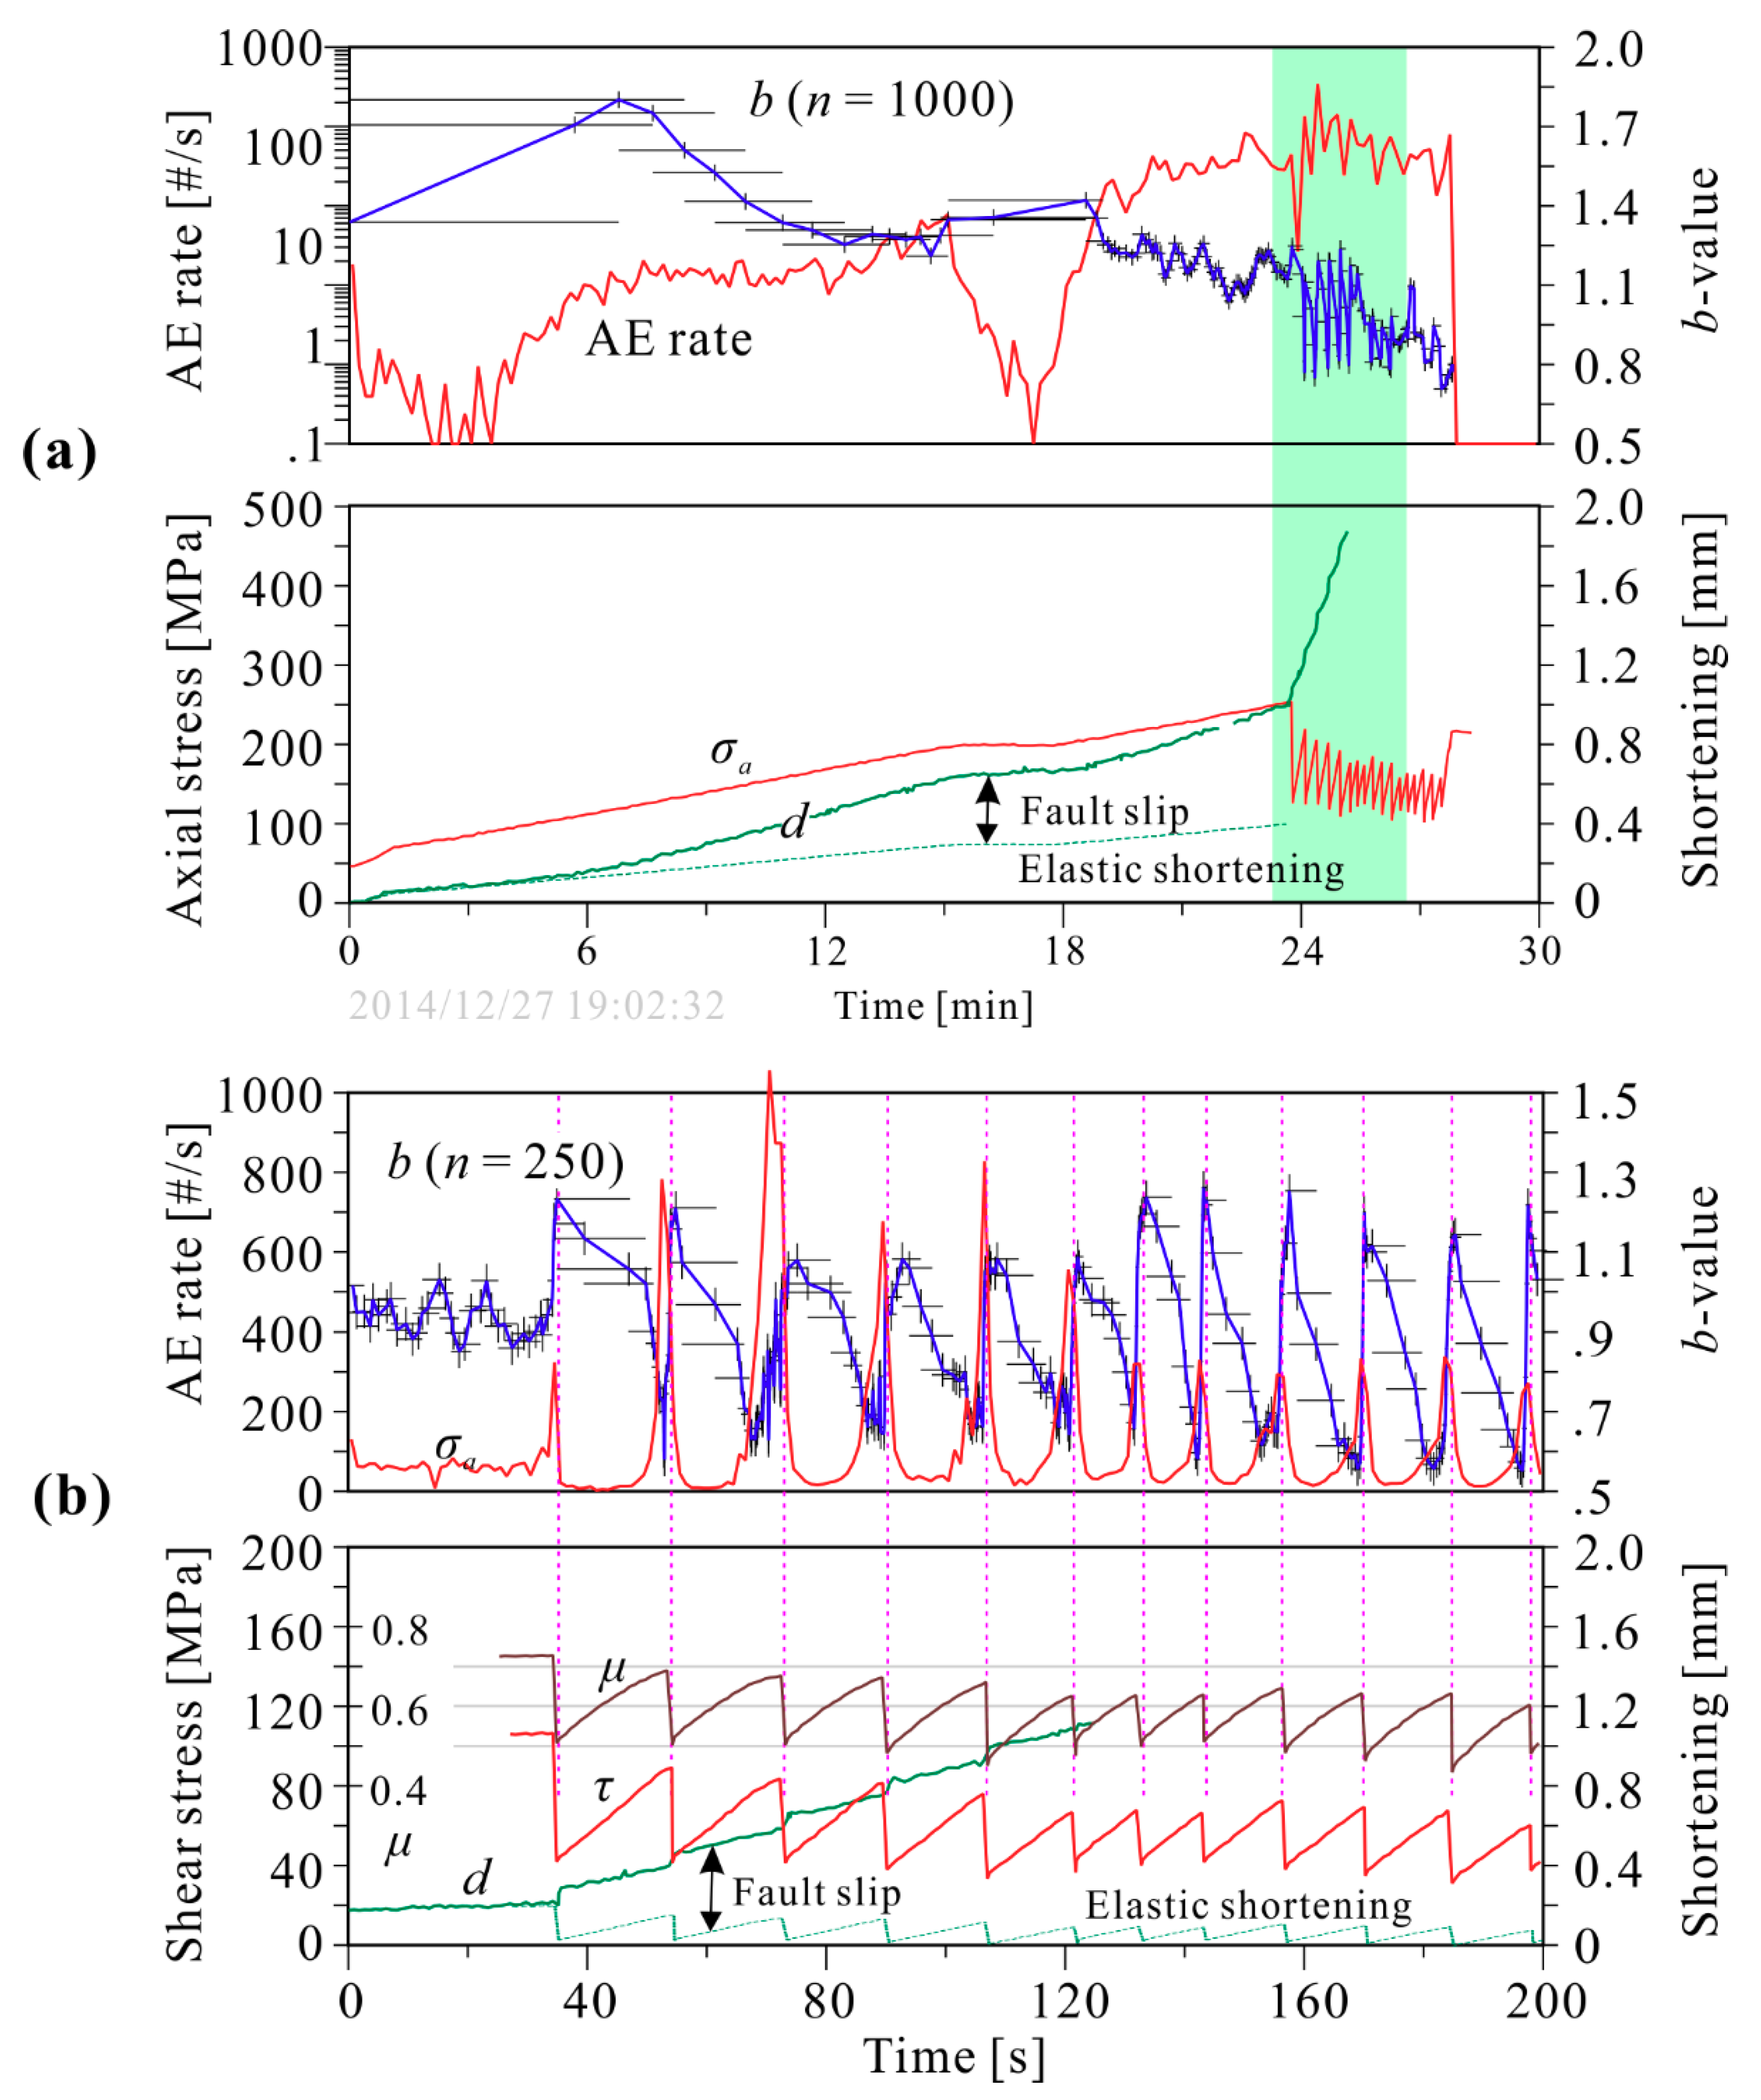
Overall, the results for the pre-cut specimens (S1 and S2) were similar. Experiment S1 were stopped after 7 stick-slip events due to leakage of confining oil into the pre-cut fault. In this paper, we thus mainly focus on results of experiment S2, in which 18 stick-slip events were recorded. As shown in Figure 4, AE activity was initiated at a very low differential stress level. In fact, some events were observed during the hydrostatic loading stage. In addition, the maximum axial stress was 210 MPa, which was less than 60% of the stress level (approximately 370 MPa) at which AE activity was initiated in the intact specimen, as described above. Since both the shear and normal stress acting on the fault surface could be calculated, we therefore estimated the static and dynamic frictional coefficients [12]. During the dynamic stress drop associated with the first stick-slip event, the static and dynamic frictional coefficients were 0.75 and 0.5, respectively (Figure 4b). With increasing axial stress, the seismic b-value gradually decreased from approximately 1.8 to 1.0 prior to the first stick-slip event. We estimated the slip along the fault from sample shortening and elastic strain data. Prior to the first stick-slip, the fault had statically or quasi-statically slipped approximately 0.6 mm (Figure 4a). Since the initiation of the fault slip coincides with the initiation of the AE activity, and the AE event rate increases continuously with increasing fault slip, we concluded that the AE activity and the pre-failure fault slip were coupled with each other.
Following the first stick-slip, 17 stick-slip events were observed (Figure 4b). The experimental results indicate that the static frictional coefficients decreased from the maximum value prior to the first stick-slip event to a stable mean value of approximately 0.6 after several stick-slip events, while the dynamic frictional coefficient fluctuated between 0.45 and 0.52. After each stick-slip event, there was a quiescent period with a relatively low AE event rate. When the shear stress reached 50 to 90% of the shear strength, the AE event rate increased rapidly and reached a maximum value immediately before the onset of the next dynamic slip (Figure 5). In total, the number of AE events per stick-slip cycle exhibits a tendency to gradually decrease as the number of stick-slips events increases. The mean value of the dynamic fault slip is approximately 0.12 mm, while the pre-failure static slip is approximately 0.04 mm.
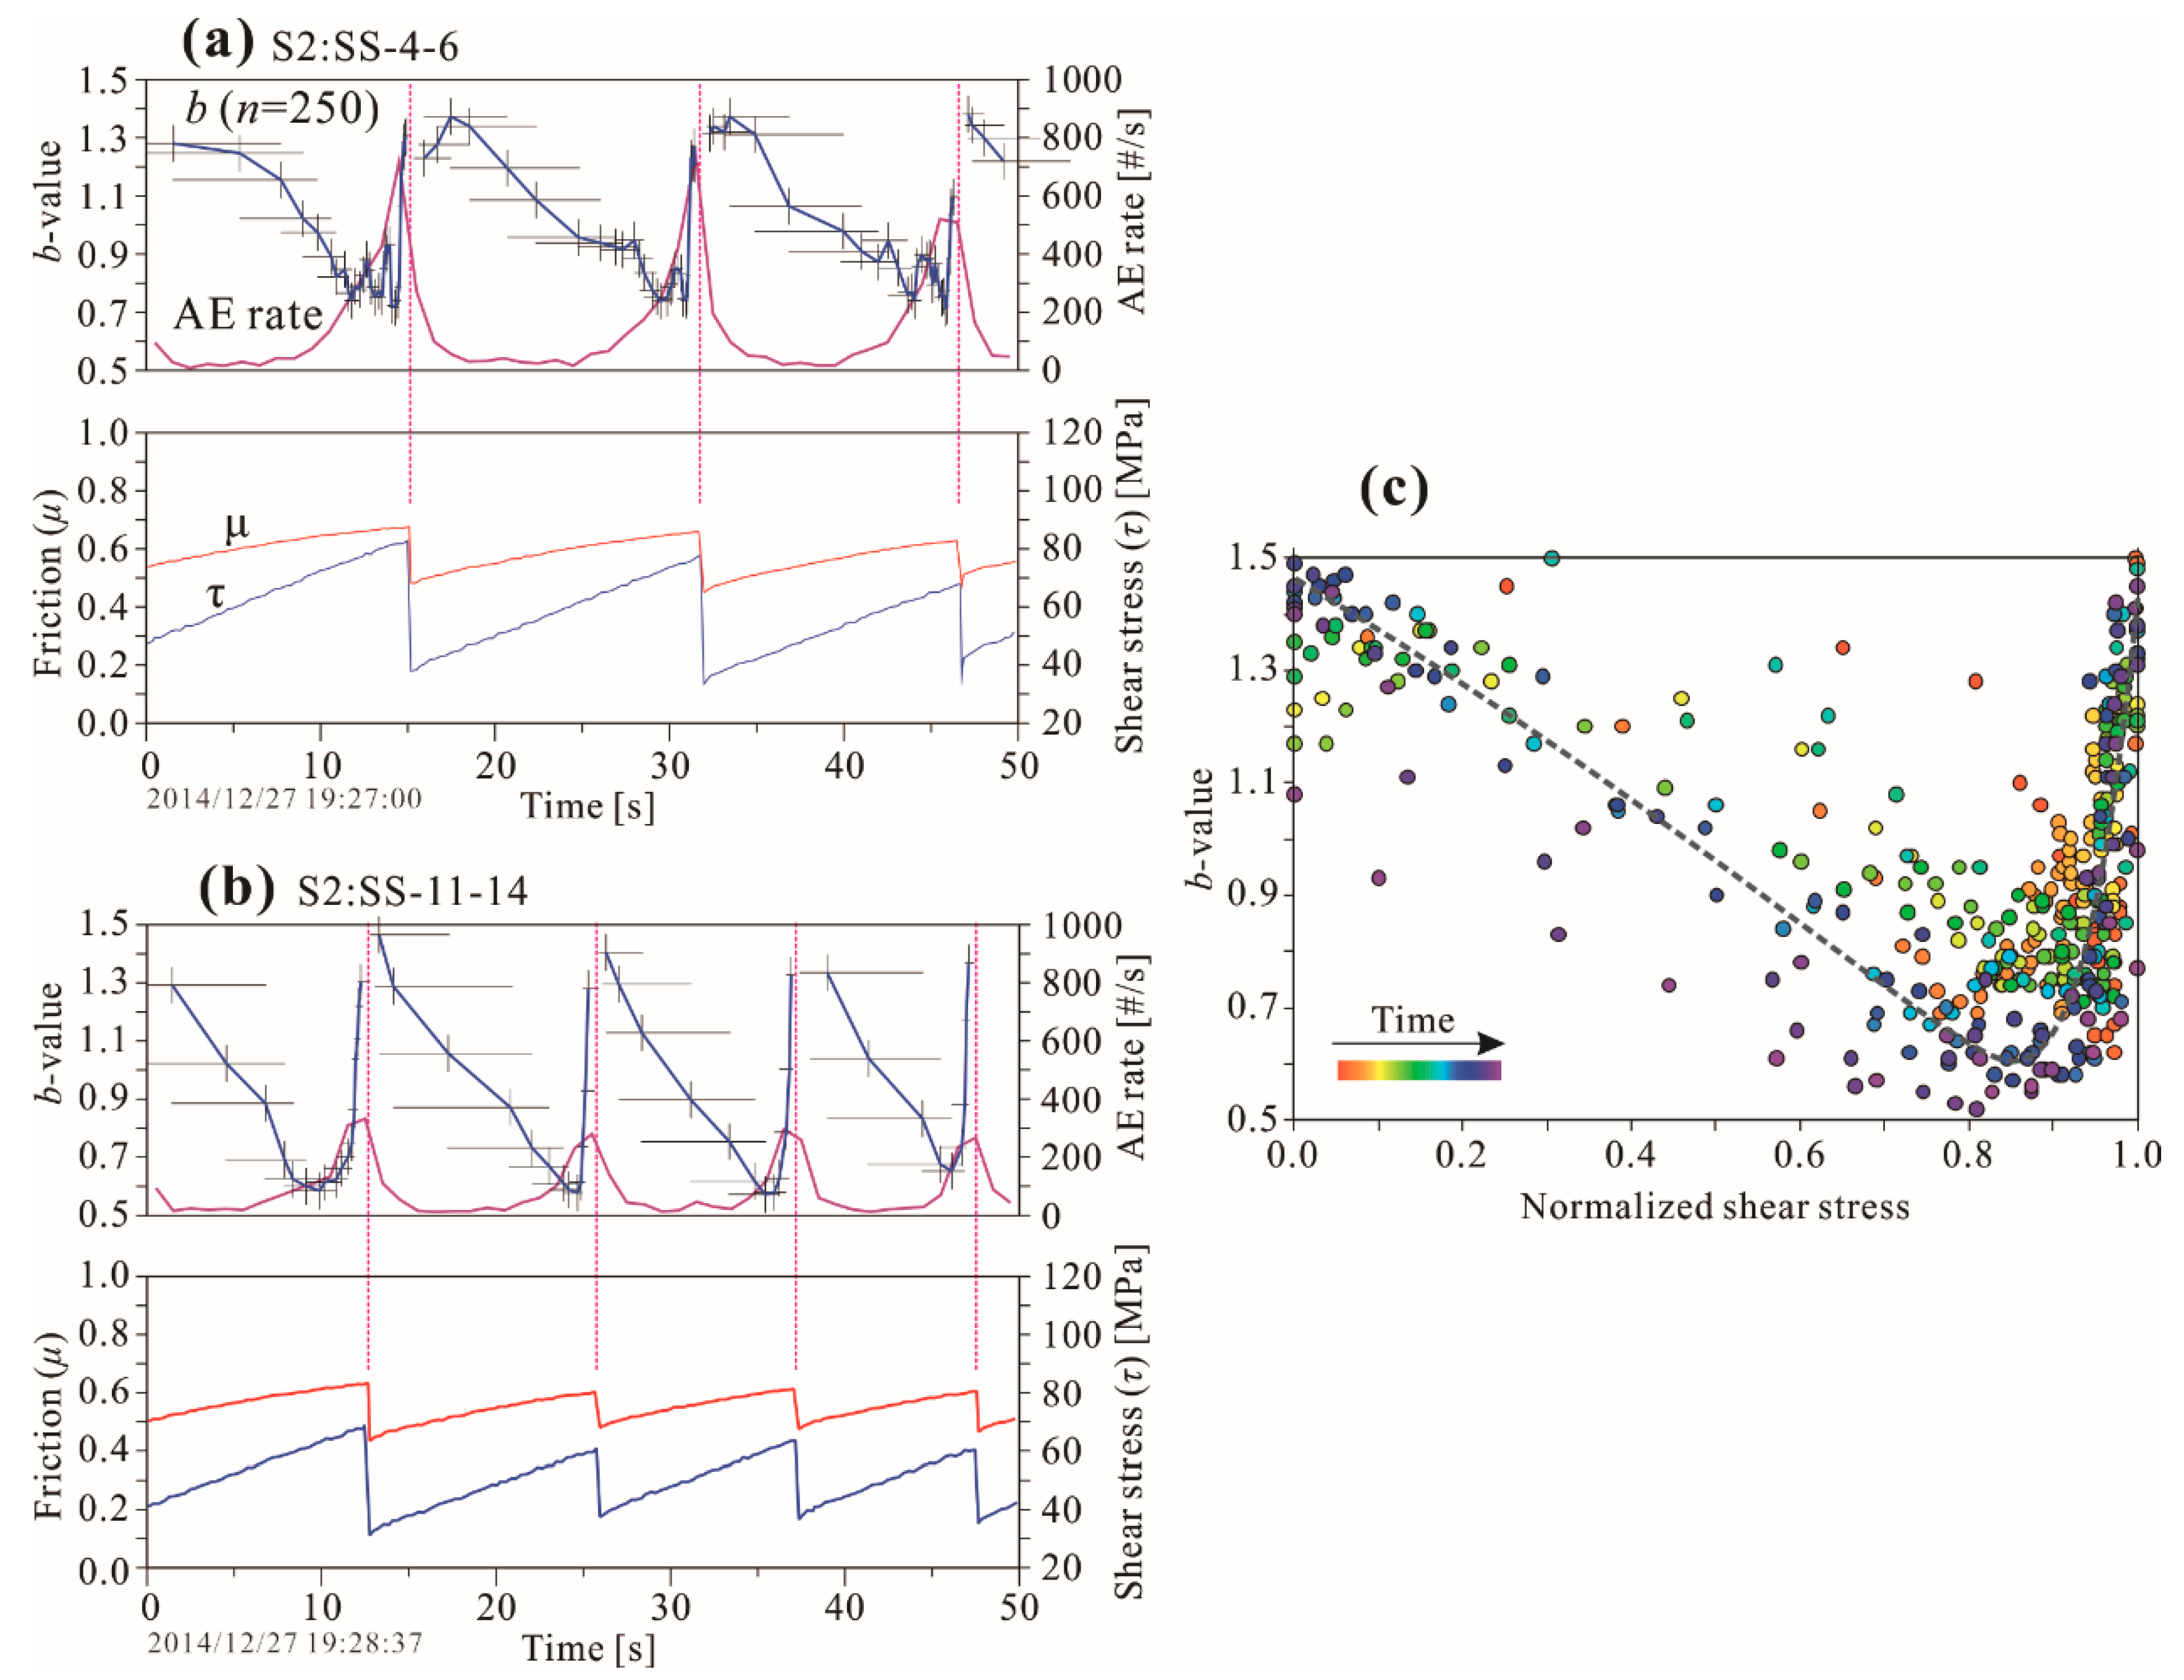
As shown in Figure 5c, for stick-slip events, the b-value decreased from 1.2 to 1.5 to approximately 0.6 as shear stress increased, and then quickly jumped back up to 1.0 to 1.3 prior to the dynamic stress drop. The time of the minimum b-value corresponds to a stress level of 70 to 95% of the shear strength.
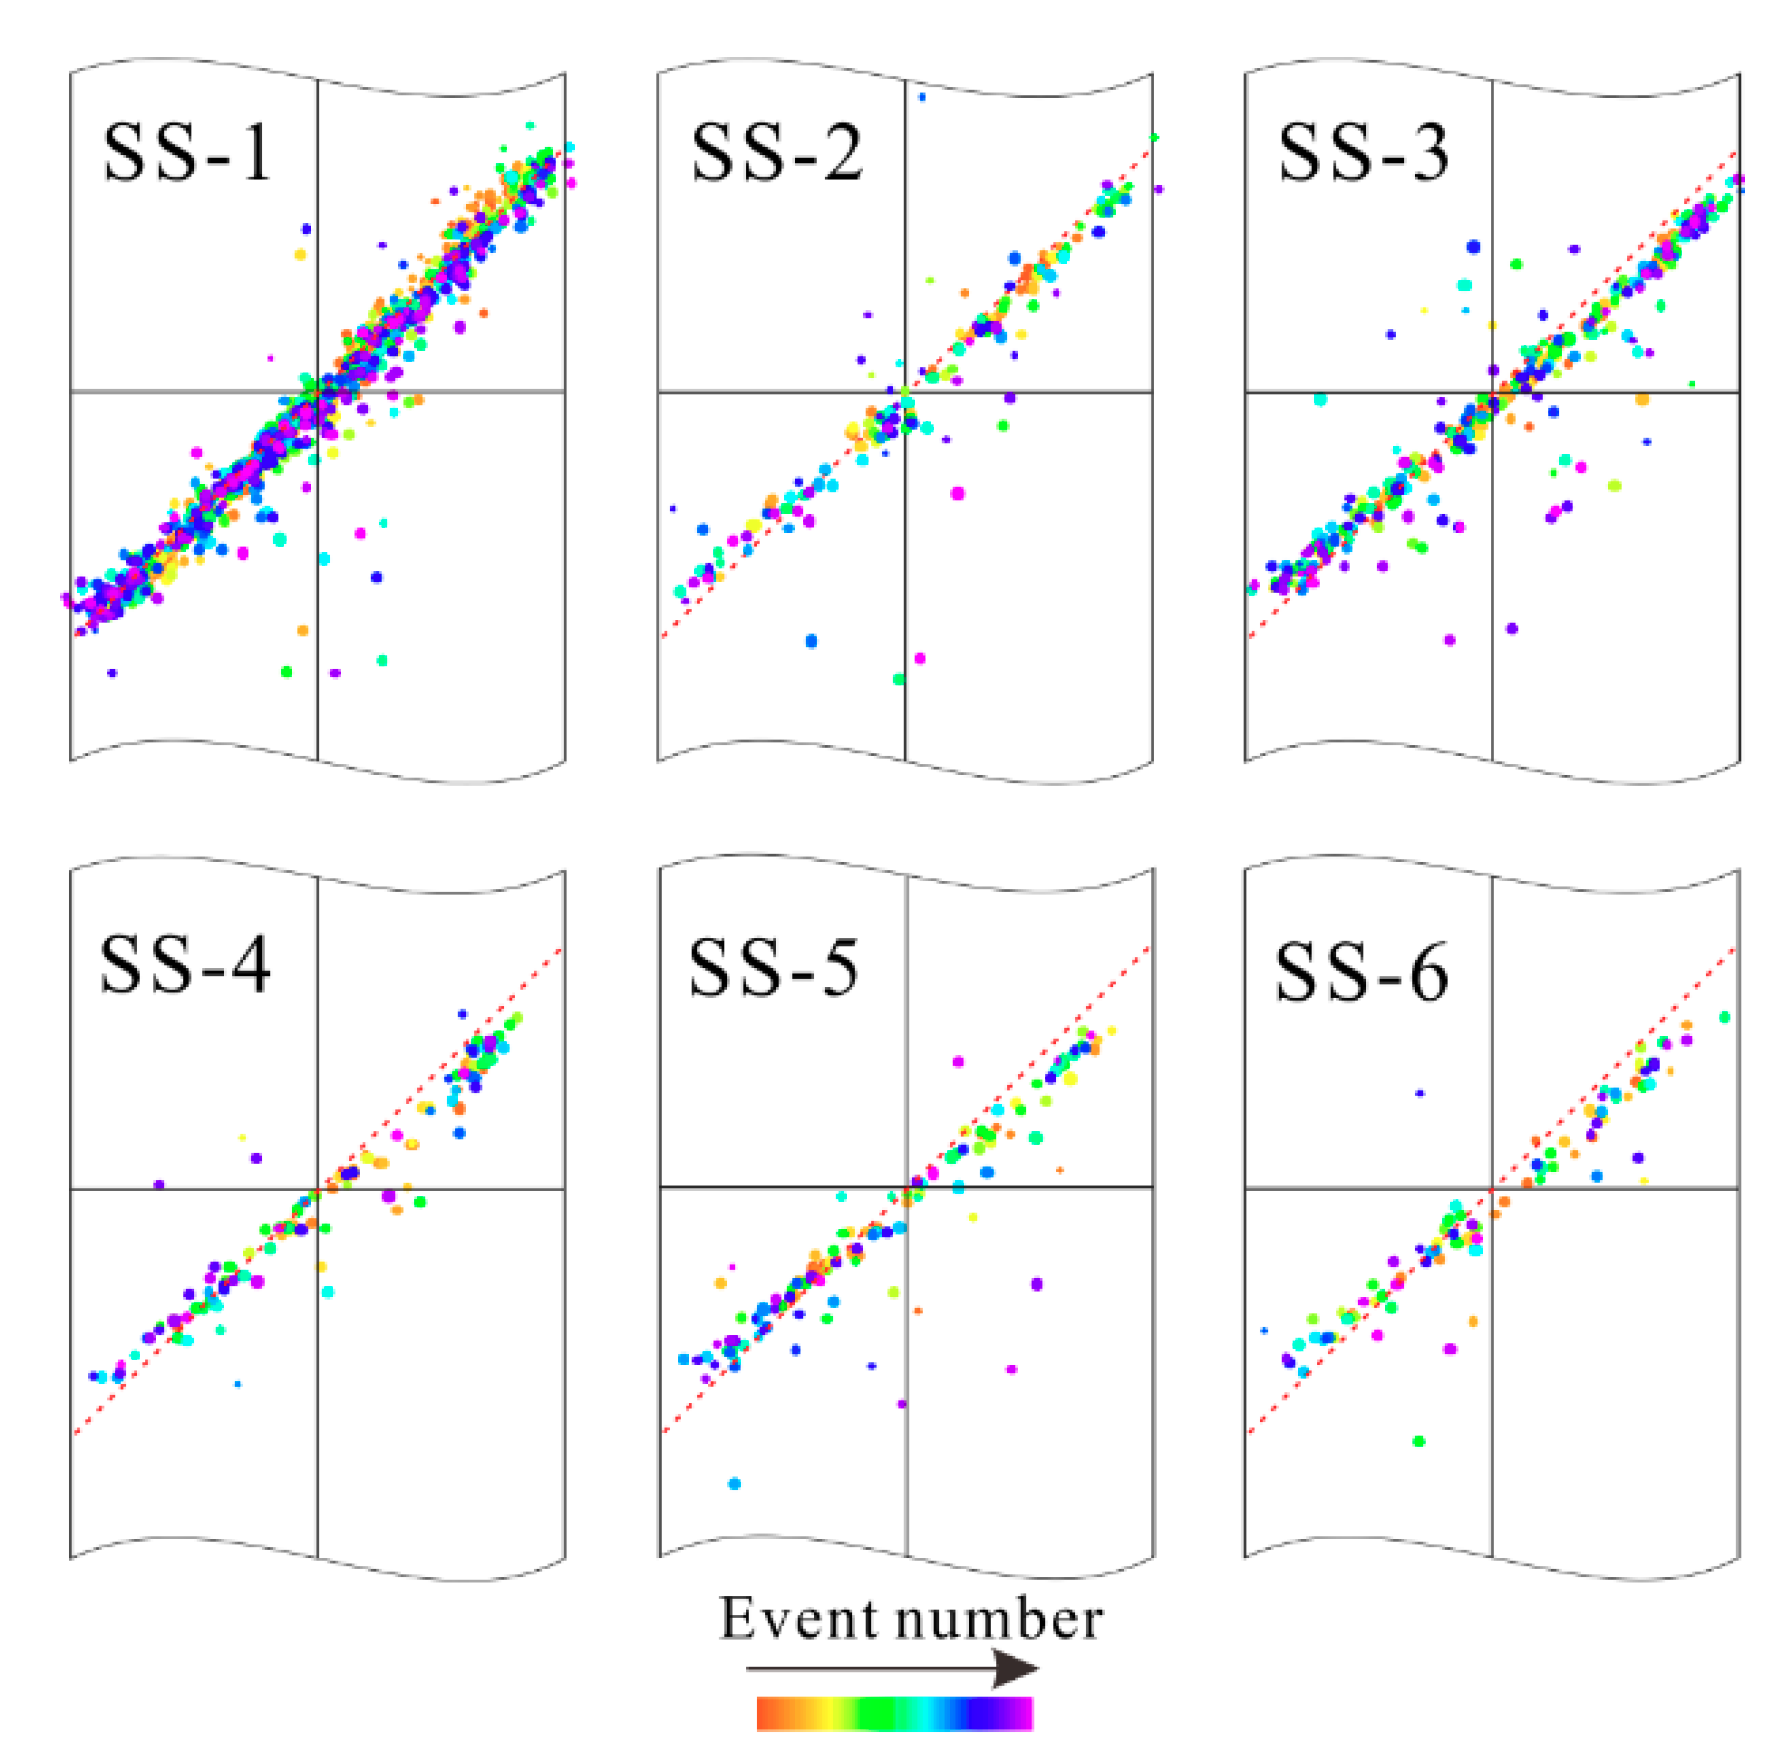
As an example, Figure 6 shows AE hypocenters projected to a vertical profile perpendicular to the fault plane for different stick-slip cycles. AE hypocenters were concentrated on the fault surface and event far from the fault surface must be very limited. This result is in agreement with the aforementioned facts, the maximum axial stress was less than 60% of the stress level at which AE activity was initiated in the intact specimen.
5. Discussion
5.1. Seismic b-Value and AE Events in Pre-Cut Faults
Previous studies on favorably oriented (oriented at 30° with respect to the maximum stress axis) faults [10] and pure shear experiments [11] showed that b-values decrease with increasing shear stress until the stress drops. The results for unfavorably oriented (45°) faults show a similar decreasing b-value trend, followed by a quick jump prior to a stress drop for most stick-slip events. Note that AEs were concentrated in a narrow zone from the fault surface. The authors also conducted similar experiments using specimens having pre-cut faults at 50°. Detailed hypocenter data suggest that there are two competing mechanisms that govern the evolution of the frictional properties and the damage zone characteristics of such unfavorably oriented faults [12]. On the one hand, the fault plane is smoothed by fault slippage because of asperities failing on the fault plane, and a fault gauge is created. On the other hand, the fault plane is roughened by new damage. In particular, for a 50° fault, a number of sub-faults were created along the favorable direction [12]. The quick jump in the b-value corresponds to a decreasing event rate, or, in other words, a quiescence period preceding failure. Such short-term quiescence basically agrees with the damage model for a fractal population of cracks [14]. The model predicts that higher b-values are associated with either lower stress intensity or greater material heterogeneity.
5.2. Implication for Seismic Hazard
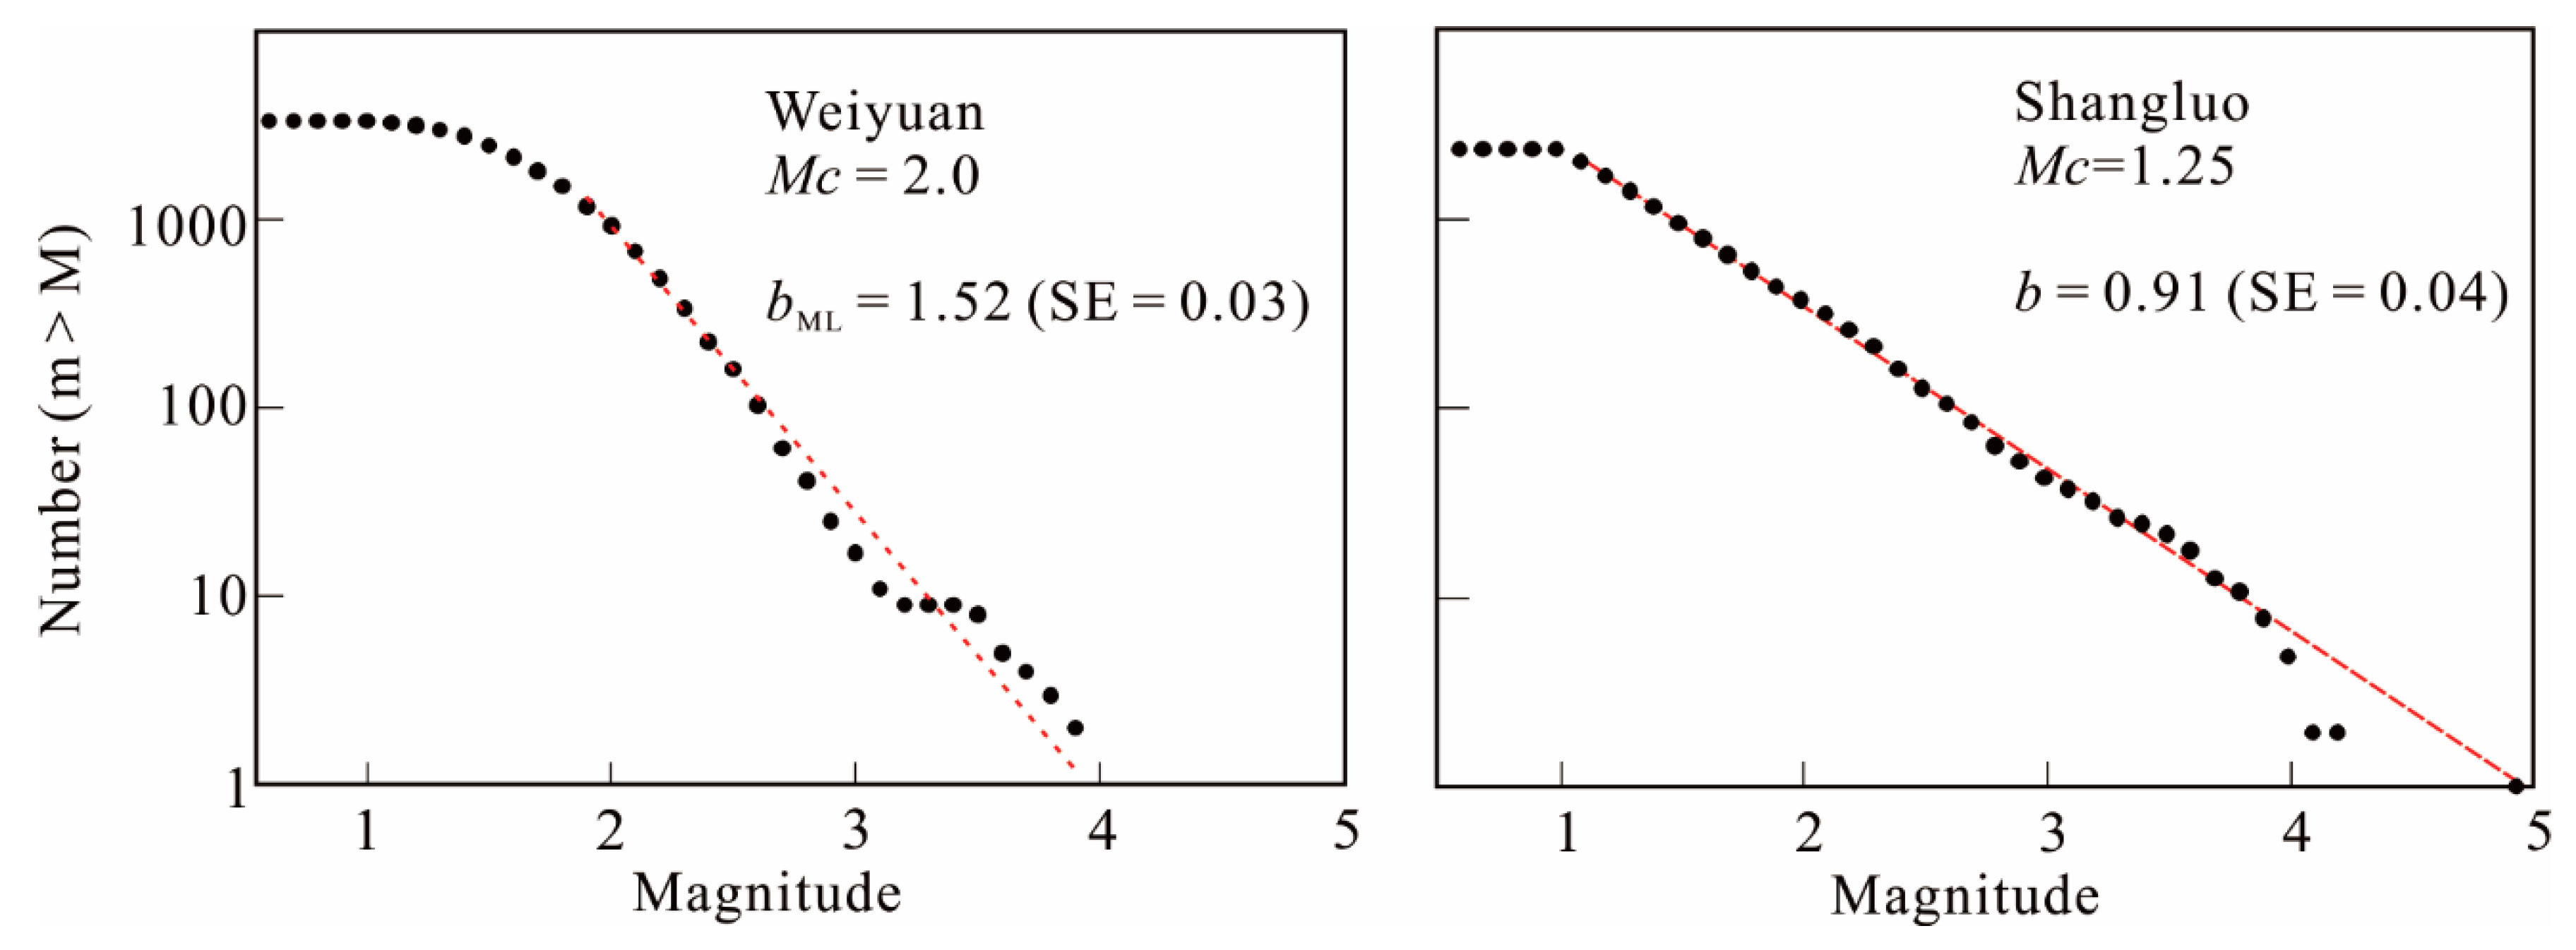
The results of the present study indicate that seismic b-values could be an indicator of fault slip history and shear stress acted on the fault. The present study is thus helpful in seismic hazard assessment and earthquake prediction, especially for injection-induced seismicity in fields having unfavorably oriented faults, immature faults, or tensile fractures created by hydrofracturing. We must pay more attention to such faults because shear fracturing contributes a high level of injection-induced seismicity. Figure 7 shows the magnitude-frequency distributions and seismic b-values for earthquakes induced by injection during shale gas fracking at two shale gas sites, Weiyuan and Shangluo, in Sichuan China [2]. The Weiyuan site is located in the central uplift of the Sichuan basin, and has a lower density of pre-existing faults. Induced seismicity is probably associated with immature fractures created by hydraulic fracturing operations, and thus has a higher b-value (1.52). The Shangluo site, which is located in the south fold zone of the Sichuan basin, has a high density of pre-existing faults (most of which are unfavorable in the present-day stress field). Since the mean seismic b-value is 0.91, pre-existing and well-developed faults play a significant role in injection-induced seismicity at the Shangluo site. These interpretations can also explain the maximum earthquake magnitudes observed thus far, which are approximately 3.5 and 5, at Weiyuan and Shangluo, respectively. At the shale sites in the Sichuan basin, many well pads exhibited induced seismicity, with a sizable magnitude of up to approximately 3.5. Events with a magnitude greater than 4 are limited to well pads close to known or unknown faults. In order to produce an earthquake of magnitude 5, a fault having a size greater than several kilometers is required [2,15], which is larger than fractures that can be created by shale fracturing.
6. Conclusions
In conclusion, the authors investigated the seismic b-value for AE events during repeated stick-slip cycles of pre-cut faults in granite under triaxial compression conditions (confining pressure: 40 MPa). The pre-cut fault had an angle of 45° with the axial stress and thus is unfavorably oriented. Using a multi-channel AE waveform recording system, AE waveforms were recorded at 16 bits and at a sampling rate of 25 MHz. At the same time, two peak detectors were used to record the maximum amplitude of AE events. Acoustic emission amplitude data, ranging over three orders of magnitude, show the frequency-magnitude relation of Gutenberg and Richter.
At first, the b-value, event rate, and surface strain for the intact specimen demonstrate three distinct phases: the primary, secondary, and nucleation phases. This pattern is similar to that observed for other fine-grained granites, such as Westerly granite and Oshima granite [7].
The results of the present study indicate that the static frictional coefficient decreased from the maximum value prior to the first stick-slip event to a stable mean value of approximately 0.6 after several stick-slip events, while the dynamic frictional coefficient fluctuated between 0.45 and 0.52. The pre-failure static slip accounts for approximately 30% of the dynamic slip. AEs during the pre-failure static slip stage were concentrated on the fault surface.
Prior to the first stick-slip event, the seismic b-value decreased gradually from approximately 1.8 to 1.0 with a fault slip of approximately 0.6 mm. For later stick-slip events, the seismic b-value decreased from 1.2 to 1.5 to approximately 0.6 as the shear stress increased, and then quickly jumped back up to 1.0 to 1.3 before the stress decreased. The time of the minimum b-value, which coincided with the maximum event rate, corresponded to a stress level of 70–95% of the shear strength.
Our results on b-value evaluation preceding repeated stick-slips demonstrate that the seismic b-value can be used as an indicator of fault slip history or the degree of fault maturity and shear stress acting on the fault, which is important in seismic hazard assessment and earthquake prediction, especially for injection-induced seismicity in fields in which reactivated shear rupture of unfavorable and immature faults or tensile fractures is important. For individual earthquakes, there are no significant differences, in a wide aspect of earthquake seismology, between induced-earthquakes by fluid injection and earthquakes related to tectonic activity [2]. A combination of multi pieces of statistical behaviors is required making reliable discrimination. This study indicates b-value evaluation is an important parameter.
Author Contributions
All authors designed the project and participated in the experiments and the interpretation of the results. X.L. processed and analyzed the data and wrote the manuscript.
Acknowledgments
The present study was partly supported by the National Science Foundation of China (NSFC 41174046).
Conflicts of Interest
The authors wish to confirm that there are no known conflicts of interest associated with this publication and there has been no significant financial support for this work that could have influenced its outcome.
References
- Grigoli, F.; Cesca, S.; Rinaldi, A.; Manconi, A.; López-Comino, J.; Clinton, J.; Westaway, R.; Cauzzi, C.; Dahm, T.; Wiemer, S. The November 2017 Mw 5.5 Pohang earthquake: A possible case of induced seismicity in South Korea. Science 2018, 360, 1003–1006. [Google Scholar] [CrossRef] [PubMed]
- Lei, X.; Huang, D.; Su, J.; Jiang, G.; Wang, X.; Wang, H.; Guo, X.; Fu, H. Fault reactivation and earthquakes with magnitudes of up to Mw4.7 induced by shale-gas hydraulic fracturing in Sichuan Basin, China. Sci. Rep. 2017, 7, 7971. [Google Scholar] [CrossRef] [PubMed]
- Terakawa, T.; Hashimoto, C.; Matsu’ura, M. Changes in seismic activity following the 2011 Tohoku-oki earthquake: Effects of pore fluid pressure. Earth Planet. Sci. Lett. 2013, 365, 17–24. [Google Scholar] [CrossRef]
- Sibson, R.H.; Robert, F.; Poulsen, K.H. High-angle reverse faults, fluid-pressure cycling, and mesothermal gold-quartz deposits. Geology 1988, 16, 551. [Google Scholar] [CrossRef]
- Terakawa, T.; Zoporowski, A.; Galvan, B.; Miller, S.A. High-pressure fluid at hypocentral depths in the L’Aquila region inferred from earthquake focal mechanisms. Geology 2010, 38, 995–998. [Google Scholar] [CrossRef]
- Sibson, R.H. Brittle-failure controls on maximum sustainable overpressure in different tectonic regimes. AAPG Bull. 2003, 87, 901–908. [Google Scholar] [CrossRef]
- Lei, X.; Ma, S. Laboratory acoustic emission study for earthquake generation process. Earthq. Sci. 2014, 27, 627–646. [Google Scholar] [CrossRef] [Green Version]
- Smith, W.D. The b-value as an earthquake precursor. Nature 1981, 289, 136–139. [Google Scholar] [CrossRef]
- Sammonds, P.R.; Meredith, P.G.; Main, I.G. Role of pore fluids in the generation of seismic precursors to shear fracture. Nature 1992, 359, 228–230. [Google Scholar] [CrossRef]
- Goebel, T.; Schorlemmer, D.; Becker, T.; Dresen, G.; Sammis, C. Acoustic emissions document stress changes over many seismic cycles in stick-slip experiments. Geophys. Res. Lett. 2013, 40, 2049–2054. [Google Scholar] [CrossRef] [Green Version]
- Rivière, J.; Lv, Z.; Johnson, P.; Marone, C. Evolution of b-value during the seismic cycle: Insights from laboratory experiments on simulated faults. Earth Planet. Sci. Lett. 2018, 482, 407–413. [Google Scholar] [CrossRef]
- Lei, X.; Li, S.; Liu, L. Fracturing behaviors of unfavorably oriented faults investigated using an acoustic emission monitor. In Advances in Acoustic Emission Technology; Springer: Basel, Switzerland, 2017; pp. 229–240. [Google Scholar]
- Lei, X. How do asperities fracture? An experimental study of unbroken asperities. Earth Planet. Sci. Lett. 2003, 213, 347–359. [Google Scholar] [CrossRef]
- Main, I.G.; Meredith, P.G.; Sammonds, P.R. Temporal variations in seismic event rate and b-values from stress corrosion constitutive laws. Tectonophysics 1992, 211, 233–246. [Google Scholar] [CrossRef]
- Wells, D.L.; Coppersmith, K.J. New empirical relationships among magnitude, rupture length, rupture width, rupture area, and surface displacement. Bull. Seismol. Soc. Am. 1994, 84, 974–1002. [Google Scholar]
Figure 1.
Roughness of pre-cut surface (S1) measured by laser scanner. A and B in (b) (rectangle region in (a)) indicates direction of two artificially selected profiles, which were used for the calculation of power spectral density function (PDF) of the roughness in (c).
Figure 1.
Roughness of pre-cut surface (S1) measured by laser scanner. A and B in (b) (rectangle region in (a)) indicates direction of two artificially selected profiles, which were used for the calculation of power spectral density function (PDF) of the roughness in (c).

Figure 2.
Schematic of experimental configuration and distributions of piezoelectric transducers (solid circles) and strain gages (crosses). The maximum amplitudes of AE signals from k1 and k2 were recorded by the peak detectors and used for the calculation of seismic b-value.
Figure 2.
Schematic of experimental configuration and distributions of piezoelectric transducers (solid circles) and strain gages (crosses). The maximum amplitudes of AE signals from k1 and k2 were recorded by the peak detectors and used for the calculation of seismic b-value.

Figure 3.
Results of the intact specimen for reference. AE rates (red line), b-values (blue line), axial stress (σa), confining (Pc) pressure, axial/circumferential/volumetric strains (εa/εc/εv), and axial shortening are plotted against time. P, S, and N indicates three distinct phases: the primary, secondary, and nucleation phases, respectively (see text for details).

Figure 4.
Results of experiment S2. (a) Acoustic emission counts (every 10 s), seismic b-value, axial stress (σa), shortening of specimen (d), and elastic shorting plotted with respect to time. (b) Detailed view of b-value and event rate (every second), with additional shear stress and friction coefficient for time window as shown in (a). The seismic b-value was estimated using a running window with 1000 or 250 event number. The vertical dashed lines in (b) indicate the onset of stick-slip events. The vertical and horizontal bars at each b-value point indicate the standard error and time window, respectively.

Figure 5.
(a,b) Detailed view of acoustic emission (AE) rate, seismic b-value, shear stress, and friction coefficient for selected stick-slip events in experiment S2. (c) b-value plotted with respect to normalized shear stress for all stick-slip events. See caption of Figure 4 for details.
Figure 5.
(a,b) Detailed view of acoustic emission (AE) rate, seismic b-value, shear stress, and friction coefficient for selected stick-slip events in experiment S2. (c) b-value plotted with respect to normalized shear stress for all stick-slip events. See caption of Figure 4 for details.

Figure 6.
AE hypocenters projected to a vertical profile perpendicular to the fault plane for different stick-slip cycles in experiment S1. Hypocenter symbols are color with event sequential number.
Figure 6.
AE hypocenters projected to a vertical profile perpendicular to the fault plane for different stick-slip cycles in experiment S1. Hypocenter symbols are color with event sequential number.

Figure 7.
Magnitude-frequency distributions and seismic b-values for induced earthquakes at two shale gas sites, Weiyuan and Shangluo, in Sichuan China. (The plot for Shangluo was modified from Lei et al. 2017 [2].) In the figure, Mc indicates the lower cut magnitude for completeness, and SE indicates the standard error of the b-value.

© 2018 by the authors. Licensee MDPI, Basel, Switzerland. This article is an open access article distributed under the terms and conditions of the Creative Commons Attribution (CC BY) license (http://creativecommons.org/licenses/by/4.0/).
Share and Cite
MDPI and ACS Style
Lei, X.; Li, S.; Liu, L. Seismic b-Value for Foreshock AE Events Preceding Repeated Stick-Slips of Pre-Cut Faults in Granite. Appl. Sci. 2018, 8, 2361. https://doi.org/10.3390/app8122361
AMA Style
Lei X, Li S, Liu L. Seismic b-Value for Foreshock AE Events Preceding Repeated Stick-Slips of Pre-Cut Faults in Granite. Applied Sciences. 2018; 8(12):2361. https://doi.org/10.3390/app8122361
Chicago/Turabian StyleLei, Xinglin, Shinian Li, and Liqiang Liu. 2018. "Seismic b-Value for Foreshock AE Events Preceding Repeated Stick-Slips of Pre-Cut Faults in Granite" Applied Sciences 8, no. 12: 2361. https://doi.org/10.3390/app8122361
Note that from the first issue of 2016, this journal uses article numbers instead of page numbers. See further details here.