A Comparative Study of Deep CNN in Forecasting and Classifying the Macronutrient Deficiencies on Development of Tomato Plant


1
Department of Electronic Engineering, Dong-A University, 37 Nakdong Daero, 550 beon-gil, Hadan 2-dong, Saha-gu, Busan 49315, Korea
2
Department of Applied Bioscience, Dong-A University, 37 Nakdong Daero, 550 beon-gil, Hadan 2-dong, Saha-gu, Busan 49315, Korea
*
Author to whom correspondence should be addressed.
Appl. Sci. 2019, 9(8), 1601; https://doi.org/10.3390/app9081601
Submission received: 5 March 2019
/
Revised: 7 April 2019
/
Accepted: 11 April 2019
/
Published: 17 April 2019
(This article belongs to the Section Computing and Artificial Intelligence)
Abstract
:Featured Application
In this paper, Deep Learning has been used to classify, predict early nutrient deficiencies during the growth of tomato plant. This study can be applied to monitoring system for detecting and suggesting the solutions to treat manifested pathological symptoms in cultivating tomato plants, which will improve the yield rate.
Abstract
During the process of plant growth, such as during the flowering stages and fruit development, the plants need to be provided with the various minerals and nutrients to grow. Nutrient deficiency is the cause of serious diseases in plant growth, affecting crop yield. In this article, we employed artificial neural network models to recognize, classify, and predict the nutritional deficiencies occurring in tomato plants (Solanum lycopersicum L.). To classify and predict the different macronutrient deficiencies in the cropping process, this paper handles the captured images of the macronutrient deficiency. This deficiency during the fruiting and leafing phases of tomato plant are based on a deep convolutional neural network (CNN). A total of 571 images were captured with tomato leaves and fruits containing the crop species at the growth stage. Among all images, 80% (461 captured images) were used for the training dataset and 20% (110 captured images) were applied for the validation dataset. In this study, we provide an analysis of two different model architectures based on convolutional neural network for classifying and predicting the nutrient deficiency symptoms. For instance, Inception-ResNet v2 and Autoencoder with the captured images of tomato plant growth under the greenhouse conditions. Moreover, a major type of statistical structure, namely Ensemble Averaging, was applied with two aforementioned predictive models to increase the accuracy of predictive validation. Three mineral nutrients, i.e., Calcium/Ca2+, Potassium/K+, and Nitrogen/N, are considered for use in evaluating the nutrient status in the development of tomato plant with these models. The aim of this study is to predict the nutrient deficiency accurately in order to increase crop production and prevent the emergence of tomato pathology caused by lack of nutrients. The predictive performance of the three models in this paper are validated, with the accuracy rates of 87.273% and 79.091% for Inception-ResNet v2 and Autoencoder, respectively, and with 91% validity using Ensemble Averaging.
1. Introduction and Related Work
In the process of plant growth, such as for a tomato plant, mineral nutrients play an important role. The essential mineral nutrients involve two kinds of elements: macro- and micronutrients. The macronutrients include Calcium, Potassium, Nitrogen, Magnesium, Sulfur, and Phosphorous. The micronutrients include Boron, Iron, Manganese, Copper, Chloride, Zinc, and Molybdenum. In addition, deficiency of these nutrients affects the growth, yield, and quality of tomato plants and crops. In this paper, we focus on collecting the dataset, diagnosing and predicting the symptoms of nutrient deficiencies that affect the tomato fruit. For example, deficiencies in the three main mineral elements can be observed by means of blossom end rot (BER) for Calcium, green/yellow shoulder and blotchy ripening for Potassium, and paler green and uniformly yellow/chlorosis on leaves for Nitrogen. The representations of nutrient deficiency for Calcium, Potassium, and Nitrogen are manifested early on in the development of tomato leaves and tomato fruits. These three mineral nutrients have an effect on the tomato leaves and fruits, and they directly affect the growth and quality of the tomato harvest, as shown in [1,2,3,4]. Moreover, the analysis of the bad impacts caused by Nitrogen deprivation within 10 or 19 days by Camille Bénard et al. in [5] suggested that they contained a higher level of chlorogenic acid and rutin. In general, symptoms of nutrient deficiency with respect to Calcium, Potassium, and Nitrogen will be visible in the growth of the tomato fruit. The appearance of similar symptoms in tomato fruits and leaves could improve our ability to distinguish and predict deficiencies through the process of farming.
Recently, artificial intelligence (AI) has found widespread application in various fields, including industry, agriculture, biology, etc. Specifically, deep learning (DL) is increasingly being applied to speech recognition, visual object recognition, object detection, and the like. Moreover, LeCun et al. employed deep convolutional nets to achieve breakthroughs in the processing of images, video, and speech [6]. In particular, in the field of agriculture, DL models are can be applied for the forecast and classification of plant disease, management of crops, weed detection, farmland management, etc., as described in [7]. From a technical perspective, Kamilaris et al. carried out a survey of 40 studies using DL models in agriculture applications including several architectures such as the popular CNN architectures (e.g., AlexNet, VGG-16 and Inception-ResNet), the Long Short-Term Memory (LSTM) model, the Differential Recurrent Neural Network (DRNN) model, Scalable Vector Machines (VSM), and the like [8].
Based on visible range images or digital image processing, recent studies have focused on agricultural diagnosis and prediction for symptoms of disease and nutrient deficiency in plants using an artificial neural network [9]. Izabela A. Samborska et al. [10] reviewed the application of ANN to agriculture under a variety of conditions with functional ANN. For identification of plant diseases based on visible range images, the discussion by Barbedo in [11] proposed a number of intrinsic and extrinsic factors, including image background, image capture conditions, symptom segmentation, etc.
Recent studies using deep learning have focused on the identification and pathological analysis of plants. Ferentinos carried out research with several CNN-based models to identify leaf diseases in 29 crops based on a database of 87,848 images, and achieved a maximum success rate of 99.53%, as reported in [12]. Artzai Picon et al. [13] used a neural network model to classify the diseases of plants, including tomato plants, based on images taken using mobile devices. In [14], Mads Dyrmann et al. built a convolutional neural network from scratch, which was trained and tested on a total of 10,413 images containing 22 species of weeds and crops. Their study results achieved a classification accuracy of 86.2%. Srdjan Sladojevic et al. [15] developed a model that was able to recognize 13 different types of plant disease. By using Caffe, a deep learning framework based on CNN, their study achieved precision of between 91% and 98% for separate class tests. Alvaro Fuentes et al. [16] proposed a robust DL-based detector for real-time disease and pest recognition in tomato plants. The authors considered the combination of three families of detectors, including Faster Region-based Convolutional Neural Network (Faster R-CNN), Region-based Fully Convolutional Network (R-FCN), and Single Shot Multibox Detector (SSD). Using several models, such as Visual Geometry Group (VGG-16), ResNet-50, ResNet-101, and ResNet-152, the authors compared the prediction results for nine different types of disease and pest.
Anna Chlingaryan et al. conducted a survey of machine learning approaches for crop yield with respect to estimation of nitrogen status in precision agriculture, which included various technologies and ML techniques, such as back-propagation Neural Network, combination of CNN or LSTM with Gaussian Processes, M5-Prime Regression Trees, and Least Squares Vector Machine [17]. H. Noh et al. estimated crop nitrogen status during side-dressing operations [18]. The authors used a neural network model to evaluate maize leaf based on the sensed reflectance of the maize canopy in three channels, including green and red colors and the near-infrared (NIR) range of a multi-spectral charge-coupled device camera. Using aerial images and an artificial neural network, R. K. Gautam et al. applied two neural network architectures—multilayer perceptron and radial basis function—to predict leaf nitrogen content in corn plants under field conditions [19]. The authors achieved a root mean square error of prediction (RMSEP) of 6.6%, and a minimum prediction accuracy (MPA) of 88.8% for predicting leaf nitrogen content. In [20], Guili Xu et al. described an approach for identifying nitrogen and potassium deficiency in tomatoes with an accuracy of 82.5% using a Genetic Algorithm (GA) based on the color and texture features of leaves.
On the other hand, M.A. Vazquez-Cruz et al. developed an ANN model prototype to estimate the leaf area of tomato growths under changes in climate and salicylic acid in [21]. In addition, a study based on a Support Vector Machine (SVM) was reported by Z. Hanxu et al. in [22], which improved the methodology by introducing the near-infrared spectrogram of the tomato leaves under investigation in order to classify anti-nematode tomatoes and normal tomatoes. C.D. Jones et al. estimated leaf nitrogen status with a reflectance spot sensor and using Bayes’ theorem for the prediction model with multispectral imaging, which exhibited a root mean square difference (RMSD) approaching 4.9% and a coefficient of determination of 0.82, as discussed in [23]. Furthermore, the method proposed by S. B. Sulistyo et al. in [24] discussed a novel computational intelligence in vision sensing for estimating nutrient content in wheat leaves. To evaluate the nutrient content, the authors applied deep spare extreme learning machines (DSELM) and a genetic algorithm (GA) to normalize plant images and reduce color variability due to a variation of sunlight intensities. The mean absolute percentage error (MAPE) of the GA-based committee machine with four DSELMs was approximately 2.78%.
A method for fusing the deep learning multilayer perceptron (DL-MLP) by means of committee machines to achieve color normalization and image segmentation was proposed by S. B. Sulistyo et al. The authors optimized the system architecture for high performance of color normalization and nitrogen estimation using a genetic algorithm (GA). In addition, the authors affirmed that they built a robust statistical model for prediction, rather than recognizing the images. To estimate the nitrogen content, the authors used several standard MLPs to extract the images for three colors (RGB) [25].
S. B. Sulistyo et al. [26] also demonstrated a low-cost, simple, and accurate approach for achieving image-based nitrogen amount estimation. The authors proposed a combination of neural networks using a committee machine with twelve statistical RGB color features to evaluate input images. They applied a neural network (NN) to distinguish the wheat leaves, and then combined a committee machine and a genetic algorithm (GA) in the NN to estimate the nitrogen content. Like previous studies, the authors used a different method based on NN to extract basic colors in order to estimate nitrogen content. In addition, the authors also presented a comparison of several methods (e.g., SPAD, univariate linear regression, multivariate linear regression, ANN 30, ANN 35, and committee machines) with respect to nitrogen prediction performance on the basis of various comparative error values, such as MAPE, MAE, RMSE, MSE, and SSE [27]. Thereby, the committee machine achieved better results than other methods in terms of the evaluated indexes, with its values such as 3.15% for MAPE, 0.088 for MAE, RMSE of 0.125, 0.016 for MSE, and SSE of 0.565.
As mentioned above, most studies have focused on distinguishing and predicting certain kinds of disease in plants or crops, such as the effects of the symptoms of nutrient deficiency on the growth of tomato plants/crops. Furthermore, previous approaches have not used particular deep neural network models in order to forecast and evaluate the performance of models under real conditions. Therefore, the primary goal of this paper is to apply a particularly deep neural network (i.e., Inception-ResNet v2 and Autoencoder), which recognizes and predicts deficiencies in the essential mineral nutrients Calcium, Potassium, and Nitrogen based on CNN, as well as to evaluate their performance effectiveness under real natural conditions. To collect a dataset for training and validation, we captured images of normal and nutrient-deficient tomato fruits.
Accordingly, Inception-ResNet v2 and Autoencoder were utilized for training, recognition, and prediction of the nutrient status of tomato plants on the basis of the images captured in this study. We upgraded the CNN model to increase the accuracy of identification and prediction of the AI system. In contrast to previous studies, we focused on analyzing, evaluating, and predicting nutrient deficiency status in the growth stages of the tomato plant. We aim to improve the predictive performance of DL models in order to achieve high production yields and prevent the emergence of tomato pathologies caused by the lack of nutrients. In particular, we used the modified structure of Inception-ResNet v2 and Autoencoder for predicting nutrient deficiency, and achieved an accuracy rate of 87.27% for the Inception-ResNet v2 model and 79.09% for the Autoencoder. The top-3 error rate was 12.73% for Inception-ResNet v2 and 20.91% for Autoencoder. Moreover, we combined two of the previously described models by using the Ensemble Averaging method to improve the predictive precision, resulting in an accuracy of 91%.
This paper is structured as follows. Section 2 presents the proposed system and dataset collection with Calcium, Potassium, and Nitrogen deficiencies. Section 3 shows the building of Inception-ResNet v2 and Autoencoder models based on CNN, and the use of Ensemble Averaging to predict and distinguish mineral nutrient deficiencies based on the captured images of tomato fruit and leaves. Section 4 demonstrates the results of forecasting. The comparison and evaluation of predictive performance for each model is described in Section 5. Section 6 summarizes the study and highlights the key development in this article.
2. Forecasting Model for Nutrient Deficiency Identification and Data Pre-Processing
2.1. Overview of the Structure of the System
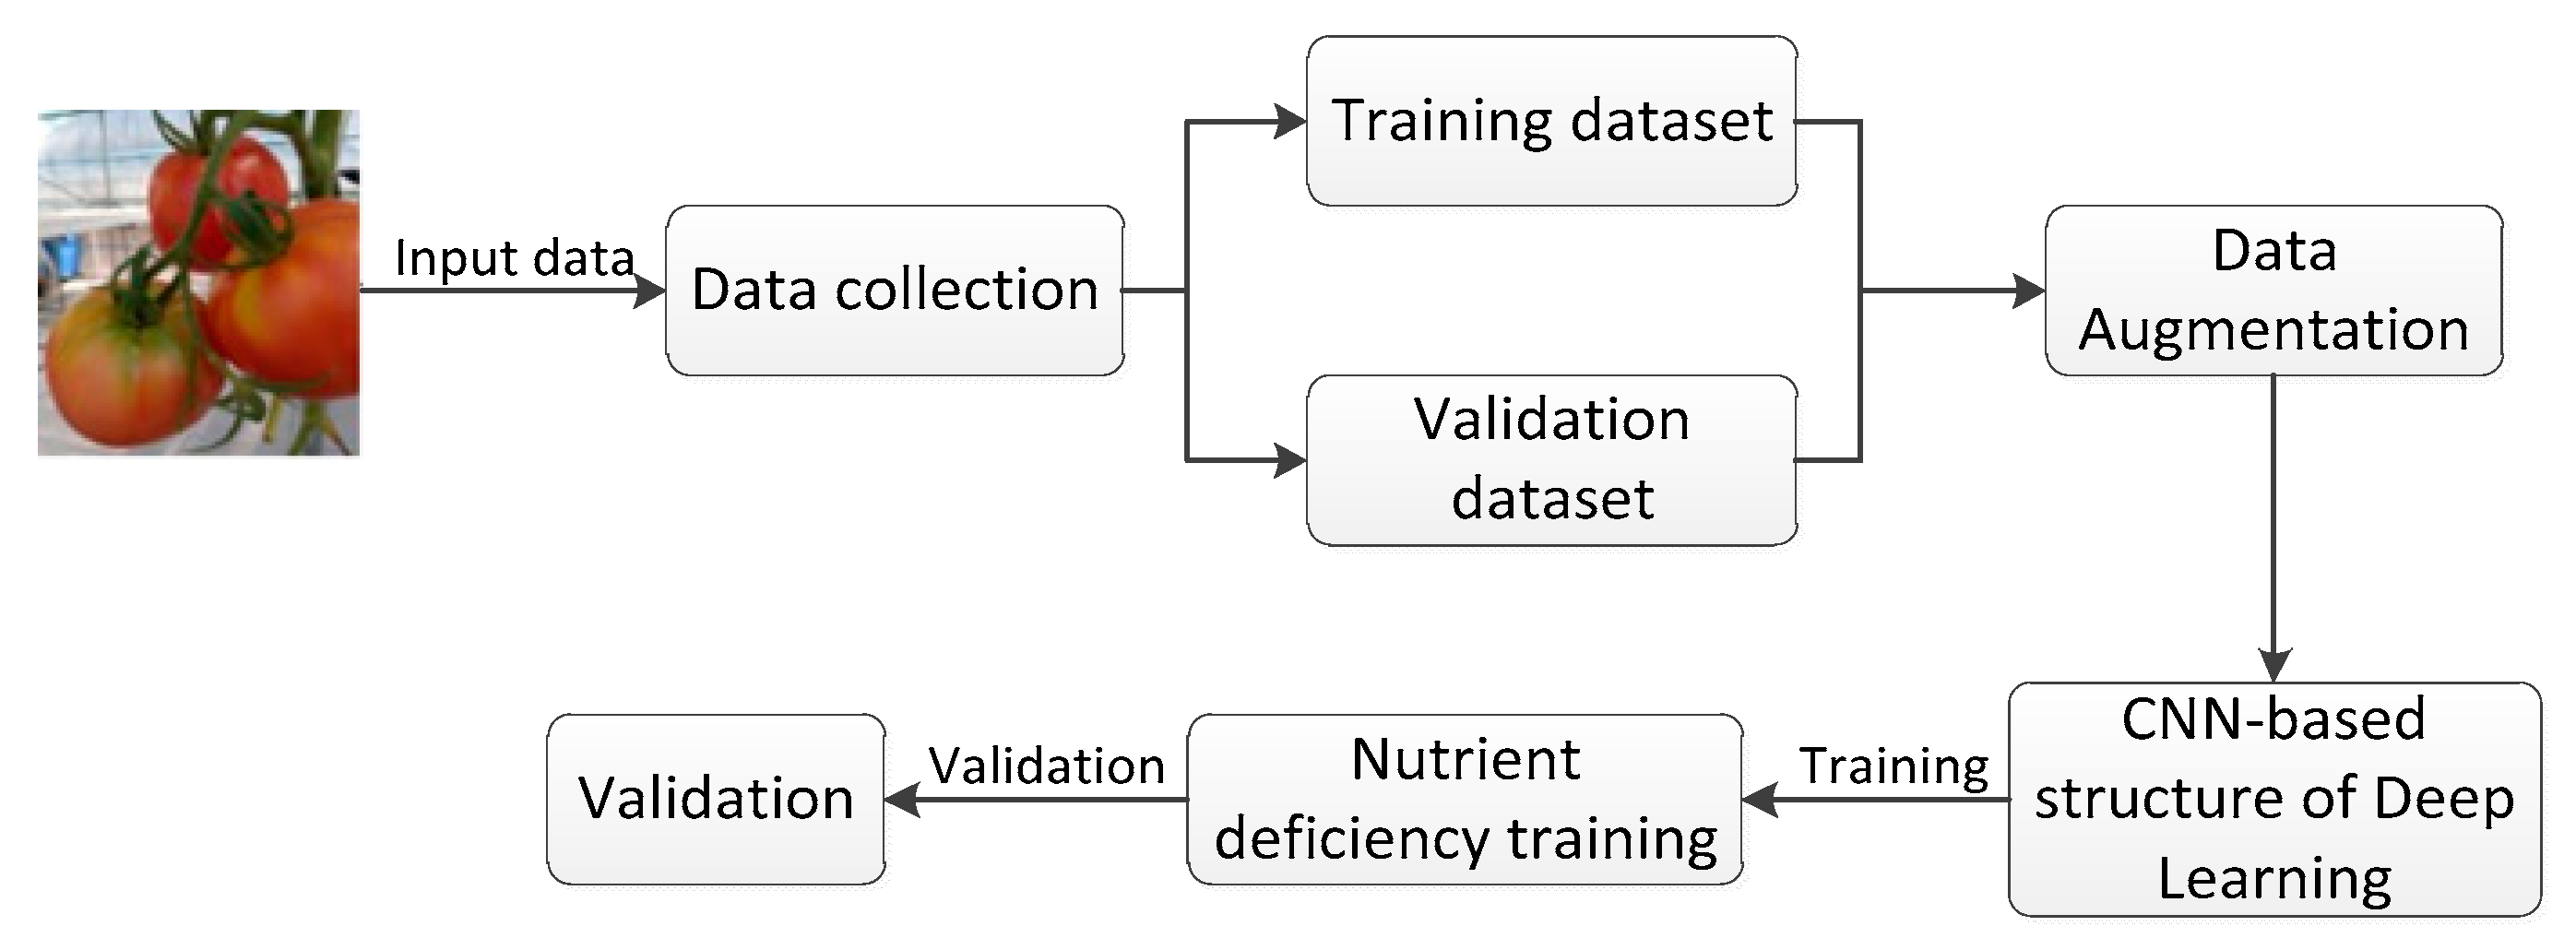
To collect data for nutrient deficiencies in tomato leaves and fruits, we cultivated tomato plants under greenhouse conditions and induced deficiency status with respect to Calcium, Potassium, and Nitrogen through the process of fertilizing the tomato plants. The gathered data involves captured images of tomato leaves and fruits in the state of deficiency of the three nutrients mentioned above. As can be seen from Figure 1, the photos were taken using a simple recording device during the growth of the tomato plants. We used a smartphone camera and a digital camera with Full HD resolution to capture the images at different angles.
In accordance with the system proposed in Figure 1, the original images were collected and used for the training and validation dataset. In addition, the original images were further expanded through data augmentation (e.g., shift, rotation, and resizing) before they were used with the deep learning model. Therefore, this allows users to capture input images using a smartphone at different angles, as well as different values of brightness and contrast, in order to evaluate the performance of predictive models.
2.2. Training and Validation Dataset
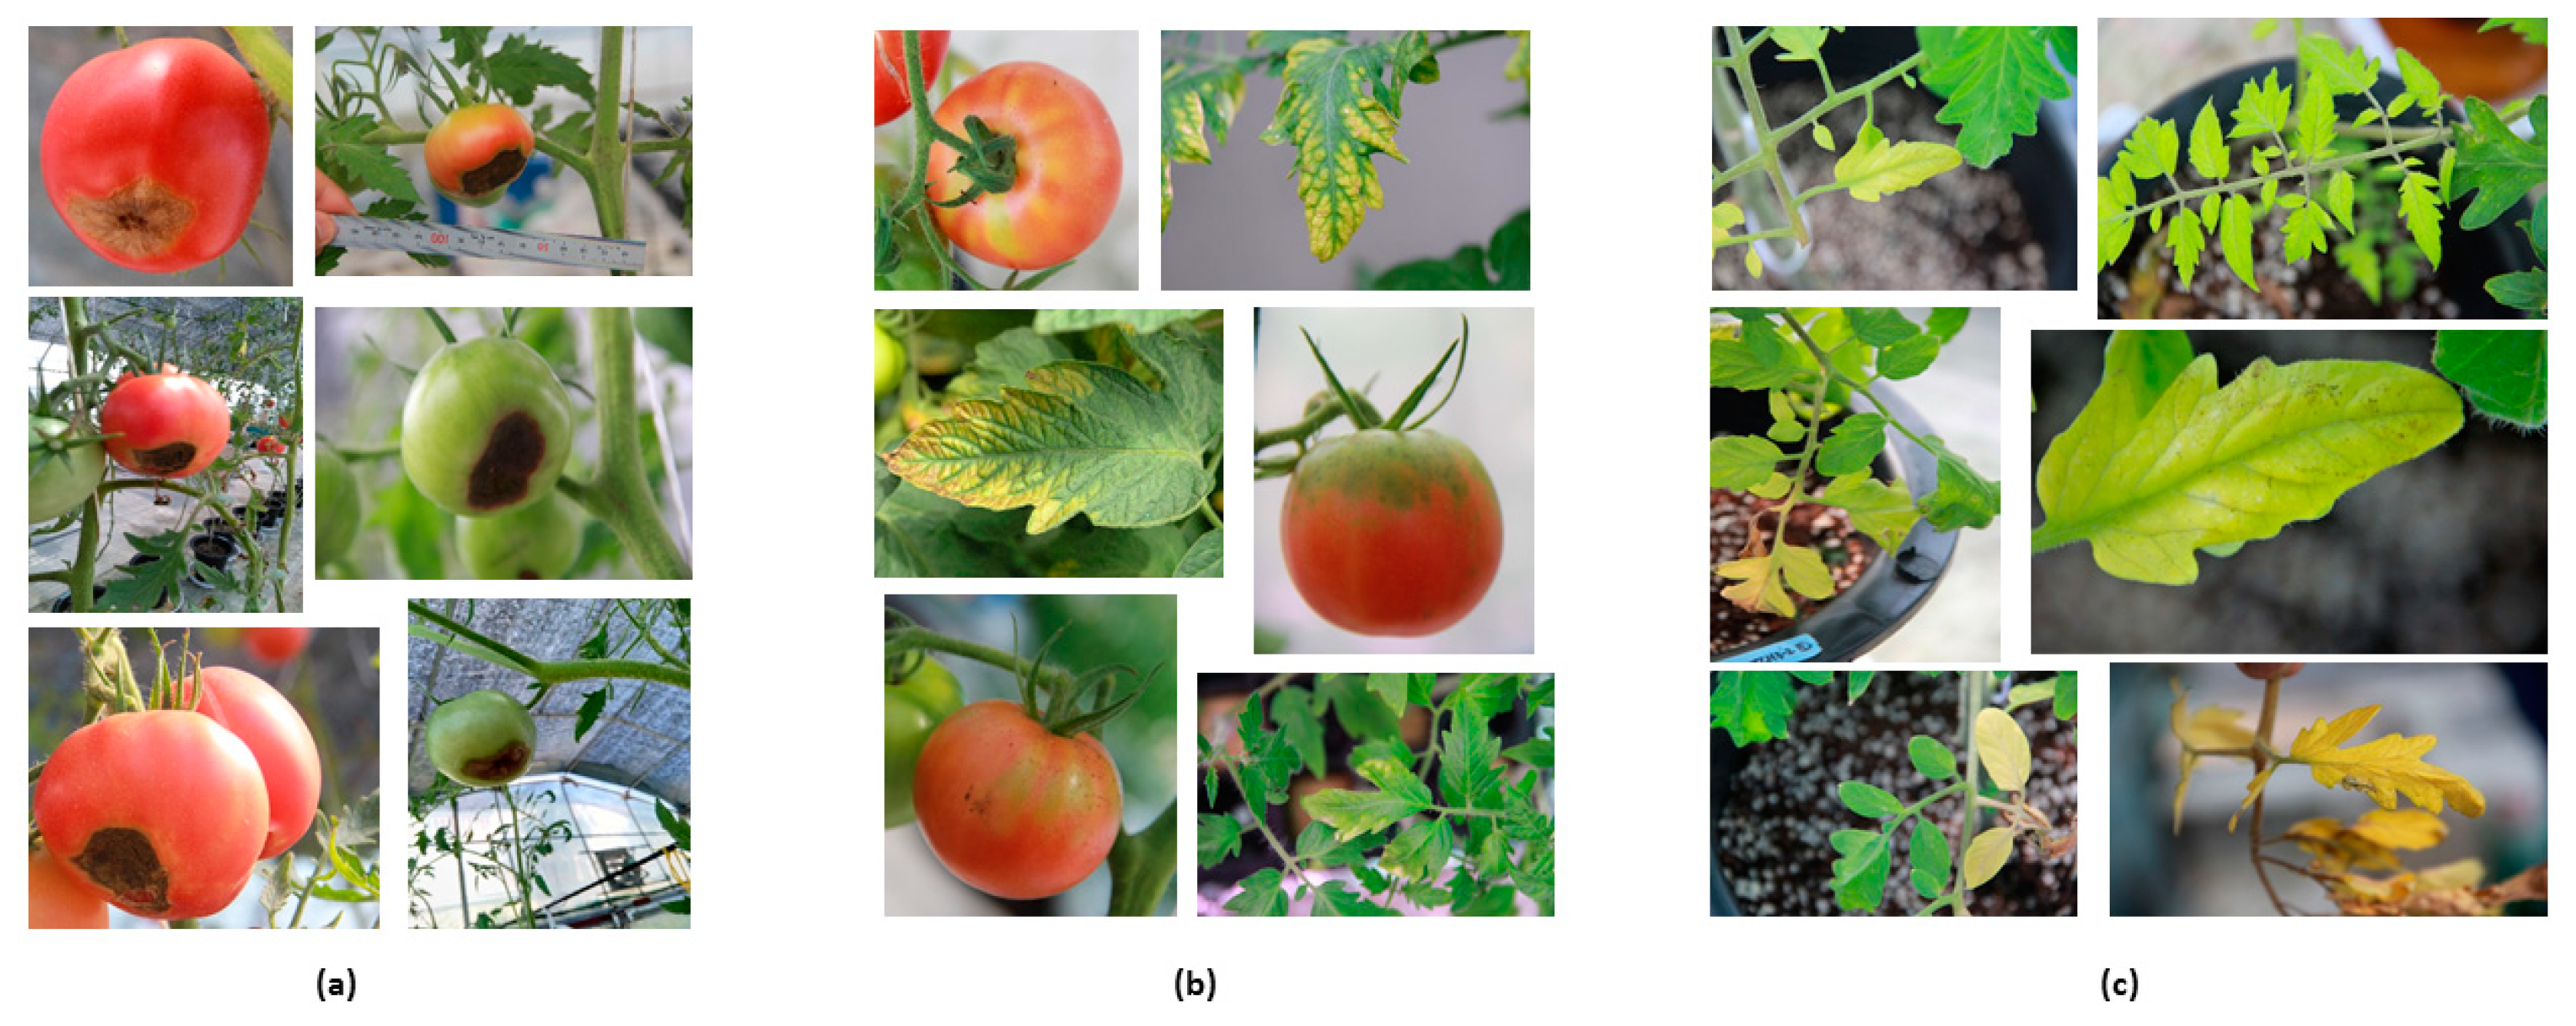
Like other crops, tomato plants need to be supplied with adequate minerals and micronutrients to avoid diseases. As mentioned above, in order to generate the expression of symptoms of nutritional deficiencies, such as Calcium, Potassium, and Nitrogen deficiencies, in the leaves and fruits of tomato, we carried out this study under greenhouse conditions. A digital camera and smartphone camera were used to collect images of each nutrient deficiency symptom, as shown in Figure 2. As can be seen from Figure 1, the lack of nutrients can be observed during the early stage symptoms of deficiency in leaves and fruit. To create a database for training the AI model, we relied on the distinctive signatures between the investigated substances, which included Calcium, Potassium, and Nitrogen. Calcium deficiency is mostly expressed on the tomato fruit; Potassium deficiency appears earlier on leaves, and on the fruit in the middle stage; and finally, Nitrogen shortage is shown on the leaf. Based on the characteristics of the nutrient deficiency. We labeled each observed mineral nutrient as follows: number zero for Calcium, number one for Potassium, and number two for Nitrogen.
In Table 1, the total number of captured images collected by the proposed system for the three different macronutrients can be seen. The database consisted of 571 images, which were grouped into two parts, with 80% of the dataset (461 images) being used for training and 20% (110 images) being used for validating the performance of the two models. Three macronutrients, i.e., Calcium, Potassium, and Nitrogen, were considered as the subjects of monitoring and identification during the growth of the tomato plants.
Each image in the database is labeled according to the development stage of each selected nutrient to be tested. In this article, to predict and classify nutritional deficiencies with respect to three macronutrients, we employed two forecast models: Inception-ResNet v2 and Autoencoder. The neural network requires all images used for training to be of a similar size. Hence, the images were preprocessed in order to scale to 299 × 299 pixels.
3. The Application of the Deep Convolutional Neural Network for Classifying and Predicting Nutrient Deficiencies
In this study, we used two models of machine learning groups, including supervised learning (Inception-ResNet v2) and unsupervised learning (Autoencoder), to classify and forecast deficiencies in three macronutrients, including Calcium, Potassium, and Nitrogen. Both models were based on CNN, both for training and to evaluate the predictive results. A CNN architecture is built with convolutional layers with various sizes of the kernel. It is able to convert an input image into smaller and smaller convolutional layers by means of the network using a number of feature maps. In addition, we use Ensemble Averaging to combine two given models for improving predictive accuracy.
3.1. Inception-ResNet V2 Model Architecture
To classify and predict the nutritional deficiencies in tomato plants, in this article, we finely tune the Inception-ResNet v2 model based on the CNN architecture. The concept of the inception module was developed by C. Szegedy et al. in [28] using the GoogLeNet structure, which creates a sub-network that reduces the top-5 error rate to below 7%. In addition, C. Szegedy et al. proposed several general concepts and optimizations to scale up the convolution network using an inception type network for computer vision in [29]. The inception module uses various hyperparameters, including several feature maps and several different kernel sizes, i.e., 1 × 1, 3 × 3, and 5 × 5, which makes it possible to identify patterns using a variety of different scales of layers, strides, and paddings. With the inception module, the layers use a stride of 1 and the same padding.
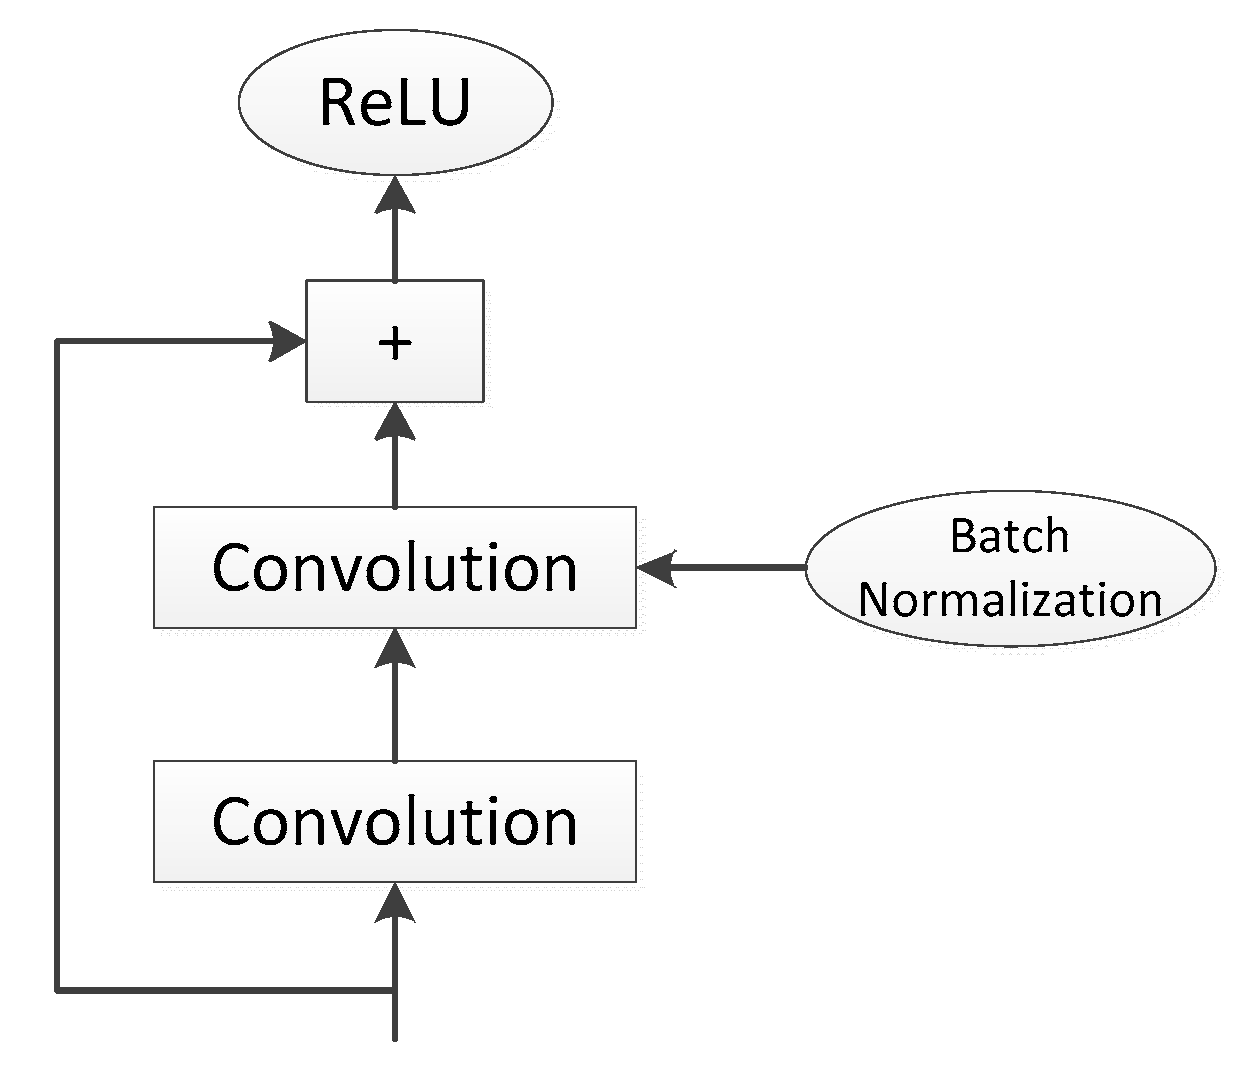
The residual network was developed by Kaiming He et al. [30]. The key idea of the residual network for training is to use short connections. Figure 3 demonstrates the residual unit structure with batch normalization (BN) and the rectified linear unit (ReLU) activation function. BN is applied specifically to address the vanishing gradient problem. According to Ioffe et al., the problem is addressed by involves formatted phenomena such as internal covariance shifting as a result of normalizing the layer inputs, and using an ensemble of batch normalization networks was able to achieve a top-5 error rate of about 4.9% on ImageNet classfication [31].
The idea is to solve the vanishing gradients problem by using batch normalization. In order to implement the BN technique, we need to evaluate the mean and standard deviation of the inputs over the current mini-batch, which can be summarized as follows:
where z(i) is the output of the BN operation with a scaled and shifted version at the i-th number of instances in the mini-batch, is the scaling parameter for the layer, denotes the zero-centered and normalized input, and is the offset for the layer.
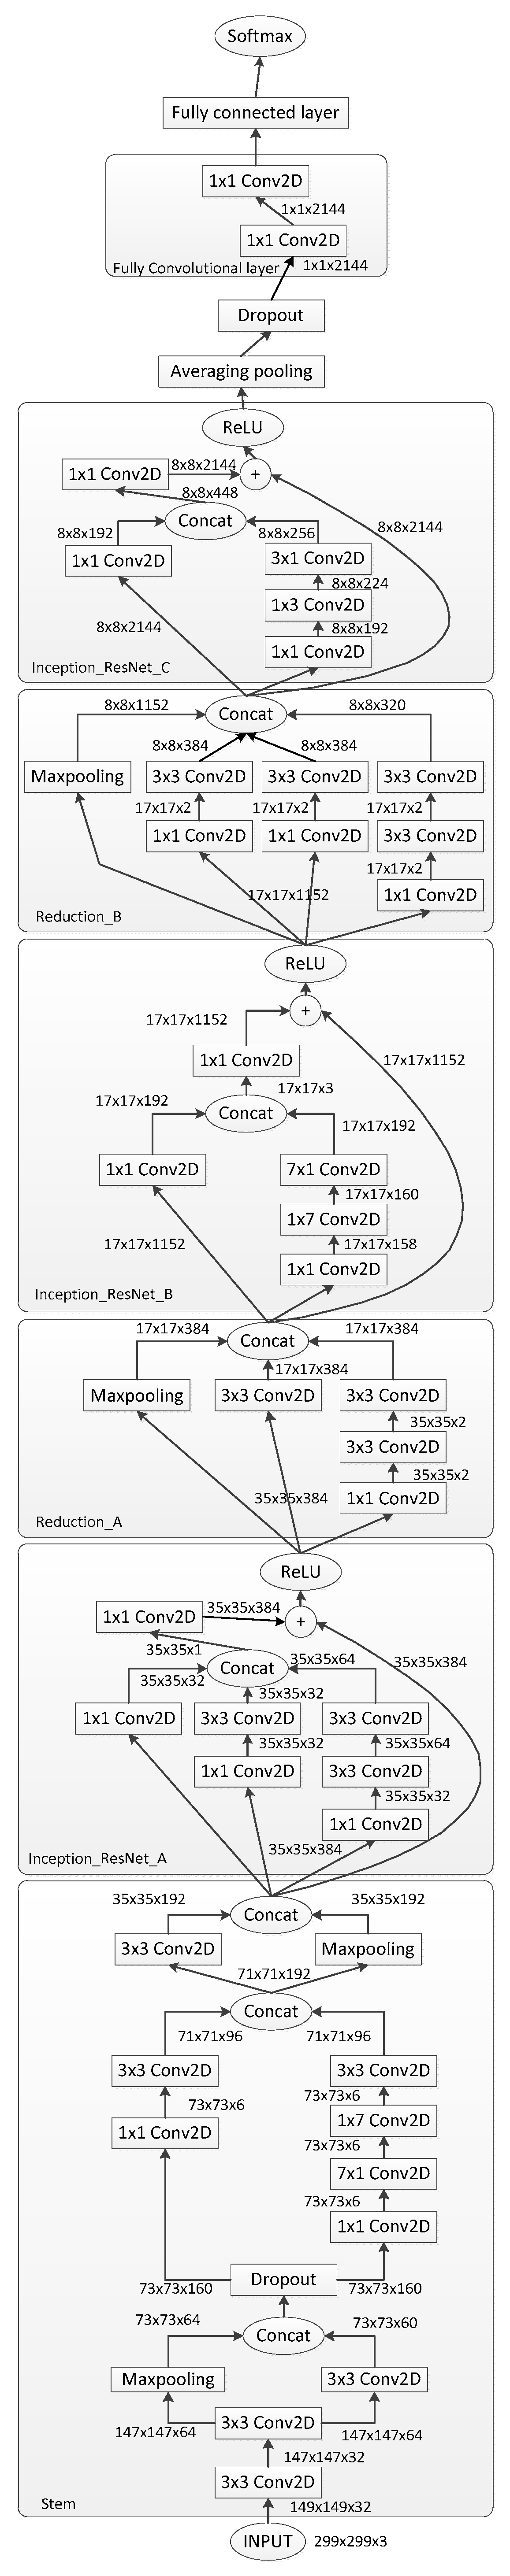
Using this method, the vanishing gradients problem is solved in the Inception-ResNet v2 model. In addition, to avoid overfitting in this model, dropout is used in this paper to eliminate overfitting through regularization. Dropout is a popular regularization technique for deep neural networks, and in [32,33] it was reported to achieve an additional 1–2% of accuracy. During the process of training, we also apply dropout for the stem layer and before the two fully connected layers, as shown in Figure 4.
To implement Inception-ResNet v2, a model was proposed by Christian Szegedy et al. [34] using the scheme described in Figure 4, where the size of the input is still 299 × 299, with three basic colors for the stem layer. However, the difference of the model used in this article is that we added the dropout after the first concatenation filter in order to avoid the occurrence of overfitting in the first step of the model. Next, we reduce the grid size from the stem layer from 299 × 299 to 35 × 35 in Inception-ResNet A, to 17 × 17 in Reduction A, and to 8x8 in Reduction B. On the other hand, all traditional layers use a batch normalization layer, and ReLU is applied as an activation function to avoid the vanishing gradient problem. Moreover, based on the proposal by Behzad Hasani et al. in [35], we changed all of the “valid” padding to “same” padding in order to reduce the size of the feature map, which means that all output grids will be the same size as their input grids. This model was designed using the Tensorflow libraries on an NVIDIA GeForce TI 1080 GPU with a learning rate of 0.0001.
3.2. Autoencoder Model Architecture
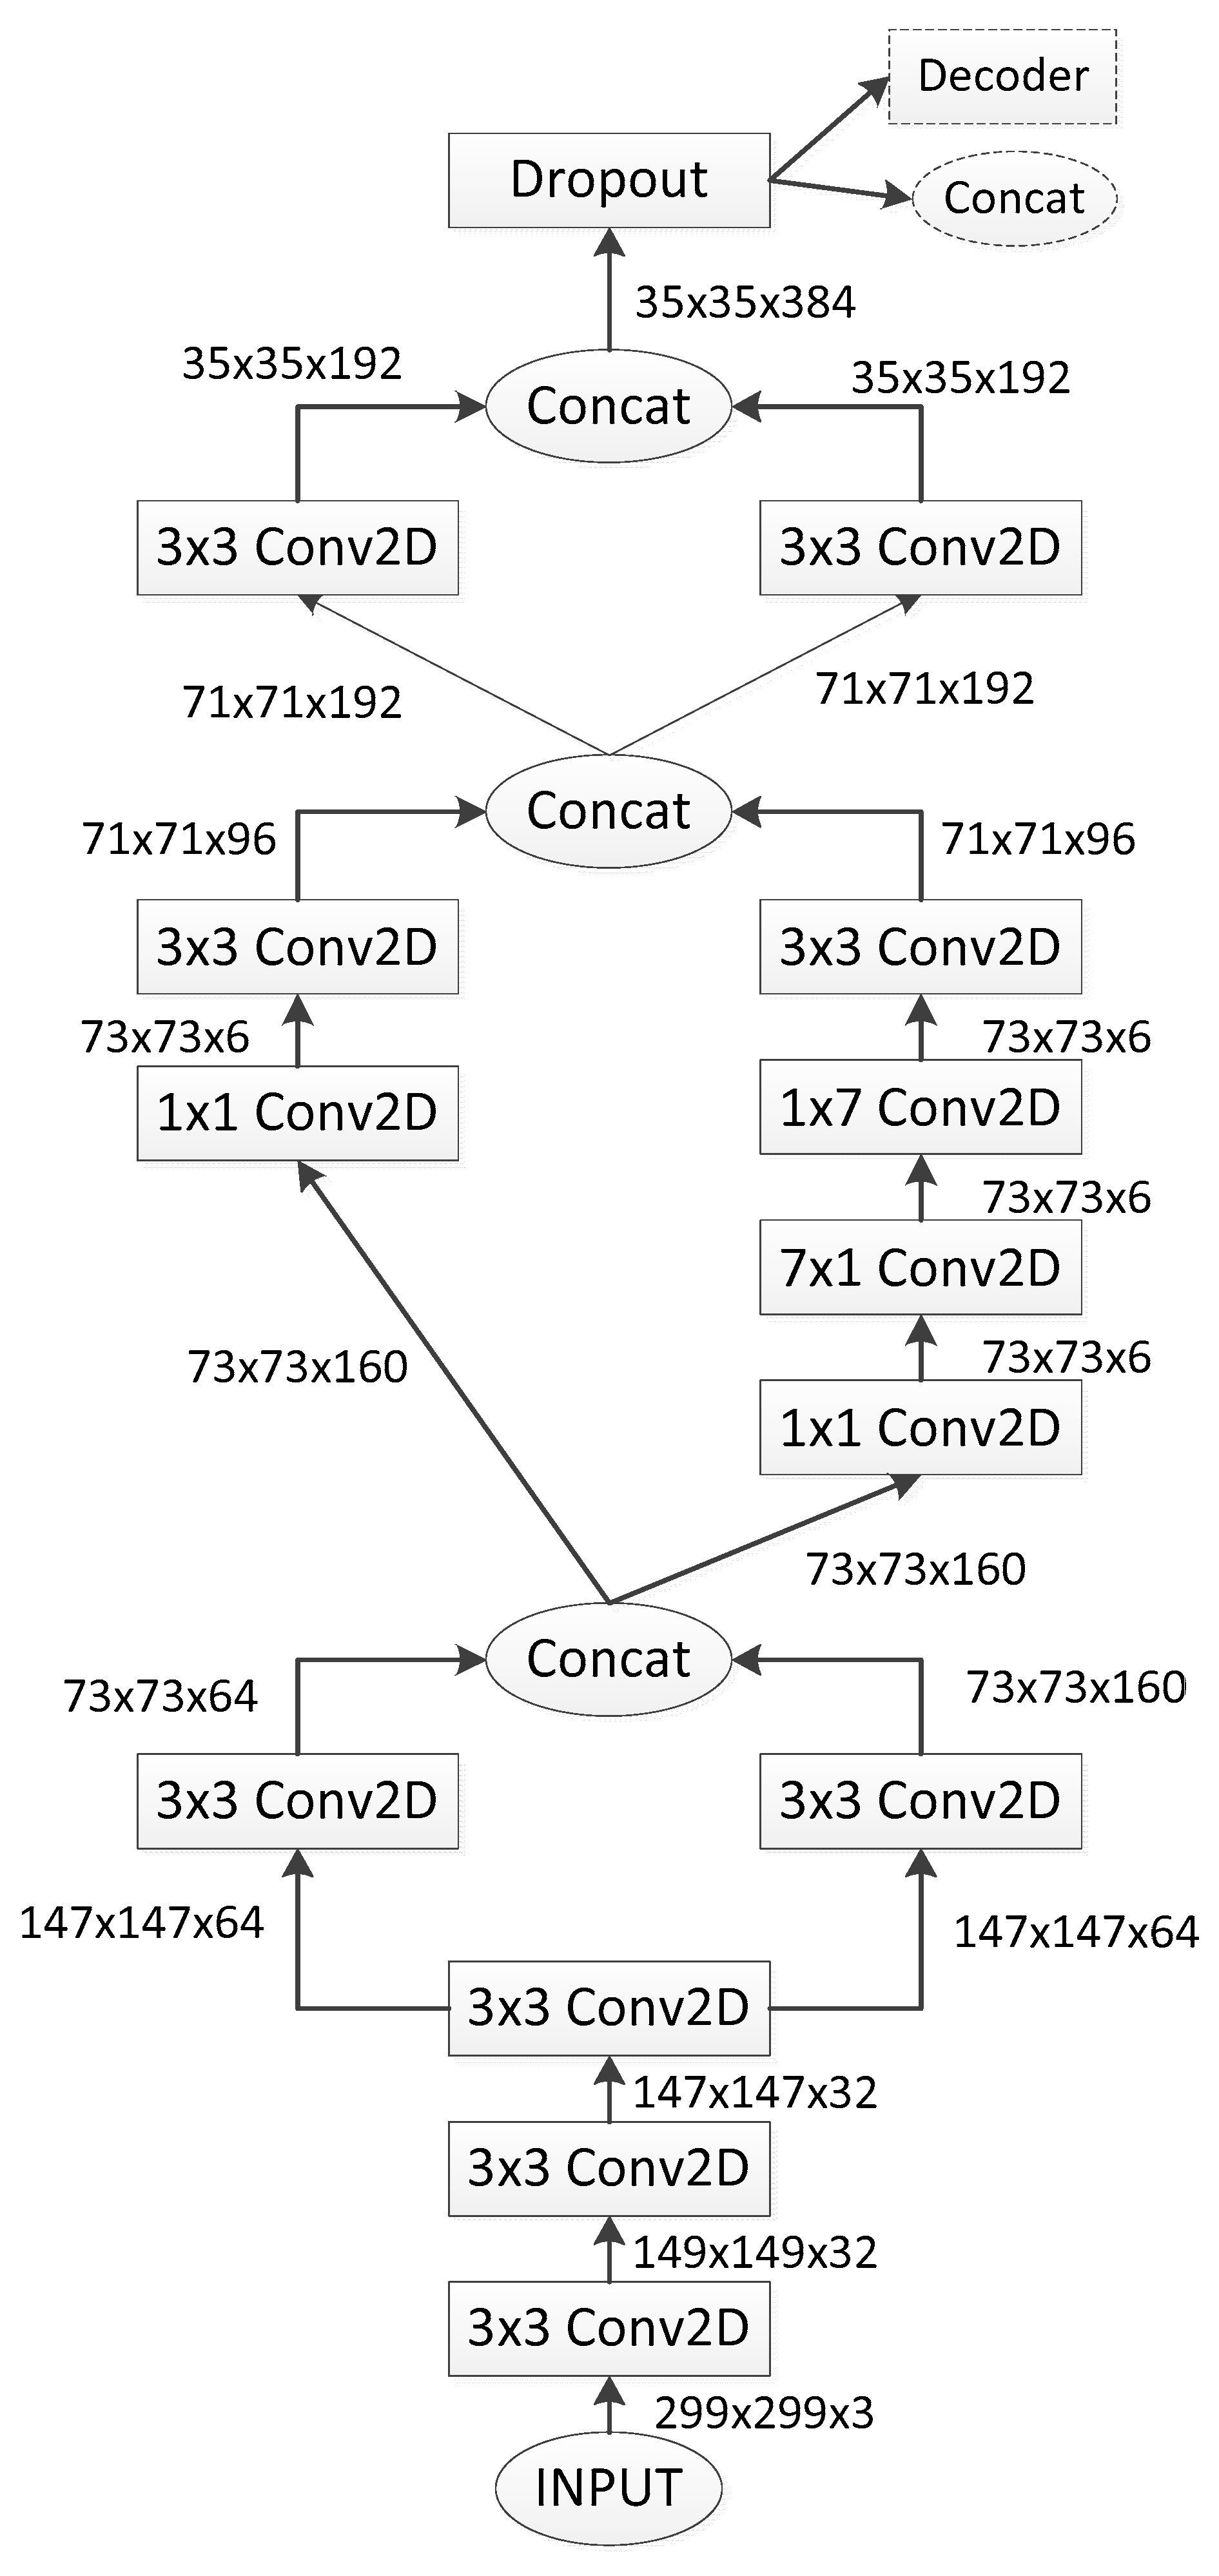
For pre-training DNN, Autoencoder is considered to be a type of ANN that is capable of learning for the purpose of the efficient representation of input data labels with an unlabeled dataset. The Autoencoder model will learn to compress the input images into a short code, and subsequently extract that code into an output the represents as much of the original images as possible. Pascal Vincent et al. introduced Autoencoder for use in feature extraction, as presented in [36]. To this end, Autoencoder is composed of two parts, the encoder and the decoder. The encoder is used to generate an internal representation on the basis of the input images, and the decoder is used to convert those internal representations into output images on the basis of a pre-trained dataset. The model structure of Autoencoder is shown in Figure 5, and leverages the Inception-ResNet v2 architecture shown in Figure 4 as its CNN structure. However, unlike Inception-ResNet v2, the Autoencoder model uses an unlabeled dataset, which saves a significant amount of time by avoiding labeling in the case of large datasets.
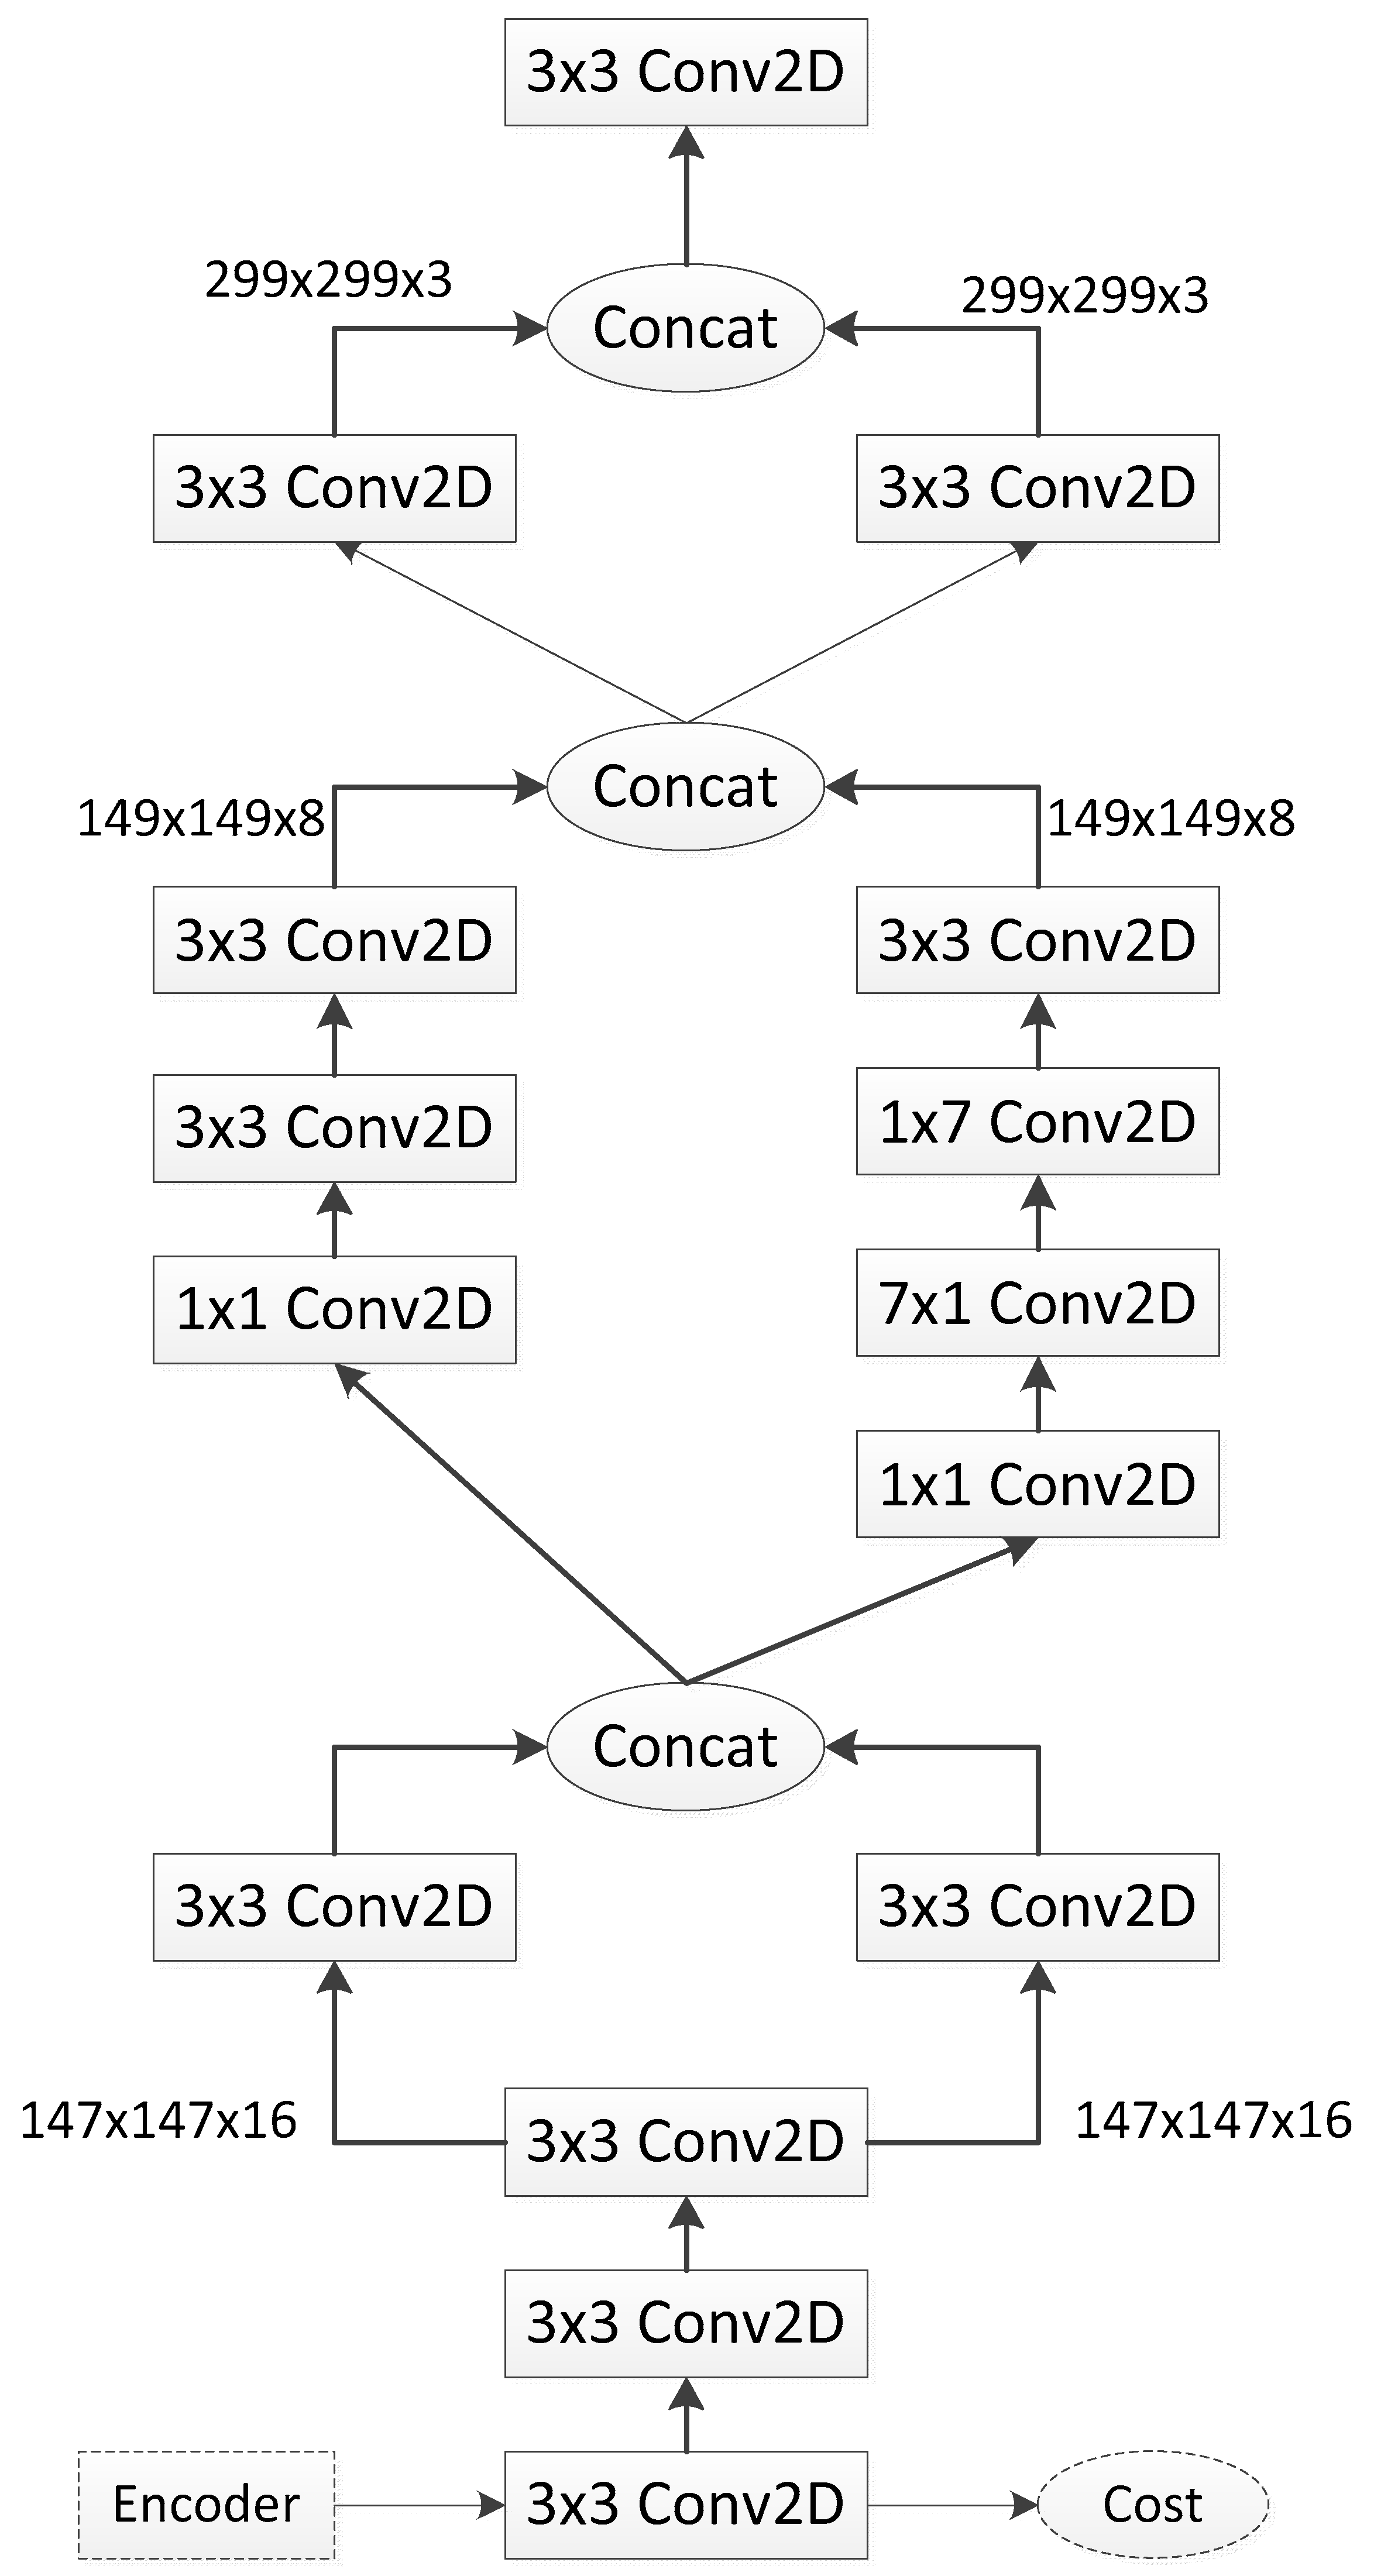
In order to perform the conversion of the input images into an internal representation using the CNN structure, we use a grid size starting from 149 × 149 and then decrease this to only 35 × 35 on the basis of an output of 192 feature maps. After the depth concatenation layer, the number of feature maps is increased to 384 before applying a dropout in order to reduce overfitting during the process of copying the input images. The decoder structure is demonstrated in Figure 6. As can be seen from Figure 6, the decoder decodes a code that is generated by the encoder structure, which encodes the input images in order to obtain corresponding output images that are as close as possible to the original. Similar to the Inception-ResNet v2 model described above, based on CNN, the convolution layer has a kernel of 1 × 1, using a stride of 1, and the other convolution layers have kernels of 3 × 3 and strides of 1 or 2. In addition, most paddings are “valid”. Only a few paddings are “same”. Moreover, all of the convolution layers used for this model apply ReLU as an activation function for the neurons to normalize the output. Thus, using the decoder structure shown in Figure 6, the images in the training dataset will be converted into output images that are as similar as possible to the original images.
3.3. Ensemble Averaging
Another method used in our study is Ensemble Learning. The idea of ensemble methods is that the results of multiple machine learning models can be combined to increase the accuracy of identification and forecasting. Cheng Ju et al. designed several experiments to indicate the effective performance of ensembles using deep CNN for image classification. In this study, we used ensemble averaging to improve the robust level of recognition accuracy from the results of two models above, as shown in [37]. Ensemble learning is a technique that allows one model to combine the group of predictors in order to achieve greater accuracy in prediction. There are two categories of ensemble learning, including
- Basic ensemble techniques, include max voting, averaging, and weighted average.
- Advanced ensemble techniques, include stacking, blending, bagging, and boosting.
In our study, we select and use ensemble averaging technology to perform the combination of both of the predictive models outlined in Section 3.1 and Section 3.2 based on the average when calculating the bias and variance of each model. Thereby, from the results of the two forecasting and classification models described above, we calculate the average of each case of nutrient deficiency for each model. Then, we summarize these average values, and select the highest final value as the final predictive result for the purposes of validation. Therefore, this can increase the efficiency of classification and identification of nutrient shortage status, while also increasing the accuracy of identification and forecasting. We calculate the weighted average value for each model based on the following equation:
where N is the number of predictors, denotes the learning rate, is weighted error rate of the j-th instance.
4. Experimental Results
To evaluate the forecast performance of the two models, Inception-ResNet v2 and Autoencoder, we use the images in the validation dataset; the number of images is indicated in Table 1.
4.1. Inception-ResNet v2
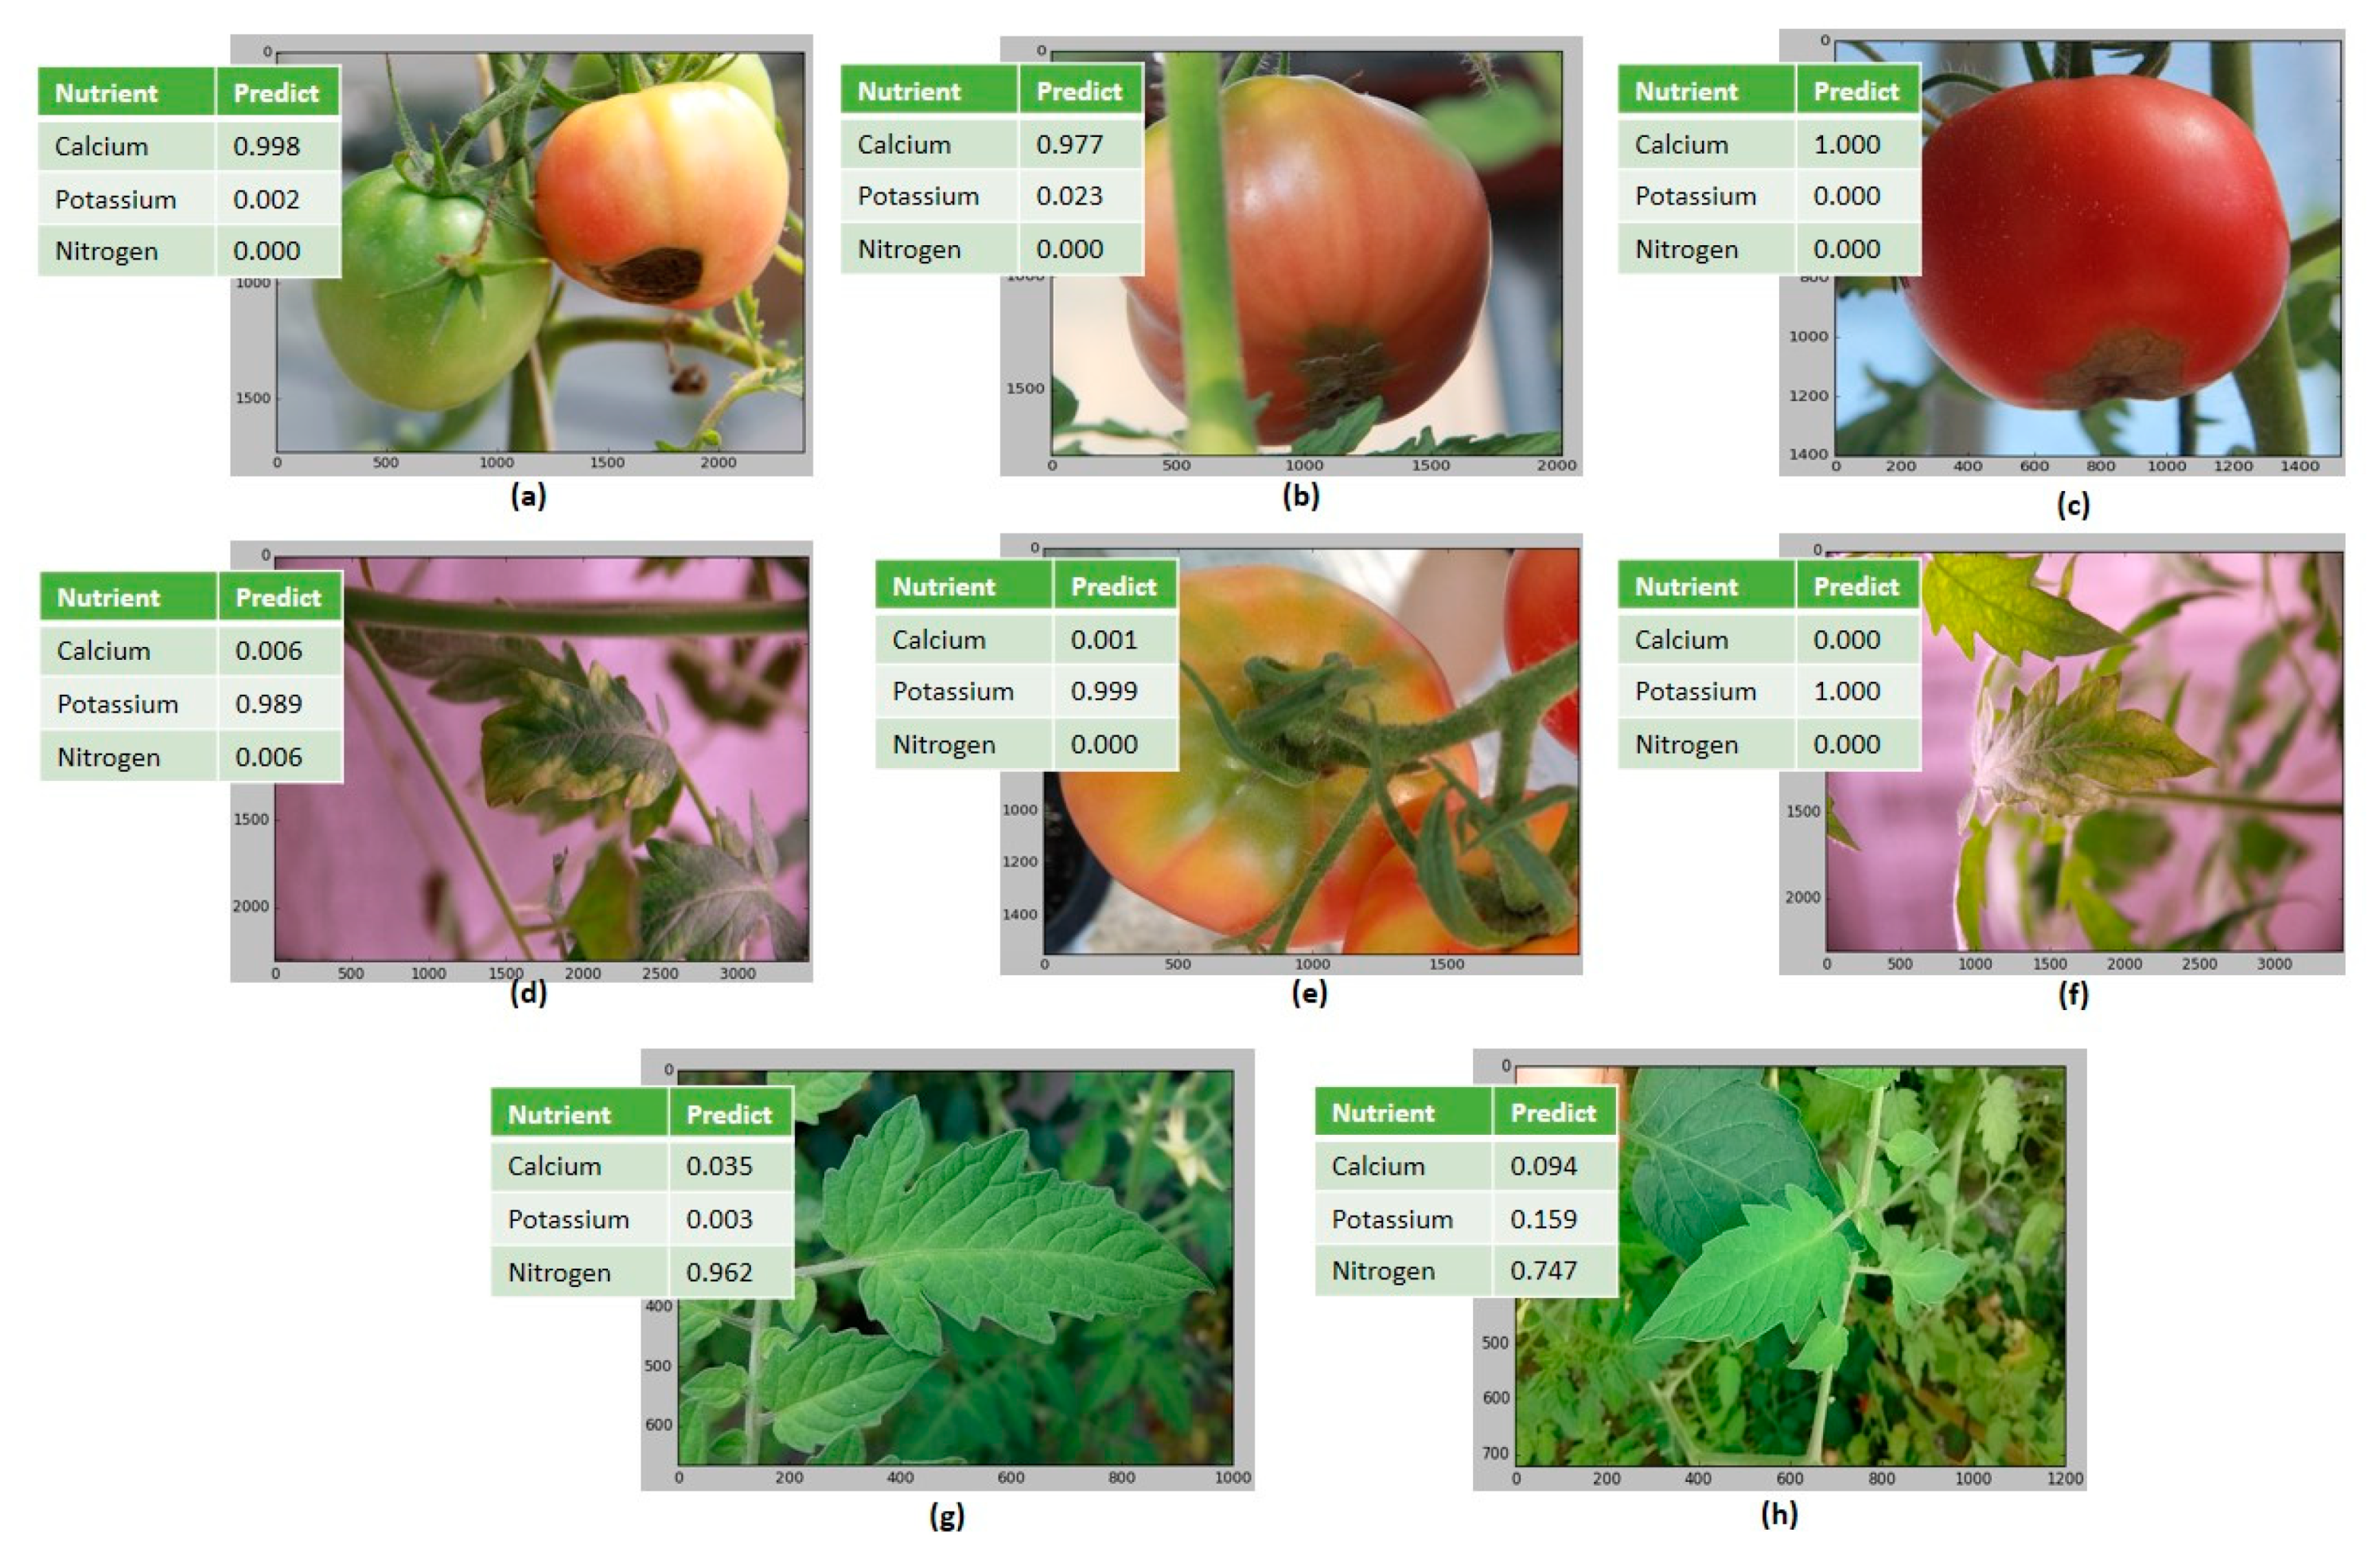
Based on the model of prediction and classification described in Section 3.1, Figure 7 shows the results of nutritional deficiencies in tomato plants determined using the Inception-ResNet v2 architecture. As can be seen from Figure 7, we compare the forecast results based on the nutritional deficiency observed in both the leaves and the fruits of tomato. For Potassium, the lack of this macronutrient is expressed in leaves and fruits, while for Calcium, the phenomenon can only be observed in the fruits of tomato, and for Nitrogen, shortage is expressed only in the tomato leaves.
The results of Calcium deficiency are presented in Figure 7a–c. It can be seen that the forecasting rate of Figure 7a is 0.998, while this value is 0.977 for Figure 7b, and 1.0 for Figure 7c. For Potassium, the prediction results are shown in Figure 7d–f, whose maximum values are 0.989, 0.999, and 1.0, respectively. For the prediction of Nitrogen deficiency, the identification results are shown in Figure 7g (0.962) and Figure 7h (0.747). In addition, the accuracy of the prediction results was 87.27% when using the Inception-ResNet v2 model applied in our study.
We use a confusion matrix with three classes to calculate actual and predicted classifications for both of the models in this paper. The actual and predicted precision will be calculated for each nutrient based on the confusion matrix results in Section 5. The precision of Inception-ResNet v2 is based on the proportion of correct predictions and the total number of data used for testing.
4.2. Autoencoder
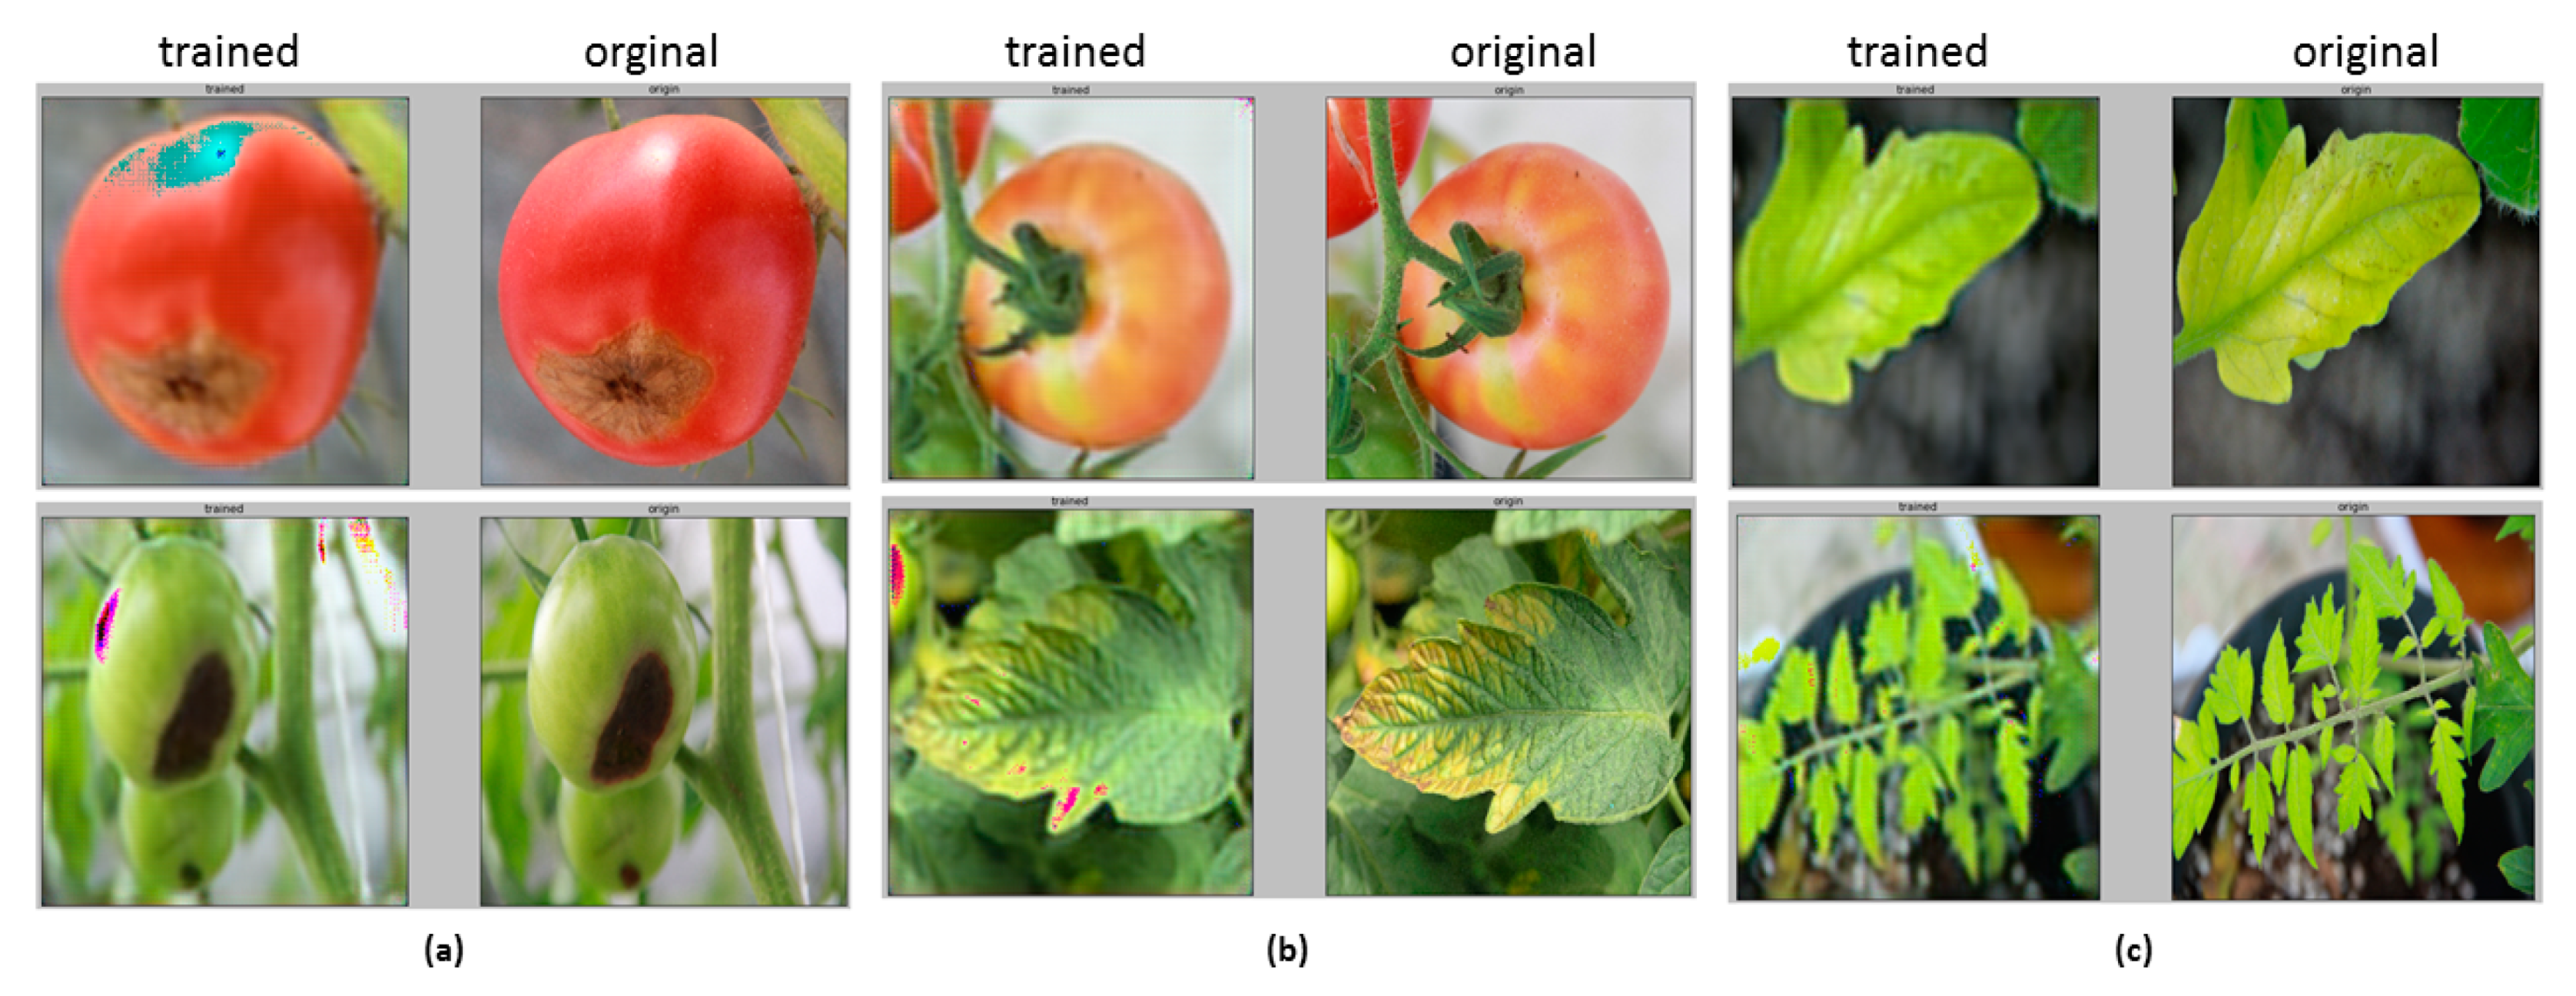
For the Autoencoder model, the encoding of the images in the training dataset needs to be completed before training in order to predict and classify nutritional deficiencies (e.g., decoding). Figure 8 illustrates the results of the comparison between the original images in the training dataset and the images from the Autoencoder model after being encrypted and used for training. Figure 8a represents the coding results for the nutritional deficiency of Calcium.
Figure 8b,c shows the results of the encryption for Potassium shortage and Nitrogen deficiency, respectively. As shown in Figure 8, the coding and decoding can recognize the training results and produce images that are almost the same as the original images. This makes it possible for predictive results based on decoded and trained images to achieve high accuracy in the classification process.
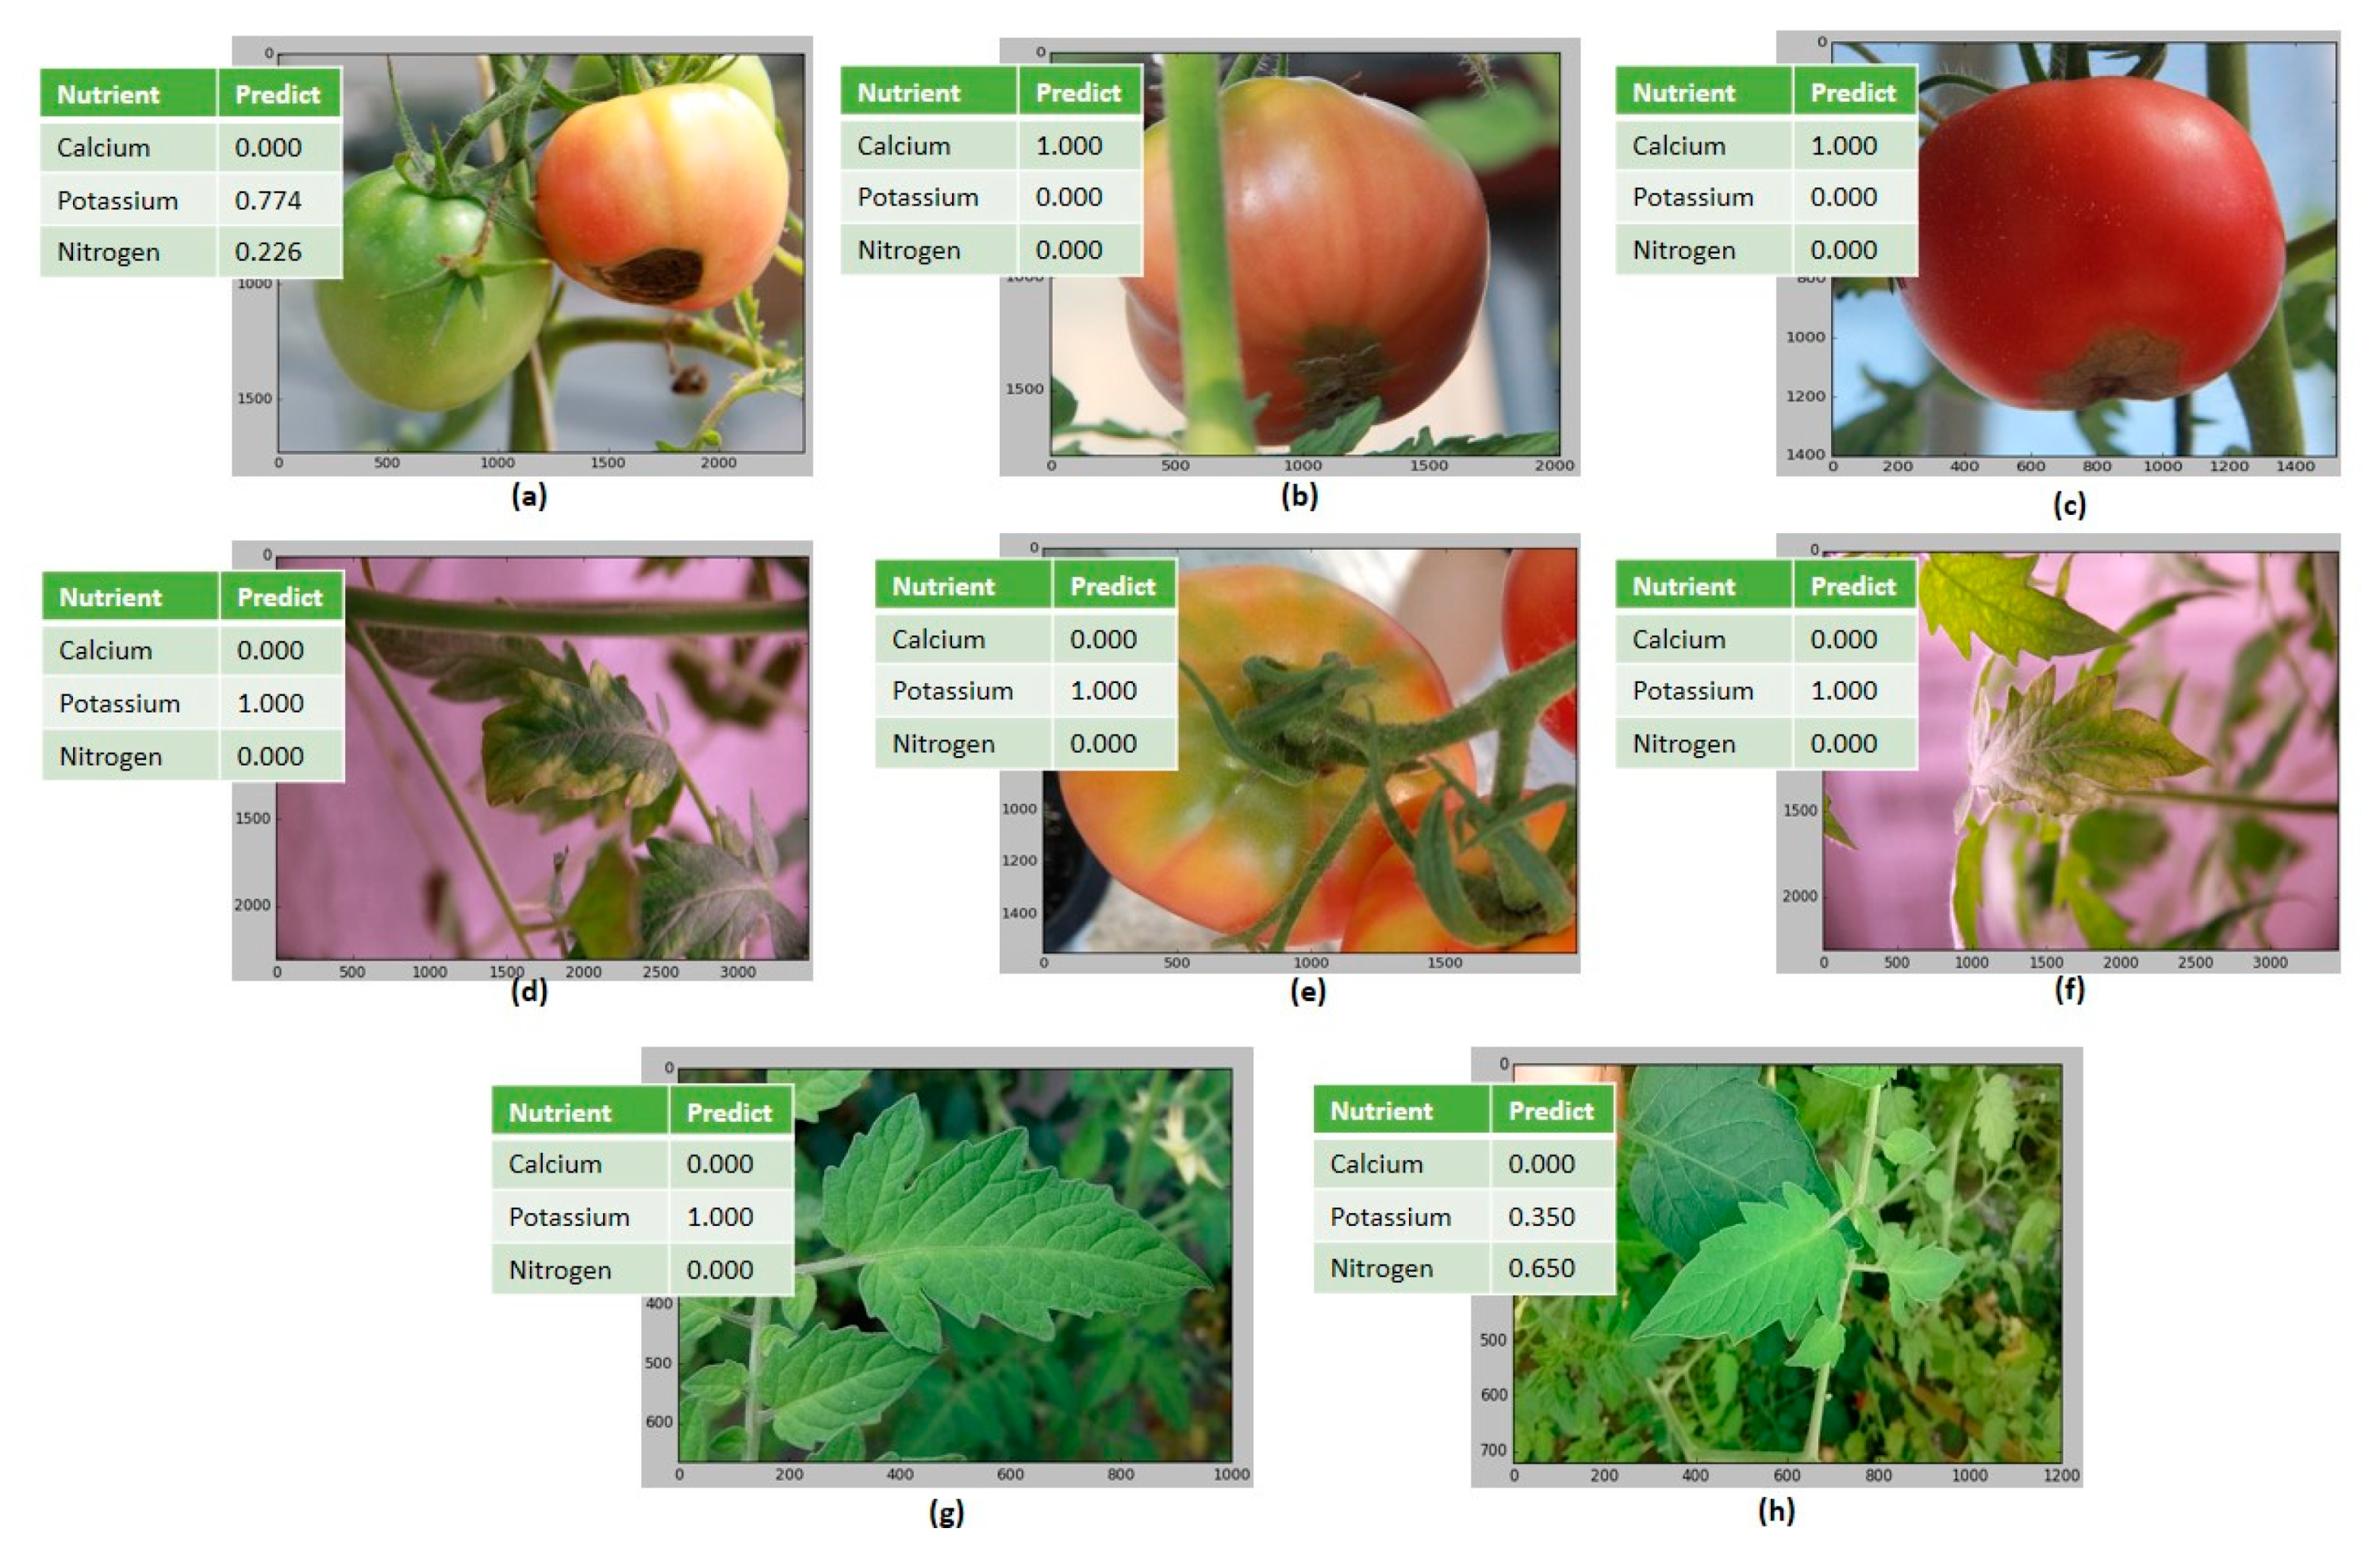
Accordingly, the results of the Autoencoder model are shown in Figure 9. It can be seen that the prediction performance was not able to achieve a good result in Figure 9a due to an inaccurate forecast expression of the symptoms of Calcium deficiency on the tomato fruit in the test case. Moreover, Autoencoder was not able to achieve a good prediction for the expression of Nitrogen deficiency in Figure 9g. Figure 9b,c show the highly predictable for classifying Calcium deficiency, and Autoencoder model achieves the high predictive accuracy for Potassium shortage as shown in Figure 9d–f. Therefore, the validation value for the forecast in this model is about 79.09%. Similar to the Inception-ResNet v2, a confusion matrix is also used to calculate the accuracy of the training and validation datasets for the assessment of forecasting accuracy using Autoencoder as mentioned in Section 5.
4.3. Ensemble Averaging
According to the Ensemble Averaging concept described in Section 3.3, the average values of each prediction model are shown in Table 2. It can be seen from Table 2, the predicted values for each expression of nutrient deficiency are summed up and compared with one another. Then, the highest predicted values for each category are selected as the final forecast result. In fact, the validation value increases to 91% after calculating the average value of both predictive models described above.
Compared with the results in Figure 7a using Inception-ResNet v2, the Autoencoder model incorrectly predicted Calcium deficiency expression on the fruit of tomato, in Figure 9a. Meanwhile, the Inception-ResNet v2 had a higher result than Autoencoder for predicting Nitrogen deficiency, as shown in Figure 7g and Figure 9g. In addition, with respect to the results of the expression of Nitrogen deficiency in Figure 7h and Figure 9h, both models have a low predictive rate for Nitrogen shortage. The results in Table 2 reveal that the ensemble model achieves a summed value of 10.83, which is higher than other nutrients, leading to an accuracy of 1.0. Simultaneously, the prediction of Nitrogen deficiency increased to 0.989, which is higher than the predicted results for either of the two models, as shown in Table 3.
5. Comparison and Validation
Based on the number of images used to validate forecasting ability in Table 1 and the comparison results in Table 3, it is apparent that the performance of Inception-ResNet v2 model with the modified structure using several sub-networks is higher than the Autoencoder model (without residual learning in its structure). Considering both of the model structures described in Section 3.1 and Section 3.2, as well as the results in Table 3, we evaluate the effectiveness of forecasting under the same conditions.
In general (see Table 3), the forecast results of Inception-ResNet v2 achieve greater accuracy than Autoencoder in our study. When looking at the comparison indexes in Table 3, it is easy to recognize that prediction and classification in the Calcium and Nitrogen groups using Inception-ResNet v2 is higher than when using Autoencoder. Particularly, in Figure 7a, and Figure 9a, Inception-ResNet v2 accurately predicts the expression of Calcium deficiency on the fruit of tomato, whereas Autoencoder does not match it correctly. In the case of Potassium prediction, the accuracy rates of the two models are almost equal. However, for forecasting the expression of Nitrogen deficiency, Autoencoder has an uncorrected prediction, as presented in Figure 9g. Meanwhile, Inception-ResNet v2 achieved an exact ratio of 0.747, which is not so much higher than the 0.650 achieved by Autoencoder, as shown in Figure 7h and Figure 9h.
Table 4 shows that validation rate of 87.27% for the Inception-ResNet v2 model, which is higher than the Autoencoder model, whereas the validation rate of Autoencdoer is only 79.09% on the basis of the same number of parameters, i.e., training and validation dataset, number of epochs, learning rate, and so on.
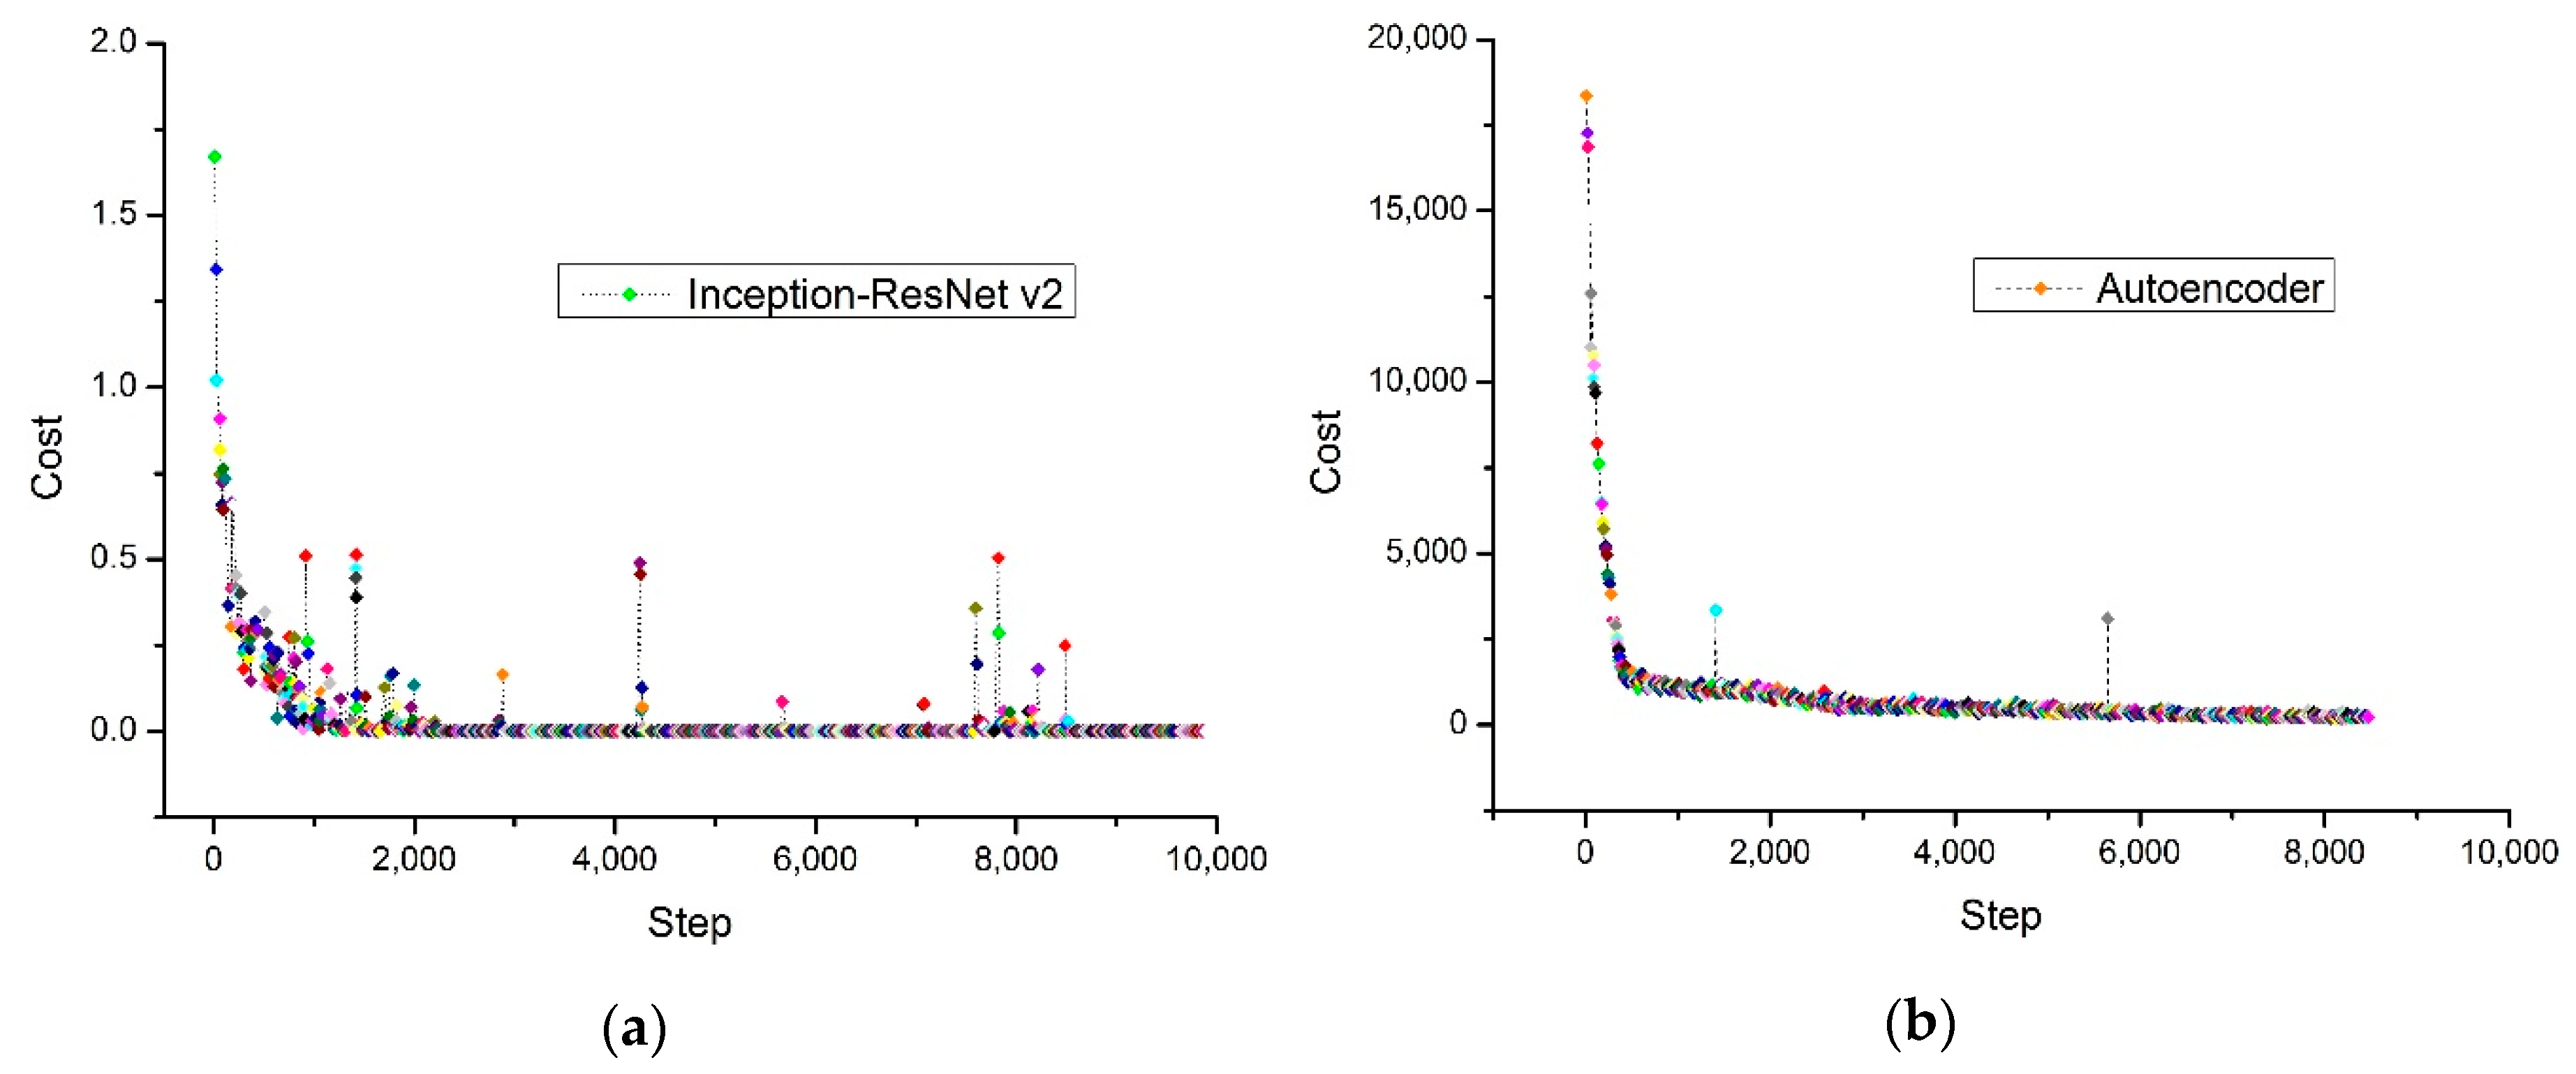
Figure 10a,b shows the relationship between the cost function and the training steps for the two predictive models using only the training dataset. As can be seen from these figures, it is obvious that the Inception-ResNet v2 model creates an algorithm with a higher accuracy than Autoencoder, due to the cost function of the former approaching zero more quickly.
Taking a closer look at the two predictive models described in Section 3.1 and Section 3.2, and based on the results in Table 3, as well as the accuracy rate in Table 4, we used the ensemble average method to increase the accuracy of the forecasting for the classification of nutritional deficiencies in the leaves and fruits of tomato plants. The prediction performance of the ensemble learning is compared with that of both models in Table 5. Accordingly, based on the accuracy and error rates achieved by each predictive result, it is revealed that the ensemble learning technique in our study is more robust than the two previous mentioned methods (see Table 5) used in our study. The 91% achieved by the ensemble is higher than the 87.27% of Inception-ResNet v2 and the 79.09% of Autoencoder for our study.
By using this simple method to evaluate the effectiveness of the DL models, we use the confusion matrix to compare the forecast results for both the training and validation datasets. According to Table 6 and Table 7, it can be seen that the Inception-ResNet v2 model achieves better evaluation indicators than the Autoencoder model with the training dataset that we collected under greenhouse conditions.
For the total of 461 images captured for use as the training dataset, Autoencoder achieves an average accuracy of 95.87% during the model training process. Compared to this value in Table 6, this result reveals that the Inception-ResNet v2 model in this study is stronger than Autoencoder. Table 7 shows the predictive results based on the observed data and the classifier results of Autoencoder for the training dataset.
Table 8 and Table 9 show the precision when both models were verified using the validation dataset. It is noticeable that Inception-ResNet v2 has a higher accuracy than Autoencoder for the classification of all three observed nutrients. However, in both models, forecast and classification of Nitrogen deficiency has a lower accuracy when compared with the others, with concrete results of around 78.26% for Inception-ResNet v2 and 69.56% for Autoencoder. This is one cause of the bad predictive results when we randomly tested the images of Nitrogen shortage in Figure 7g,h and Figure 9g,h. In addition, according to Table 9, the accuracy of forecasting for Calcium in the Autoencoder model is only 80.32%, so the results in Figure 9a are completely incorrect (see Table 3).
6. Conclusions
In the field of cultivation, predicting nutritional deficiencies in macronutrients, as well as in micronutrients, can contribute to suppressing the factors leading to plant pathologies. However, previous studies have only focused on the use of machine learning methods to identify and classify the expressions of disease in plants, particularly with respect to tomato plants. Therefore, accurate assessment and forecasting of the early stages of nutrient deficiency is an urgent matter in agricultural sectors, especially in the farming industry working with greenhouse environments. To this end, our study addressed the key issues by comparing and evaluating the effectiveness of the different models based on the CNN structure to predict and classify early and late phenomena resulting from nutrient deficiencies in tomato plants. Accordingly, two different models of deep neural networks were applied, and they were further developed in order to be able to forecast the expression of nutritional macronutrient deficiencies in tomato plants under greenhouse conditions. Furthermore, this study also applied the ensemble learning technique to increase forecasting performance. Based on the results of this study, we can summarize our conclusions as follows:
- The two predictive models based on CNN structure used in this paper, i.e., Inception-ResNet v2 and Autoencoder, which is able to predict, indicate, and classify the symptoms of nutritional deficiency in the leaves and fruits of tomato plants.
- According to the results of this study, to prevent pathologies caused by the lack of nutrients, the two forecast models based on the CNN structure are capable models for predicting nutrient deficiencies in tomato plants, except that in some cases, the results were not good. We suggest using ensemble learning to enhance the accuracy of the results. Moreover, based on these results, it is possible to apply the forecasting model in cultivating tomato plants under greenhouse conditions in order to minimize the negative impacts of nutrient deficiencies, contributing to an increase in harvest rate.
The observation results, which were evaluated under real conditions, show that accuracy rates increased from 87.27% for Inception-ResNet v2 and 79.09% for Autoencoder to 91% for ensemble averaging. We also proved that deep neural networks are able to work with high performance to build real systems for the monitoring and identification of earlier symptoms of nutrient deficiency under greenhouse conditions.
As future work, the proposed system with the application of deep learning will be applied for small tomato farms in Vietnam. In addition, it can be extended to different diseases and crops to increase plant growth productivity.
Author Contributions
The authors contributed equally to this work.
Funding
This work was supported by the Ministry of Trade, Industry, and Energy (MOTIE, South Korea) under Industrial Technology Innovation Program (No. 10062368).
Conflicts of Interest
The authors declare no conflict of interest.
References
- Ho, L.C.; White, P.L. A cellular hypothesis for the induction of blossom-end rot in tomato fruit. Ann. Bot. 2005, 95, 571–681. [Google Scholar] [CrossRef] [PubMed]
- Morard, P.; Pujos, A.; Bernadac, A.; Bertoni, G. Effect on temporary calcium deficiency on tomato growth and mineral nutrition. J. Plant Nutr. 2008, 19, 115–127. [Google Scholar] [CrossRef]
- Pujos, A.; Morard, P. Effects of potassium deficiency on tomato growth and mineral nutrition at the early production stage. Plant Soil 1997, 189, 189–196. [Google Scholar] [CrossRef]
- Adams, P.; Davies, J.N.; Winsor, G.W. Effects of nitrogen, potatssium and magnesium on the quality and chemical composition of tomato grown in peat. J. Hortic. Sci. 1978, 55, 115–122. [Google Scholar] [CrossRef]
- Bénard, C.; Bourgaud, F.; Gautier, H. Impact of temporary nitrogen deprivation on tomato of leaf phenolics. Int. J. Mol. Sci. 2011, 12, 7971–7981. [Google Scholar] [CrossRef] [PubMed]
- LeCun, Y.; Bengio, Y.; Hinton, G. Deep learning. Nature 2015, 521, 436–444. [Google Scholar] [CrossRef]
- Liakos, K.G.; Busato, P.; Moshuo, D.; Pearson, S.; Bochtis, D. Machine learning in agriculture: A review. Sensors 2018, 18, 2674. [Google Scholar] [CrossRef] [PubMed]
- Kamilaris, A.; Prenafeta-Boldú, F.X. Deep learning in agriculture: A survey. Comput. Electron. Agric. 2018, 147, 70–90. [Google Scholar] [CrossRef]
- Jeyalakshmi, S.; Radha, R. A review on diagnosis of nutrient deficiency symptoms in plant leaf image using digital image processing. ICTACT J. Image Video Process. 2017, 7, 1515–1524. [Google Scholar] [CrossRef]
- Samborska, I.A.; Alexandrov, V.; Sieczko, L.; Kornatowska, B.; Goltsev, V.; Cetner, M.D.; Kalaji, H.M. Aritificial neural networks and their application in biological and agricultural research. J. NanoPhotoBioSciences 2014, 2, 14–30. [Google Scholar]
- Barbedo, J.C.A. A review on the main challenges in automatic plant disease identification based on visible range images. Biosyst. Eng. 2016, 144, 52–60. [Google Scholar] [CrossRef]
- Ferentinos, K.P. Deep learning models for plant disease detection and diagnosis. Comput. Electron. Agric. 2018, 145, 311–318. [Google Scholar] [CrossRef]
- Picon, A.; Alvarez-Gila, A.; Seitz, M.; Ortiz-Barredo, A.; Echazarra, J.; Johannes, A. Deep convolutional neural networks for mobile capture device-based crop disease classification in the wild. Comput. Electron. Agric. 2018. [Google Scholar] [CrossRef]
- Dyrmann, M.; Karstoft, H.; Midtiby, H.S. Plant species classification using deep convolutional neural network. Biosyst. Eng. 2016, 151, 72–80. [Google Scholar] [CrossRef]
- Sladojevic, S.; Arsenovic, M.; Anderla, A.; Culibrk, D.; Stefanovic, D. Deep neural network based recognition of plant diseases by leaf image classification. Comput. Intell. Neurosci. 2016. [Google Scholar] [CrossRef]
- Fuentes, A.; Yoon, S.; Kim, S.C.; Park, D.S. A robust deep-learning-based detector for real-time tomato plant diseases and pests recognition. Sensors 2017, 17, 2022. [Google Scholar] [CrossRef]
- Chlingaryan, A.; Sukkarieh, S.; Whelan, B. Machine learning approaches for crop yield prediction and nitrogen status estimation in precision agriculture: A review. Comput. Electron. Agric. 2018, 151, 61–69. [Google Scholar] [CrossRef]
- Noh, H.; Zhang, Q.; Shin, B.; Han, S.; Feng, L. A neural network model of maize crop nitrogen stress assessment for a multi-spectral imaging sensor. Biosyst. Eng. 2006, 94, 477–485. [Google Scholar] [CrossRef]
- Gautam, R.K.; Panigrahi, S. Leaf nitrogen determination of corn plant using aerial images and artificial neural networks. Can. Biosyst. Eng. 2007, 49, 71–79. [Google Scholar]
- Xu, G.; Zhang, F.; Shah, S.G.; Ye, Y.; Mao, H. Use of leaf color images to identify nitrogen and potassium deficient tomatos. Pattern Recognit. Lett. 2011, 32, 1584–1590. [Google Scholar] [CrossRef]
- Vazquez-Cruz, M.A.; Luna-Rubio, R.; Contreras-Medina, L.M.; Torres-Pacheco, I.; Guevara-Gonzalez, R.G. Estimating the response of tomato (Solanum lycopersicum) leaf area to changes in climate and salicylic acid applications by means of artificial neural networks. Biosyst. Eng. 2012, 112, 319–327. [Google Scholar] [CrossRef]
- Zhang, H.; Liu, G. Dichotomous research on near infrared spectrogram of tomato leaf based on SVM algorithm. In Proceedings of the 2013 International Conference on Mechatronic Sciences, Electric Engineering and Computer (MEC), Shengyang, China, 20–22 December 2013. [Google Scholar]
- Jones, C.D.; Jones, J.B.; Lee, W.S. Diagnosis of bacterial spot of tomato using spectral signatures. Comput. Electron. Agric. 2010, 74, 329–335. [Google Scholar] [CrossRef]
- Sulistyo, S.B.; Wu, D.; Woo, W.L.; Dlay, S.S.; Gao, B. Computational Deep Intelligence Vision Sensing for Nutrient Content Estimation in Agricultural Automation. IEEE Trans. Autom. Sci. Eng. 2018, 15, 1243–1257. [Google Scholar] [CrossRef]
- Sulistyo, S.B.; Woo, W.L.; Dlay, S.S.; Gao, B. Building A Globally Optimized Computational Intelligence Image Processing Algorithm for On-Site Nitrogen Status Analysis in Plants. IEEE Intell. Syst. 2018, 33, 15–26. [Google Scholar] [CrossRef]
- Sulistyo, S.B.; Woo, W.L.; Delay, S.S. Regularized Neural Networks Fusion and Genetic Algorithm based On-Field Nitrogen Status Estimation of Wheat Plants. IEEE Trans. Ind. Inform. 2016, 13, 103–114. [Google Scholar] [CrossRef]
- Sulistyo, S.B.; Woo, W.L.; Delay, S.S. Ensemble Neural Networks and Image Analysis for On-Site Estimation of Nitrogen Contents in Plants. In Proceedings of the SAI Intelligent Systems Conference (IntelliSys 2016), London, UK, 21–22 September 2016. [Google Scholar]
- Szegedy, C.; Liu, W.; Jia, Y.; Sermanet, P.; Reed, S.; Anguelov, D.; Erhan, D.; Vanhoucke, V.; Rabinovich, A. Going deeper with convolutions. In Proceedings of the 2015 IEEE Conference on Computer Vision and Pattern Recognition (CVPR), Boston, MA, USA, 7–12 June 2015. [Google Scholar]
- Szegedy, C.; Vanhoucke, V.; Ioffe, S.; Shlens, J. Rethinking the inception architecture for computer vision. In Proceedings of the 2016 IEEE Conference on Computer Vision and Pattern Recognition (CVPR), Las Vegas, NV, USA, 27–30 June 2016. [Google Scholar]
- He, K.; Zhang, X.; Ren, S.; Sun, J. Deep residual learning for image recognition. In Proceedings of the 2016 IEEE Conference on Computer Vision and Pattern Recognition (CVPR), Las Vegas, NV, USA, 27–30 June 2016. [Google Scholar]
- Ioffe, S.; Szegedy, C. Batch normalization: Accelerating deep network training by reducing internal covariate shift. In Proceedings of the 32nd International Conference on Machine Learning (ICML), Lille, France, 6–11 July 2015. [Google Scholar]
- Srivastava, N.; Hinton, G.; Krizhevsky, A.; Sutskever, I.; Salakhutdinov, R. Dropout: A simple way to prevent neural networks from overfitting. J. Mach. Learn. Res. 2014, 15, 1929–1958. [Google Scholar]
- Hinton, G.E.; Srivastava, N.; Krizhevsky, A.; Sutskever, I.; Salakhutdinov, R. Improving neural networks by preventing co-adaptation of feature detectors. arXiv 2012, arXiv:1207.0580. [Google Scholar]
- Szegedy, C.; Ioffe, S.; Vanhoucke, V.; Alemi, A. Inception-v4, Inception-ResNet and the impact of residual connections on learning. In Proceedings of the 31st AAAI Conference on Artificial Intelligence, San Francisco, CA, USA, 4–10 February 2017. [Google Scholar]
- Hasani, B.; Mahoor, M.H. Facial affect estimation in the wild using deep residual and convolutional networks. In Proceedings of the IEEE conference on computer vision and pattern recognition workshops (CVPRW), Honolulu, HI, USA, 21–26 July 2017. [Google Scholar]
- Vincent, P.; Larochelle, H.; Bengio, Y.; Mnzagol, P.-A. Extracting and composing robust features with denoising autoencoders. In Proceedings of the 25th International Conference on Machine Learning (ICML), Helsinki, Finland, 5–9 July 2008. [Google Scholar]
- Ju, C.; Bibaut, A.; van der Laan, M.J. The relative performance of ensemble methods with deep convolutional neural networks for image classification. J. Appl. Stat. 2018, 45, 2800–2818. [Google Scholar] [CrossRef]
Figure 1.
Overview of the proposed system based on a deep learning approach for prediction of nutrient deficiency. The proposed system consists of several steps to collect the dataset and provide classification and prediction results.
Figure 1.
Overview of the proposed system based on a deep learning approach for prediction of nutrient deficiency. The proposed system consists of several steps to collect the dataset and provide classification and prediction results.

Figure 2.
The symptoms of nutrient deficiency. (a) Calcium deficiency; (b) Potassium deficiency; (c) Nitrogen deficiency. The raw images were collected under different environmental conditions.
Figure 2.
The symptoms of nutrient deficiency. (a) Calcium deficiency; (b) Potassium deficiency; (c) Nitrogen deficiency. The raw images were collected under different environmental conditions.

Figure 3.
Residual unit structure.

Figure 4.
Inception-ResNet v2 architecture.

Figure 5.
The scheme of the encoder.

Figure 6.
Decoder structure.

Figure 7.
Prediction results of Inception-ResNet v2. (a–c) Prediction of Calcium deficiency; (d–f) Potassium shortage forecast; (g,h) Nitrogen lack prediction.
Figure 7.
Prediction results of Inception-ResNet v2. (a–c) Prediction of Calcium deficiency; (d–f) Potassium shortage forecast; (g,h) Nitrogen lack prediction.

Figure 8.
Comparison between original training dataset and pre-training dataset with Autoencoder. (a) Pre-training of Calcium; (b) Pre-train for Potassium; (c) Nitrogen Pre-training.
Figure 8.
Comparison between original training dataset and pre-training dataset with Autoencoder. (a) Pre-training of Calcium; (b) Pre-train for Potassium; (c) Nitrogen Pre-training.

Figure 9.
Autoencoder prediction results. (a–c) Prediction of Calcium shortage; (d–f) Potassium deficiency forecast; (g,h) Nitrogen deficiency prediction.
Figure 9.
Autoencoder prediction results. (a–c) Prediction of Calcium shortage; (d–f) Potassium deficiency forecast; (g,h) Nitrogen deficiency prediction.

Figure 10.
Cost function profile of both prediction models. (a) Inception-ResNet v2; (b) Autoencoder.
Figure 10.
Cost function profile of both prediction models. (a) Inception-ResNet v2; (b) Autoencoder.


Table 1.
Summary of the dataset used for training and validation in this study.
| Mineral Nutrient | Training | Validation | Total |
|---|---|---|---|
| Calcium (Ca2) | 244 | 61 | 305 |
| Potassium (K+) | 105 | 26 | 131 |
| Nitrogen (N) | 112 | 23 | 135 |
| Total | 461 | 110 | 571 |
Table 2.
The average value of each prediction model using the ensemble learning technique.
| Average Value | Calcium | Potassium | Nitrogen | Figures |
|---|---|---|---|---|
| Inception-ResNet v2 | 7.30 | 1.12 | −8.20 | Figure 7a and Figure 9a |
| Autoencoder | 3.53 | −2.81 | 0.81 | |
| Total_1 | 10.83 | −1.69 | −7.39 | |
| Prediction rate | Calcium 1.0 | |||
| Inception-ResNet v2 | −0.23 | −2.72 | 3.08 | Figure 7g and Figure 9g |
| Autoencoder | 0.62 | −3.97 | 5.25 | |
| Total_2 | 0.39 | −6.69 | 8.33 | |
| Prediction rate | Nitrogen 1.0 | |||
| Inception-ResNet v2 | −1.00 | −0.47 | 1.07 | Figure 7h and Figure 9h |
| Autoencoder | −0.12 | −1.10 | 2.79 | |
| Total_3 | −1.12 | −1.57 | 3.86 | |
| Prediction rate | Nitrogen 0.989 |
Table 3.
Comparison of the accuracy rate of the two prediction models for forecasting nutrient deficiencies in the validation dataset.
Table 3.
Comparison of the accuracy rate of the two prediction models for forecasting nutrient deficiencies in the validation dataset.
| Nutrient | Inception-ResNet v2 Top-3 Accuracy | Figures | Autoencoder Top-3 Accuracy | Figures |
|---|---|---|---|---|
| Calcium (Ca2+) | 0.998 | Figure 7a | 0.000 | Figure 9a |
| 0.977 | Figure 7b | 1.000 | Figure 9b | |
| 1.000 | Figure 7c | 1.000 | Figure 9c | |
| Potassium (K+) | 0.989 | Figure 7d | 1.000 | Figure 9d |
| 0.999 | Figure 7e | 1.000 | Figure 9e | |
| 1.000 | Figure 7f | 1.000 | Figure 9f | |
| Nitrogen (N) | 0.962 | Figure 7g | 0.000 | Figure 9g |
| 0.747 | Figure 7h | 0.650 | Figure 9h |
Table 4.
Top-3 accuracy and error rates for two forecast models.
| Model | Top-3 Accuracy | Top-3 Error Rate | Epoch | Learning Rate |
|---|---|---|---|---|
| Inception-ResNet v2 | 87.27% | 12.73% | 50 | 0.0001 |
| Autoencoder | 79.09% | 20.91% | 50 | 0.0001 |
Table 5.
Performance of ensemble in comparison with the different model architectures based on CNN.
| Model | Top-3 Accuracy | Top-3 Error |
|---|---|---|
| Inception-ResNet v2 | 87.27% | 12.73% |
| Autoencoder | 79.09% | 20.91% |
| Ensemble | 91% | 9% |
Table 6.
Confusion matrix for the prediction of Inception-ResNet v2 with the numbers of the training dataset in Table 1.
Table 6.
Confusion matrix for the prediction of Inception-ResNet v2 with the numbers of the training dataset in Table 1.
| Classifier Result | Observed Data | Precision | ||
|---|---|---|---|---|
| Calcium | Potassium | Nitrogen | ||
| Calcium | 244 | 0 | 0 | 100% |
| Potassium | 0 | 105 | 0 | 100% |
| Nitrogen | 0 | 0 | 112 | 100% |
| Recall | 100% | 100% | 100% | 100% |
Table 7.
Confusion matrix for the predictions of Autoencoder with the numbers of the training dataset in Table 1.
Table 7.
Confusion matrix for the predictions of Autoencoder with the numbers of the training dataset in Table 1.
| Classifier Result | Observed Data | Precision | ||
|---|---|---|---|---|
| Calcium | Potassium | Nitrogen | ||
| Calcium | 244 | 0 | 0 | 100% |
| Potassium | 2 | 98 | 5 | 93.33% |
| Nitrogen | 4 | 8 | 100 | 89.28% |
| Recall | 97.6% | 92.45% | 95.23% | 95.87% |
Table 8.
Confusion matrix for the prediction of Inception-ResNet v2 with the numbers of the validation dataset in Table 1.
Table 8.
Confusion matrix for the prediction of Inception-ResNet v2 with the numbers of the validation dataset in Table 1.
| Classifier Result | Observed Data | Precision | ||
|---|---|---|---|---|
| Calcium | Potassium | Nitrogen | ||
| Calcium | 52 | 8 | 1 | 85.24% |
| Potassium | 0 | 26 | 0 | 100% |
| Nitrogen | 5 | 0 | 18 | 78.26% |
| Recall | 91.22% | 76.47% | 94.73% | 87.27% |
Table 9.
Confusion matrix for the prediction of Autoencoder with the numbers of the validation dataset in Table 1.
Table 9.
Confusion matrix for the prediction of Autoencoder with the numbers of the validation dataset in Table 1.
| Classifier Result | Observed Data | Precision | ||
|---|---|---|---|---|
| Calcium | Potassium | Nitrogen | ||
| Calcium | 49 | 8 | 4 | 80.32% |
| Potassium | 4 | 22 | 0 | 84.61% |
| Nitrogen | 7 | 0 | 16 | 69.56% |
| Recall | 81.66% | 73.33% | 80% | 79.09% |
© 2019 by the authors. Licensee MDPI, Basel, Switzerland. This article is an open access article distributed under the terms and conditions of the Creative Commons Attribution (CC BY) license (http://creativecommons.org/licenses/by/4.0/).
Share and Cite
MDPI and ACS Style
Tran, T.-T.; Choi, J.-W.; Le, T.-T.H.; Kim, J.-W. A Comparative Study of Deep CNN in Forecasting and Classifying the Macronutrient Deficiencies on Development of Tomato Plant. Appl. Sci. 2019, 9, 1601. https://doi.org/10.3390/app9081601
AMA Style
Tran T-T, Choi J-W, Le T-TH, Kim J-W. A Comparative Study of Deep CNN in Forecasting and Classifying the Macronutrient Deficiencies on Development of Tomato Plant. Applied Sciences. 2019; 9(8):1601. https://doi.org/10.3390/app9081601
Chicago/Turabian StyleTran, Trung-Tin, Jae-Won Choi, Thien-Tu Huynh Le, and Jong-Wook Kim. 2019. "A Comparative Study of Deep CNN in Forecasting and Classifying the Macronutrient Deficiencies on Development of Tomato Plant" Applied Sciences 9, no. 8: 1601. https://doi.org/10.3390/app9081601
Note that from the first issue of 2016, this journal uses article numbers instead of page numbers. See further details here.