Article

“Texting & Driving” Detection Using Deep Convolutional Neural Networks

by
José María Celaya-Padilla
1,*,†,
Carlos Eric Galván-Tejada
2,
Joyce Selene Anaid Lozano-Aguilar
2,
Laura Alejandra Zanella-Calzada
2,
Huizilopoztli Luna-García
2,
Jorge Issac Galván-Tejada
2,
Nadia Karina Gamboa-Rosales
1,
Alberto Velez Rodriguez
2 and
Hamurabi Gamboa-Rosales
2,*,†
1
Unidad Académica de Ingeniería Eléctrica, CONACyT—Universidad Autónoma de Zacatecas, Zacatecas 98000, Mexico
2
Unidad Académica de Ingeniería Eléctrica, Universidad Autónoma de Zacatecas, Zacatecas 98000, Mexico
*
Authors to whom correspondence should be addressed.
Current address: Unidad Académica de Ingeniería Eléctrica, Universidad Autónoma de Zacatecas, Zacatecas 98000, Mexico.
Appl. Sci. 2019, 9(15), 2962; https://doi.org/10.3390/app9152962
Submission received: 21 May 2019 / Revised: 20 June 2019 / Accepted: 21 June 2019 / Published: 24 July 2019

Abstract

:
The effects of distracted driving are one of the main causes of deaths and injuries on U.S. roads. According to the National Highway Traffic Safety Administration (NHTSA), among the different types of distractions, the use of cellphones is highly related to car accidents, commonly known as “texting and driving”, with around 481,000 drivers distracted by their cellphones while driving, about 3450 people killed and 391,000 injured in car accidents involving distracted drivers in 2016 alone. Therefore, in this research, a novel methodology to detect distracted drivers using their cellphone is proposed. For this, a ceiling mounted wide angle camera coupled to a deep learning–convolutional neural network (CNN) are implemented to detect such distracted drivers. The CNN is constructed by the Inception V3 deep neural network, being trained to detect “texting and driving” subjects. The final CNN was trained and validated on a dataset of 85,401 images, achieving an area under the curve (AUC) of 0.891 in the training set, an AUC of 0.86 on a blind test and a sensitivity value of 0.97 on the blind test. In this research, for the first time, a CNN is used to detect the problem of texting and driving, achieving a significant performance. The proposed methodology can be incorporated into a smart infotainment car, thus helping raise drivers’ awareness of their driving habits and associated risks, thus helping to reduce careless driving and promoting safe driving practices to reduce the accident rate.

1. Introduction

Currently, car manufacturers devote much of their attention to equipping cars with new integrated safety features. These features include avoiding collisions, pedestrian detection, lane change warning, driver feedback, even semi-autonomous driving, among others.
With the advance of technology, the car can now infer dangerous behaviors such as drowsiness by using advanced sensors integrated in the vehicle (for example, night cameras, radars, ultrasonic sensors) [1]. In addition, some high-end cars can activate automatic steering when the car moves to another lane without a safe warning (for example, the driver did not turn on the turn signal to indicate a line change), and the car can even brake before dangerously approaching the car ahead by means of the assistant of automatic braking. However, only a small fraction of automobiles present these warning systems to the driver and, even with all these safety features, one of the biggest problems that has not yet been solved is the “distracted” driver, which continues to have significant repercussions throughout the world due to the accidents generated.
According to the National Highway Traffic Safety Administration (NHTSA) [2], around 3450 people were killed and 391,000 were injured in motor vehicle accidents with distracted drivers in 2016 and approximately 481,000 drivers were using their cell phones while they were driving, which is a potential danger to drivers and passengers, as it can cause deaths or injuries on the U.S. roads.
According to the National Highway Traffic Safety Administration (NHTSA) [2], around 3450 people died and 391,000 were injured in car accidents with distracted drivers in 2016 and approximately 481,000 drivers participated in the use of their cell phones while driving, which represents a potential danger to drivers and passengers, as it can cause deaths or injuries on the roads in the U.S.
Therefore, the popularity of mobile devices has had some unplanned and even dangerous consequences, since distracted drivers accounted for only 8.5% of total deaths in 2017 [3], and mobile communications are now linked to a significant increase in distracted driving, which is a serious and growing threat to road safety, causing injuries and loss of life [4].
Based on this, detecting driver distraction, specifically the use of the cell phone while driving, can help increase drivers’ awareness of their driving habits and associated risks, and thus help reduce sloppy driving and promote safe driving practices.
A large number of studies have focused on measuring the effects of distracted driving among the four types of driver distraction: visual (when drivers do not look at the road for a period of time); cognitive (reflecting on a topic of conversation as a result of talking on the phone, instead of analyzing the situation on the road); physical (when the driver holds or operates a device instead of driving with both hands, or dials from a mobile phone or leans to tune to a radio that can lead to the address); and auditory (responding to a ringing mobile phone, or if a device is activated so loudly that it masks other sounds, such as ambulance sirens) [5].
A term that has been studied with great interest due to its negative effects is “texting and driving”, which is defined as the act of holding/using the cell phone in front of a person near the chest, and is likely to cause accidents. This term can be differentiated from talking on the cell phone while driving, since the focal point of the driver’s eye is not the same, so it is possible to identify this action according to the movement of the eyes.
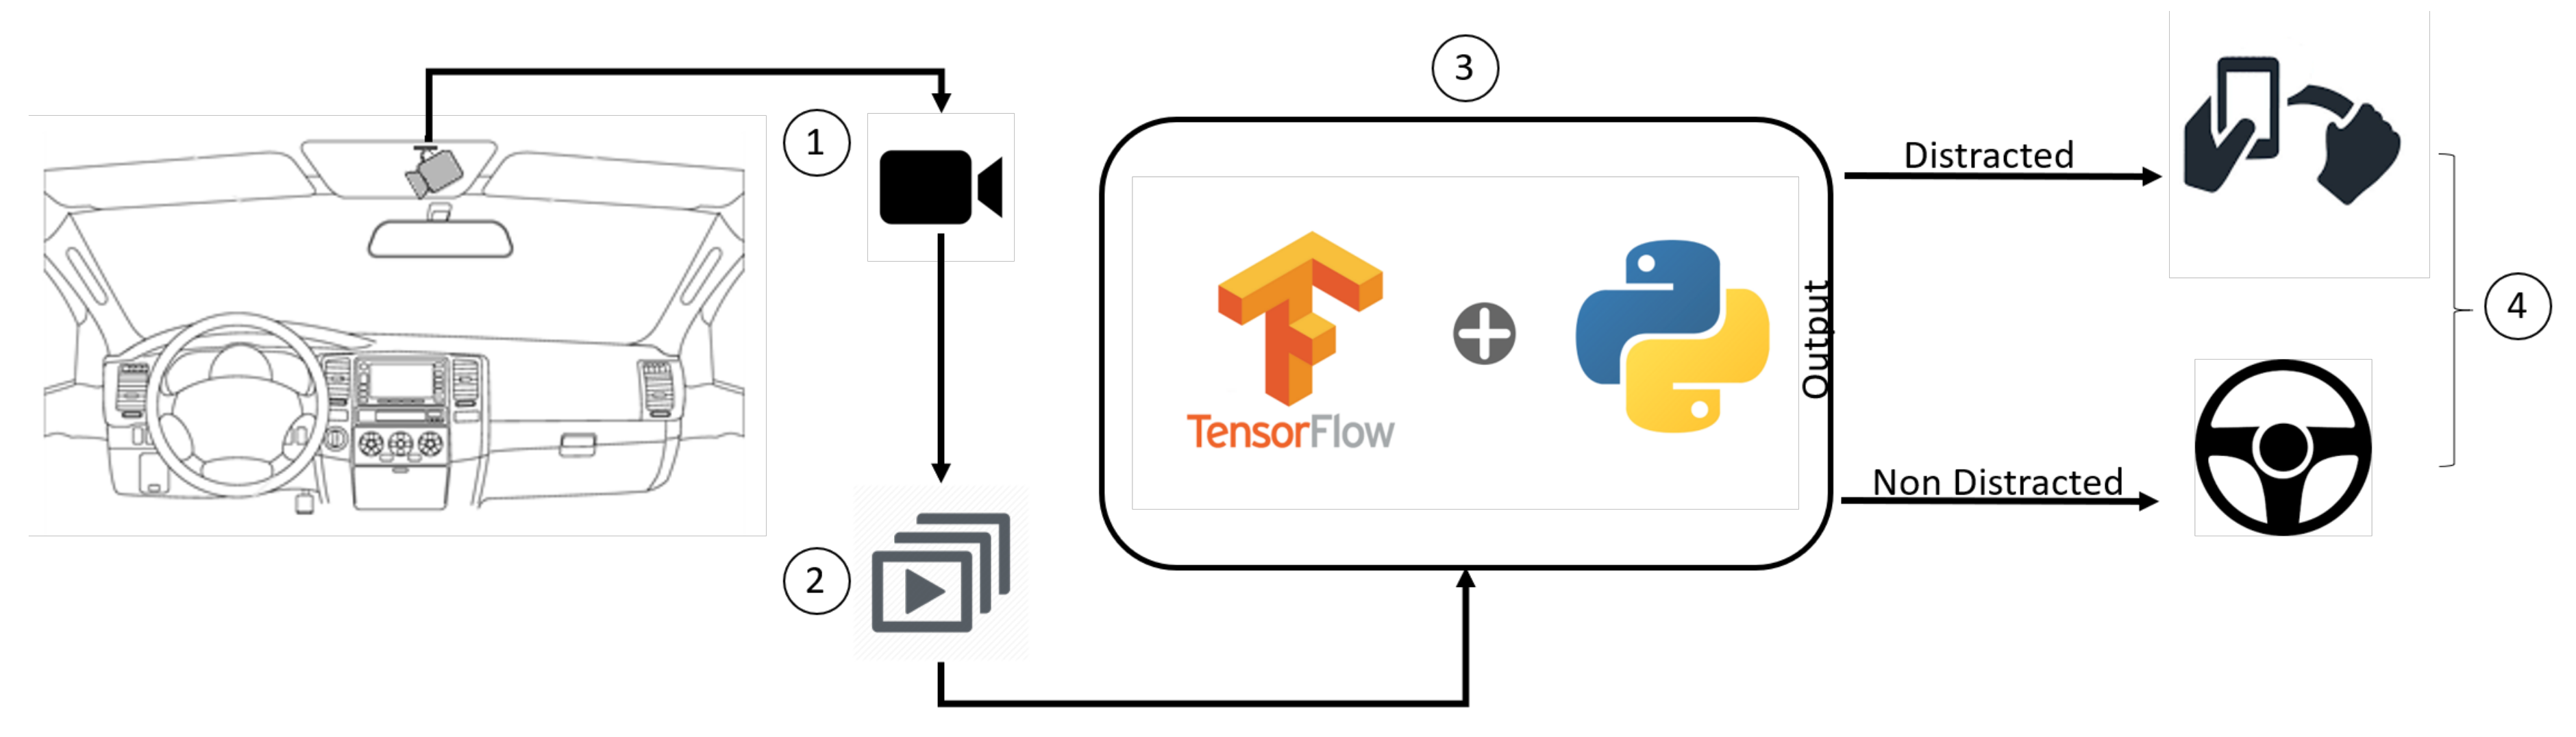
On this basis, and trying to prevent accidents related to text messages and driving, a methodology to detect such distracted behavior is proposed. This research presents a ubiquitous oriented methodology based on deep learning: convolutional neural networks (CNN) to detect drivers who use the cell phone while driving. We intend to use a wide-angle camera mounted on the roof to send images of the driver to CNN and detect distraction. Once implemented, manufacturers can use this methodology to detect and avoid accidents caused by “text and handling” behavior, thus reducing deaths.
In the next sections, the details of the proposed methodology will be presented. In Section 2, related work is shown, followed by Section 3, where the proposed methodology is presented. Section 4 presents the results obtained and, finally, Section 5 provides the discussion, while the final section presents the conclusions.

2. Related Work

According to the literature, several works have been developing different research in order to address the problem related to “texting and driving”.
Li et al. [6] investigated the pattern of eye movement of drivers in a process of collision avoidance from the rear under the influence of driver distraction induced by cell phones using the driving simulator of the Beijing Jiaotong University (BJTU), which was projected through a 300-degree front/peripheral field of view at a resolution of 1400 × 1050 pixels, and the eye-tracking system mounted on the head, Eye tracking glasses SensoMotoric Instruments (SMI ETG), to collect eye movement data. The study showed that the distraction of tasks that were not of visual demand could also interrupt the visual attention of the drivers to the source of danger due to the multiple tasks superimposed between the manual operation (adjustment of the force exerted on the brake pedal) and the cognitive activities (calculation of arithmetic problems).
Atiquzzaman et al. [7] developed an algorithm to detect driving behavior in two distracting tasks, sending text messages and eating or drinking. Using a simulator, subjects performed a series of tasks while driving the simulation; then, 10 characteristics related to vehicle acceleration, steering angle, speed, etc. were used as input data. Then, three data mining techniques were used: linear discriminant analysis (LDA), logistic regression (LR) and support vector machine (SVM). Results showed that the SVM algorithm outperformed LDA and LR, in the detection of distractions related to texting and eating/drinking with an accuracy of 84.33% and 79.53%, respectively. The false alarm rates for these SVM algorithms were 15.77% and 23.54%, respectively.
On the other hand, telephone conversations while driving are another type of distraction. Iqbal et al. [8] focused on proactive alert and mediation through voice communication. The authors studied the effect of indicating the next critical conditions of the road and placing the calls on hold while driving; quantitative data was collected, such as the number of errors during the turn and collisions, as a measure of driving performance. Results show that context-sensitive mediation systems could play a valuable role in focusing the driver’s attention on the road during telephone conversations.
Klaner et al. [9] studied the relationship between the performance of secondary tasks, including the use of cell phones, and the risk of collisions and near collisions, measured through different sensors such as accelerometers, cameras, global positioning systems, among others. The results obtained show that the most critical risk of a collision or a near collision between novice drivers is when they were dialing a number on a cell phone (odds ratio = 8.32, 95% confidence interval (CI), 2.83 to 24.42), reaching an object other than a cell phone (odds ratio = 8.00; 95% CI, 3.67 to 17.50) and among experienced drivers; the dialing of a mobile phone was associated with a significantly greater risk of a fall or near-fall (Probability ratio = 2.49, 95% CI, 1.38 to 4.54).
Gliklich et al. [10] described the frequency of the cell phone related to distracted driving behaviors. They reported a reading or writing activity on the cell phone within the previous 30 days, with reading texts (48%), writing texts (33%) and viewing maps (43%) reported more frequently. Only 4.9% of respondents had enrolled in a program aimed at reducing distracted driving related to the cell phone.
Based on this, some technology approaches intend to reduce the dangers of distracted driving, working to dissuade people from texting while driving.
An example of the technological advances that try to reduce the accident rate with text messages is the Driver’s Distraction Prevention Dock (DDD Dock). DDD Dock is a device that can be used as a method to prevent drivers from texting while driving, putting the driver’s phone out of sight and out of reach. The car will not start unless your phone is on the dock. The device works by linking to the phone, and, if the phone is removed from the base, a notification is sent to the device administrator [11].
In addition, “The SmartSense” is a sensor based on advanced algorithms based on computer vision and combines them with motor data, telematics, accelerometer and analytical data based on SmartDrive cameras to help solve the epidemic. Distracted and unattractive driving at the root of the problem. The system interprets unit tracks that indicate distraction, such as movements of the head and eyes, and activates a video, which is prioritized and downloaded for immediate verification and intervention [12]. Among the applications-based solutions, Wahlström et al. [13] present a 10-year comprehensive study of smartphones and their use in the automotive industry; among the risk factors, having a telephone conversation can increase the risk of shock factor by a factor of two, while sending text messages is even more distracting [13,14]; this is due to the fact that sending text messages is a cognitive task. The effect of using the cell phone while driving at the cognitive level is shown in the research proposed by Jibo et al. [15]; the author presented a novel study to study the mutual influences of driving and text messages. For this, the subjects were asked to perform a lane change task using a simulator; then, measurements of the driving performance were taken, such as the mean and the standard deviation of the lane deviation; the results showed a greater lane deviation to sending text messages and driving. Trying to detect and prevent accidents caused by the cognitive distraction of texting and driving, several investigations have been proposed; among them, Watkins et al. [16] present a methodology based on applications to detect texting and driving; the authors focused on the change of keystrokes and how the act of texting is affected while driving rather than how it is affected by the sending of text messages alone; the authors developed an application that recorded each event. Then, the pattern of the distribution of beats with text messages without driving was compared. This showed greater entropy in the distribution of key presses when texting and driving, demonstrating the cognitive complexity of the task. Bo et al. [17] presented a methodology for detecting texting and driving through non-intrusive detection. TEXIVE is a system based on inertial sensors and magnetometers integrated in common smartphones to distinguish the drivers from the passengers through the recognition of rich micro-movements of smartphone users. Initially, the system detects when a subject is driving and, once the system detects such behavior, it is able to distinguish when the user is sending text messages by means of the speed and accuracy of text messages (writing). The precision reports a value of 87.18%. On the other hand, Chu et al. [18] used smart phone sensors coupled to a support vector machine algorithm to detect if the subject was a passenger or the driver; the authors reported an accuracy of 85 % using cross-validation. However, the authors did not focus on text messages and the driver, but on detecting the act of driving (pushing the accelerator pedal). Later, Mantouka et al. [19] presented a methodology to detect unsafe driving profiles, including driving aggressively, being distracted from the task of driving (use of the mobile phone) and developing risk behavior (speed) while he drives. The methodology was based on an application that the user must use while driving, the application collects data (acceleration/km, Brakes/km, smoothness indicator, acceleration standard deviation, percentage of mobile use, percentage of speeding), and then the K-means that the algorithm grouped as aggressive and non-aggressive travel, nevertheless, no metrics regarding “texting and driving” were presented.
Related to accident prevention, Dai et al. [20] developed a system to detect drunk driving using only the smartphone’s accelerometer by characterizing the drunk driver’s behavior. Händel et al. [21] discussed the technological aspects of vehicle insurance telematics and the use of smartphones as a platform for vehicle insurance telematics [22].
Finally, on the commercial side, several approaches have been presented, TrueMotion [23] presented a smartphone app that monitors driving behavior using sensors in the smartphone. The app then gives an overall safety score based on the habits behind the wheel. Later, TrueMotion developed an app called “Mojo” that provides feedback and incentives to help users reduce distracted driving. The app provides an overall score that characterizes how distracted a user is while driving. The app runs in the background on a driver’s phone and uses sensor-based algorithms to capture and break down distracted driving into three categories: typing, handheld calls and hands-free calls [24]. DriveWell is an app developed by Cambridge Mobile Telematics (Cambridge, MA, USA) that uses phone sensors to records trip data and using telematics and machine learning infer key metrics about vehicle mileage, road types, speed, acceleration patterns, phone distraction, and collisions. Contrary to TrueMotion, DriveWell can aggregate the data and provide a driver/passenger classification. Moreover, this app showed a 40 % reduction in phone usage once the app is used [25]. Similar to DriveWell, Floow Score is an app developed by The Floow Limited (Yorkshire, UK), which uses the phone sensors and telematic data, to score speed, smoothness of driving, distraction and time for the driver; this app is mainly used to aid insurance companies with pricing their policies and predicting risk for each driver more accurately; the app also provides tips, education, and coaching, in order to improve the score and drive more safely. A software developer kit (SDK) is also available to provide data collection, storage, scoring, etc. and generate custom solutions [26].

3. Materials and Methods

The flow chart of the proposed methodology is presented in Figure 1, where, in order to detect “texting and driving” or any other form of cellphone induced distraction, (1) a driver’s video is compiled from a wide angle GoPro camera (GoPro, Inc., San Mateo, CA, USA). Then, (2) each second of the video is split into 24 pictures with a resolution of 1980 × 1080. (3) These images are then used to feed a deep learning algorithm in order to train it to (4) accurately detect the distraction of “texting and driving”. In the next subsections, each stage is explained in detail.

3.1. Data Acquisition

The first stage is to acquire the data; for this, a total of six test subjects was used, both women and men, as well as two different vehicles and a different set of cell phones. This was chosen to avoid biases towards a specific item, such as the color of the clothes, the model of the mobile phone, the shape/color/clothes of the driver or the lighting conditions.
To detect the use of the cellphone while driving, a camera with a wide angle lens mounted in the middle of the ceiling car is used. The camera, which is a GoPro Hero 5 sessions camera with an equivalent 14 mm field of view angle, is mounted as depicted in Figure 2a and pointed towards the driver’s body, as shown in Figure 2b. With the camera positioned, a series of videos with a resolution of 1980 × 1080 and sample rate of 24 Hz were taken.
With the camera mounted, in the second stage, test subjects were instructed to drive the car as they normally do, without any special position or restriction of movement. Then, they had to move the cellphone from anywhere they had it and send a text message or use an application, without restrictions on how they held the phone or the time between events (as in real life, when the cellphone is held for short or long periods of time). This process was repeated five times by each subject. For each subject video, every frame was saved as an independent image; then, the said image was assigned a label (distracted, non distracted). Table 1 shows all the details of the data used, including, cellphone model, vehicle type, number of images by subject, etc. All this was performed under two different lighting conditions, daytime driving, and night driving, gathering a total of 85,401 images.

Data Privacy

All the data used in this investigation was processed in the vehicle, without transferring information outside it. Once the data had been processed, the information was destroyed to maintain the privacy of the data.

3.2. Image Processing

In order to minimize the effect of external lighting and focus on the hands of drivers, from the 85,401 images depicted in Table 1, a region of interest (ROI) was selected as the input image. The ROI was placed in the center of the image with a size of 700 × 700, selecting this location to focus on the movement of the hands while minimizing foreign objects, i.e., passing vehicles, walking pedestrians, incoming cars, among others. Each ROI is then resized to a 299 × 299 image, using a bi-cubic interpolation, which can be calculated with Equation (1):
f ( x , y ) = i = 0 3 j = 0 3 a i j x i y j ,
where a i j are the coefficients of the polynomial system and f ( x , y ) is the output image. After the size reduction, the f ( x , y ) image is normalized to a f ( x , y ) image through Equation (2), with I being the input image ( α = −0.5 and θ = 0.5), so that all values are within the same range:
m i n I d s t ( I ) = α , m a x I d s t ( I ) = θ .

3.3. Model Development

The pre-trained Google CNN architecture Inception v3 is implemented in this work (Mountain View, CA, USA). This CNN used 1.28 million images and 1000 classes for its pre-training, achieving an accuracy of 93.33% on the 2014 ImageNet Challenge [27].
For this approach, the CNN is trained using a “transfer learning” technique [28], where the final classification layer from the network presented in Figure 3 was retrained for 5000 epochs with the dataset collected in this research [29,30] and optimized to detect the presence of cellphones while driving. The rest of the layers are fine-tuned using the original learning parameters [27]. Inception CNN was chosen due the fact that such CNN can be exported for low cost hardware such as Raspberry Pi and can be deployed in Android platforms; furthermore, the CNN architecture acted as multiple convolution filters that were then applied to the same input; the results were then concatenated and passed forward. This approach allowed the model to take advantage of multi-level feature extraction. The CNN Inception V3 is based on a pattern recognition network, and it is designed to use minimal amounts of image pre-processing. Each of the proposed CNN layer reinforces key features; the first layer detects edges, and the second tackles the overall design, among others [29].
The final CNN is shown in Figure 3. For this stage, using Python (version 2.7), the Google TensorFlow deep learning framework is used to retrain the CNN; the experimental parameters were set to 5000 epochs, with two binary classes (distracted i.e., “texting and driving”, non distracted i.e., “driving”) using the transfer learning technique presented by [28].

Re-Training Setup

From the dataset of Table 1, the subset I D 1 with a total of 56,840 images was used to train and test the CNN model, composed of four randomly selected subjects, four different phones, day and night light conditions and the same vehicle, while the remaining subset I D 2 was used as an independent blind-test with a total of 28,561 images, composed of two different subjects (not participating in the training/testing set), two different phones, day and night light conditions and a different vehicle.
This data distribution allows for training the model with several different images, and validating it in a complete unseen scenario, looking for the generalization in the behavior of the model to guarantee good performance with real data on any new unseen vehicle or new unseen subject [32]. Figure 4 shows the proposed data set distribution for the training and testing, as well as the independent blind test.

3.4. Model Evaluation

In this section, the description of each metric calculated to evaluate the model performance is presented.

3.4.1. Cross-Entropy

Cross-entropy uses the Kullback–Leibler distance, which is a measure between two density functions g and h, known as the cross-entropy between g and h, as shown in Equation (3). This operation is based on iterations, generating a random set of values estimating the value to be obtained and then actualizing the parameters in the next iteration to generate “better” values or more approximately, in terms of the Kullback–Leibler distance [33,34], thus obtaining the model that best fits the data [34]:
D ( g , h ) = g ( x ) l n g ( x ) h ( x ) μ ( d x ) = g ( x ) l n g ( x ) μ ( d x ) - g ( x ) l n h ( x ) μ ( d x ) .
This method consists of evaluating the loss for each n sized batch sample of the total data as the sum of the cross-entropy of the CNN, which is calculated with Equation (4) [35],
L ( y * , y ^ ) = - j = 1 n y ^ j l o g y j * + ( 1 - y ^ j ) l o g ( 1 - y j * ) ,
where y * is the output of the model for all n batch samples, y j * is the output for sample j, and y ^ j ϵ 0 , 1 is the true label of the sample j, with “0” representing “no texting while driving” and “1” representing “texting and driving”.

3.4.2. Accuracy

The accuracy allows for measuring the performance of the CNN through a non-differentiable function. This metric allows for selecting the model that presents the most suitable performance in the training stage, based on the average of the differences between the output calculated by the CNN and the true output of the sample data. Equation (5) is reported as 1- e r r o r , where V p r e d is the output predicted by the CNN and V a c t u a l refers to the real output of the sample data [34,36]:
e r r o r = V p r e d - V a c t u a l .
For this work, the “binary-accuracy” function from “tensorflow” is used, which calculates the average accuracy rate across all predictions for binary classification problems [34].

3.4.3. ROC Curve

The receiver operating characteristic (ROC) curve is computed to evaluate the precision with which the model classifies and it is based on the relationship between sensitivity and specificity across the predictions, where sensitivity is the proportion of subjects “texting and driving” that were classified as positive, commonly known as positive predictive values (PPV), and it is calculated with Equation (6), where T P represents the number of true positives and F P represents the number of false positives [37,38]:
P P V = T P T P + F P .
Specificity is defined as the proportion of no-texting subjects that were classified as negative, commonly known as the negative predictive values (NPV), and it is calculated with Equation (7), where T N represents the number of true negatives and F N represents the number of false negatives [34,37,38]:
N P V = T N T N + F N .
Finally, Cohen’s kappa statistic coefficient is computed to measure the inter-rater agreement of the final models [39]; this metric measures the amount of agreement corrected by the agreement expected by chance, the Kappa coefficient κ is given by (8), where P ( o ) is the relative observed agreement among raters (identical to accuracy), and P ( e ) is the hypothetical probability of chance agreement:
κ = P ( o ) - P ( e ) 1 - P ( e ) .

4. Results

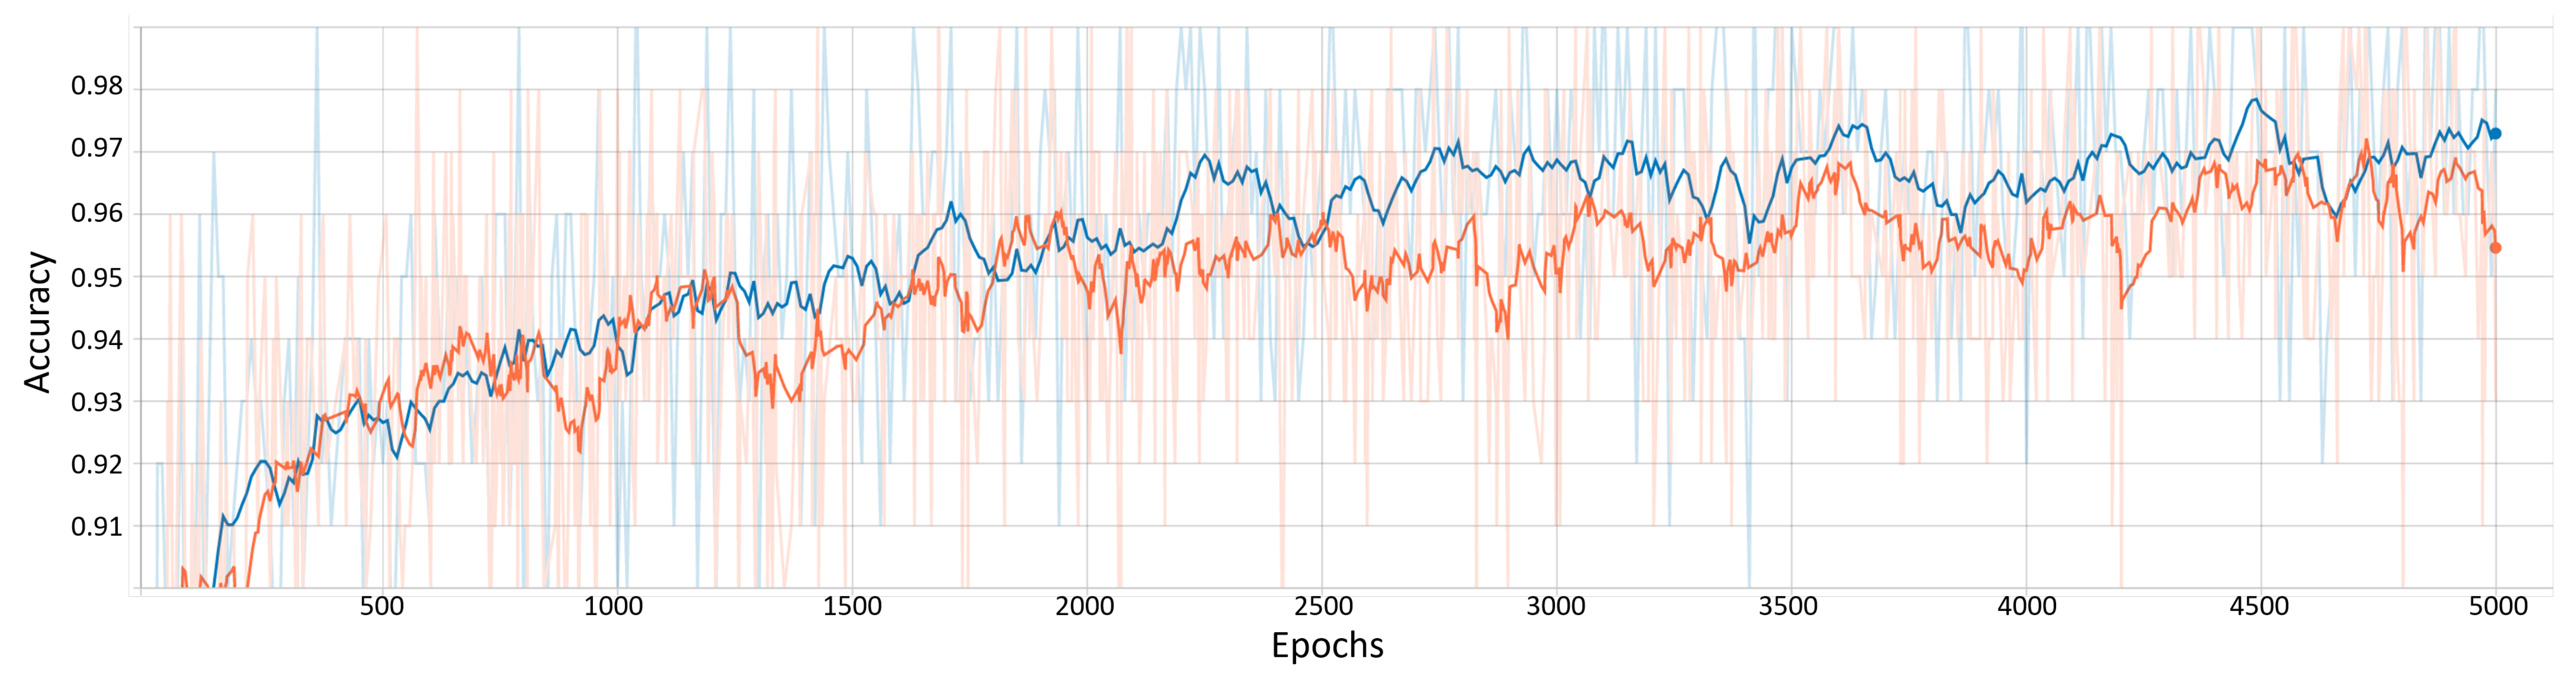
The accuracy obtained by the CNN is shown in Figure 5, where the blue line represents the behavior of the training data, obtaining a final accuracy of 0.93, while the orange line represents the behavior of the testing data, obtaining a final accuracy of 0.98.
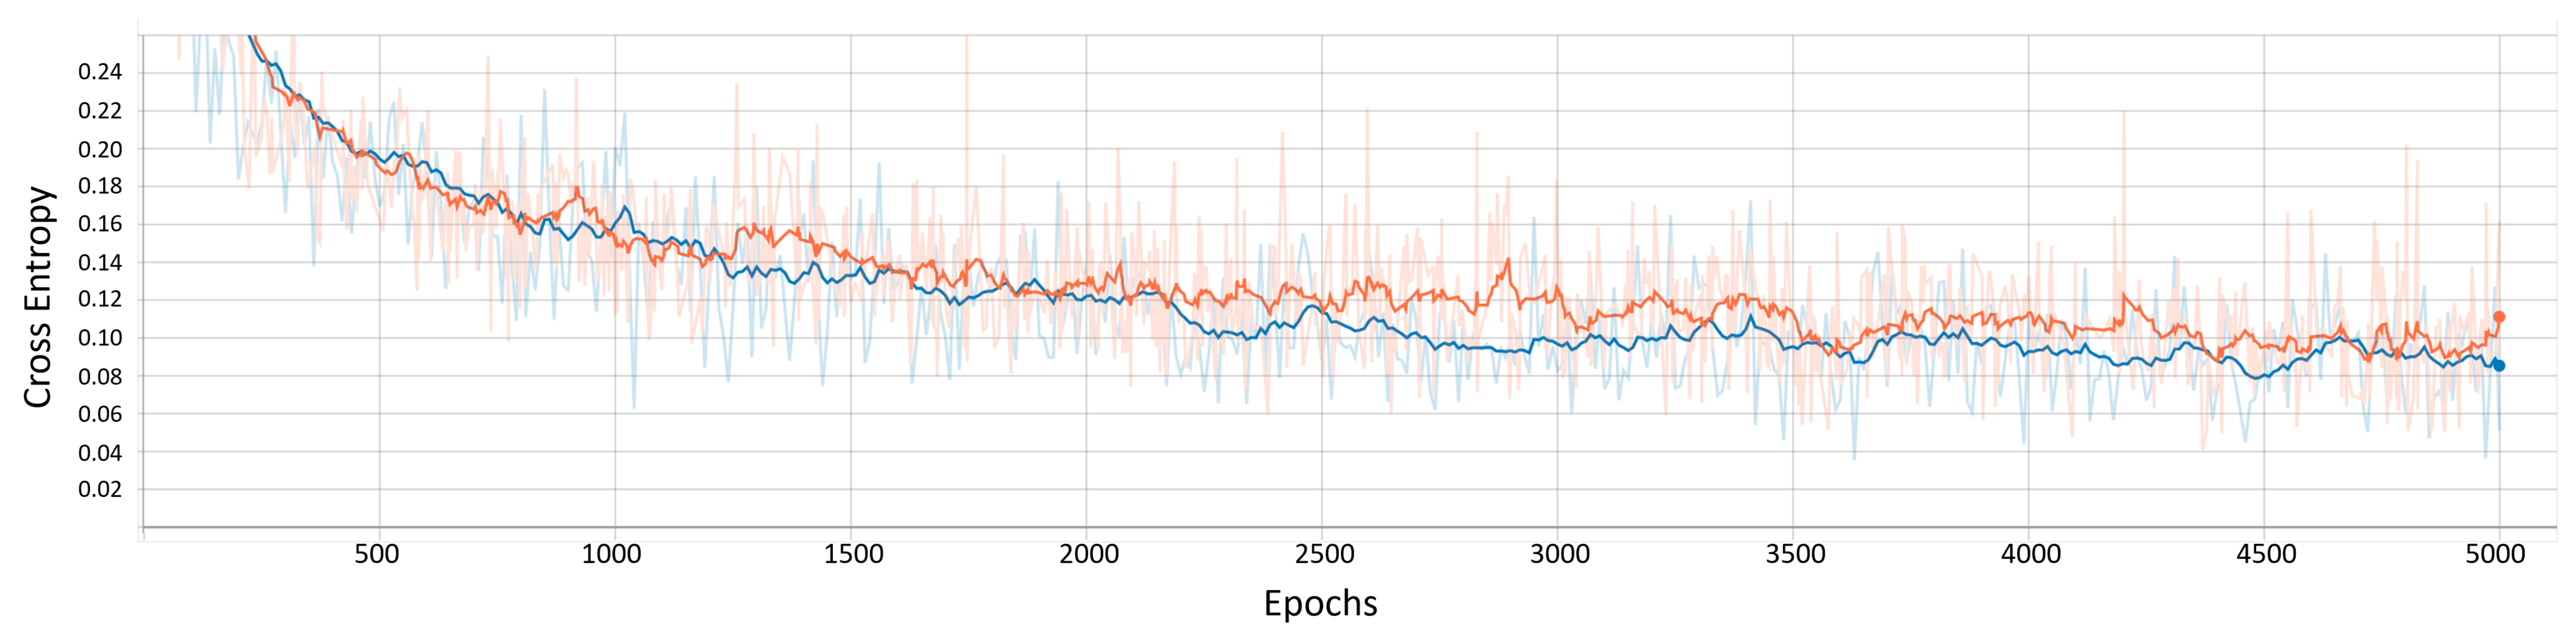
In contrast, Figure 6 shows the loss function, where the blue line represents the behavior of the training data, obtaining a final value of 0.12, while the orange line represents the behavior of the testing data, obtaining a final value of 0.12.
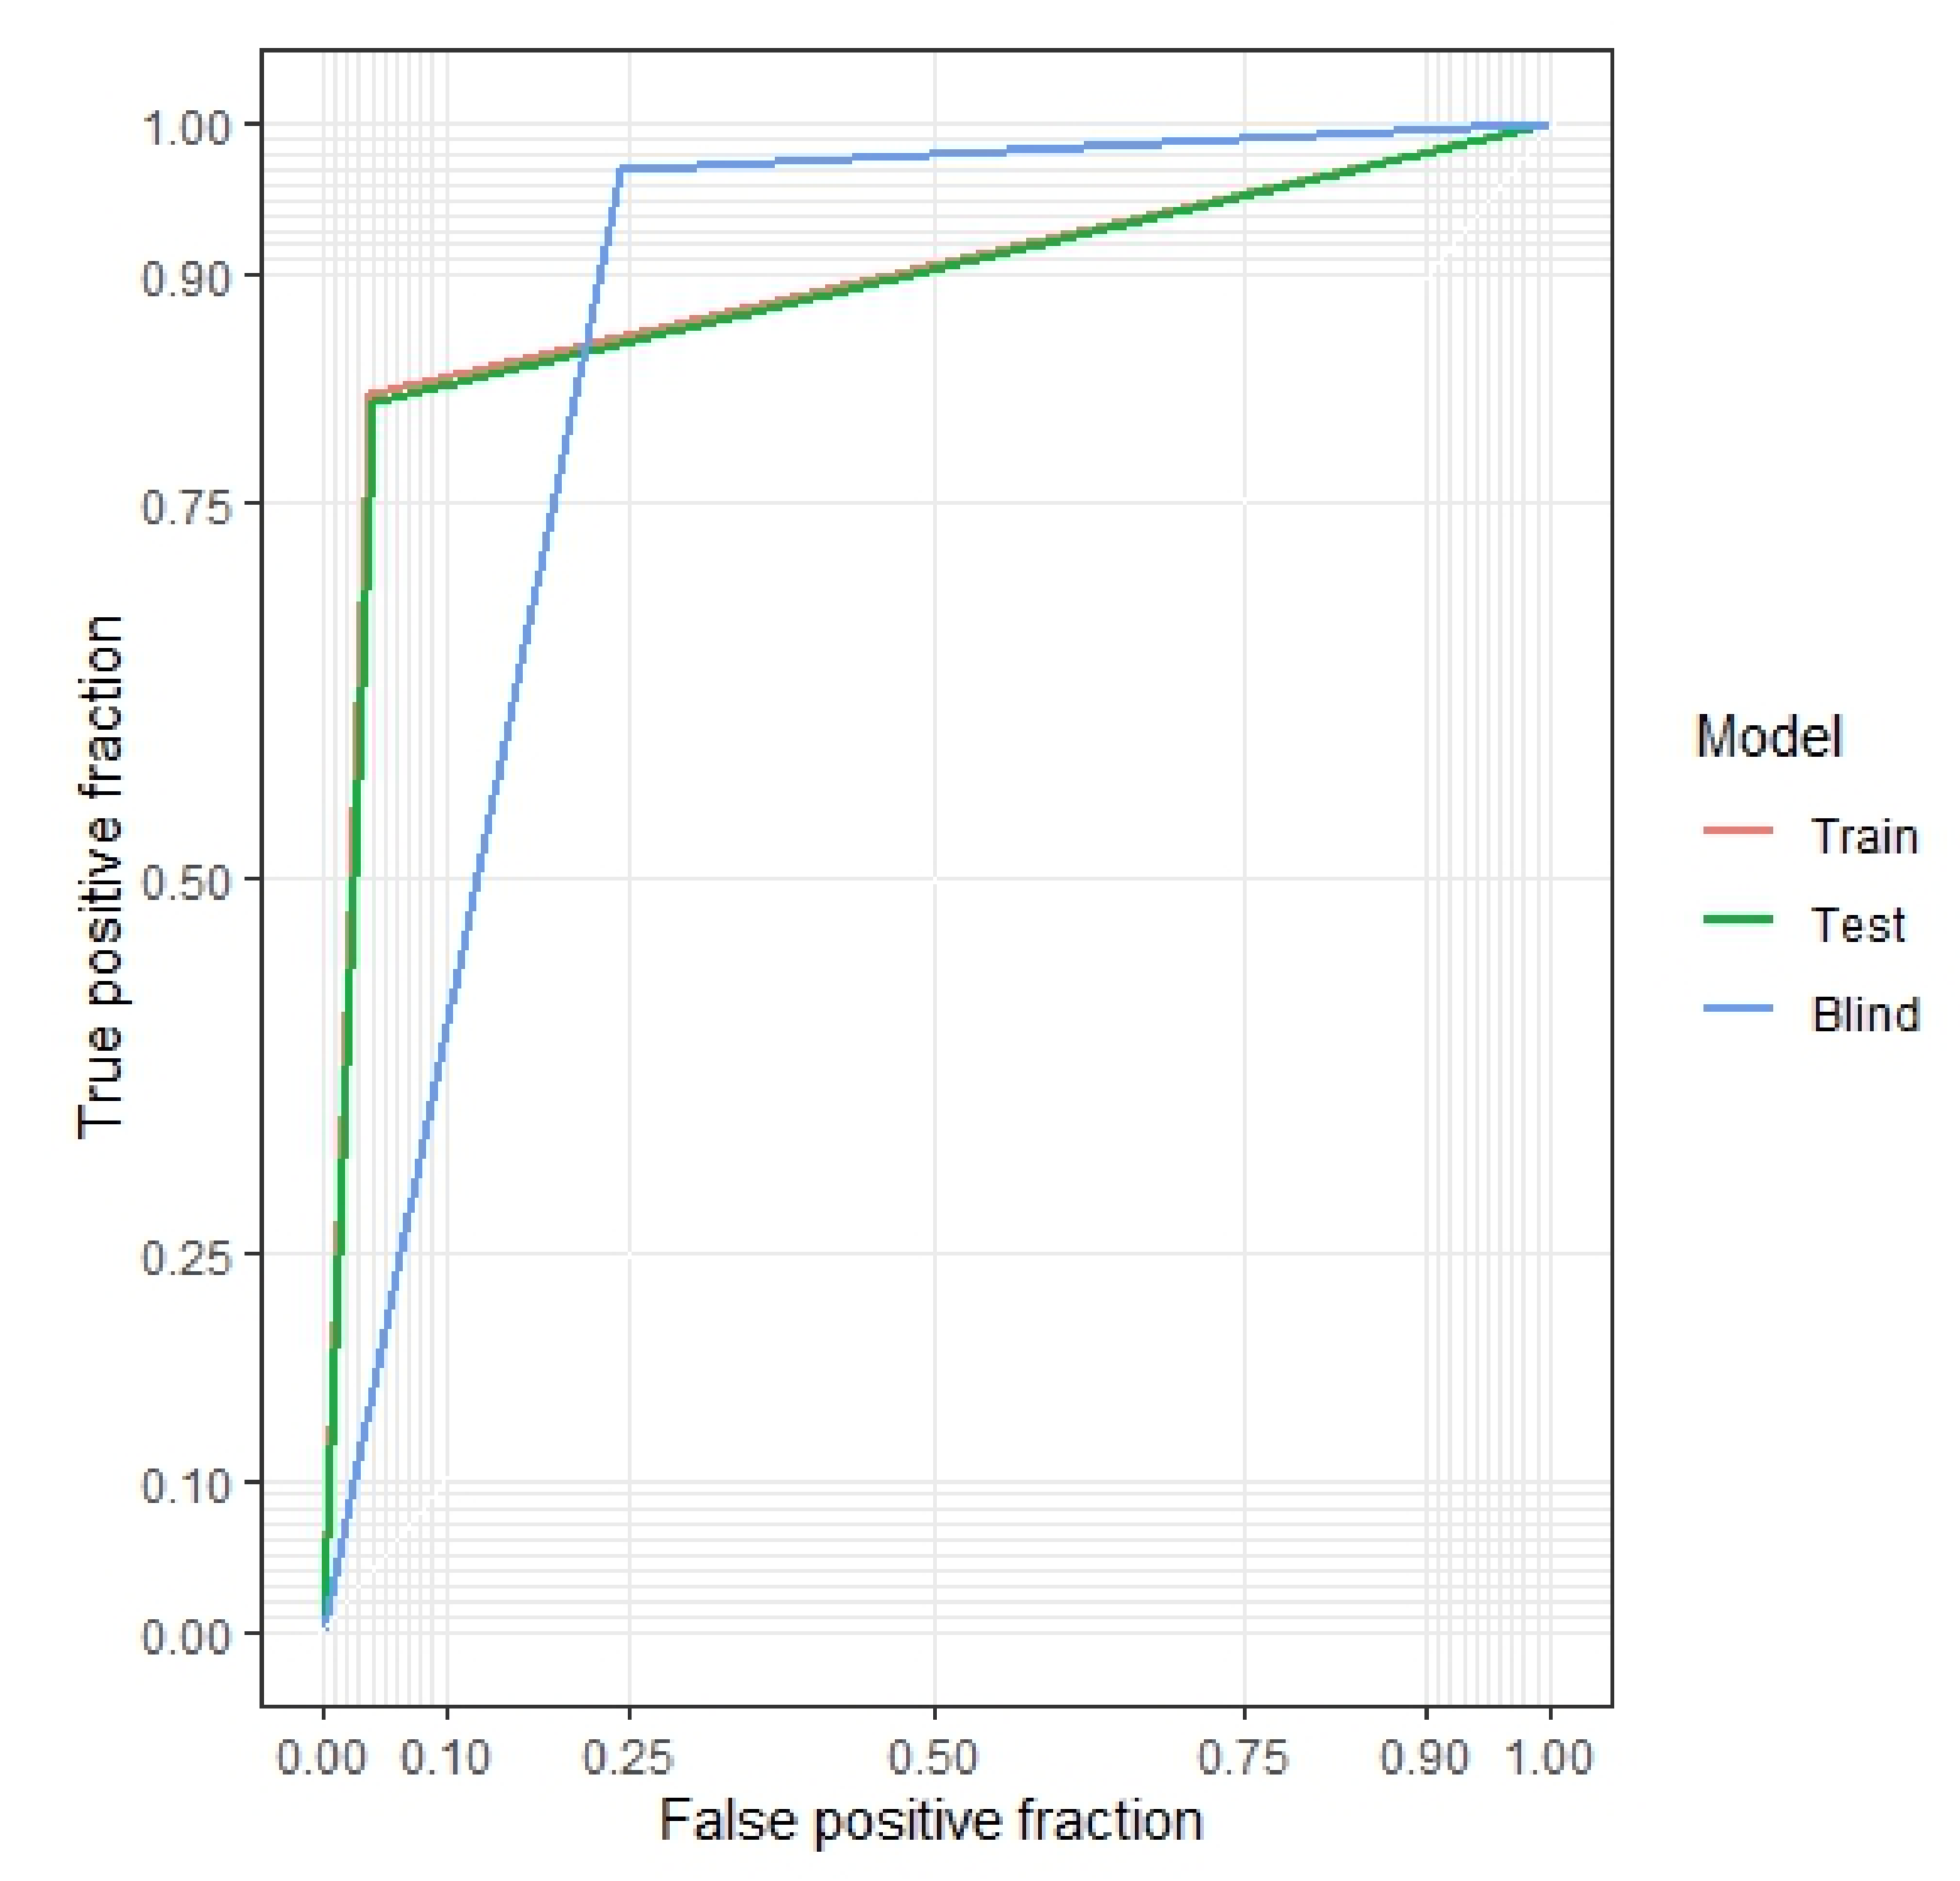
The ROC curves obtained are shown in Figure 7, where the training subset presented an area under the curve (AUC) value of 0.89 (red line), the testing subset presented an AUC value of 0.88 (green line), and the blind subset presented an AUC value of 0.86 (blue line).
In Figure 8, the confusion matrix of the CNN for the training dataset is shown, obtaining a sensitivity of 0.81, specificity of 0.96, PPV of 0.87 and kappa value of 0.80.
For the testing dataset, the confusion matrix of the CNN is shown in Figure 9, obtaining a sensitivity of 0.81, specificity of 0.95, PPV of 0.86 and kappa value of 0.79.
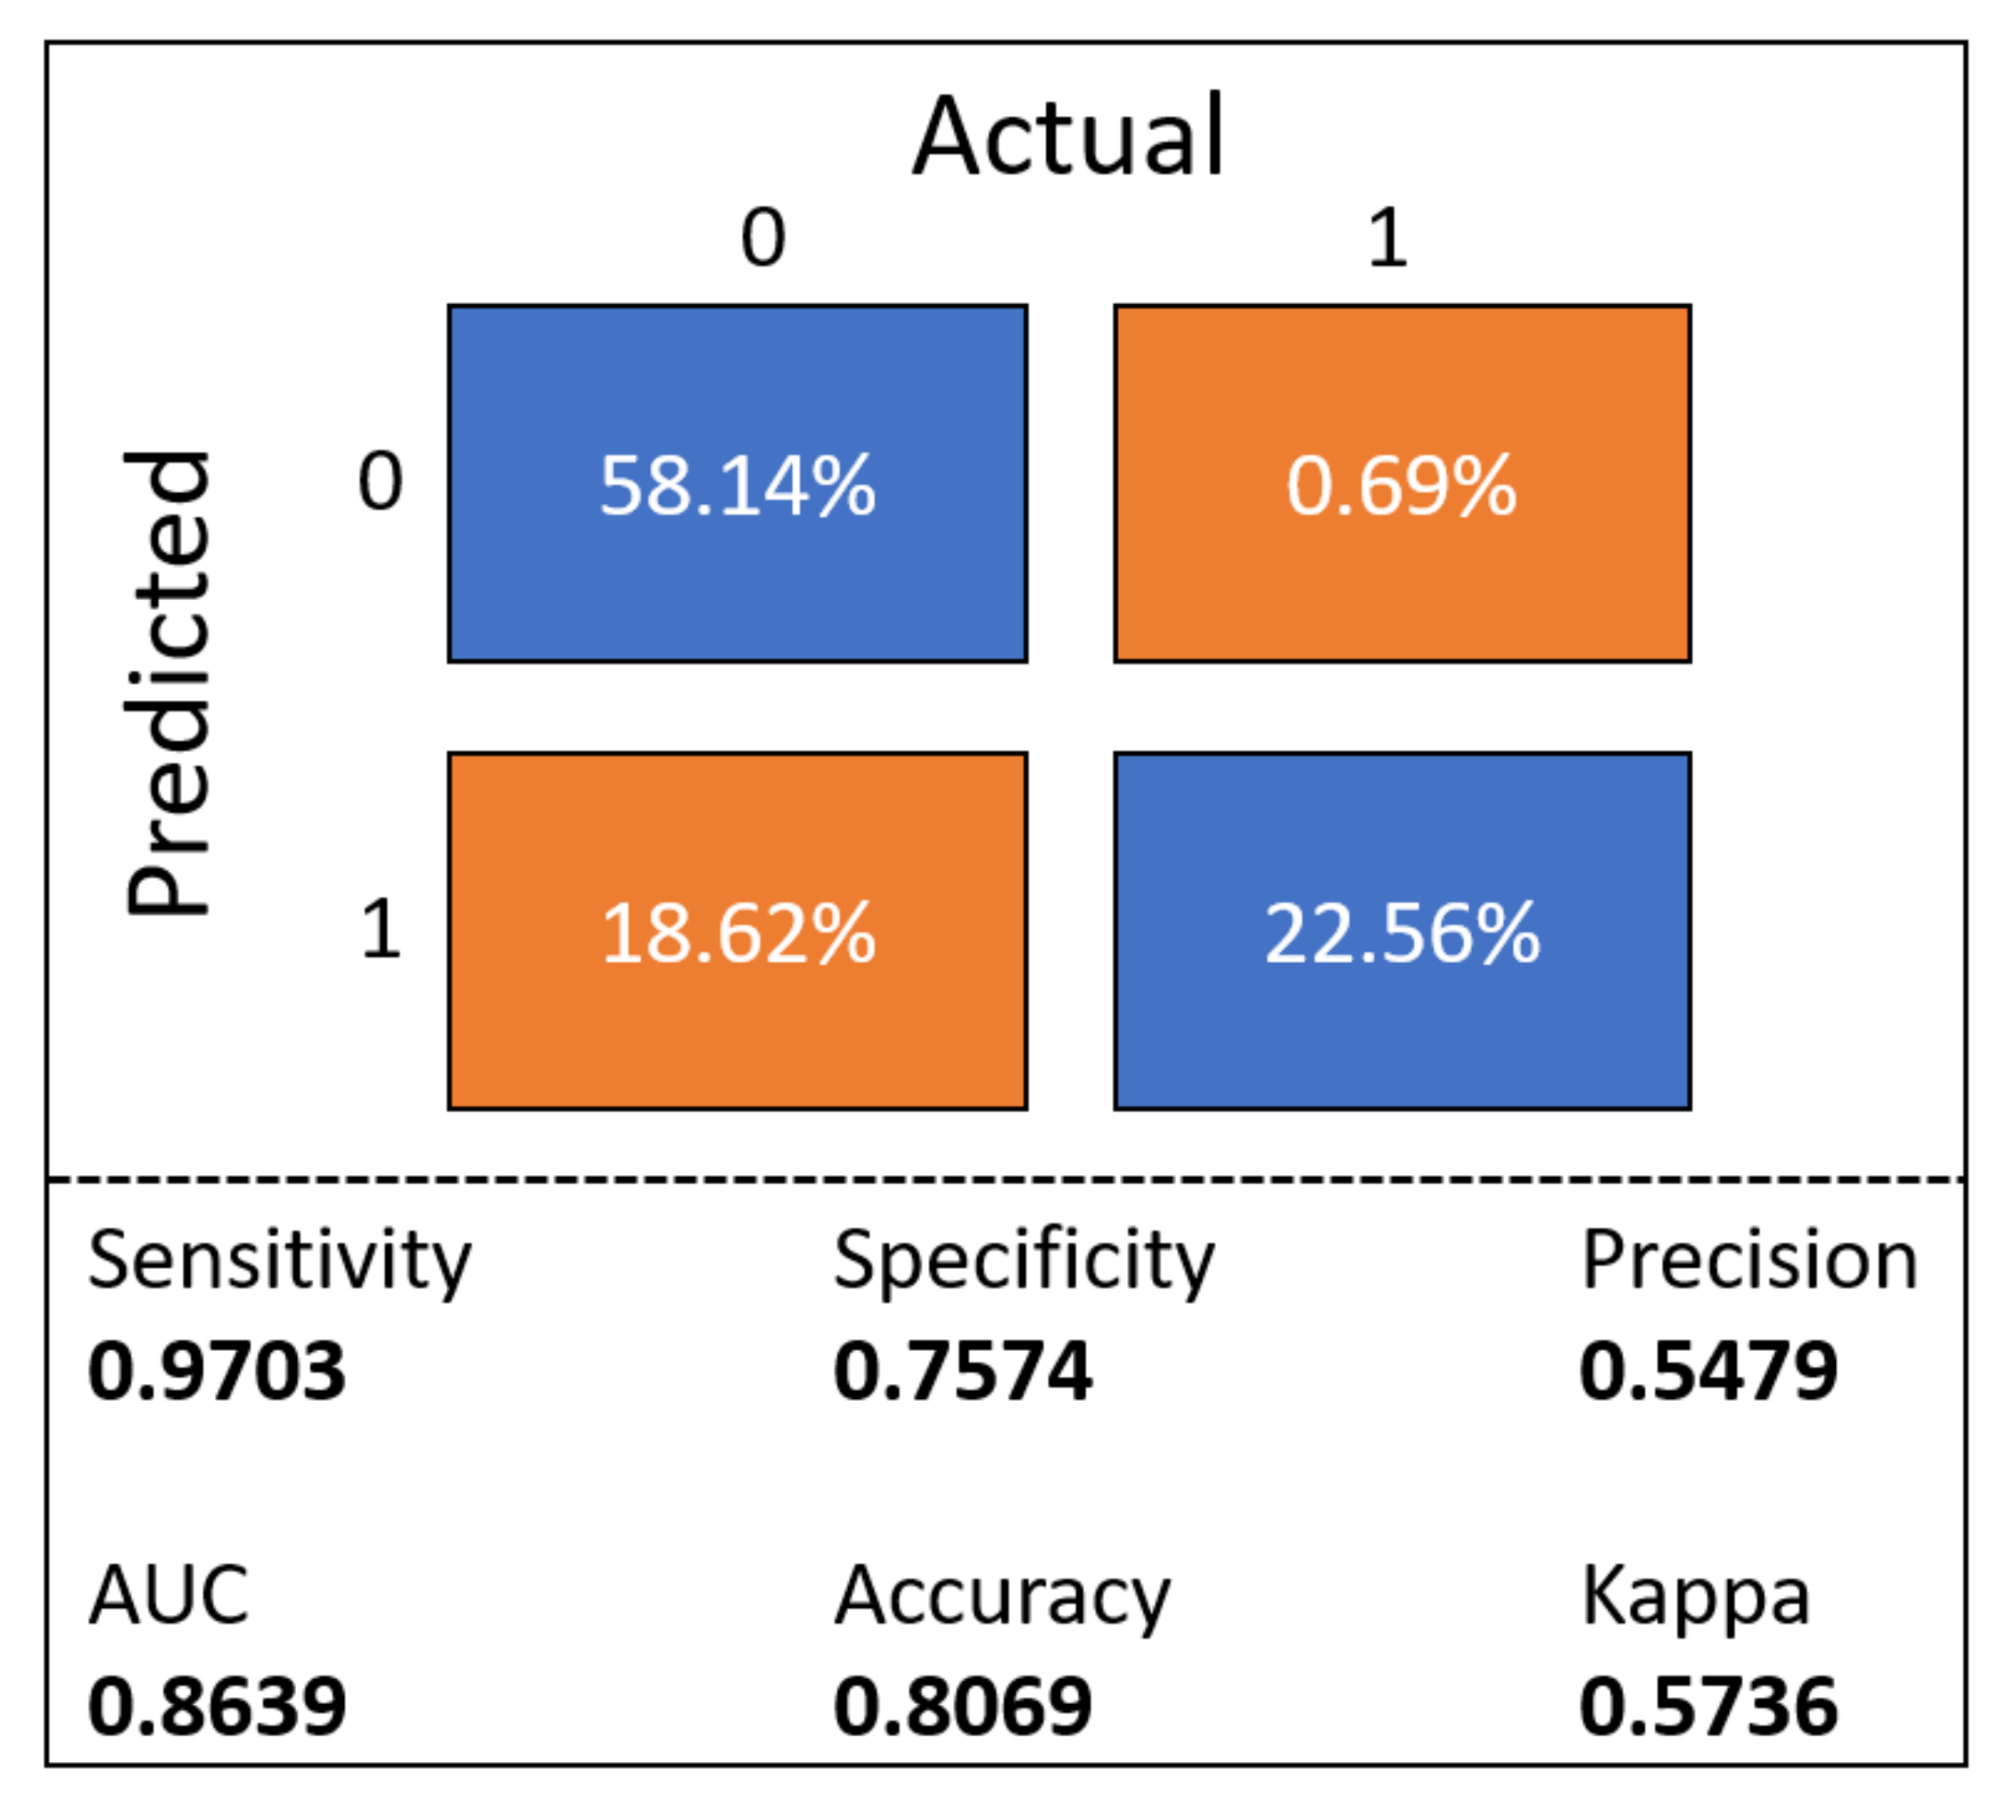
Finally, for the blind dataset, the confusion matrix of the CNN is shown in Figure 10, obtaining a sensitivity of 0.97, specificity of 0.75, PPV of 0 . 5479 and kappa value of 0.57.

5. Discussion

The proposed methodology is able to demonstrate the effectiveness of deep learning in the smart connected cars. The CNN of this work is able to detect distracted drivers while performing dangerous tasks such as texting and driving.
According to the results obtained, the CNN presents a generalized behavior since the evaluation using the test dataset presents very similar values to the obtained using the train dataset, even when the images were not seen by the CNN in the training stage, suggesting the high degree of detection once the system is fully trained.
On the other hand, in order to validate the CNN performance in a more realistic scenario, a blind dataset was used, where the data contained only unseen samples from different subjects, vehicles and cellphones, achieving an accuracy of 0.80, sensitivity and specificity of 0.97 and 0.75, respectively, and kappa value of 0.57. As it is evident, the CNN performance presents a decrease in its values due to the complete change of the environmental conditions; however, the CNN is still able to detect the texting and driving action with statistically significant performance.
From the confusion matrices for training and testing presented in Figure 8 and Figure 9, it is possible to observe that the performance of the CNN for the training and testing stages is very similar, with less than 1% of a difference in the false positive (FP) and, when the CNN is compared with the blind data set presented in Figure 10, an increase of 15.5% in the false negative (FN) with respect to the original testing data set is obtained; nevertheless, the FP, with a value of 0.06% in the blind test, remained within the original training values; therefore, even with different conditions, the CNN is able to precisely detect the “texting and driving” condition with a low rate of FN and FP.
From the validation stage, Figure 7 shows that the performance of the training and testing is also very similar, obtaining both AUC values higher than 0.88, being statistically significant, as well as the value obtained with the blind dataset, which is higher than 0.86, demonstrating again that the CNN is capable of detecting the “texting and driving” task in different conditions, suggesting the robustness of the CNN model.
In Table 2, a comparison of the presented research against two similar approaches is shown. These approaches are “SmartSence” and “TEXIVE”, where, from the SmartSence, no performance is disclosed and, from the TEXIVE, the authors present an accuracy of 87.18%; however, even when TEXIVE presents statistically significant performance, it is based on the assumption that the subject always carries the phone in the same position (i.e., left pocket) prior to entering the car, and it is placed or held in the same place inside the car. Chu et al. [18] focused instead on the detection of driving and did not detect distracted drivers. Lastly, Mantouka et al. [19] detected aggressive driver detection; however, the author did not disclose any performance regarding distracted driving. From this table, it is possible to observe that the methodology presented in this work exceeded any other similar approaches; in addition, it is not necessary to force the driver to carry the phone in any way or special place.
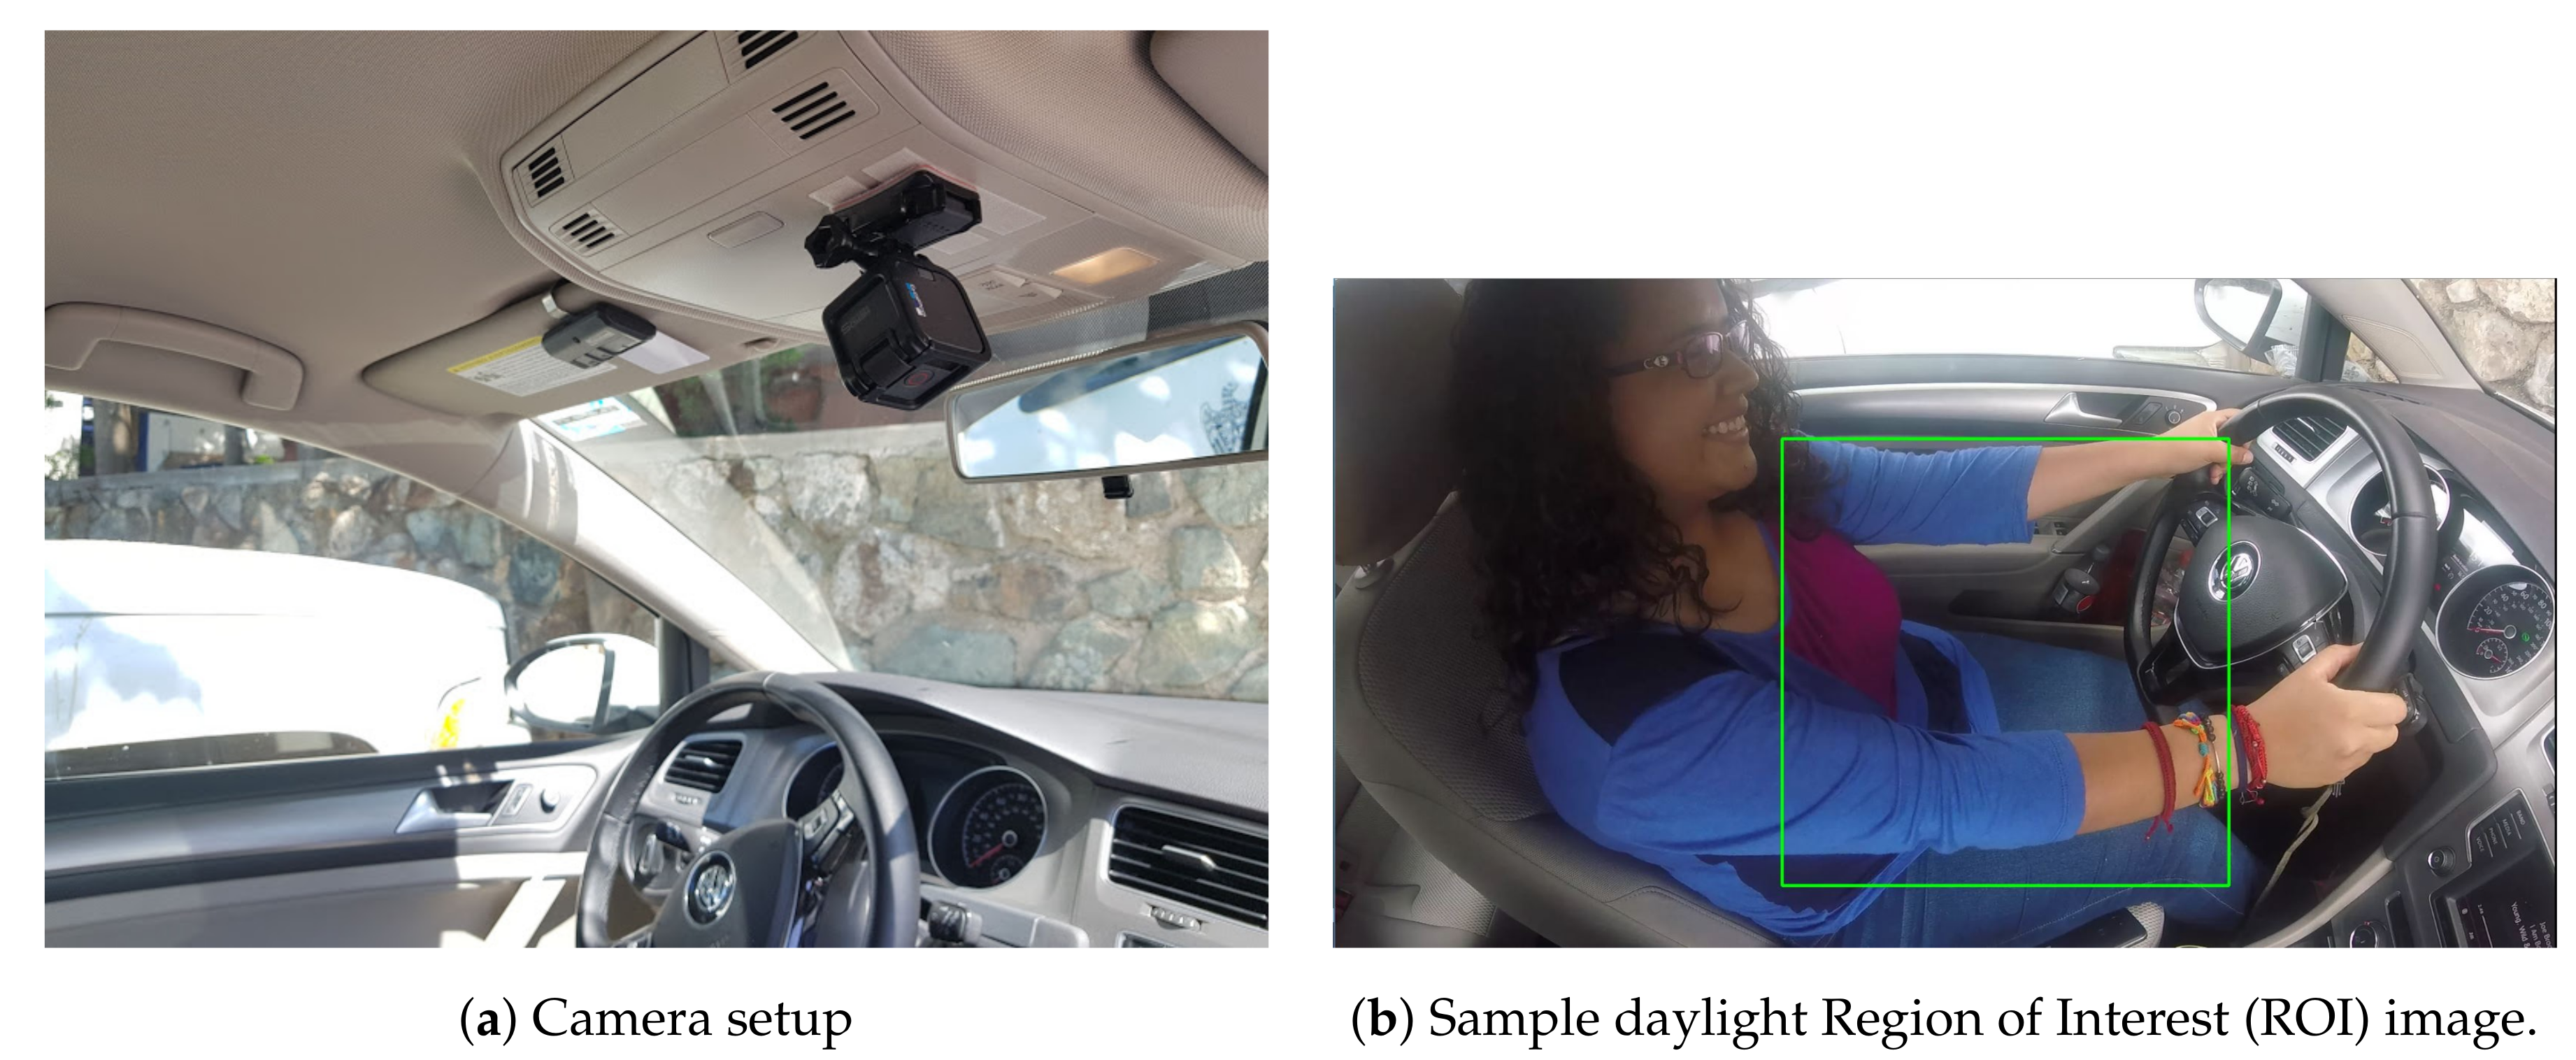
The present study limits the system to a green box delimited by return on investment, shown in Figure 2b; this restriction was selected as the most common place to hold the phone while texting, since, in order to write a text, the subject should see the screen of the phone; therefore, holding the phone outside of the ROI and texting represent only a small fraction of the total cases; nevertheless, future research will focus on addressing such scenarios. As mentioned in the related work in Section 2, several approaches have been proposed to solve the problem of distracted drivers [13,15,16,17,18,19]. Most of the approaches are based on applications; therefore, it does not require any modification of hardware, while our approach uses fixed sensors for vehicles, while we can think that this implementation will have a higher cost; the CNN used in this investigation can export to low-cost computers like Raspberry Pi 3 and can even be incorporated into an Android application, reducing the cost gap only at the cost of the wide-angle camera. In addition, our approach does not analyze “writing” patterns such as those proposed by He et al. [15] nor does it send any telematics outside the vehicle such as the SmartSense [12] approach, thus maintaining privacy. If we compare our approach with He et al. [15], if changes in the pattern of text messages are used to detect driving, our approach does not require any text message patterns. That is, we can detect when the user is distracted even when the user scrolls down in certain applications, sees a video, plays a game, etc. Furthermore, we do not force the user to enter from a specific door or take the cell phone to a particular place (i.e., the right pocket), according to the research proposed by Chu et al. [18]. Another aspect is that the proposed approach is not based on cloud-based telematics such as [12,21,23,25,26]; all the processing is done on the site, keeping, as shown, the fixed sensors in the vehicle. They have huge advantages over application-based approaches; however, we do not believe that both approaches fight each other, but we think that the both approaches can benefit from each other; for example, our approach can work backwards (i.e., detect driving instead of sending text messages), and communicate with the mobile phone to inform when the driver was driving, and the mobile phone in combination with other application-based approaches can use that information to block notifications, calls and other distraction events, so that the proposed methodology can be more complete for the user.
The industry has driven some approaches based on applications such as TrueMotion, DriveWell, Floow Score, among others [23,25,26]. However, these approaches focus on the driver’s score to evaluate the risk on the part of the insurance companies. Some of them present some feedback to the driver. In some cases, the user of this feedback reduced the use of the cell phone as in DriveWell [25]. Nevertheless, this change is achieved by increasing the policy insurance or labor penalties for those who use the cell phone. Contrary to this, our approach does not require that the data be collected, transmitted and analyzed to “score” a driver, but our approach is based on the detection of users in real time. With this approach, we can send feedback in real time to avoid such use (i.e., steering wheel vibration, dashboard warning, etc.). With this warning, we could reduce the use of the cellphone while driving, and, contrary to industry approaches, we can prevent accidents related to the distraction, and not only calculate a “risk” score. In addition, as indicated above, our approach can be used with other applications as a complement to assess driver behavior and calculate individual risk.

6. Conclusions

In conclusion, according to the literature, this is the first time that a CNN has been used to detect the problem of texting and driving, achieving a very good performance and being able to detect the distracted driver with high sensitivity and specificity. Then, the implementation of this system in intelligent information and entertainment can provide a tool for the prevention of accidents related to the sending of text messages and driving, giving a warning to the driver about the use of the mobile phone while driving, supporting the reduction of mortality. Due to this scenario, it was thought that the system would be incorporated in future automobiles as a standard infotainment security system that can communicate with other systems (i.e., force the activation of maintenance line assistance until the driver is no longer distracted, activate pedestrian detection, advance) collision warning, etc.); however, the system can be easily developed to be incorporated as an independent device to monitor the performance of the driver of large fleets of driving cars.

Author Contributions

J.M.C.-P. and C.E.G.-T. performed the study. C.E.G.-T. and H.G.-R. performed the study design and data analysis. J.M.C.-P., C.E.G.-T., J.S.A.L.-A., L.A.Z.-C., J.I.G.-T., H.G.-R. and H.L.-G. contributed to Materials and Methods used in this study. J.I.G.-T. and J.M.C.-P. performed statistical analysis with critical feedback to authors. J.S.A.L.-A. contributed with the gathering and processing of the original data set used in this study. H.G.-R., N.K.G.-R. and H.L.-G. provided technical feedback from the results. All authors interpreted findings from the analysis and drafted the manuscript.

Funding

This research received no external funding.

Acknowledgments

The authors thank Joyce Lozano Aguilar, Javier Saldivar Pérez, Martin Hazael Guerrero Flores, Fabian Navarrete Rocha and Vanessa del Rosario Alcalá Ramírez for the support of the data collection. “Artículo publicado con apoyo PFCE 2019” (article published with support of PFCE 2019).

Conflicts of Interest

The authors declare no conflict of interest.

References

  1. You, C.W.; Lane, N.D.; Chen, F.; Wang, R.; Chen, Z.; Bao, T.J.; Montes-de Oca, M.; Cheng, Y.; Lin, M.; Torresani, L.; et al. Carsafe app: Alerting drowsy and distracted drivers using dual cameras on smartphones. In Proceedings of the 11th annual international conference on Mobile Systems, aPplications, and Services, Taipei, Taiwan, 25–28 June 2013; pp. 13–26. [Google Scholar]
  2. National Highway Traffic Safety Administration. Driver Electronic Device Use in 2015. 2016. Available online: https://crashstats.nhtsa.dot.gov/Api/Public/ViewPublication/812326 (accessed on 13 June 2018).
  3. Federal Communications Commission. Distracted Driving. Available online: https://www.fcc.gov/general/distracted-driving (accessed on 10 June 2018).
  4. World Health Organization. Global Status Report on Road Safety 2015; World Health Organization: Geneva, Switzerland, 2015. [Google Scholar]
  5. World Health Organization. Mobile Phone Use: A Growing Problem of Driver Distraction. 2011. Available online: https://www.who.int/violence_injury_prevention/publications/road_traffic/distracted_driving/en/ (accessed on 5 June 2018).
  6. Li, X.; Rakotonirainy, A.; Yan, X.; Zhang, Y. Driver’s Visual Performance in Rear-End Collision Avoidance Process under the Influence of Cell Phone Use. Transp. Res. Rec. J. Transp. Res. Board 2018, 2672, 55–63. [Google Scholar] [CrossRef]
  7. Atiquzzaman, M.; Qi, Y.; Fries, R. Exploring Distracted Driver Detection Algorithms Using a Driving Simulator Study. Transp. Res. Board 2017, 2017, 1–12. [Google Scholar]
  8. Iqbal, S.T.; Horvitz, E.; Ju, Y.C.; Mathews, E. Hang on a Sec! Effects of Proactive Mediation of Phone Conversations While Driving. In Proceedings of the SIGCHI Conference on Human Factors in Computing Systems, Vancouver, BC, Canada, 7–12 May 2011; pp. 463–472. [Google Scholar]
  9. Klauer, S.G.; Guo, F.; Bruce, G.; Simons-Morton, E.; Ouimet, M.C.; Lee, S.E.; Dingus, T.A. Distracted Driving and Risk of Road Crashes among Novice and Experienced Drivers. N. Engl. J. Med. 2014, 370, 54–59. [Google Scholar] [CrossRef] [Green Version]
  10. Gliklich, E.; Guo, R.; Bergmark, R.W. Texting while driving: A study of 1211 U.S. adults with the Distracted Driving Survey. Prev. Med. Rep. 2016, 4, 486–489. [Google Scholar] [CrossRef] [PubMed] [Green Version]
  11. Distracted Driving Device Dock. 2017. Available online: https://distracteddrivingdevice.com (accessed on 20 June 2018).
  12. SmartDrive Systems. First Sensor in SmartDrive’s New Line of Intelligent Driver-Assist Sensors Recognized for Addressing One of the Deadliest Risks in Commercial Transportation. Available online: https://www.smartdrive.net/smartdrive-smartsense-distracted-driving-named-heavy-duty-truckings-2018-top-20-products-list/ (accessed on 22 June 2018).
  13. Wahlström, J.; Skog, I.; Händel, P. Smartphone-based vehicle telematics: A ten-year anniversary. IEEE Trans. Intell. Transp. Syst. 2017, 18, 2802–2825. [Google Scholar]
  14. Saiprasert, C.; Supakwong, S.; Sangjun, W.; Thajchayapong, S. Effects of smartphone usage on driver safety level performance in urban road conditions. In Proceedings of the 2014 11th International Conference on Electrical Engineering/Electronics, Computer, Telecommunications and Information Technology (ECTI-CON), Nakhon Ratchasima, Thailand, 14–17 May 2014; pp. 1–6. [Google Scholar]
  15. He, J.; Chaparro, A.; Wu, X.; Crandall, J.; Ellis, J. Mutual interferences of driving and texting performance. Compute. Hum. Behav. 2015, 52, 115–123. [Google Scholar]
  16. Watkins, M.L.; Amaya, I.A.; Keller, P.E.; Hughes, M.A.; Beck, E.D. Autonomous detection of distracted driving by cell phone. In Proceedings of the 2011 14th International IEEE Conference on Intelligent Transportation Systems (ITSC), Washington, DC, USA, 5–7 October 2011; pp. 1960–1965. [Google Scholar]
  17. Bo, C.; Jian, X.; Jung, T.; Han, J.; Li, X.Y.; Mao, X.; Wang, Y. Detecting driver’s smartphone usage via nonintrusively sensing driving dynamics. IEEE Internet Things J. 2017, 4, 340–350. [Google Scholar]
  18. Chu, H.; Raman, V.; Shen, J.; Kansal, A.; Bahl, V.; Choudhury, R.R. I am a smartphone and I know my user is driving. In Proceedings of the 2014 Sixth International Conference on Communication Systems and Networks (COMSNETS), Bangalore, India, 6–10 January 2014; pp. 1–8. [Google Scholar]
  19. Mantouka, E.G.; Barmpounakis, E.N.; Vlahogianni, E.I. Mobile Sensing and Machine Learning for Identifying Driving Safety Profiles; Technical Report; Transportation Research Board: Washington, DC, USA, 2018. [Google Scholar]
  20. Dai, J.; Teng, J.; Bai, X.; Shen, Z.; Xuan, D. Mobile phone based drunk driving detection. In Proceedings of the 2010 4th International Conference on Pervasive Computing Technologies for Healthcare, Munich, Germany, 22–25 March 2010; pp. 1–8. [Google Scholar]
  21. Händel, P.; Skog, I.; Wahlström, J.; Bonawiede, F.; Welch, R.; Ohlsson, J.; Ohlsson, M. Insurance Telematics: Opportunities and Challenges with the Smartphone Solution. IEEE Intell. Transp. Syst. Mag. 2014, 6, 57–70. [Google Scholar]
  22. Engelbrecht, J.; Booysen, M.J.; van Rooyen, G.J.; Bruwer, F.J. Survey of smartphone-based sensing in vehicles for intelligent transportation system applications. IET Intell. Transp. Syst. 2015, 9, 924–935. [Google Scholar]
  23. True Motion Technologies. True Motion. 2019. Available online: https://gotruemotion.com/category/distracted-driving/ (accessed on 6 June 2019).
  24. True Motion Technologies. Mojo. 2019. Available online: https://gotruemotion.com/distracted-driving/announcing-mojo-the-app-that-rewards-safe-driving/ (accessed on 19 June 2019).
  25. Cambridge Mobile Telematics (CMT). DriveWell: A Behavior-Based Program. 2019. Available online: https://www.cmtelematics.com/drivewell/ (accessed on 6 June 2019).
  26. Limited The Floow. FloowScore, Driver Scoring. 2019. Available online: https://www.thefloow.com/what-we-do/ (accessed on 6 June 2019).
  27. Russakovsky, O.; Deng, J.; Su, H.; Krause, J.; Satheesh, S.; Ma, S.; Huang, Z.; Karpathy, A.; Khosla, A.; Bernstein, M.; et al. Imagenet large scale visual recognition challenge. Int. J. Comput. Vis. 2015, 115, 211–252. [Google Scholar]
  28. Esteva, A.; Kuprel, B.; Novoa, R.A.; Ko, J.; Swetter, S.M.; Blau, H.M.; Thrun, S. Dermatologist-level classification of skin cancer with deep neural networks. Nature 2017, 542, 115. [Google Scholar] [PubMed]
  29. Szegedy, C.; Vanhoucke, V.; Ioffe, S.; Shlens, J.; Wojna, Z. Rethinking the inception architecture for computer vision. In Proceedings of the IEEE Conference on Computer Vision and Pattern Recognition, Las Vegas, NV, USA, 27–28 July 2016; pp. 2818–2826. [Google Scholar]
  30. Pan, S.J.; Yang, Q. A survey on transfer learning. IEEE Trans. Knowl. Data Eng. 2010, 22, 1345–1359. [Google Scholar]
  31. Google LLC. Advanced Guide to Inception v3 on Cloud TPU. Available online: https://cloud.google.com/tpu/docs/inception-v3-advanced (accessed on 6 June 2019).
  32. Hancock, M.F., Jr. Practical Data Mining; CRC Press: Boca Raton, FL, USA, 2011. [Google Scholar]
  33. Helene Bischel, S. El método de la entropía cruzada. Algunas Aplicaciones 2015. Available online: http://repositorio.ual.es/handle/10835/3322 (accessed on 6 June 2019).
  34. Zanella-Calzada, L.; Galván-Tejada, C.; Chávez-Lamas, N.; Rivas-Gutierrez, J.; Magallanes-Quintanar, R.; Celaya-Padilla, J.; Galván-Tejada, J.; Gamboa-Rosales, H. Deep Artificial Neural Networks for the Diagnostic of Caries Using Socioeconomic and Nutritional Features as Determinants: Data from NHANES 2013–2014. Bioengineering 2018, 5, 47. [Google Scholar]
  35. Saxe, J.; Berlin, K. Deep neural network based malware detection using two dimensional binary program features. In Proceedings of the 2015 10th International Conference on Malicious and Unwanted Software (MALWARE), Fajardo, Puerto Rico, 20–22 October 2015; pp. 11–20. [Google Scholar]
  36. Nye, M.; Saxe, A. Are Efficient Deep Representations Learnable? arXiv 2018, arXiv:1807.06399. [Google Scholar]
  37. Lobo, J.M.; Jiménez-Valverde, A.; Real, R. AUC: a misleading measure of the performance of predictive distribution models. Glob. Ecol. Biogeogr. 2008, 17, 145–151. [Google Scholar]
  38. Hanley, J.A.; McNeil, B.J. The meaning and use of the area under a receiver operating characteristic (ROC) curve. Radiology 1982, 143, 29–36. [Google Scholar] [PubMed]
  39. Fleiss, J.L.; Cohen, J. The equivalence of weighted kappa and the intraclass correlation coefficient as measures of reliability. Educ. Psychol. Meas. 1973, 33, 613–619. [Google Scholar]
Figure 1. Flowchart of the methodology proposed.
Applsci 09 02962 g001
Figure 2. Image acquisition setup.
Applsci 09 02962 g002
Figure 3. Inception V3 CNN architecture. Adapted from [31].
Applsci 09 02962 g003
Figure 4. Experiment image data distribution.
Applsci 09 02962 g004
Figure 5. Graph of the accuracy obtained along the 5000 epochs, red line = train data, blue line = validation data.
Applsci 09 02962 g005
Figure 6. Graph of the cross entropy obtained along the 5000 epochs, red line = train data, blue line = validation data.
Applsci 09 02962 g006
Figure 7. Performance of the model measured using receiver operating characteristic (ROC) curves, red line = train data set, green line = test data set, blue line = blind data set.
Applsci 09 02962 g007
Figure 8. Convolutional neural network (CNN) confusion matrix for the training dataset.
Applsci 09 02962 g008
Figure 9. CNN Confusion matrix for the test dataset.
Applsci 09 02962 g009
Figure 10. CNN Confusion matrix for the blind dataset.
Applsci 09 02962 g010
Table 1. Data distribution.
DayNight
Dataset IDVehicleSubjectCellphone ModelDistractedNon DistractedDistractedNon DistractedTotal
ID1Honda HR-V 2017AzXiaomi redmi 5a170754512755439414,307
ID1Honda HR-V 2017FaMotorola X Play188552601952523914,336
ID1Honda HR-V 2017JeAlcatel pop 5131257631236583314,144
ID1Honda HR-V 2017JoHuawei P20 Light24534446683647114,053
ID2VW Golf 2016JaMoto G5 plus122259751057584214,096
ID2VW Golf 2016vaMotorola moto g5 plus200652072355489714,465
Total =85,401
Number of captured images.
Table 2. Performance comparison of related work.
ApproachResearch ObjectiveDescriptionPerformance
Our ApproachDistracted Drivers (Texting and driving)Computer vision & Convolutional Neural Network92.8% Accuracy
The SmartSense  [12]Distracted Drivers through head and eye movementsComputer vision & TelematicsNon Disclosed
TEXIVE  [17]Distracted Drivers (Texting and driving)Phone based, Inertial Sensors, No Crossvalidation 87.18 % Accuracy
Chu et al.  [18]Passanger or Driver DetectionSmartphone sensors, SVM classifier 85 % Accuracy
Mantouka et al.  [19]Aggressive driver detectionSmartphone, K-means to detect aggressive drivingNon Disclosed
SVM = Support-vector machine.

