Ultrasonic Transducer Array Performance for Improved Cleaning of Pipelines in Marine and Freshwater Applications


1
Brunel University London, Kingston Lane, Uxbridge, Middlesex UB8 3PH, UK
2
Nuclear AMRC, Brunel Way, Catcliffe, Rotherham S60 5WG, UK
3
Pontifical Catholic University of Rio de Janeiro (PUC-Rio), Rio de Janeiro 22451-900, Brazil
4
TWI Ltd., Granta Park, Great Abington, Cambridge CB21 6AL, UK
*
Author to whom correspondence should be addressed.
Appl. Sci. 2019, 9(20), 4353; https://doi.org/10.3390/app9204353
Submission received: 16 September 2019
/
Revised: 4 October 2019
/
Accepted: 12 October 2019
/
Published: 16 October 2019
(This article belongs to the Section Acoustics and Vibrations)
Abstract
:Featured Application
non-invasive ultrasonic cleaning technology for subsea pipelines.
Abstract
Fouling accumulation in pipelines is a well-known problem in industry across various applications. The build-up of fouling within a pipe can reach a detrimental state, leading to pipe blockages that, in turn, result in pipe bursts. As pipelines transport fluid up to hundreds of meters, a method to prevent and remove fouling at long distances is required to support an engineering structure without the requirement of halts for maintenance to be carried out. Underwater pipelines are currently deployed which must ensure that pipelines carrying crude oil do not reach a detrimental state which leads to pipe leaks or pipe bursts, resulting in a discharge of oil into the surrounding water. This work discusses an optimized ultrasonic cleaning transducer array which undergoes marinization. The marinized transducers are characterized for impedance and wave propagation across a fouled 6.2 m long, Schedule 40, 6-inch diameter carbon steel pipe. This study has shown that the addition of marinized material dampens the vibrational output from the High-Power Ultrasonic Transducer (HPUT) configuration. This reduction in vibration is most significant when the structure is filled with water, resulting in a marinized HPUT configuration dropping by up to 85% and a non-marinized HPUT configuration dropping by up to 80%.
1. Introduction
Fouling is a well-known problem in industry as it occurs in various different engineering assets depending on the environmental conditions surrounding the fouled structure. In industry, there are different means in which a liquid substance can be transported, one example is the use of pipelines. As pipes are filled with a liquid, the movement of fluid can begin to accumulate fouling and/or scaling on the inner wall of the pipe which may lead to a pipeline blockage. The occurrence of a blockage in a pipeline will immediately affect the performance to transport liquid and leads to the operating condition to drop below an acceptable level. The fouling/scaling that is generated also contributes to the contamination of the moving liquid, which can affect the quality of the fluid which passes the contaminated walls.
The accumulation of fouling has a significant effect on pipelines as it increases the likelihood of pipeline failure. More specifically, corrosion fouling accounts for 65% of pipeline failure [1,2]. The implications of this include danger to surrounding individuals, unscheduled downtime, as well as economic impact due to maintenance costs and profit loss. The decommissioning process of pipelines must abide by regulations to decontaminate, clean, dispose, and recycle material [3,4]. In some cases, the pipelines must be transported to land to carry out de-fouling, which again has cost implications. For the decommissioning process to achieve a more streamlined approach, various aspects must be maintained to allow decommissioned pipelines to reduce their cost implications; one method is to minimize the fouling accumulation of the pipe before decommission and also prolong the pipeline’s lifespan by the reduction of fouling. The removal of fouling can be very costly and has resulted in many attempts to mitigate, monitor, and remove fouling accumulation in a cost-effective manner. This growth of fouling is difficult to mitigate and also costly to remove, as mitigating means cannot guarantee 100% anti-fouling of a structure.
1.1. Underwater Pipelines
Underwater pipelines are an economical and efficient method of transportation of large amounts of fluid, commonly for crude oil and natural gas. Pipelines are typically made of carbon steel due to its mechanical properties, low cost, and corrosion-resistant properties [5,6]. However, by transporting fluid through the pipe, a buildup of fouling can occur which can lead to pipe leakage or burst, resulting in a discharge into the surrounding water. Oil spills endanger public health, drinking water, and natural resources and disrupt the economy [7]. To reduce the probability of oil spills, the maintenance and removal of fouling accumulation that leads to pipe leaks and bursts must be carried out. As the pipeline is underwater, this results in other types of fouling accumulation to occur such as biological fouling which can result in damage to the outer pipe wall.
1.2. Fouling Mitigation
Methods for mitigation of fouling build-up have been addressed through means of new materials (such as composites) as lining rehabilitation. This includes but is not limited to Teflon, nanocomposites, plastics, fiber-reinforced polymers, and alloys. The addition of coatings of the aforementioned materials can assist in preventing the build-up due to the lining on the structure’s walls. Other preventative means can include the design optimization of the structure to reduce fouling build-up, common in heat exchangers. Another method of prevention is the assistance of chemicals known as ‘acid treatment’ or ‘pH control’ [8], as well as the addition of chemical agents into the processed liquid. Magnetic fields [9] and electric fields [10] have both been used for crystallization fouling and biofouling prevention.
1.3. Fouling Detection
Current detection methods require halts in production to carry out monitoring such as pigging. New tools in pigging have been used, such as ultrasonic inspection equipment, for not only cleaning but also for detecting failures and corrosion, or to verify the cleaning efficiency. In recent years, the usage of Ultrasonic Guided Waves has been recognized as a potential solution for the detection of fouling accumulation through structural health monitoring but is still in its initial stages of readiness for industrial practice [11].
1.4. Fouling Removal
One of the most used fouling removal technique that has been applied to pipelines is the use of chemicals as it can achieve up to 100% removal [12]; however, this is achieved with the addition of harsh implications to the environment. Legislation has recently surfaced to demote the use of chemicals, thus other solutions for fouling removal and prevention must be reviewed and carried out in replacement of chemicals. Various techniques on the market require the halt of production and facilities to carry out defouling due to its invasive approach. The pause in production can amount to profit losses that can become costly. A noninvasive approach would provide added benefit of removal without the halting of facilities.
Previous work has shown capabilities to remove inner wall pipe fouling noninvasively using ultrasounds [13,14,15,16]. This is carried out by the attachment of a High-Power Ultrasonic Transducer (HPUT) onto the outer wall of a water-filled pipe. The HPUT delivers a high compressional wave through the structure and into the liquid medium to generate acoustic cavitation bubbles. The generated cavitation bubbles produce a fouling removal mechanism due to the implosion of these bubbles, creating high forces, pressure, and temperature that dislodges fouling from the fouled surface.
Further work is required to validate its capability to achieving long-distance cleaning. To apply this technique onto subsea pipelines, the ultrasonic technique must be marinized for underwater applications.
This paper begins with the methodology and development of a marinization technique to enclose a 40 kHz high power ultrasonic transducer in Section 2. To validate the marinized transducers, the laboratory methodology is discussed in Section 3. The designed transducer array is validated on a fouled 6.2 m long, Schedule 40, 6-inch diameter carbon steel pipe in Section 4. A field trial is carried out using the ultrasonic technique in Section 5 and a complete system demonstration for underwater applications is shown in Section 6. The paper concludes with the findings and suggests further work in Section 7.
2. Marinization Methodology
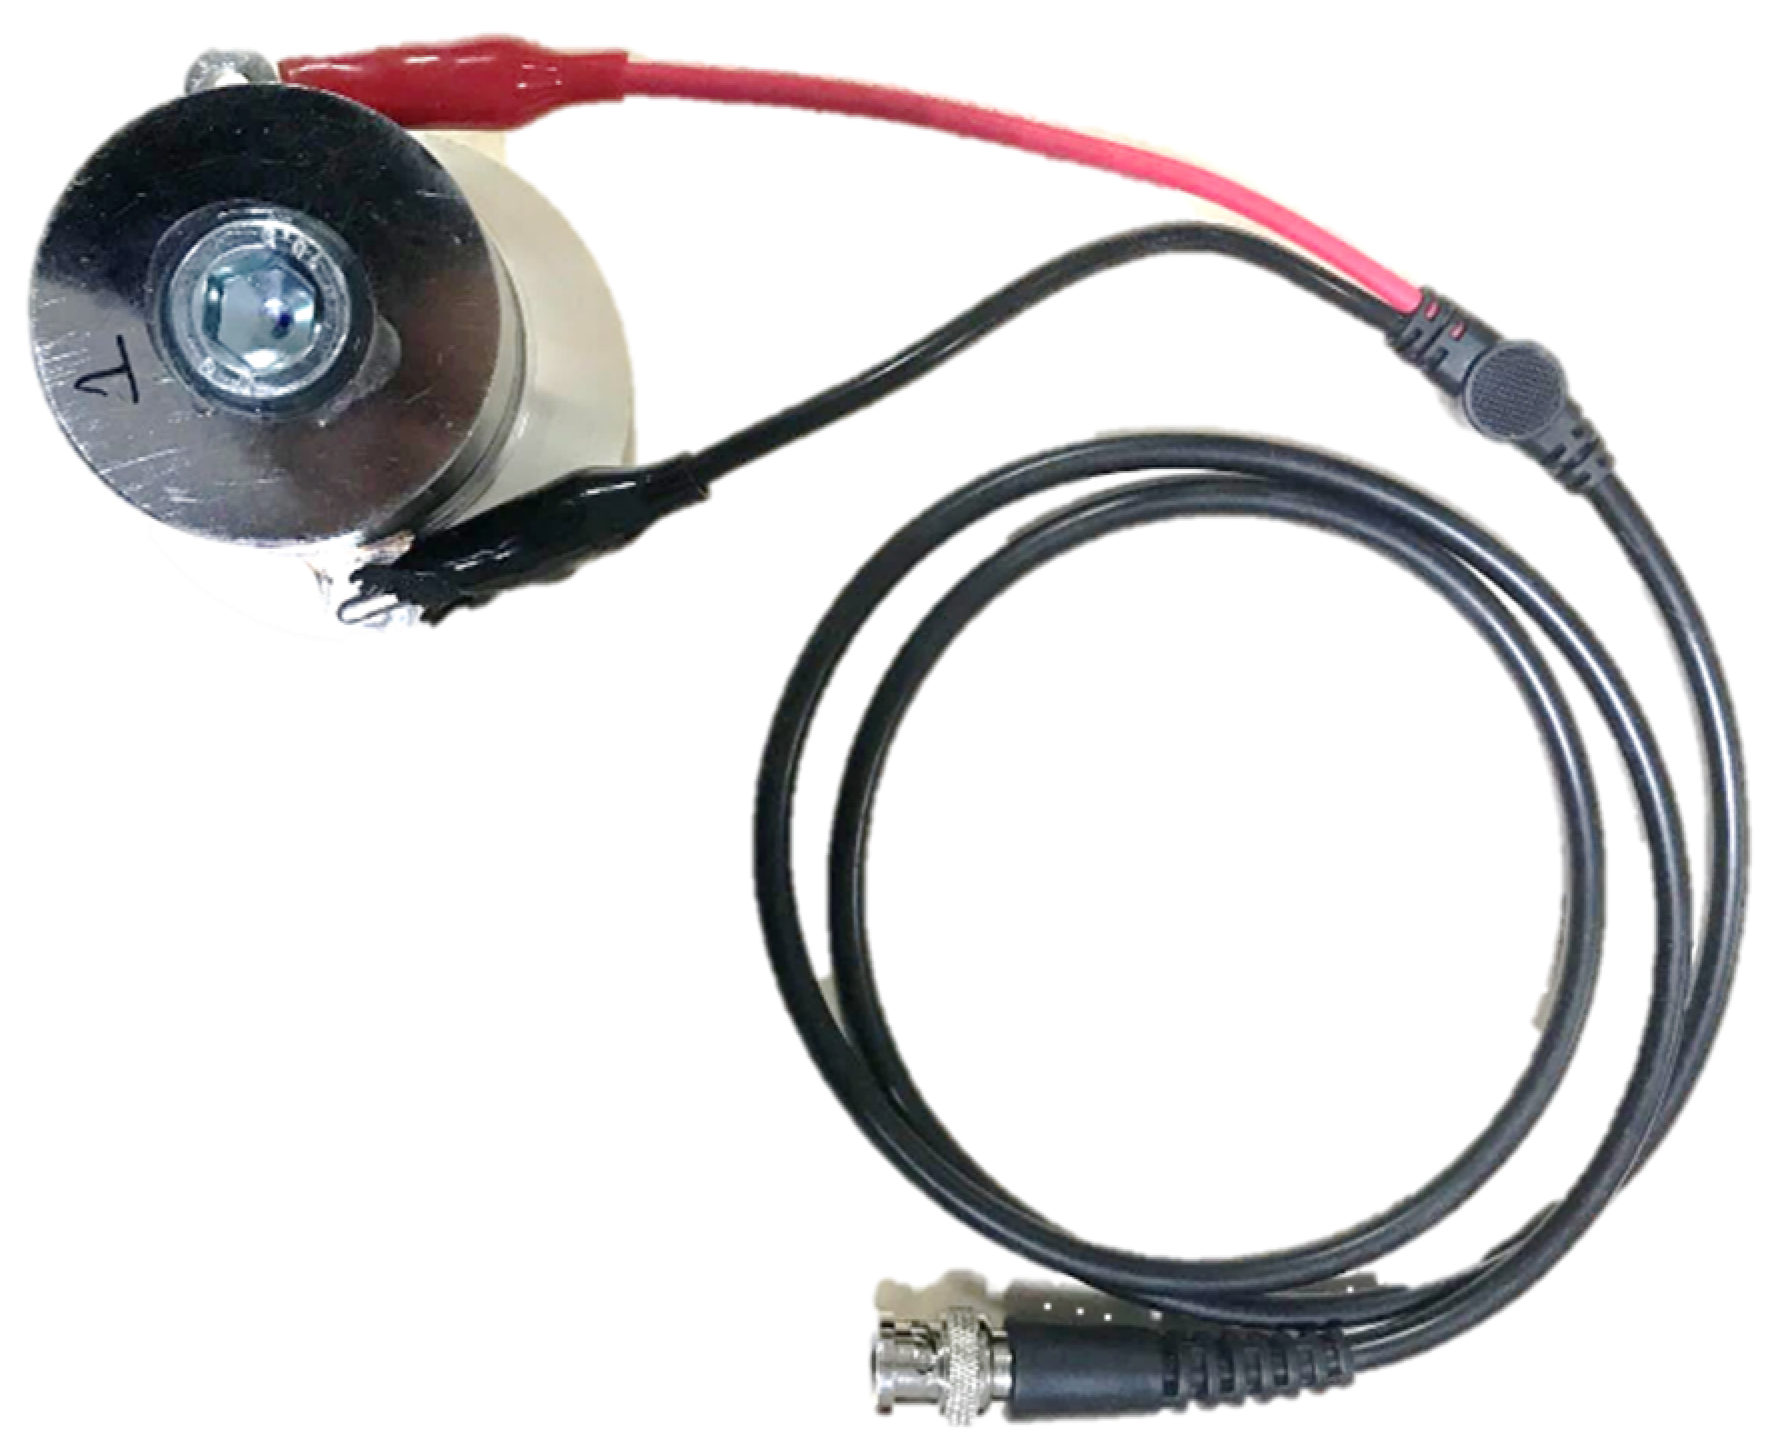
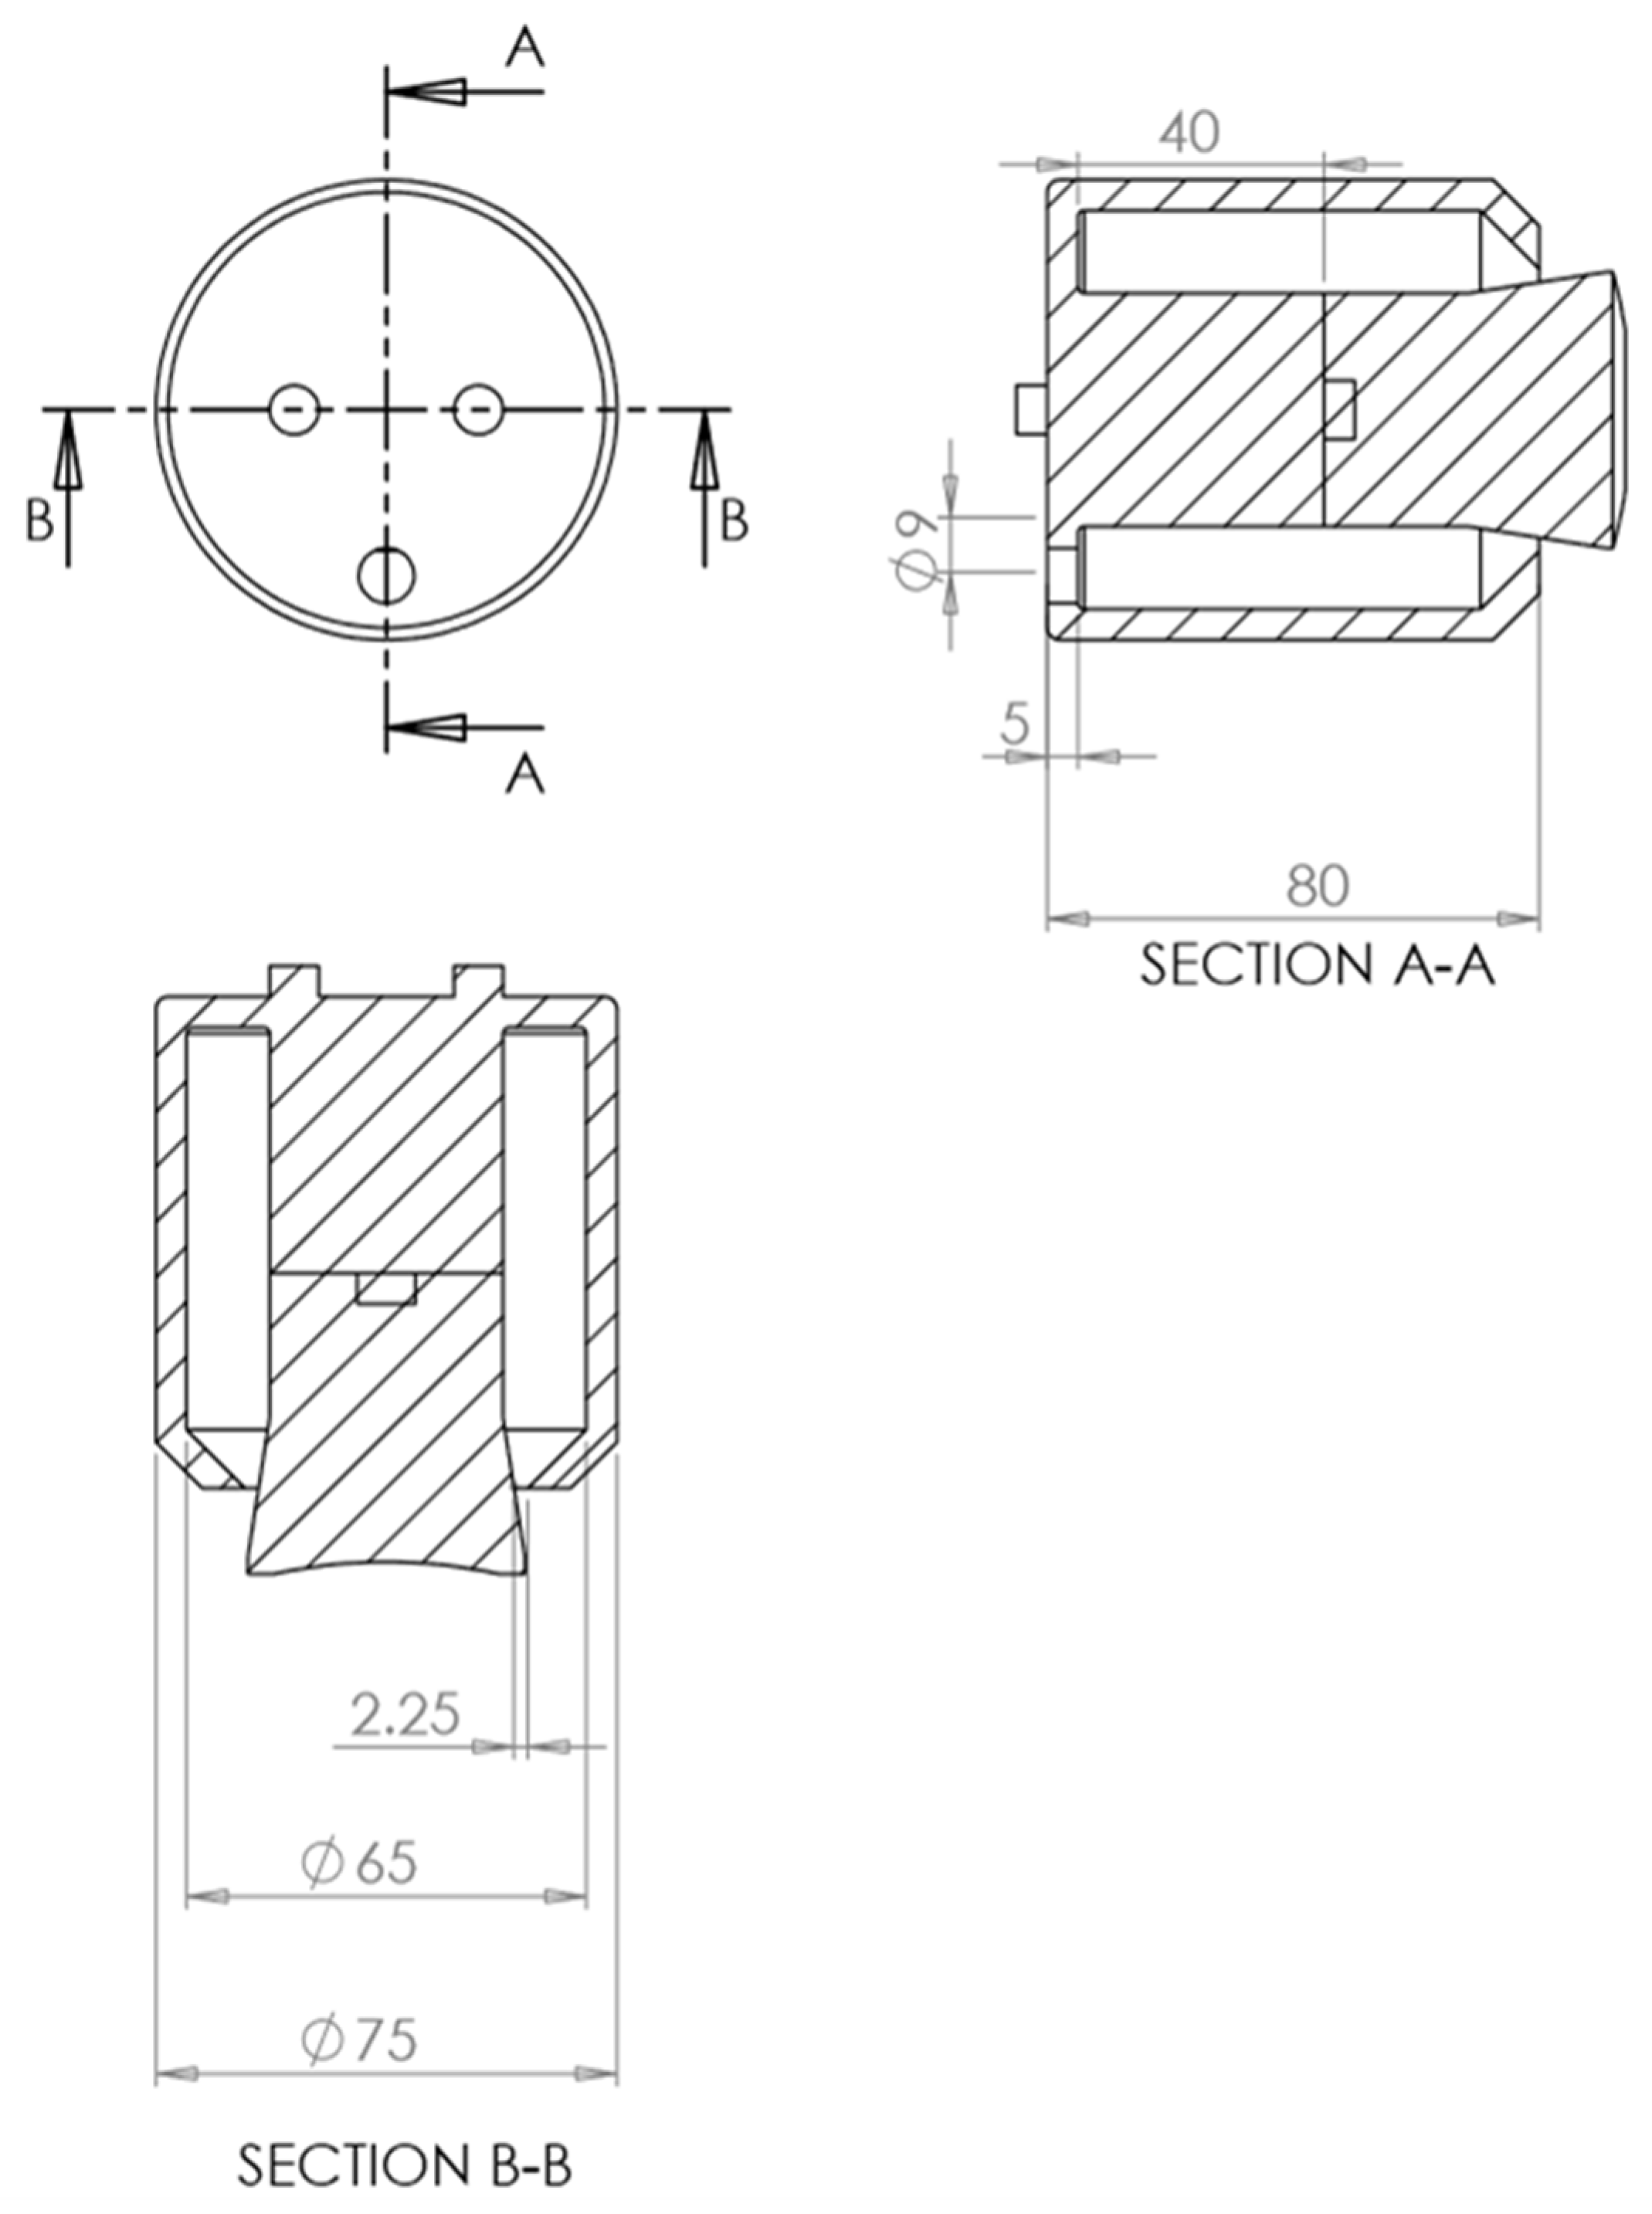
HPUTs are typically bolted onto the outer wall of an ultrasonic bath, resulting in no contact with water, which means that there is no requirement for a marinization technique. The marinization is sub-contracted to STS Defense [17]. This is done by housing the HPUT within a Restriction of Hazardous Substances (RoHS) compliant and Mercury-free Polyurethane 3D printed enclosure (see Table 1 for material properties). This allows a marinized cable to run through the housing, which is then soldered onto the contact plates of the HPUT. Once the cable is attached to the HPUT electrodes (similarly to Figure 1), a RoHS compliant and mercury-free polyurethane potting is injected into the housing, and then filled to the opening of the housing to ensure that the contact plates and Piezoelectric elements are sealed from any water contact. The design of the 3D printed enclosure is shown in Figure 2.
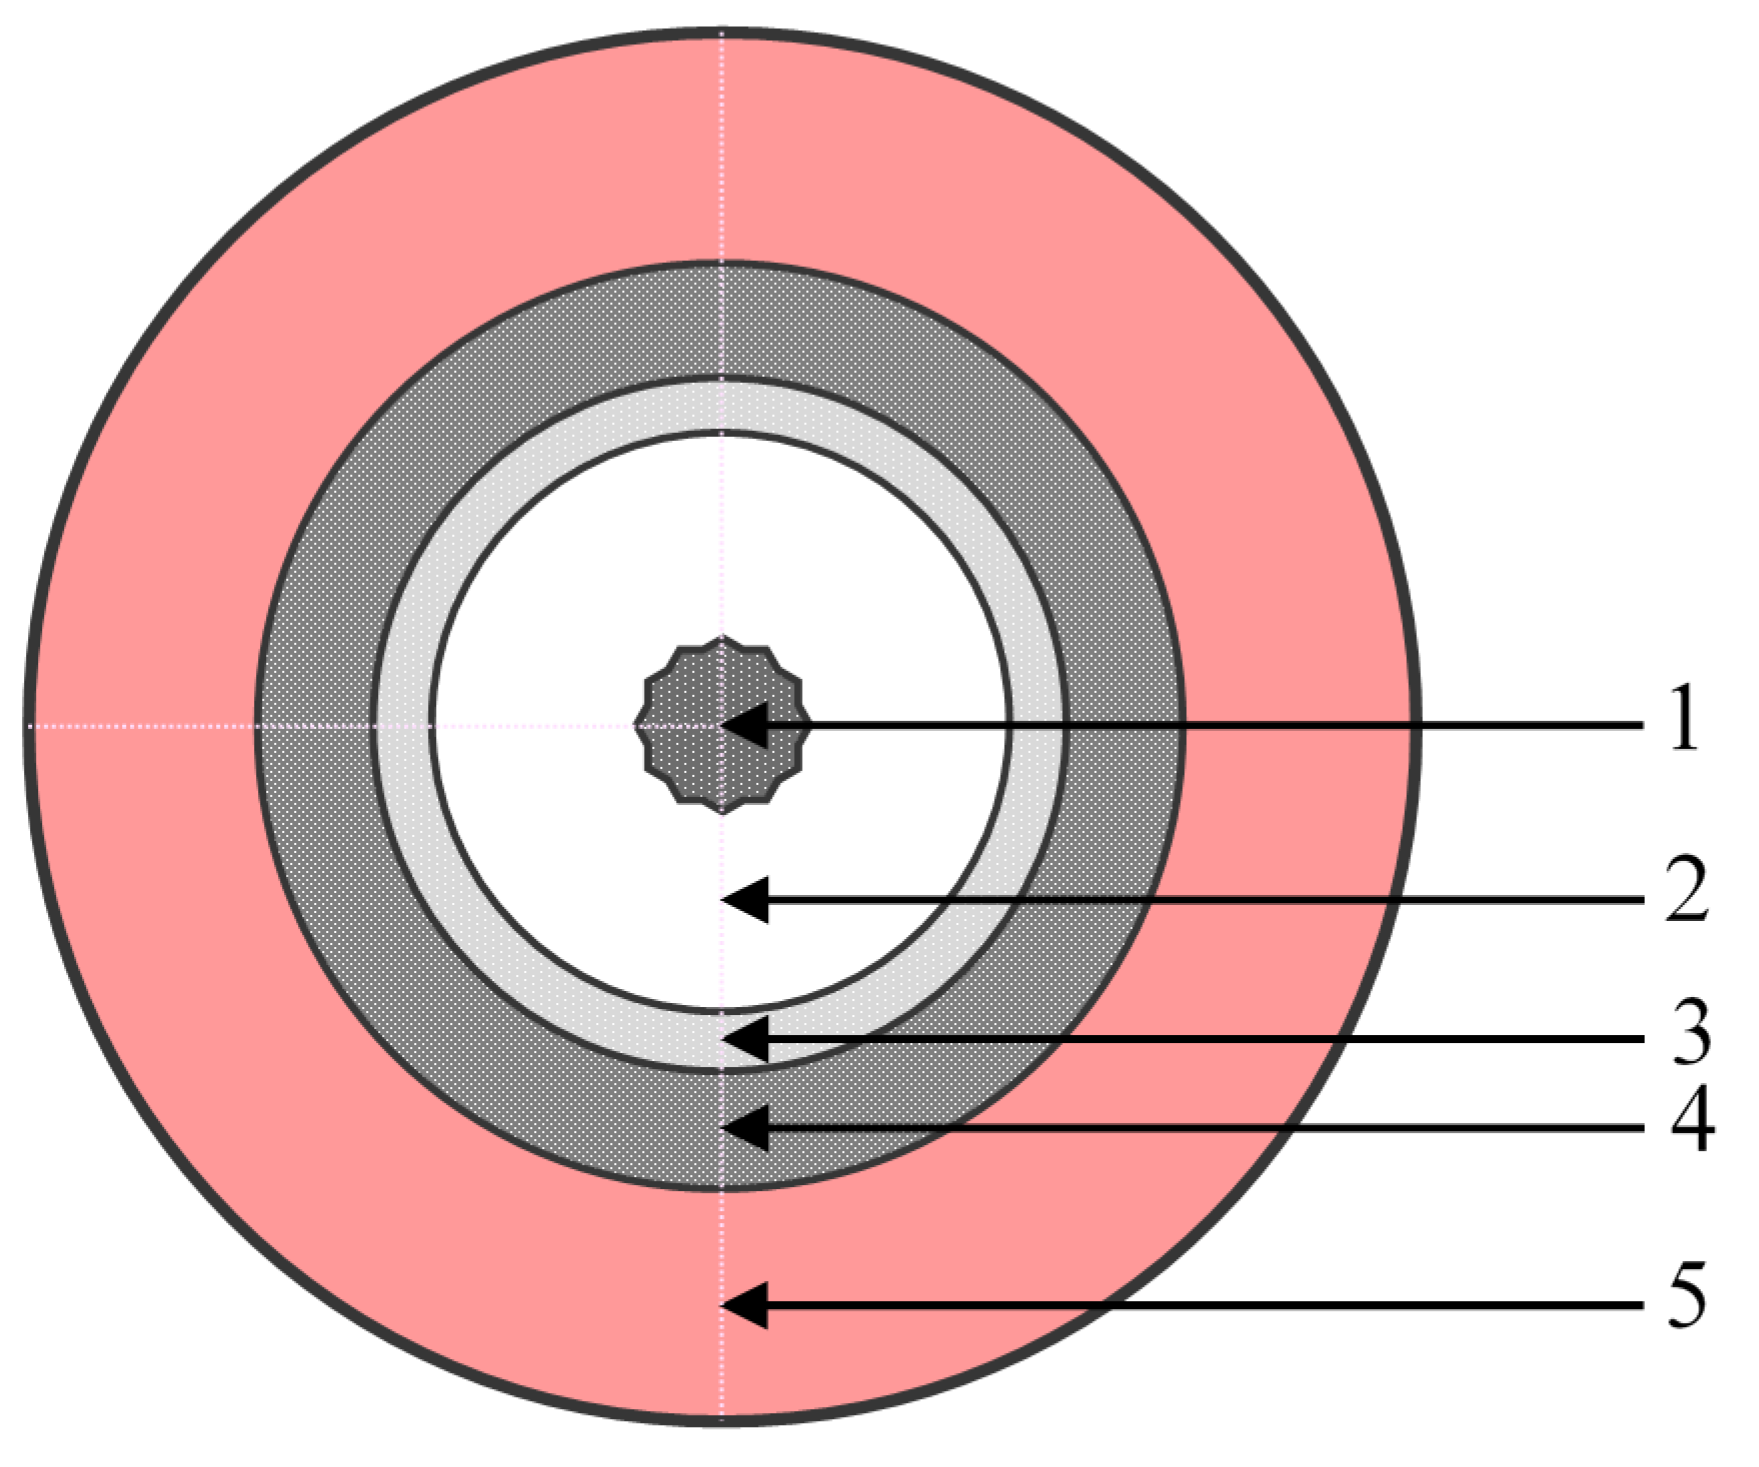
Each HPUT is connected to a flame retardant, halogen-free, 6.4 mm diameter, marinized RG58 cable. A cross-section of the cable along with material descriptions are presented in Figure 3 and Table 2. The confirmed number of HPUTs found [16] undergo marinization with a 10 m long marinized cabling with a BNC connection; a summary of the marinization requirements are shown in Table 3.
HPUT Marinization Characterization
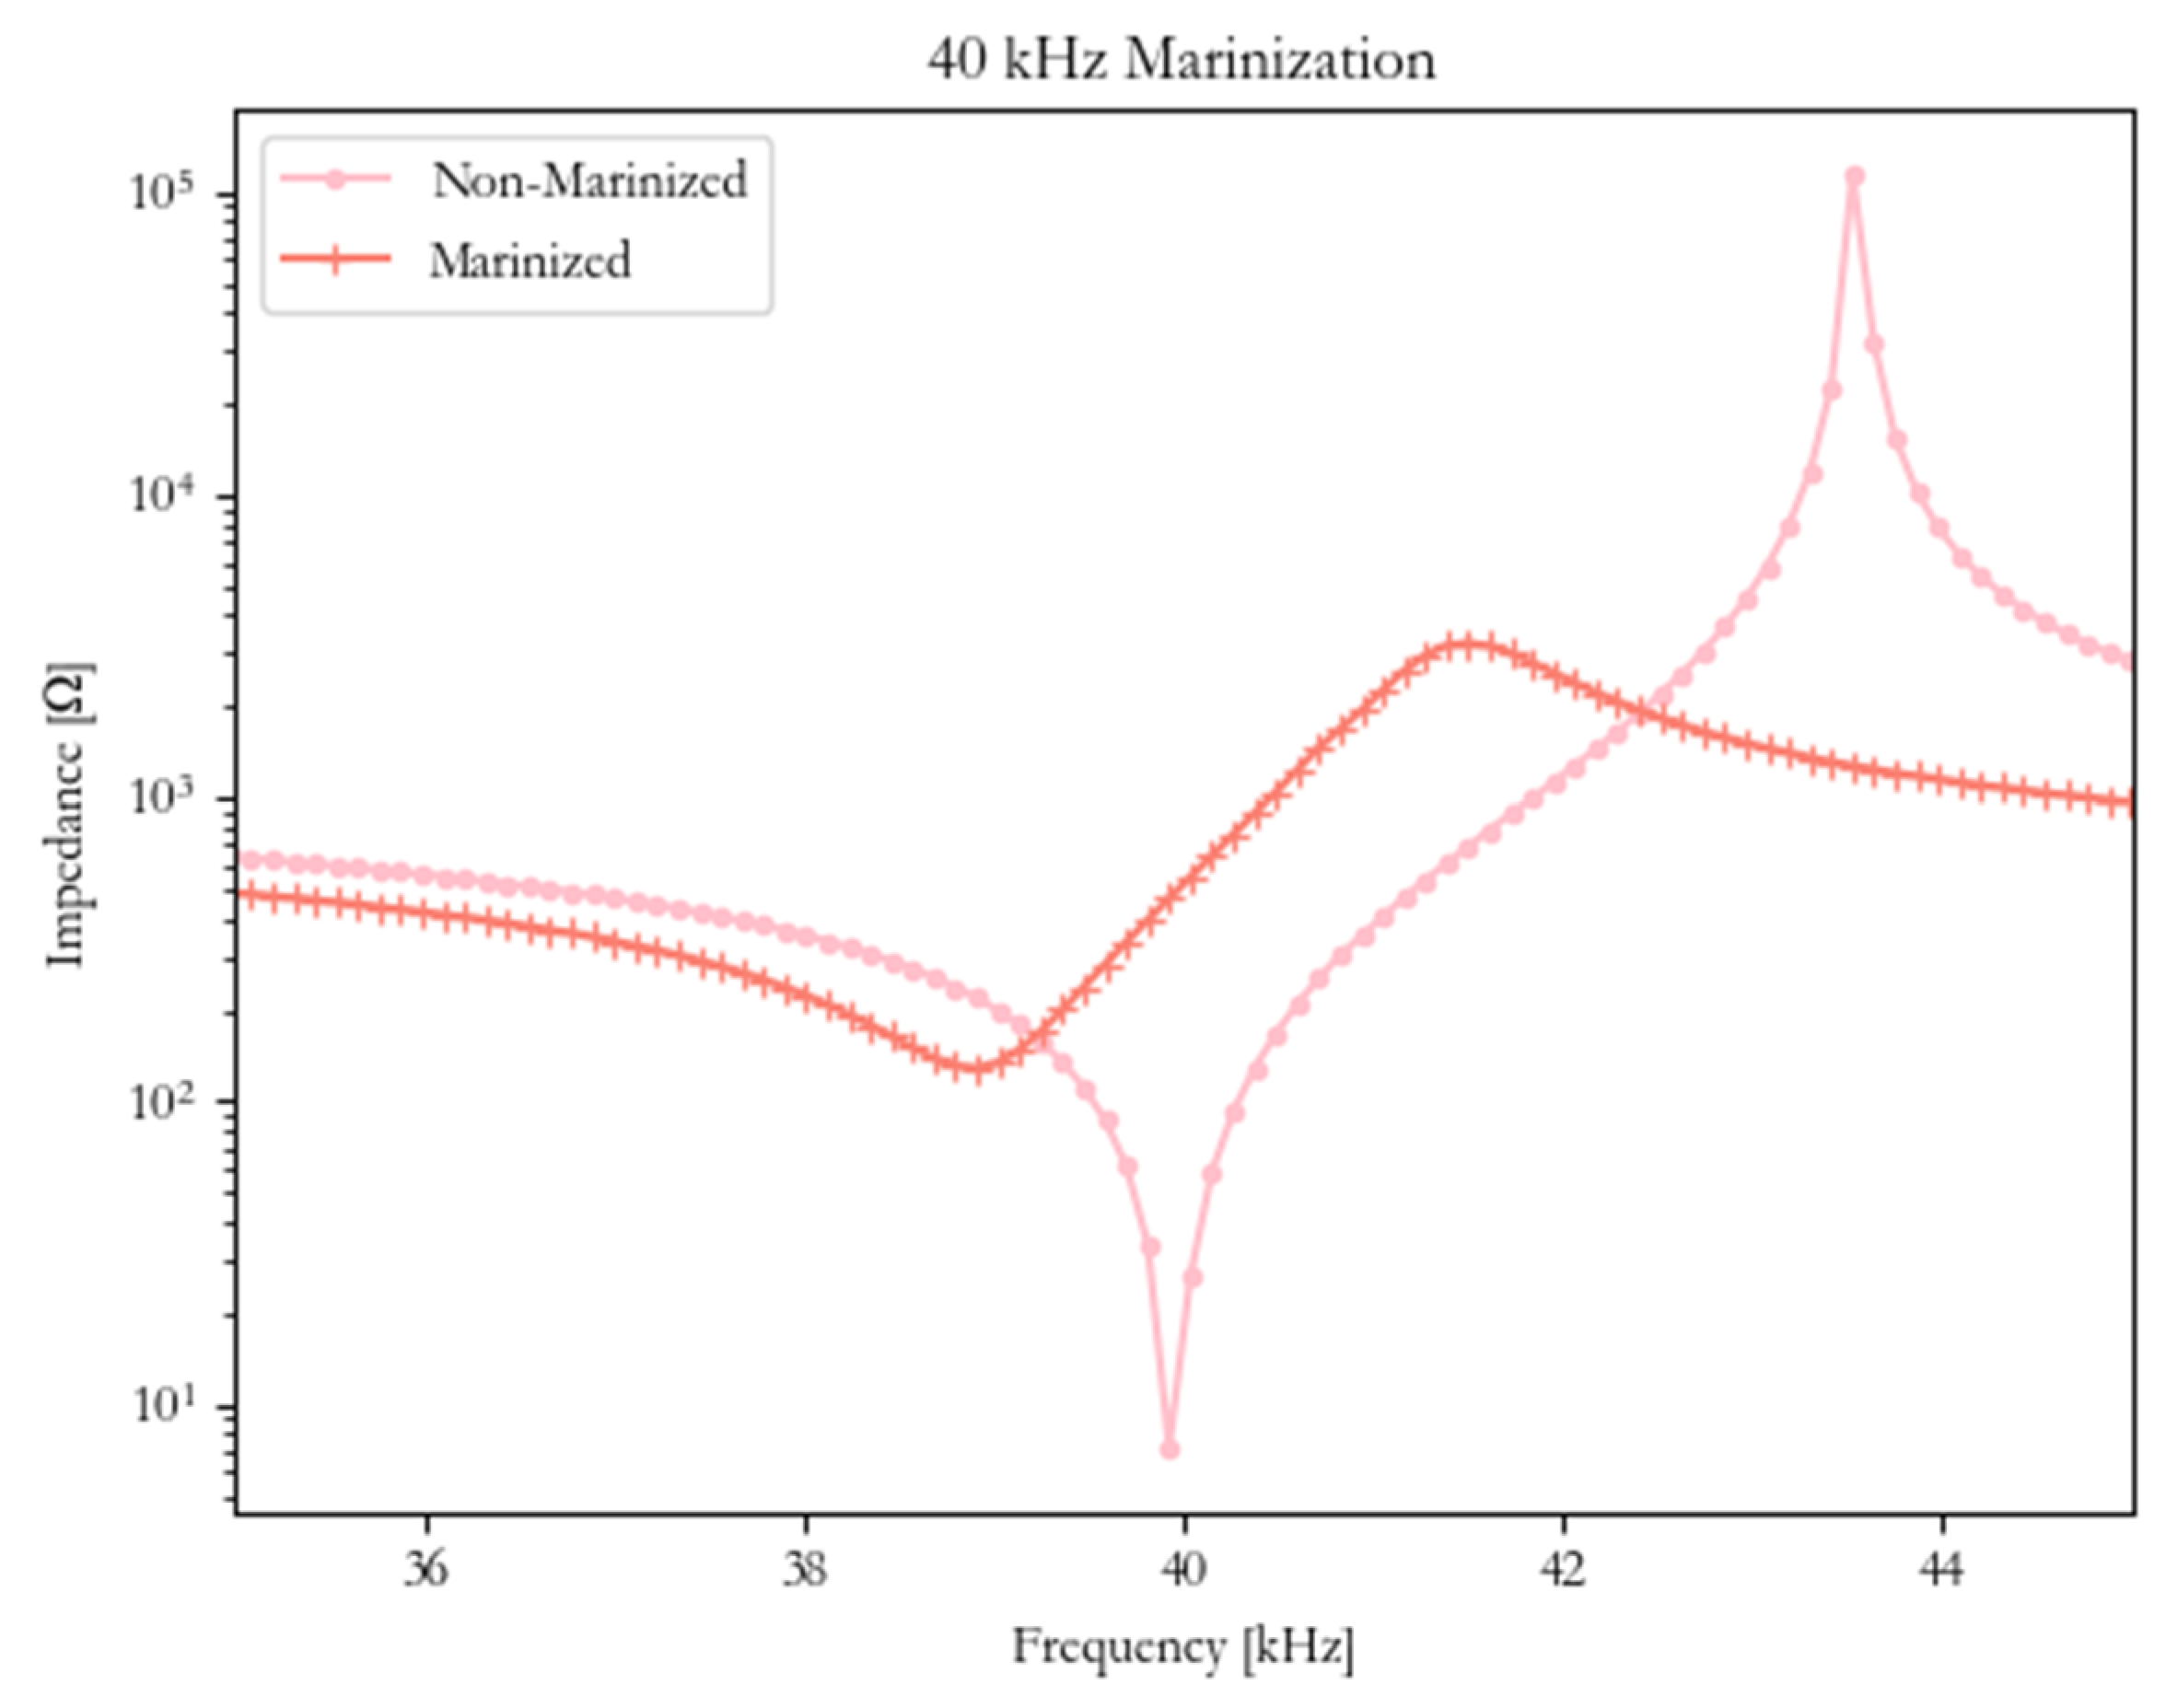
To characterize any changes in power delivery to the HPUTs by the addition of the marinization material, the Agilent 4294A Precision Impedance Analyzer [18] is used to measure the 40 kHz HPUTs before and after marinization. Figure 4 shows that the addition of the marinization material has increased the impedance of the HPUTs resonant frequency which also contributes to a partial shift in the resonant frequency. The anti-resonant frequency has reduced in impedance, implying that the marinization technique is dampening the HPUT components. This causes the HPUT to become more broadband.
3. Laboratory Methodology
Although the impedance characterization has shown potential power loss due to the marinization technique, the HPUTs undergo initial fouling removal trials on a Calcite-fouled 6.2 m long, Schedule 40, 6-inch diameter carbon steel pipe created [11]. The hardware and software developed by the Brunel Innovation Centre [19] are described to drive the 4-HPUT configuration.
3.1. Power Electronics
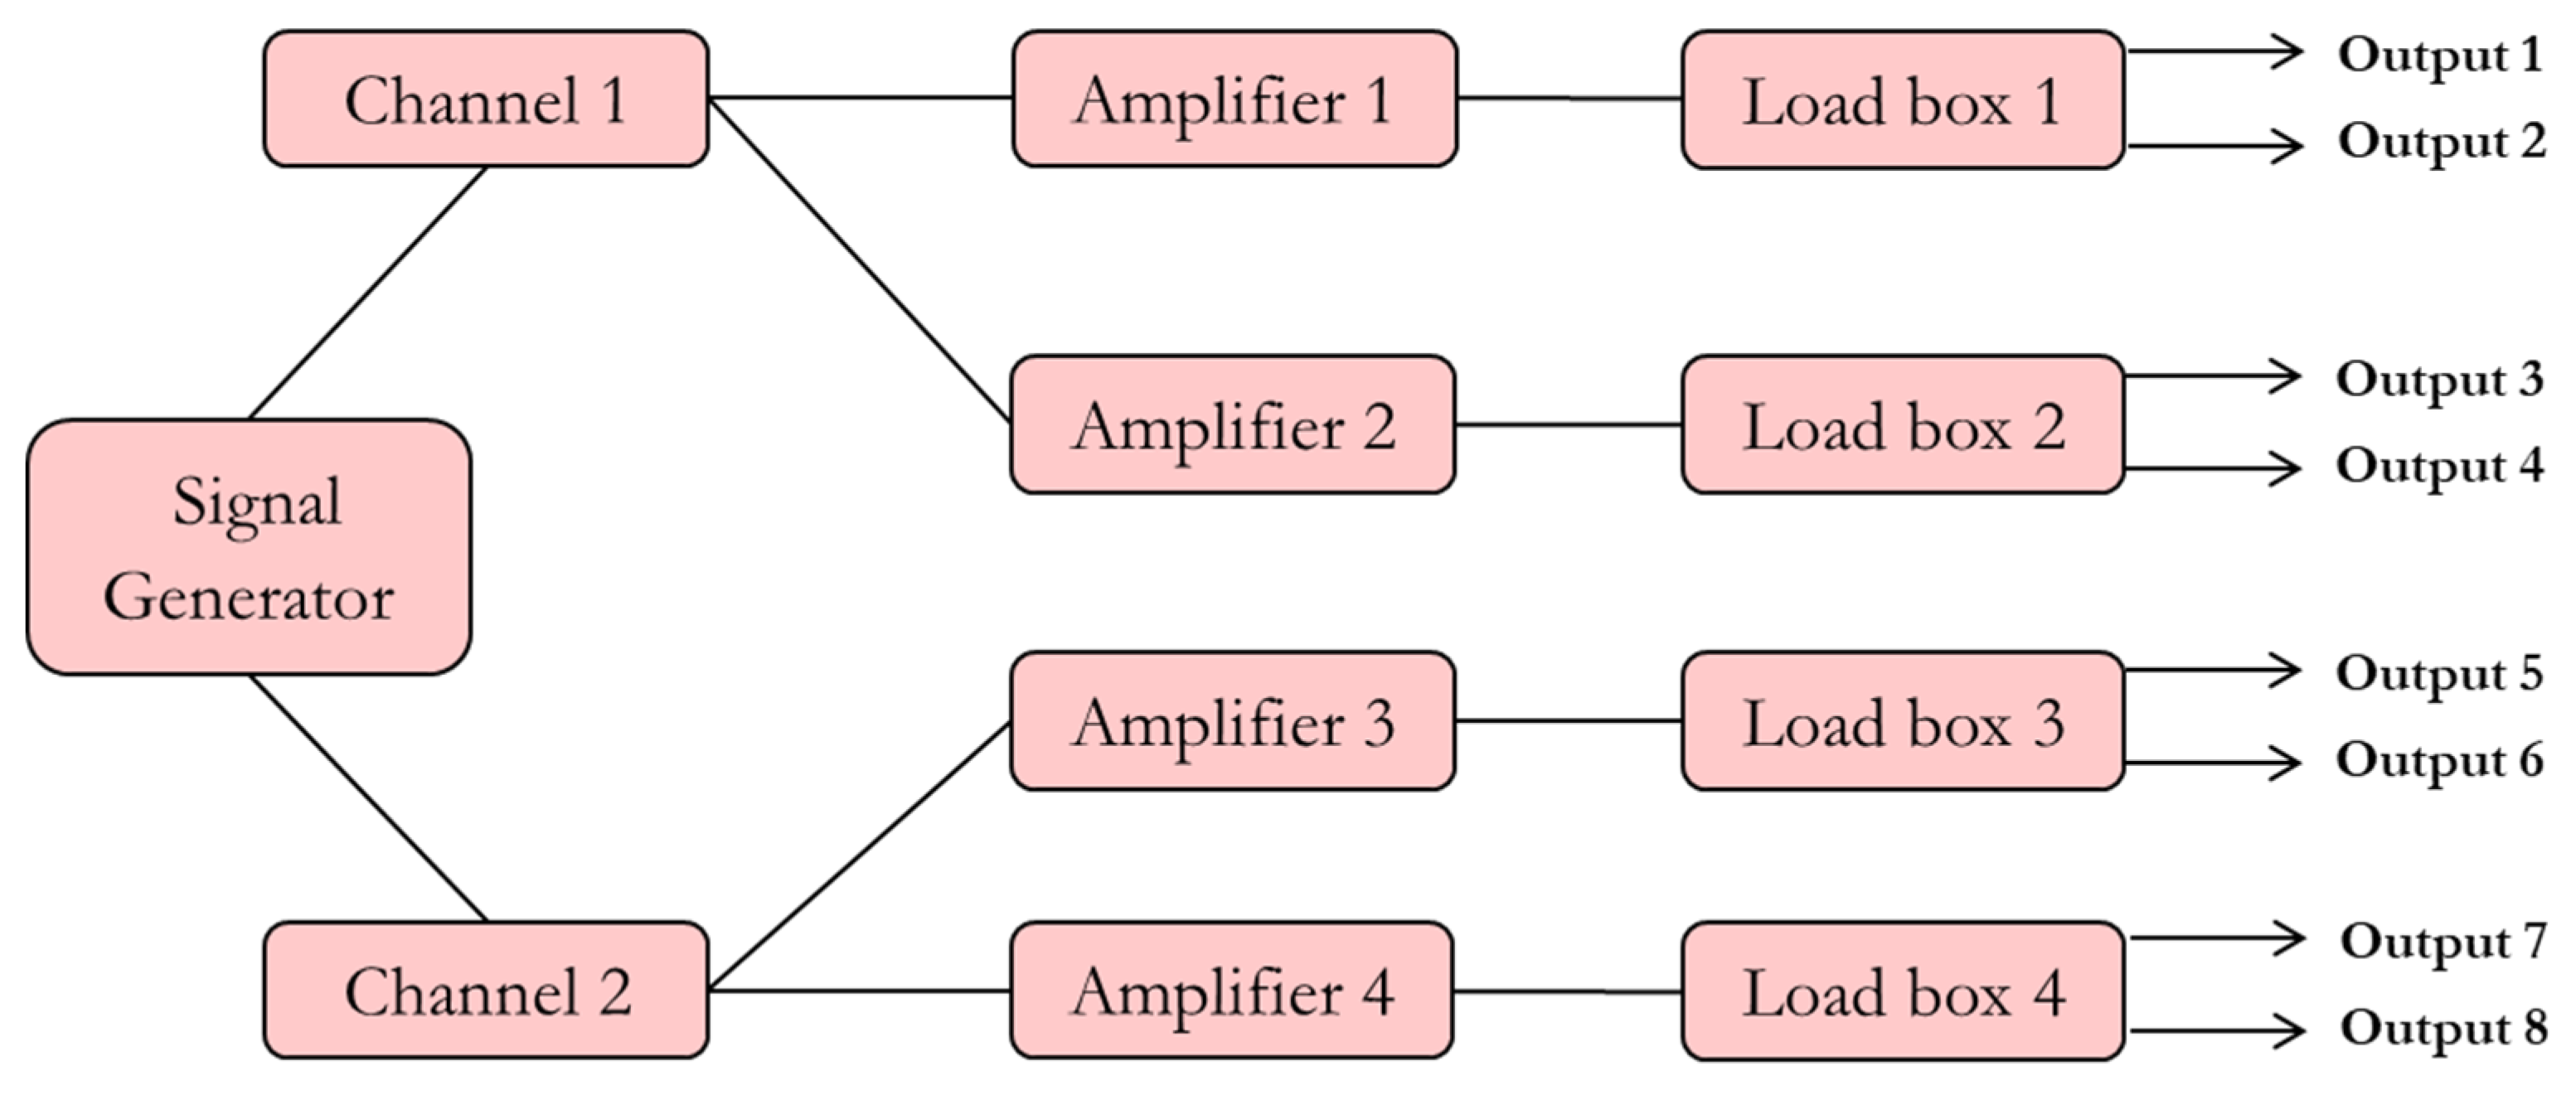
The power amplifier box includes a signal generator that splits into two channels, where each channel is connected to two amplifiers and each amplifier is connected to a load box providing two outputs. Overall, this results in 8 outputs as shown in Figure 5.
Power amplifier specification:
- Power 4 × 100 W Root Mean Square (RMS), High Voltage Amplifier
- Power Supply control 100–300 V, adjustable voltage via dimmer and QT_Sendwave
- Maximum current output 5 A RMS
- Operating Frequency 10–300 kHz
- Load Box with current protection, allowing off-resonance voltages up to 1000 V
- Programmable 2 channel output signal generator
- 2 channel signal generator—two different outputs simultaneously
- Each signal generator drives 2 amplifiers
- 8 continuous-wave output channels (2 per channel 4 per output)
- Single sinusoids and chirp functions
- Arbitrary function generator possible with a software upgrade
- Power monitoring functions
- Power supply monitoring functions
- Logging, auto restart, and parameter persistence functions
- Raspberry pi with a touch screen interface
- 2 USB ports
- Fan cooled
- Isolated transformer
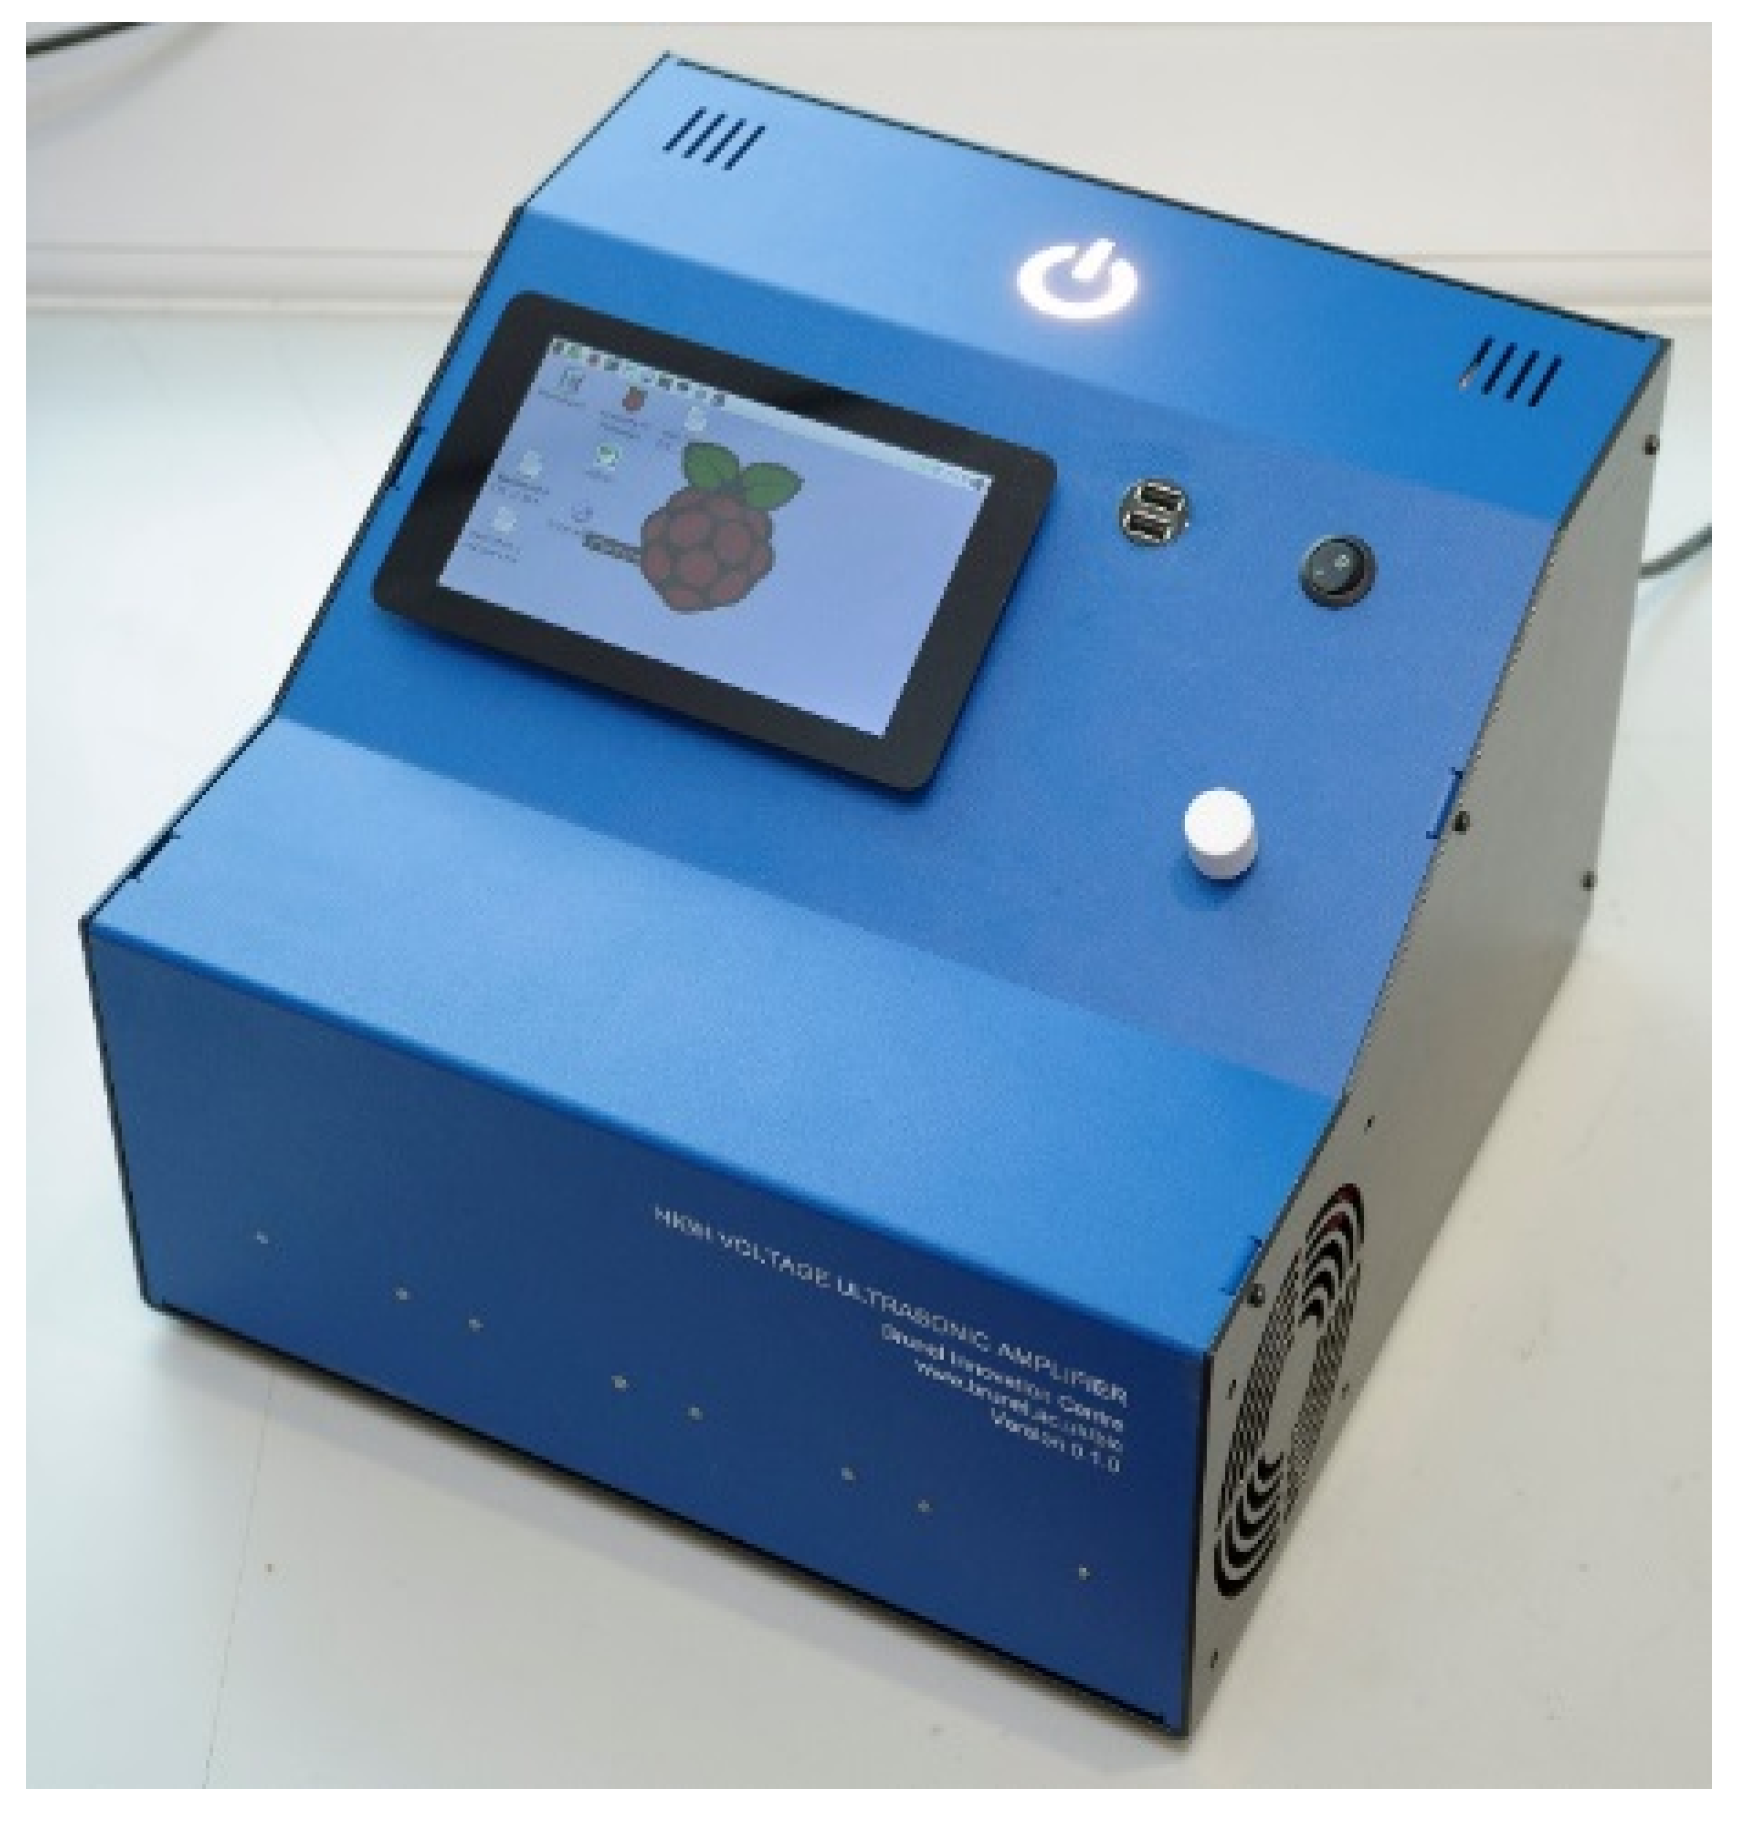
Table 4 displays the final system features and shows that each channel is driven by a signal generator that can be controlled by the user using the Raspberry Pi touchscreen interface, allowing the user to change the signal wave, frequency, power, and sampling. The final hardware is developed and shown in Figure 6.
3.2. Power Ultrasonic Software
The software requirements to control the wave parameters to input into driving the HPUTs are listed in Table 5.
3.2.1. Software Architecture
High-voltage and high-frequency operation achieved via dedicated high-power OP (PA90) and current boosting power Metal Oxide Semiconductor Field-Effect Transistors (MOSFETs)
- Maximum operating voltage 300 V and up to 5 AMPS
- Operation safety controlled by Load Box and power supply variation using Dimmer
- High Voltage supply used directly from mains supply and the use of isolation transformer to avoid shock hazards when operating the unit
- Load Box also used to match impedance of cleaning HPUTs
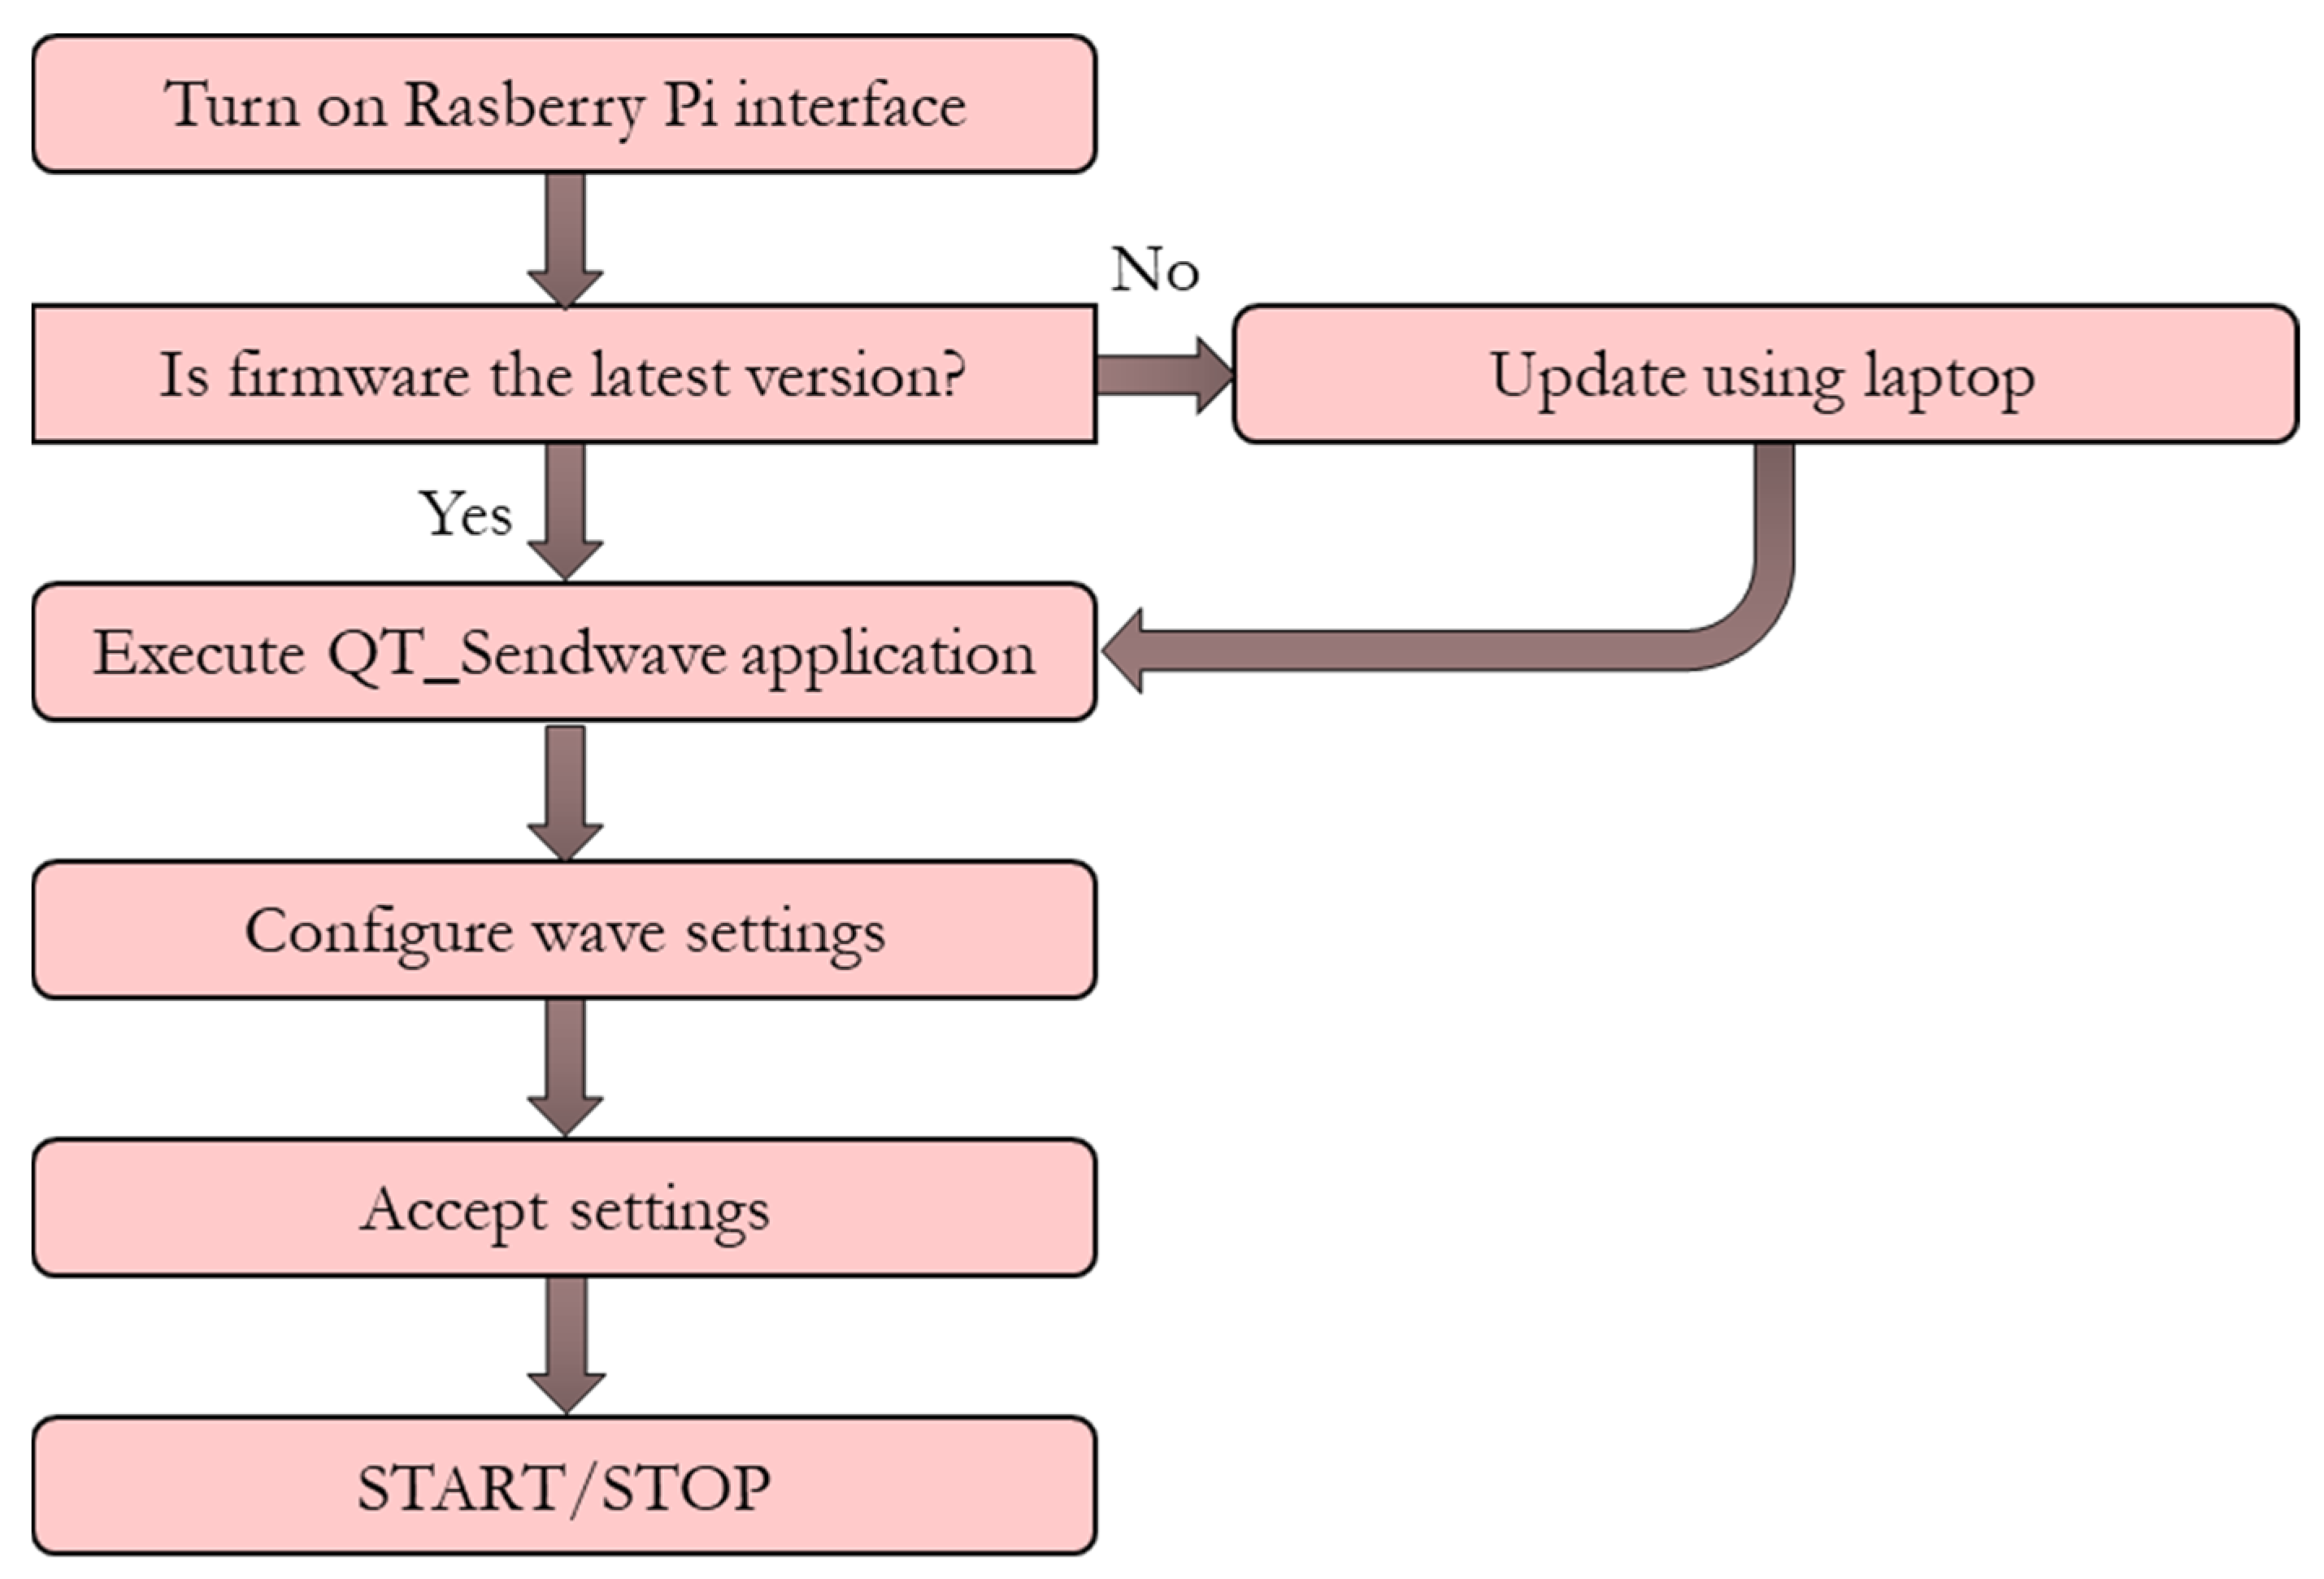
The software is operated via a touch screen display by following the steps shown in Figure 7.
3.2.2. Functionality
- Signal generator and power monitor:
- Centered on STM32F407 chip using evaluation board providing a very cost-effective solution for the supported functions needed in this design
- Single board can handle 2 channels working simultaneously
- Board has 2 Digital-to-Analogue Converters (DAC) which can be programmed by software to generate arbitrary function
- System is designed for cleaning, so signals generated are sinusoidal and chirp signals
- 6 Analogue-to-Digital Converters (ADC) channels used for sequential monitoring functions
- Maximum operation signal generated is 100 kHz, limited by internal analog circuitry, but extended to 300 kHz by add on circuitry
- Boards operate dedicated custom firmware (BIC IP) that enables DAC and ADC programming functions together with communications with control software via USB
3.2.3. Control Computer
- Centered on Raspberry Pi 3 and 7-inch touch screen monitor
- Runs Raspbian Linux operation system with full graphical user interface (GUI)
- Dedicated application for controlling signal generation, monitoring, logging, and persistence functions
- 2 Port USB interface available on the box for I/O operation
- Wi-Fi support for internet and/or remote access
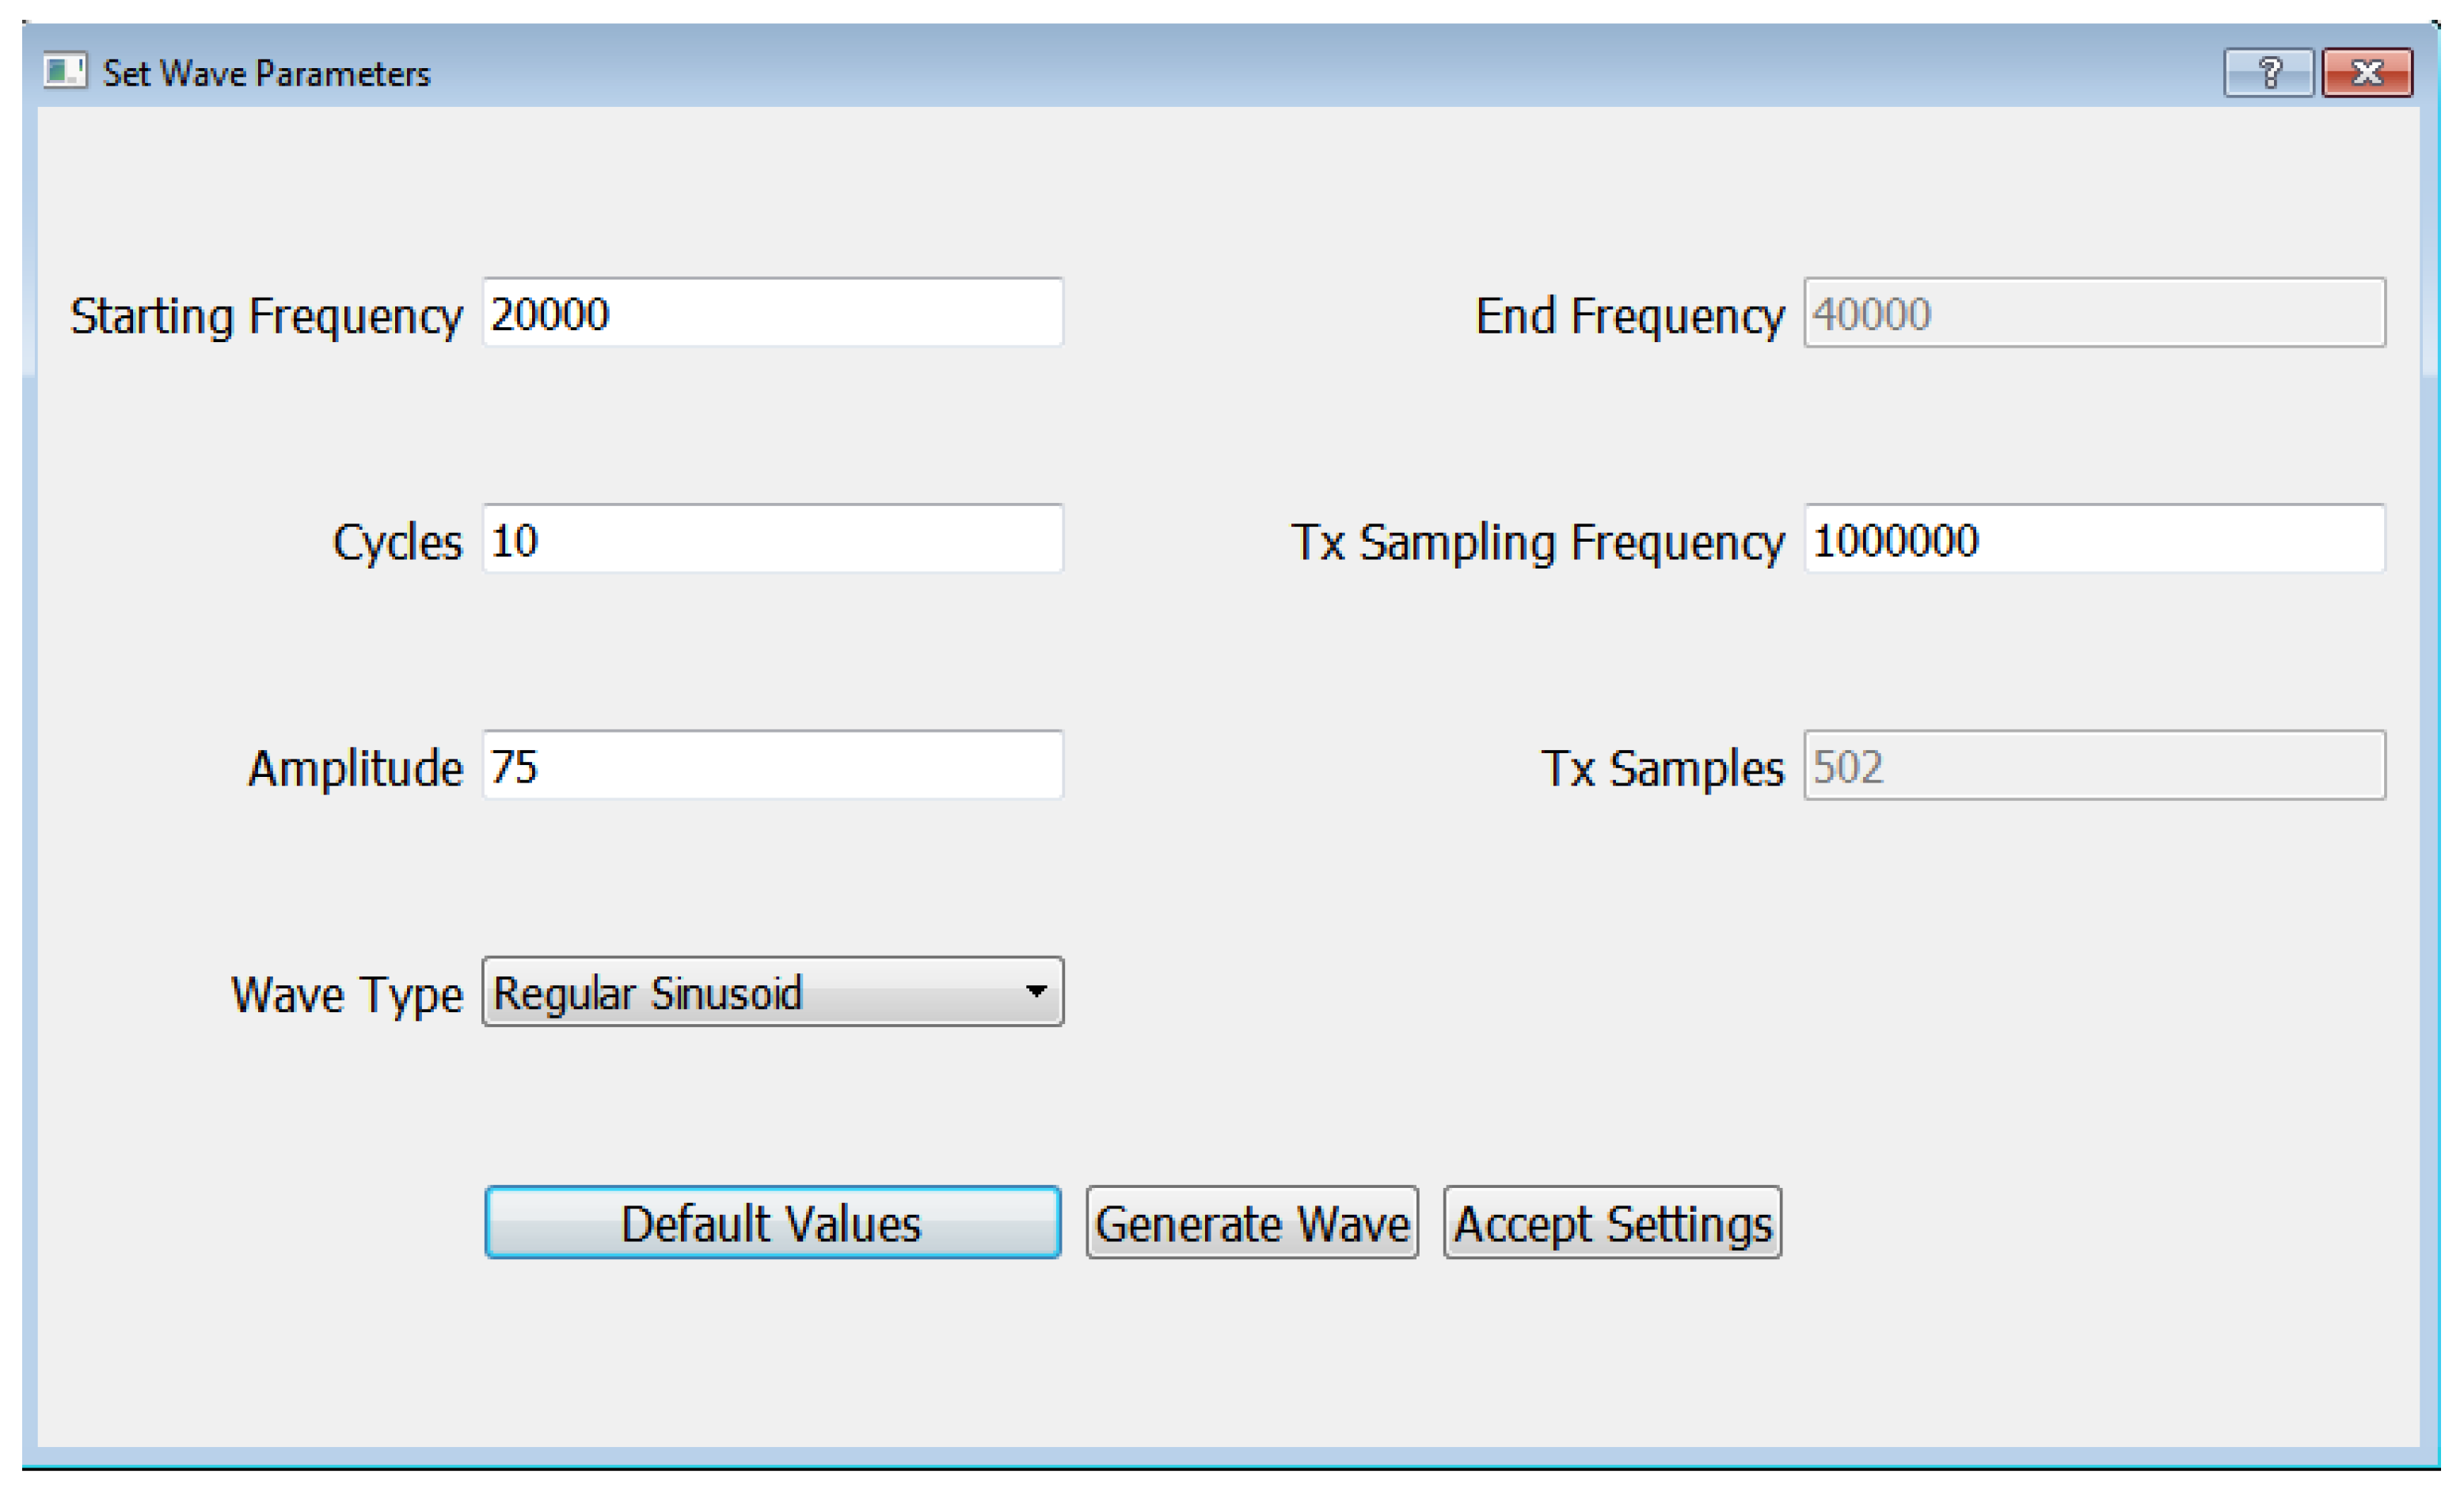
The GUI allows to set the channel and waveform configurations. Figure 8 shows the screen for channel settings.
3.3. HPUT Collar
The attachment and detachment of the HPUTs from a structure is crucial for ease of use for future commercial applications. For commercial use, a universal and user-friendly method to allow the HPUT configuration to be placed evenly across the circumference of a pipe with sufficient pressure (between 5 and 10 Bar) was designed and manufactured by InnoTecUK [20] and shown in Figure 9.
An initial HPUT collar was trialed using the marinized HPUT configuration. The pipe is filled with water and the HPUT collar is attached at the mid-length of the pipe. The high-power amplifier is used to drive the HPUT configuration using a continuous 40 kHz sinusoidal waveform. The results show that the liquid within the pipe has discolored after a cycle of cleaning, due to the detachment of fouling from the inner wall.
The transducers are investigated with the initial HPUT prototype collar. The initial trials have shown that when exciting the transducer configuration at its resonance frequency, the fluid within the pipe darkens and more solids can be seen, which can be due to the dislodging of fouling from the inner wall of the pipe, as shown in Figure 10.
4. Transducer Array Validation
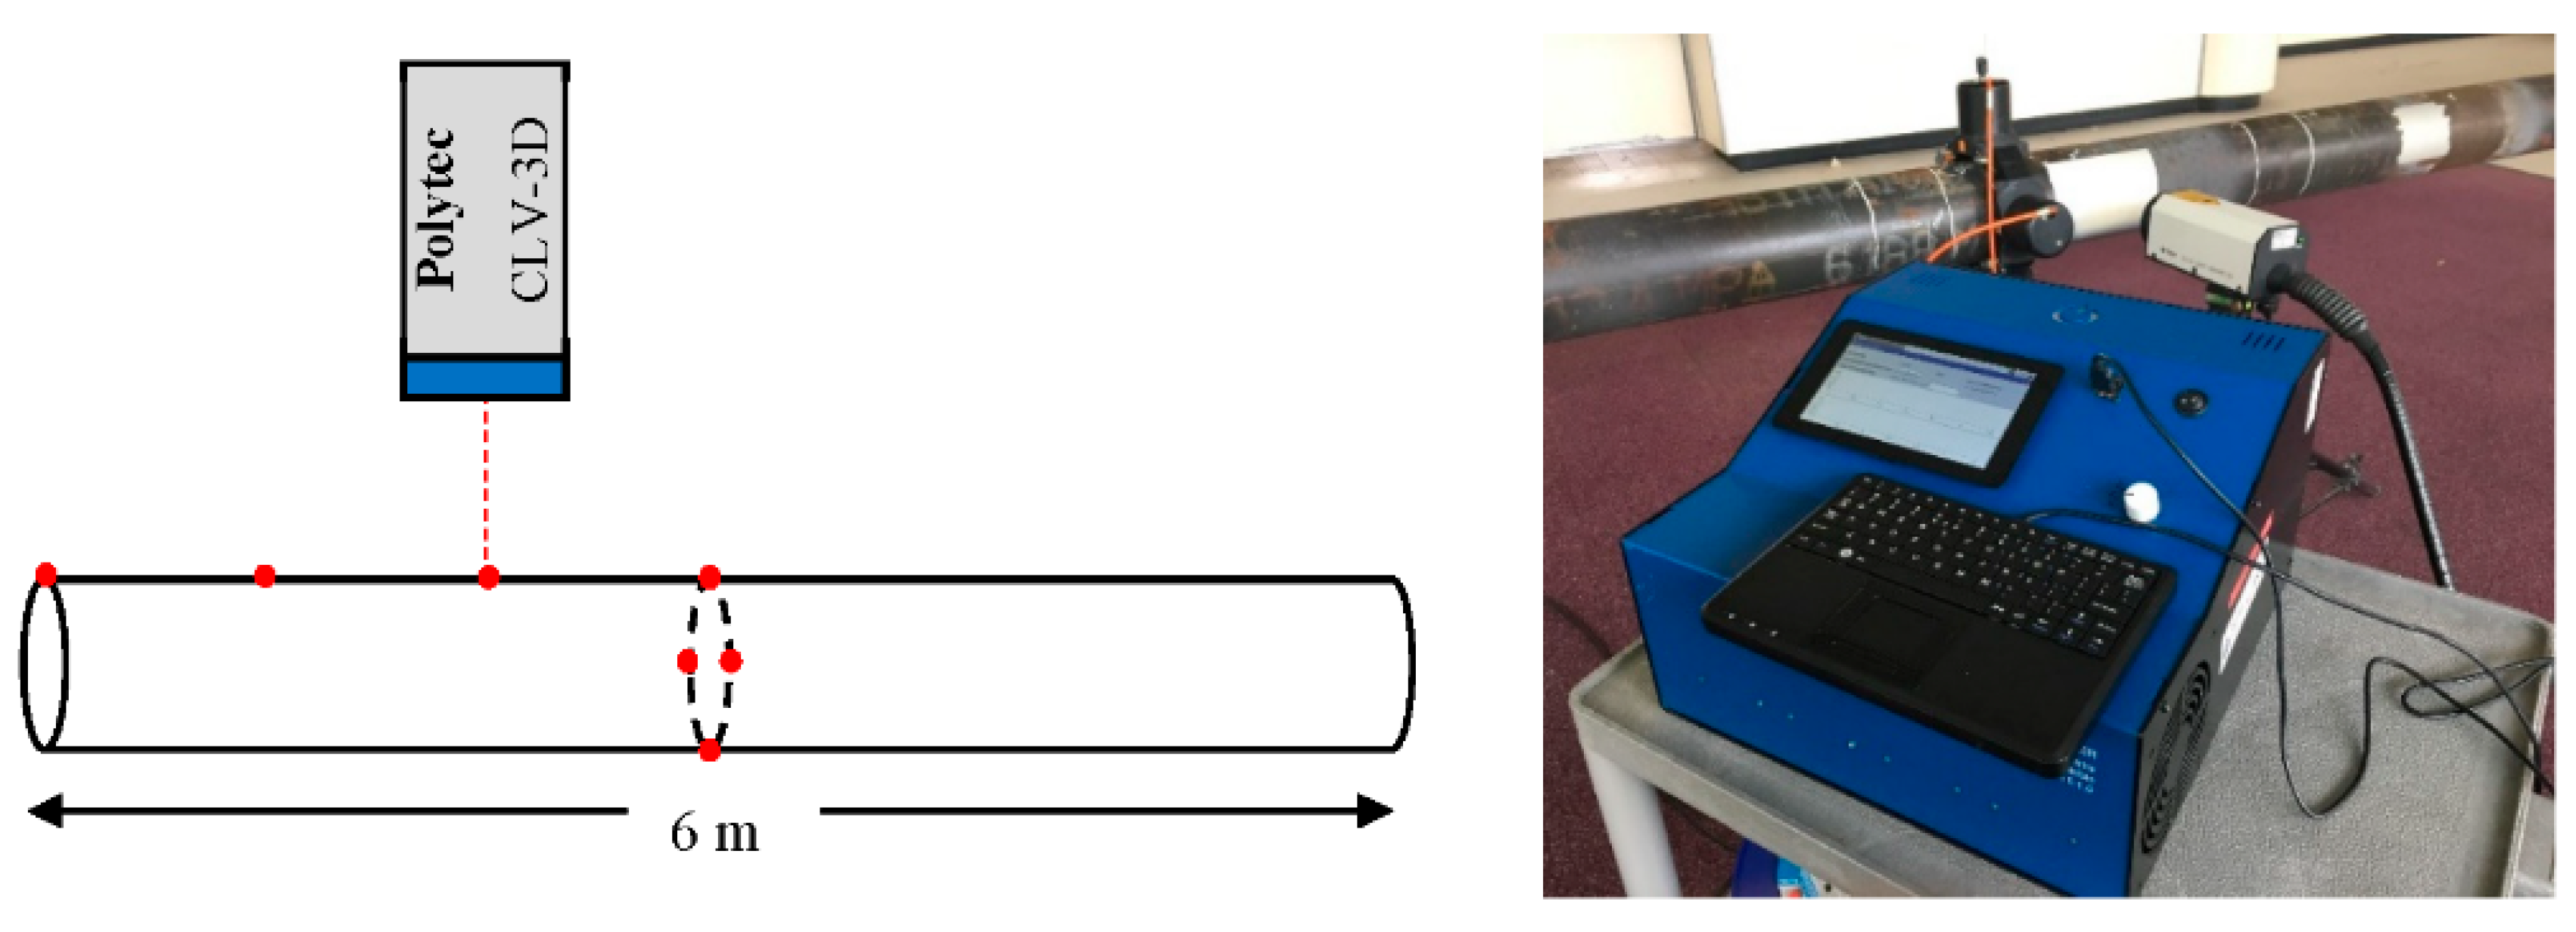
The final HPUT collar was designed and manufactured (Figure 11) and then used to further analyze the HPUTs to compare the HPUT array, marinization effects, and maximum out-of-plane displacement across the monitored points. This is carried out by using the Polytec CLV-3D Laser Vibrometer [21] to scan point data along the length of the pipe as shown in Figure 12. Similar to the work carried out [16], the HPUTs are excited in 1, 2, and 4 HPUT configurations to compare these findings with the trends shown from the Finite Element (FE) model.
Results
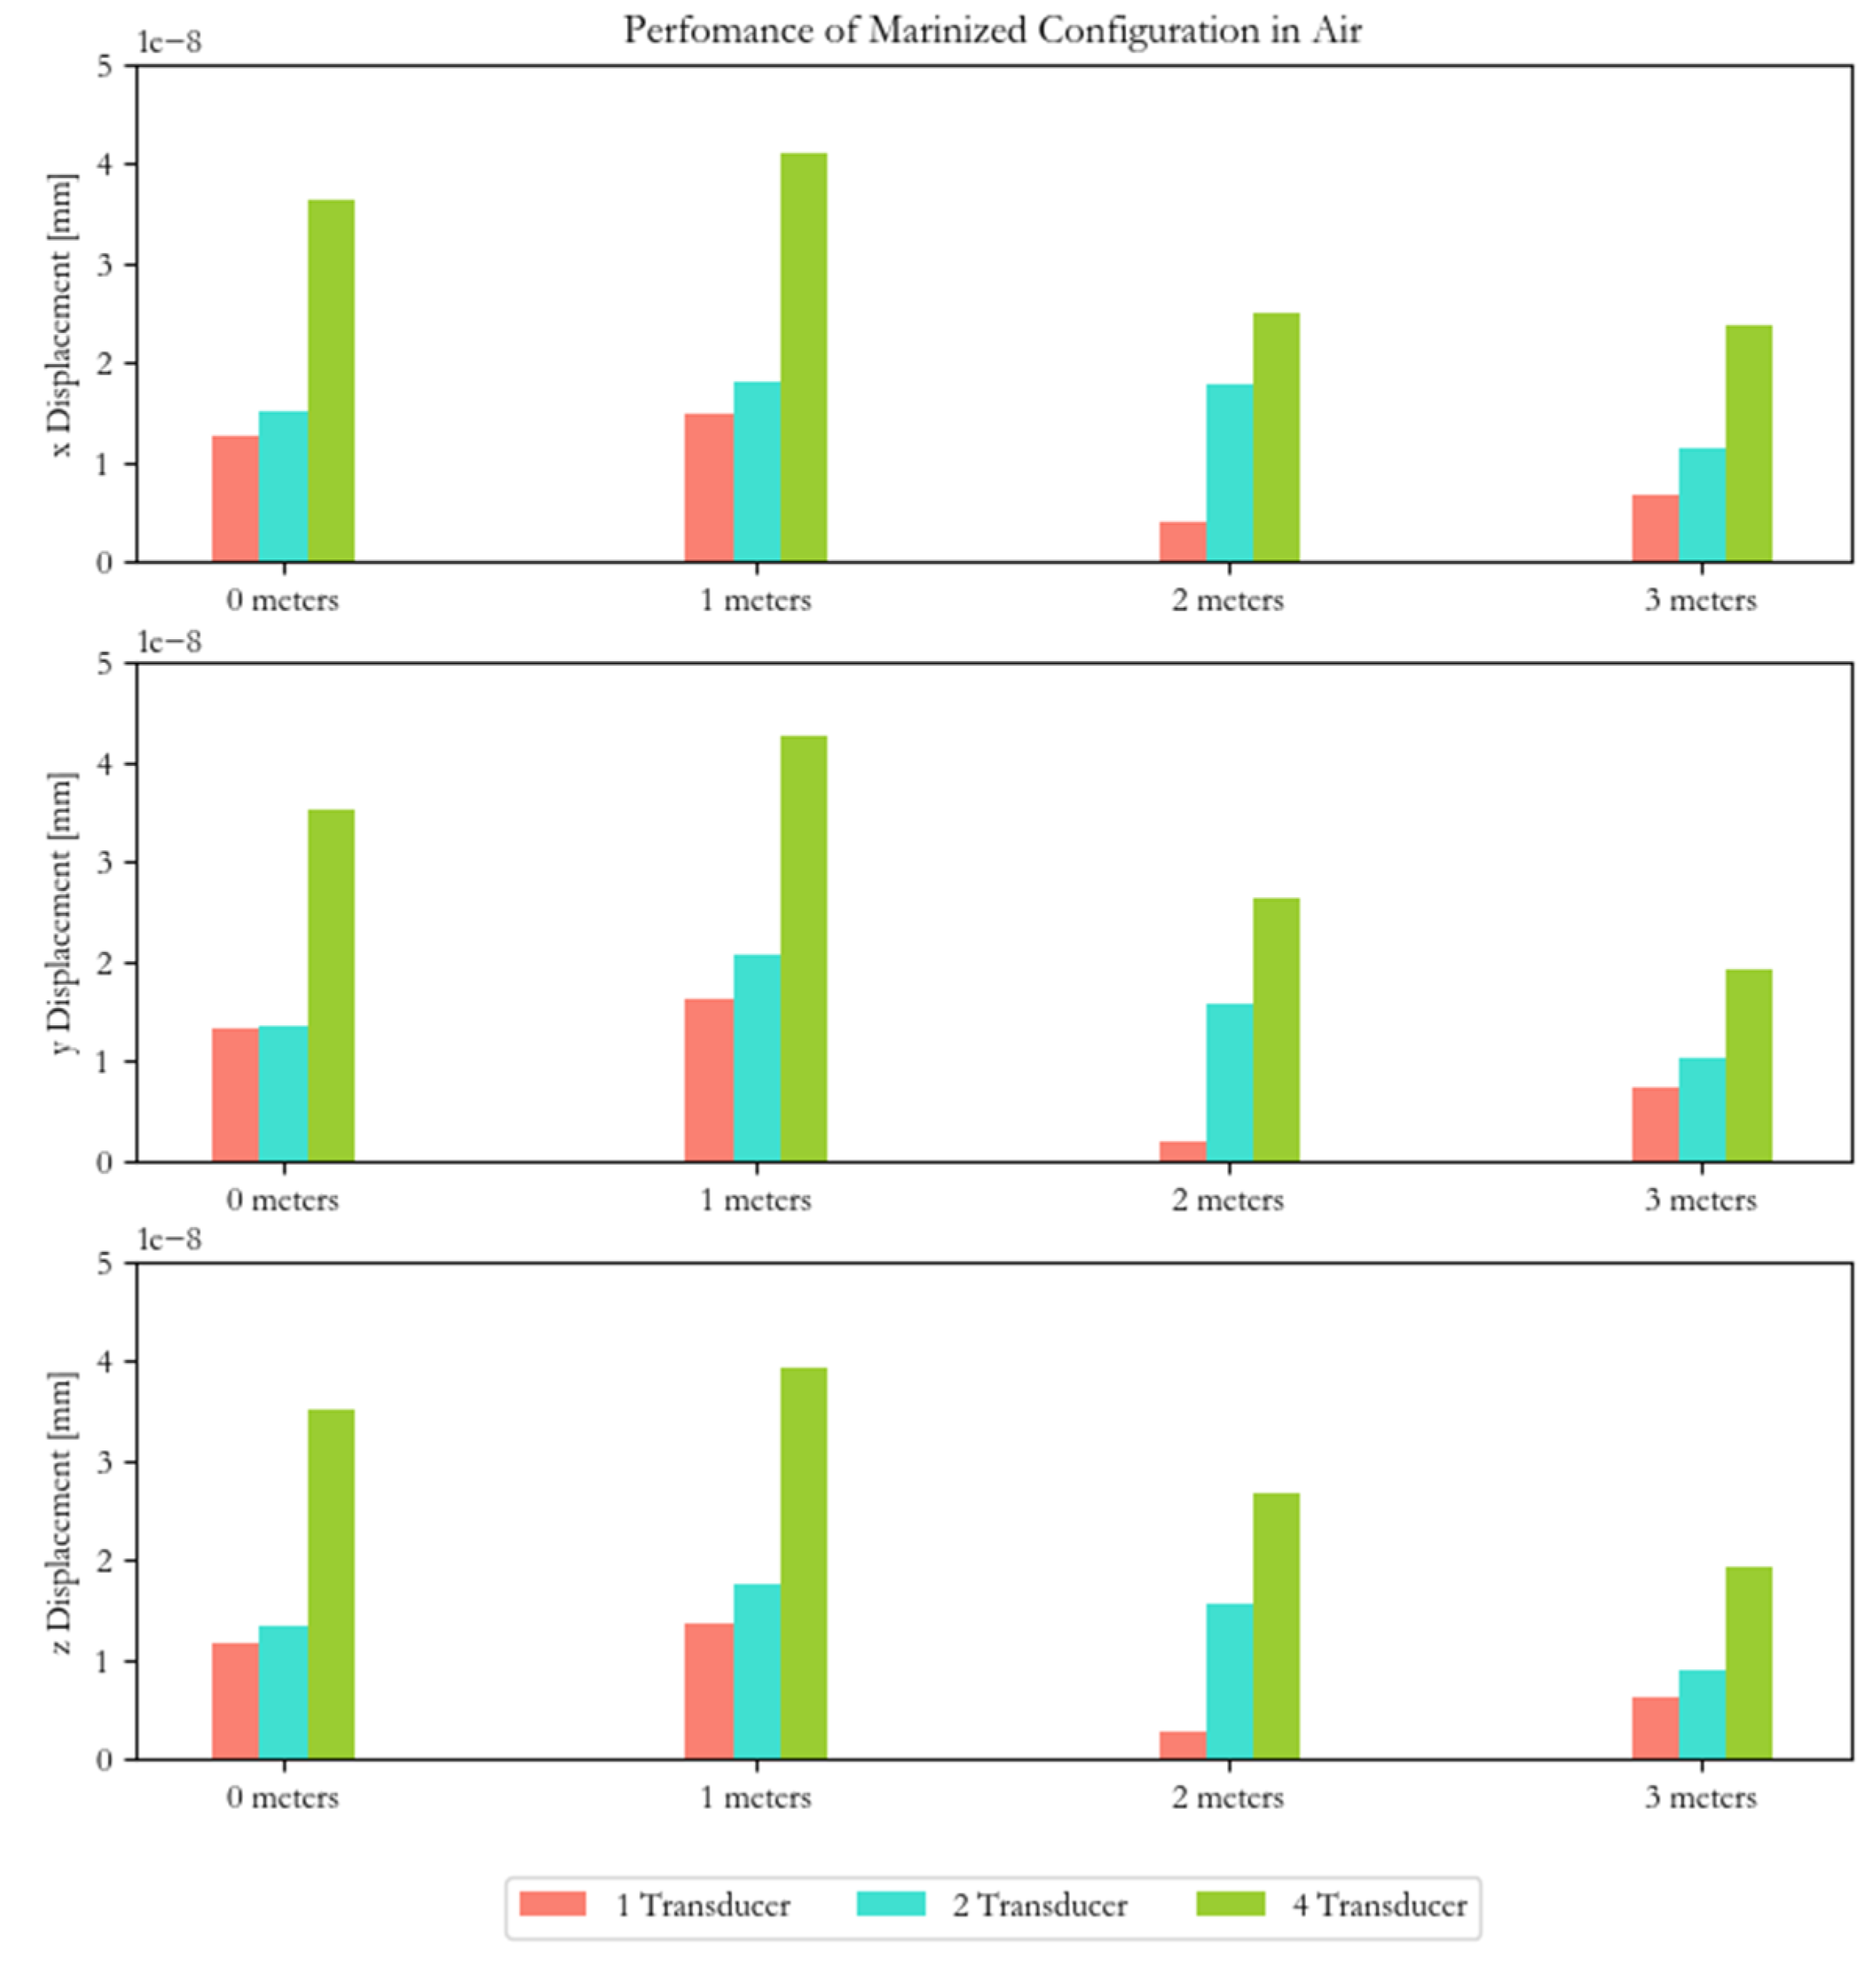
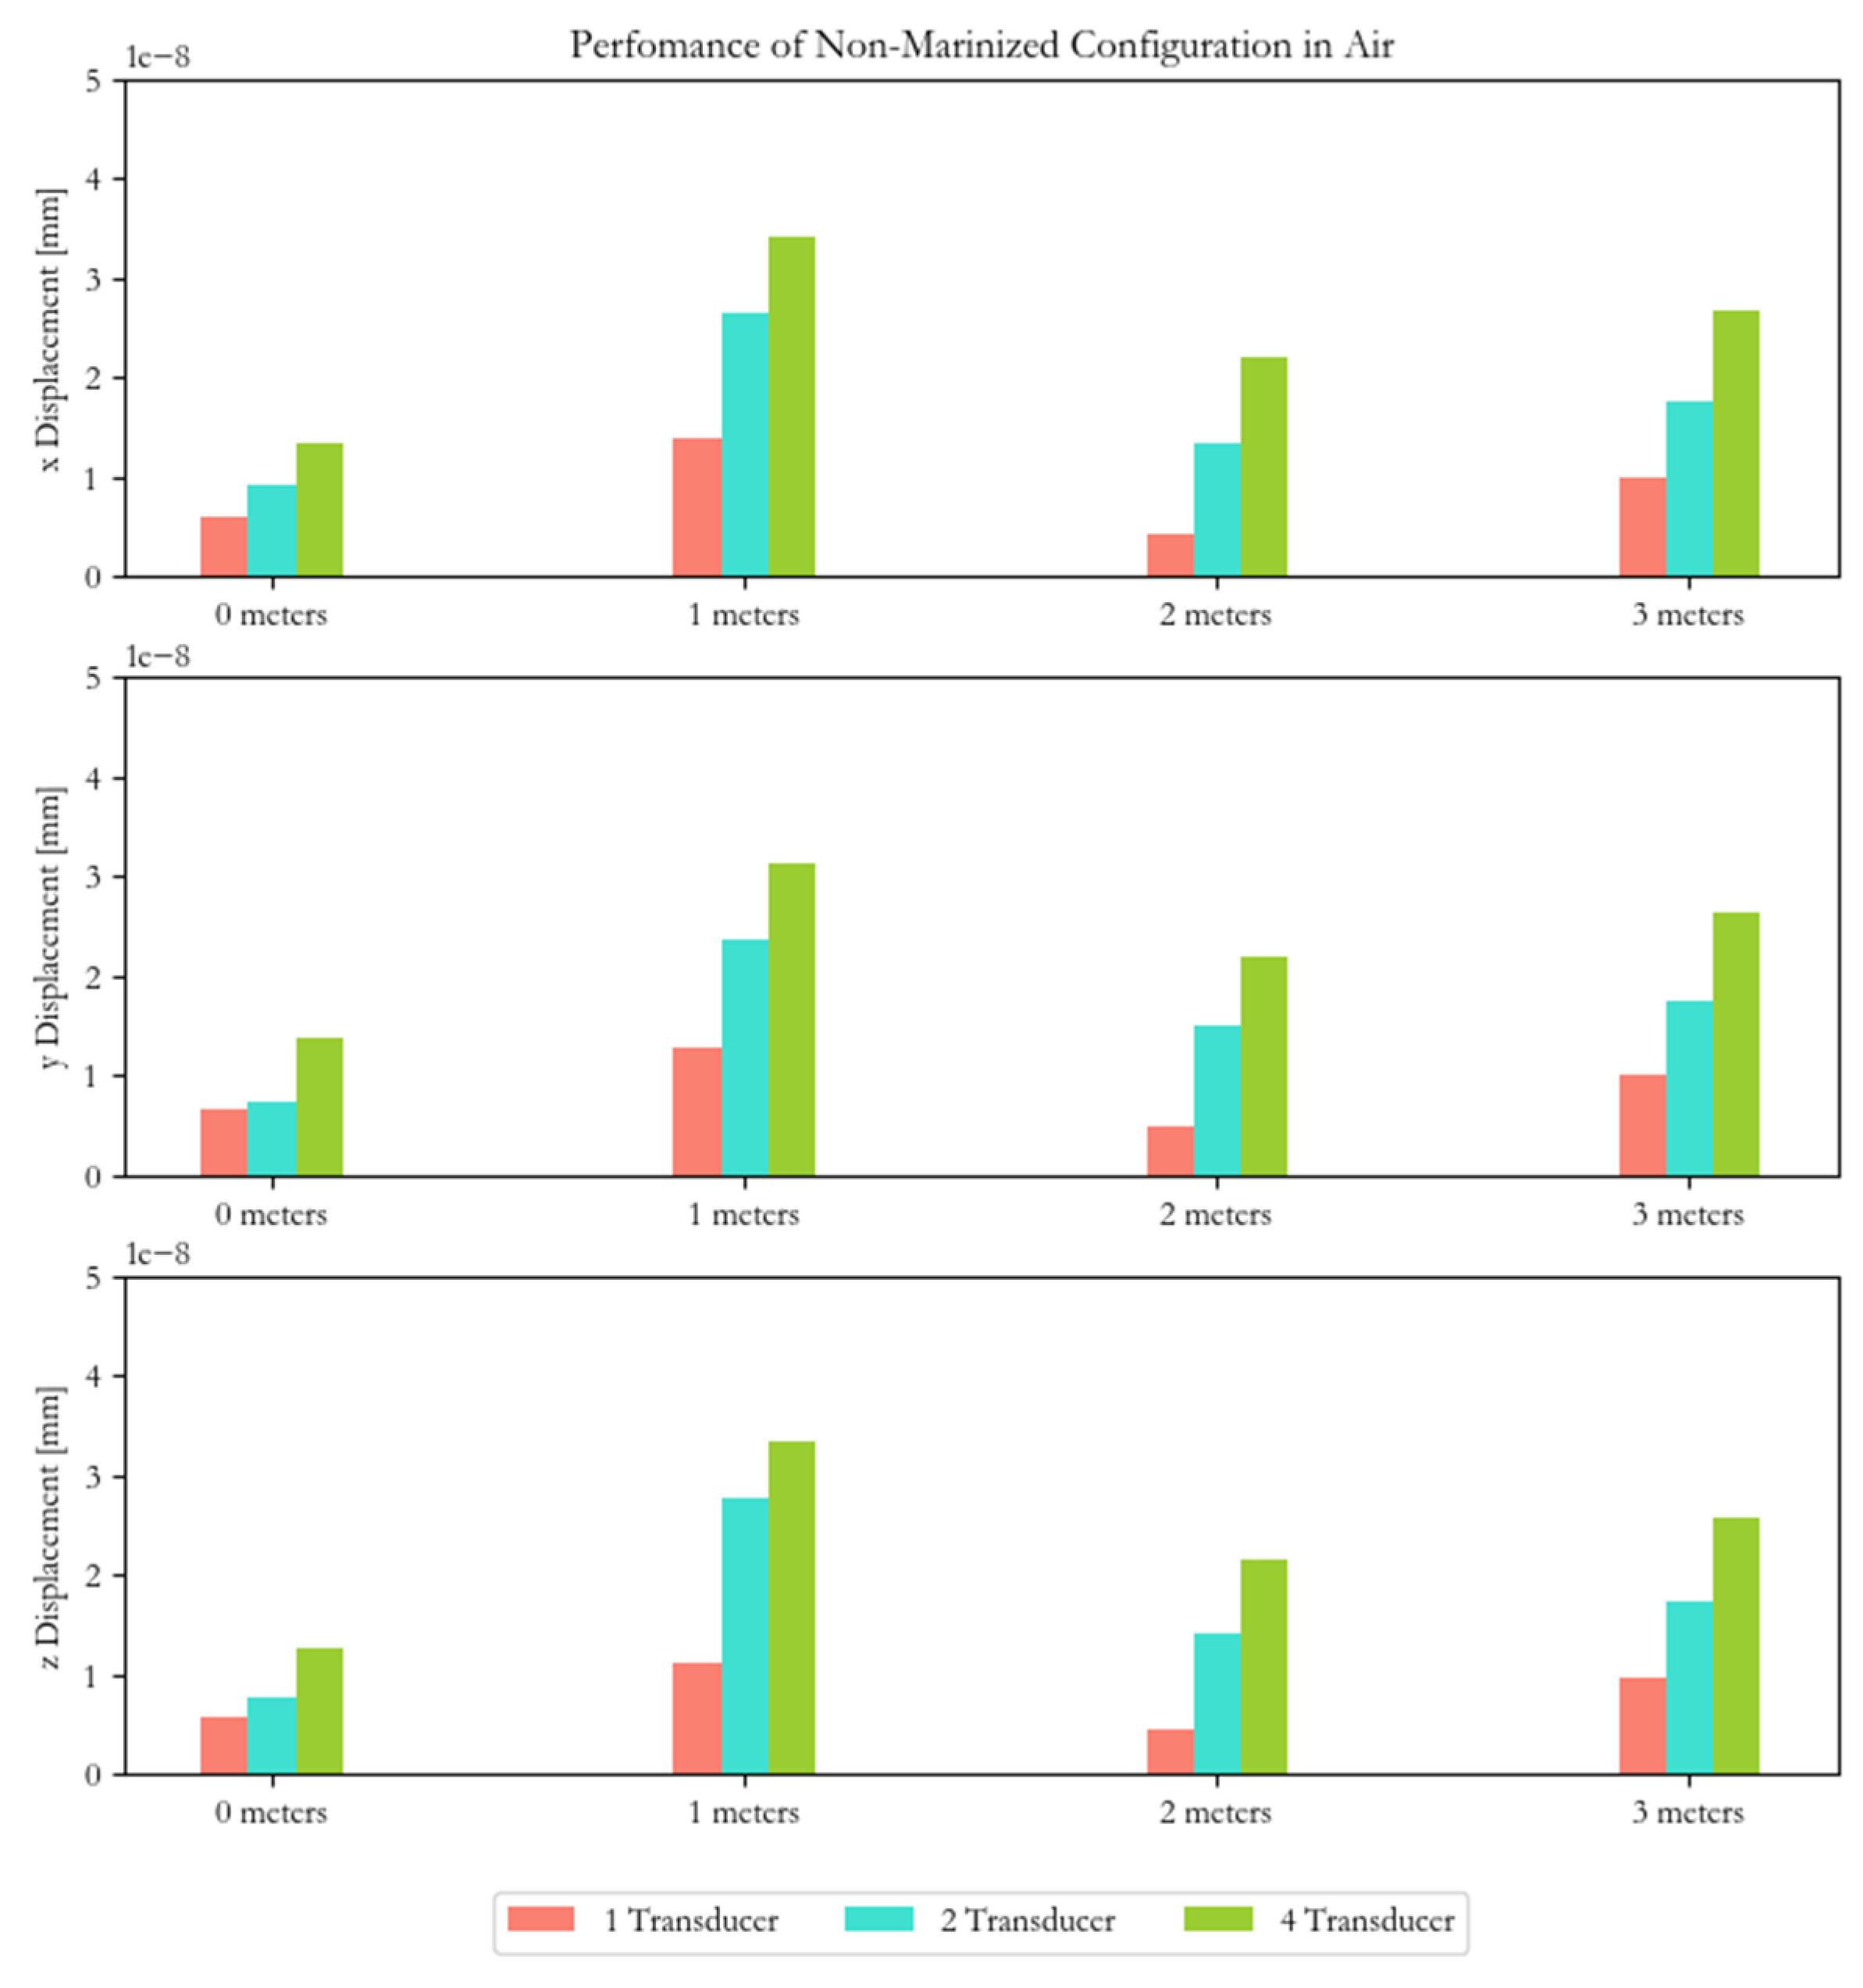
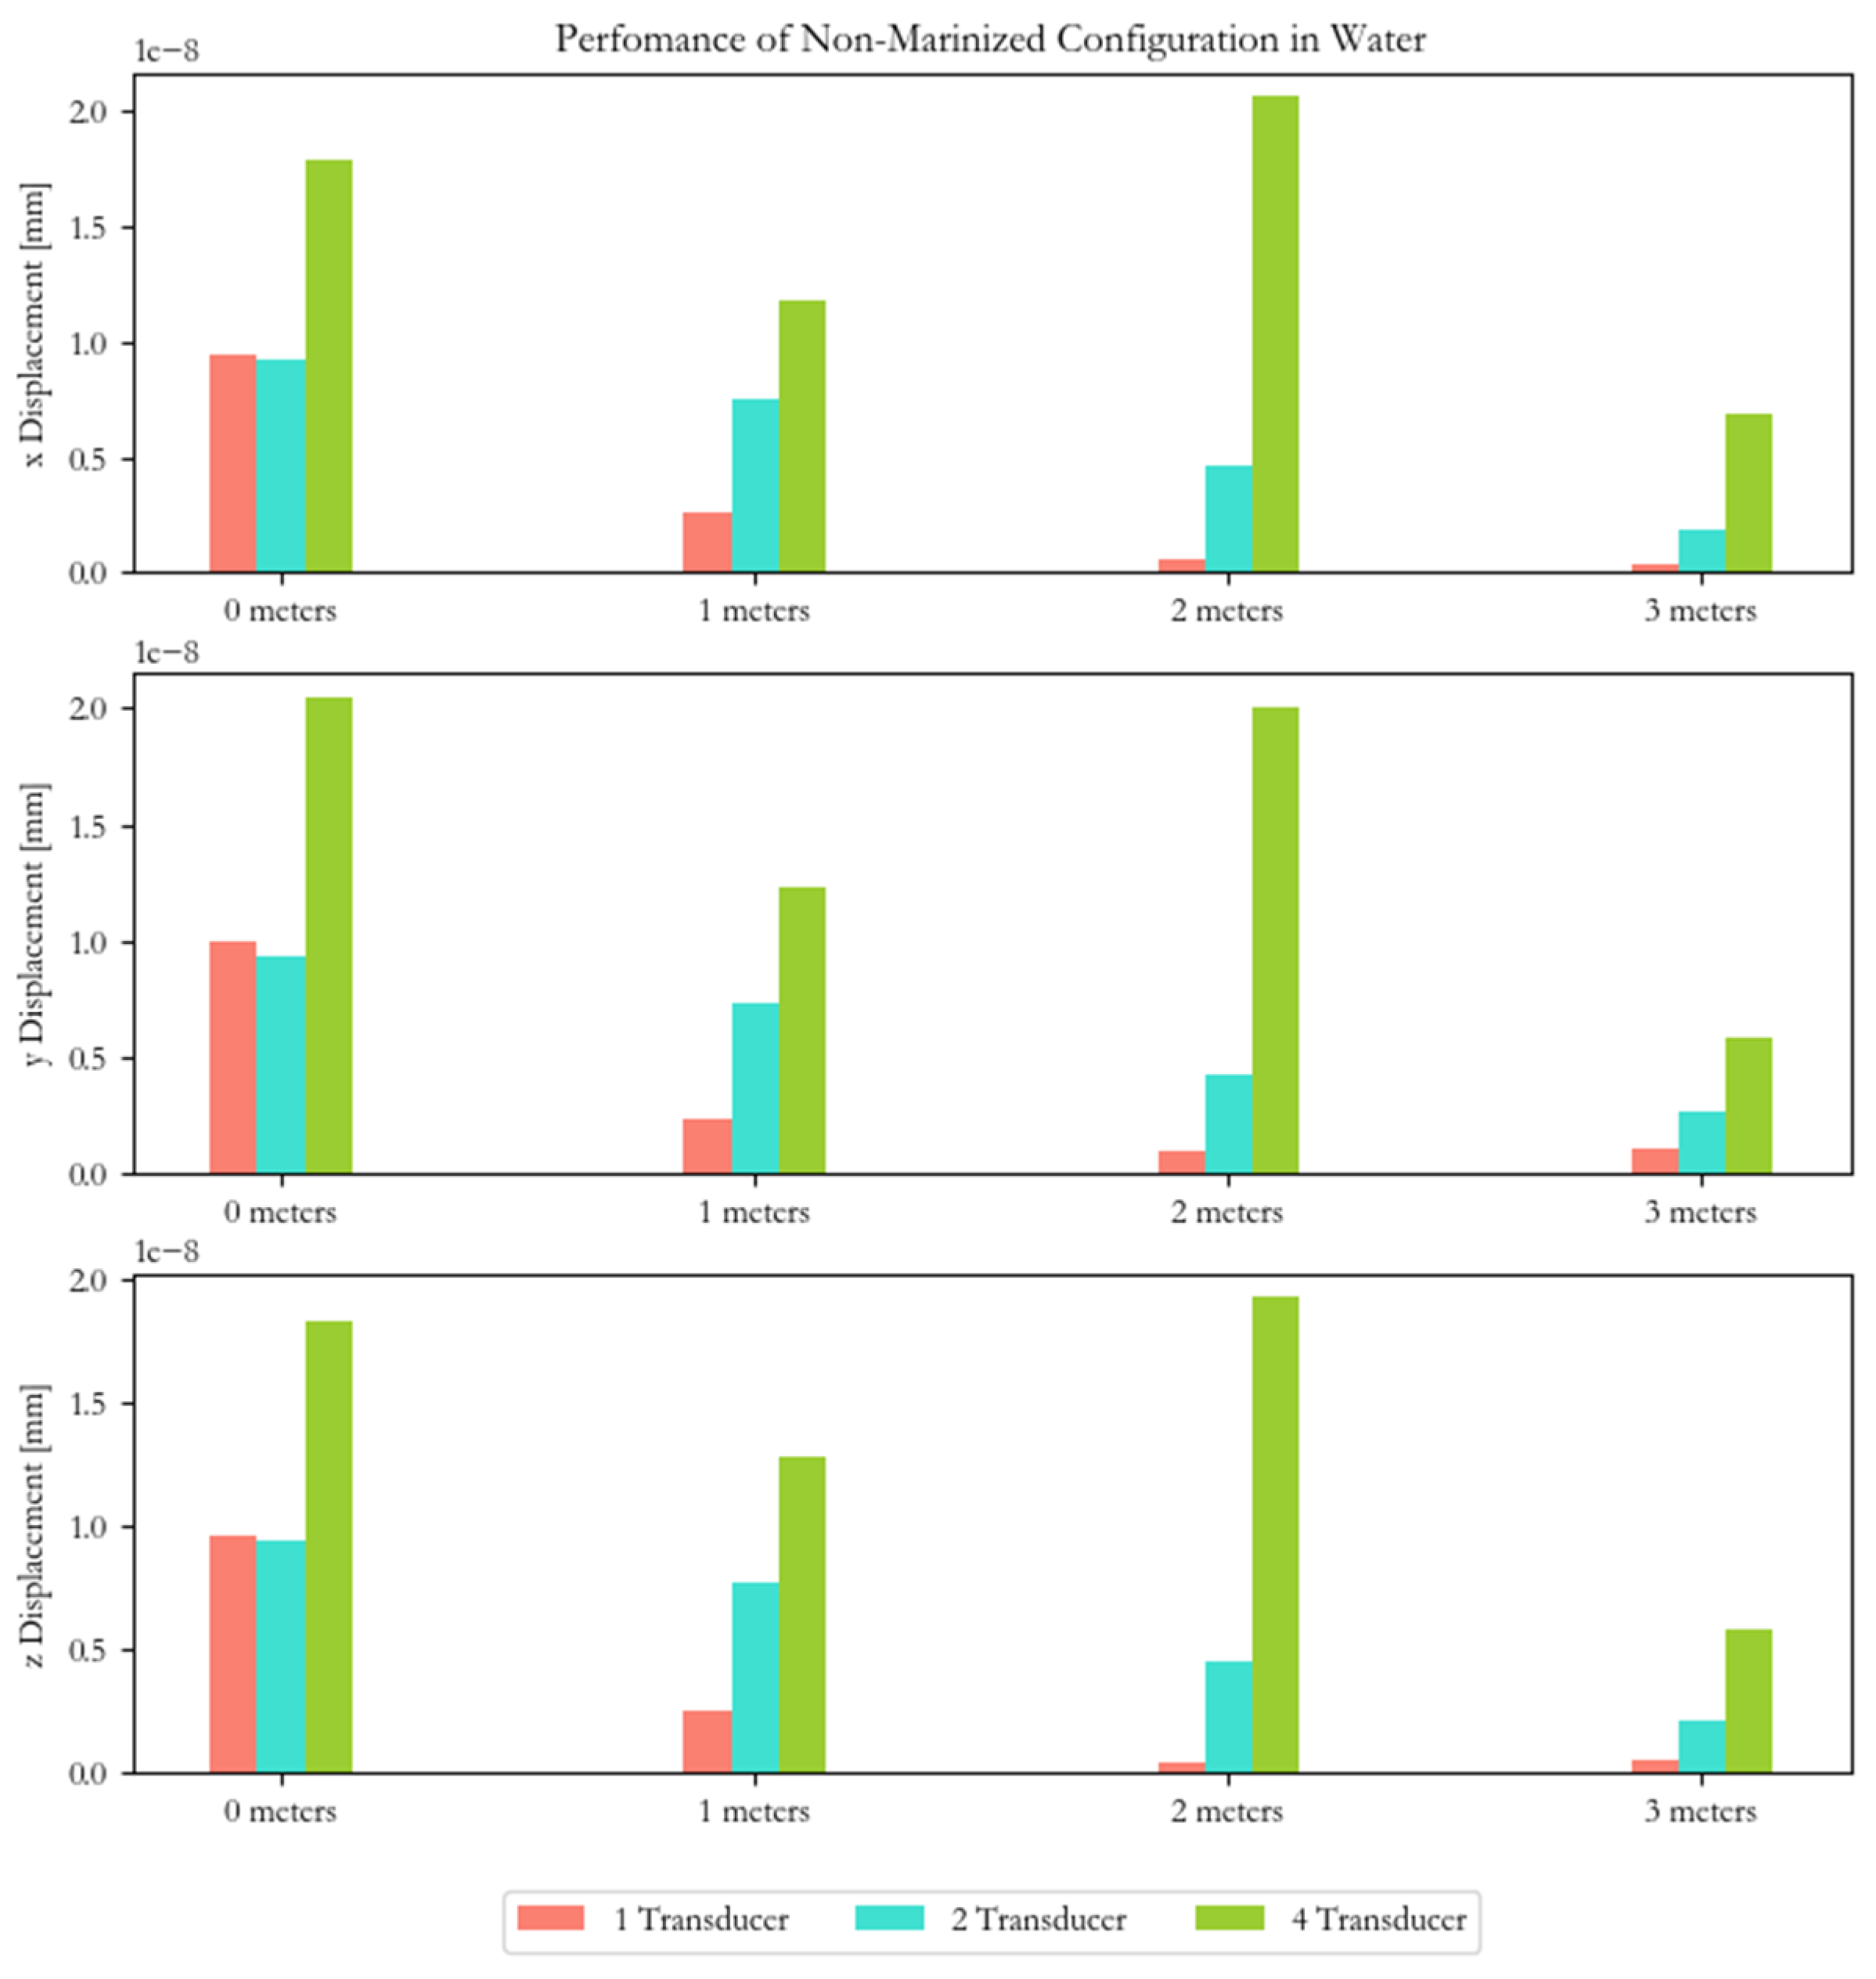
For the 0 m case, results are taken 20 cm away from the HPUT configuration (Figure 13). From comparing the HPUT configurations, there is a clear trend of an increase in achieved amplitude with an increase in number of HPUTs within the array. Over the length of the pipe, the displacement achieved at the monitored point reduces (Figure 14, Figure 15 and Figure 16). The addition of water contributes to the reduction in amplitude due to the attenuation of the ultrasonics into the liquid medium. However, at 0 m, the non-marinized 4-HPUT configuration increases with water and can be due to generating high-pressure fields within the liquid.
The results are not representative of whether there is a reduction in displacement as a result of the addition of the marinization material. This is due to having fixed monitored points that may not represent the maximum displacement achieved as there may be a shift in the distribution of standing waves across the structure due to the marinization. Overall, for both cases, there is a similar trend of a reduction in amplitude across the length of the structure.
5. Field Trial
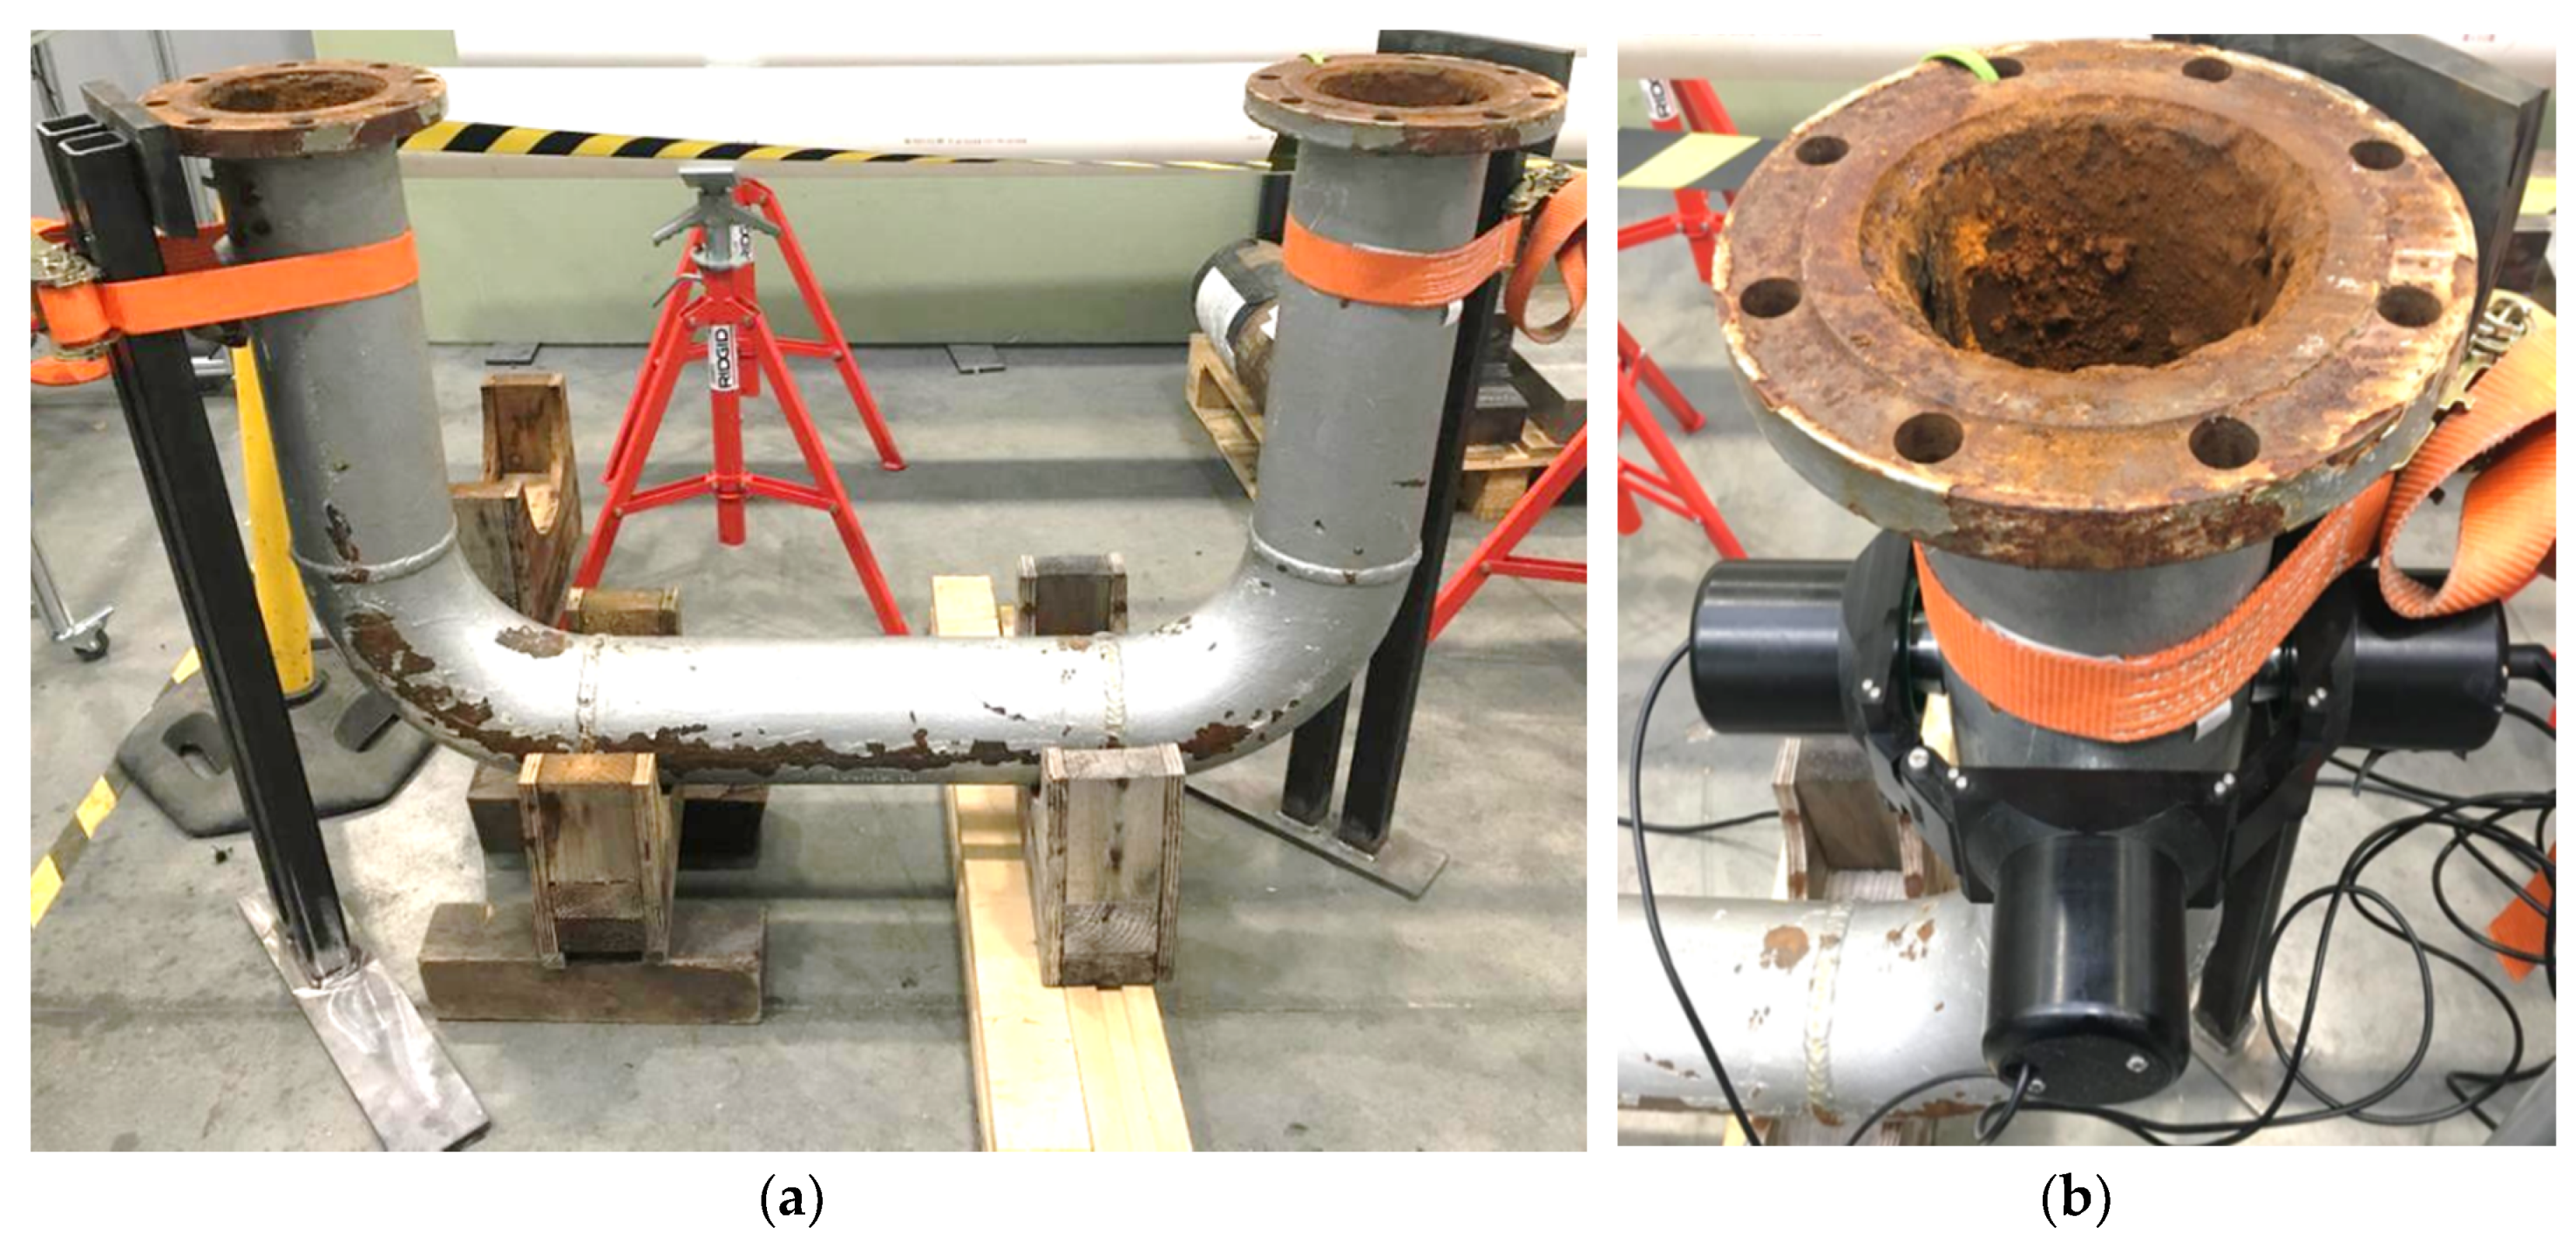
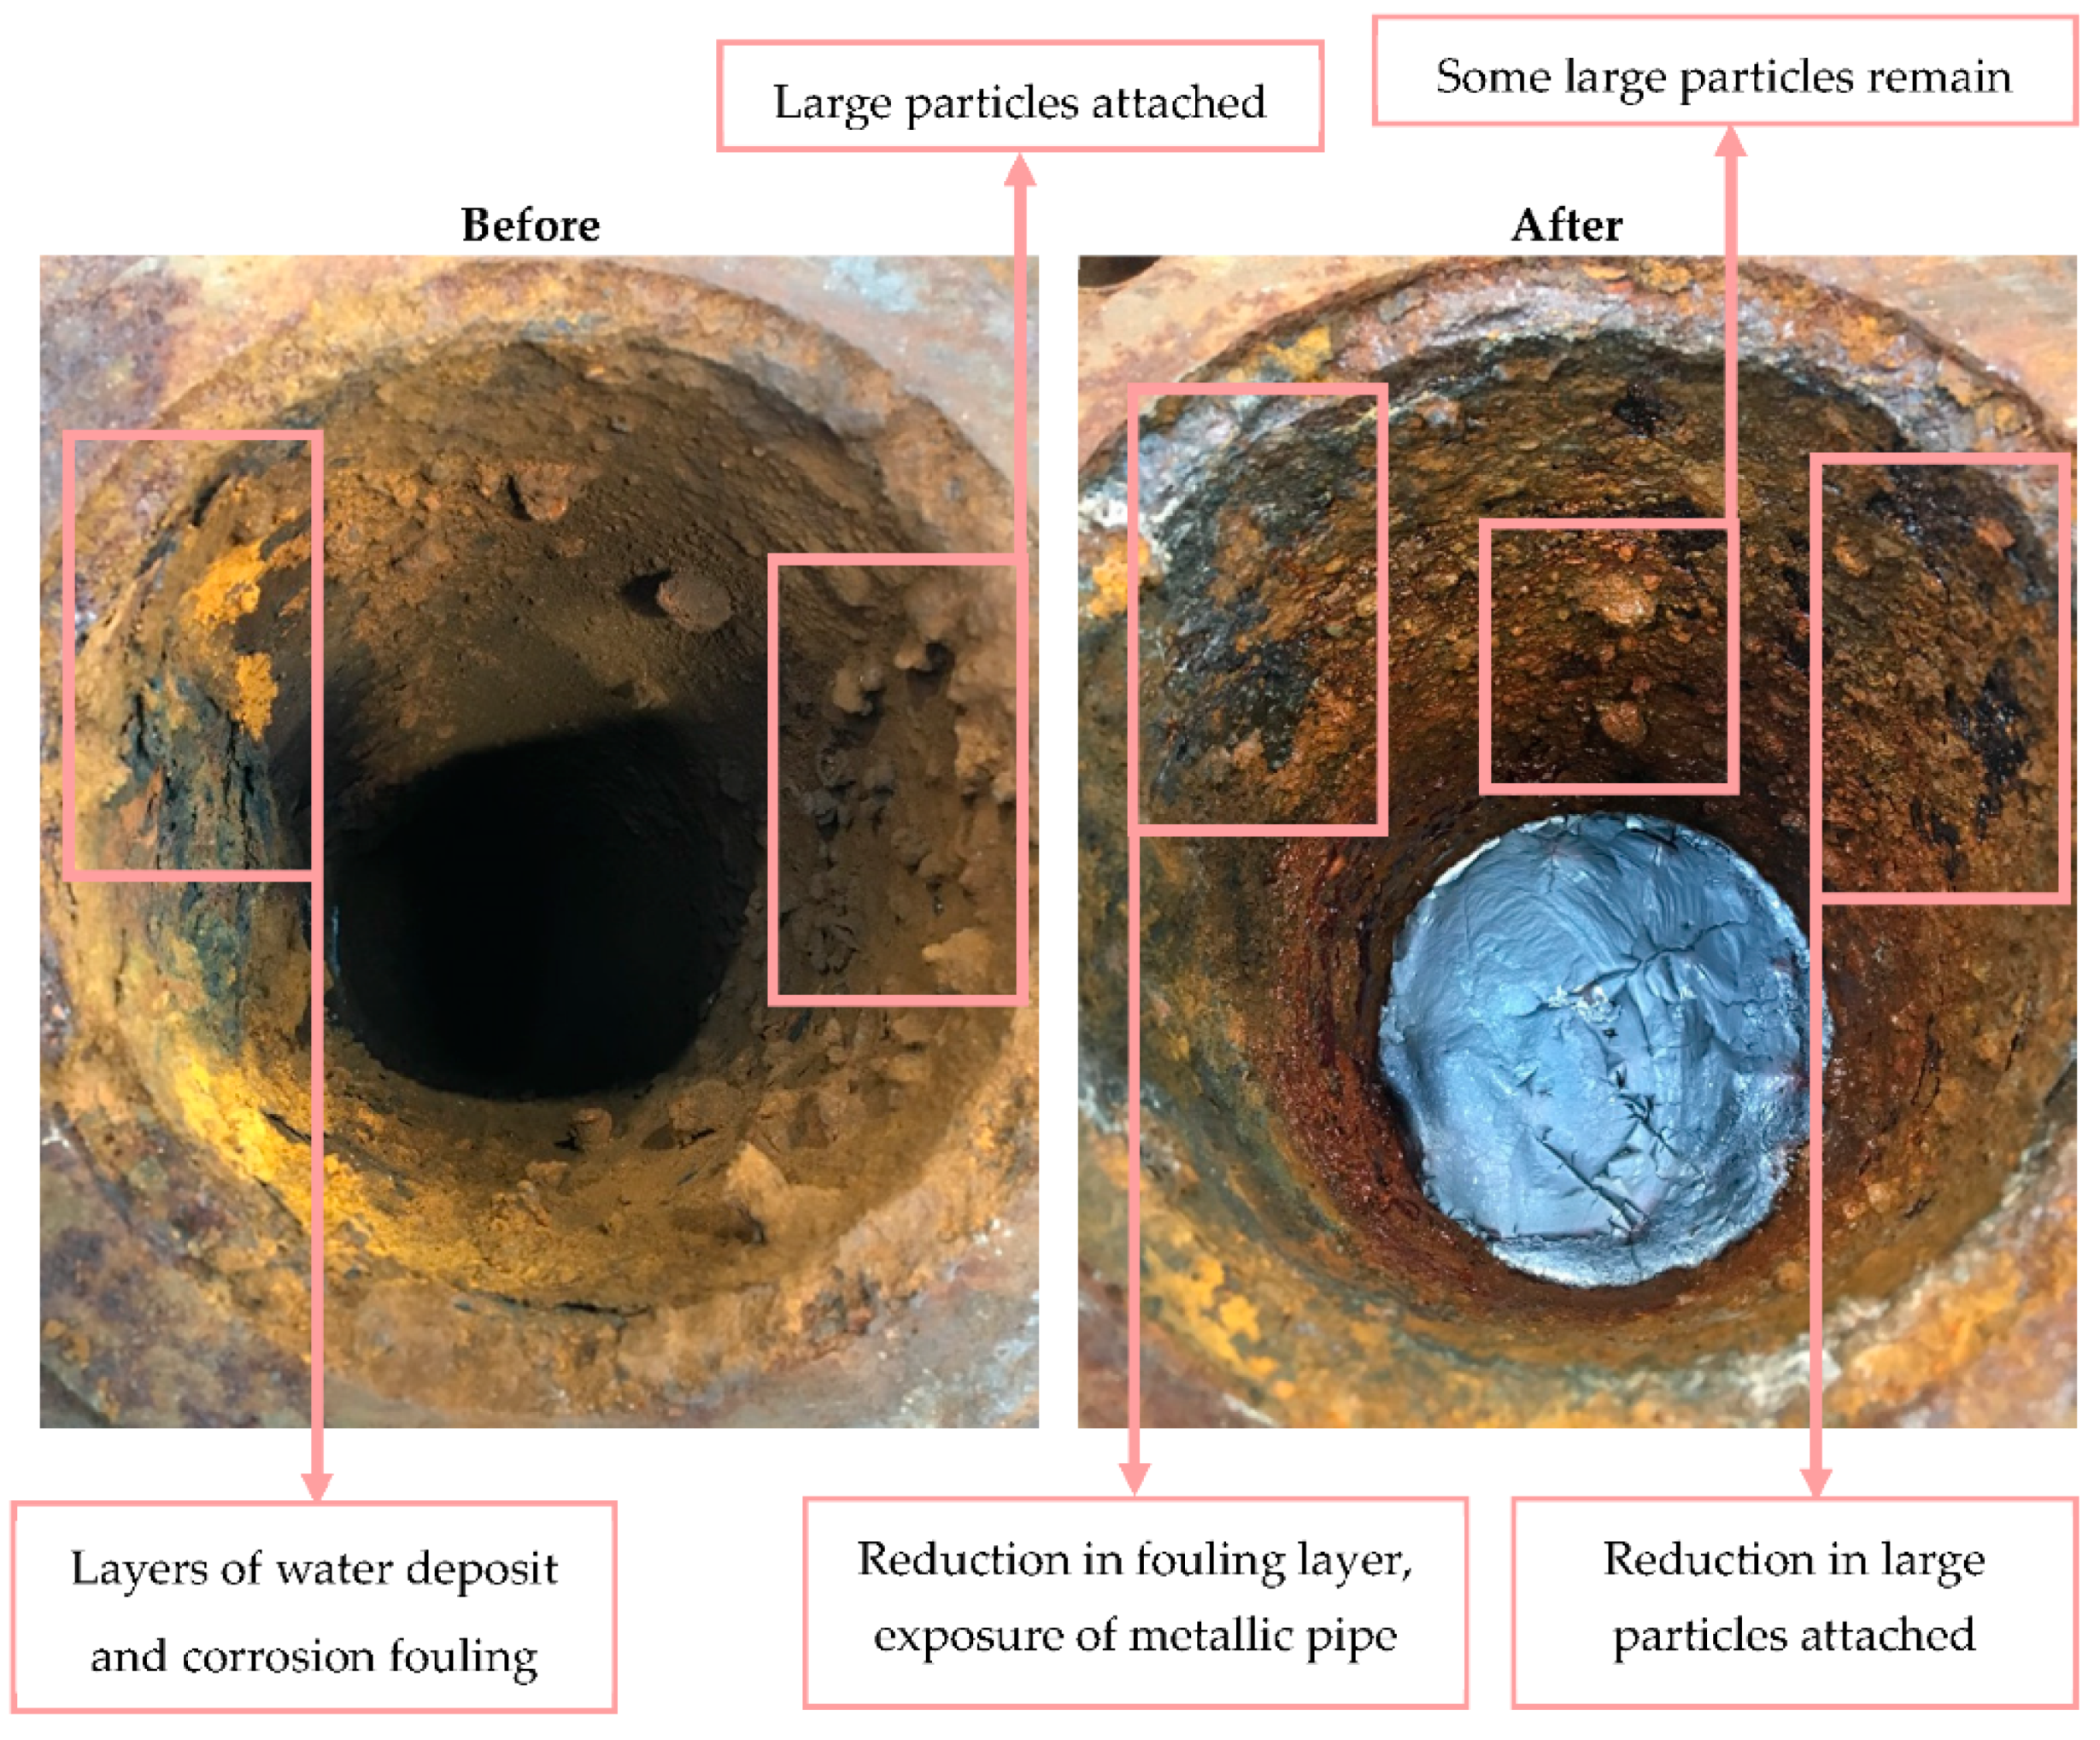
A sample Schedule 40, 6-inch diameter u-bend pipe was received from ESSAR [22]. The specimen is placed upright and is filled with water. The non-marinized HPUT collar is attached approximately 200 mm below the flange as illustrated in Figure 17 and shown in Figure 18. This is left to excite the specimen for a 30 min cleaning cycle.
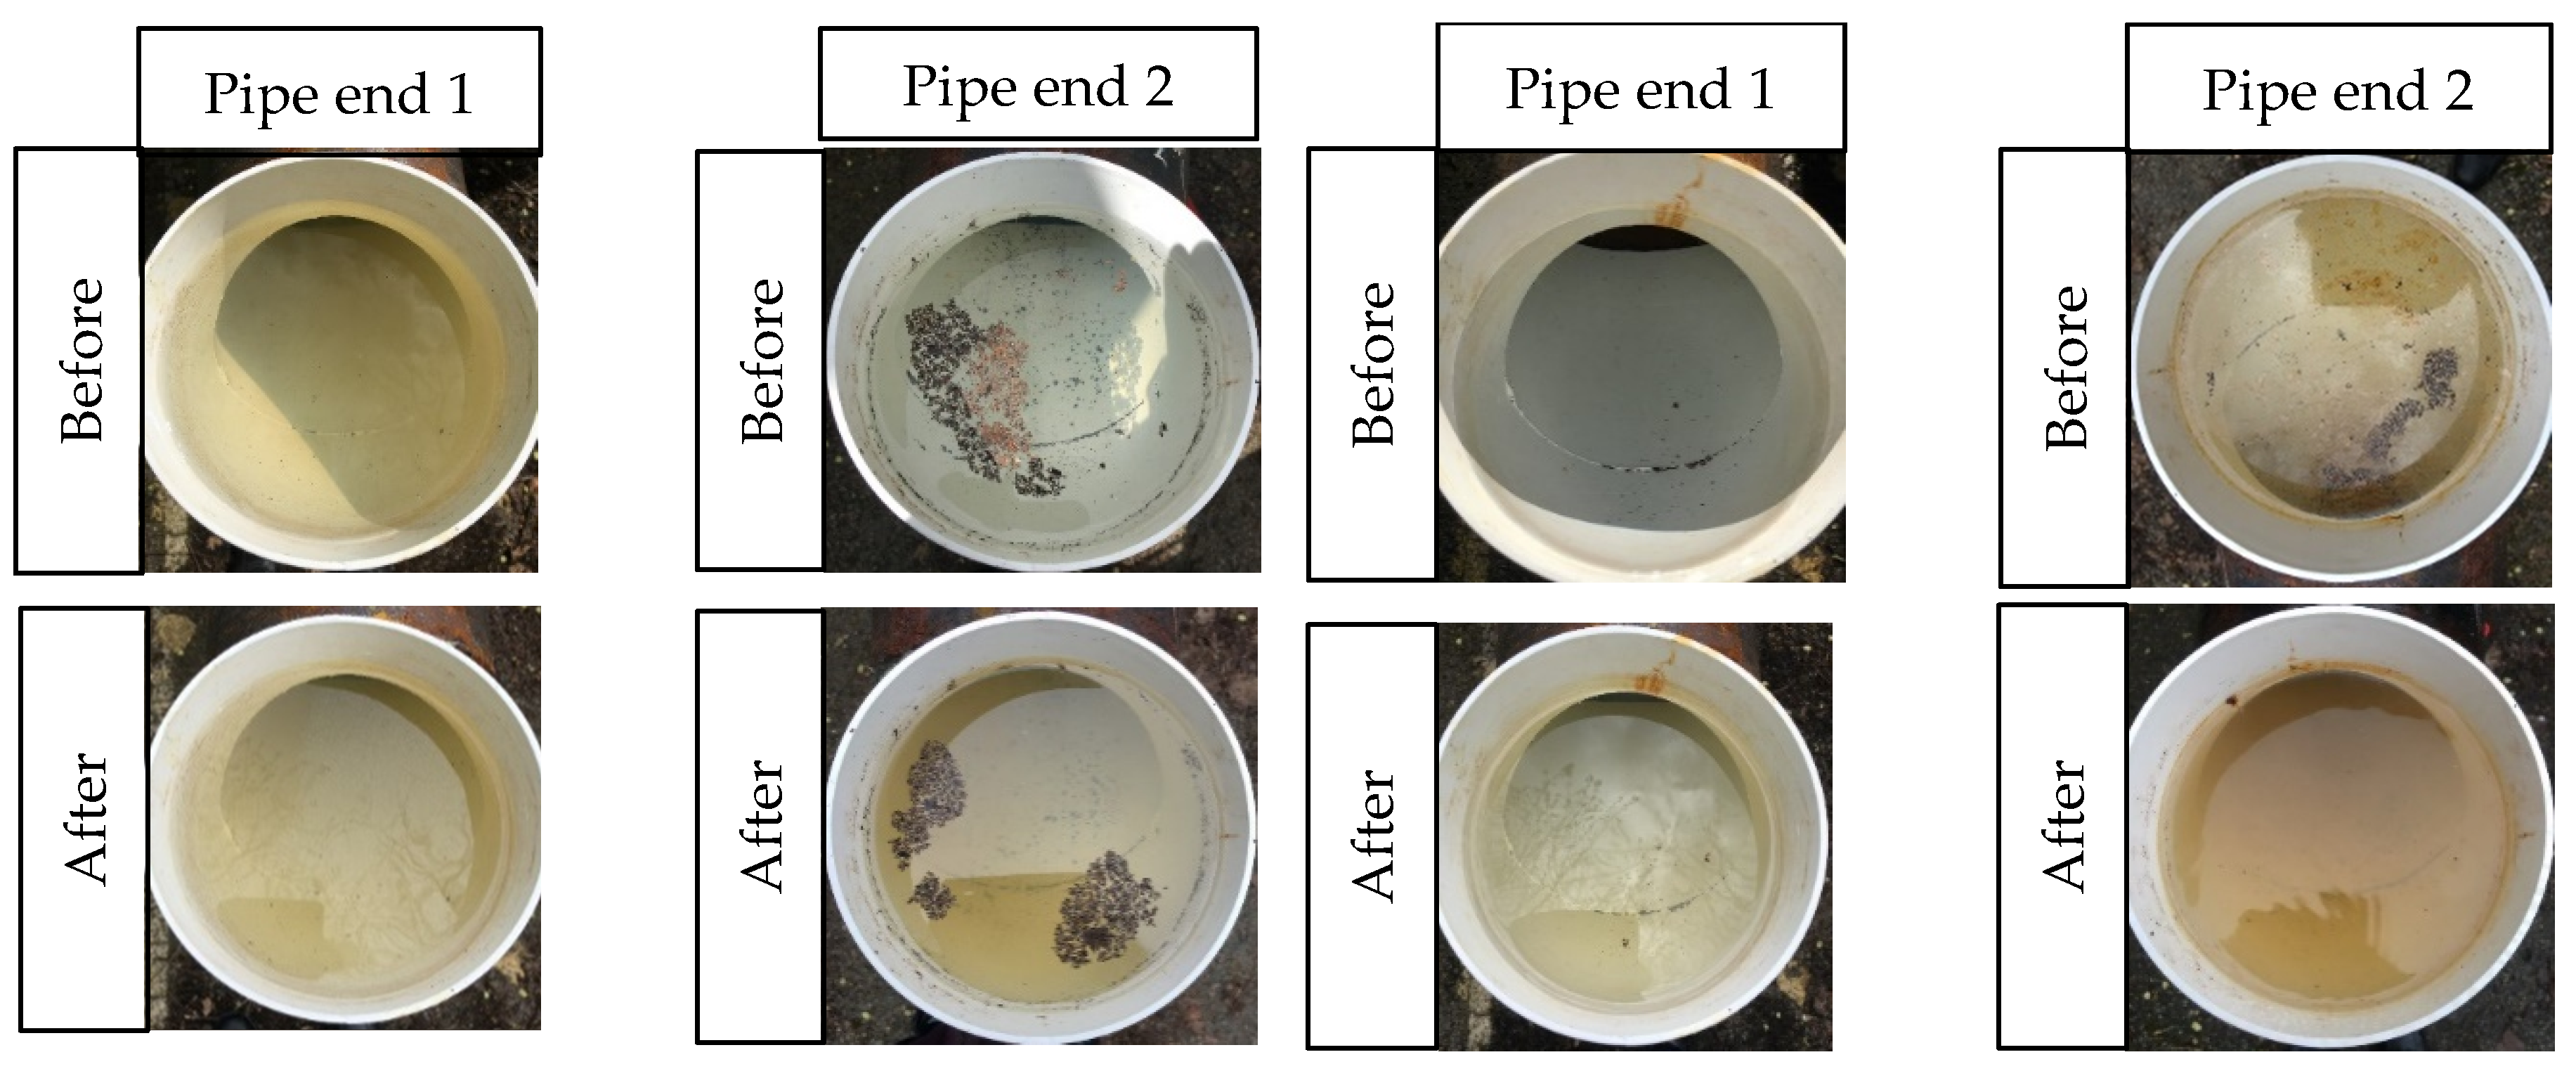
Figure 19 shows locations of fouling reduction which exposes the pipe wall surface. Large deposits shown in the before image have later been dislodged after a cycle of cleaning. Due to the thickness of the fouling, there is only a partial reduction of fouling of the larger deposits. Various parameters have an influence on the achieved performance, as discussed in Table 6.
6. Complete System for Off-Shore Applications
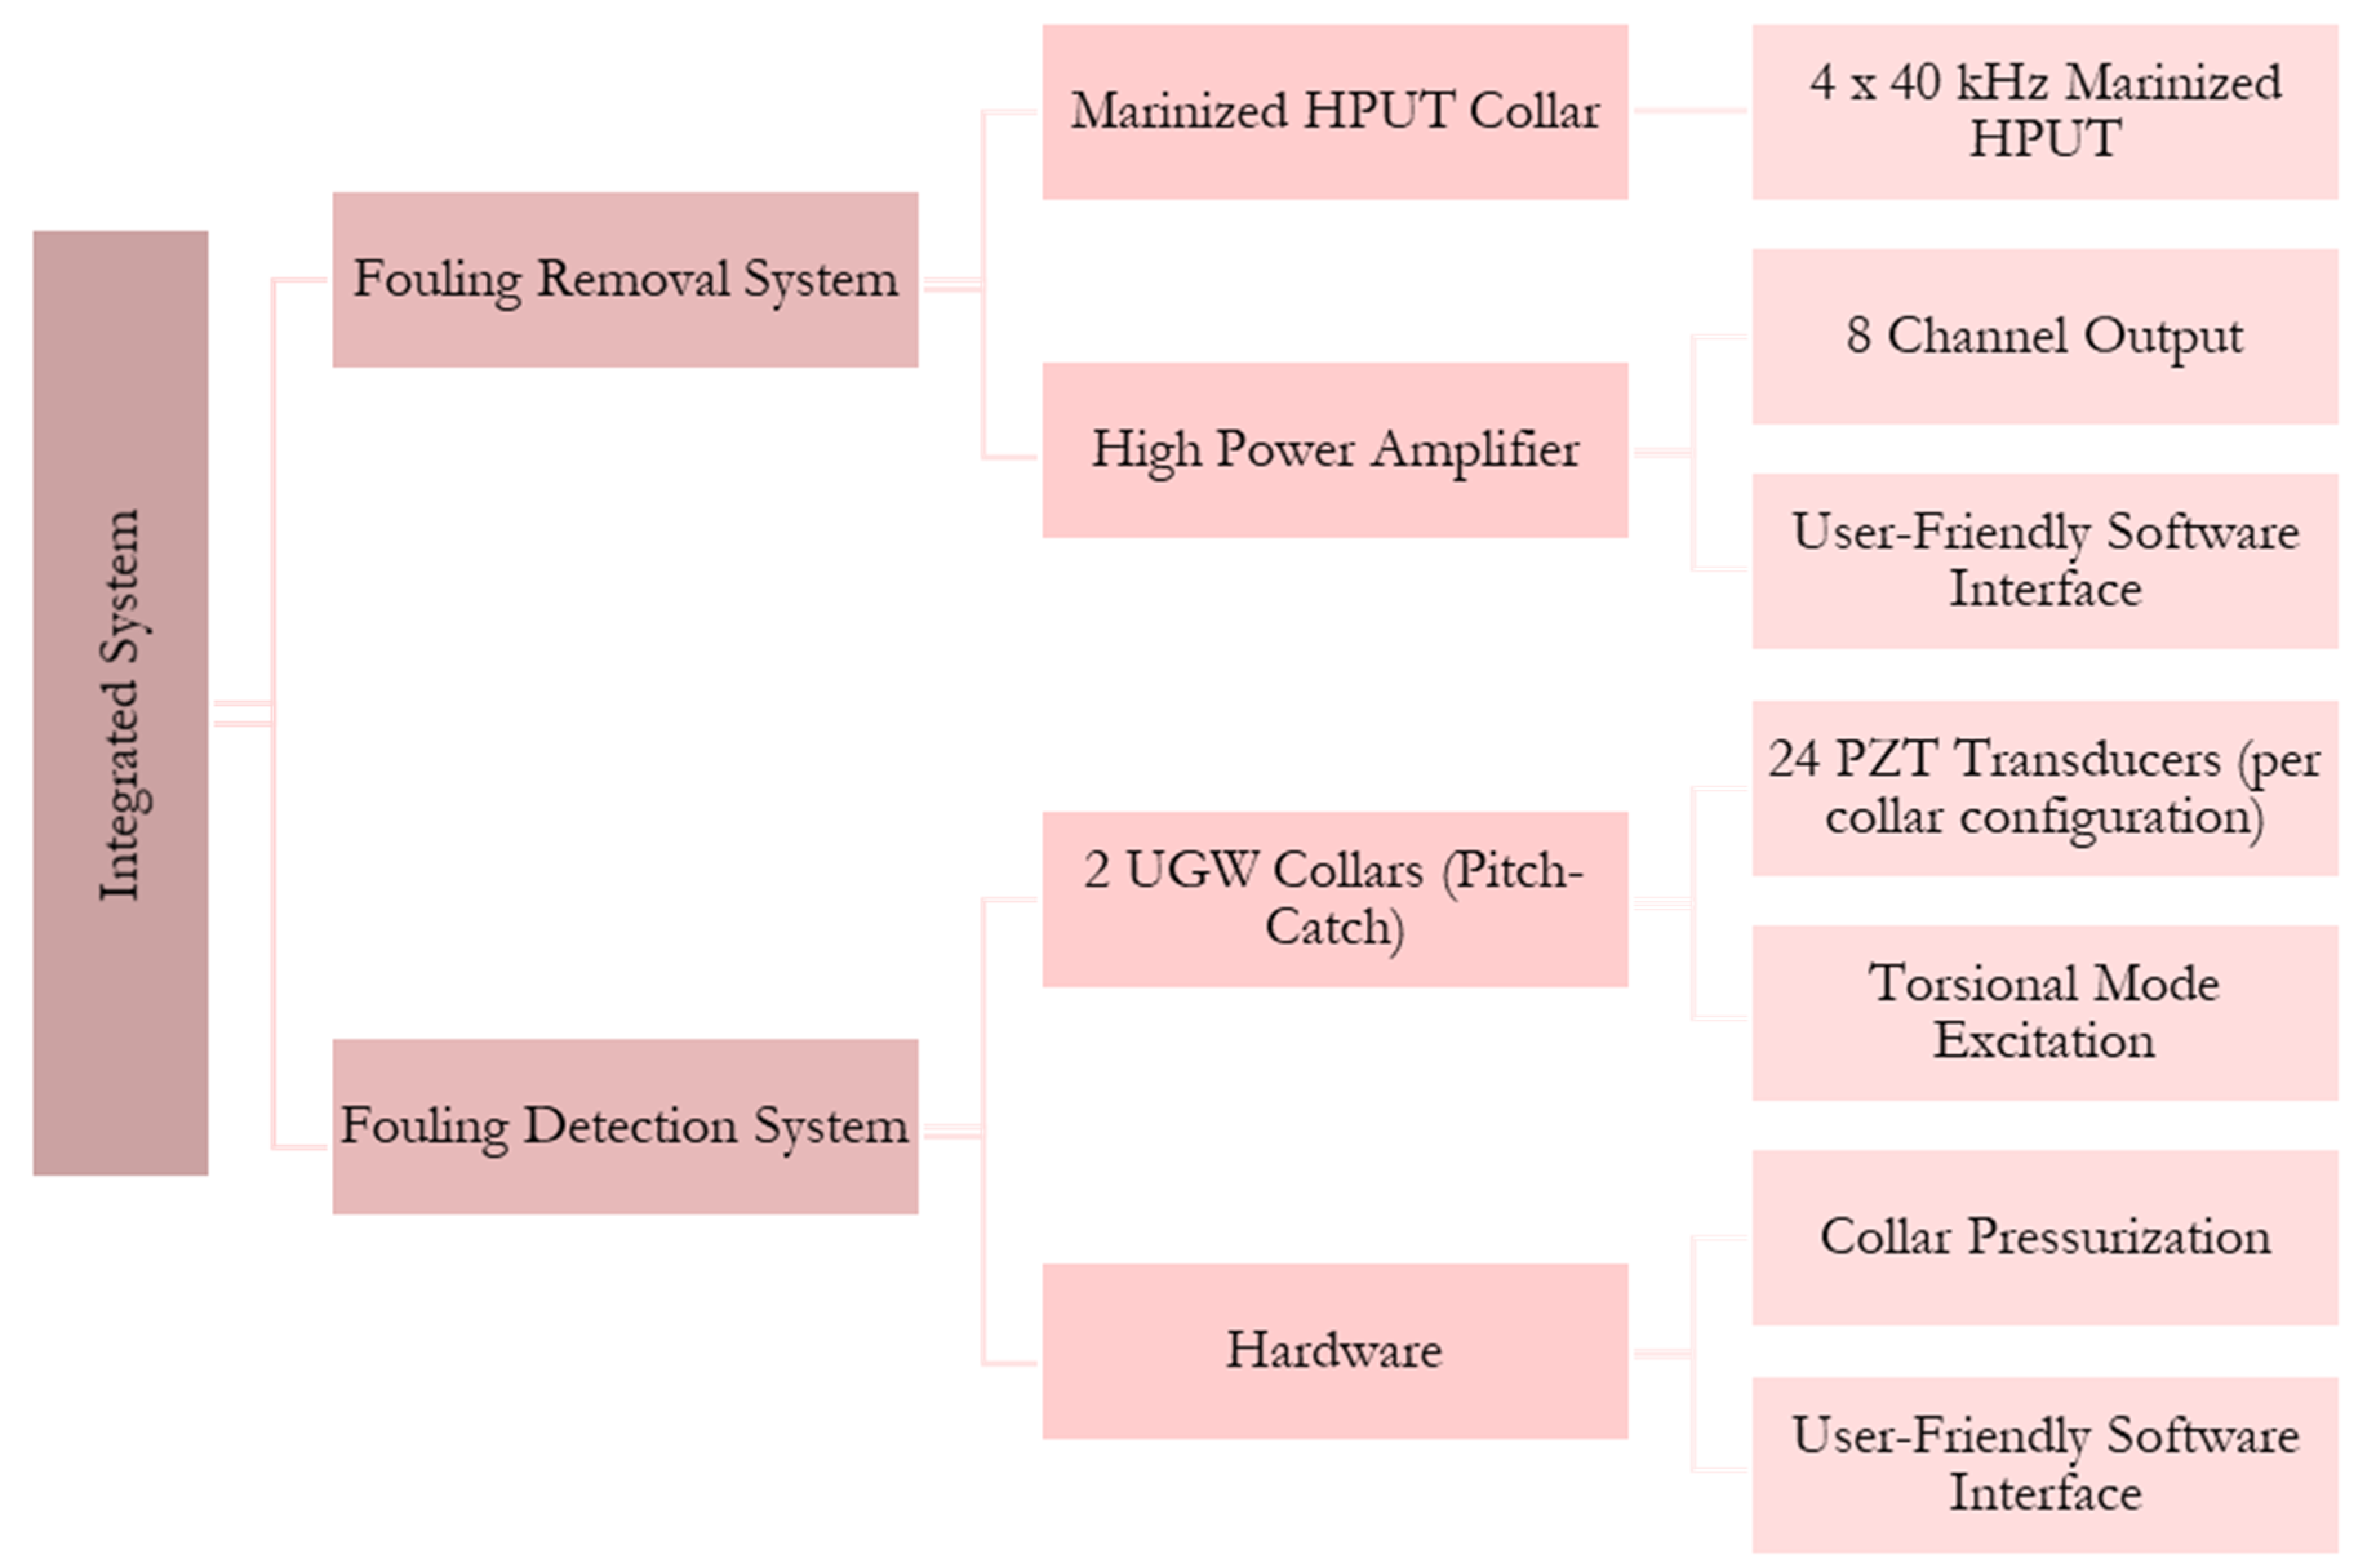
The system consists of two technologies, the fouling removal system and the fouling detection system. Both systems work together to detect fouling before carrying out fouling removal, which can then be monitored to determine the fouling removal effectivity. The architecture of the system is shown in Figure 20.
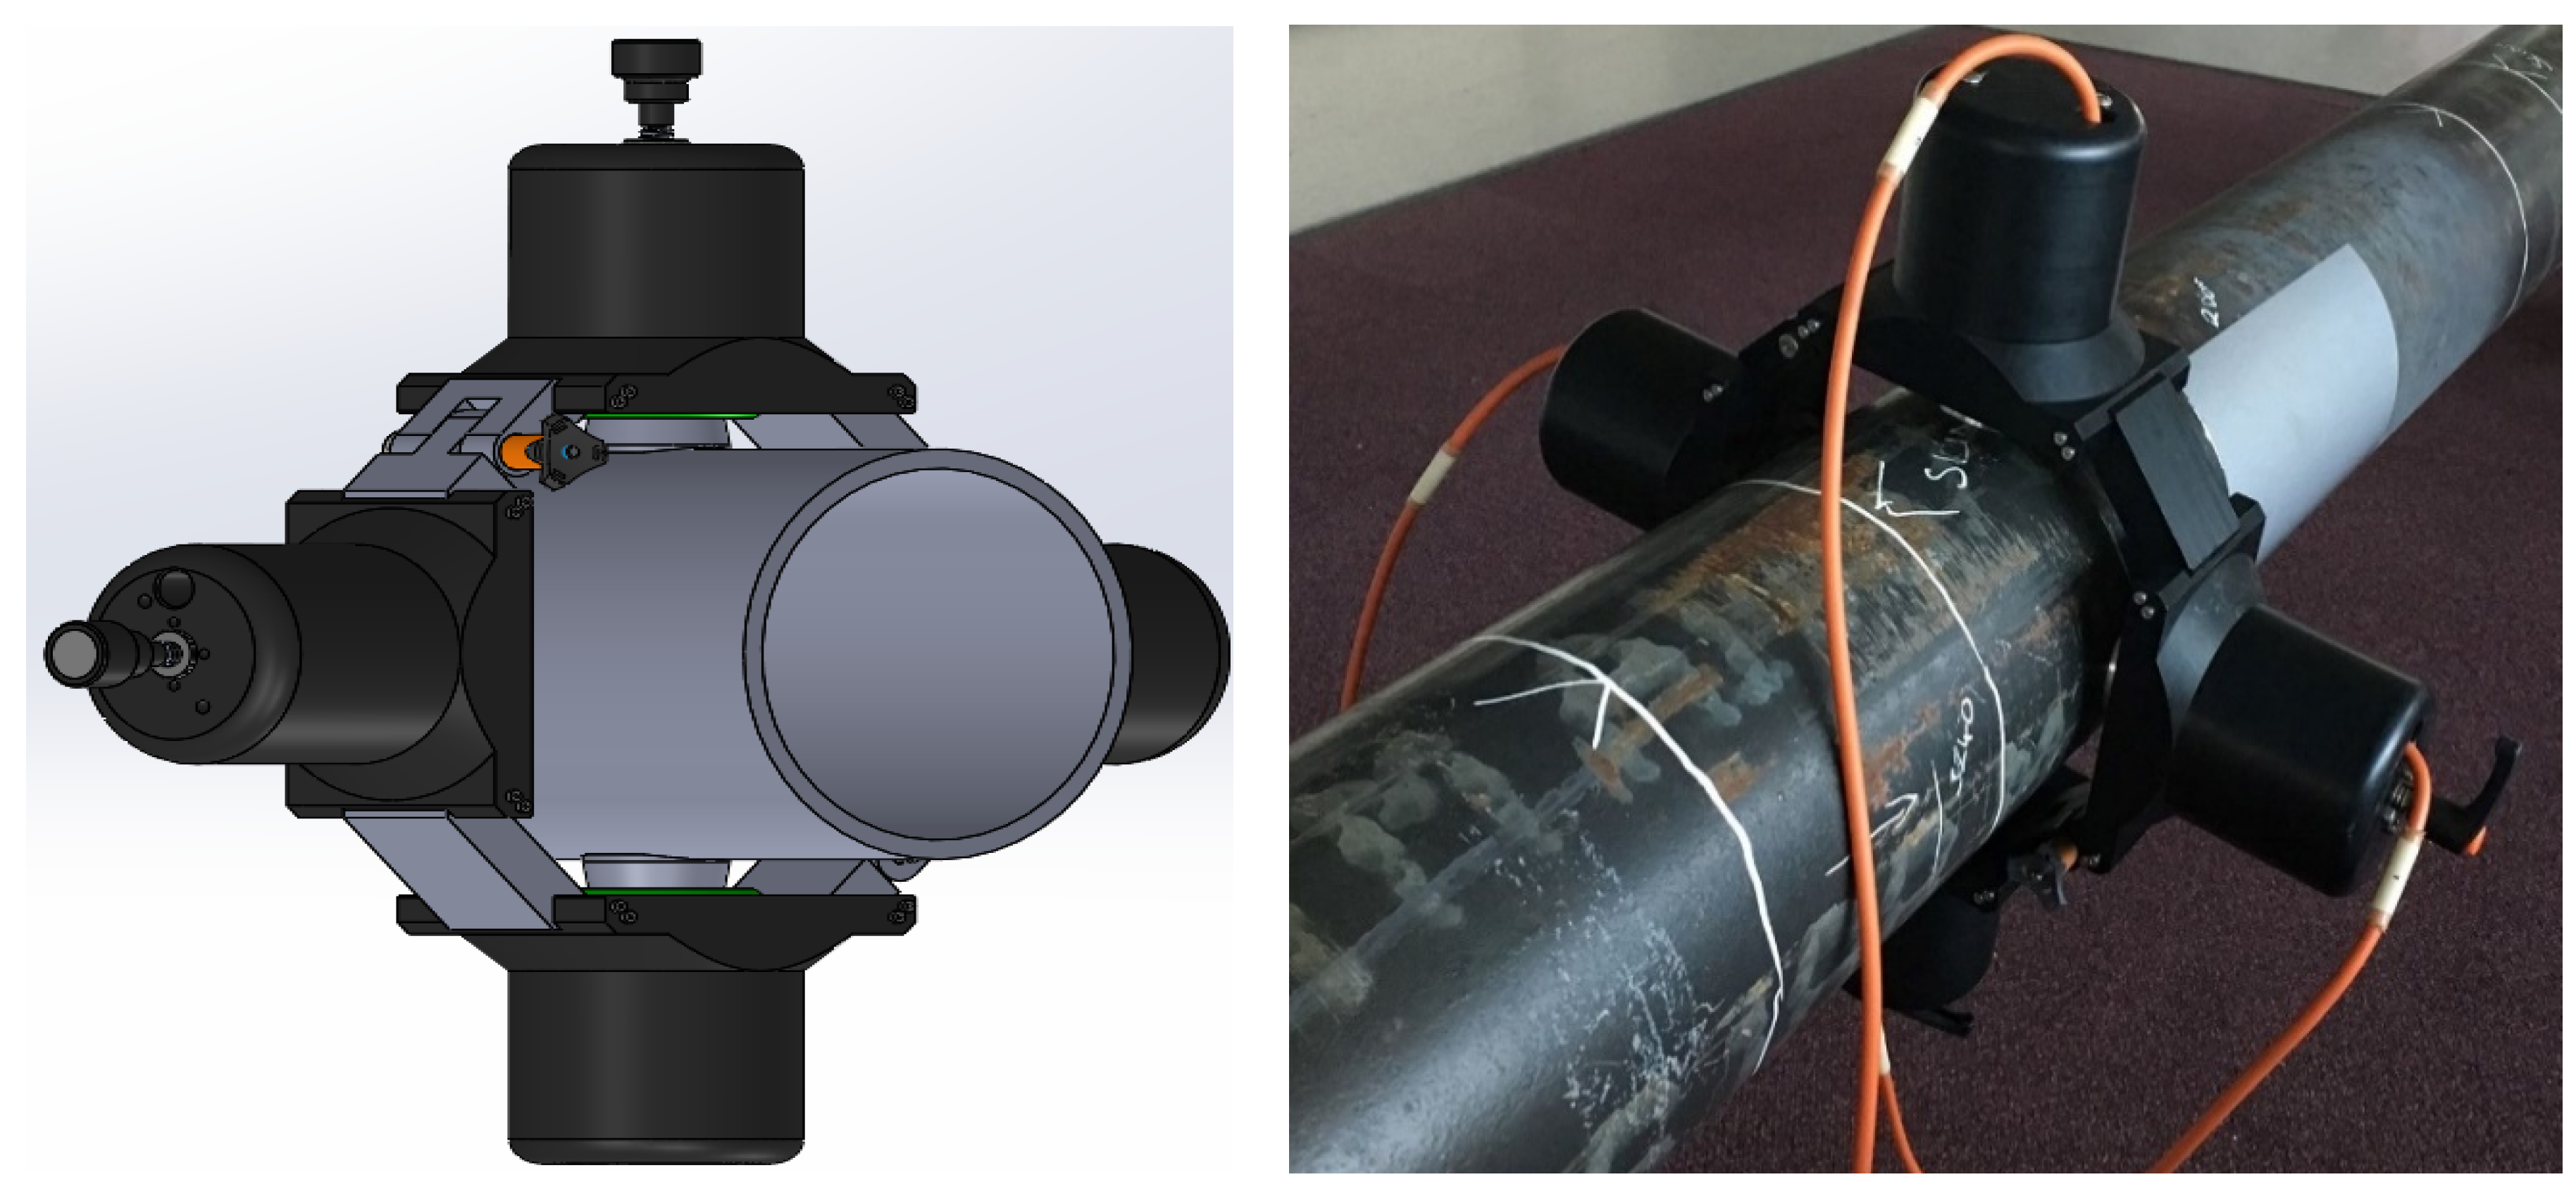
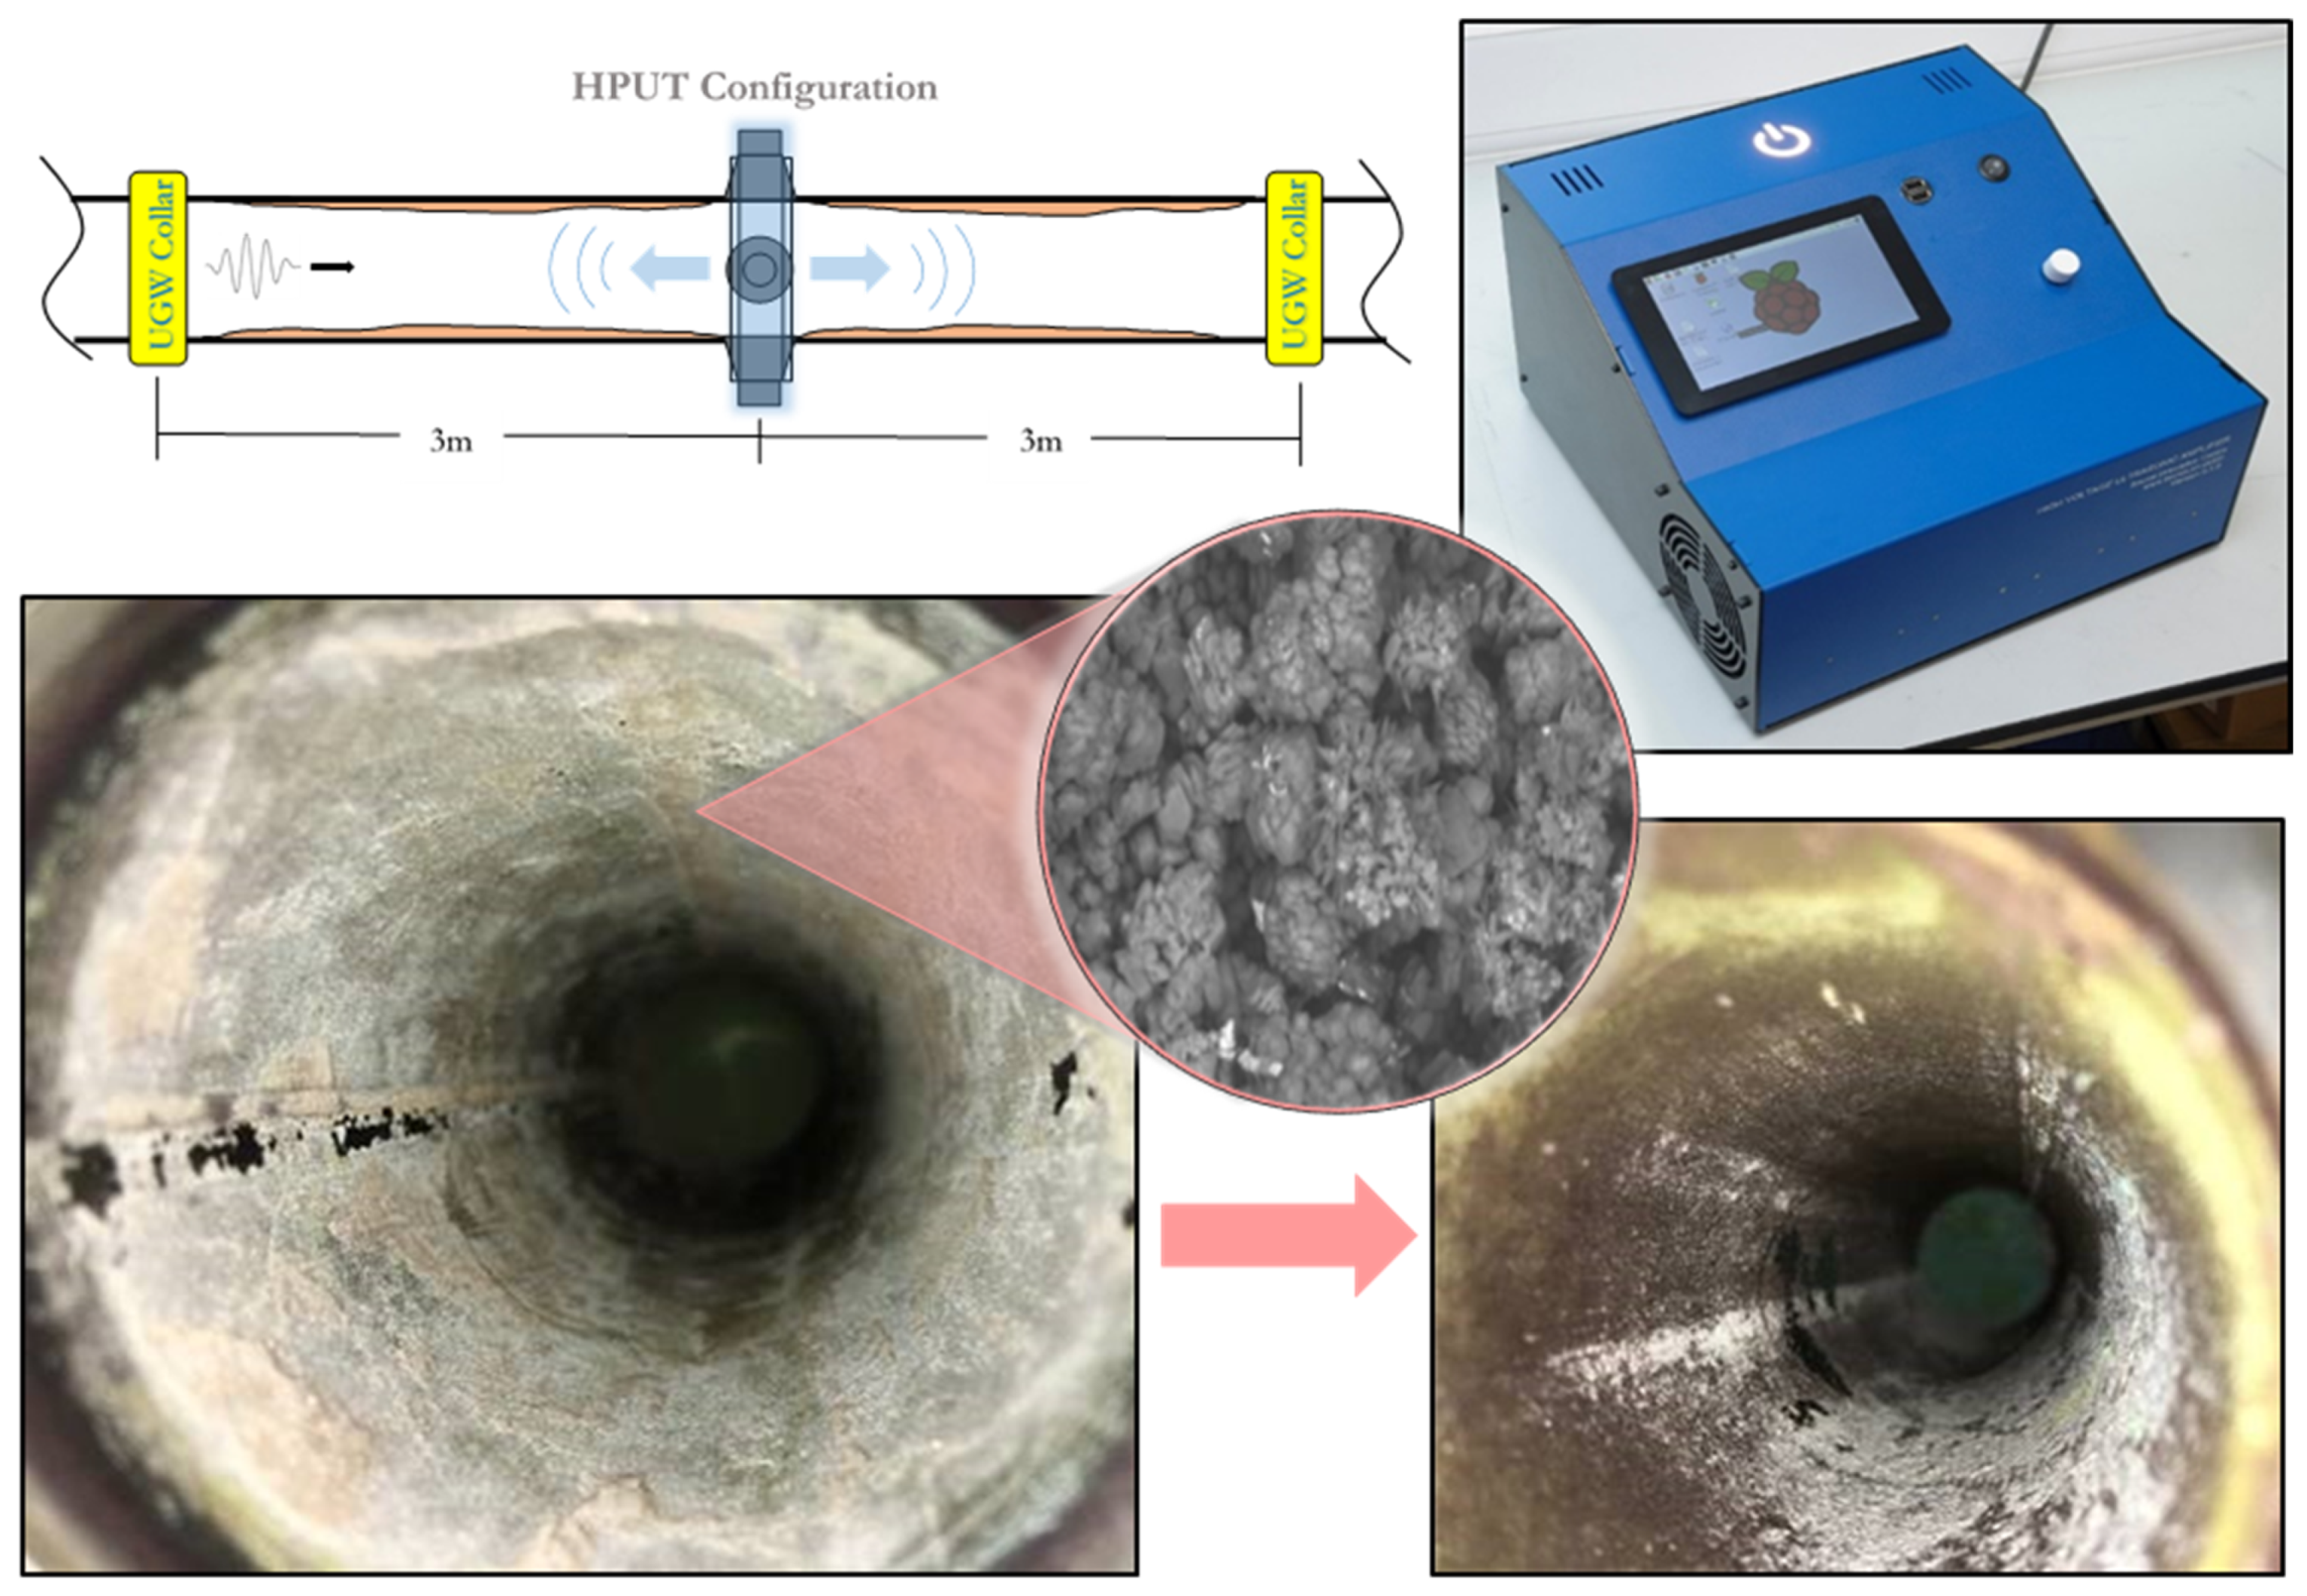
The Ultrasonic Guided Wave (UGW) collars are configured for pitch-catch, where one collar excites a discrete pulse and the second collar receives the signal. This signal is monitored where the variation in signal amplitude varies with the increase of fouling accumulation and reduction in fouling due to cleaning. The UGW collars are placed on each side of the HPUT collar as shown in Figure 21.
7. Conclusions and Further Work
This study discusses the development and marinization technique for the selected 40 kHz cleaning transducers. The effects of marinization are characterized using impedance and undergo an investigation of its wave propagation capabilities across a fouled 6.2 m long, Schedule 40, 6-inch diameter carbon steel pipe. This study has shown that the addition of marinized material dampens the vibrational output from the HPUT configuration. This reduction in vibration is most significant when the structure is filled with water, resulting in a marinized HPUT configuration dropping by up to 85% and a non-marinized HPUT configuration dropping by up to 80%. This 5% difference shows that cleaning capabilities can be achieved on a subsea pipeline but further optimization can be done to account for the vibrational loss.
Underwater Demonstration
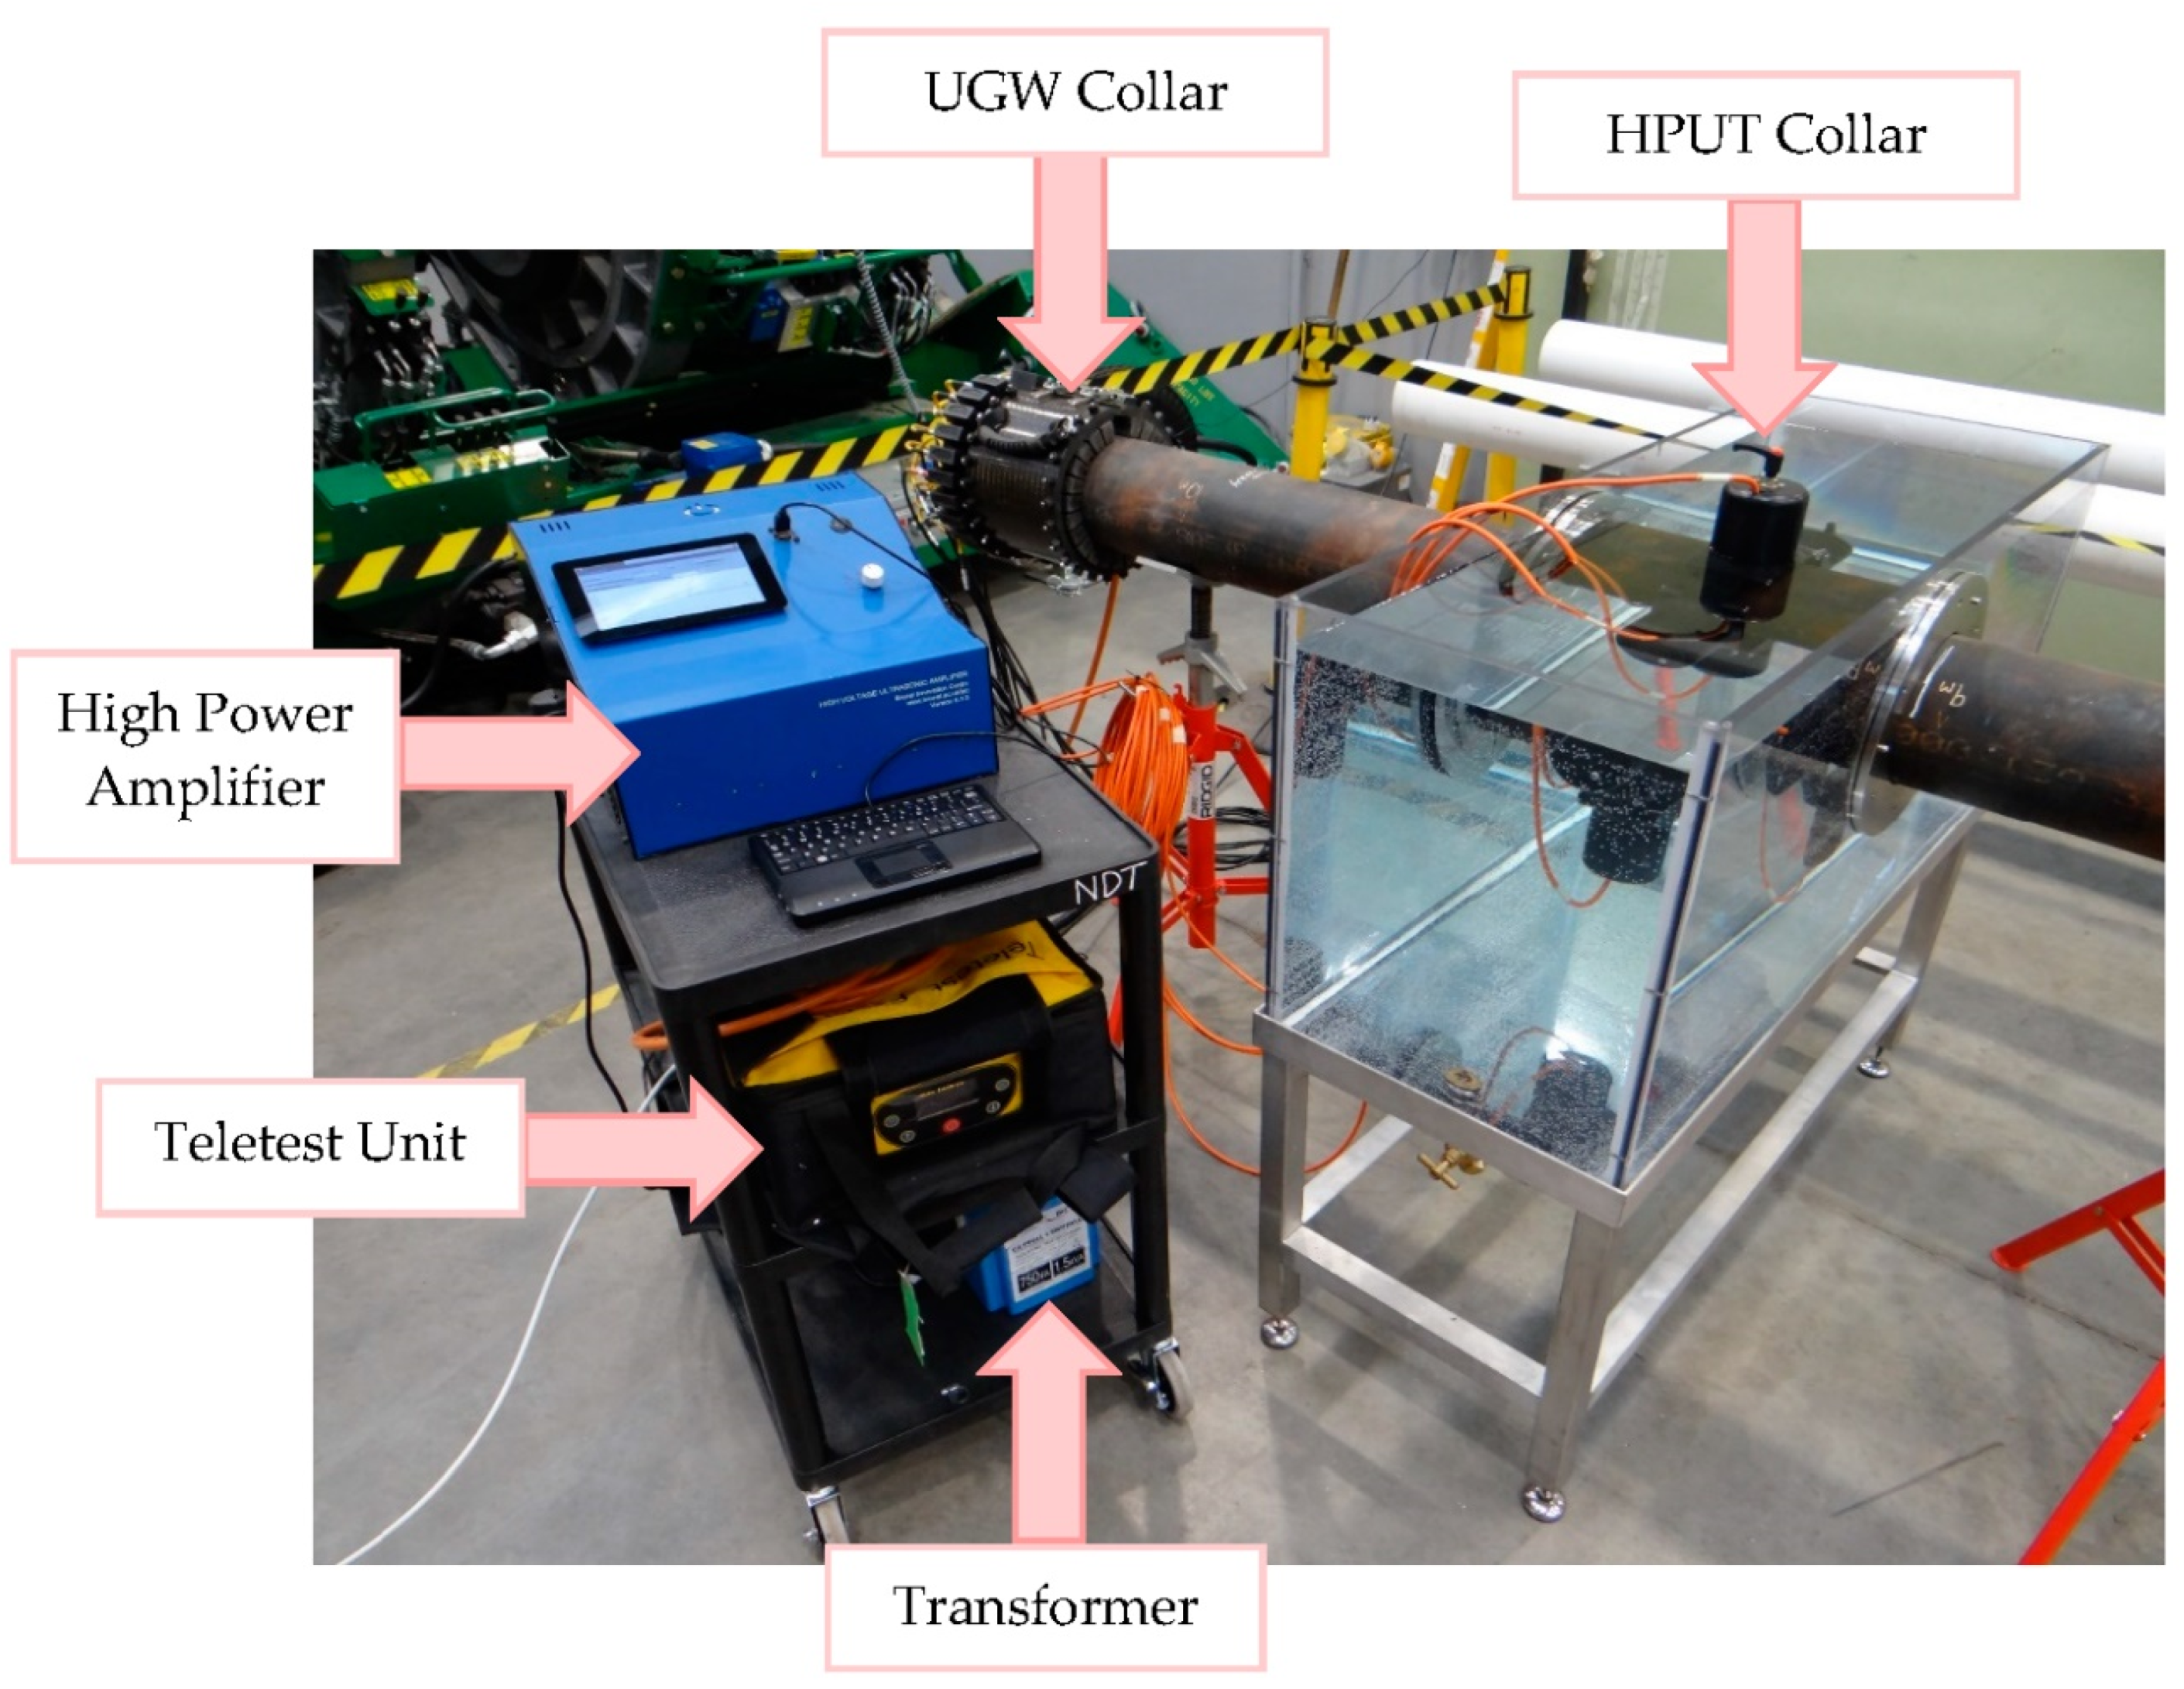
The demonstration tank consists of a sample 2.5 m long, Schedule 40, 6-inch diameter carbon steel pipe which is placed through a tank enclosure as shown in Figure 22. The tank is supported by a steel frame and the pipe is supported by two pipe supports. The section of the pipe which is encapsulated by the tank is sealed using O rings and vacuum lubrication. The pipe ends are closed using flanges where one end includes a valve to allow water to be filled within the pipe. The tank consists of a tap at the bottom panel to allow the water to be drained out.
With the completion of the tank assembly, the HPUT collar is placed underwater as shown in Figure 23. Due to the length of the pipe, a single UGW collar is placed at a pipe end outside of the tank for pulse-echo configuration. The power amplifier hardware is used to drive the marinized HPUTs, and the Teletest unit [23] is used to pressurize the UGW collar and monitor the pipe.
The development of a testing tank can be utilized for further characterization and optimization of the ultrasonic cleaning technique for underwater applications. Examples of improvement include the modification of the cleaning transducers by material selection, addition of a sonotrode, and improvement of the ultrasonic cleaning system hardware to drive the transducer excitation.
Author Contributions
H.L. is the lead author and main contributor to the paper. She conducted the experimental investigation and has written the original draft of the manuscript and carried out the literature review and formal analysis of the data collected. P.S.L. has contributed to the conceptualization to carry out this investigation as well as supervision of the research, project management and coordination of the research activity, visualization of the manuscript and, furthermore, contributed toward reviewing and editing the original manuscript. L.C.W. has contributed plenty as the academic supervisor of the PhD research, also contributing toward funding acquisition and further reviewing and editing of the original paper. T.-H.G. has contributed by supervision of the PhD research, reviewing of the original paper, and also acquiring funding to carry out the current investigation.
Funding
This research was funded by Innovate UK, grant number 102491.
Acknowledgments
The authors would like to give their appreciation to Makis Livadas and Adrian Waka of Brunel University London for their contributions toward this work.
Conflicts of Interest
The authors declare no conflict of interest.
References
- Creation of Stable and Transient Cavitation Bubbles. Available online: https://www.hielscher.com/wp-content/uploads/stable-transient-cavitation-Santos-et-al.-2009-opt.png (accessed on 25 January 2018).
- van der Werff, A.; BV, B.N. The Importance of Pipeline Cleaning: Risks, Gains, Benefits, Peace of Mind. In Proceedings of the Pipeline Technology Conference, Hannover, Germany, 25 April 2006. [Google Scholar]
- Standard Decommissioning Programme(s) Template. Available online: https://assets.publishing.service.gov.uk/government/uploads/system/uploads/attachment_data/file/760561/Non_Derogation_Decommissioning_Programme_Template_-_November_2018.pdf (accessed on 6 February 2019).
- UKCS Decommissioning 2018 Cost Estimate. Available online: https://www.ogauthority.co.uk/media/4999/decommissioning-a5-2018-pdf-version.pdf (accessed on 6 February 2019).
- Ilman, M. Kusmono. Analysis of internal corrosion in subsea oil pipeline. Case Stud. Eng. Fail. Anal. 2014, 2, 1–8. [Google Scholar] [CrossRef]
- Tawancy, H.; Al-Hadhrami, L.M.; Al-Yousef, F. Analysis of corroded elbow section of carbon steel piping system of an oil-gas separator vessel. Case Stud. Eng. Fail. Anal. 2013, 1, 6–14. [Google Scholar] [CrossRef]
- Li, S.; Grifoll, M.; Estrada, M.; Zheng, P.; Feng, H. Optimization on emergency materials dispatching considering the characteristics of integrated emergency response for large-scale marine oil spills. J. Mar. Sci. Eng. 2019, 7, 214. [Google Scholar] [CrossRef]
- Glater, J.; York, J.L.; Campbell, K.S. Scale Formation and Prevention; Academic Press: Cambridge, MA, USA, 1980; Volume 627. [Google Scholar]
- Tai, C.Y.; Chang, M.-C.; Shieh, R.-J.; Chen, T.G. Magnetic effects on crystal growth rate of calcite in a constant-composition environment. J. Cryst. Growth 2008, 310, 3690–3697. [Google Scholar] [CrossRef]
- Schoenbach, K.H.; Alden, R.W.; Fox, T.J. Biofouling prevention with pulsed electric fields. In Proceedings of the 1996 International Power Modulator Symposium, Boca Raton, FL, USA, 25–27 June 1996; pp. 75–78. [Google Scholar]
- Lais, H.; Lowe, P.; Gan, T.-H.; Wrobel, L.; Kanfoud, J. Characterization of the use of low frequency ultrasonic guided waves to detect fouling deposition in pipelines. Sensors 2018, 18, 2122. [Google Scholar] [CrossRef] [PubMed]
- Ocean Team Group, as. Available online:. Available online: http://www.oceanteam.eu/ (accessed on 14 March 2017).
- Lais, H.; Lowe, P.S.; Kanfoud, J.; Gan, T.-H. Application of High Power Ultrasonics for Fouling Removal in Submerged Structures. In Proceedings of the IEEE/MTS OCEANS 17 Conference, Aberdeen, UK, 19–22 June 2017. [Google Scholar]
- Lais, H.; Lowe, P.S.; Gan, T.-H.; Wrobel, L.C. Numerical modelling of acoustic pressure fields to optimize the ultrasonic cleaning technique for cylinders. Ultrason. Sonochem. 2018, 45, 7–16. [Google Scholar] [CrossRef] [PubMed]
- Lais, H.; Lowe, P.; Kanfoud, J.; Gan, T.-H. Advancements in fouling removal using high power ultrasonics for industrial applications. In Proceedings of the IEEE International Conference on Industrial and Information Systems (ICIIS), Peradeniya, Sri Lanka, 15–16 December 2017; pp. 1–6. [Google Scholar]
- Lais, H.; Lowe, P.S.; Gan, T.-H.; Wrobel, L.C. Numerical investigation of design parameters for optimization of the in-situ ultrasonic fouling removal technique for pipelines. Ultrason. Sonochem. 2019, 56, 94–104. [Google Scholar] [CrossRef] [PubMed]
- STS Defence. Available online: https://www.sts-defence.com/ (accessed on 7 August 2019).
- 4294A Precision Impedance Analyzer. Available online: https://www.keysight.com/gb/en/home.html (accessed on 18 May 2019).
- Brunel Innovation Centre. Available online: https://www.brunel.ac.uk/bic (accessed on 4 August 2019).
- InnoTecUK. Available online: https://www.innotecuk.com (accessed on 4 August 2019).
- Polytec CLV-3D Laser Vibrometer. Available online: https://www.polytec.com/uk/ (accessed on 18 May 2019).
- ESSAR. Available online: https://www.essar.com/ (accessed on 4 August 2019).
- Teletest Focus+. Available online: https://www.teletestndt.com/focus-guided-wave-inspection/ (accessed on 4 August 2019).
Figure 1.
Example of cable connection to High-Power Ultrasonic Transducer (HPUT) using a male BNC test lead cable.
Figure 1.
Example of cable connection to High-Power Ultrasonic Transducer (HPUT) using a male BNC test lead cable.

Figure 2.
Technical drawing of 3D-printed housing to encapsulate the 40 kHz HPUT.

Figure 3.
Cross-section of marinized RG58 cable.

Figure 4.
Impedance characterization of 40 kHz HPUT before and after marinization.

Figure 5.
Power electronics system schematic.

Figure 6.
Bespoke High-Power Amplifier.

Figure 7.
Flow diagram of the software operation.

Figure 8.
Wave generator—graphical user interface (GUI).

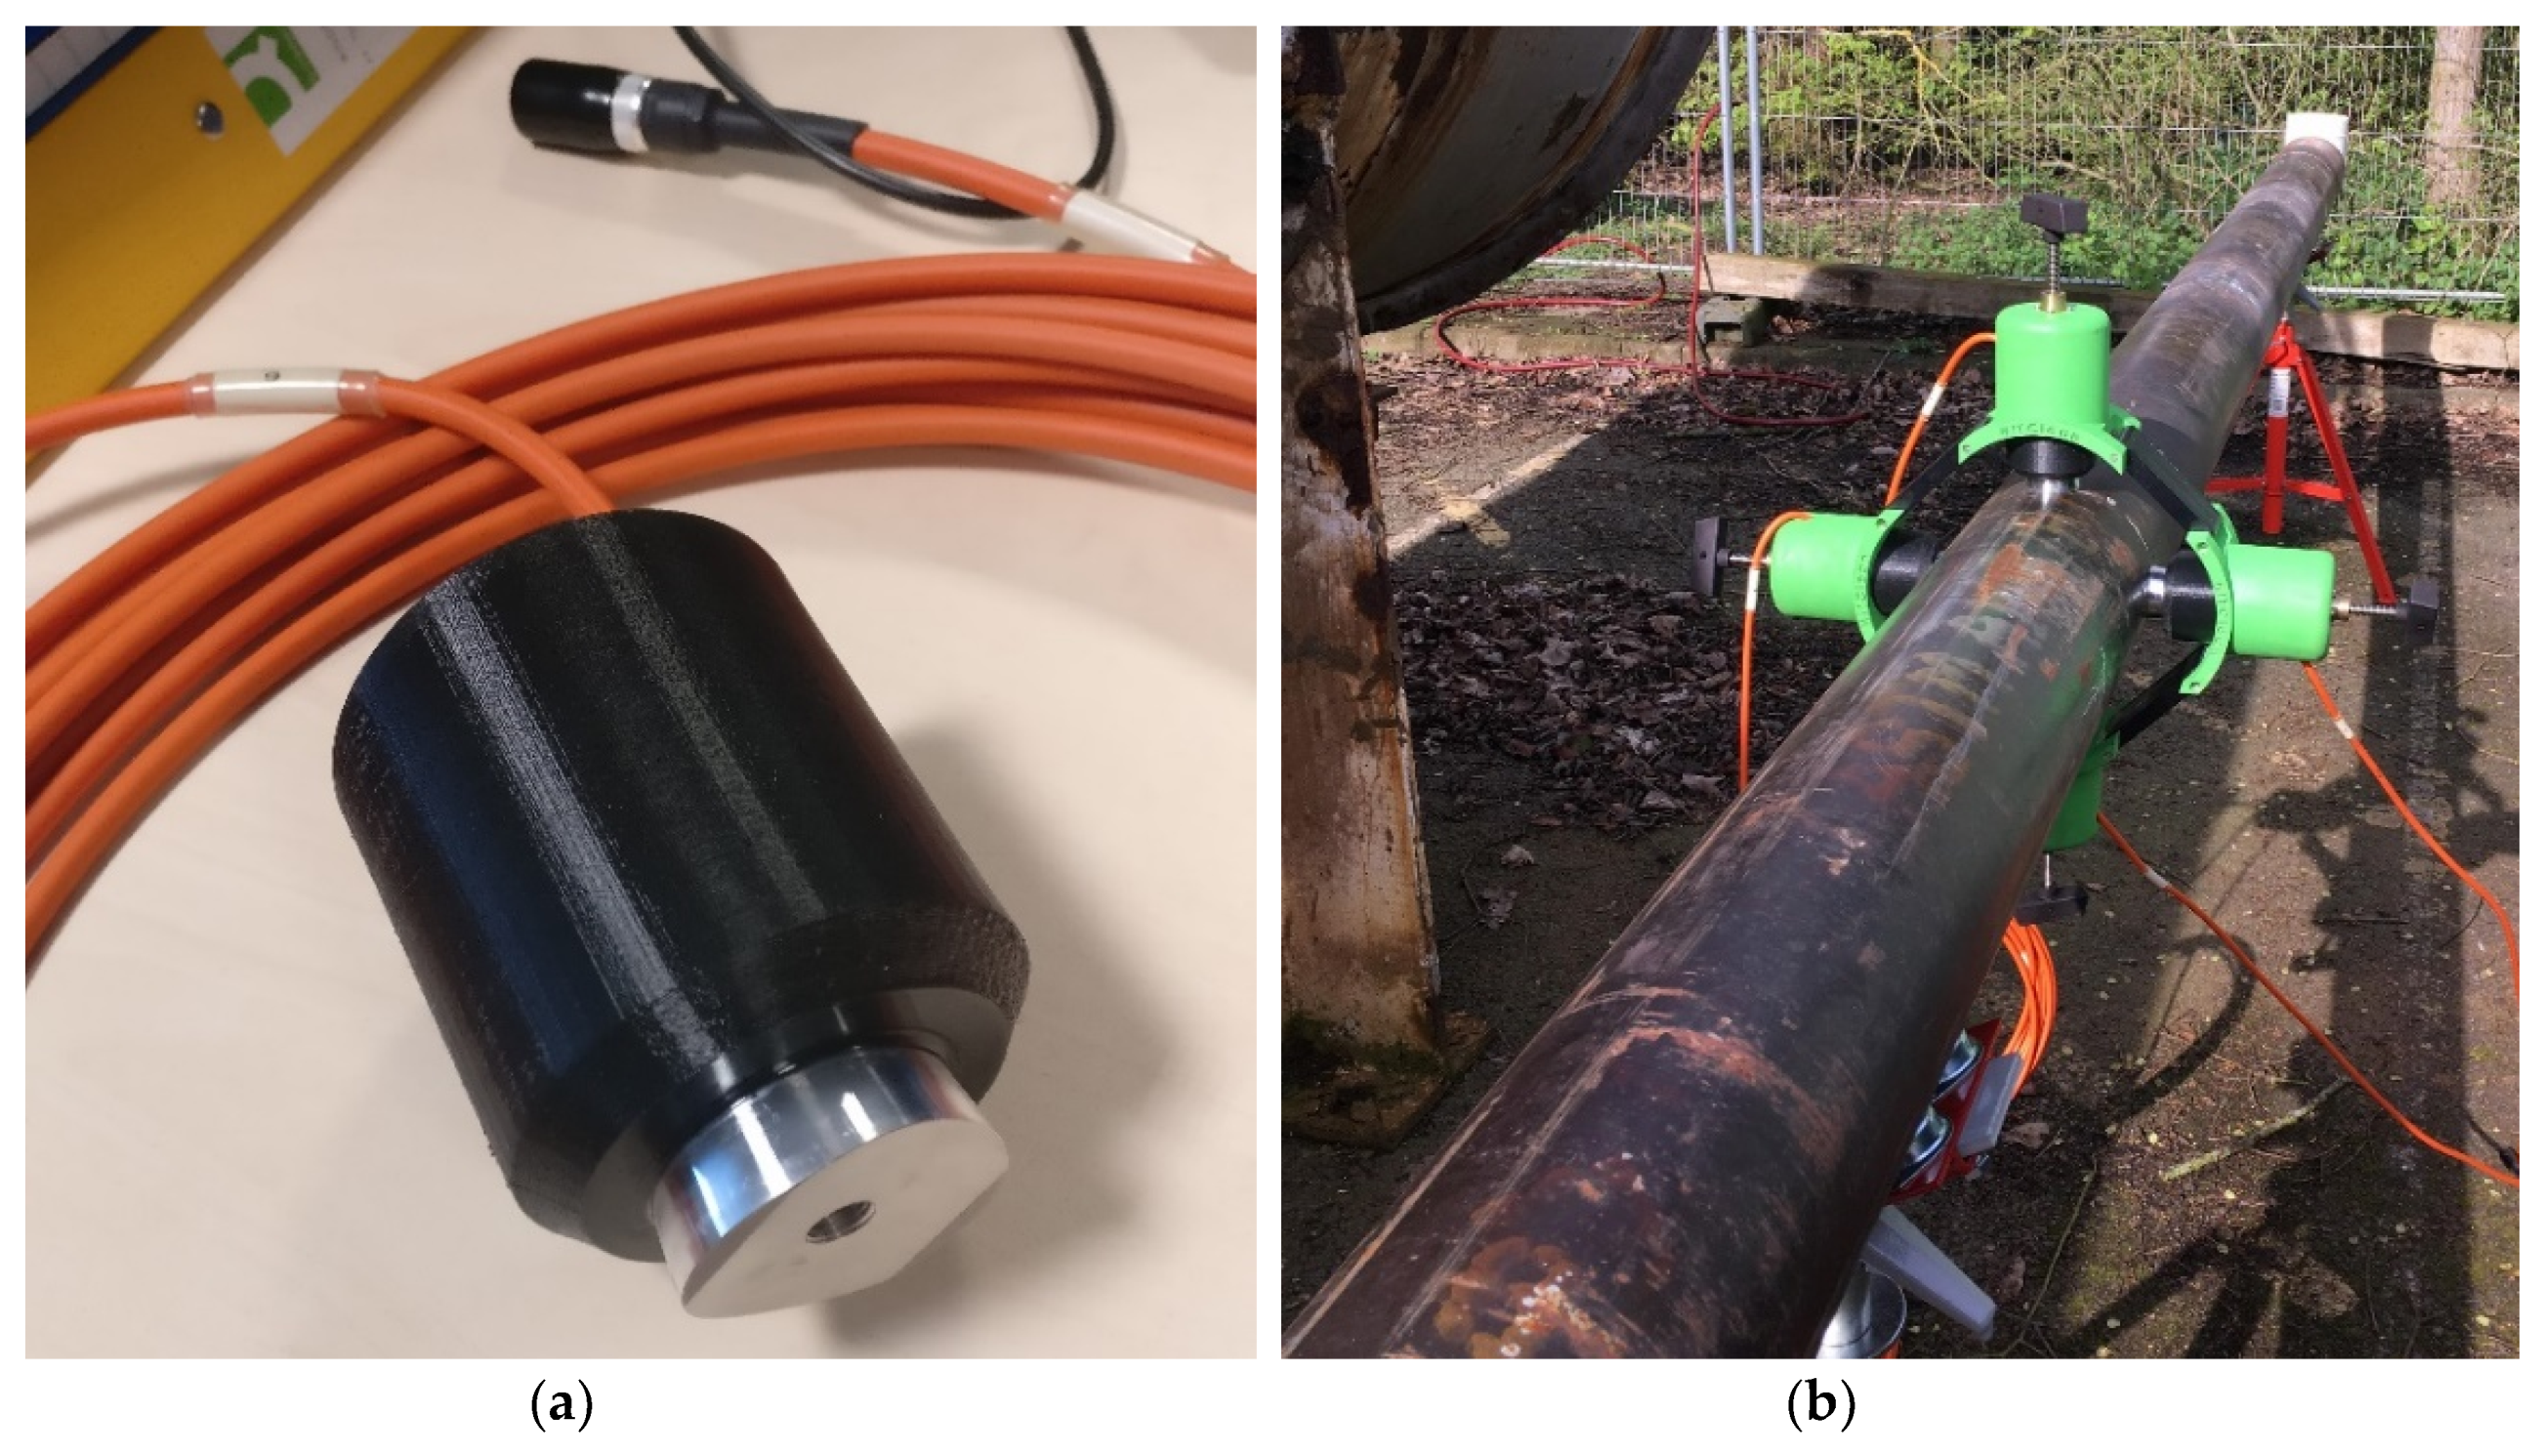
Figure 9.
(a) Marinized HPUT with marinized cabling and (b) marinized HPUTs placed into prototype HPUT collar to commence laboratory investigations.
Figure 9.
(a) Marinized HPUT with marinized cabling and (b) marinized HPUTs placed into prototype HPUT collar to commence laboratory investigations.

Figure 10.
Examples of fouling removal results displaying an increase in material dislodged into the water after one cycle of cleaning.
Figure 10.
Examples of fouling removal results displaying an increase in material dislodged into the water after one cycle of cleaning.

Figure 11.
HPUT Collar CAD (left) and placed onto 6-inch pipe (right).

Figure 12.
Point data along the length of pipe using Polytec CLV-3D Laser Vibrometer.

Figure 13.
Performance of marinized configuration in air.

Figure 14.
Performance of non-marinized configuration in air.

Figure 15.
Performance of marinized configuration in water.

Figure 16.
Performance of non-marinized configuration in water.

Figure 17.
Schematic of U-shaped pipe specimen.

Figure 18.
(a) U-shaped pipe set-up for fouling removal and (b) attachment of HPUT.

Figure 19.
Before and after image of the inner wall of the U-shaped pipe.

Figure 20.
Integrated system architecture.

Figure 21.
Integrated system schematic, displaying cleaning results after a cycle of fouling removal.
Figure 21.
Integrated system schematic, displaying cleaning results after a cycle of fouling removal.

Figure 22.
Assembly of the integrated system demonstration tank.

Figure 23.
Final set-up of ultrasonic cleaning and Ultrasonic Guided Wave detection demonstration tank.
Figure 23.
Final set-up of ultrasonic cleaning and Ultrasonic Guided Wave detection demonstration tank.


Table 1.
Material properties of polyurethane used for marinization of the HPUT.
| Test | Result |
|---|---|
| Flammability | Not flame retardant |
| Volume Resistivity | 13–1510 ohm.cm |
| Surface Resistivity | 12.5–14.510 ohm.cm |
| Dielectric Constant | 3.1 |
| Breakdown Voltage | 20 KV/mm |
| Hardness | 70 Shore A |
| Tensile Strength | 3–4 MPa |
| Operating Temperature | −55 to 130 °C (application and geometry dependent) |
| Elongation at Break | 200% |
Table 2.
Component and material description of marinized RG58 cable.
| # | Component | Material |
|---|---|---|
| 1 | Central Conductor | Tinned Copper |
| 2 | Dielectric | Solid Polyethylene |
| 3 | Outer Conductor | Tinned Copper Wire Braid |
| 4 | Inner Jacket | PVC TM2 |
| 5 | Outer Jacket | Polyurethane |
Table 3.
HPUT marinization requirements.
| Specimen | Quantity | Marinized Cabling | HPUT Marinization | 3D Printed Housing |
|---|---|---|---|---|
| 40 kHz HPUT | 4 | Connection from electrode plates to male BNC. Length of 10 m | Putty to cover electrodes and cabling—metal front mass of HPUT does not require marinization | HPUT housing to surround putty to be 80 mm in outer diameter |
Table 4.
Final hardware system requirements and features.
| Feature | Specification | Prototype |
|---|---|---|
| Powered by | Mains | Mains |
| Voltage, V | 240 | 100–300 V |
| Dimensions (L × W × H), cm | 50 × 30 × 20 | 37 × 36 × 23 |
| Weight of the system, Kg | <10 Kgs | 1.5 Kgs |
| Number of channels | 4 | 8 |
| Inputs signal generators | 4 | 2 individual signal generators |
| Powered by | Mains | Mains |
Table 5.
Power ultrasonic software requirements.
| Feature | Prototype |
|---|---|
| Capabilities of the software, i.e., change the parameters based on the modeling results |
|
| Capability of driving the hardware | Yes |
| Level of user-friendliness | Basic (knowledge of ultrasonic cleaning process) |
| Data acquisition capabilities | Yes |
| Data storage | Yes—laptop |
| Reporting capabilities | Desirable |
Table 6.
Ultrasonic cleaning limiting parameters and further suggestions for optimization.
| Parameter | Limitation | Performance Optimization |
|---|---|---|
| Fouling Thickness | Takes longer to breakdown fouling layer | Optimize cleaning time to account structural constraints. This will increase the cleaning time duration and may require wave input optimization to account for attenuation. |
| Pipe Wall Thickness | Reduction of delivery of power into liquid | |
| Structural Coating | Attenuation power delivery from HPUT into the metallic structure | |
| High-Power Amplifier Hardware | Power delivery into HPUT to compensate for power loss due to pipe thickness and coating | Improve power output and optimize wave generation, i.e., square wave |
© 2019 by the authors. Licensee MDPI, Basel, Switzerland. This article is an open access article distributed under the terms and conditions of the Creative Commons Attribution (CC BY) license (http://creativecommons.org/licenses/by/4.0/).
Share and Cite
MDPI and ACS Style
Lais, H.; Lowe, P.S.; Wrobel, L.C.; Gan, T.-H. Ultrasonic Transducer Array Performance for Improved Cleaning of Pipelines in Marine and Freshwater Applications. Appl. Sci. 2019, 9, 4353. https://doi.org/10.3390/app9204353
AMA Style
Lais H, Lowe PS, Wrobel LC, Gan T-H. Ultrasonic Transducer Array Performance for Improved Cleaning of Pipelines in Marine and Freshwater Applications. Applied Sciences. 2019; 9(20):4353. https://doi.org/10.3390/app9204353
Chicago/Turabian StyleLais, Habiba, Premesh S. Lowe, Luiz C. Wrobel, and Tat-Hean Gan. 2019. "Ultrasonic Transducer Array Performance for Improved Cleaning of Pipelines in Marine and Freshwater Applications" Applied Sciences 9, no. 20: 4353. https://doi.org/10.3390/app9204353
Note that from the first issue of 2016, this journal uses article numbers instead of page numbers. See further details here.