On the Precipitation and Precipitation Change in Alaska


Alaska Climate Research Center, University of Alaska Fairbanks, 2158 N Koyukuk St., Fairbanks, AK 99709, USA
*
Author to whom correspondence should be addressed.
Atmosphere 2017, 8(12), 253; https://doi.org/10.3390/atmos8120253
Submission received: 21 September 2017
/
Revised: 9 December 2017
/
Accepted: 12 December 2017
/
Published: 15 December 2017
(This article belongs to the Special Issue Global Precipitation with Climate Change)
Abstract
:Alaska observes very large differences in precipitation throughout the state; southeast Alaska experiences consistently wet conditions, while northern Arctic Alaska observes very dry conditions. The maximum mean annual precipitation of 5727 mm is observed in the southeastern panhandle at Little Port Arthur, while the minimum of 92 mm occurs on the North Slope at Kuparuk. Besides explaining these large differences due to geographic and orographic location, we discuss the changes in precipitation with time. Analyzing the 18 first-order National Weather Service stations, we found that the total average precipitation in the state increased by 17% over the last 67 years. The observed changes in precipitation are furthermore discussed as a function of the observed temperature increase of 2.1 °C, the mean temperature change of the 18 stations over the same period. This observed warming of Alaska is about three times the magnitude of the mean global warming and allows the air to hold more water vapor. Furthermore, we discuss the effect of the Pacific Decadal Oscillation (PDO), which has a strong influence on both the temperature and precipitation in Alaska.
1. Introduction and Background
Climate observations in Alaska go back to the period when Alaska was part of the Russian Empire. Russians established an observatory in 1827 on Baranof Island, Sitka [1,2,3]. After the sale of Alaska to the USA in 1867, Abbe [4] was the first to attempt to describe the climate of Alaska in 1906. However, the data sources were sparse and often limited to activities regarding gold mining, fur trapping, and whaling. With more data becoming available, Day [5], Searby [6], and Shulski & Wendler [7] improved the overview of Alaska’s climate with more complete climatological data sets.
At 1.477 million km2, Alaska is the largest state of the Union and has a greatly varied climate. The land north of the Brooks Range is commonly called the ‘North Slope’, where the warmest month is below 10 °C, tree growth is not possible, the mean annual temperature is below 0 °C, and the ground is frozen year-round (permafrost). Due to the cold temperatures that make the air less able to hold moisture, precipitation is low.
Numerous climatological studies have been carried out in Utqiaġvik (formerly known as Barrow), the most northern point in North America [8,9,10,11]. These measurements were frequently carried out with support from the Naval Arctic Research Laboratory in Utqiaġvik, as well as several Distant Early Warning Line (DEW Line) stations that were established in northern Alaska in the early 1950s. Furthermore, the Atmospheric Radiation Measurement (ARM) Climate Research Facility in Utqiaġvik has been operating a suite of instruments collecting cloud, radiation, and numerous other meteorological data since 1997 [12].
While temperature measurements from Utqiaġvik were typically of good quality, precipitation measurements were normally underreported especially during the cold season, as first pointed out by Black [13]. This problem is caused by low amounts of mostly snow precipitation; standard rain gauges do not collect all the snow, as the high wind speeds in northern Alaska cause snow to be blown about.
In interior Alaska, the area between the Alaska Range and the Brooks Range, wind speeds are low, and the climate is continental, experiencing relatively warm summers, but cold winters. Both the highest and lowest statewide temperatures were observed in the Interior. The maximum of 37.7 °C was observed in Fort Yukon, a few miles north of the Arctic Circle [6]. The Alaska Range shelters the Interior from large amounts of precipitation, as moist air traveling from the south loses most of its moisture when crossing this mountain range. There is over a century’s worth of climatological data for the interior, with the city of Fairbanks having the longest time series [7].
The southern part of Alaska has a more maritime climate that is strongly influenced by the Pacific Ocean. There are modest temperature changes over the seasons: winters are relatively warm, summers are cool, and precipitation is plentiful. This is especially the case in southeastern Alaska. Because of these cool and moist conditions, glaciers are most common in the coastal areas of southern Alaska, calving in part into the ocean. The most visited of these glaciers are found in the Glacier Bay National Park close to Juneau. One might expect to find more glaciers when traveling north to colder climates; however, for Alaska, this is not the case. There are only a few small glaciers in the Brooks Range due to the relatively small snow accumulation rates [14].
Sitka, the old Russian capital, is the only station where systematic observations go back to before 1867 when the USA purchased Alaska from the Russians. Some early observations were made in the Aleutian Islands, but these were sporadic and not helpful for systematic climate investigations. Systematic climate observations did not take place until southern Alaska was majorly settled by workers of the fishing industry. For example, Anchorage, Alaska’s largest city, was only established in 1914, at which time Fairbanks was already a thriving city.
In the following section, we present more recent efforts to understand the climate of Alaska and our analysis of precipitation change observed from first-order weather stations over the past 67 years. Section 3 relates the observed climate changes to the Pacific Decadal Oscillation.
2. Climate Data Analysis
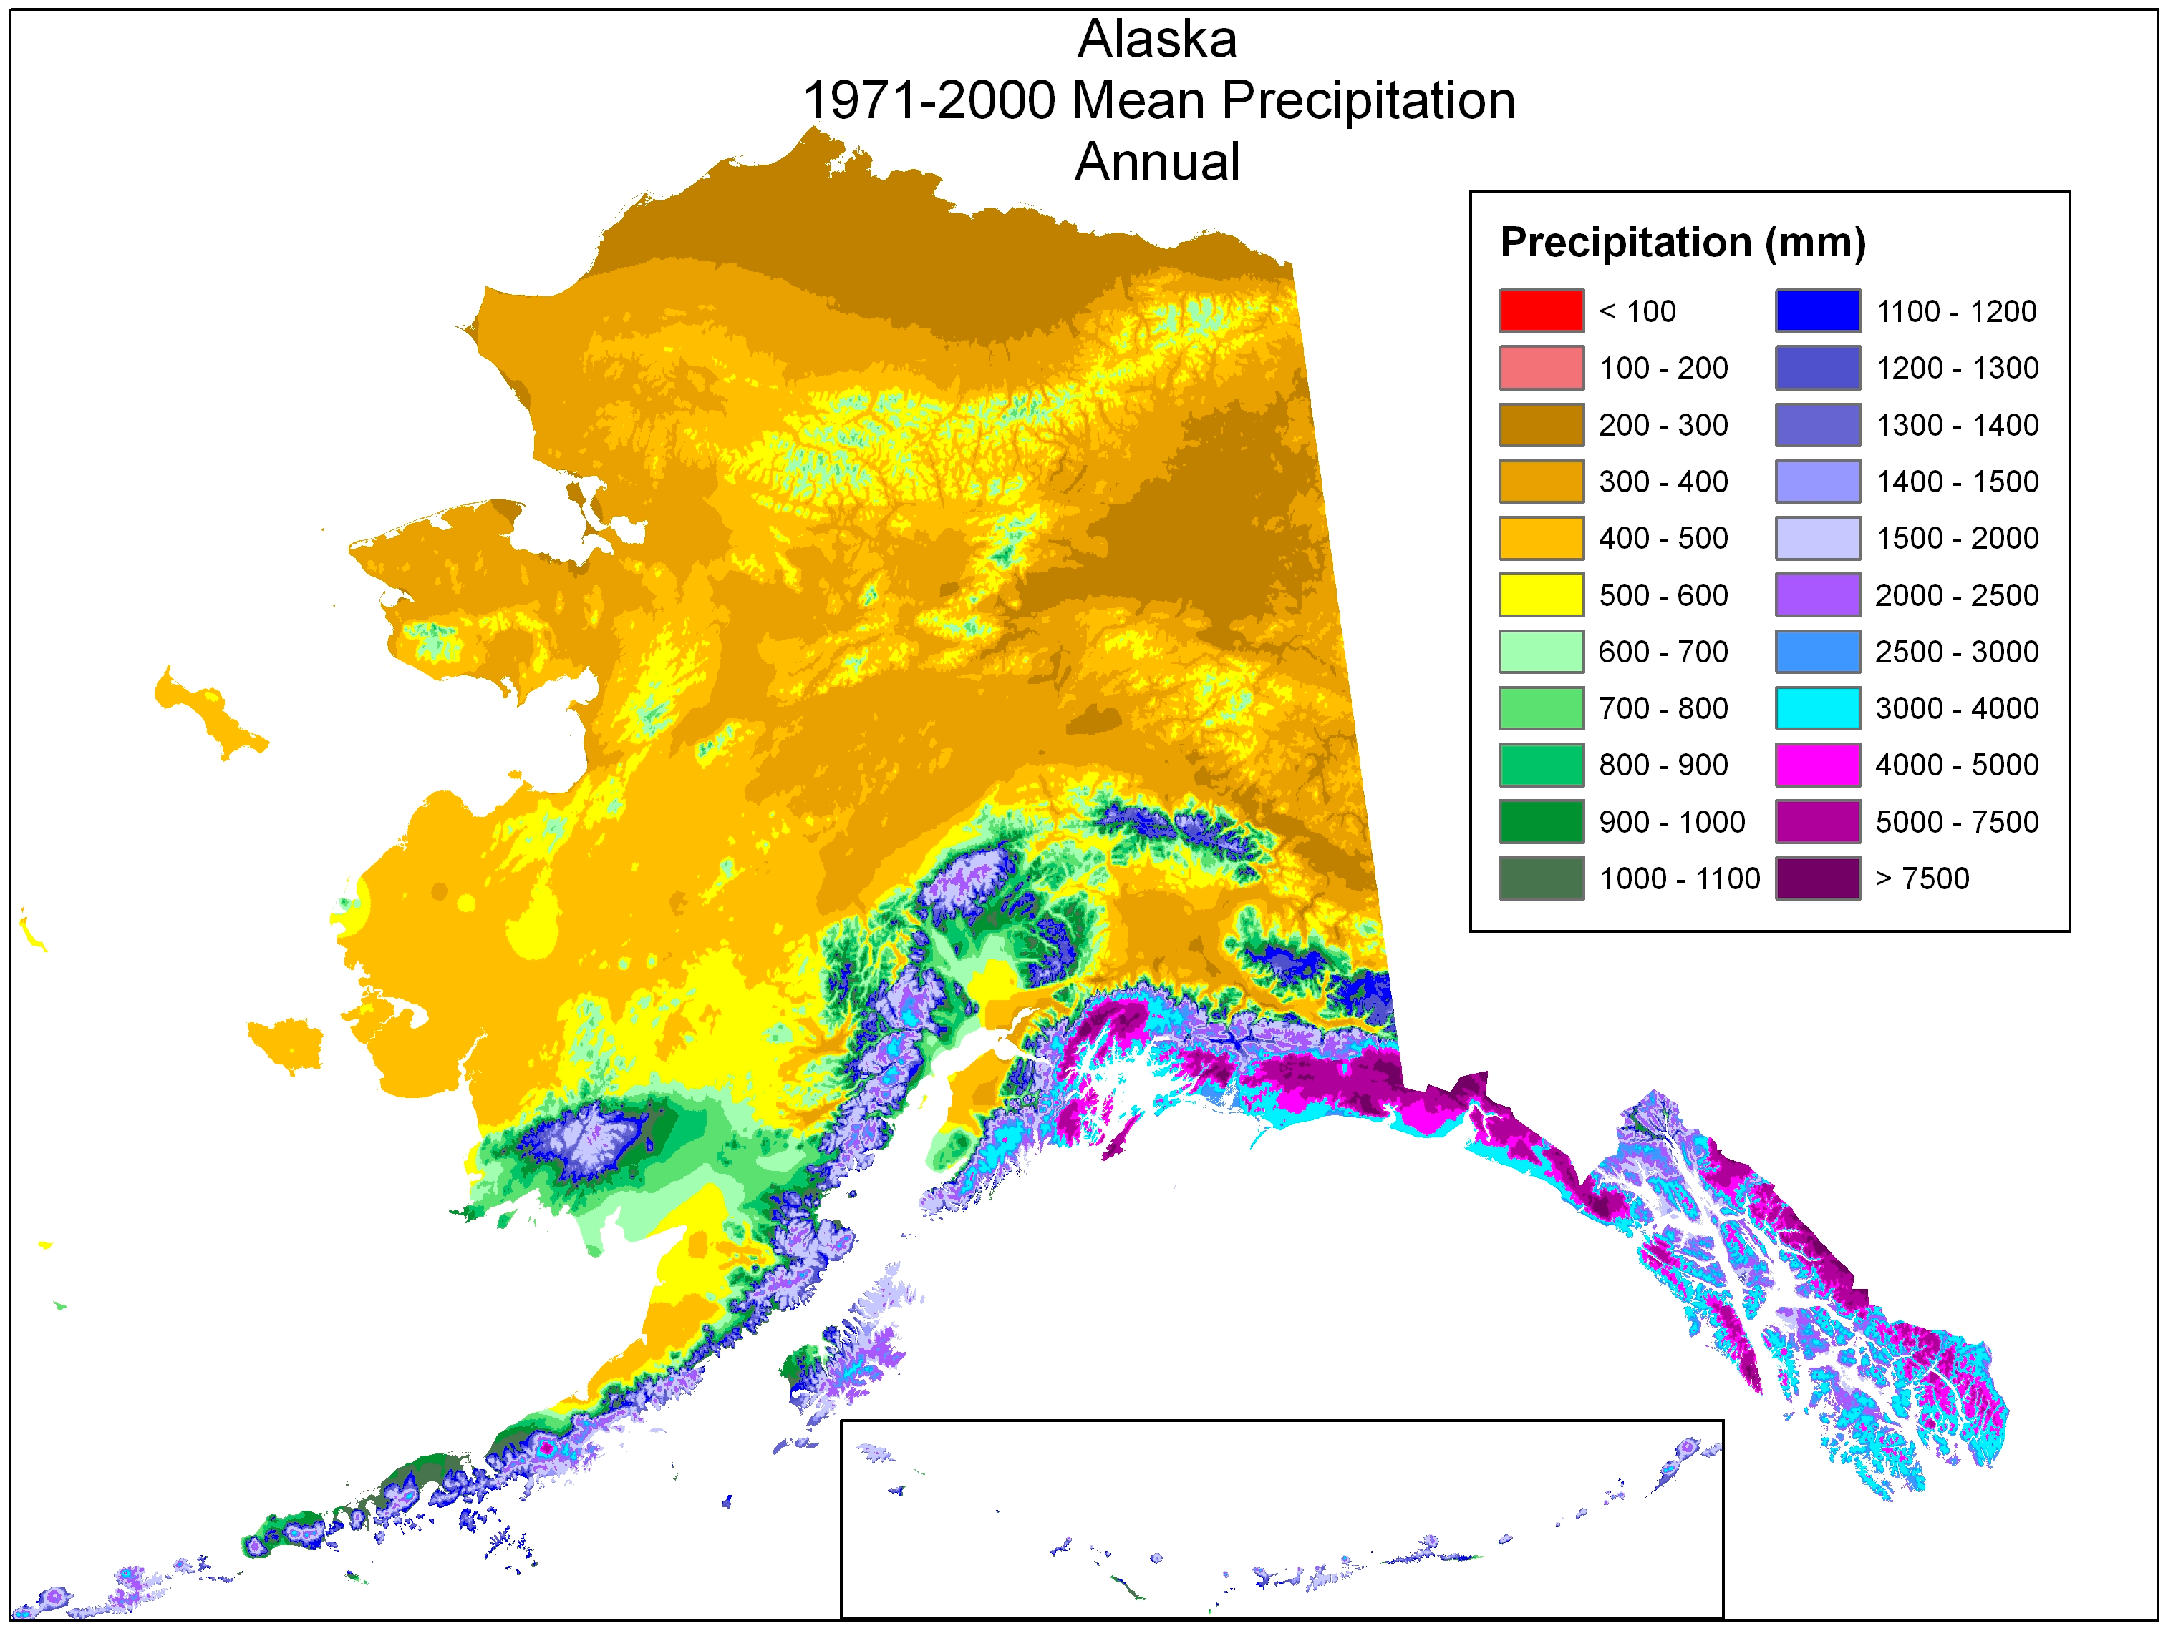
At the end of every decade, the National Climate Data Center of NOAA calculates the mean climatic values for all stations for the last three decadal time periods. These values, from which deviations are calculated, are frequently called ‘normals’. Normals are not constant and can change, at least slightly, by the end of every decade. The normals for the climate period of 1971–2000 form the basis of the precipitation map of Alaska presented in Figure 1.
Figure 1 is a map of mean annual precipitation built from PRISM model data. The PRISM model is based on meteorological measurements that are modified with consideration of altitude, slope angle, and slope direction. This precipitation map clearly displays the large differences in the amount of precipitation from southeastern Alaska to the North Slope. Further, the maxima in precipitation occur on the southern slopes of the Coastal Range, and to a lesser extent, on the Alaska Range, where air is forced to rise with southerly flow.
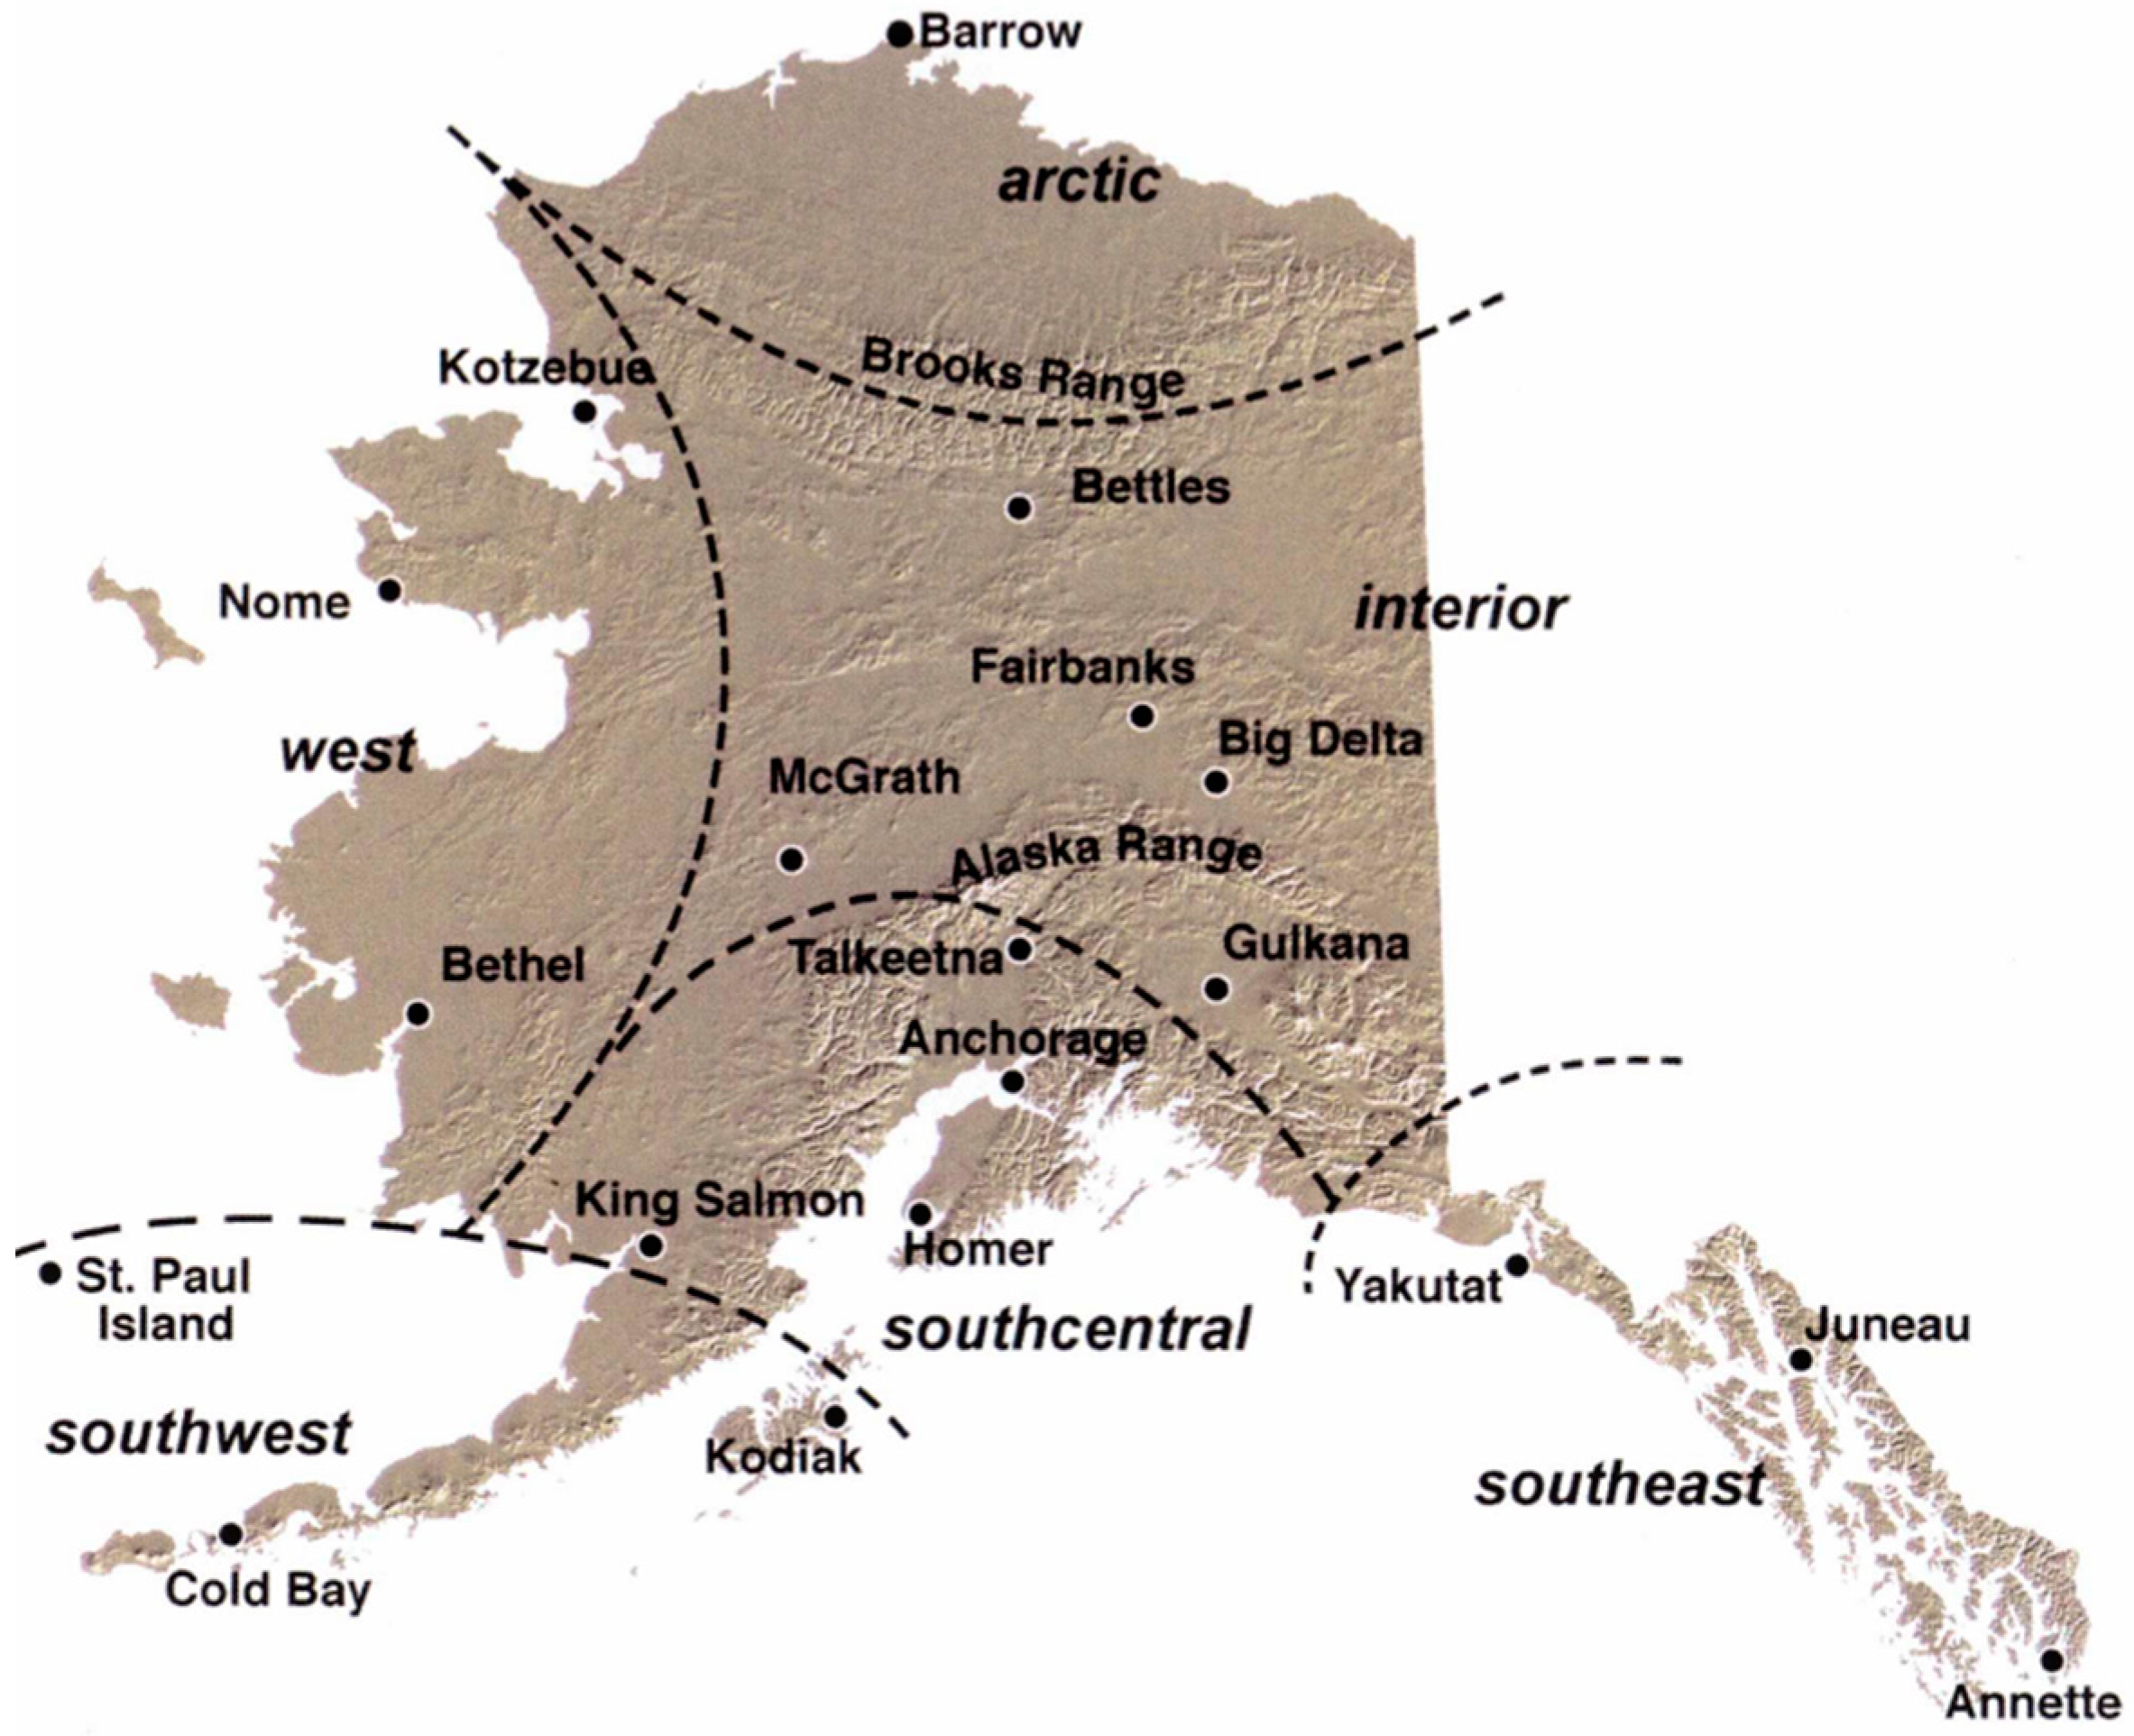
In our analysis of the precipitation changes in Alaska, we used data from first-order meteorological stations. A first-order weather station is a site at which National Weather Service employees or other certified personnel have taken scheduled weather observations. There are 19 of these stations in Alaska, 18 of which have coverage for the whole period of 1949–2016. The first-order station locations, as well as an outline of the state’s major climatic zones as originally developed by Köppen in 1884, are presented in Figure 2 [15,16]. In our analysis, we assign statistical significance at the 95% confidence level.
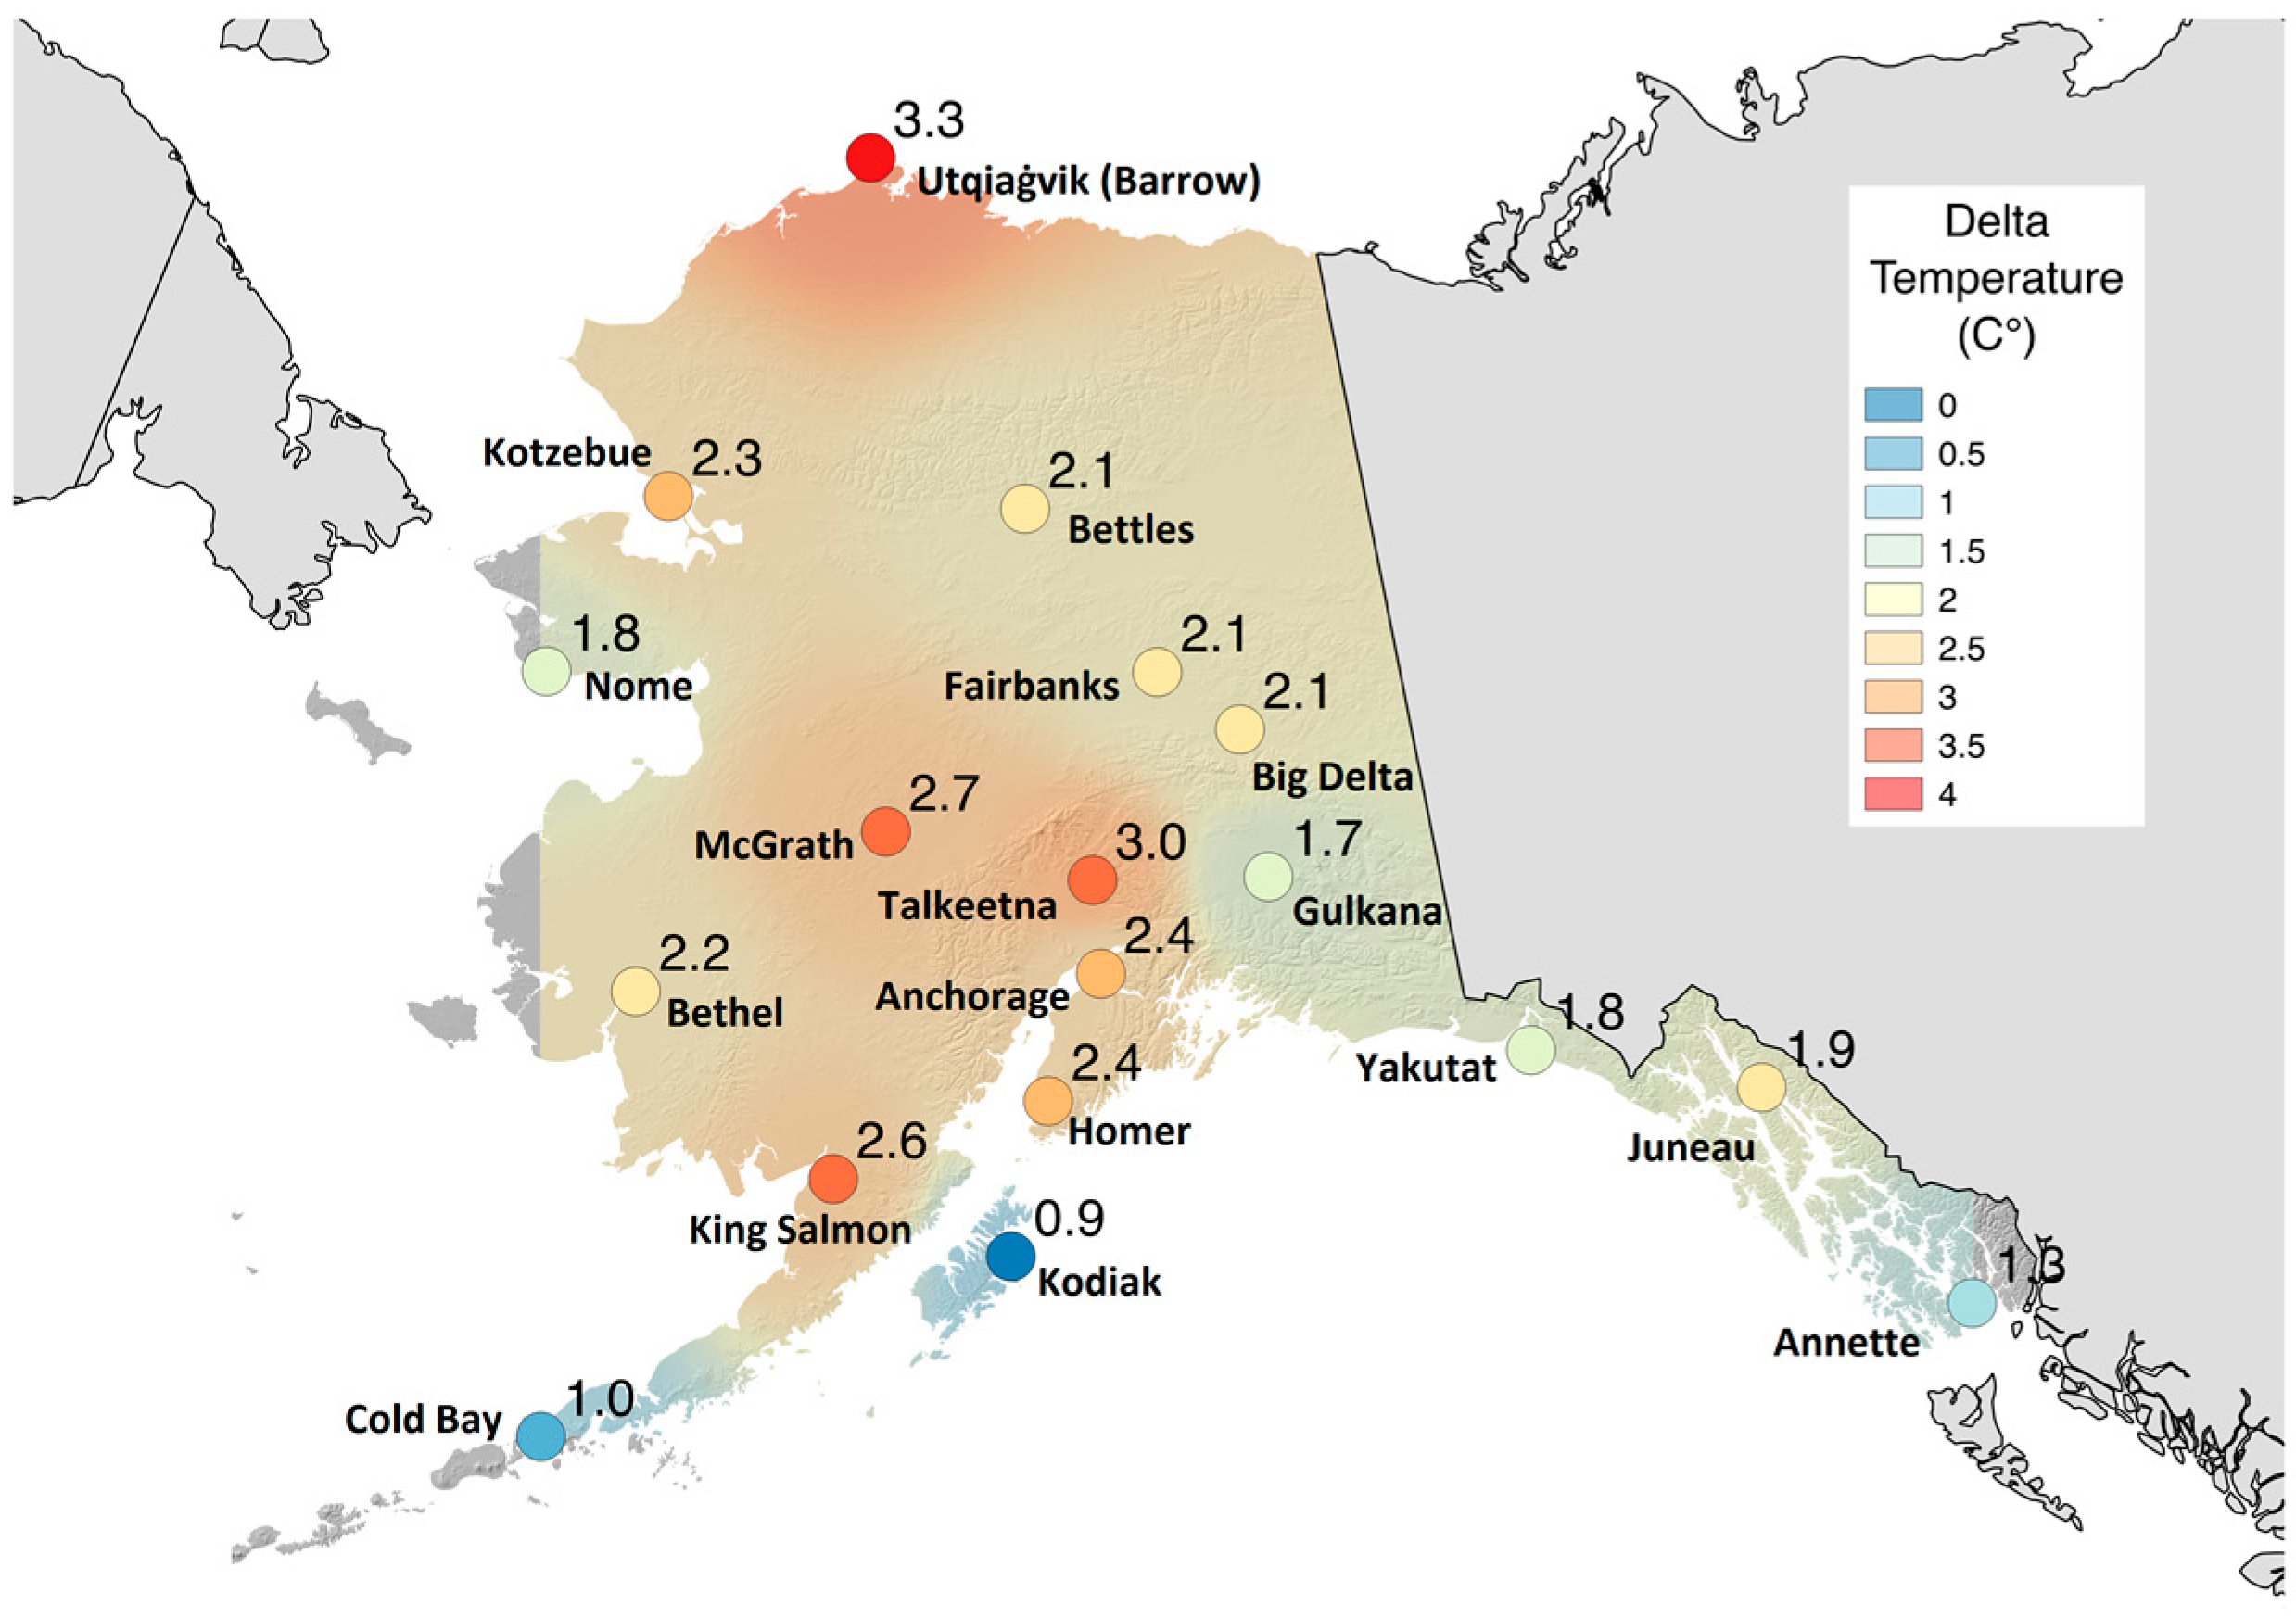
In Table 1, the changes in precipitation (%) and in temperature (°C) for the different climatic zones are presented for the 67-year period; these change values were defined by the best linear fit of the data points. All regions have observed precipitation and temperature increases over this period. The temperature increase is especially strong in the Arctic; this result is not surprising, as the polar amplification of global warming is a well-known phenomenon [8,9].
However, there are additional regional effects to the generally positive feedback of climatic warming leading to earlier snowmelt causing decreased surface albedo and thus amplifying the warming tendency [18]. In Utqiaġvik, for example, the greatest temperature change was observed in autumn, at a time when solar radiation is very weak [19]. As sea ice extent has been substantially reduced over the last decades, coastal regions have open or partly open water during the autumn months. Relatively warm air is thus advected towards the coast when the land temperatures are already far below the freezing point [20].
The highest temperature change values were observed in northern Alaska (Figure 3) as expected, while the lowest warming was experienced in maritime southern Alaska. This maritime region stretches from Cold Bay in the far west (1.0 °C), over Kodiak Island (0.9 °C), to Annette (1.3 °C) in the southeast. These values are for a 67-year period; however, they are still higher than the mean value of global warming.
The amount of precipitation change from station to station varies much more widely than temperature, as can be seen from Table 1. However, for all regions of Alaska, precipitation increases were observed; this is expected due to the temperature increase in all regions. Warmer air can hold more water vapor. The saturation water vapor pressure level is semi-logarithmic—with every 5 °C increase in temperature, it roughly doubles. Thus, when relatively warm, moist air from the Pacific Ocean is topographically forced over the Coastal Range by southeasterly winds, very high precipitation values can be observed on the ocean side as seen in Figure 1. The air is cooled moist adiabatically when rising, and while descending, it is warmed adiabatically; the amount of the heat of phase transition at any temperature can be obtained according to the Clausius–Clapeyron equation. Hence, it is relatively warm and dry on the leeward side of the mountain—this is also referred to as a rain shadow. In this way, the local topography of a station has an even greater effect on precipitation than on temperature.
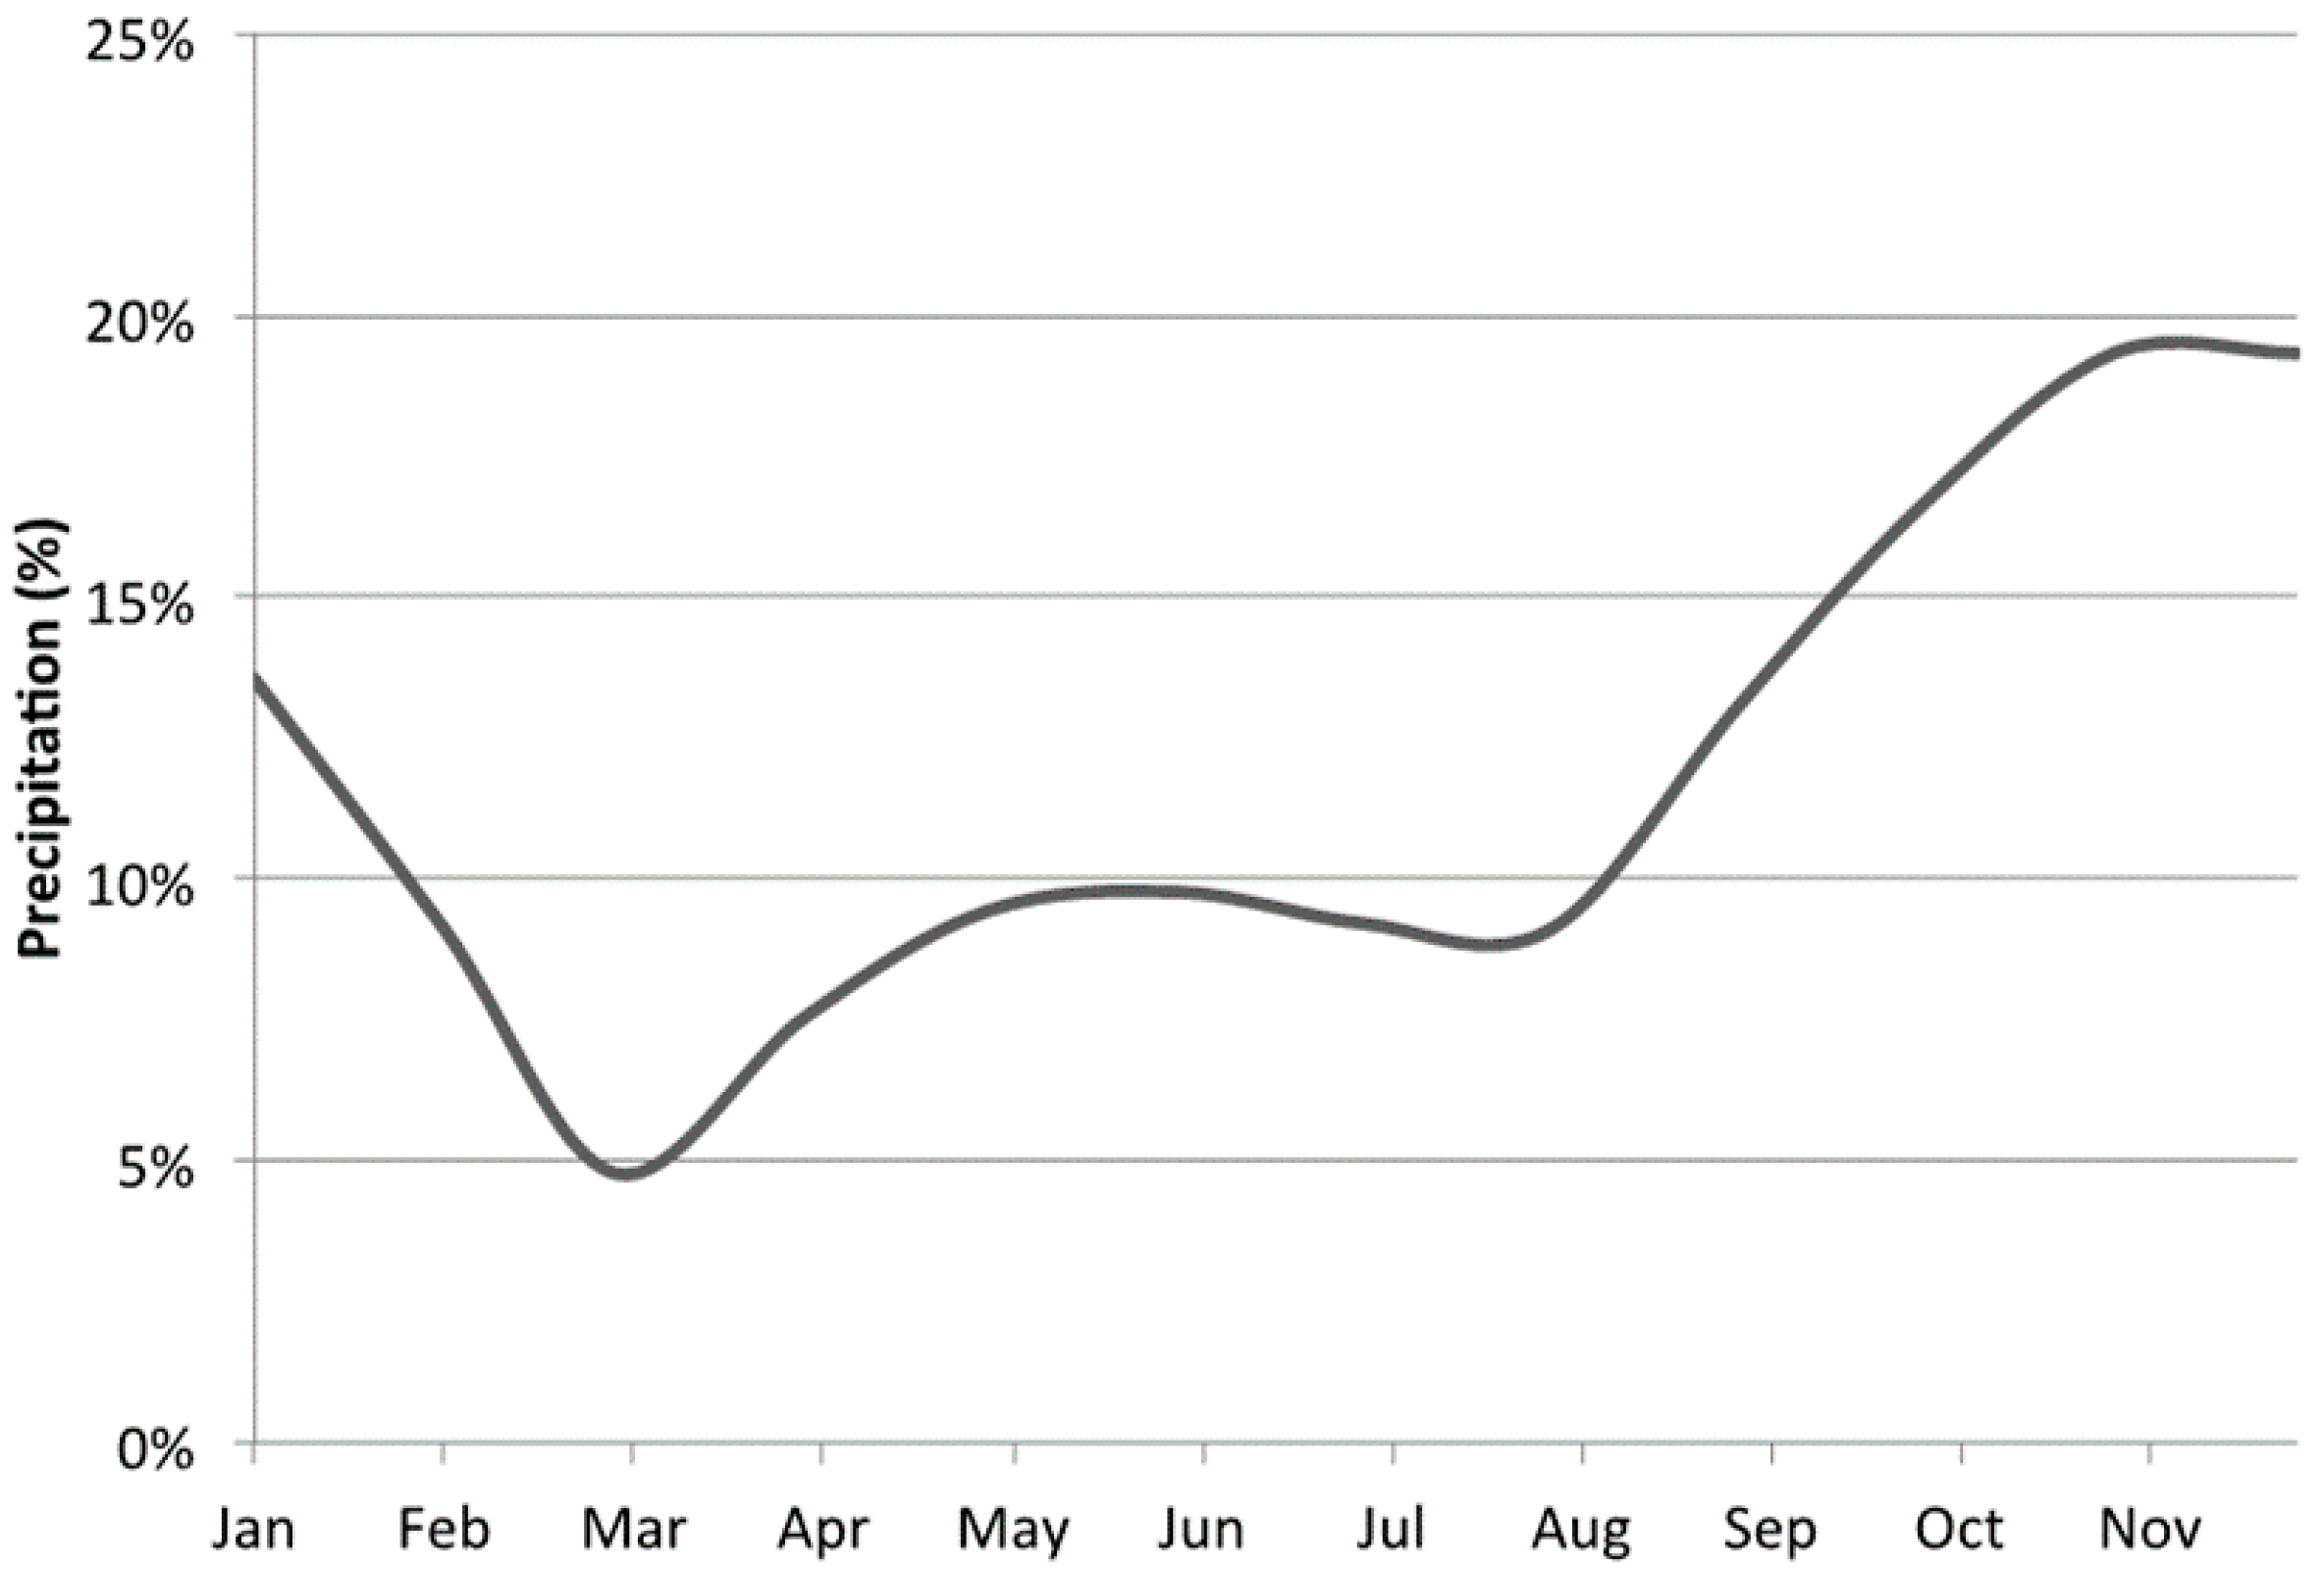
In Figure 4, the average annual course of precipitation change (%) for the mean of the 18 stations is presented. While a precipitation increase is observed for all months of the year, the maximum of the increase is observed in early winter. After a relatively warm summer, leaving a fair amount of water vapor content in the atmosphere, the cooling does not allow this moisture to stay in the atmosphere. In early spring, the opposite effect happens. After the cold winter, the atmosphere is relatively dry, so we observe the minimum increase in precipitation.
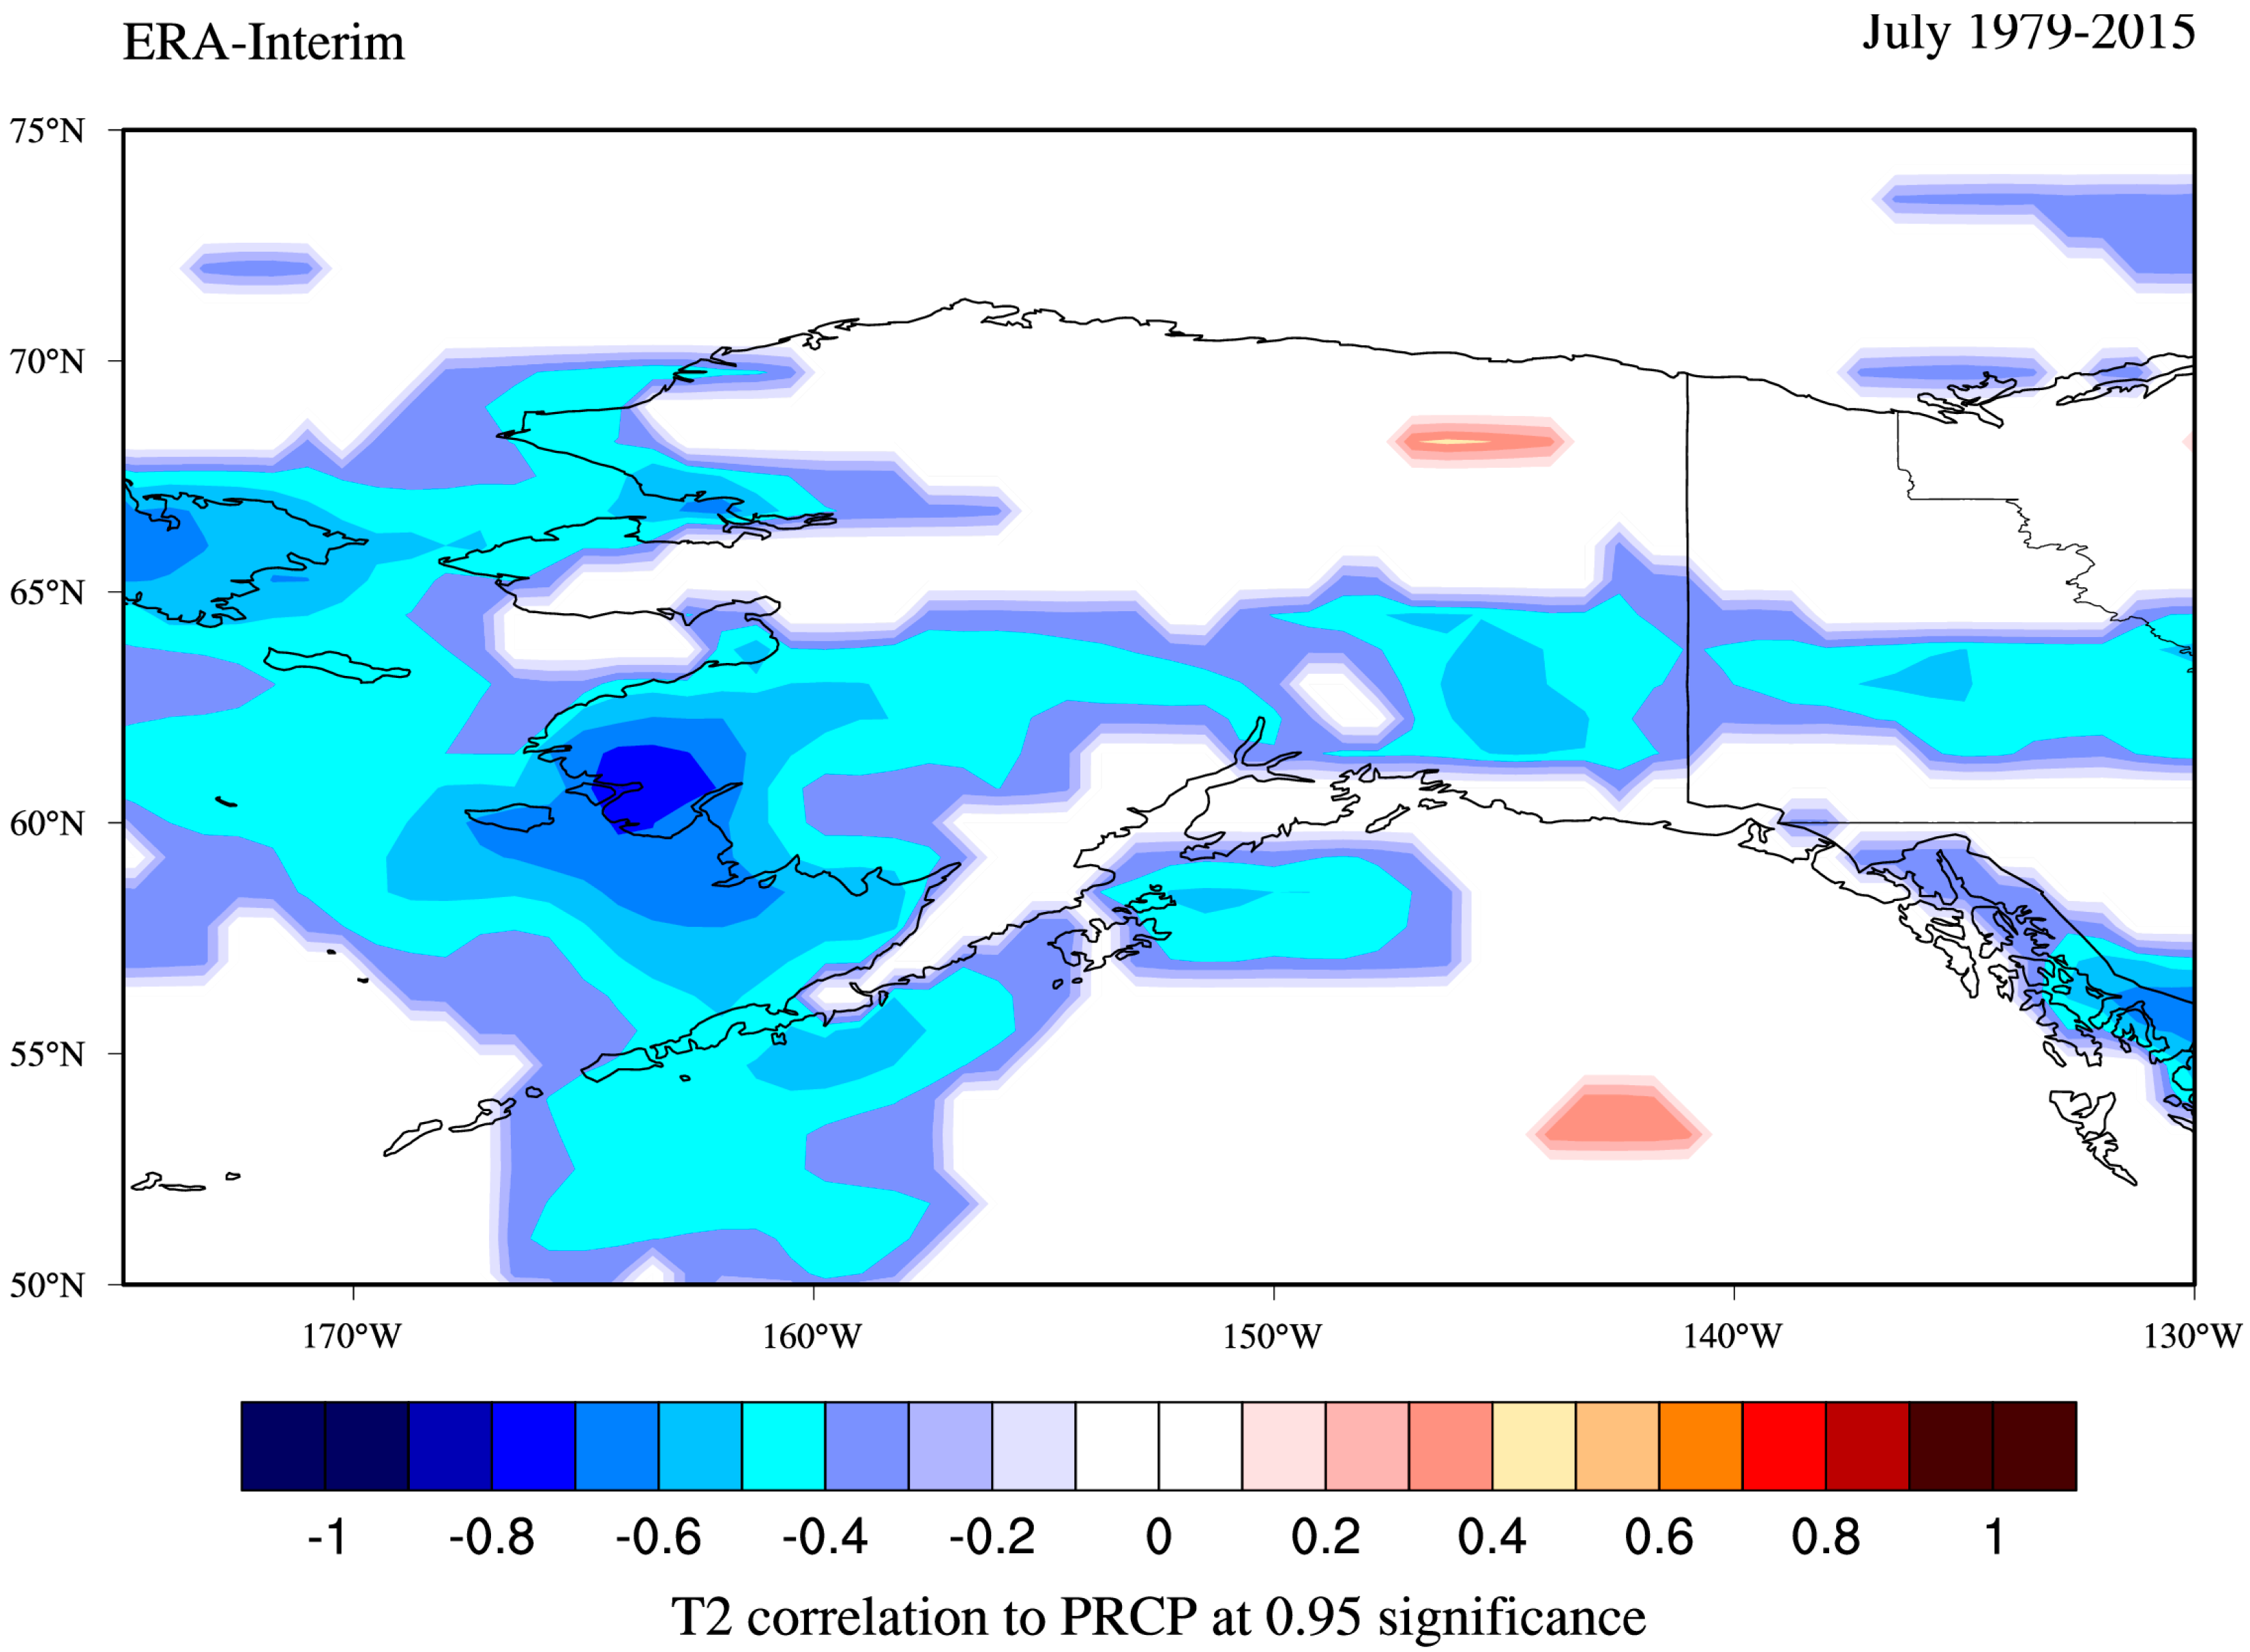
While years with above normal temperatures typically also had above normal precipitation amounts, this is not necessarily the case for all monthly values. We demonstrate this in Figure 5 for the entire Alaska region, presenting the correlation between precipitation and the 2-meter mean temperature (°C) for July based upon the European Centre for Medium-Range Weather Forecasts (ECMWF) reanalysis (ERA) interim data from 1979–2015 [21]. With increased temperatures, a decrease in precipitation is observed. Temperature and precipitation are inversely related because the warmest summer days are normally sunny, with no or few clouds. Hence, no precipitation occurs unless there are showers due to thunderstorm activity that normally occurs in the late afternoon.
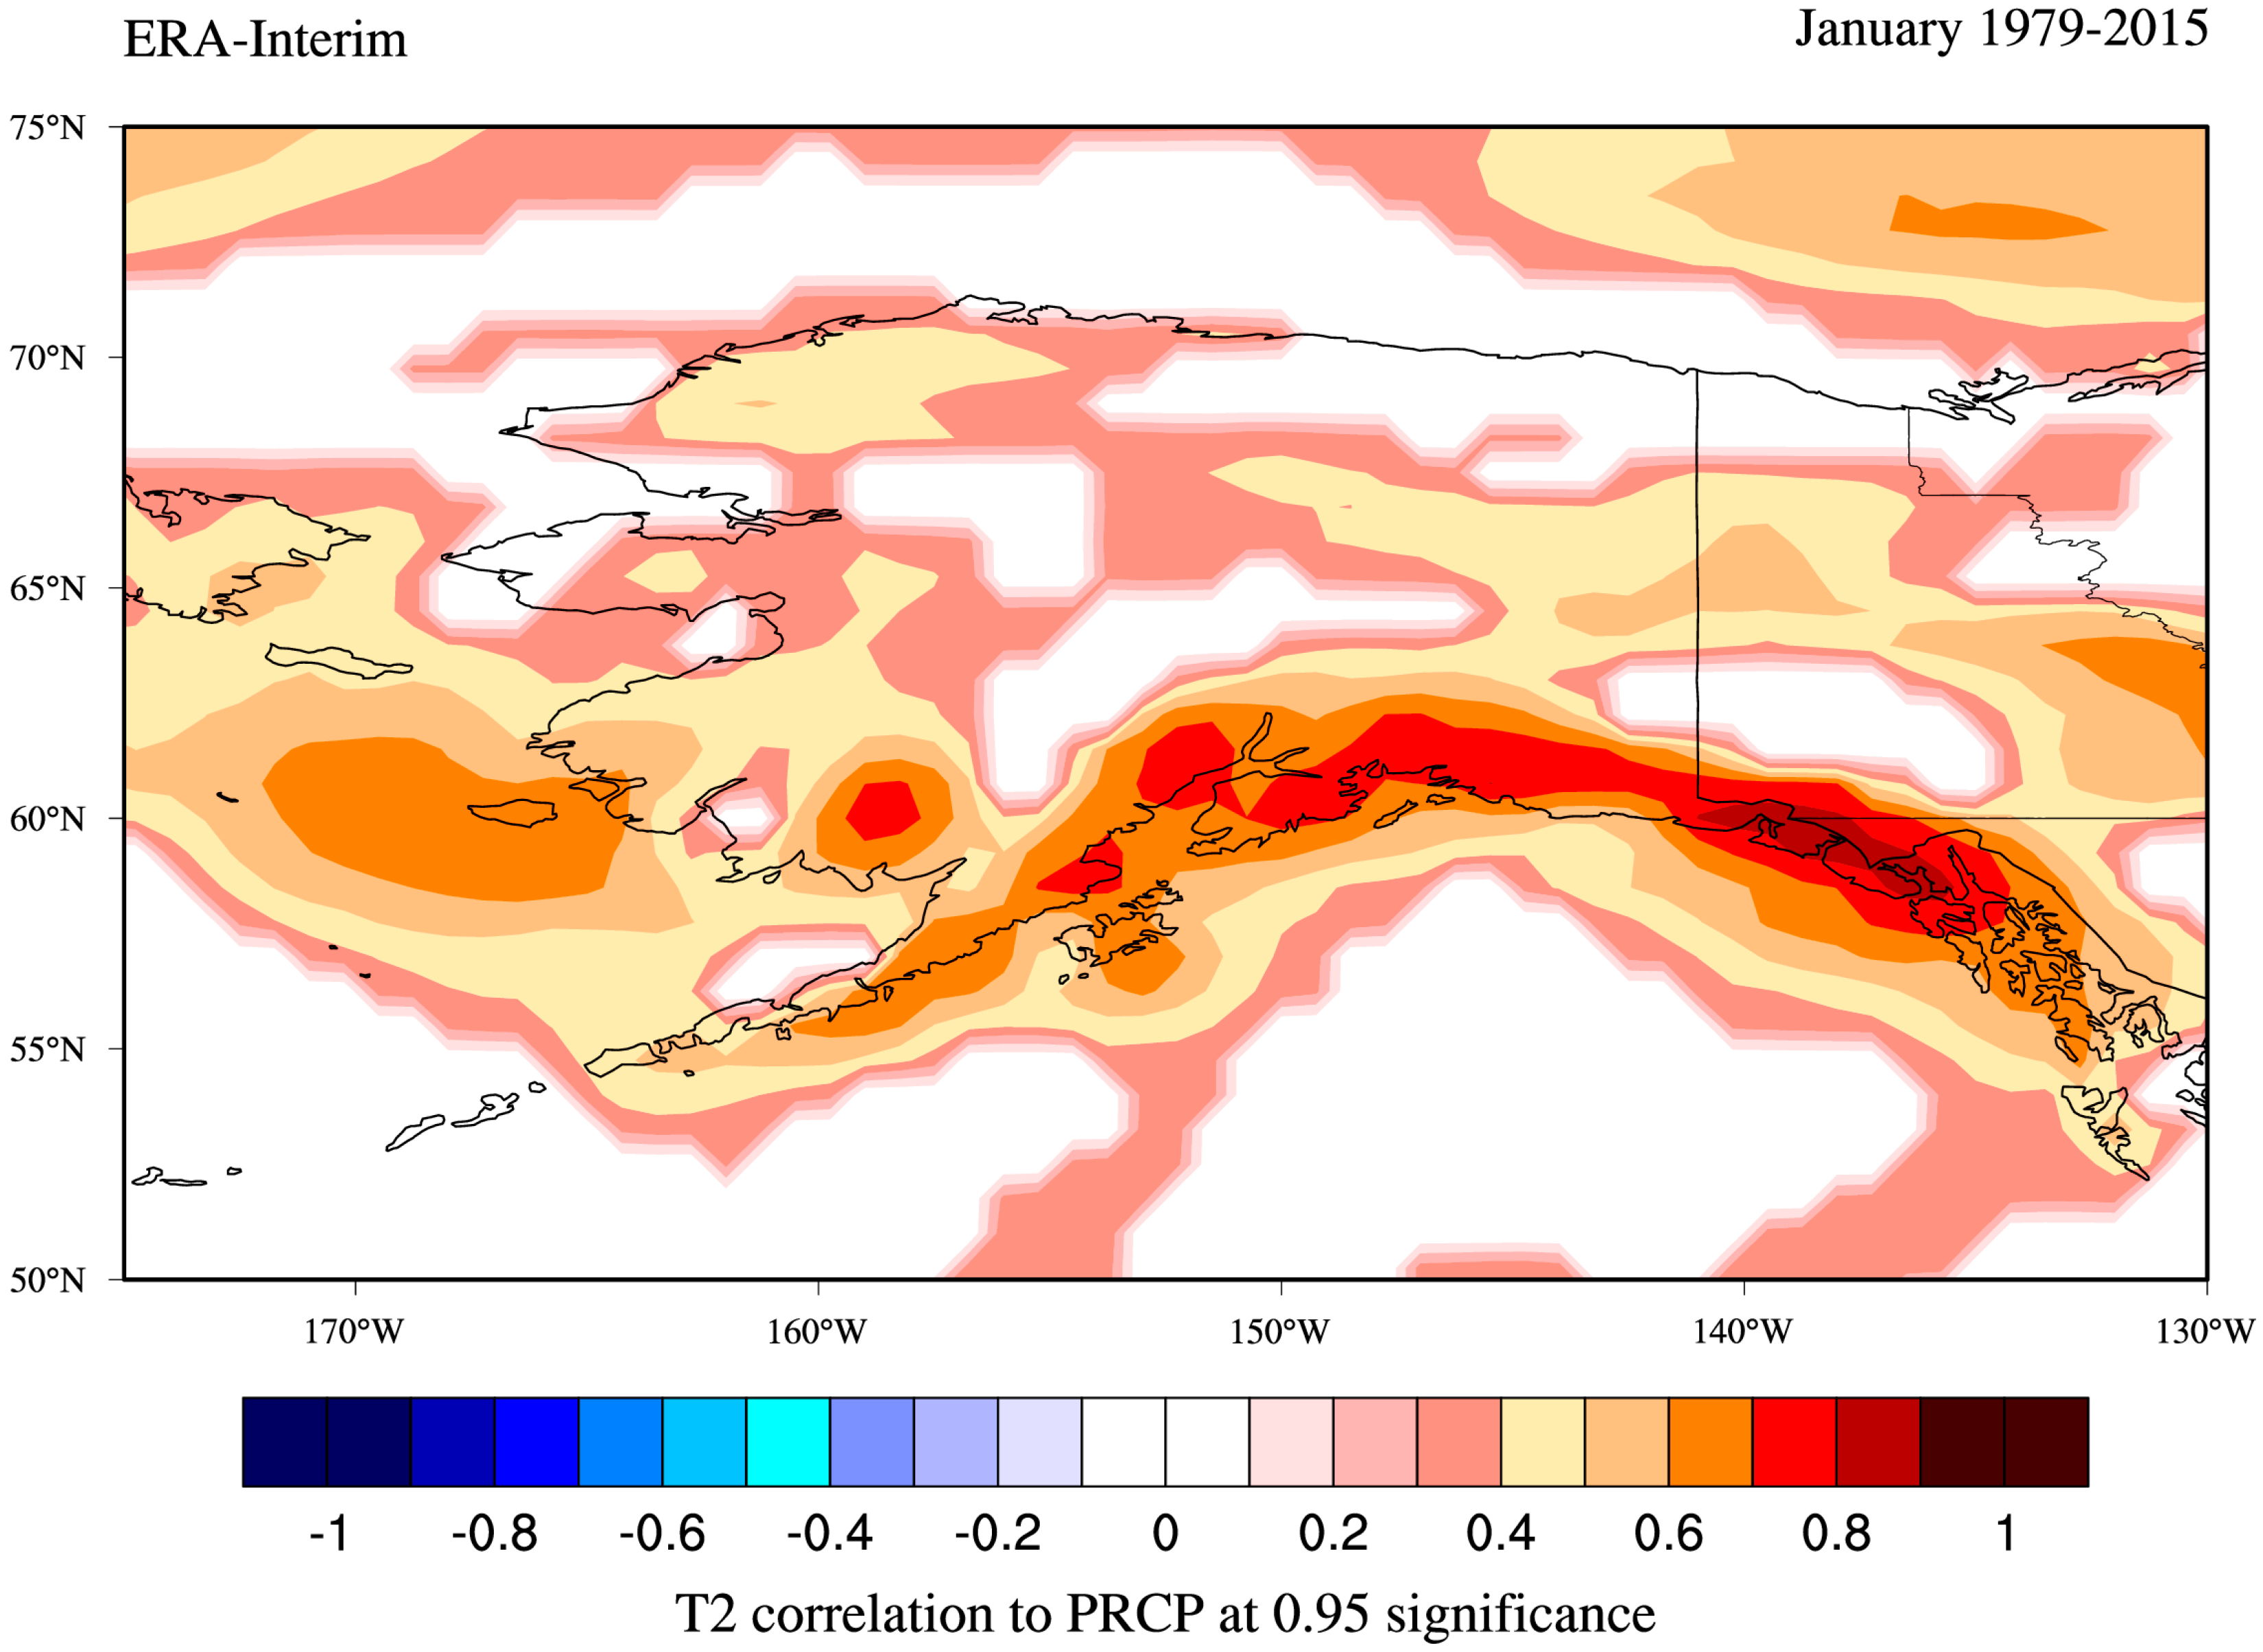
For most of the year, and especially in winter, the opposite is true; clear days are the cold days, as the radiation in the infrared region from the clouds is missing. This positive correlation between precipitation and temperature is evident for most regions of Alaska during the month of January (Figure 6) [21].
3. The Pacific Decadal Oscillation
A factor having a substantial influence on the climate of Alaska is the Pacific Decadal Oscillation (PDO). The PDO is a function of the water temperature north of 20° N of the Pacific Ocean, which is strongly related to the El Niño Southern Oscillation (ENSO). ENSO describes the circulation change in the tropical Pacific. The PDO has, however, a closer relationship to the climate of Alaska than does NINO. Mantua et al. in 1997 were the first to point out the importance of the PDO for Alaska’s climate and its salmon fisheries [22]. Royer analyzed the long-term water temperature changes of Sitka in 1989 [2]. A comprehensive study on the effect of the PDO change in 1976 from dominantly negative to dominantly positive values was carried out by Hartmann and Wendler in 2005 [17]. In general, during its positive phase, (above normal water temperatures) higher temperatures and more precipitation are observed in Alaska, while the negative phase relates to cooling and a corresponding decrease in precipitation.
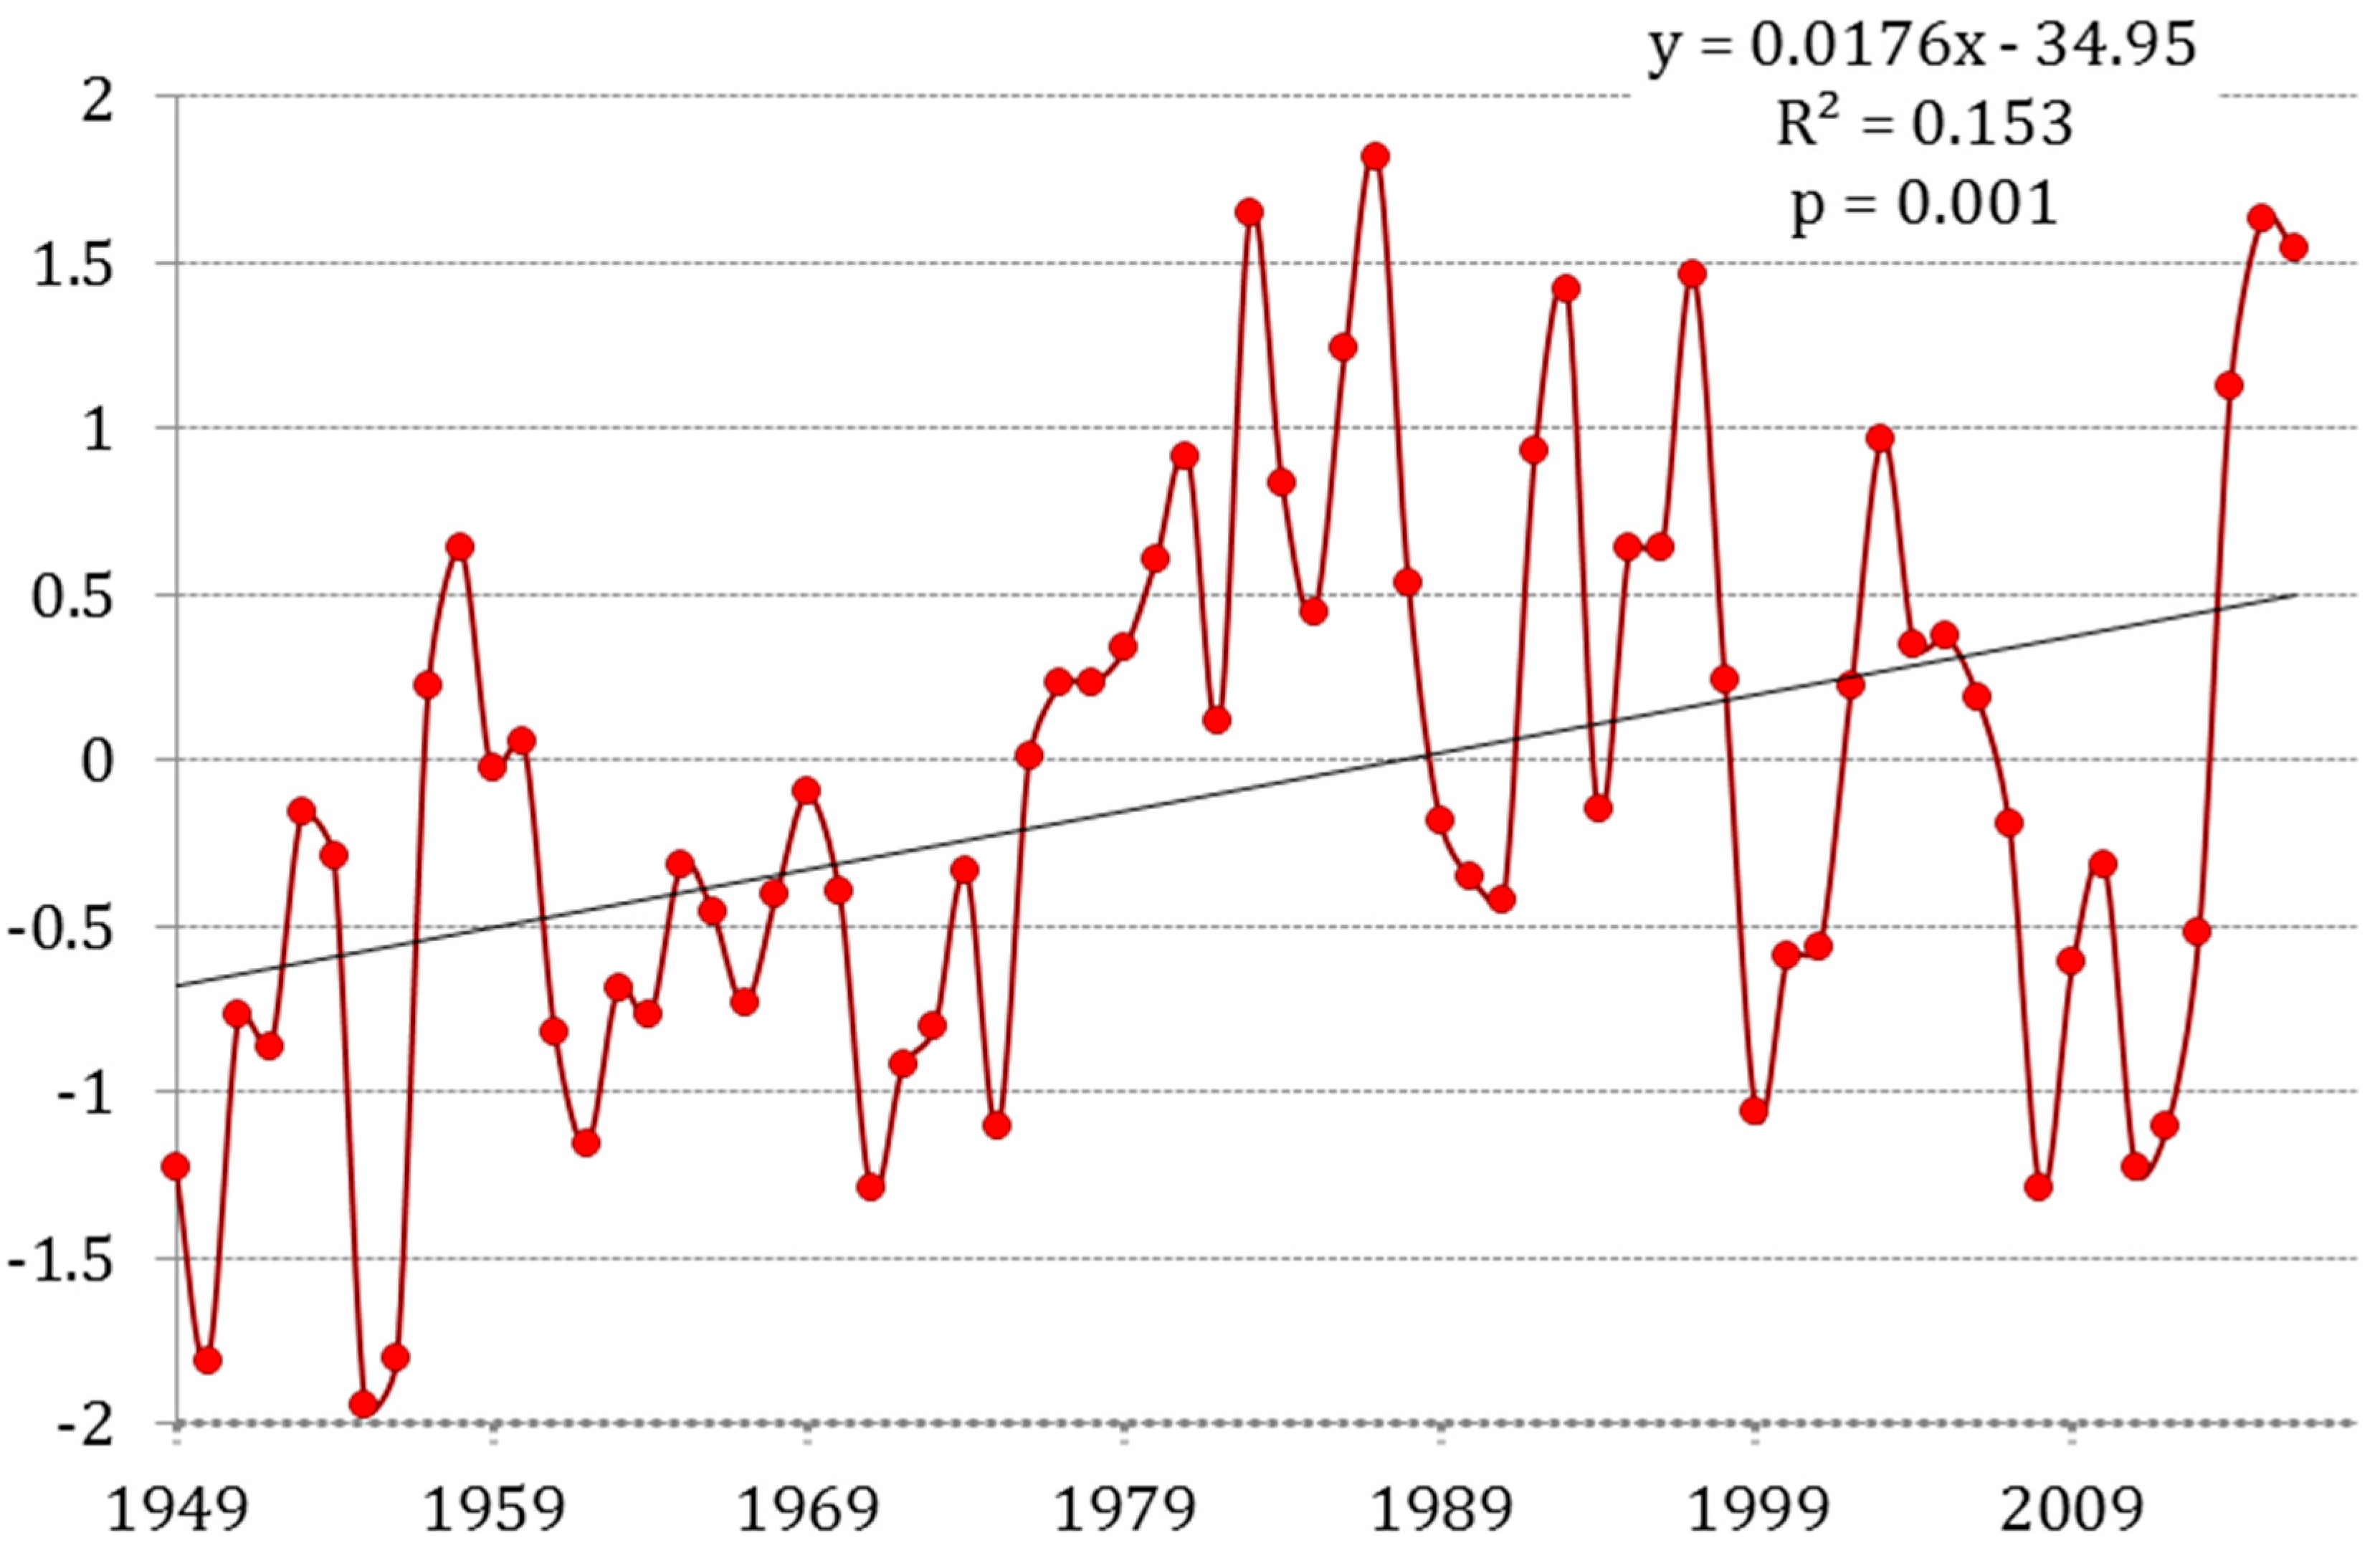
In Figure 7, the annual PDO values for 1949–2016 are presented. The values vary widely from year to year. Furthermore, the last three years of our time series had highly positive PDO values, which brought above normal temperatures. Above normal summer season temperatures are typically a result of stable high-pressure systems lasting several weeks; these weather situations may cause increased biomass burn activity, especially in Interior Alaska. The first half of the summer of 2015 was characteristic for widespread forest fires, which resulted in the second highest number of fires in Alaska’s wildfire record in over 50 years. However, there were below normal amounts of wildfire and cooler temperatures in the seven years prior to 2015 [23].
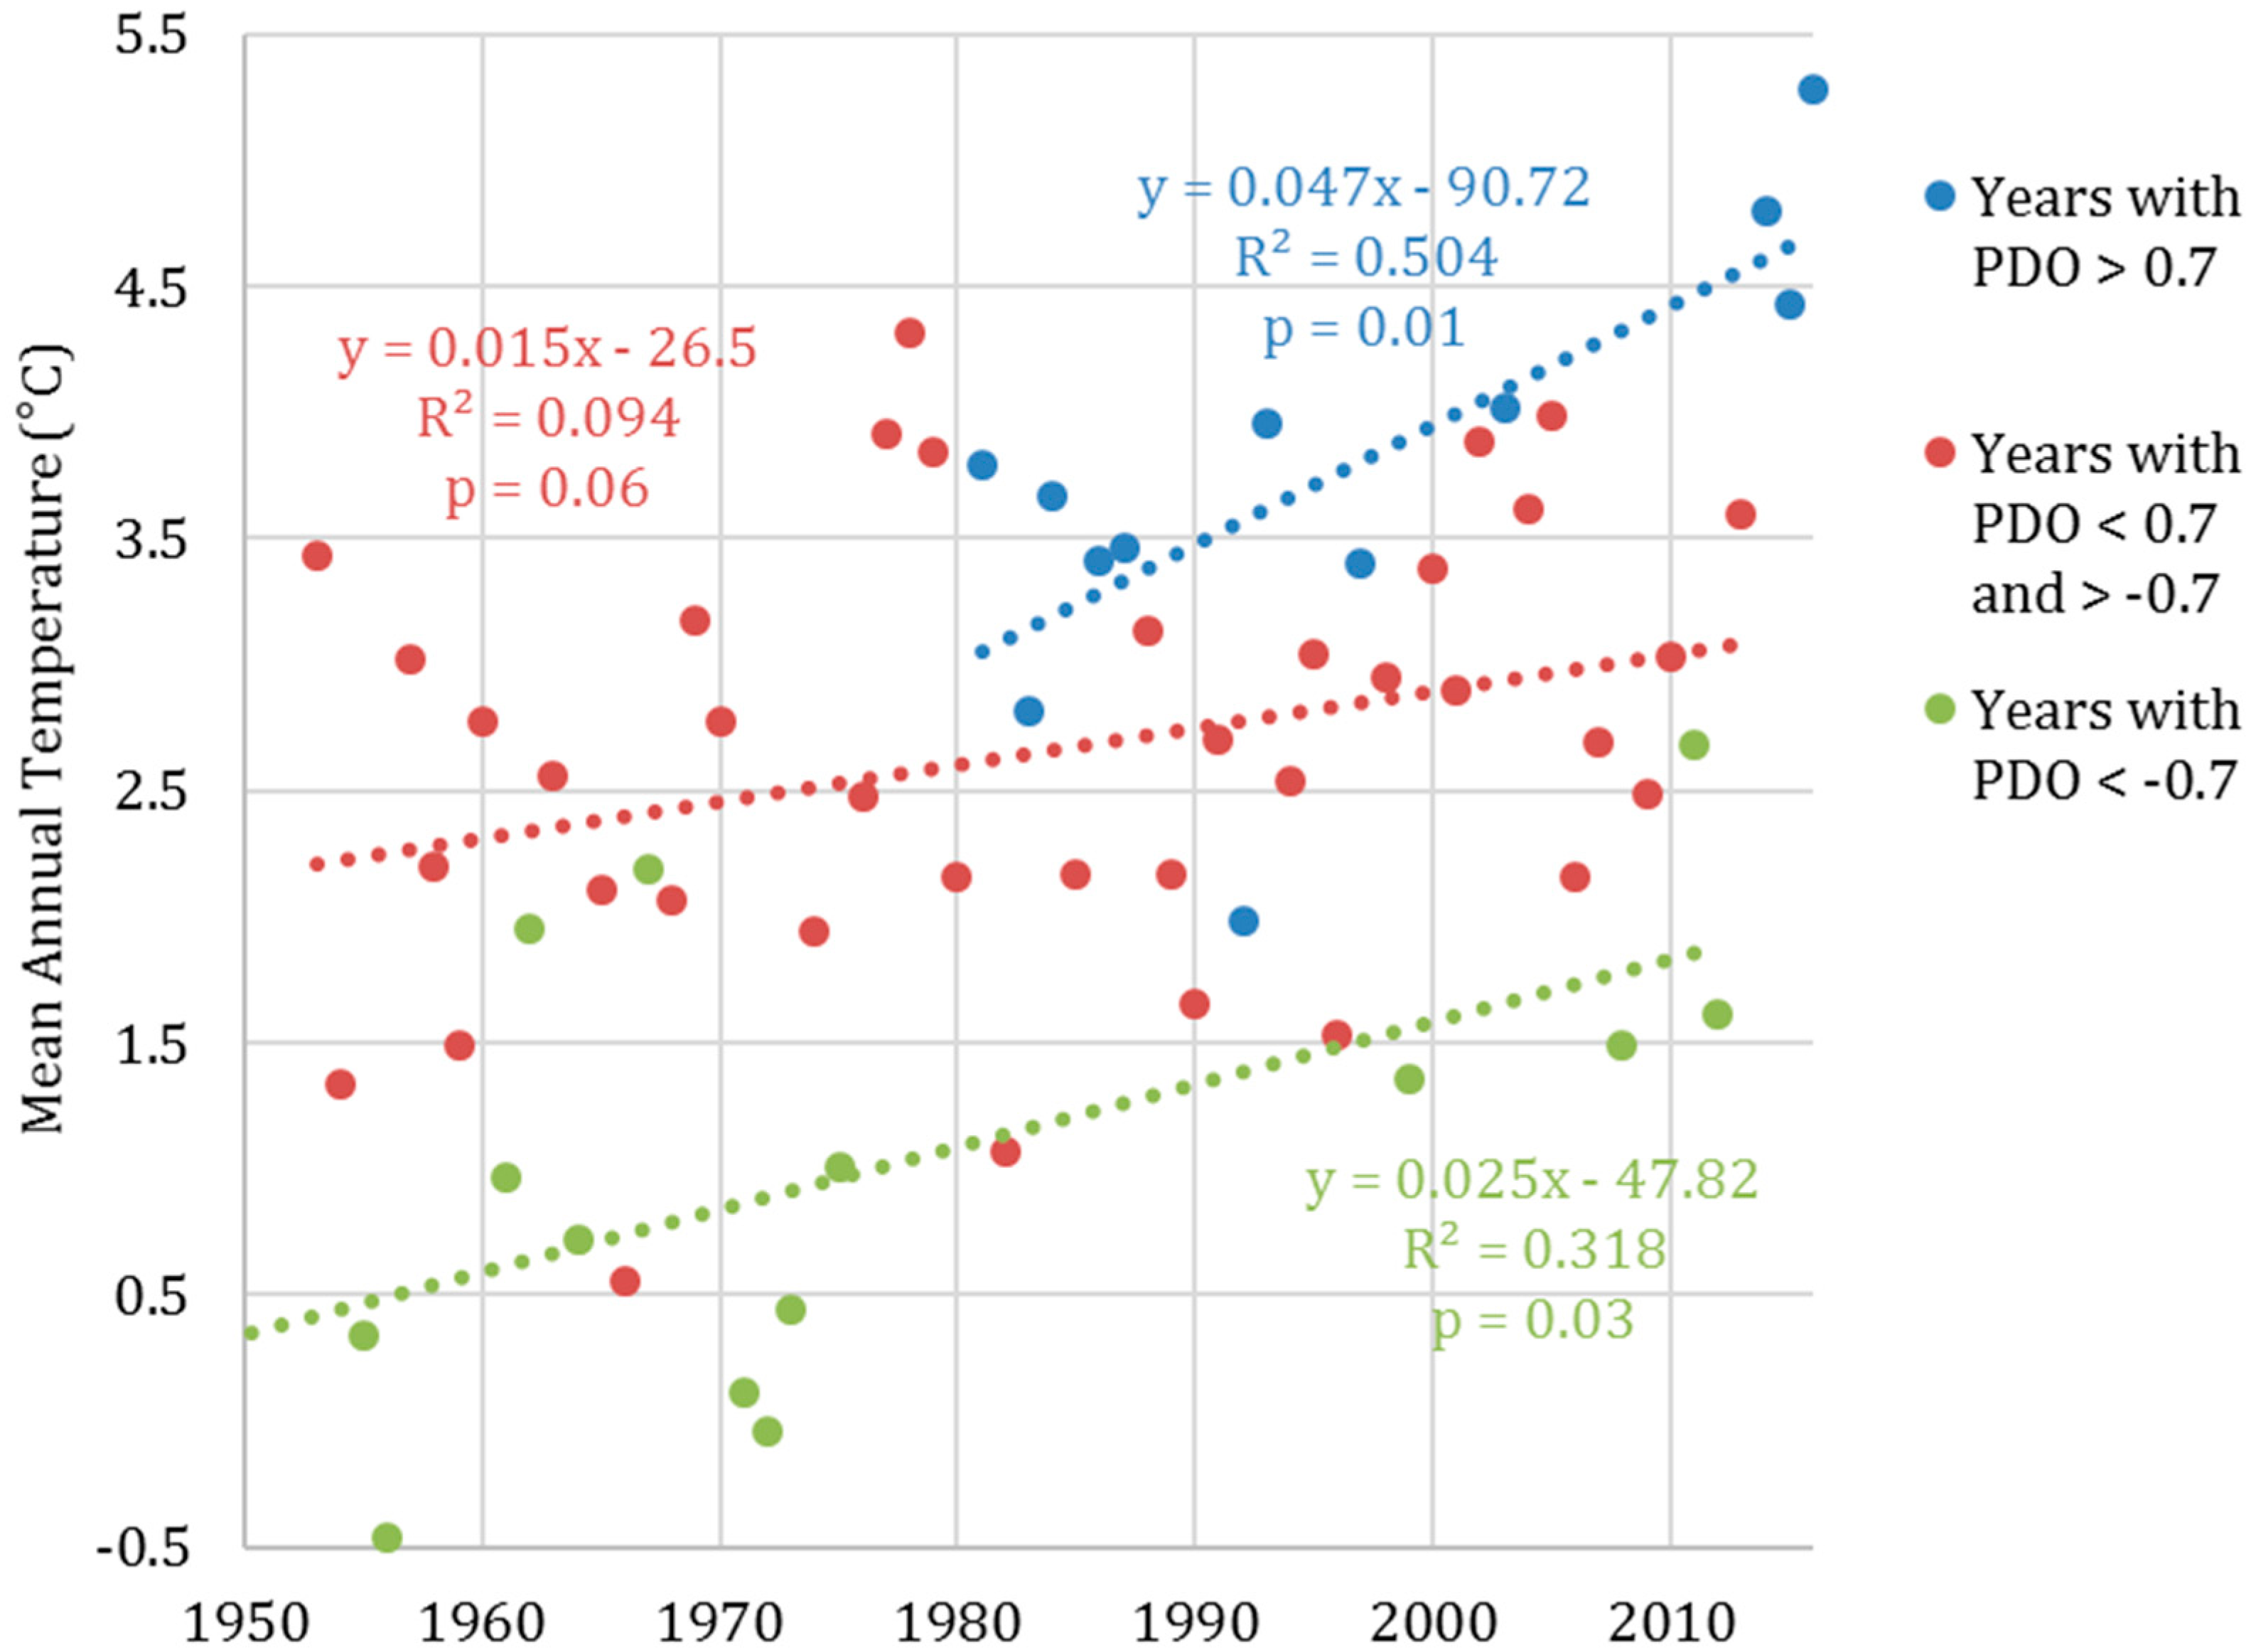
To evaluate the relation between local temperatures and the PDO, we plotted the mean annual temperature of Anchorage for the past 67 years against the PDO values (Figure 8). We subdivided the PDO values into three groups:
- Years with neutral PDO values, which we defined as values between −0.7 to +0.7;
- Years with positive PDO values (El Nino) >+0.7;
- Years with negative PDO values (La Nina) <−0.7.
In Figure 8, we report the p-values calculated for each group. For the positive and negative PDO groups, we calculated a value within our .95 confidence level, confirming that those relationships are statistically significant. The group of ‘neutral’ PDO values falls just outside of this confidence level. Figure 8 shows that during years with positive PDO values, the temperature is about 1 °C higher than for neutral conditions, and typically 2 °C when compared to negative PDO values. Higher PDO values have occurred more frequently since the mid-1970s and have contributed to the substantial temperature increase observed for the rest of the 20th century in Alaska [2]. A decrease in the frequency of positive PDO values in the first decade of this century resulted in a slight cooling for western Alaska [19]. However, for all classes of the PDO, an increase in temperature with time was observed. This increase in temperature could indicate the existence of long-term global warming, and since the PDO can affect these values, accurate short-term forecasting of the climate is difficult.
The behavior of the PDO is further complicated by the Arctic Oscillation (AO). The Arctic Oscillation is an index of the dominant pattern of surface atmospheric pressure in the polar region; a positive AO value corresponds to low surface pressure, and a negative AO value corresponds to high surface pressure. The strength of the Aleutian Low is in turn linked to the PDO by ocean-atmosphere interactions in the North Pacific. In 2006, Sun and Wang found there to be a lagging correlation between the AO and the PDO, and it is especially high when the AO precedes the PDO by 7–8 years [24].
In Table 1, we presented the temperature and precipitation change for the different climatic zones of Alaska. From this table, we can calculate a temperature change of 1.8 °C and a precipitation increase of about 17% for the mean of Alaska. If we assume a mean annual temperature of Alaska as 2 °C and look at the saturation water vapor pressure (the ability of air to hold water vapor), an increase of 13% can be calculated—this is somewhat lower than the observed precipitation increases of 17%. The assumption of the mean temperature is not very critical for this calculation. Values for specific stations vary much more widely, indicating that other factors—such as the specific geographic location, altitude, distance from the ocean, etc.—will play a major role.
4. Conclusions
Analysis of Alaska’s first-order weather stations has shown clear increases in precipitation and temperatures over the last 67 years. This period was chosen due to the availability of a nearly complete and high-quality data set. A mean precipitation increase of 17% was observed. While the R2 values of the PDO, temperature, and precipitation relationships calculated in our analysis vary regionally, there are clear relationships that warrant further investigation. Increases at different stations could vary widely, even in the same climatic zone, which shows the importance of the specific geographic location.
The temperature increases varied less, and a mean value of 1.8 °C was calculated for the 67-year period. This temperature increase is far above the mean global value of about 0.6 °C per century and supports the concept of ‘polar amplification’ of global warming. However, the observed temperature increase was not uniform, and the largest increases were observed in northern Alaska. This was an expected result.
As can be seen from Figure 8, the Pacific Decadal Oscillation values have a noticeable influence on the temperature. A positive PDO has contributed to exceptional warming after 1976, and again during the last three years, while negative PDO values and cooler temperatures were evident during the first decade of this century; these cooler temperatures were especially observed in western Alaska [19]. Hence, the strong contribution of the PDO makes modeling the temperature and precipitation on a regional scale for decadal climate predictions difficult and unreliable, as PDO values are hard to predict, and positive or negative PDO amplitudes are of greater importance on a regional scale than the long-term effects of global warming.
Acknowledgments
The Alaska Climate Research Center was established and is funded by the State of Alaska by Title 14, Chapter 40, Section 085. We thank Christopher Daly of Oregon State University, who supplied Figure 1.
Author Contributions
Gerd Wendler started the investigation, Telayna Gordon carried out most of the data analysis, and all three authors discussed the preliminary results which led to the final version of the paper.
Conflicts of Interest
The authors declare no conflict of interest. The founding sponsors had no role in the design of the study; in the collection, analyses, or interpretation of data; in the writing of the manuscript, or in the decision to publish the results.
References
- Patterson, C.P. Pacific Coast Pilot: Coast and Islands of Alaska; U.S. Coast and Geodetic Survey, U.S. Government Printing Office: Washington, DC, USA, 1879.
- Royer, T. Upper ocean temperature variability in the northeast Pacific Ocean: Is it an indicator of global warming? J. Geophys. Res. 1989, 94, 18175–18183. [Google Scholar] [CrossRef]
- Wendler, G.; Galloway, K.; Stuefer, M. On the climate and climate change of Sitka, Southeast Alaska. Theor. Appl. Climatol. 2016, 126, 27–34. [Google Scholar] [CrossRef]
- Abbe, C. The Climate of Alaska; No. 45; U.S. Geological Survey, Government Printing Office: Washington, DC, USA, 1906.
- Day, P.C. Summary of Climatological Data of Alaska, by Sections; Weather Bureau, U.S. Department of Agriculture, U.S. Government Printing Office: Washington, DC, USA, 1922.
- Searby, H.W. Climates of the States, Alaska, Climatography of the United States; No. 60–49; U.S. Department of Commerce, U.S. Government Printing Office: Washington, DC, USA, 1968.
- Shulski, M.; Wendler, G. The Climate of Alaska; University of Alaska Press: Fairbanks, AK, USA, 2007. [Google Scholar]
- Stone, R.S.; Dutton, E.G.; Harris, J.M.; Longenecker, D. Earlier spring snowmelt in northern Alaska as an indicator of climate change. J. Geophys. Res. 2002, 107. [Google Scholar] [CrossRef]
- Polyakov, I.V.; Bekryaev, R.V.; Alekseev, G.V.; Bhatt, U.S.; Colony, R.S.; Johnson, M.A.; Maskshtas, A.P.; Walsh, D. Variability and trends of air temperature and pressure in the maritime Arctic, 1875–2000. J. Clim. 2003, 16, 2067–2077. [Google Scholar] [CrossRef]
- Curtis, J.; Wendler, G.; Stone, R.; Dutton, E. Precipitation decrease in the western Arctic, with special emphasis on Barrow and Barter Island, Alaska. Int. J. Climatol. 1998, 18, 1687–1707. [Google Scholar] [CrossRef]
- Walsh, J.E.; Chapman, W.L. Arctic contribution to upper-ocean variability in the North Atlantic. J. Clim. 1990, 3, 1462–1473. [Google Scholar] [CrossRef]
- Verlinde, J.; Zak, B.D.; Shupe, M.D.; Ivey, M.D.; Stamnes, K. The ARM North Slope of Alaska (NSA) sites. Meteorol. Monogr. 2016, 57. [Google Scholar] [CrossRef]
- Black, R.F. Precipitation at Barrow, Alaska, greater than recorded. Eos Trans. AGU 1954, 35, 203–207. [Google Scholar] [CrossRef]
- Larsen, C.F.; Burgess, E.; Arendt, A.A.; O’Neel, S.; Johnson, A.J.; Kienholz, C. Surface melt dominates Alaska glacier mass balance. Geophys. Res. Lett. 2015, 42, 5902–5908. [Google Scholar] [CrossRef]
- Köppen, W. Die Wärmezonen der Erde, nach der Dauer der heissen, gemässigten und kalten Zeit und nach der Wirkung der Wärme auf die organische Welt betrachtet. Meteorol. Z. 1884, 1, 215–226. [Google Scholar]
- Bieniek, P.A.; Bhatt, U.S.; Thoman, R.L.; Angeloff, H.; Partain, J.; Papineau, J.; Fritsch, F.; Holloway, E.; Walsh, J.E.; Daly, C.; et al. Climate divisions for Alaska based on objective methods. J. Appl. Meteorol. Climatol. 2012, 51, 1276–1289. [Google Scholar] [CrossRef]
- Hartmann, B.; Wendler, G. On the significance of the 1976 Pacific climate shift in the climatology of Alaska. Climate 2005, 18, 4824–4839. [Google Scholar] [CrossRef]
- Serreze, M.C.; Barry, R.G. The Arctic Climate System, 2nd ed.; Cambridge University Press: Cambridge, MA, USA, 2014; ISBN 9781139583817. [Google Scholar]
- Wendler, G.; Chen, L.; Moore, B. Recent sea ice increase and temperature decrease in the Bering Sea area, Alaska. Theor. Appl. Climatol. 2014, 117, 393–398. [Google Scholar] [CrossRef]
- Wendler, G.; Moore, B.; Galloway, K. Strong temperature increase and shrinking sea ice in Arctic Alaska. Open Atmos. Sci. J. 2014, 8, 7–15. [Google Scholar] [CrossRef]
- Dee, D.P.; Uppala, S.M.; Simmons, A.J.; Berrisford, P.; Poli, P.; Kobayashi, S.; Andrae, U.; Balmaseda, M.A.; Balsamo, G.; Bauer, P.; et al. The ERA-Interim reanalysis: Configuration and performance of the data assimilation system. Q. J. R. Meteorol. Soc. 2011, 137, 553–597. [Google Scholar] [CrossRef]
- Mantua, N.; Hare, S.; Zhang, Y.; Wallace, J.; Francis, R. A Pacific interdecadal climate oscillation with impacts on salmon production. BAMS 1997, 78, 1069–1079. [Google Scholar] [CrossRef]
- Wendler, G.; Conner, J.; Moore, B.; Shulski, M.; Stuefer, M. Climatology of Alaskan wildfires with special emphasis on the extreme year of 2004. Theor. Appl. Climatol. 2011, 104, 459–472. [Google Scholar] [CrossRef]
- Sun, J.; Wang, H. Relationship between Arctic Oscillation and Pacific Decadal Oscillation on decadal timescale. Chin. Sci. Bull. 2006, 51, 75–79. [Google Scholar] [CrossRef]
Figure 1.
Precipitation map for the 1971–2000 normal time period using PRISM model data (Oregon State University).
Figure 1.
Precipitation map for the 1971–2000 normal time period using PRISM model data (Oregon State University).

Figure 2.
Location of the first-order stations and climatic zones of Alaska from Hartmann and Wendler [17].
Figure 2.
Location of the first-order stations and climatic zones of Alaska from Hartmann and Wendler [17].

Figure 3.
Temperature change (°C) for Alaska’s first-order stations from 1949–2016.

Figure 4.
Smoothed monthly change in the mean precipitation of the 18 first-order stations from 1949–2016.
Figure 4.
Smoothed monthly change in the mean precipitation of the 18 first-order stations from 1949–2016.

Figure 5.
Correlation between precipitation and the 2-meter mean temperature (°C) for the Alaska region for the month of July as derived from the ERA-Interim reanalysis, 1979–2015 [21].
Figure 5.
Correlation between precipitation and the 2-meter mean temperature (°C) for the Alaska region for the month of July as derived from the ERA-Interim reanalysis, 1979–2015 [21].

Figure 6.
Correlation between precipitation and the 2-meter mean temperature (°C) for the Alaska region for the month of January as derived from the ERA-Interim reanalysis, 1979–2015 [21].
Figure 6.
Correlation between precipitation and the 2-meter mean temperature (°C) for the Alaska region for the month of January as derived from the ERA-Interim reanalysis, 1979–2015 [21].

Figure 7.
Time series of the mean annual PDO indices for 1949–2016.

Figure 8.
Mean annual temperature of Anchorage (1949–2016) as a function of different classes of the PDO values.
Figure 8.
Mean annual temperature of Anchorage (1949–2016) as a function of different classes of the PDO values.


Table 1.
Change in precipitation (%) and temperature (°C) for the climatic zones of Alaska from 1949–2016.
Table 1.
Change in precipitation (%) and temperature (°C) for the climatic zones of Alaska from 1949–2016.
| Climate Region | Precipitation % | Temperature (°C) |
|---|---|---|
| Arctic | 8 | 3.3 |
| West | 18 | 2.1 |
| Central | 7 | 1.9 |
| Southwest | 40 | 1.5 |
| Southcentral | 8 | 2.6 |
| Southeast | 8 | 1.7 |
© 2017 by the authors. Licensee MDPI, Basel, Switzerland. This article is an open access article distributed under the terms and conditions of the Creative Commons Attribution (CC BY) license (http://creativecommons.org/licenses/by/4.0/).
Share and Cite
MDPI and ACS Style
Wendler, G.; Gordon, T.; Stuefer, M. On the Precipitation and Precipitation Change in Alaska. Atmosphere 2017, 8, 253. https://doi.org/10.3390/atmos8120253
AMA Style
Wendler G, Gordon T, Stuefer M. On the Precipitation and Precipitation Change in Alaska. Atmosphere. 2017; 8(12):253. https://doi.org/10.3390/atmos8120253
Chicago/Turabian StyleWendler, Gerd, Telayna Gordon, and Martin Stuefer. 2017. "On the Precipitation and Precipitation Change in Alaska" Atmosphere 8, no. 12: 253. https://doi.org/10.3390/atmos8120253
Note that from the first issue of 2016, this journal uses article numbers instead of page numbers. See further details here.