Factors Affecting Capacity Design of Lithium-Ion Stationary Batteries


Department of Nuclear Power Plant Engineering, KEPCO International Nuclear Graduate School (KINGS), Ulsan 45014, Korea
Batteries 2019, 5(3), 58; https://doi.org/10.3390/batteries5030058
Submission received: 6 June 2019
/
Revised: 20 July 2019
/
Accepted: 3 August 2019
/
Published: 28 August 2019
(This article belongs to the Special Issue Sustainable Lithium Ion Batteries: From Production to Recycling)
Abstract
:Lead-acid batteries are currently the most popular for direct current (DC) power in power plants. They are also the most widely used electric energy storage device but too much space is needed to increase energy storage. Lithium-ion batteries have a higher energy density, allowing them to store more energy than other types of batteries. The purpose of this paper is to elaborate on the factors affecting the capacity design of lithium-ion stationary batteries. Factors that need to be considered in calculating the capacity of stationary lithium-ion batteries are investigated and reviewed, and based on the results, a method of calculating capacity of stationary lithium-ion batteries for industrial use is proposed. In addition, the capacity and area required for replacing the lead-acid batteries for nuclear power plants with lithium-ion batteries are reviewed as part of this case study.
1. Introduction
As a result of competitive research and development efforts around the world, the development of high-capacity and high-performance energy storage systems (ESSs) is accelerating. Since the advent of lithium-ion batteries in 1991, they are widely applied to energy storage devices. In the early days, it was widely used in portable electronic devices. In recent years, however, the application of ESS in electric vehicles and renewable energy plants has been expanding rapidly. However, while industrial standards for sizing existing stationary batteries such as lead-acid batteries and nickel cadmium batteries are established, industrial standards for sizing lithium-ion stationary batteries are still under development.
IEC 62619-2017, ‘Safety requirements for secondary lithium cells and batteries, for use in industrial applications’ and IEC 62620-2014, ‘Secondary cells and batteries containing alkaline or other non-acid electrolytes’ are recently established international standards for stationary lithium-ion batteries. However, IEC 62619 and 62620 do not cover the capacity sizing method of lithium-ion stationary batteries. The Korea electric association published Korea electric power industry code (KEPIC) EEG 1400, ‘Installation design and installation of lithium-ion batteries for station applications’ on 31 December 2017. KEPIC EEG 1400 describes how to decide the size of the lithium-ion stationary batteries but does not take into account all the characteristics of lithium-ion batteries.
The author has proposed a formula for selecting the capacity of lithium-ion stationary batteries for establishing industrial design standards essential for the design and installation of stationary batteries in nuclear power plants [1]. As a further study, the purpose of this paper is to consider the characteristics of battery cell voltage, one of the factors affecting the calculation of battery specifications, and to suggest how to apply the voltage factor in the calculation of battery capacity. Research on capacity fade mechanisms and performance degradation of lithium-ion batteries is being carried out by many researchers [2,3,4,5]. The results of such research are an important factor in predicting battery life. However, this study assumes that the battery is replaced when the battery capacity decreases below a predetermined level than its rated capacity.
A case study was performed for the comparison of lithium-ion batteries and lead-acid batteries. The 125 V DC system of a pressurized water reactor (PWR) nuclear power plant was selected as a case. That is because the nuclear energy institute (NEI) raised the need to extend battery backup times to last at least 24 h [6].
2. Factors Affecting Capacity Design of Lithium-ion Batteries
2.1. Nominal Voltage
Lithium-ion batteries are composed of cells employing lithium intercalation compounds as positive and negative materials. Lithium-ion batteries can be manufactured using lithium cobalt oxide (LiCoO2 or LCO), manganese oxide (LiMn2O4 or LMO), lithium nickel manganese cobalt oxide (LiNiMnCoO2 or NMC), lithium iron phosphate (LiFePO4), lithium titanate (Li4Ti5O12), and lithium nickel cobalt aluminum oxide (LiNiCoAlO2) as shown in Table 1 [7].
Various sizes and shapes are produced by different manufacturers. A single cell typically operates in the range of 2.5 V to 4.2 V. The lithium-ion battery output voltage varies during discharging. Nominal voltage is the voltage that is measured when the battery has discharged 50% of its total energy based on a 0.2 C discharge rate. Because the energy of the battery depends on the product of the voltage and the capacity, a battery with a high energy density is obtained from a material with a high voltage and a large capacity [8].
2.2. Charging Voltage and State of Capacity
In general, stationary batteries are operated with floating charging, and discharge to the loads when the charging source is interrupted. There is a roughly linear relationship between the state of charge (SOC) of lead-acid batteries and the voltage of the open circuit (OCV). Unlike lead-acid batteries, lithium-ion batteries have no linear relationship between OCV and SOC [9]. The SOC of a battery is defined as the ratio of its current capacity (Qt) to the nominal capacity (Qn). The nominal or rated capacity (Ah) of a battery is defined as the maximum Ah a fully charged battery can discharge under certain specific conditions. These conditions include the battery’s end voltage, discharge current, and temperature.
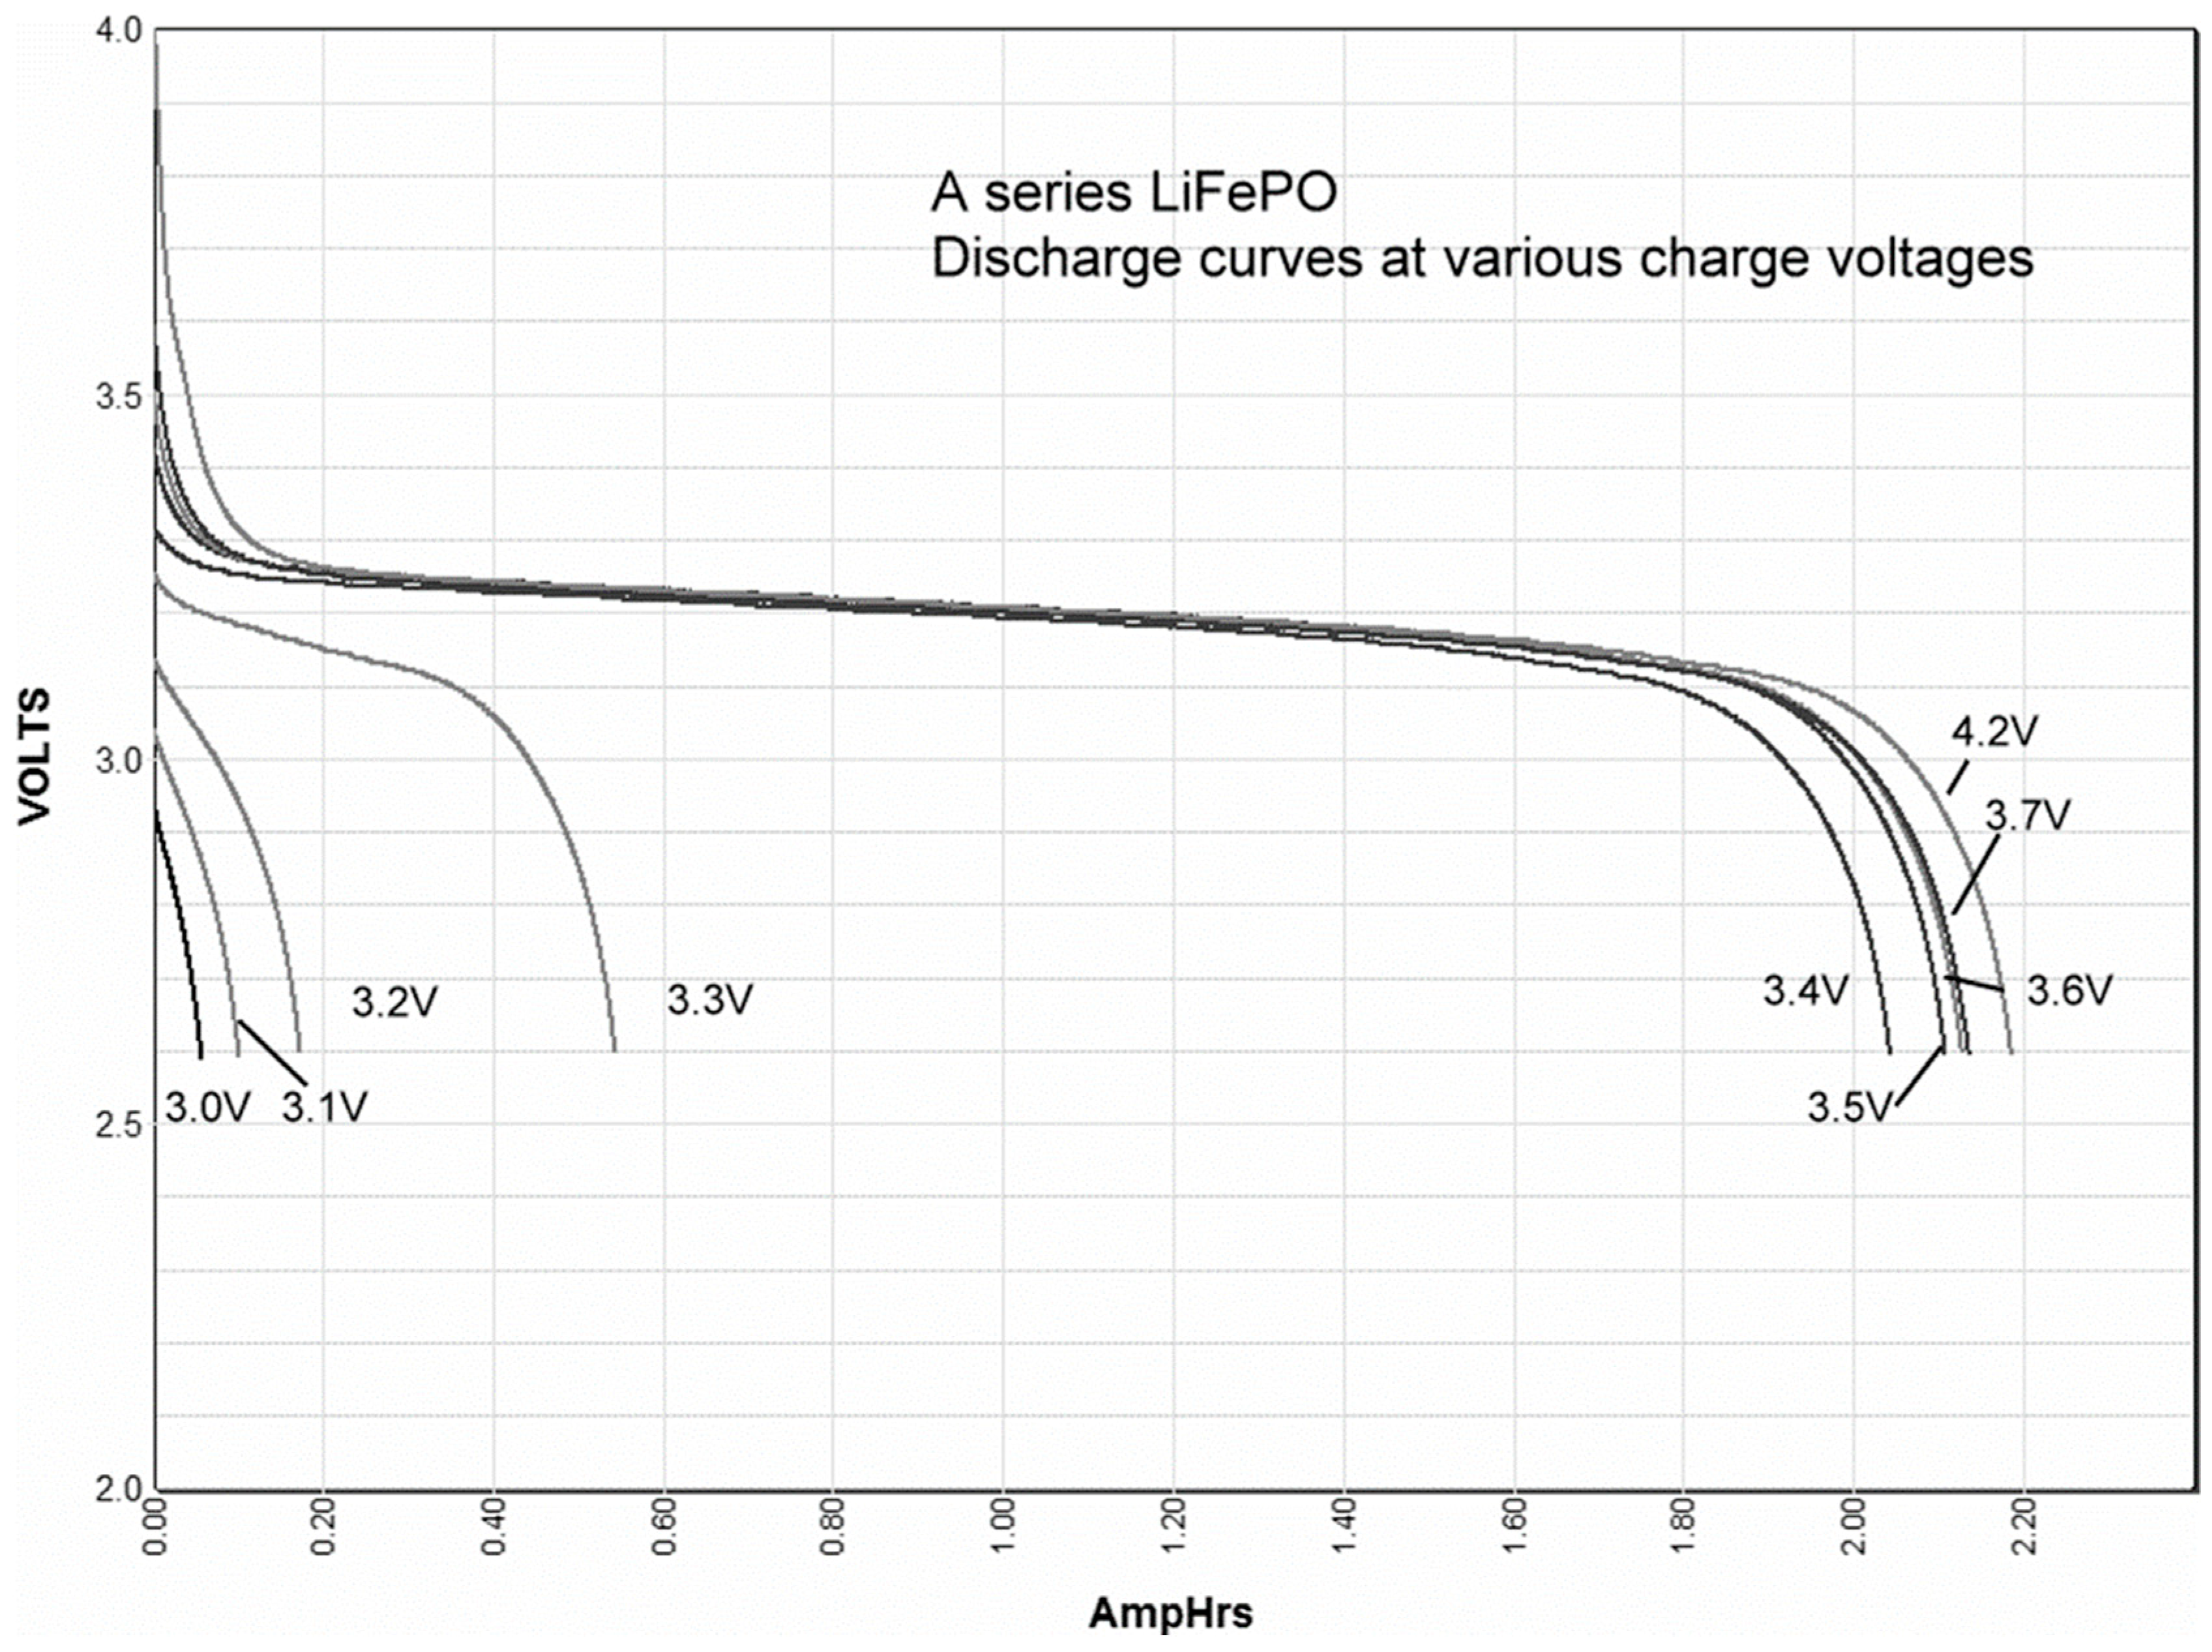
Most batteries have a distinct charge voltage. At voltages below that distinct voltage, the battery is not charged, and if the charge voltage is slightly higher than the distinct charge voltage, the battery is fully charged, although it may take a long time. However, lithium-ion (lithium-ion, lithium polymer, lithium-ion phosphate, etc.) batteries are not the same as other types of batteries. The amount of charging depends on the voltage as shown in Figure 1 [10]. Continuing to charge a fully charged battery could cause a fire due to overcharging. Recently in Korea, there have been frequent fires in the ESS (energy storage system) operating in conjunction with solar power. Therefore, the manufacturer recommended that customers limit the amount of charge below a certain level to prevent overcharging until the causes of the fire are verified.
2.2.1. Charging Process and Voltage
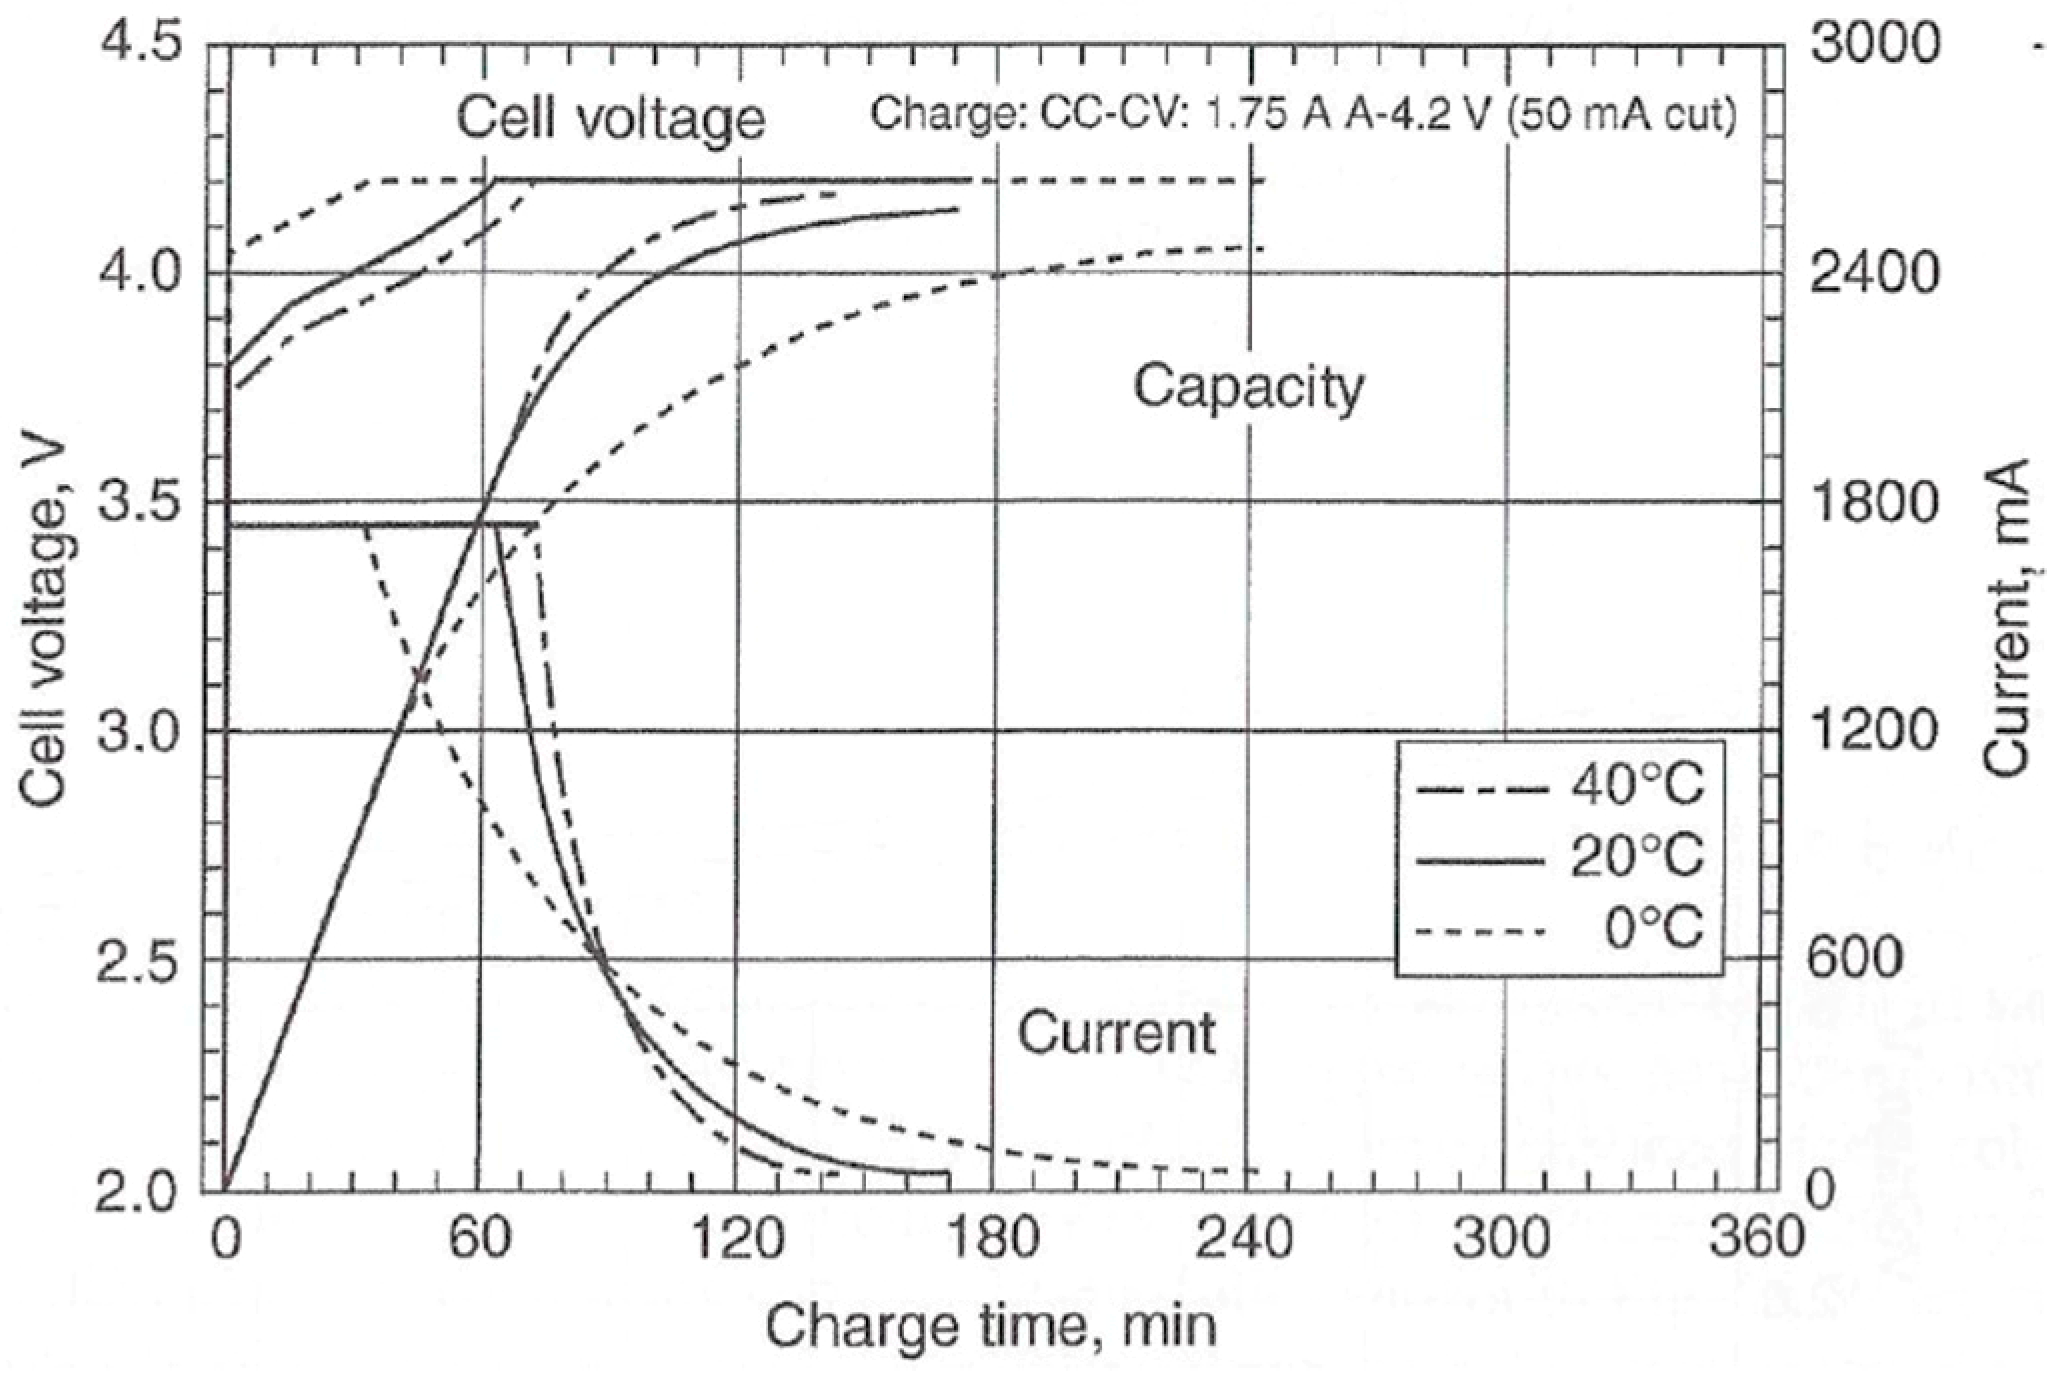
There are several methods of lithium-ion battery charging. They are the trickle charging, five-step charging, pulse charging, and boost charging methods. One of the most renowned charging methods is trickle charging [11]. Trickle charging refers to charging a fully charged battery at the same rate as the self-discharge rate thus that the battery can maintain a full charge level. However, lithium-ion batteries cannot be trickle charged safely. In that case, the charging circuit controls the electrical conditions during charging to match the requirements of the battery chemistry. The graph in Figure 2 [12] shows the behavior of a constant current/constant voltage (CCCV) charging process of a lithium-ion battery cell. The charger limits the amount of current to a pre-set level until the battery reaches a pre-set cut-off voltage level. The current then reduces as the battery becomes fully charged. This system allows fast charging without the risk of over-charging.
2.2.2. Float Charging Voltage
The float voltage is a voltage that maintains the charge state of the battery after being fully charged by compensating the self-discharge. The appropriate float voltage will vary greatly depending on the chemistry and structure of the battery and the ambient temperature [13].
Whereas lead-acid, NiCd and NiMH cells are designed to be able to make a recombination; lithium-ion cells cannot. When a lead-acid battery is overcharged, the positive plate generates oxygen and the negative plate produces hydrogen gas. Then, oxygen and hydrogen make the recombination and convert into water. (O2 + 4H + 4e− 2H2O). However, any current forced into a fully-charged lithium-ion damages it and/or reduces its cell life. In the wake of frequent lithium-ion battery type energy storage system (ESS) fire accidents, battery manufacturers have recommended lowering the SOC ceiling from 90% to 70%. Because lithium-ion cells are degraded irreversibly by overcharge or over discharge and may vent if overcharged, lithium-ion batteries typically employ battery management circuitry to maintain charging voltage less than the cut-off voltage and prevent overcharging [14].
On the other hand, according to the experiment in reference [15], the LiFePO4 cathode battery retained 70% of its initial discharge capacity after a 24-month float charge test. The capacity reduction rate increased with increasing temperature, and the capacity dropped to 60% of the initial value after one month of float charging test performed at 55 °C. Therefore, both the float charge voltage and float charge time must be taken into account when determining the required capacity of a lithium-ion stationary battery.
2.3. Discharge Current and Discharge Capacity
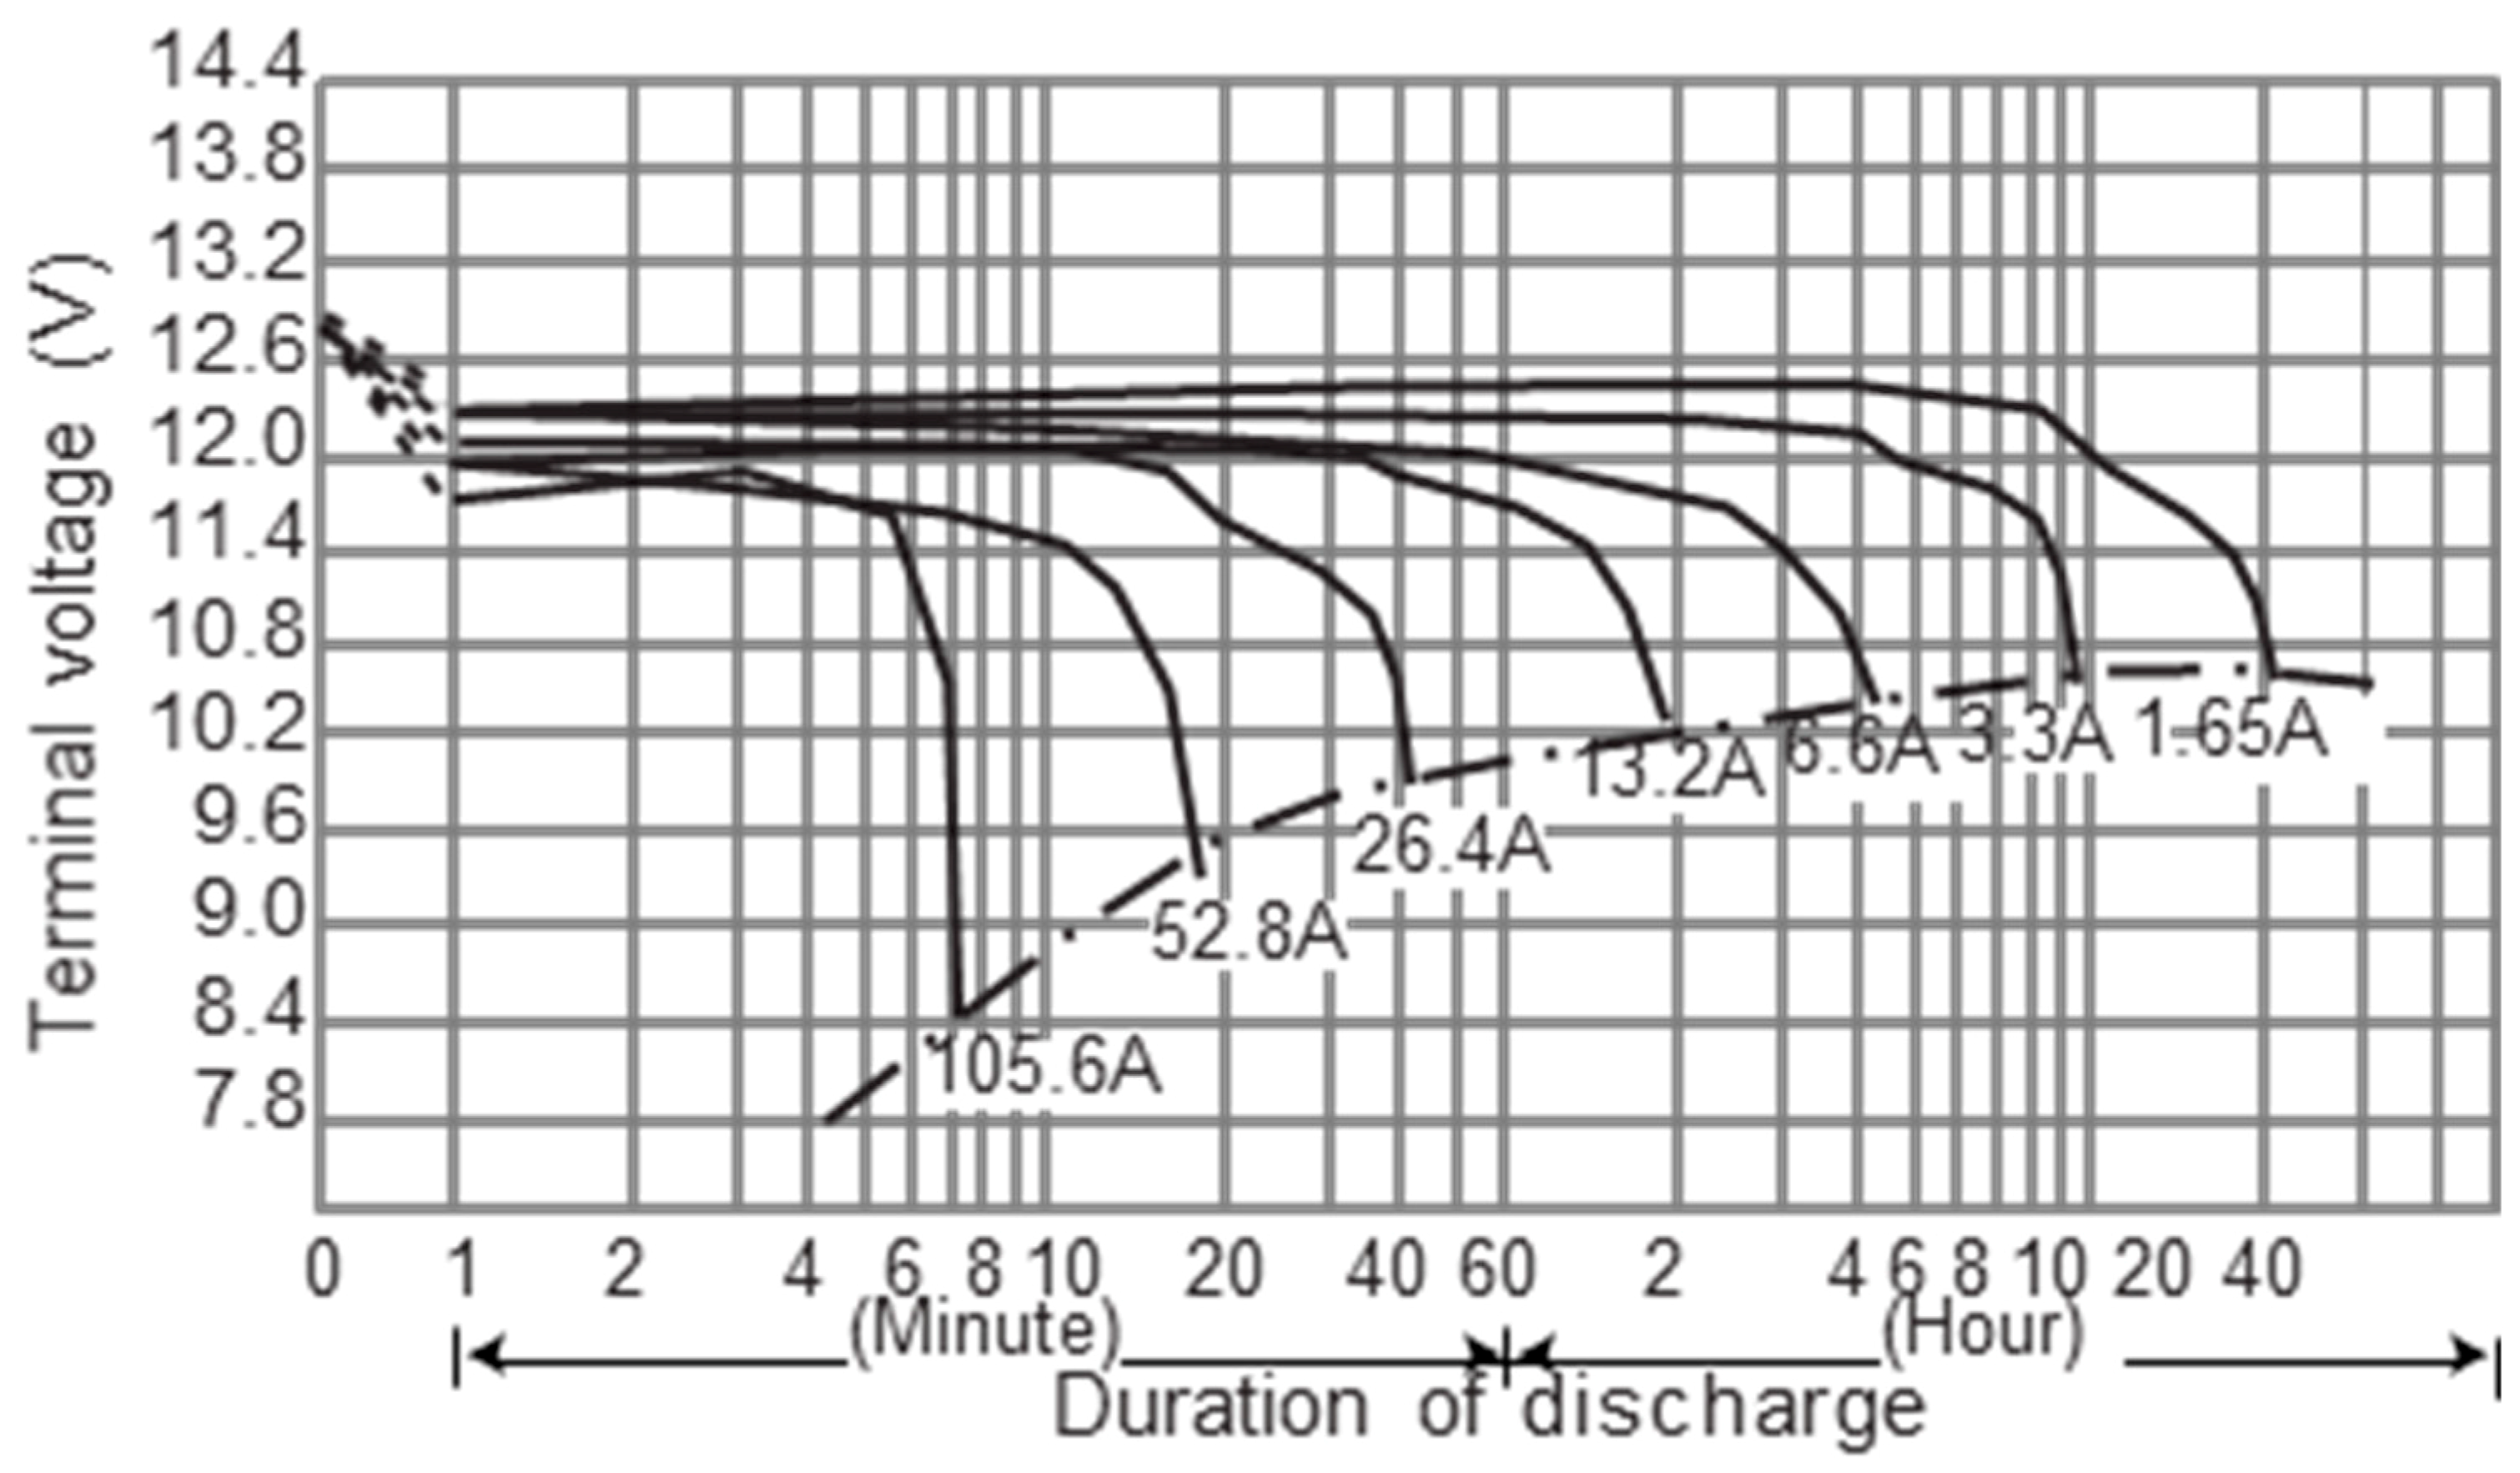
The discharge capacity of the lead-acid battery varies with the discharge current due to the Peukert formula k constant. The larger the discharge current, the greater the difference in discharge capacity. In other words, the discharge capacity of a lead-acid battery exponentially decreases at high currents as shown in Figure 3 [16].
The discharge characteristics of lead-acid batteries, which are mainly used for industrial purposes, are represented by the following Peukert’s law.
where;
- Qp Discharge capacity when discharging at 1 A [Ah]
- I Discharge current [A]
- T Discharge time to reach discharge terminating voltage [s]
- K Constant, approximately 1.3.
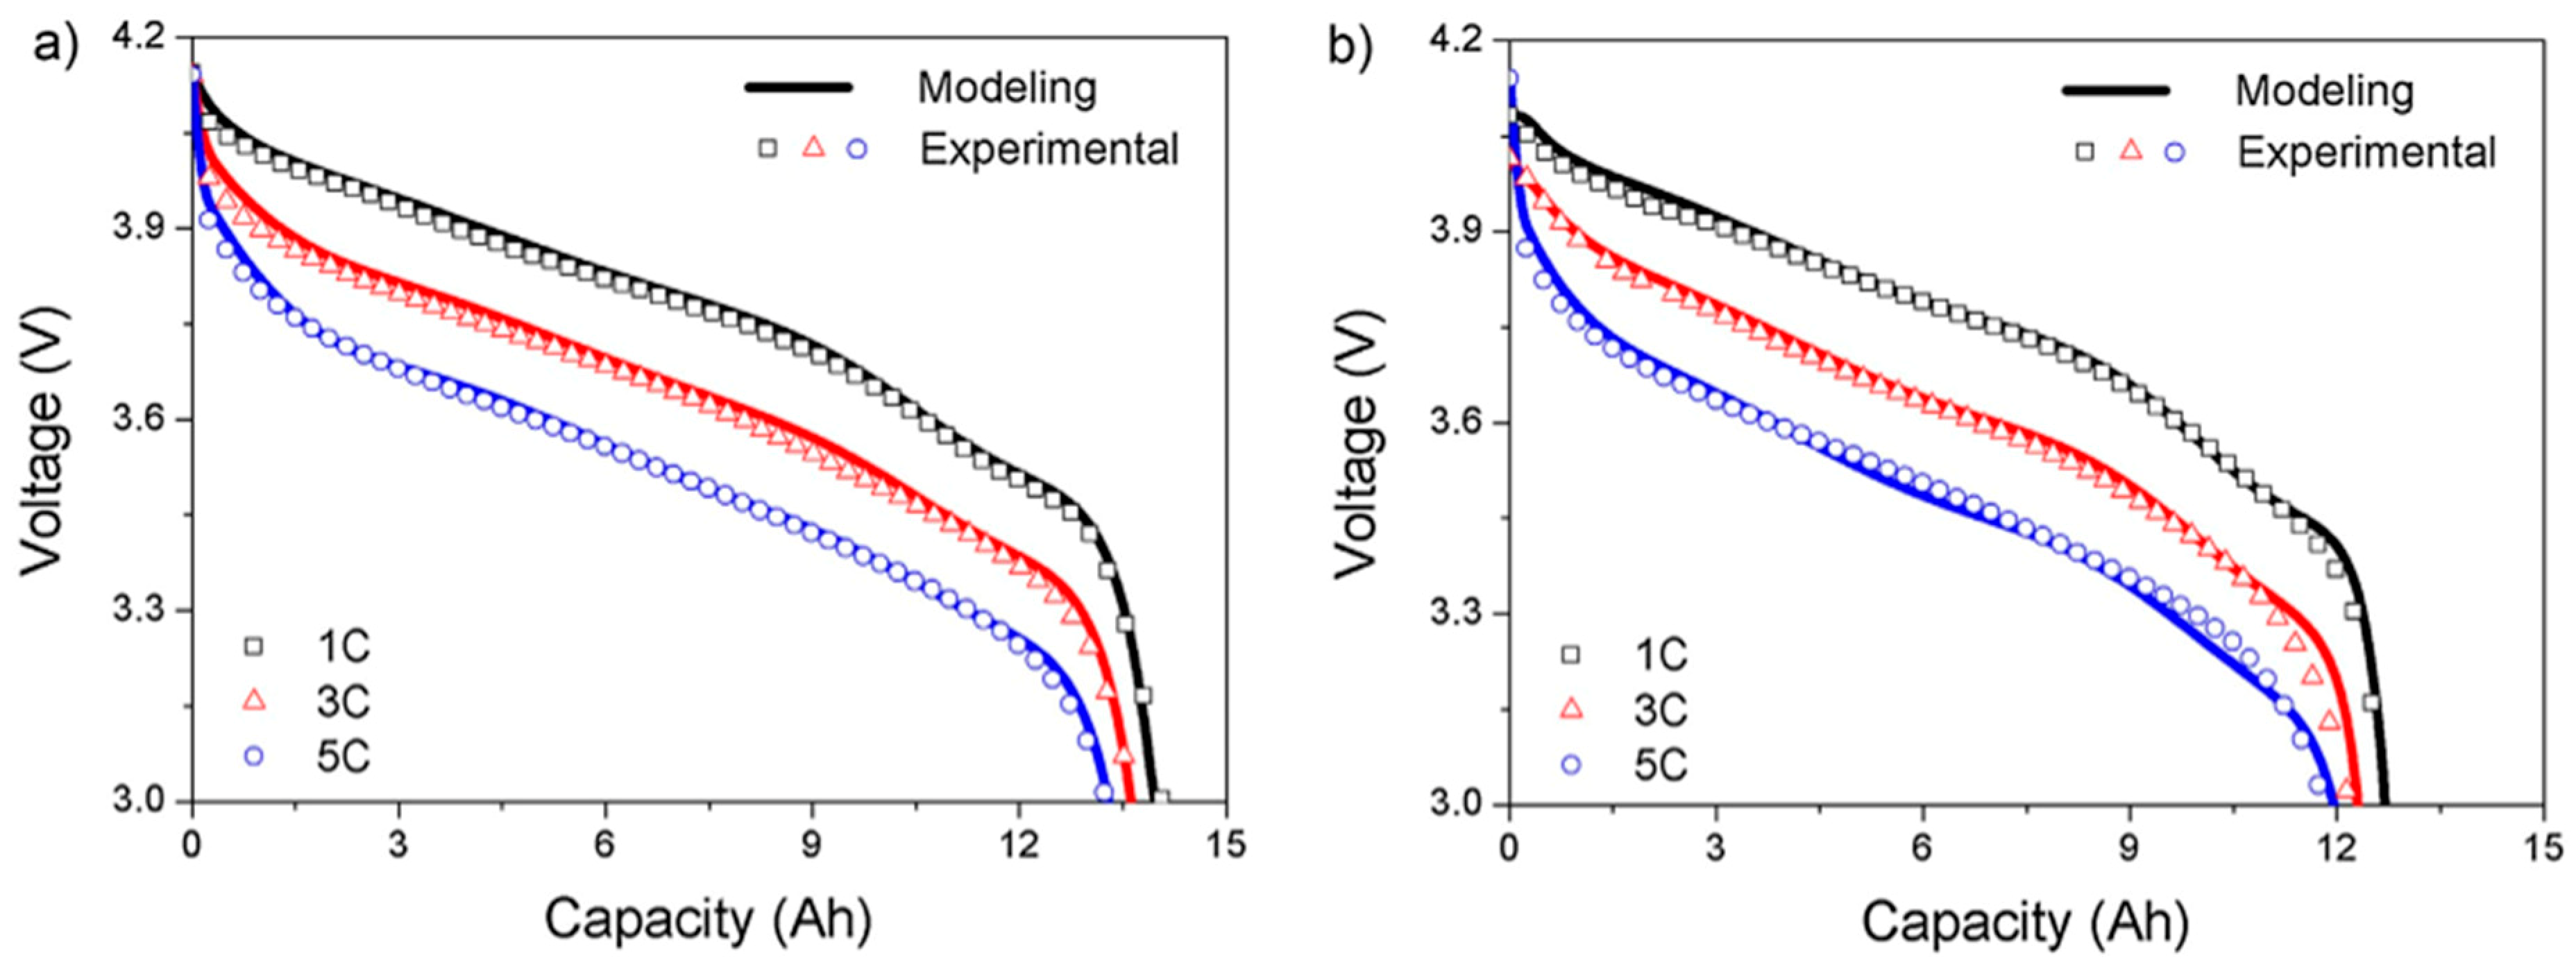
On the other hand, the lithium-ion battery has a k-constant close to unity. This means that the discharge capacity of the battery does not vary greatly depending on the magnitude of the discharge current and exhibits good discharge characteristics at a high discharge rate. However, as the end voltage increases, differences in the discharge capacity depending on the discharge rate begin to increase. And as the number of charge-discharge cycles increases, the difference in discharge capacity according to the discharge rate increases as shown in Figure 4 [17].
2.4. Operating Temperature and Discharge Capacity
Lithium-ion batteries are capable of operating over a relatively wide temperature range as listed in Table 2 [18]. In addition, it is more affected by temperature during charging than discharging.
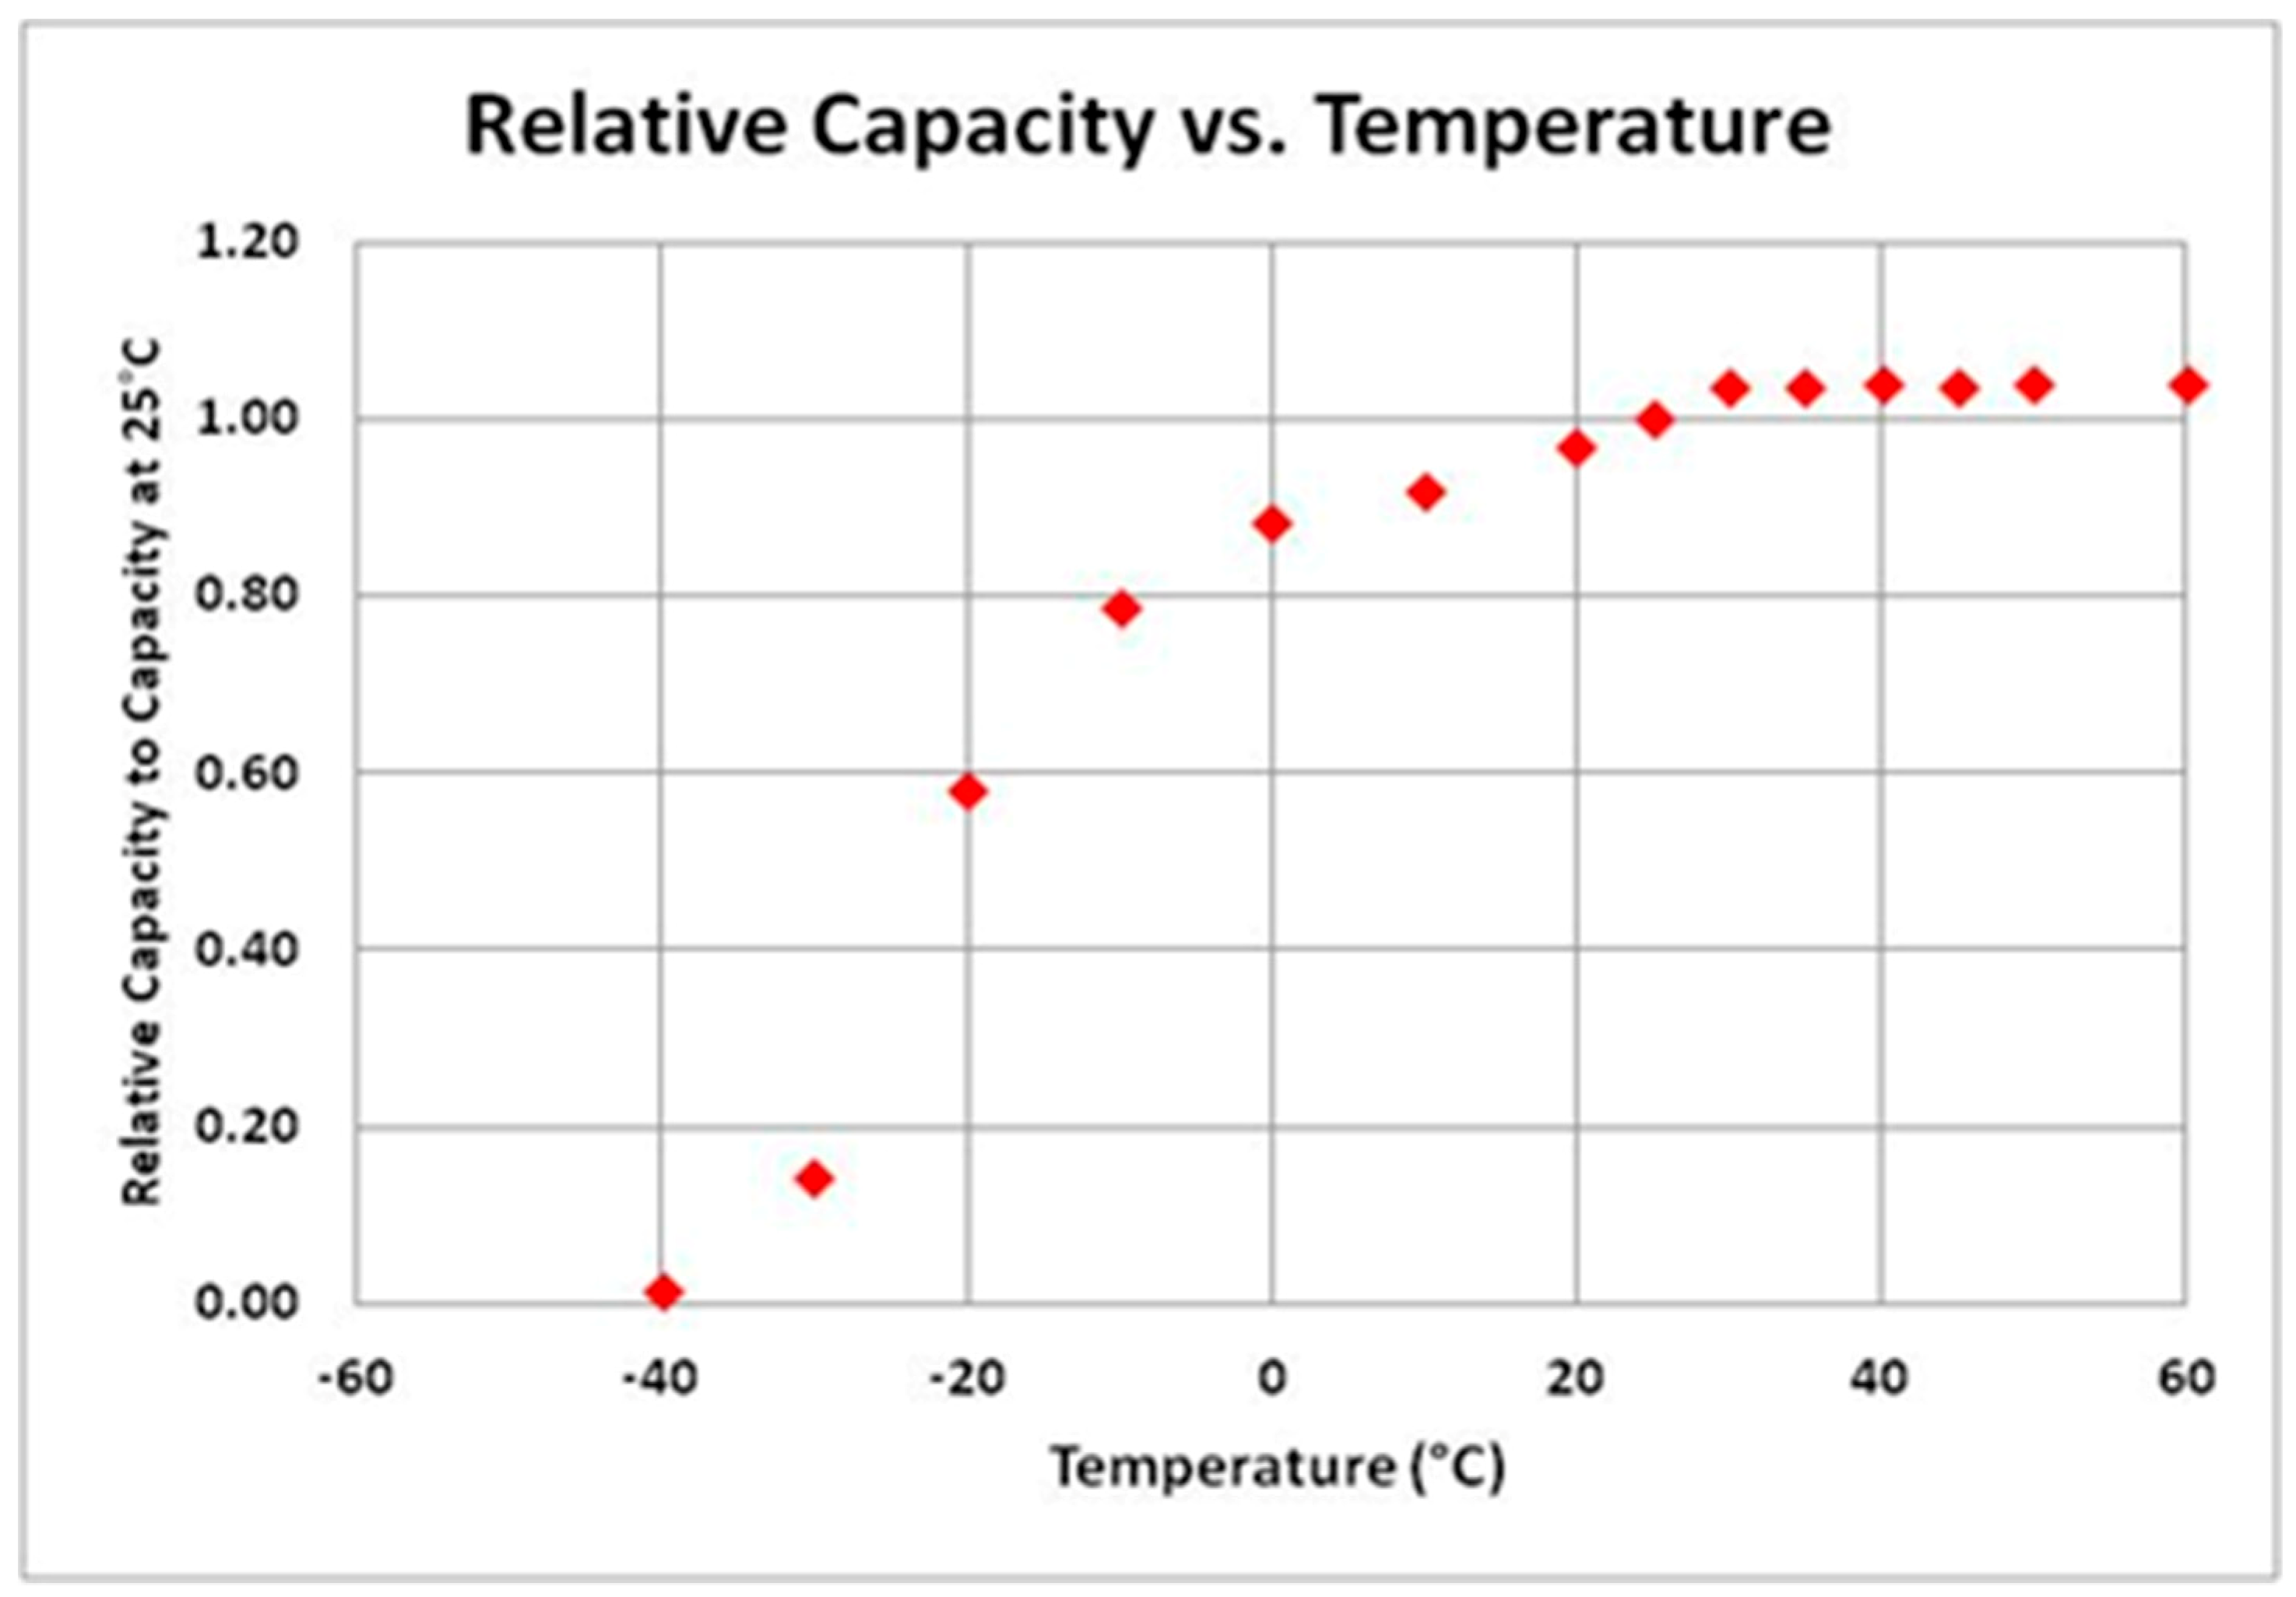
Charging performance deteriorates at extremely low or high temperatures. Lead-acid batteries can be charged at below 0 °C. However, the recommended charging current is 0.3 C. The higher the temperature, the greater the discharge capacity of lead-acid batteries as listed in “Table 1. Cell size correction factors for temperature” of IEEE Std. 485-1997 [19]. All batteries achieve optimal service life when used at 20 °C temperature or slightly lower. At 40 °C, the loss increases by as much as 40%, and when charged and discharged at 45 °C, the cycle life is only half of the expected lifetime at 20 °C. The performance of all batteries drops greatly at low temperatures. At 0 °C, the temperature loss of the lithium-ion battery is about 10~20 percent of its rated capacity at 25 °C.
Figure 5 may be used for preliminary input data [20]. The lithium-ion battery is degraded at above 35 °C, especially beyond 50 °C [21].
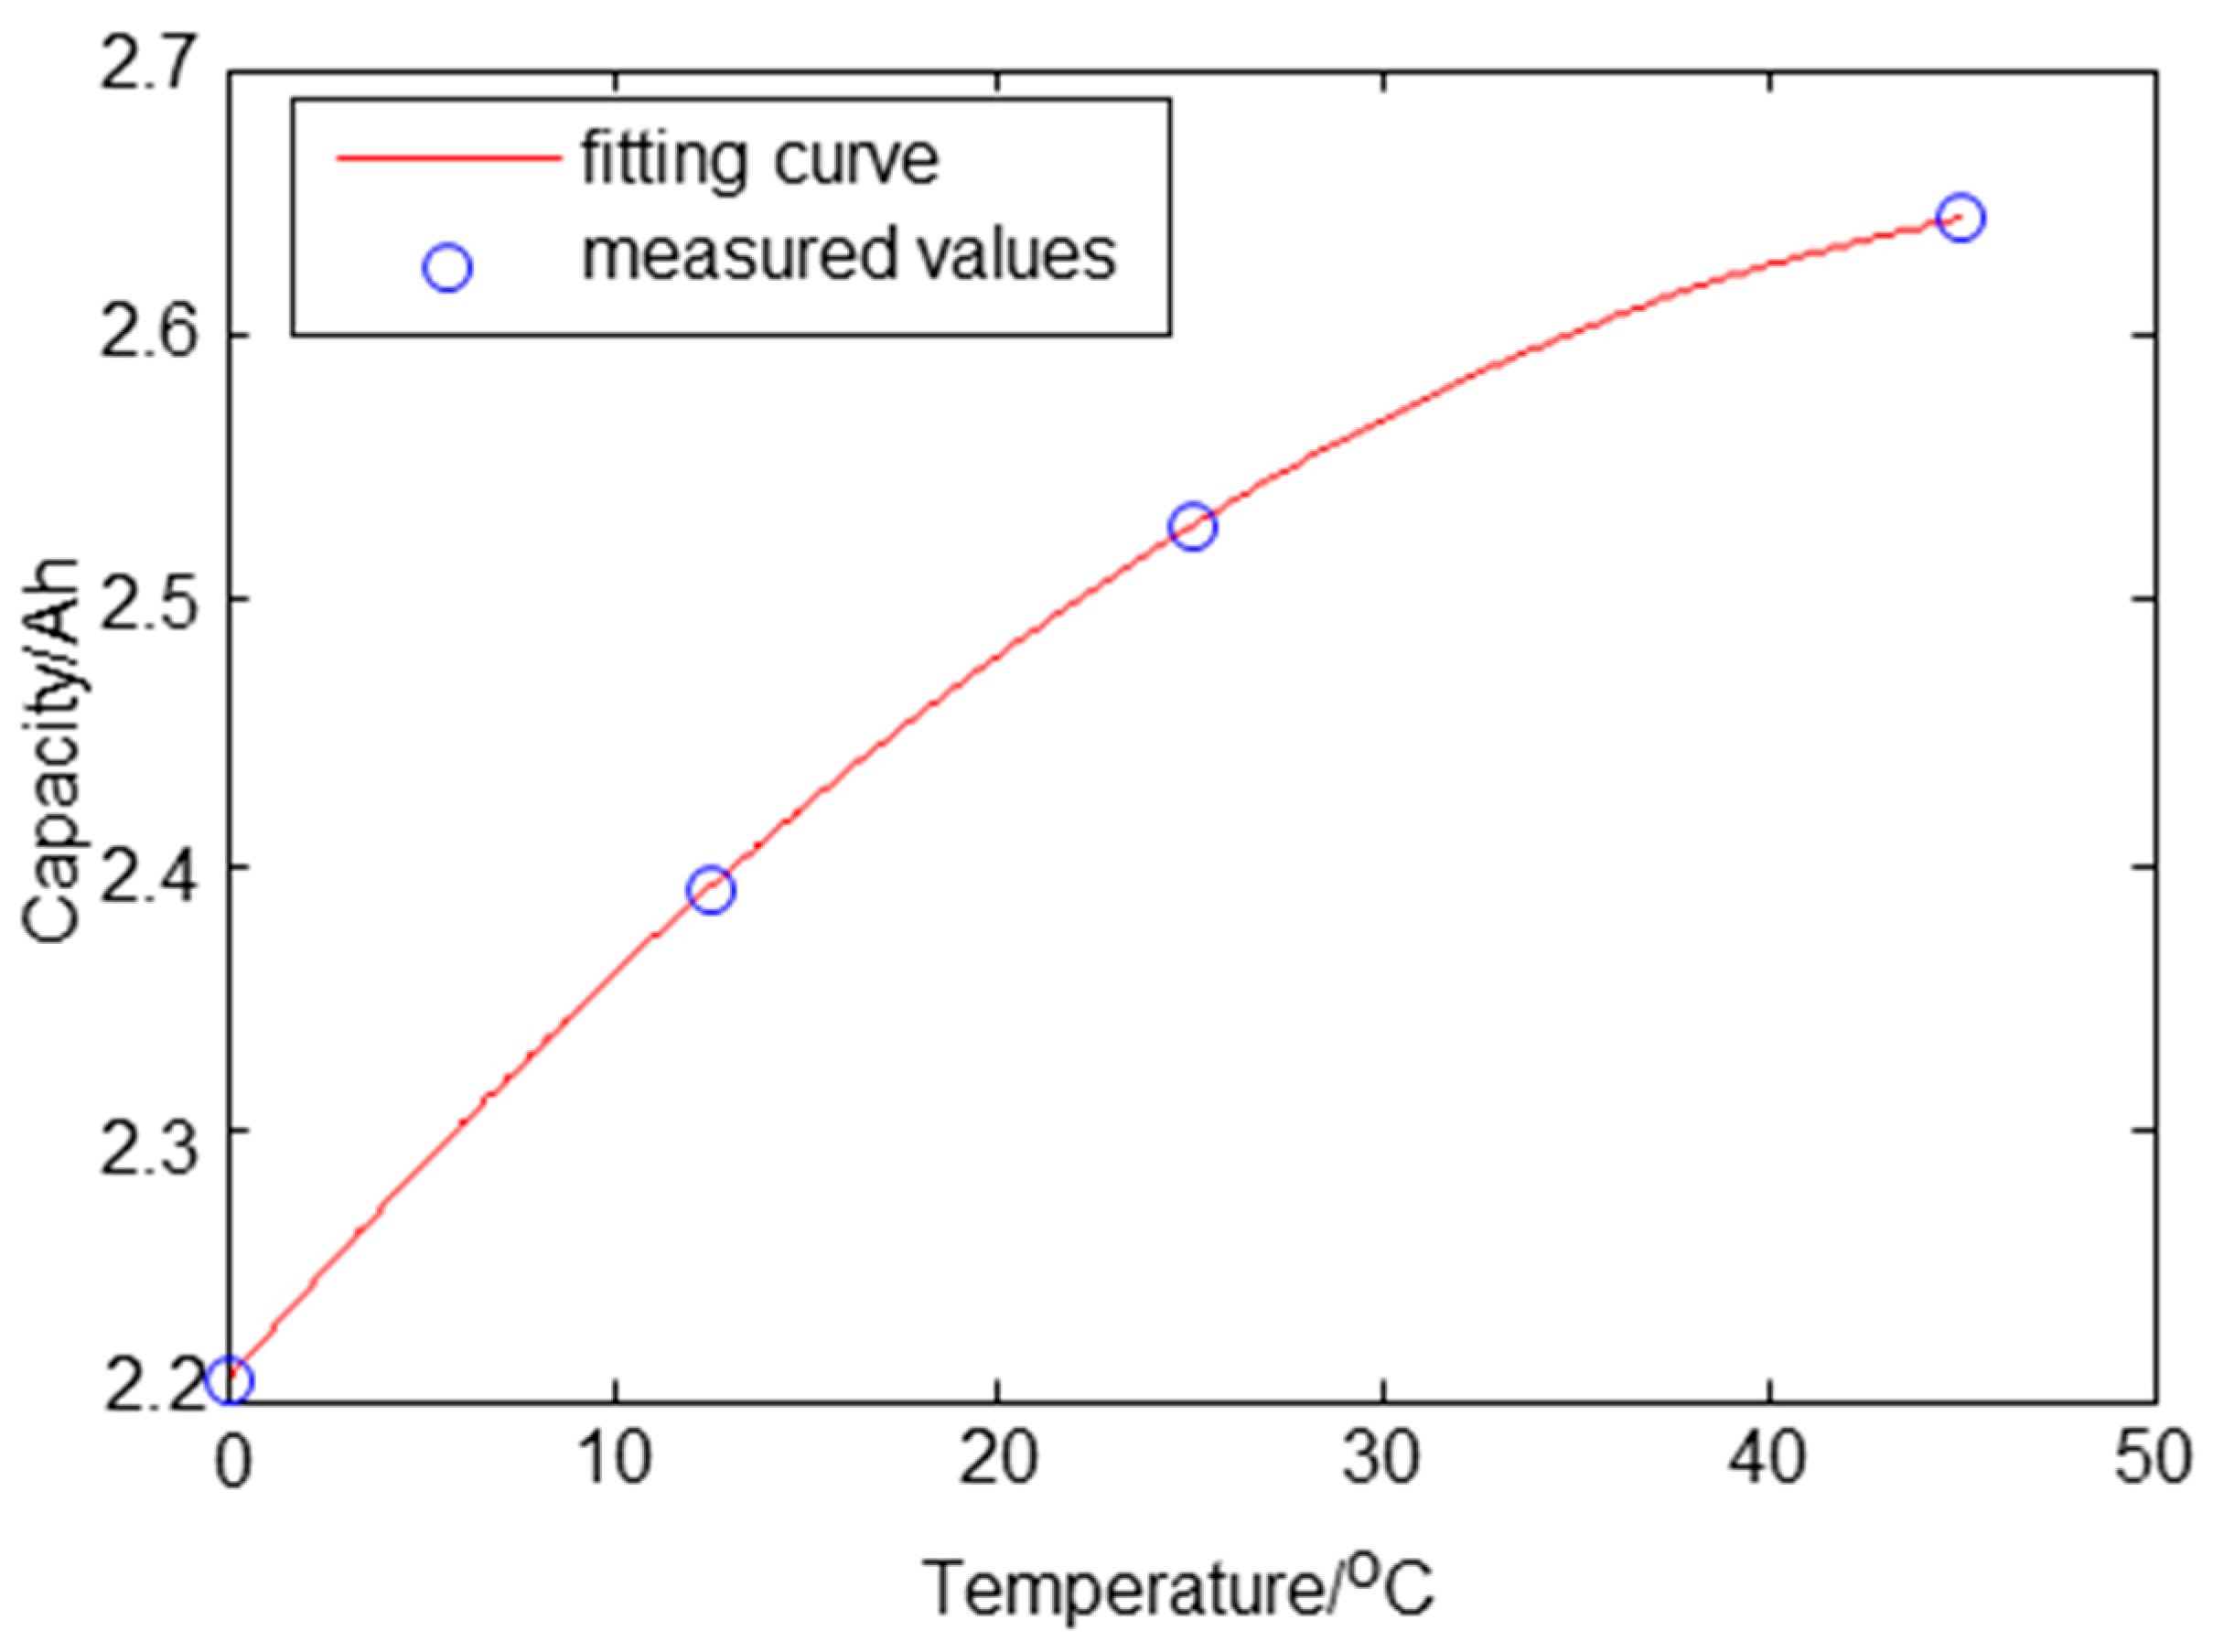
According to an experiment where a graphite/LiNixCoyMnzO2 cell with a nominal voltage of 3.6 V and nominal capacity 2.5 Ah was tested, predicting the battery capacity from the ambient temperature is possible. Figure 6 [22] is the temperature vs. discharge capacity curve plotted through the interpolation. Due to the slow diffusion in the battery, the effect of temperature on the battery takes a long time to appear. Therefore, it is more reasonable to predict the battery capacity from the ambient temperature than from the battery temperature.
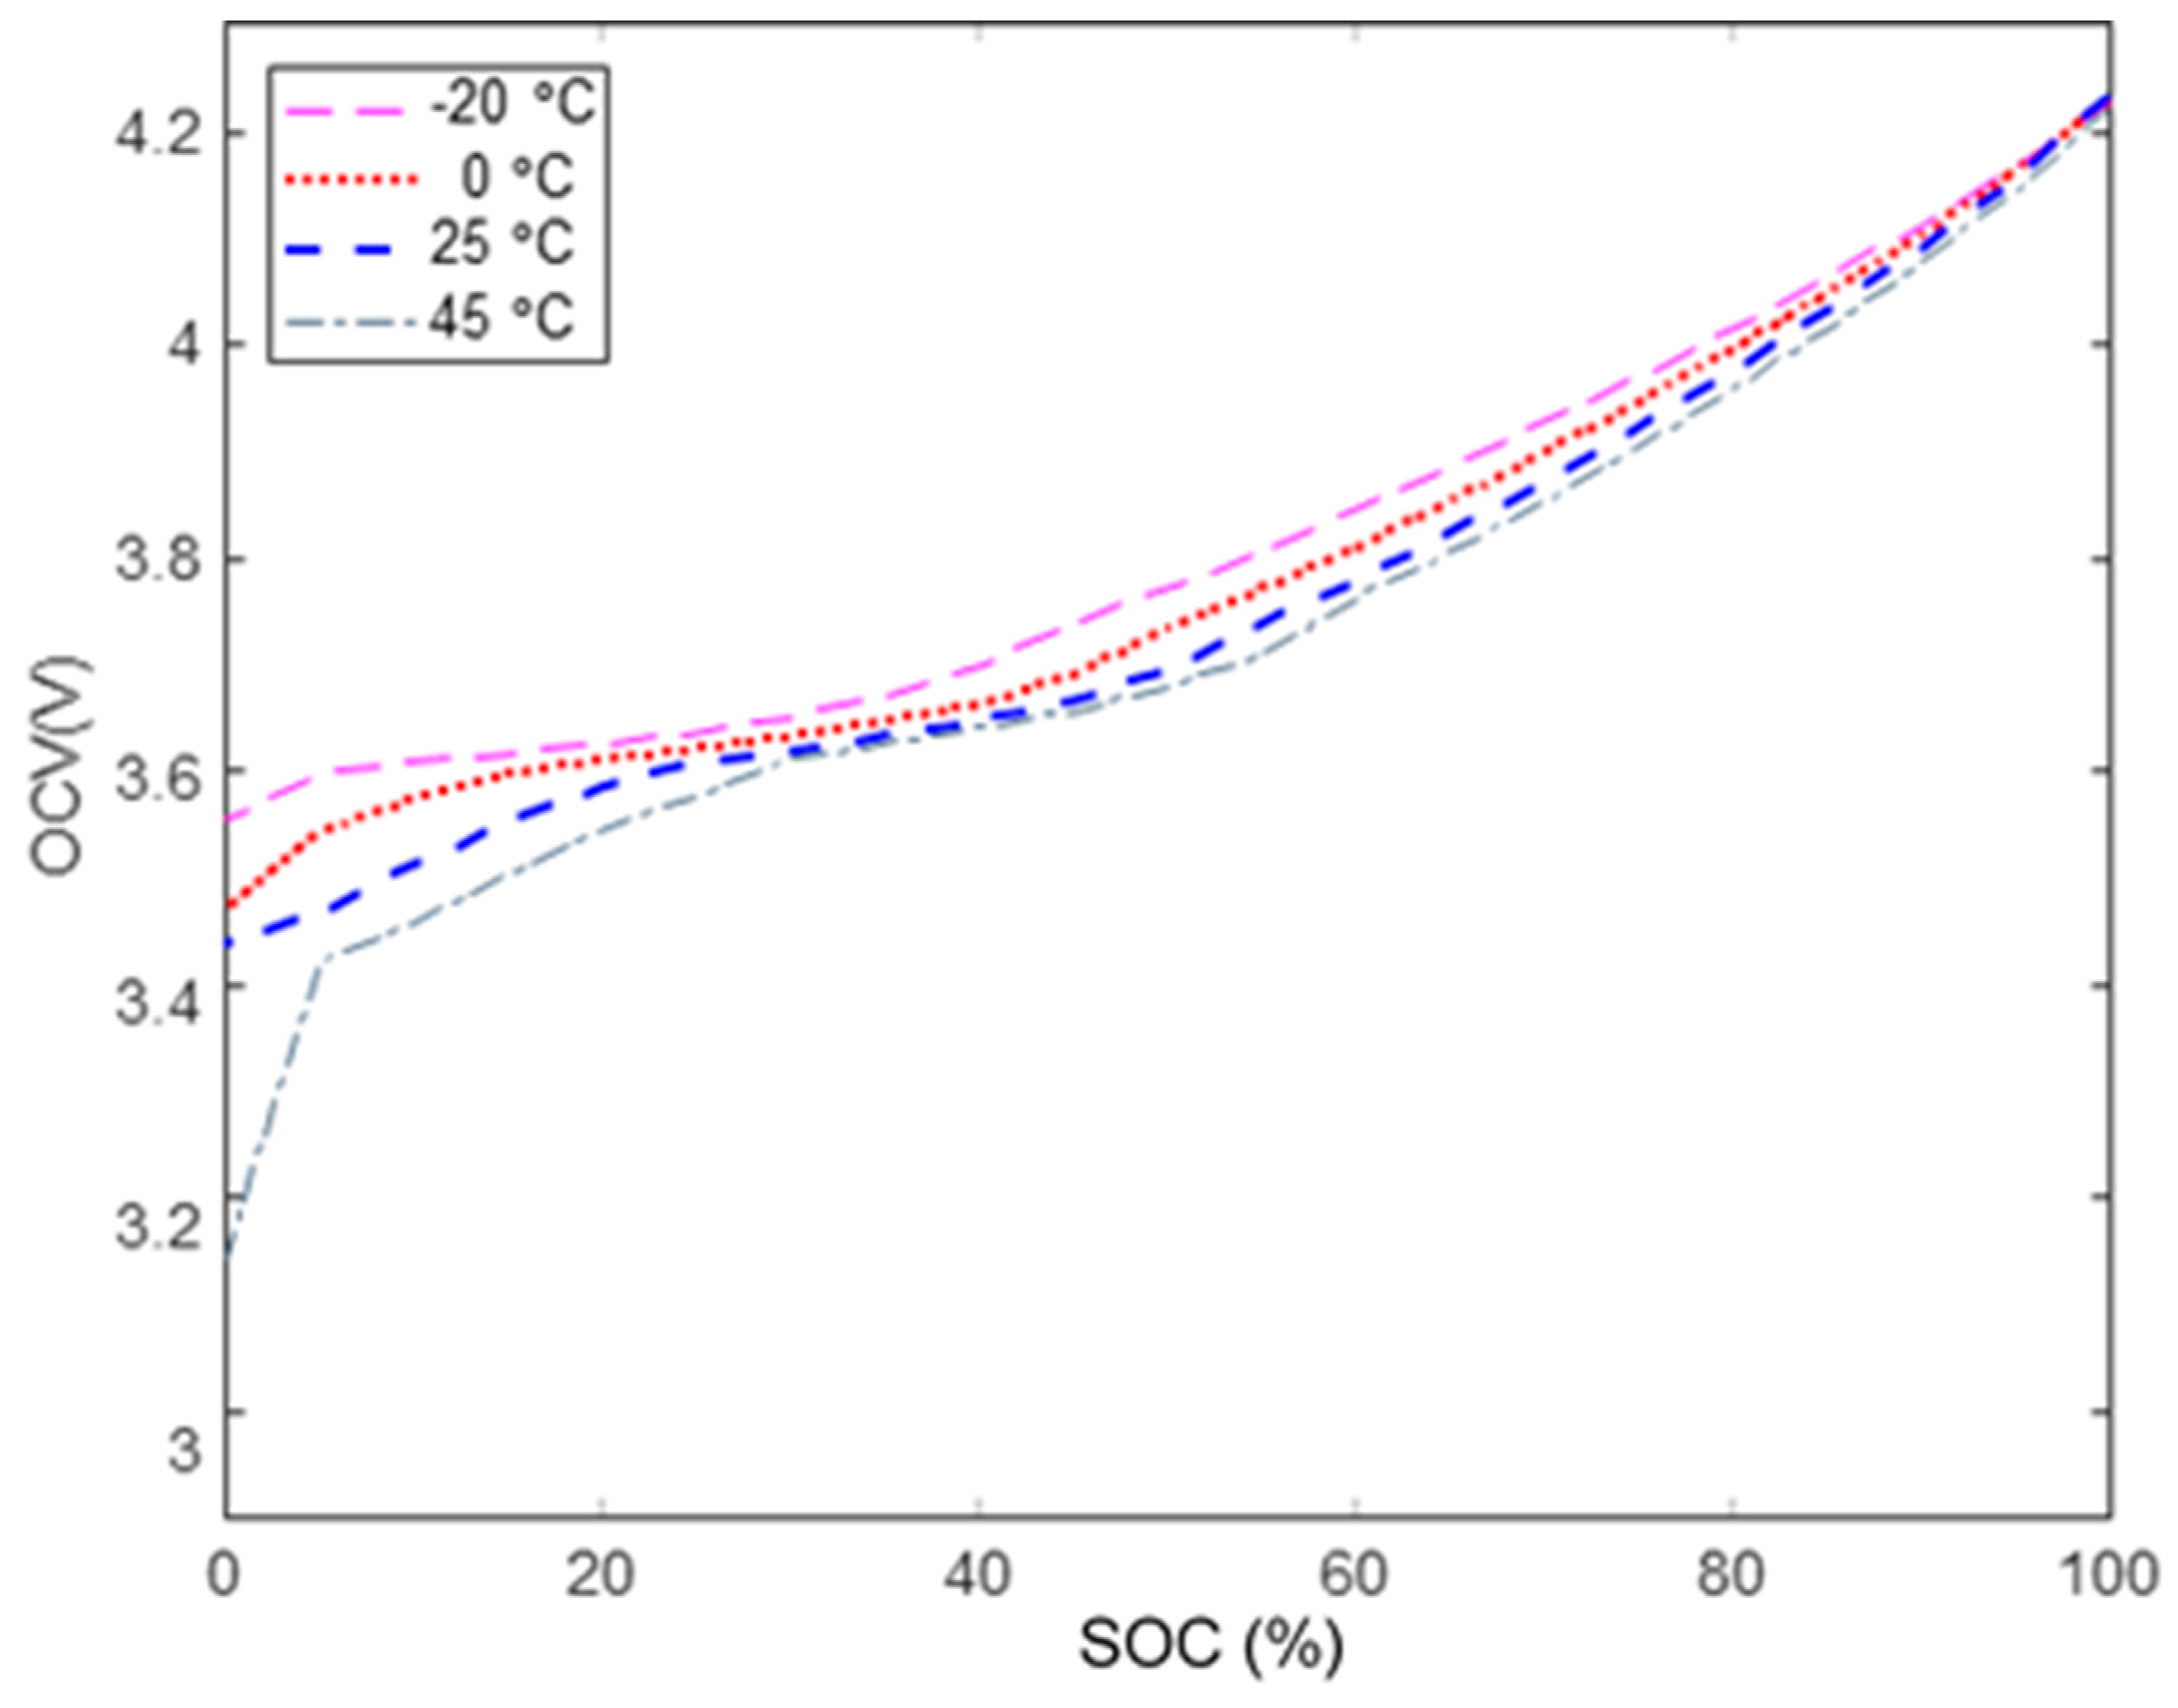
Meanwhile, regarding the relation between temperature and discharge capacity, Figure 7 [23] shows the battery OCV-SOC curves at temperatures of 45 °C, 25 °C, 0 °C, and −20 °C. The OCV-SOC curve is very different, especially under the influence of high and low temperatures. In the diagram, the higher the ambient temperature, the lower the battery’s discharge cut-off voltage, the greater the battery’s discharge capacity. The OCV-SOC characteristic curve represents the overall downward shift. Conversely, the lower the ambient temperature, the higher the battery’s discharge cut-off voltage, producing more battery power that cannot be released.
2.5. Charging Cycle and Capacity Retention
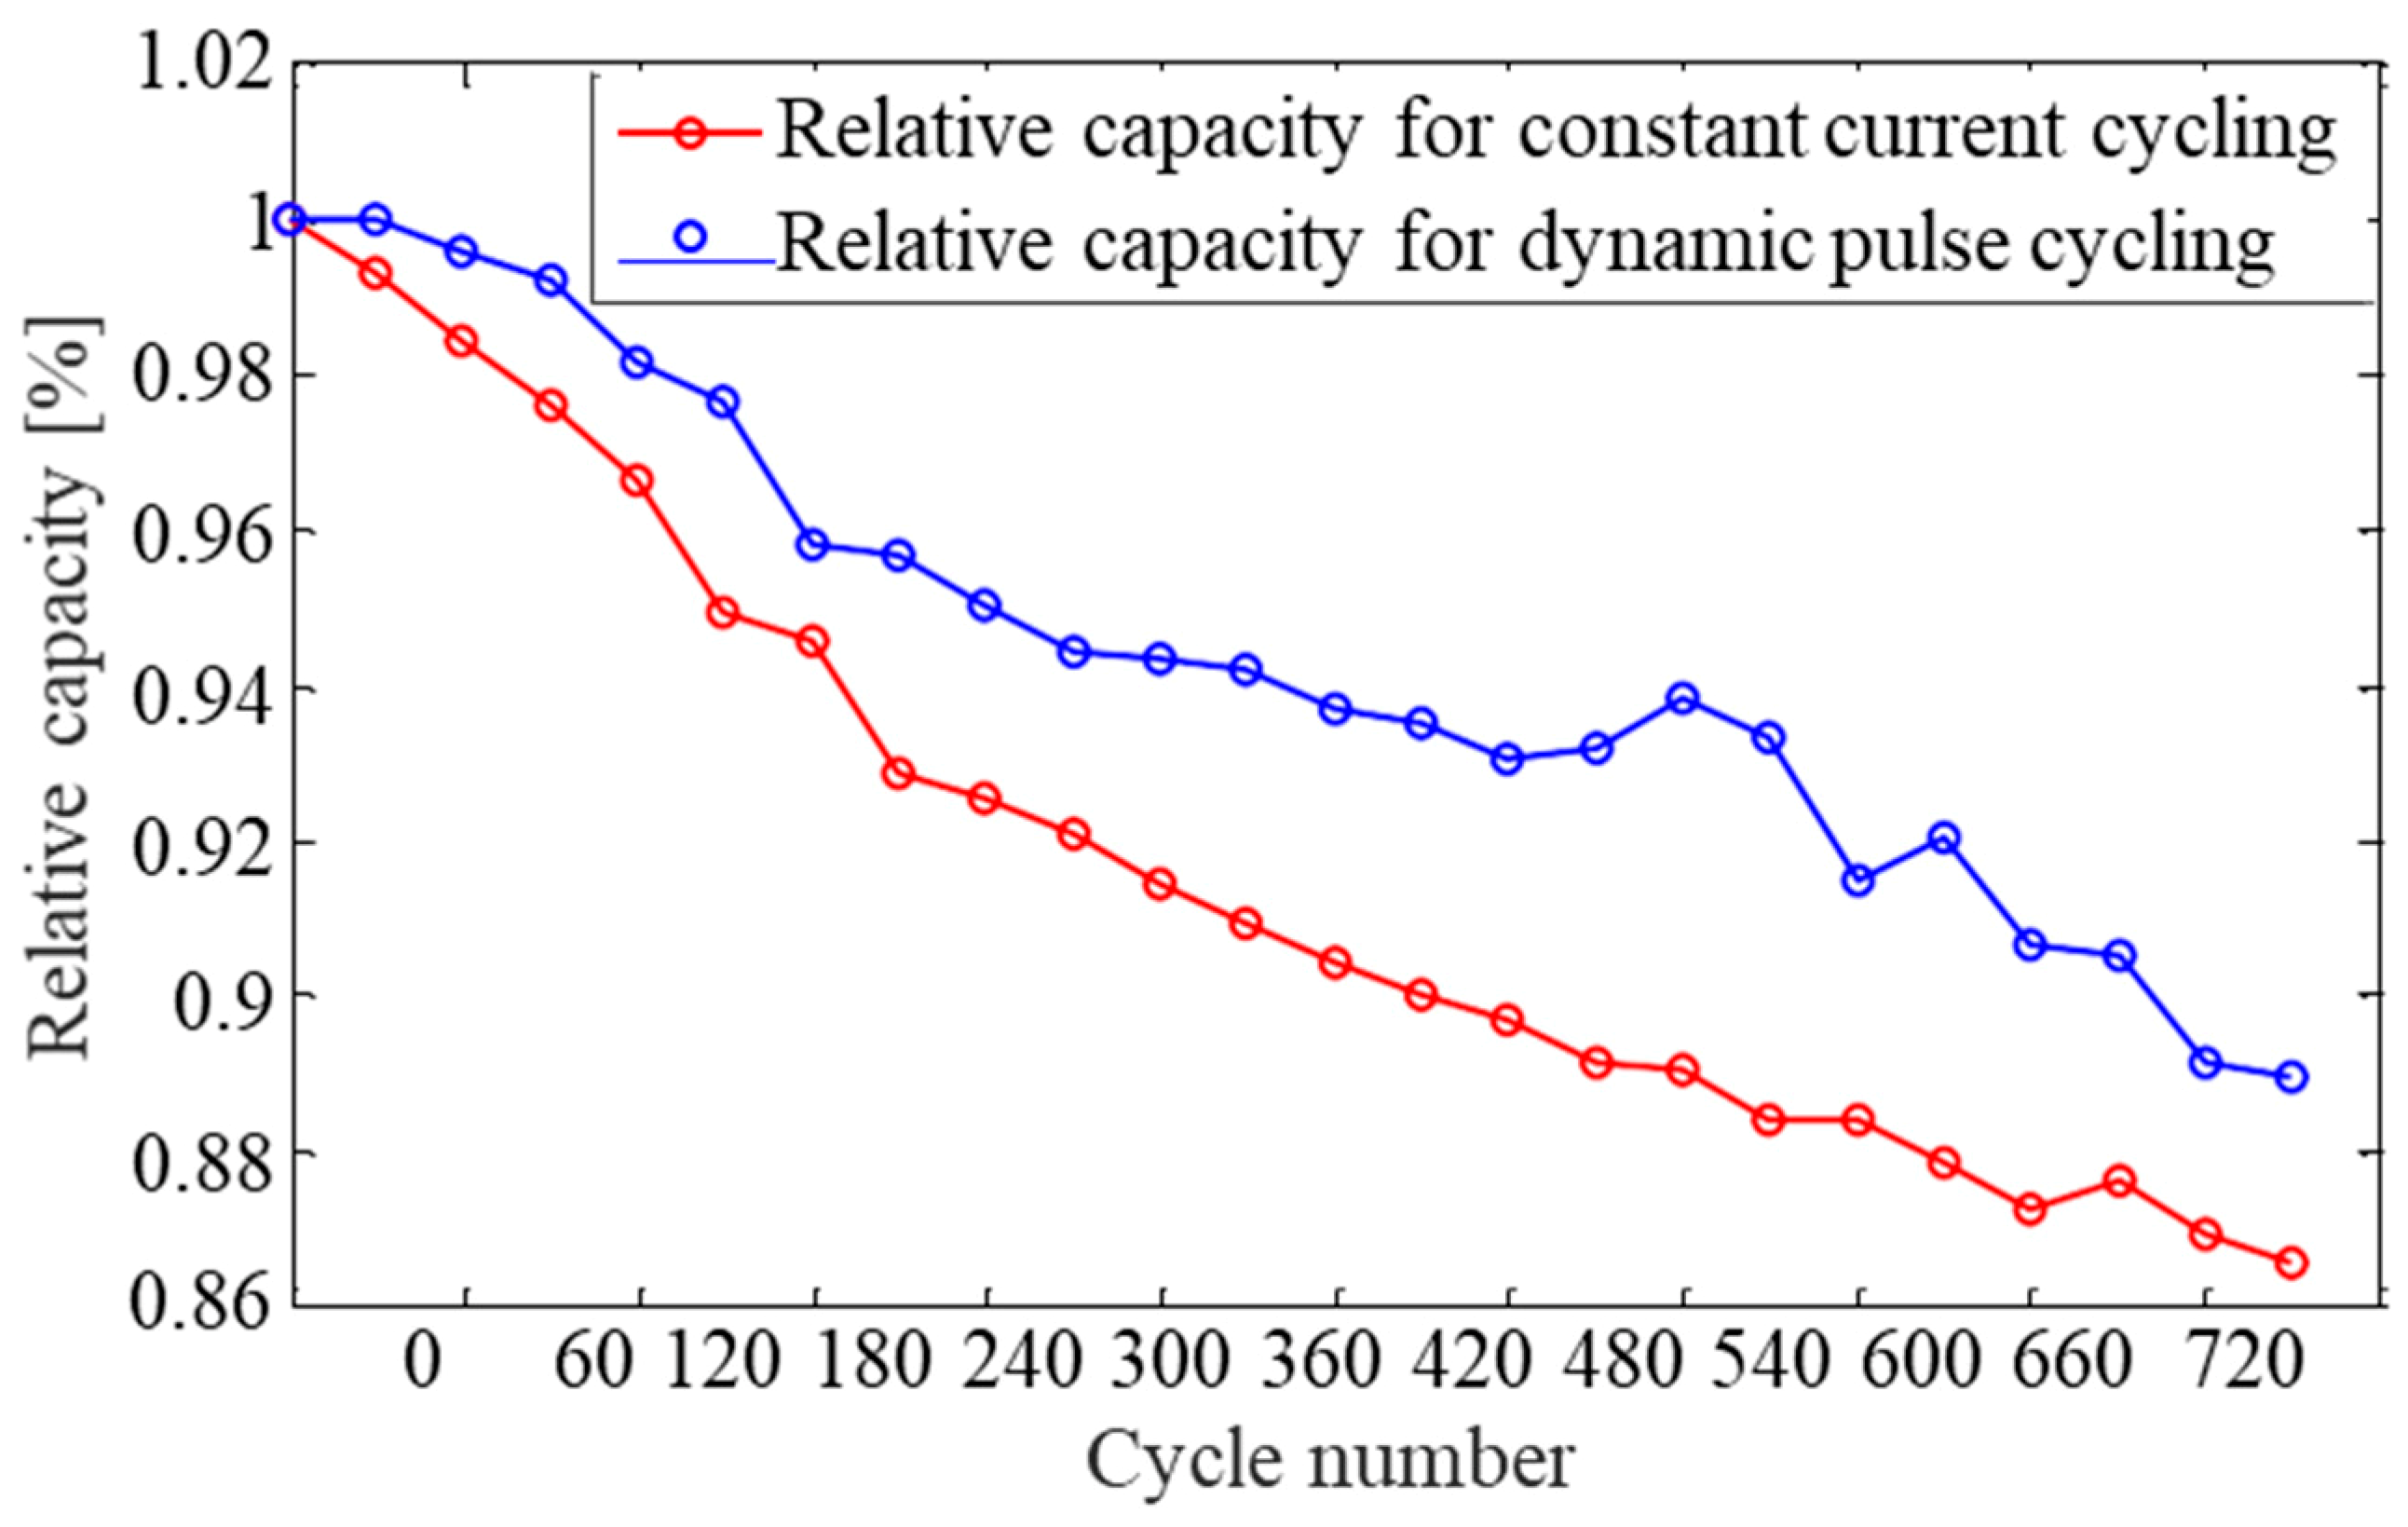
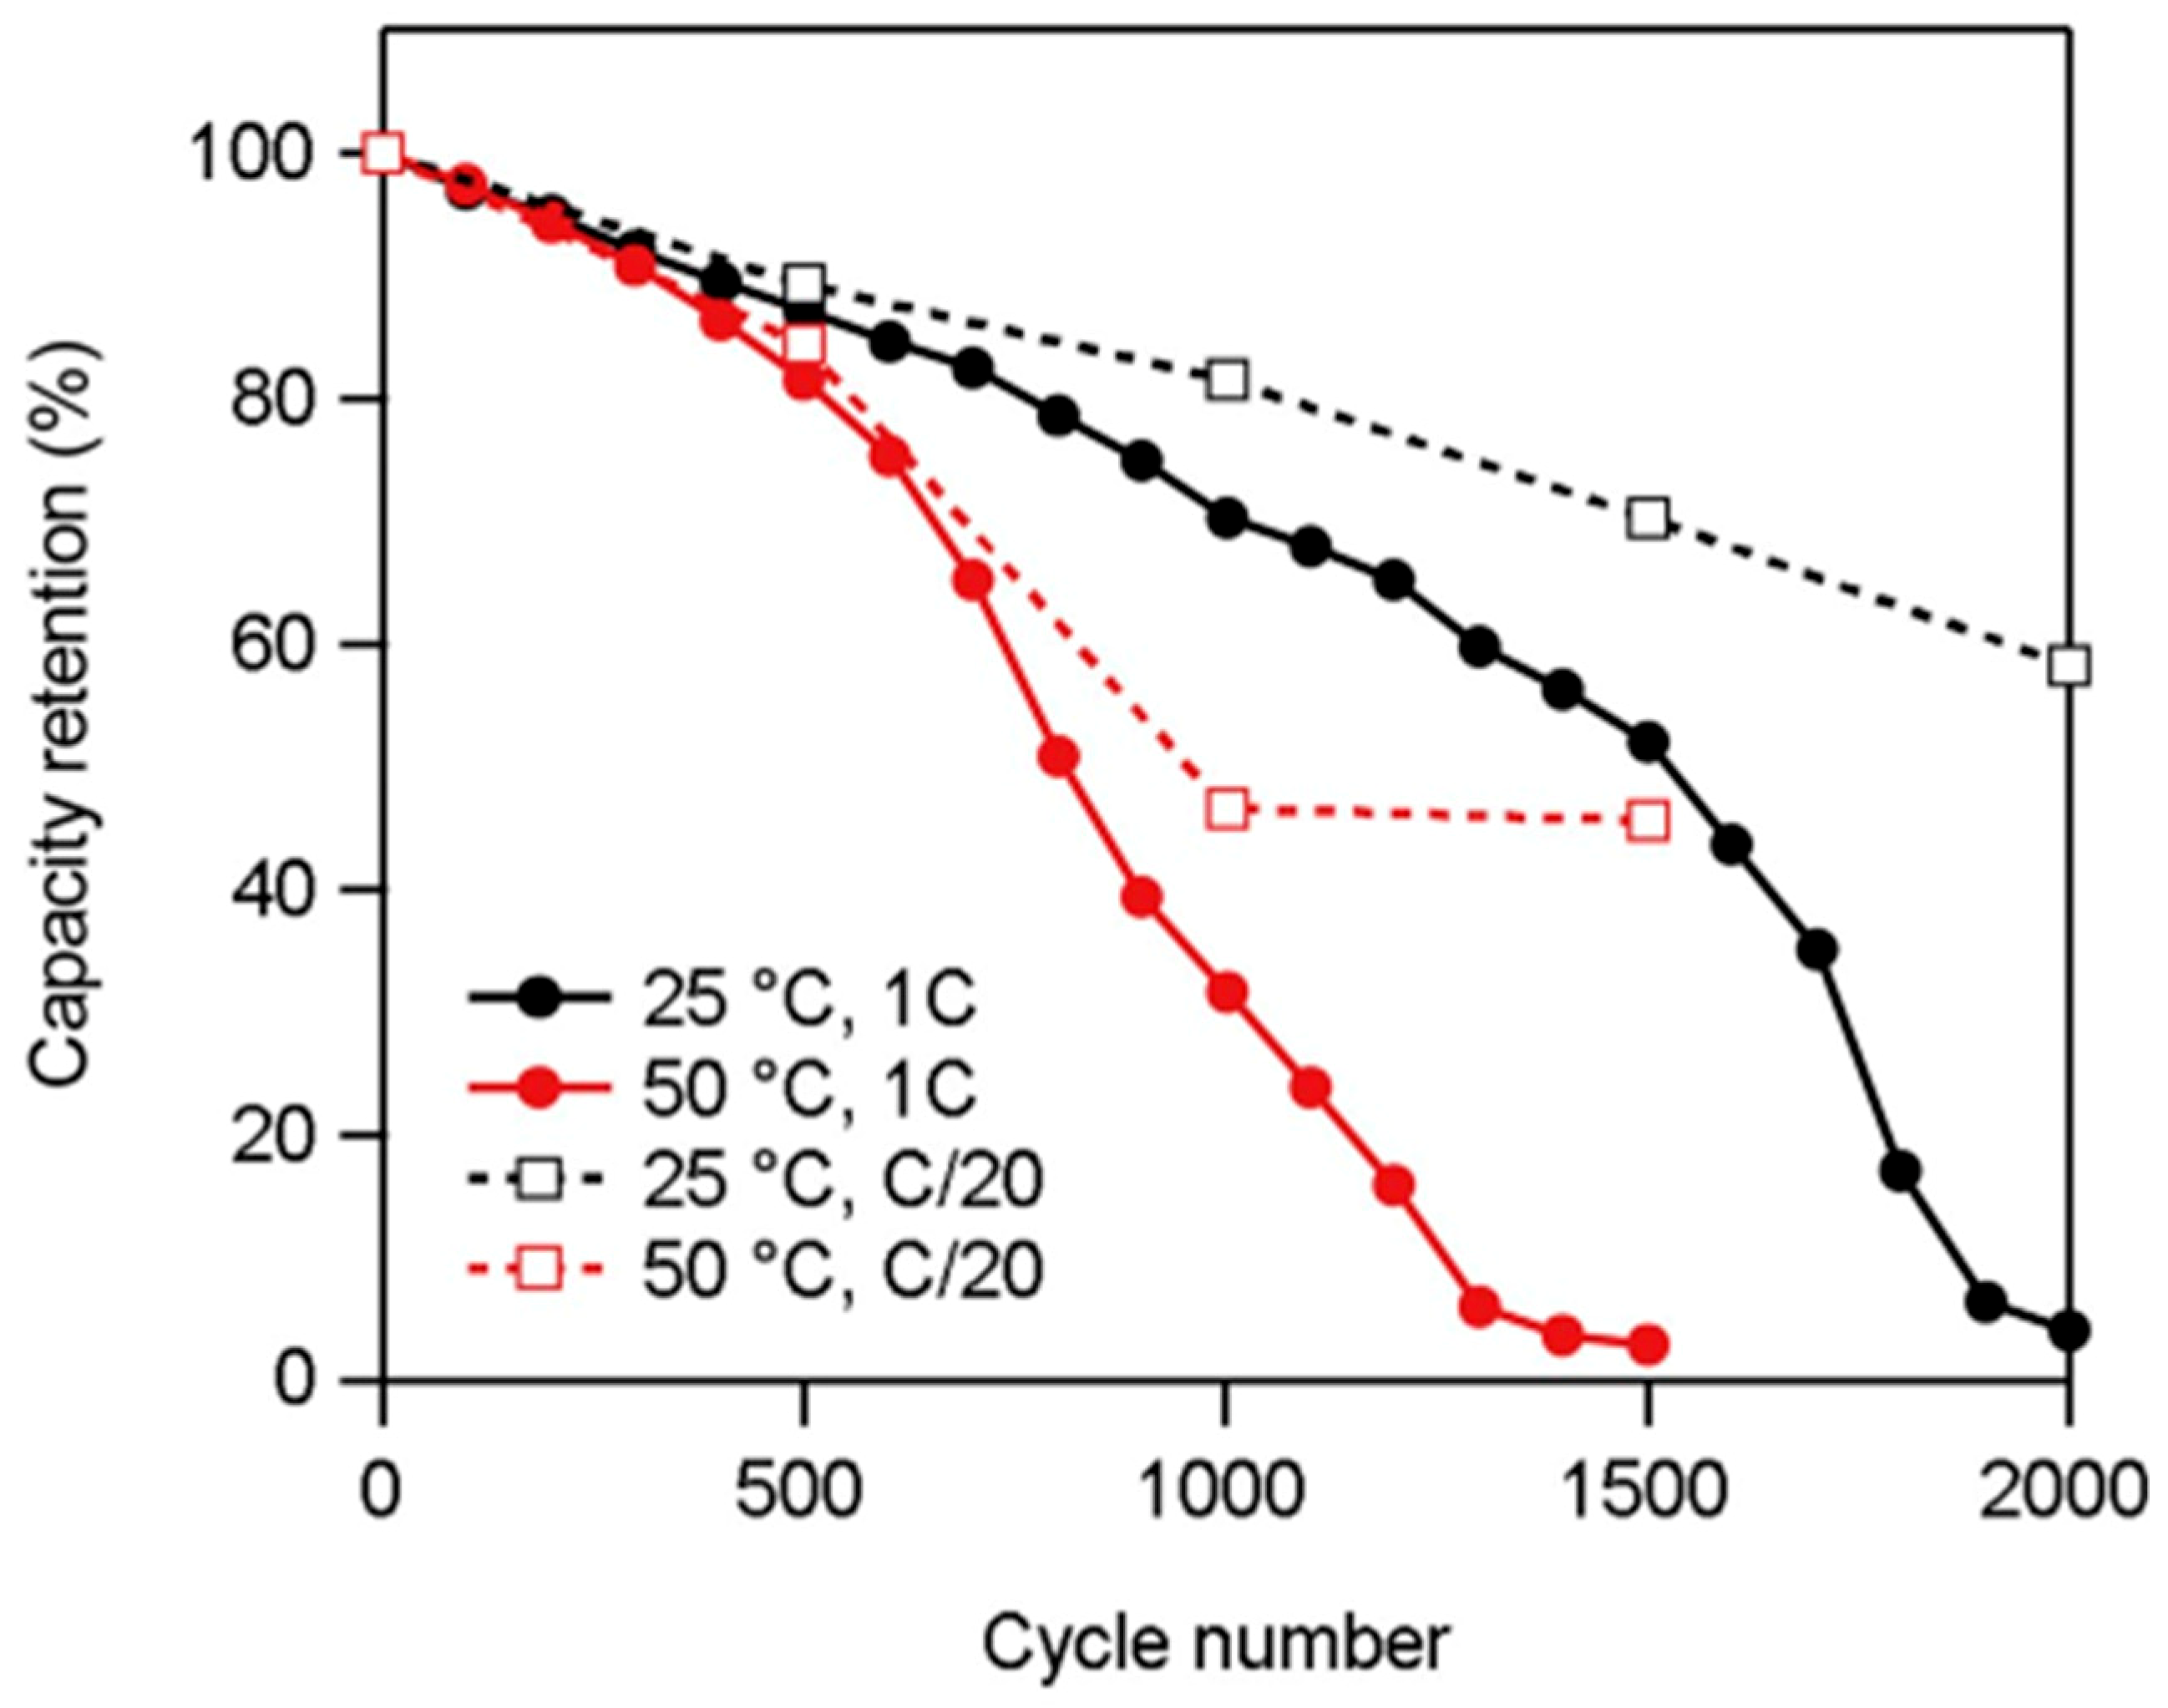
The differences in test conditions and profiles can clearly have a significant effect on the cycling results. Most batteries, including lithium-ion, are known to prefer a moderate current in a constant discharge rather than a pulse or momentary high load. The cycling results of the related previous studies for lithium batteries indicated that load-leveling of the battery reduces the rate of degradation for both Ah capacity and resistance. However, recent test data indicated that the modules degraded more rapidly with constant current cycling than when using the dynamic pulse profiles as shown in Figure 8 [24]. Another experiment tested with nickel manganese cobalt oxide-type lithium-ion cell (Li(Ni1/3Mn1/3Co1/3)O2) shows the different capacity retention result after cycling depends on discharge current and room temperature as shown in Figure 9 [25]. Therefore, clarifying the uncertainty about the effect of the load profile on battery life is especially important with respect to the sizing of lithium-ion fixed batteries.
3. Calculation of Lithium-ion Battery Capacity
3.1. Related Industrial Standards
The DC battery system of nuclear power plants should comply with the requirements of the IEEE std. 946 [26] for the numbers of batteries, IEEE std. 384 [27] for the separation requirements, and regulatory guide RG1.75 [28] for other requirements. The capacity of a lead-acid battery was decided in accordance with the IEEE std. 485 [19]. However, international industrial standards for the stationary lithium-ion battery capacity sizing is not yet established. Recently Korea electric industry code (KEPIC) EEG 1400 [29] was issued and it is the only standard for the sizing and installation of stationary lithium-ion batteries. However, it does not take into account the state of charge (SOC) characteristics and has insufficient information and guidance provided for the application of the code. Therefore, this paper elaborated on the factors that affected the discharge capacity of lithium-ion batteries for the sizing of stationary lithium-ion batteries. The following is the lithium-ion stationary battery capacity sizing formula developed in a previous study [1]. In addition, the case study result is described in Section 4.
3.2. Battery Capacity Calculation Formula
The following is the capacity and dimension sizing method for the lithium-ion battery proposed in the paper [1].
where
Fs = Fd × Sf
- Fs
- is the capacity required by DC loads [Wh];
- Fd
- is the battery capacity uncorrected for temperature, aging, and design margin etc.;
- Sf
- is the capacity correction factor.
And,
where
Sf = (1 + df) × (1 + tf) × (1 + cf) × (1 + af) × (1 + if)
- df
- is the design margin;
- tf
- is the temperature correction factor;
- cf
- is the state of charge (SOC) correction;
- af
- is the aging compensation;
- if
- is the inverter loss (for UPS battery only).
The capacity correction factors were estimated as below. The design margin (df) is the margin which is required to cover unknown or unverified DC loads. The recommended design margin for the stationary battery is specified in IEEE 485.
Batteries are sensitive to environmental temperatures. The temperature correction factor (tf) was decided based on the postulated lowest operating condition.
The SOC of the lithium-ion battery varied with the charging voltage as shown in Figure 1. The stationary battery was operated with a floating charging mode during normal operation. Therefore, the discharge capacity of the lithium-ion battery was affected by the floating charging voltage. The battery end voltage must also be considered when determining the SOC correction factor (cf). Battery rated capacity was the total discharged capacity when the battery is discharged until the battery voltage is decreased to nominal voltage.
Battery capacity retention (%) was decreased with the increment of the cycle number as shown in Figure 8 and Figure 9. Therefore, battery capacity should be monitored by conducting a performance test. Normally, this is done within the first two years of service for comparison purposes to check if the results are similar in duration to the battery duty cycle [30]. If the battery is replaced when the discharge capacity of the battery reaches 80% of the manufacture’s rating, then the aging compensation factor is 25%.
4. Case Study for Lithium-ion Battery Capacity Sizing
4.1. Non-Safety Related 125 V DC Batteries for a Nuclear Power Plant
A redundant DC 125 V system is installed for safety and non-safety DC loads of nuclear power plants. Redundant 250 V DC system is installed for non-safety large loads such as DC energy motors for turbines and generators. Table 3 shows the load profiles of the non-safety DC 125 V system for a PWR nuclear power plant. Equipment qualification is required for the safety related DC batteries, but equipment qualification is out of the scope of this paper. Therefore, a non-safety related DC 125 V battery was selected for the sample calculation in this paper.
4.2. Battery Cell and System Selection
Required capacity calculation with Equations (2) and (3).
where each correction factor was applied as below:
Fd = {(1431.17 × 1/60) + (1263.62 × 29/60) + (258.62 × 90/60) + (142.2 × 120/60)} × 125 =
1306.9 Ah × 125 V = 163,366.6 [Wh]
1306.9 Ah × 125 V = 163,366.6 [Wh]
Sf = (1 + 0.10) × (1 + 0.05) × (1 + 0.10) × (1 + 0.25) × (1 + 0) = 1.59
df: 10%, tf: 5%, cf: 10%, af: 25%, if: 0%
For the unverified DC loads, the design margin (df) was assumed to be 10% according to the general practice of the power plant design project if there was no specific requirement by the client. The temperature of the battery room was kept at 25 °C, but the temperature correction factor (tf) of 5% was applied considering that the temperature may fall below that level when AC power was lost (See Figure 5 and Figure 6). The battery was operating with floating charging and floating voltage, which should be lower than the maximum voltage (See Section 2.2.2). The minimum voltage of the battery was 3.0 V. However, the end of discharge voltage was 3.09 V because the minimum voltage of the DC system was 105 V (See Table 4). Therefore, a SOC correction factor (cf) of 10% was applied based on the above review results and Figure 1 and Figure 2. When the discharge capacity reached 80% of the rated capacity through periodic discharge tests, replacing the battery was the general operation and maintenance standard in the power plants. Therefore, the age correction factor of 25% was applied.
Then required battery capacity by the DC loads [Wh] is
Fs = 163,366.9 × 1.59 = 259,752.9 [Wh]
The lithium-ion battery systems suitable for the above battery capacity were selected by referring to the ESS specification of a domestic company and its specifications, which are listed in Table 5 [31].
Battery system for non-safety related DC 125 V system:
- (a)
- Battery Module
- Capacity: 9435 Wh
- Cell Type: 150 Ah (75 Ah × 2)
- Nominal Voltage: 62.9 V (3.7 V × 17)
- Connection Type: 17 Series × 2 Parallel
- (b)
- Battery Cubicle
- Number of Modules: 10 Module/Cubicle
- Connection Type: 2 Series × 5 Parallel
- Cubicle Capacity: 750 Ah (150 Ah × 5)
- Nominal Voltage: 125.8V (62.9 V × 2)
- Dimension (W × D × H): 1150 × 740 × 2116 mm
- Peak Discharge Rate; 6000 A (8 C)
- (c)
- Battery System
- Number of Cubicles: 3 Cubicles
- System connection Type: 3 Parallel
- Capacity: 2250 Ah (750 Ah × 3)
- Nominal Voltage: 125.8 V
- Energy: 283 kWh
- Footprint: 2.25 m2 (0.85 m2 × 3 Cubicles)
- (d)
- Practical Capacity Correction Factor:
- 283 kWh/163.3 kWh = 1.73
4.3. Equivalent Lead-acid Battery Capacity and Size
A lead-acid battery that qualified for nuclear power plant application was selected [32] and the estimated capacity and required area for battery installation was calculated. Lead-acid battery capacity sizing was performed in accordance with the Equation (4) of IEEE 485.
where
- F is uncorrected cell size;
- S is the section of the duty cycle being analyzed;
- N is the number of periods in the duty cycle;
- P is the period being analyzed;
- Ap are the amperes required for period P;
- t is the time in minutes from the beginning of period P through the end of section S;
- kt is the ratio of rated ampere-hour capacity of the cell, to the amperes that can be supplied by the cell for t minutes at 25 °C and to a given minimum cell voltage.
The following are the ratings of lead-acid battery estimated based on the DC load profile of Table 3. Capacity correction factor for design margin (df) and aging margin (af) are the same with lithium-ion battery;
5. Results and Conclusions
This paper elaborated on the charging and discharging characteristics of lithium-ion batteries in detail. Other factors affecting the determination of the capacity of the lithium-ion batteries and their characteristics were reviewed. Then, in accordance with the lithium-ion battery capacity calculation formula presented in a previous paper [1], the capacity of the battery used in the 125 V DC system of a PWR nuclear power plant was calculated and the results were compared with the existing stationary lead-acid batteries. Lithium-ion batteries have a higher energy density than lead-acid batteries. In addition, lithium ion batteries are installed in cubicles and lead-acid batteries in single-tier racks. As a result, lithium ion batteries take up much less space than lead-acid batteries as shown in the calculation results.
Where long-term DC power backup is required in the event of loss of AC power, such as nuclear power plants, it is highly recommended to apply high energy density lithium-ion batteries. However, to date, no internationally approved industrial standard has been developed for capacity calculations of stationary lithium-ion batteries. Therefore, the lithium-ion stationary battery capacity calculation formula and the factors affecting the capacity calculation result presented and assessed in this paper will help in the design and operation of lithium-ion stationary batteries. On the other hand, lithium-ion battery manufacturers also have to provide users with accurate data for the above factors.
Funding
This research received no external funding.
Acknowledgments
This research was supported by the 2019 Research Fund of the KEPCO International Nuclear Graduate School (KINGS).
Conflicts of Interest
The author declares no conflict of interest.
References
- Chang, C.-H.; Sulley, M. Lithium-ion Stationary Battery Capacity Sizing Formula for the Establishment of Industrial Design Standard. J. Electr. Eng. Technol. 2018, 13, 2561–2567. [Google Scholar]
- Lin, X.; Park, J.; Liu, L.; Lee, Y.; Sastry, A.M.; Wei, L. A Comprehensive Capacity Fade Model and Analysis for Li-Ion Batteries. J. Electrochem. Soc. 2013, 160, A1701–A1710. [Google Scholar] [CrossRef]
- Liu, L.; Park, J.; Lin, X.; Sastry, A.M.; Lu, W. A thermal-electrochemical model that gives spatial-dependent growth of solid electrolyte interphase in a Li-ion battery. J. Power Sour. 2014, 268, 482–490. [Google Scholar] [CrossRef]
- Liu, L.; Guan, P.; Liu, C. Experimental and Simulation Investigations of Porosity Graded Cathodes in Mitigating Battery Degradation of High Voltage Lithium-Ion Batteries. J. Electrochem. Soc. 2017, 164, A3163–A3173. [Google Scholar] [CrossRef]
- Guan, P.; Liu, L.; Lin, X. Simulation and Experiment on Solid Electrolyte Interphase (SEI) Morphology Evolution and Lithium-Ion Diffusion. J. Electrochem. Soc. 2015, 162, A1798–A1808. [Google Scholar] [CrossRef] [Green Version]
- Nuclear Energy Institute’s Technical Report, Diverse and Flexible Coping Strategies (FLEX) Implementation Guide; Nuclear Energy Institute: Washington, DC, USA, 6 December 2016; pp. 8, 15 and 73.
- Types of Lithium-ion. Battery University. Available online: http://batteryuniversity.com/learn/articles/types_of_lithium_ion (accessed on 6 June 2019).
- Yoshio, M.; Brodd, R.J.; Kozawa, A. Lithium-Ion Batteries-Science and Technologies; Springer: New York, NY, USA, 2009; p. 32. [Google Scholar] [CrossRef]
- Coleman, M.; Lee, C.K.; Zhu, C.; Hurley, W.G. State of-charge determination from EMF voltage estimation: using impedance, terminal voltage, and current for lead-acid and lithium-ion batteries. IEEE Trans. Ind. Electron. 2007, 54, 2550–2557. [Google Scholar] [CrossRef]
- PowerStream. How Does Capacity Correlate with Charge Voltage for Lithium Ion Batteries? Available online: https://www.powerstream.com/lithium-ion-charge-voltage.htm (accessed on 27 March 2019).
- Ayoub, E.; Karami, N. Review on the Charging Techniques of a Li-ion Battery. In Proceedings of the Third International Conference on Technological Advances in Electrical, Electronics and Computer Engineering (TAEECE), Beirut, Lebanon, 29 April–1 May 2015. [Google Scholar] [CrossRef]
- Thomas, B.R. Linden’s Handbook of Batteries, 4th ed.; McGraw-Hill Co. Inc.: New York, NY, USA, 2011; pp. 26, 53. [Google Scholar]
- Whitham, D.R. DC Power System Design for Telecommunications; John Wiley and Sons: Piscataway, NJ, USA, 2012; p. 239. [Google Scholar]
- Thomas, B.R. Linden’s Handbook of Batteries, 3rd ed.; McGraw-Hill Co. Inc.: New York, NY, USA, 2002; pp. 35, 69. [Google Scholar]
- Takahashi, M.; Shodai, T. Float Charging Performance of Lithium Ion Batteries with LiFePO4 Cathode. Electrochemistry 2010, 78, 342–344. [Google Scholar] [CrossRef]
- Matsushita Battery Industrial Co. Ltd. Sealed–Acid Batteries Technical Handbook 2000; Panasonic: Tokyo, Japan, 2000; p. 64. [Google Scholar]
- Yia, J.; Kooa, B.; Shina, C.B.; Hanb, T.; Park, S. Modeling the effect of aging on the electrical and thermal behaviors of a lithium-ion battery during constant current charge and discharge cycling. Comput. Chem. Eng. 2017, 99, 31–39. [Google Scholar] [CrossRef]
- Cha, H.-a.; Gong, S.-a.; Park, I.-l. Development of the Lithium-Ion Batery Feasibility Assessment Technology for Nuclear Power Plants; KINS/HR-1219; Korea Institute of Nuclear Safety: Seoul, Korea, 2012; Volume 11, p. 5. [Google Scholar]
- IEEE Recommended Practice for Sizing Lead-acid batteries for Stationary Applications; IEEE std. 485-1997; The Institute of Electrical and Electronics Engineers, Inc.: New York, NY, USA, 1997; pp. 9–12.
- Pesaran, A.; Santhanagopalan, S.; Kim, G.-I. Addressing the Impact of Temperature Extremes on Large Format Li-Ion Batteries for Vehicle Applications. In Proceedings of the 30th International Battery Seminar, Ft. Lauderdale, FL, USA, 11–14 March 2013. [Google Scholar]
- Bandhauer, T.M.; Garimella, S.; Fuller, T.F. A Critical Review of the Thermal Issues in Lithium-Ion Batteries. J. Electrochem. Soc. 2011, 158, R1–R25. [Google Scholar] [CrossRef]
- Yang, S.; Deng, C.; Zhang, Y.; He, Y. State of Charge Estimation for Lithium-Ion Battery with a Temperature-Compensated Model. Energies 2017, 10, 1560. [Google Scholar] [CrossRef]
- Zhang, R.; Xia, B.; Li, B.; Cao, L.; Lai, Y.; Zheng, W.; Wang, H.; Wang, W.; Wang, M. A Study on the Open Circuit Voltage and State of Charge Characterization of High Capacity Lithium-Ion Battery under Different Temperature. Energies 2018, 11, 2408. [Google Scholar] [CrossRef]
- Zhao, J.; Gao, Y.; Guo, J.; Chu, L.; Burke, A.F. Cycle life testing of lithium batteries: The effect of load-levelling. Int. J. Electrochem. Sci. 2018, 13, 1773–1786. [Google Scholar] [CrossRef]
- Matsudaa, T.; Andoa, K.; Myojina, M.; Matsumotob, M.; Sanadab, T.; Takaob, N.; Imaib, H.; Imamuraa, D. Investigation of the influence of temperature on the degradation mechanism of commercial nickel manganese cobalt oxide-type lithium-ion cells during long-term cycle tests. J. Energy Storage 2019, 21, 665–671. [Google Scholar] [CrossRef]
- IEEE std. 946-1992, IEEE Recommended Practice for the Design of DC Auxiliary Power Systems for Generating Stations. Available online: https://ieeexplore.ieee.org/document/213720 (accessed on 27 March 2019).
- Zar, M.S. Working group white paper on the use of IEEE 384-1992 standard criteria for independence of Class 1E equipment and circuits. In Proceedings of the 1994 IEEE Nuclear Science Symposium - NSS’94, Norfolk, VA, USA, 30 October–5 November 1994. [Google Scholar]
- Regulatory Guide 1.75, Physical Independence of Electric Systems, Revision 3. Available online: https://www.nrc.gov/docs/ML0436/ML043630448.pdf (accessed on 27 March 2019).
- KEPIC. Installation Design and Installation of Lithium-ion Batteries for Stationary Applications; EEG 1400; Korea Electric Association: Seoul, Korea, 31 December 2017; pp. 7–10. [Google Scholar]
- IEEE Recommended Practice for Maintenance, Testing, and Replacement of Vented Lead-Acid Batteries for Stationary Applications; IEEE Std. 450-1995; The Institute of Electrical and Electronics Engineers, Inc.: New York, NY, USA, 1995; pp. 7–11.
- Technical Specification of Battery, Kokam Battery Module KBM Series ‘KBM2P17S, Kokam, Suwon Korea. Available online: http://kokam.com/wp-content/uploads/2016/03/Kokam-Battery-Module-216-Series-Brochure1.pdf (accessed on 27 March 2019).
- Technical Specification of Battery, Global OPZS Type Stationary Flooded Tublar Lead Acid Battery, PS Series, Ver. 110210, Global Battery, Chang-woon Korea. Available online: www.gbattery.com/download? unit=product_english&id=10&no=0 (accessed on 27 March 2019).
Figure 1.
Charging voltage and discharge capacity of a lithium-ion battery.

Figure 2.
Charge characteristics (1.75 A, 4.2 V CCCV) of a Sanyo UR 18650E LiCoO2/graphite cell. Temperature is indicated in the legend. (Courtesy of Sanyo).
Figure 2.
Charge characteristics (1.75 A, 4.2 V CCCV) of a Sanyo UR 18650E LiCoO2/graphite cell. Temperature is indicated in the legend. (Courtesy of Sanyo).

Figure 3.
Typical discharge curves of lead-acid batteries at 25 °C.

Figure 4.
Comparison of discharge curves calculated from the modeling and measured by experiments. Discharge rates are 1 C, 3 C, and 5 C after (a) 1000, (b)3000 cycles.
Figure 4.
Comparison of discharge curves calculated from the modeling and measured by experiments. Discharge rates are 1 C, 3 C, and 5 C after (a) 1000, (b)3000 cycles.

Figure 5.
Relative capacity and temperature of a lithium-ion battery.

Figure 6.
Fitting result of capacity in 0~45 °C.

Figure 7.
The battery OCV-SOC relationship at different temperatures.

Figure 8.
Capacity degradation curves for the LiNiCoAl module, when the module was discharged at C/2.7 rate, room temperature (25 °C).
Figure 8.
Capacity degradation curves for the LiNiCoAl module, when the module was discharged at C/2.7 rate, room temperature (25 °C).

Figure 9.
Capacity retention curves at different discharge current rate of 1 C (solid circles) and C/20 (open squares) at 25 °C as a function of cycle number.
Figure 9.
Capacity retention curves at different discharge current rate of 1 C (solid circles) and C/20 (open squares) at 25 °C as a function of cycle number.


Table 1.
Lithium-ion battery voltage.
| Battery Type | Voltage [V] | Usage Field | ||
|---|---|---|---|---|
| Lowest | Nominal | Max. | ||
| LiCoO2 | 3.0 | 3.6 | 4.2 | Cell phones, tablets |
| LiMn2O4 | 3.0 | 3.7 | 4.2 | Medical equipment, tram |
| LiNiMnCoO2 | 3.0 | 3.6 | 4.2 | Electric vehicles, industrial |
| LiFePO4 | 2.5 | 3.2 | 3.65 | High current load battery |
| LiNiCoAlO2 | 3.0 | 3.6 | 4.2 | Industrial, tram |
| Li4Ti5O12 | 1.8 | 2.4 | 2.85 | Uninterruptable power supply (UPS), tram |
Table 2.
Comparisons of secondary batteries.
| Battery Type | Lithium-Ion | Lead-Acid | NiMH |
|---|---|---|---|
| Energy density (Wh/kg) | 190~210 | 20~40 | 50~80 |
| Operation Temperature (°C) | −20~60 | 0~40 | −20~50 |
| Self-discharge rate (%/month) | 3~5 | 20~90 | 20~25 |
| Nominal Voltage (V) | 3.7 | 2.0 | 1.2 |
Table 3.
Non-safety 125 V DC load list of a pressurized water reactor (PWR) nuclear power plant.
| Load Description | Load Current (A) | |||
|---|---|---|---|---|
| 0~1 Min | 1~30 Min | 30~120 Min | 2~4 H | |
| Chemical & Volume Control System (CVCS) | 3.14 | 3.14 | 3.14 | |
| Local Annunciator | 31.75 | 31.75 | 31.75 | |
| Emergency Lighting | 55.2 | 55.2 | 55.2 | 55.2 |
| FW Pump TBN Emergency Lube Oil Pump Motor | 136.85 | 39.1 | 39.1 | |
| Miscellaneous Valve | 15.93 | 15.93 | 15.93 | 15.93 |
| Medium & Low Voltage Switchgear | 96.3 | 26.5 | 26.5 | |
| Inverter Load | 1092.0 | 1092.0 | 87 | 87 |
| Total | 1431.17 | 1263.62 | 258.62 | 142.2 |
Table 4.
Equivalent lead-acid battery.
| Description | Rating |
|---|---|
| Discharge Time | 4 H |
| Battery Cell Capacity [10 h rate] | 3600 Ah (1800 Ah × 2 parallel) |
| Nominal Cell Voltage | 2.0 V |
| Cell End Voltage | 1.81 V |
| Battery System Voltage | 125 V |
| Minimum Voltage | 105 V |
| Maximum Voltage | 140 V |
| Number of Cells | 116 (58 × 2) |
| Footprint | 19.7 m2 |
Table 5.
Lithium-ion battery specification.
| Description | Rating | Description | Rating |
|---|---|---|---|
| Nominal Cell Voltage | 3.7 V | System Nominal Voltage | 125.8 V |
| Cell Min. Voltage | 3.0 (3.09 *) V | System Minimum Voltage | 102 (105 *) V |
| Cell Max. Voltage | 4.2 V | System Maximum Voltage | 142.8 V |
| Cell Capacity | 75 Ah | Backup Time | 4 H |
| Number of Cells per Module | 34 (17 S × 2 P) | Max Continuous Charge C-rate | 1 C |
| Number of Modules per Cubicle | 10 (2 S × 5 P) | Max Continuous Discharge C-rate | 1 C |
| Number of Cubicles (Energy) | 3 (283 kWh) | Peak discharge C-rate | 3 C |
[Note] * End of discharge voltage of the DC system.
© 2019 by the author. Licensee MDPI, Basel, Switzerland. This article is an open access article distributed under the terms and conditions of the Creative Commons Attribution (CC BY) license (http://creativecommons.org/licenses/by/4.0/).
Share and Cite
MDPI and ACS Style
Chang, C.-k. Factors Affecting Capacity Design of Lithium-Ion Stationary Batteries. Batteries 2019, 5, 58. https://doi.org/10.3390/batteries5030058
AMA Style
Chang C-k. Factors Affecting Capacity Design of Lithium-Ion Stationary Batteries. Batteries. 2019; 5(3):58. https://doi.org/10.3390/batteries5030058
Chicago/Turabian StyleChang, Choong-koo. 2019. "Factors Affecting Capacity Design of Lithium-Ion Stationary Batteries" Batteries 5, no. 3: 58. https://doi.org/10.3390/batteries5030058
Note that from the first issue of 2016, this journal uses article numbers instead of page numbers. See further details here.