
Structural Performance of Reinforced Concrete Beams Incorporating Cathode-Ray Tube (CRT) Glass Waste


1
Faculty of Engineering, Beirut Arab University, 11-5020 Beirut, Lebanon
2
Department of Civil Engineering, Faculty of Engineering, Cergy-Pontoise University, 95011 Paris, France
*
Author to whom correspondence should be addressed.
Buildings 2021, 11(2), 67; https://doi.org/10.3390/buildings11020067
Submission received: 13 January 2021
/
Revised: 5 February 2021
/
Accepted: 10 February 2021
/
Published: 13 February 2021
(This article belongs to the Collection Advanced Concrete Materials in Construction)
Abstract
:The performance of reinforced concrete beams in the presence of cathode-ray tube (CRT) glass waste is examined. Four concrete mixes containing 0%, 10%, 20%, and 30% CRT glass waste as partial replacement of sand were prepared. The compressive and flexural strength as well as the modulus of elasticity of concrete were determined. Reinforced concrete beams with varying amounts of CRT glass were prepared and the three-point bending test was conducted. The load-deflection curve as well as the strain distribution along the depth of the beams were determined. Concrete containing CRT glass showed an increase in compressive strength, flexural strength, and modulus of elasticity especially at 10% replacement level. The load carrying capacity of reinforced concrete beam is higher when 10% of sand is replaced with CRT glass compared to the control beam and the beams with 20% and 30% CRT glass substitution. The failure mode of the reinforced concrete beams is flexural failure, and the failure pattern is similar for all beams. Strain distribution showed a better ductility at control beam where the deflection was higher than the other beams at the same load. Numerical analysis was conducted, and comparison was made with the experimental results. The comparison showed the accuracy of the software used, where the results of maximum load capacity and maximum deflection were very similar, and the difference did not exceed 5%. In addition, the tensile damage generated by the numerical analysis was very similar to that obtained by the experimental study.
1. Introduction
The generation of electronic waste (e-waste) is increasing each year. It is estimated that 44.7 million tons of hazardous electronic waste was produced globally in 2016 [1]. Although the cathode-ray tube (CRT) technology is already phased out, the generation of CRT waste is still ongoing and will continue in the coming years. [2]. In fact, it is estimated that in 2020, a worrying amount of 19.5 million CRT units were scrapped in China alone [3]. CRTs have been used as a fundamental part of television and computer monitors since the 1950s [4]. However, due to the advances in this field, they have been replaced by liquid crystal displays (LCD), plasma display panels (PDP), and light emitting diodes (LED) [5]. For instance, the usage of CRT television displays in the world decreased from 83.3 million units to only 5 million units between 2002 and 2016, whereas during the same period, LCD television displays increased from 32.3 million units to 261 million units [6].
A typical CRT is made of 85% glass and consists of three parts: the front panel glass (65%), funnel glass (30%), and neck glass (5%) [7,8]. CRTs can be black and white (monochrome) or colored. Panel and funnel glass contain more than 55% SiO2 in additions to other oxides, including Al2O3, BaO, K2O, and many other minor elements [9]. Lead can be found in the funnel glass of colored CRT and in the neck glass in both colored and monochrome CRTs [10]. In fact, lead accounts for 2 kg in a typical 13 kg CRT [11]. Consequently, CRT is considered hazardous. Lead triggers major environmental concerns and health issues caused by leaching into drinking water, especially in developed countries [6], where landfilling of e-wastes is very common yet unsuitable [12]. Not only may there not be enough space for discarded CRT units, but also they have to be treated for lead before disposal [5]. Thus, several methods of managing waste cathode-ray tubes (CRT) were suggested in the last two decades, including closed loop recycling, which is limited and impractical, and open loop recycling, which is difficult but efficient and eco-friendly [13].
Out of many options for reuse, such as tiles, road fillers, and artificial marbles, CRT glass showed suitability for being utilized as a replacement for sand in cementitious materials due to its contribution in preserving natural resources and improving some properties. For example, Zhao and Poon [14] found that using CRT glass in mortar as a replacement for sand improves its consistency, where an increase of 83.3% in slump flow was observed between 0% replacement level and 75% replacement level. The authors explained this improvement by the smooth surface and impermeability of the glass, where these properties lead to a lower water demand in mortar mixes [15]. Kim et al. [16] reported comparable results for concrete specimens, as they observed that using CRT glass increased the workability of concrete at different water/binder (W/B) ratios. It was also noted that this improvement was more evident at lower W/B ratios. In general, using CRT glass in cementitious materials enhances its workability.
Using CRT glass in cementitious materials as a replacement for sand causes an increase in density. This is mainly due to the higher relative density of CRT glass (~3.0) when compared to natural sand (~2.6). This was demonstrated by Romero et al. [17], where they found that the wet density of concrete increased with the increase in CRT glass content. Ling and Poon [18] observed similar results on the hardened density of concrete. They found that the inclusion of CRT glass caused an increase in the density of concrete. They also noted that concrete containing treated CRT glass with acid had a lower density slightly than that of non-treated CRT glass due to the absence of lead. The increase in hardened density is also confirmed by Bawab et al. [19]. While lighter concrete is preferred to structural applications, a higher density can be beneficial in certain applications, such as radiation shielding [20].
Replacing sand with CRT glass waste in cement mortar was proved to have adverse effects on compressive and flexural strength by Ling and Poon [21]. However, the authors observed that mortar specimens containing CRT glass gained more strength after 28 days when compared with specimens without CRT glass, probably due to pozzolanic reaction. They also noticed that specimens with finer glass size had slightly higher strength. The negative effect of CRT glass on mortar strength was apparent in other studies by the same authors [18,22]. A very recent study by Ouldkhaoua et al. [23] reported that the compressive strength of concrete decreased with the inclusion of CRT glass.
CRT glass concrete was investigated for several other properties. Wang et al. [24] reported that the inclusion of CRT glass in concrete led to a reduction in drying shrinkage. This is attributed to the lower water absorption of CRT glass particles [16,25]. However, the presence of CRT glass in concrete reduced the resistance to the alkali-silica reaction (ASR), resulting in an increase in expansion values [26,27].
Some researchers investigated the structural performance of reinforced concrete beams containing glass waste. Hama et al. [28] studied the structural performance of reinforced concrete beams containing waste glass powder as a cement replacement up to 15%. They reported that the load capacity for beams containing 10% and 15% waste glass was higher than the reference beams. In addition, beams with 10% replacement level showed higher crack resistance than the reference beams. In another study, it was found that applying glass as fine aggregates or coarse aggregates causes a decrease in the flexural strength and ductility factor of reinforced concrete beams [29].
Using CRT glass waste in structural concrete will produce a high-grade material at an economic price and reduce the risk of lead contamination. According to the authors’ knowledge, there has been no research on the structural performance of reinforced concrete beams containing CRT glass. The aim of this paper is to assess the flexural behavior of such reinforced concrete beams. The specific objectives include testing several material properties then investigating flexural behavior including load-deflection curve, load carrying capacity, and strain distribution. The procedures in this paper almost follow similar techniques that have been proven to be practical and are widely available in the literature but on other materials, such as plastic wastes and foamed glass [30,31,32,33,34,35,36]. Moreover, the behavior of beams was modeled using ABAQUS 6.14 by SIMULIA to validate the experimental results and predict its behavior under different conditions. Future study might include the structural behavior of reinforced concrete beams and slabs including CRT glass waste under different dynamic load conditions such as blast and impact loads [37,38,39,40] to expand the knowledge on material behavior under different loading conditions.
2. Materials and Methods
2.1. Mix Design
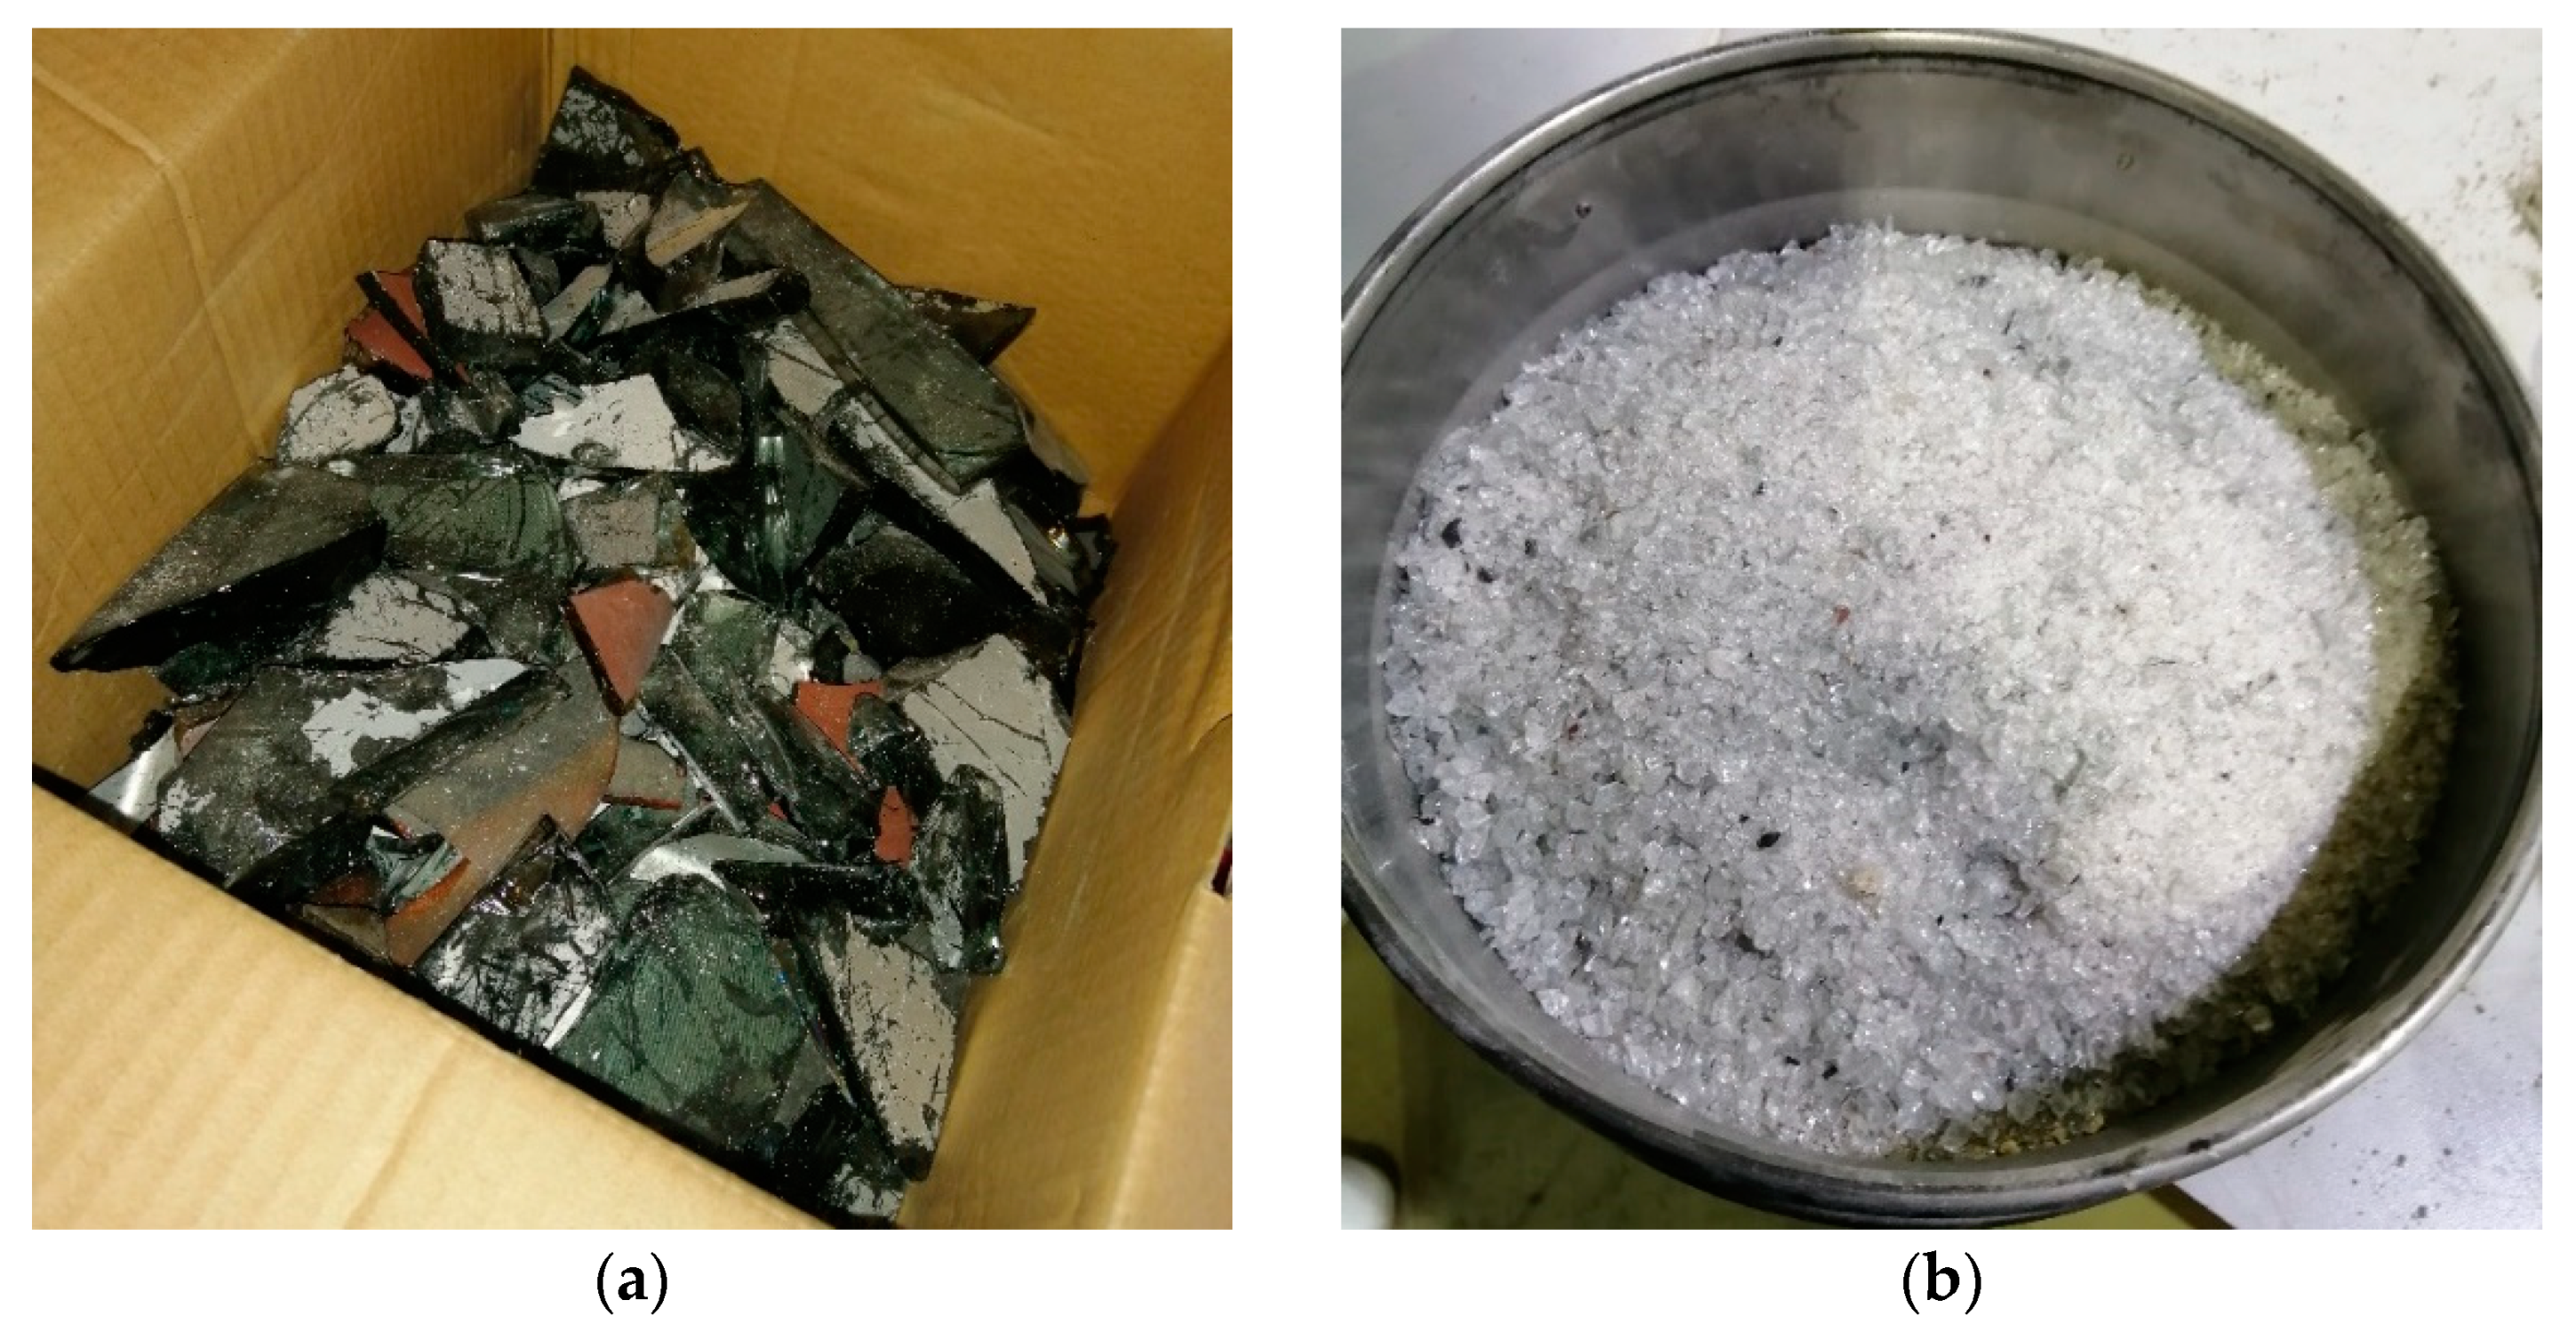
Type I ordinary Portland cement (OPC) from Sibline Cement Factory, Sibline, was used in this study. Natural sand with a maximum size of 4.75 mm and natural gravel with a maximum size of 19 mm were used as fine and coarse aggregates, respectively. CRT glass derived from colored televisions was crushed to reach a maximum particle size of 5 mm (Figure 1). Four mixes were prepared: a control mix (CRT-0), and three mixes (CRT-10, CRT-20, CRT-30) containing 10%, 20% and 30% (by volume) waste CRT glass, respectively. The mix proportions were 1:2:4 (cement/fine aggregate/coarse aggregate). The water to cement (W/C) ratio was kept constant at 0.52. A superplasticizer (SP) based on modified polycarboxylates and having a light brownish color was also used to improve workability of mixes. Different amounts of SP were used in the mixes to maintain approximately the same slump (180 ± 20mm). Table 1shows mix proportions of concrete mixes.
2.2. Casting
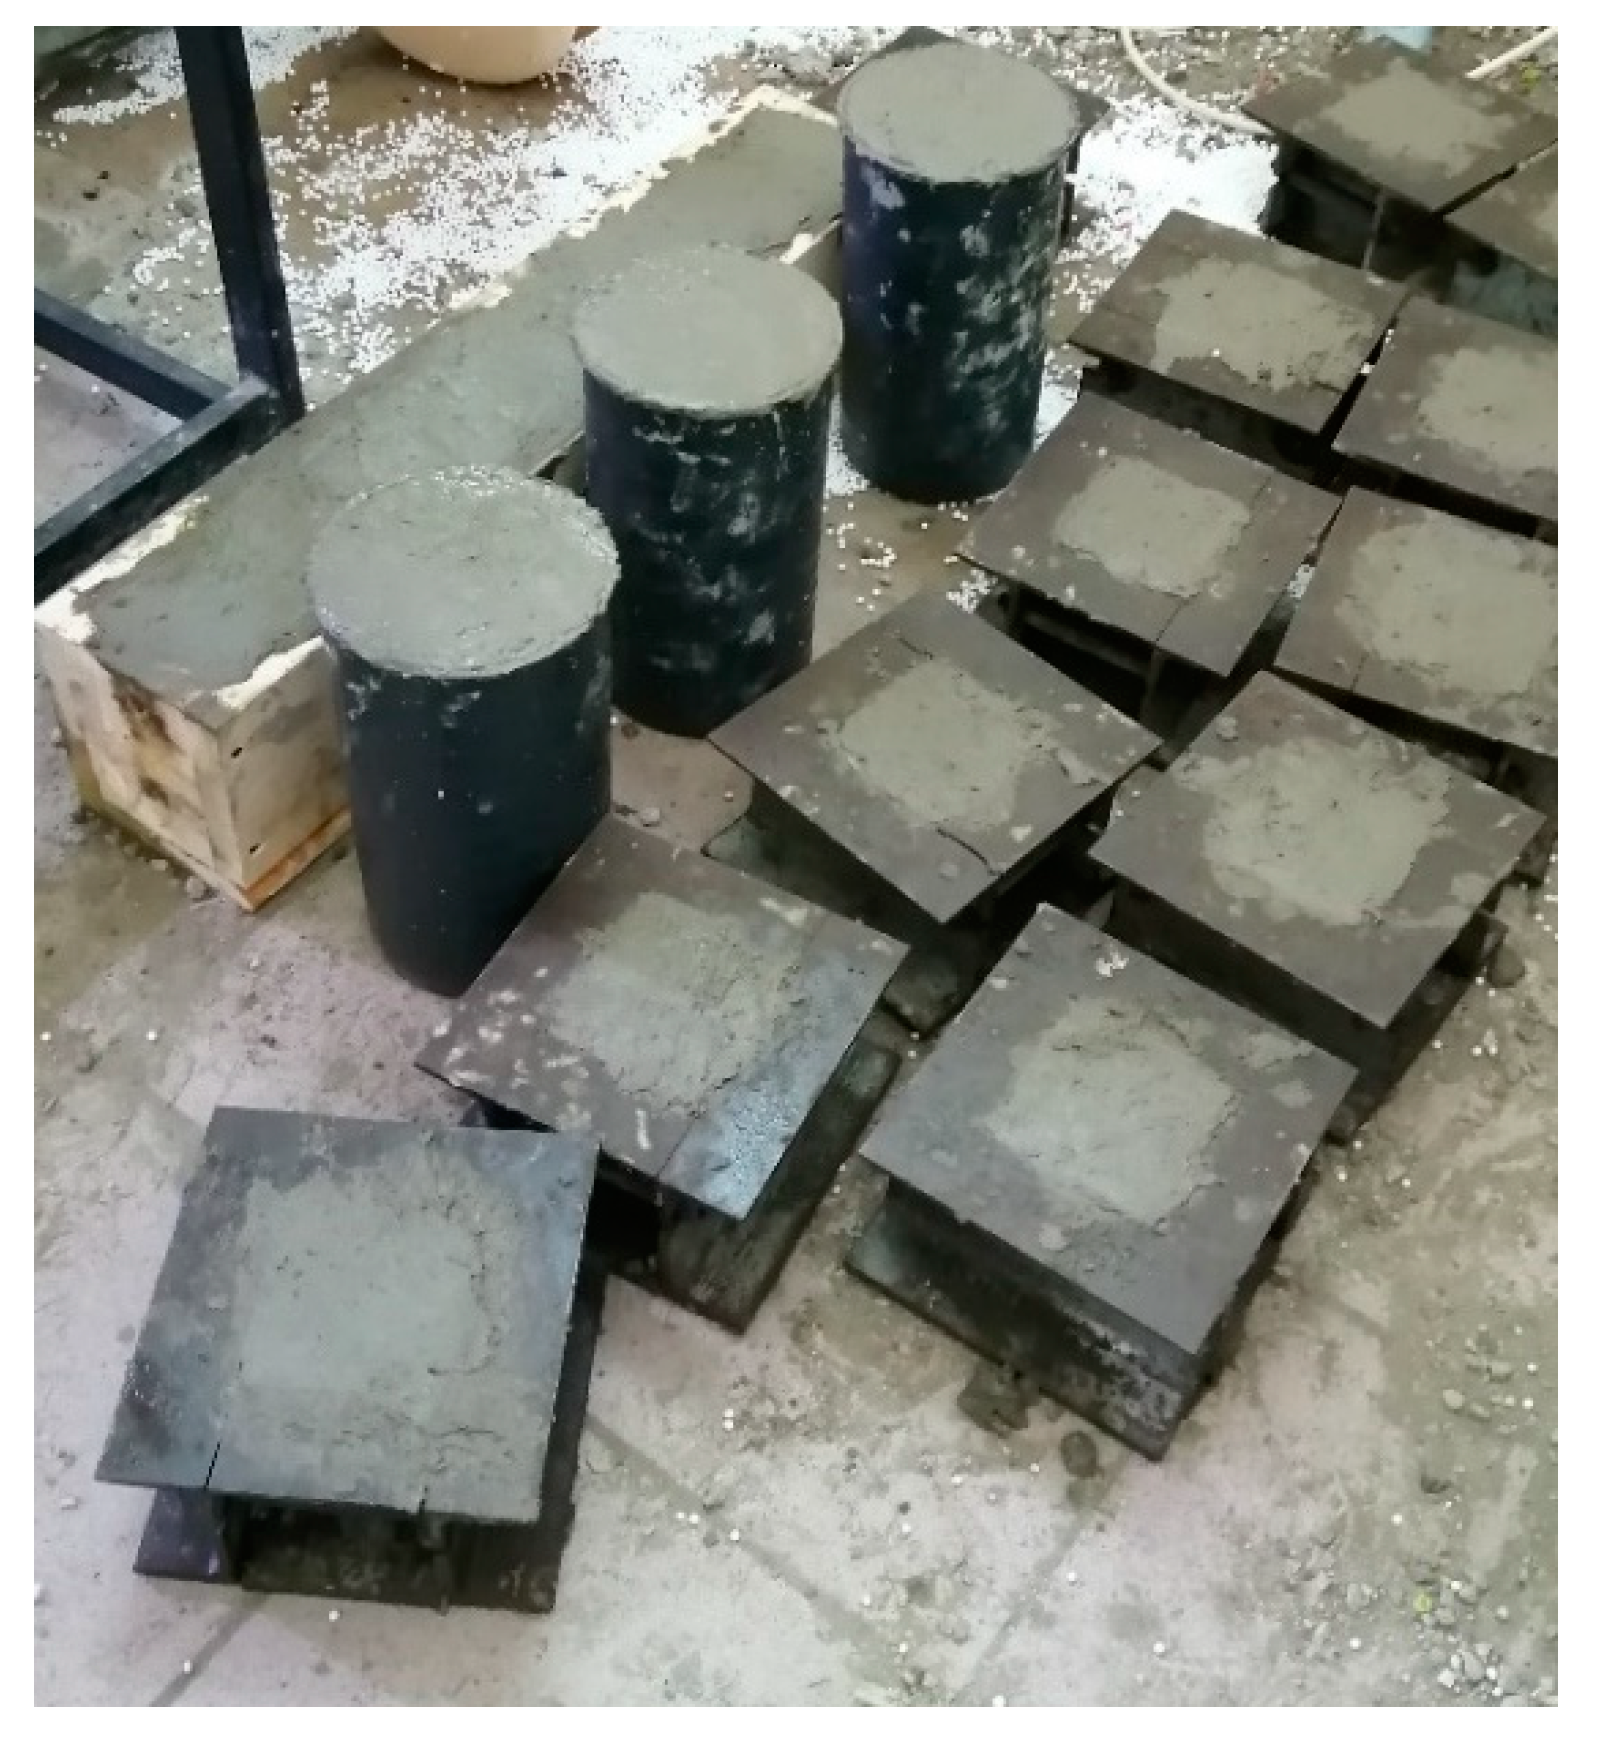
After the determination of the mix constituents, each material used in the mixes was weighed. Cement and aggregates were mixed first for 3 min in a pan mixer from Matest, Italy. After that, half the amount of free water was added, and materials were mixed for another 3 min. Then, the remaining amount of water with SP was added and concrete was mixed for a further 2 min. The mixture was then poured into molds. Cubes of 100 mm in size were used to determine the density, ultrasonic pulse velocity, and compressive strength. For the determination of the modulus of elasticity, cylindrical specimens of 150 mm diameter and 300 mm length were used. Beams of dimensions 100 mm × 150 mm × 700 mm (width/height/length) were used to study the flexural performance. Concrete specimens were left in the molds for 24 h at laboratory temperature before being removed and placed in water tanks at 20 °C until testing. Figure 2 shows the concrete specimens just after casting.
2.3. Reinforced Concrete Beams Details
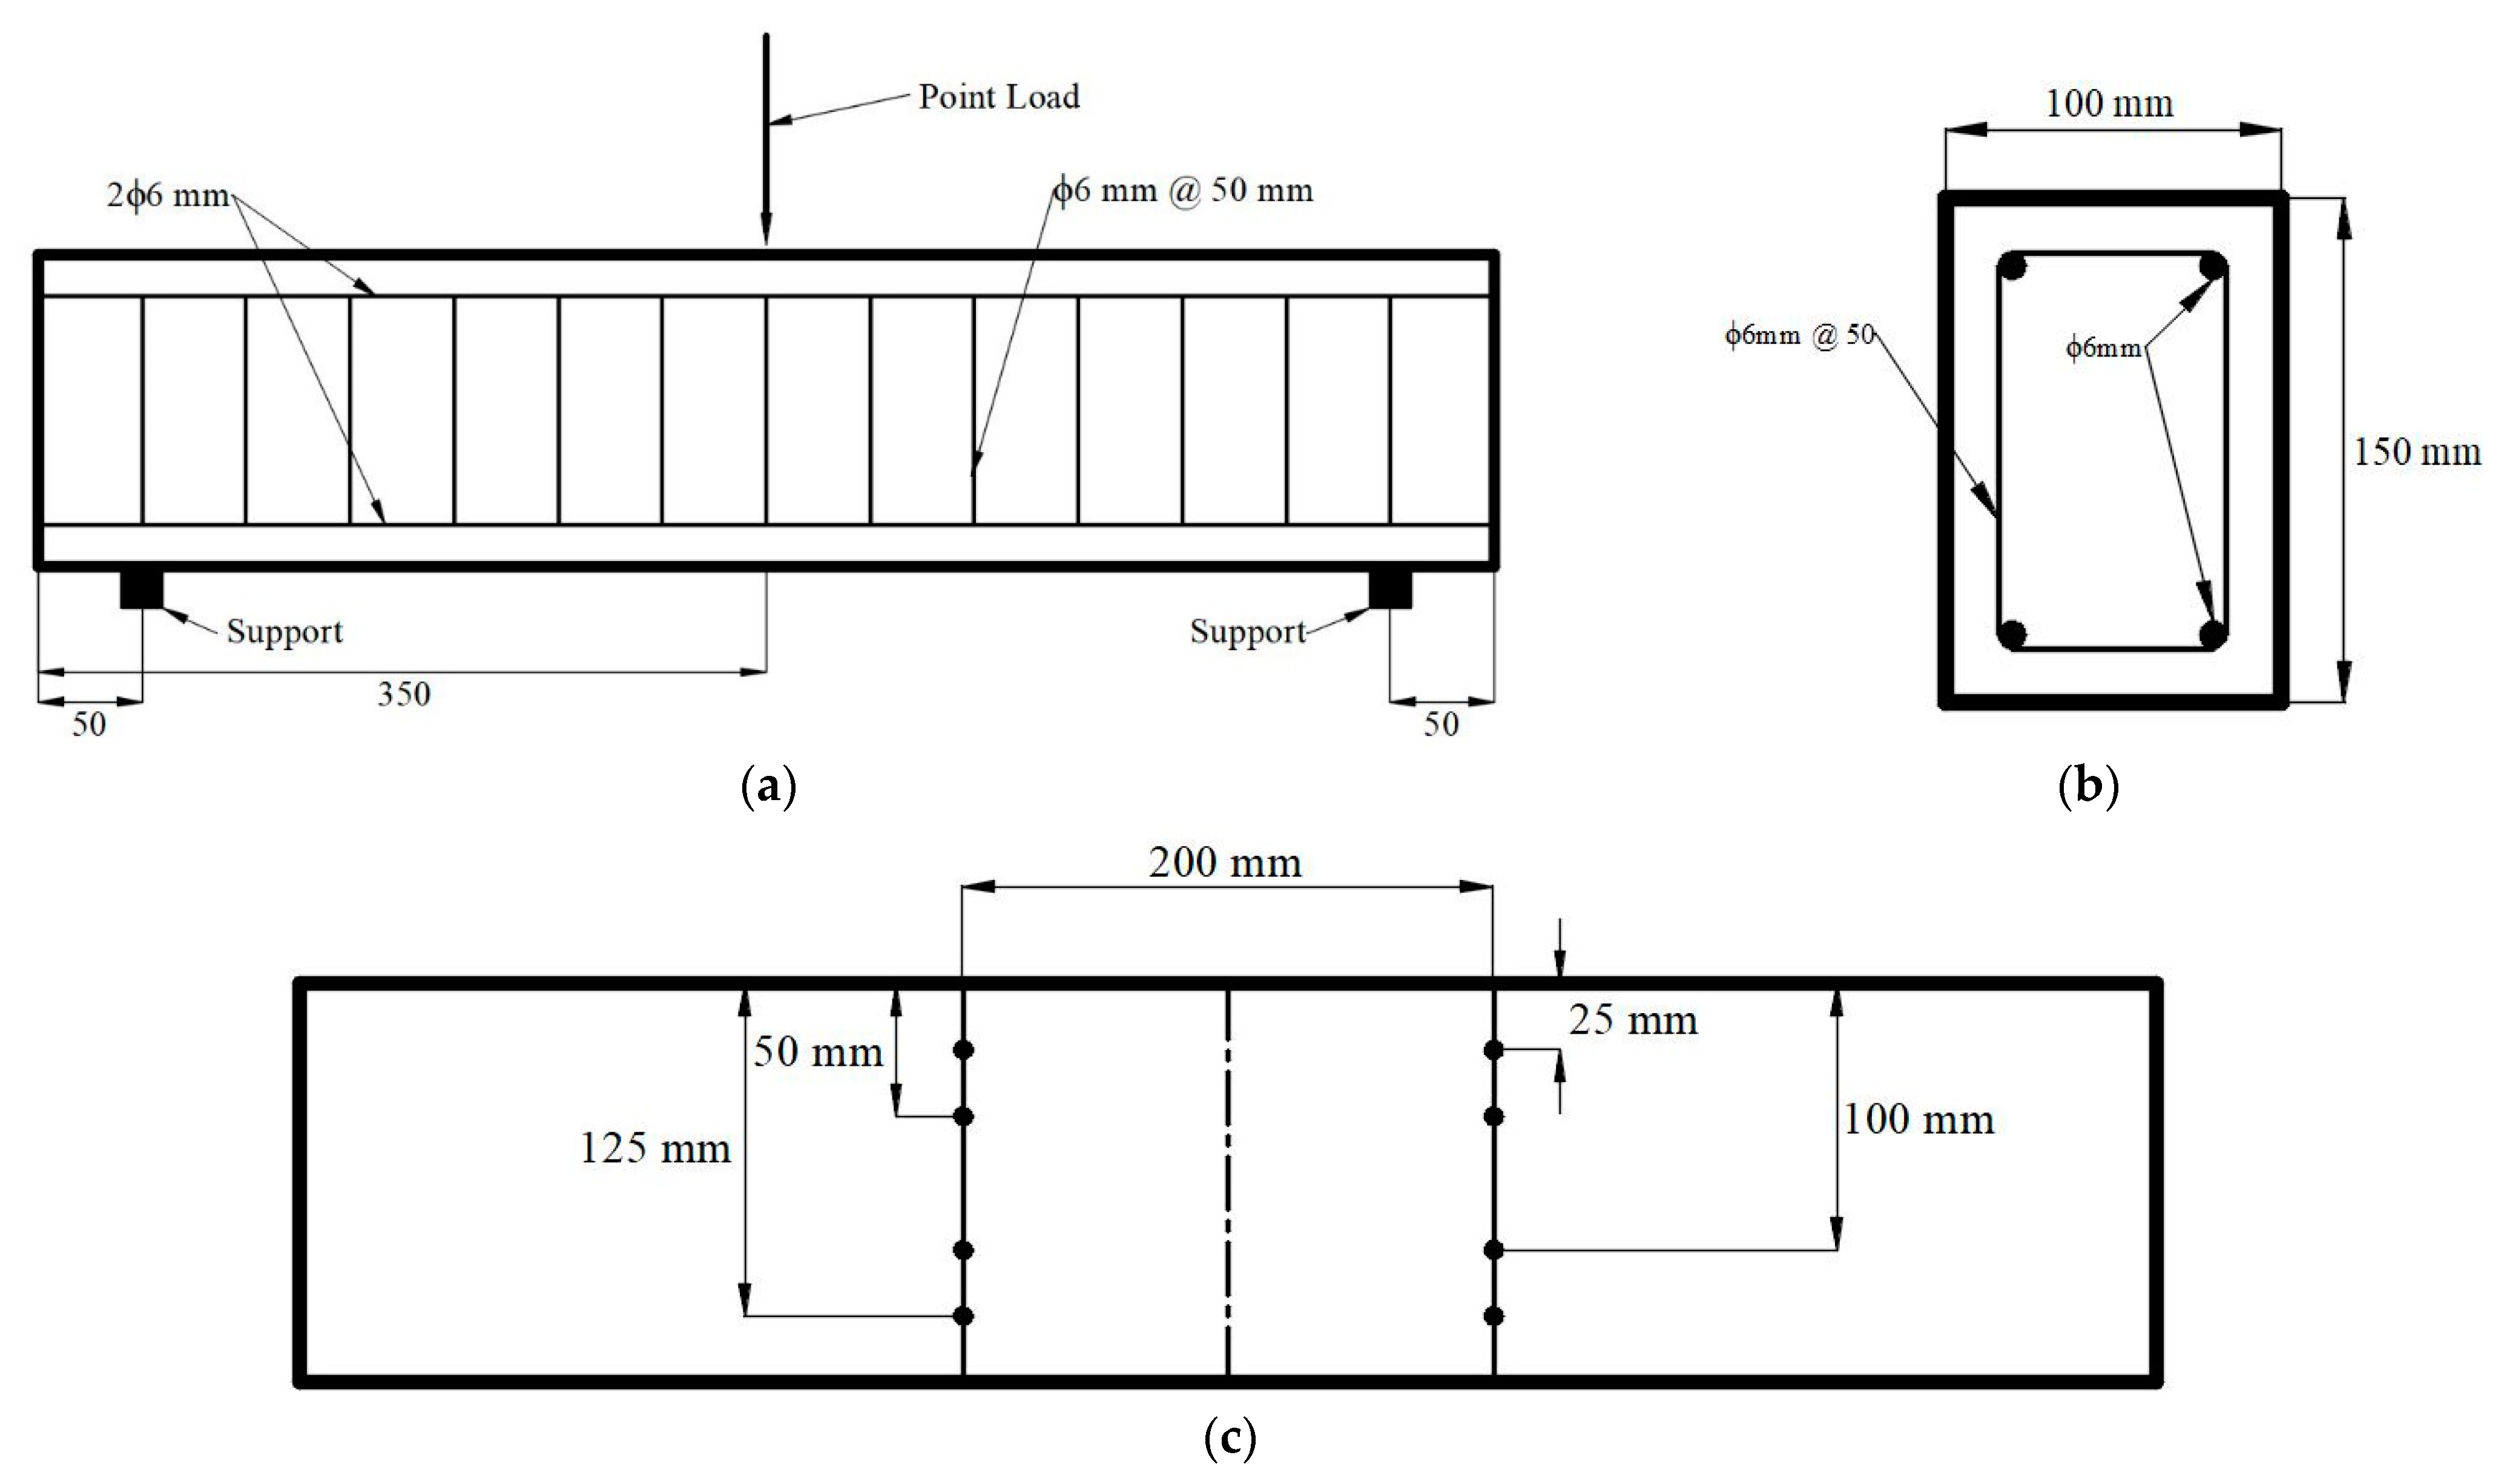
One reinforced concrete beam was cast for each mix. The steel reinforcement consists of two 6 mm bars at the bottom, two 6 mm bars at the top, and 6 mm stirrups distanced at 50 mm. The location of supports and point load are shown in Figure 3a, while Figure 3b shows the cross section and the reinforcement of the beam. Two pairs of steel discs (DEMEC points) were located in the tensile zone and two pairs in the compression zone, as shown in Figure 3c. The main function of the DEMEC points is to serve as stations to measure the strain using the mechanical strain gauge.
2.4. Experimental Testing
The hardened density, ultrasonic pulse velocity (UPV), compressive strength, splitting tensile strength, and static modulus of elasticity of concrete were determined according to BS EN 12350-6 [41], BS EN 12504-4 [42], BS EN 12390-3 [43], BS EN 12390-6 [44] and BS EN 12390-13 [45], respectively, at 28 days. The reported value of each of these properties is the average of 3 specimens.
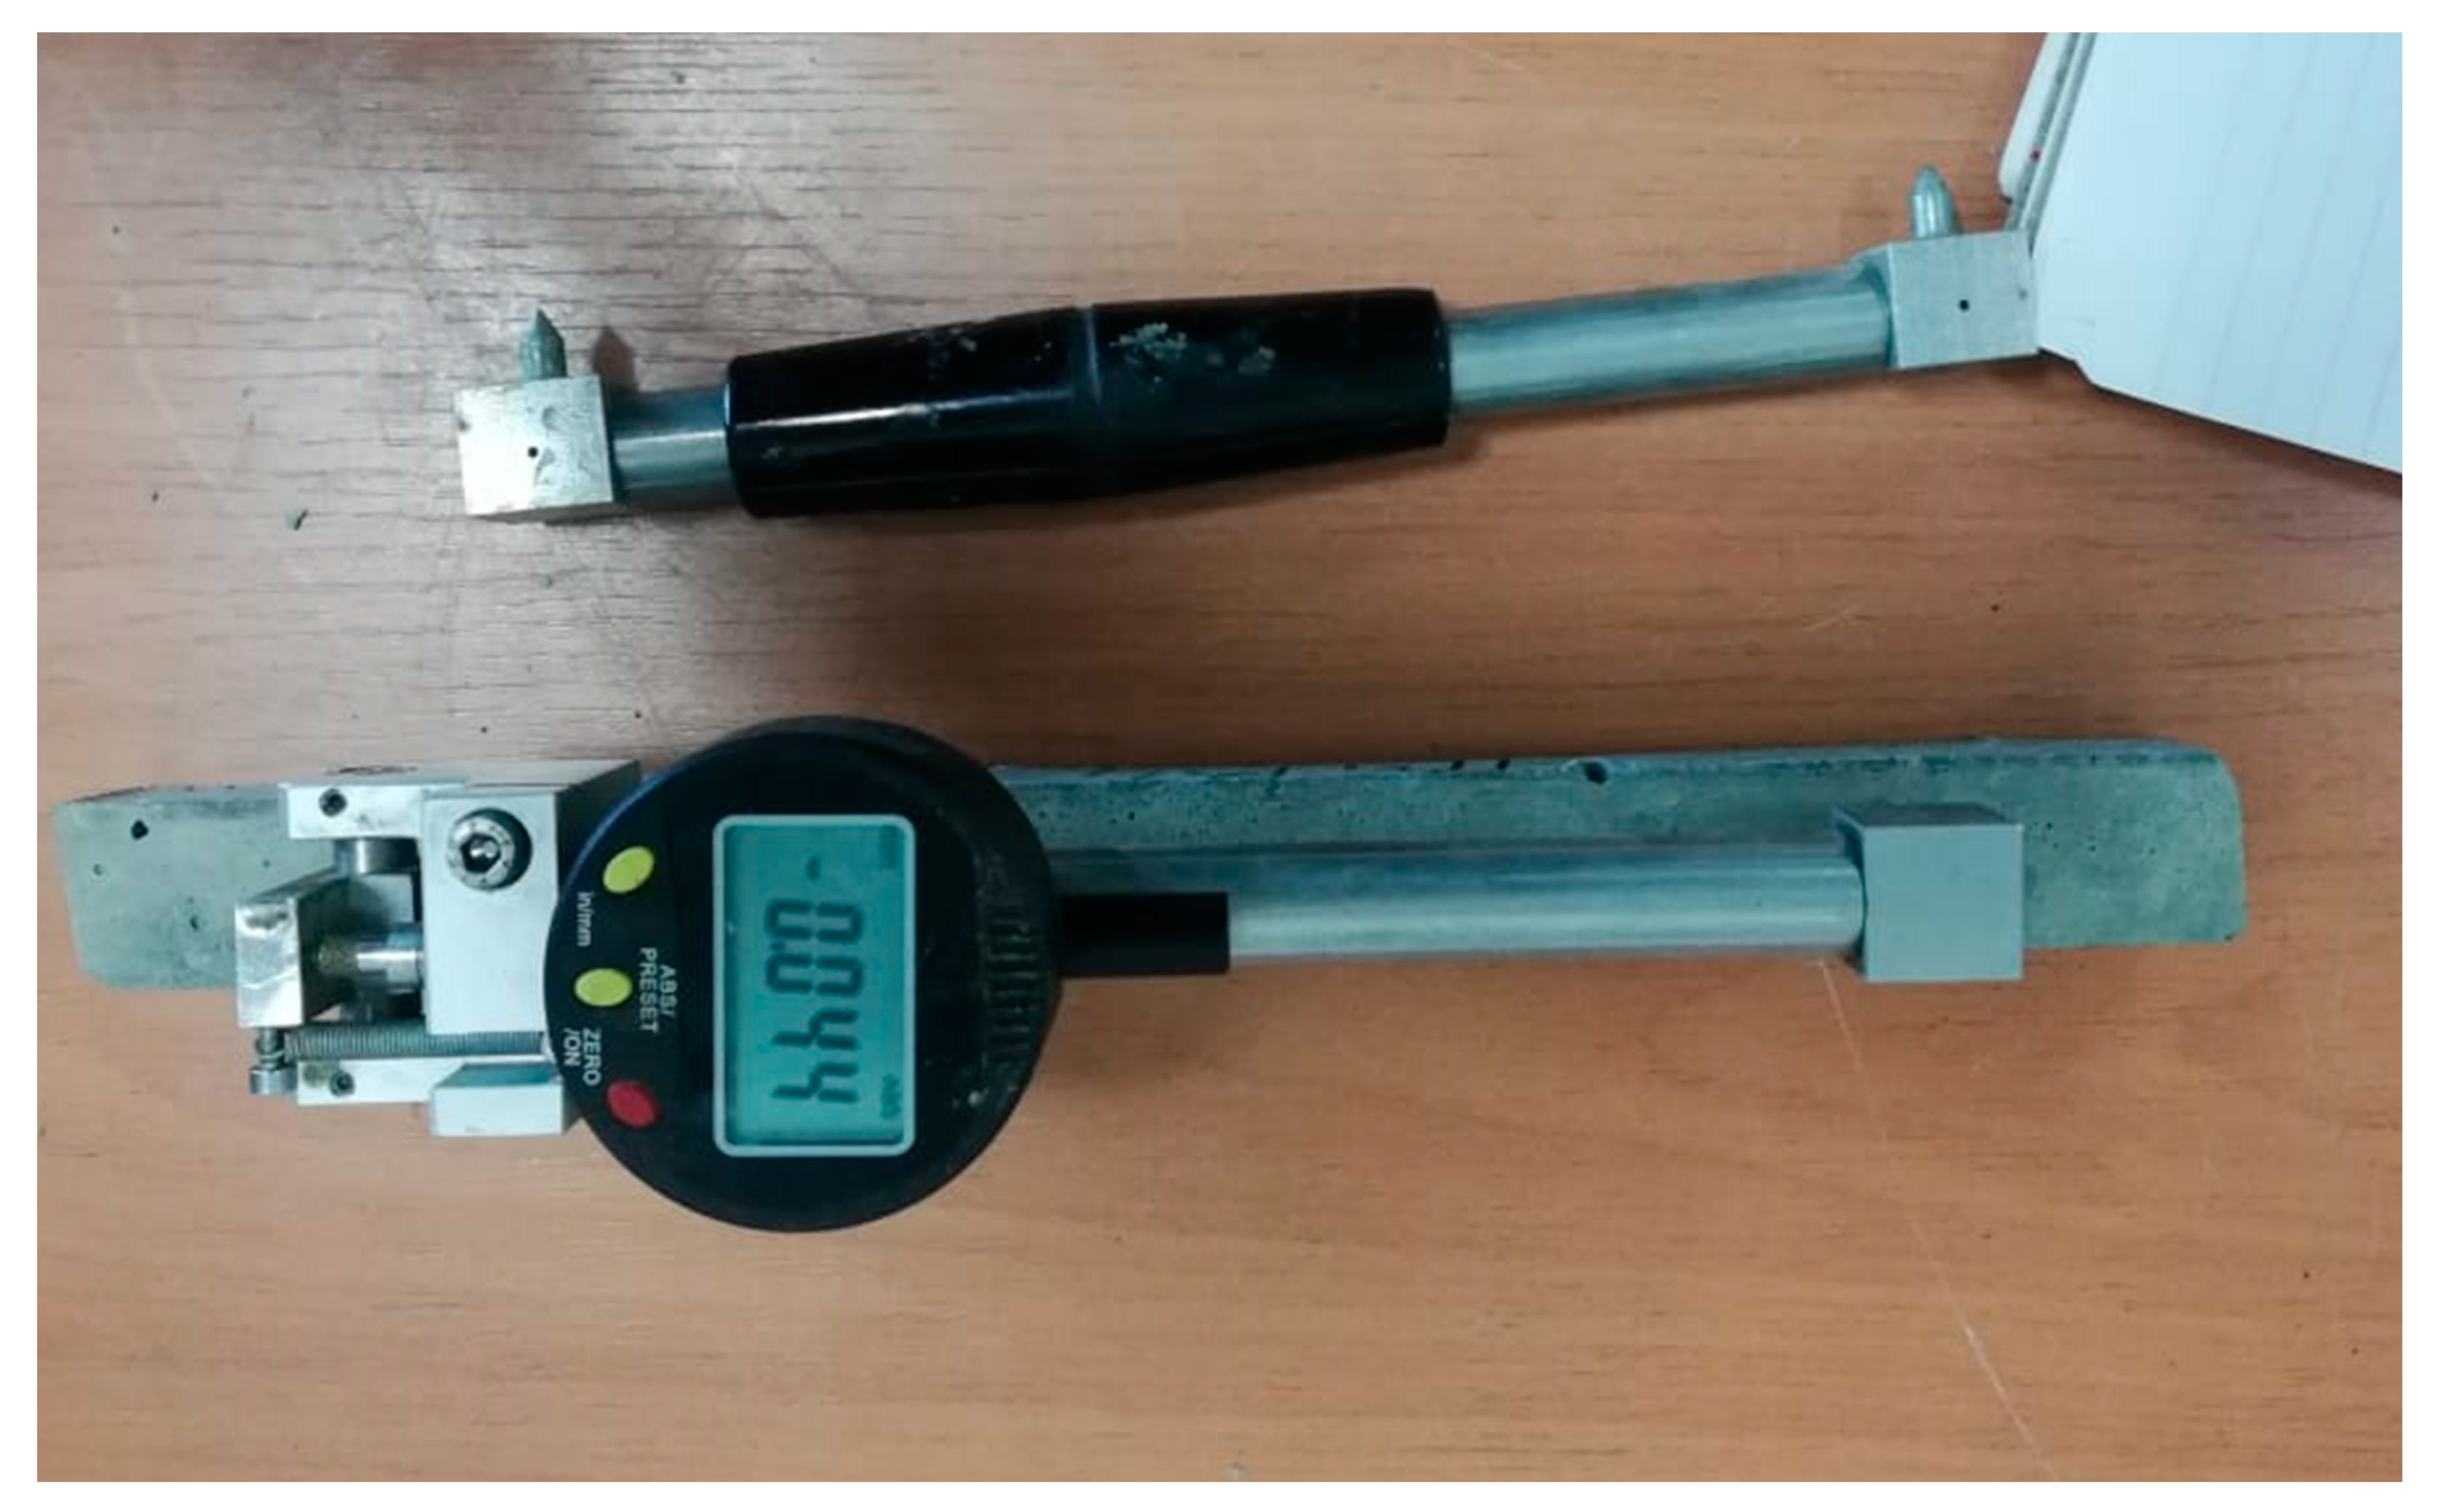
After 28 days of curing, a three-point test was used to determine the flexural behavior of reinforced concrete beams. The beams were subjected to an increasing load of 4 kN increments. At each load, the machine was stopped to measure the central deflection and strain at the four different locations. The mechanical strain gauge used for measuring strain at each load increment is shown in Figure 4. The load at first crack was recorded and the loading continued until failure.
2.5. Numerical Modeling
The experimental work was simulated numerically using the advanced finite element software ABAQUS 6.14 by SIMULIA. Volumetric elements were used to model the concrete beam while linear elements were used to model steel rebars. As for supporting and loading systems, they were modeled as rigid elements, since they have a null deformation. All model details are shown in Figure 5.
The concrete material was defined using the built-in concrete damage plasticity (CDP) model, which accounts for the nonlinear behavior of concrete [46]. The compressive strength, tensile strength, density, concrete damage, and modulus of elasticity were determined experimentally and then implemented in the CDP model. Other default parameters such as Poisson’s ratio, dilation angle, eccentricity, biaxial to uniaxial ratio, stress invariant ratio, and viscosity parameter are shown in Table 2. As for steel rebar material, the elastic-perfectly plastic behavior was considered in material definition, knowing that the yield strength of steel rebars was 420 MPa.
Several mesh sizes were tried until reaching the best size in terms of both result accuracy and computation time. The final mesh size agreed on for use by the authors was 100 mm for both concrete body and steel rebars. Steel rebars were assumed to be embedded inside the concrete body with full bond condition. As for supports, it was found that a friction coefficient between steel and concrete of 0.7 was sufficient for this study case. The loading plate shown in Figure 6 was considered as a rigid body to avoid any detorsions inside it while applying the load gradually on the beam.
3. Results and Discussion
3.1. Concrete Properties
Table 3 shows the concrete properties for mixes containing 0%, 10%, 20% and 30% CRT glass at 28 days. There is a slight increase in the hardened density of concrete with the increase in CRT glass content due to the higher density of CRT glass compared to that of sand. The UPV of concrete also showed a slight increase due to the presence of CRT glass. All UPV values are above 4500 m/s, indicating an excellent quality concrete [47]. All concretes with CRT glass show an increase in compressive strength compared with the control, particularly at 10% replacement, where an increase of over 20% was observed. Similarly, the tensile strength at 10% CRT replacement level was the highest (3.263 MPa). This is also true for the modulus of elasticity, where an increase of about 12% was noticed at 10% CRT substitution level. It can be noticed that there is a high correlation coefficient of R2 = 0.9601 between the modulus of elasticity and the compressive strength [19]. In addition, higher modulus of elasticity indicates lower deformability at the same load.
In conclusion, there is an improvement in the mechanical properties of concrete when CRT glass is used as a partial replacement (up to 30%) of sand, especially at the 10% replacement level. These results are in agreement with results elsewhere [48].
3.2. Load Deflection
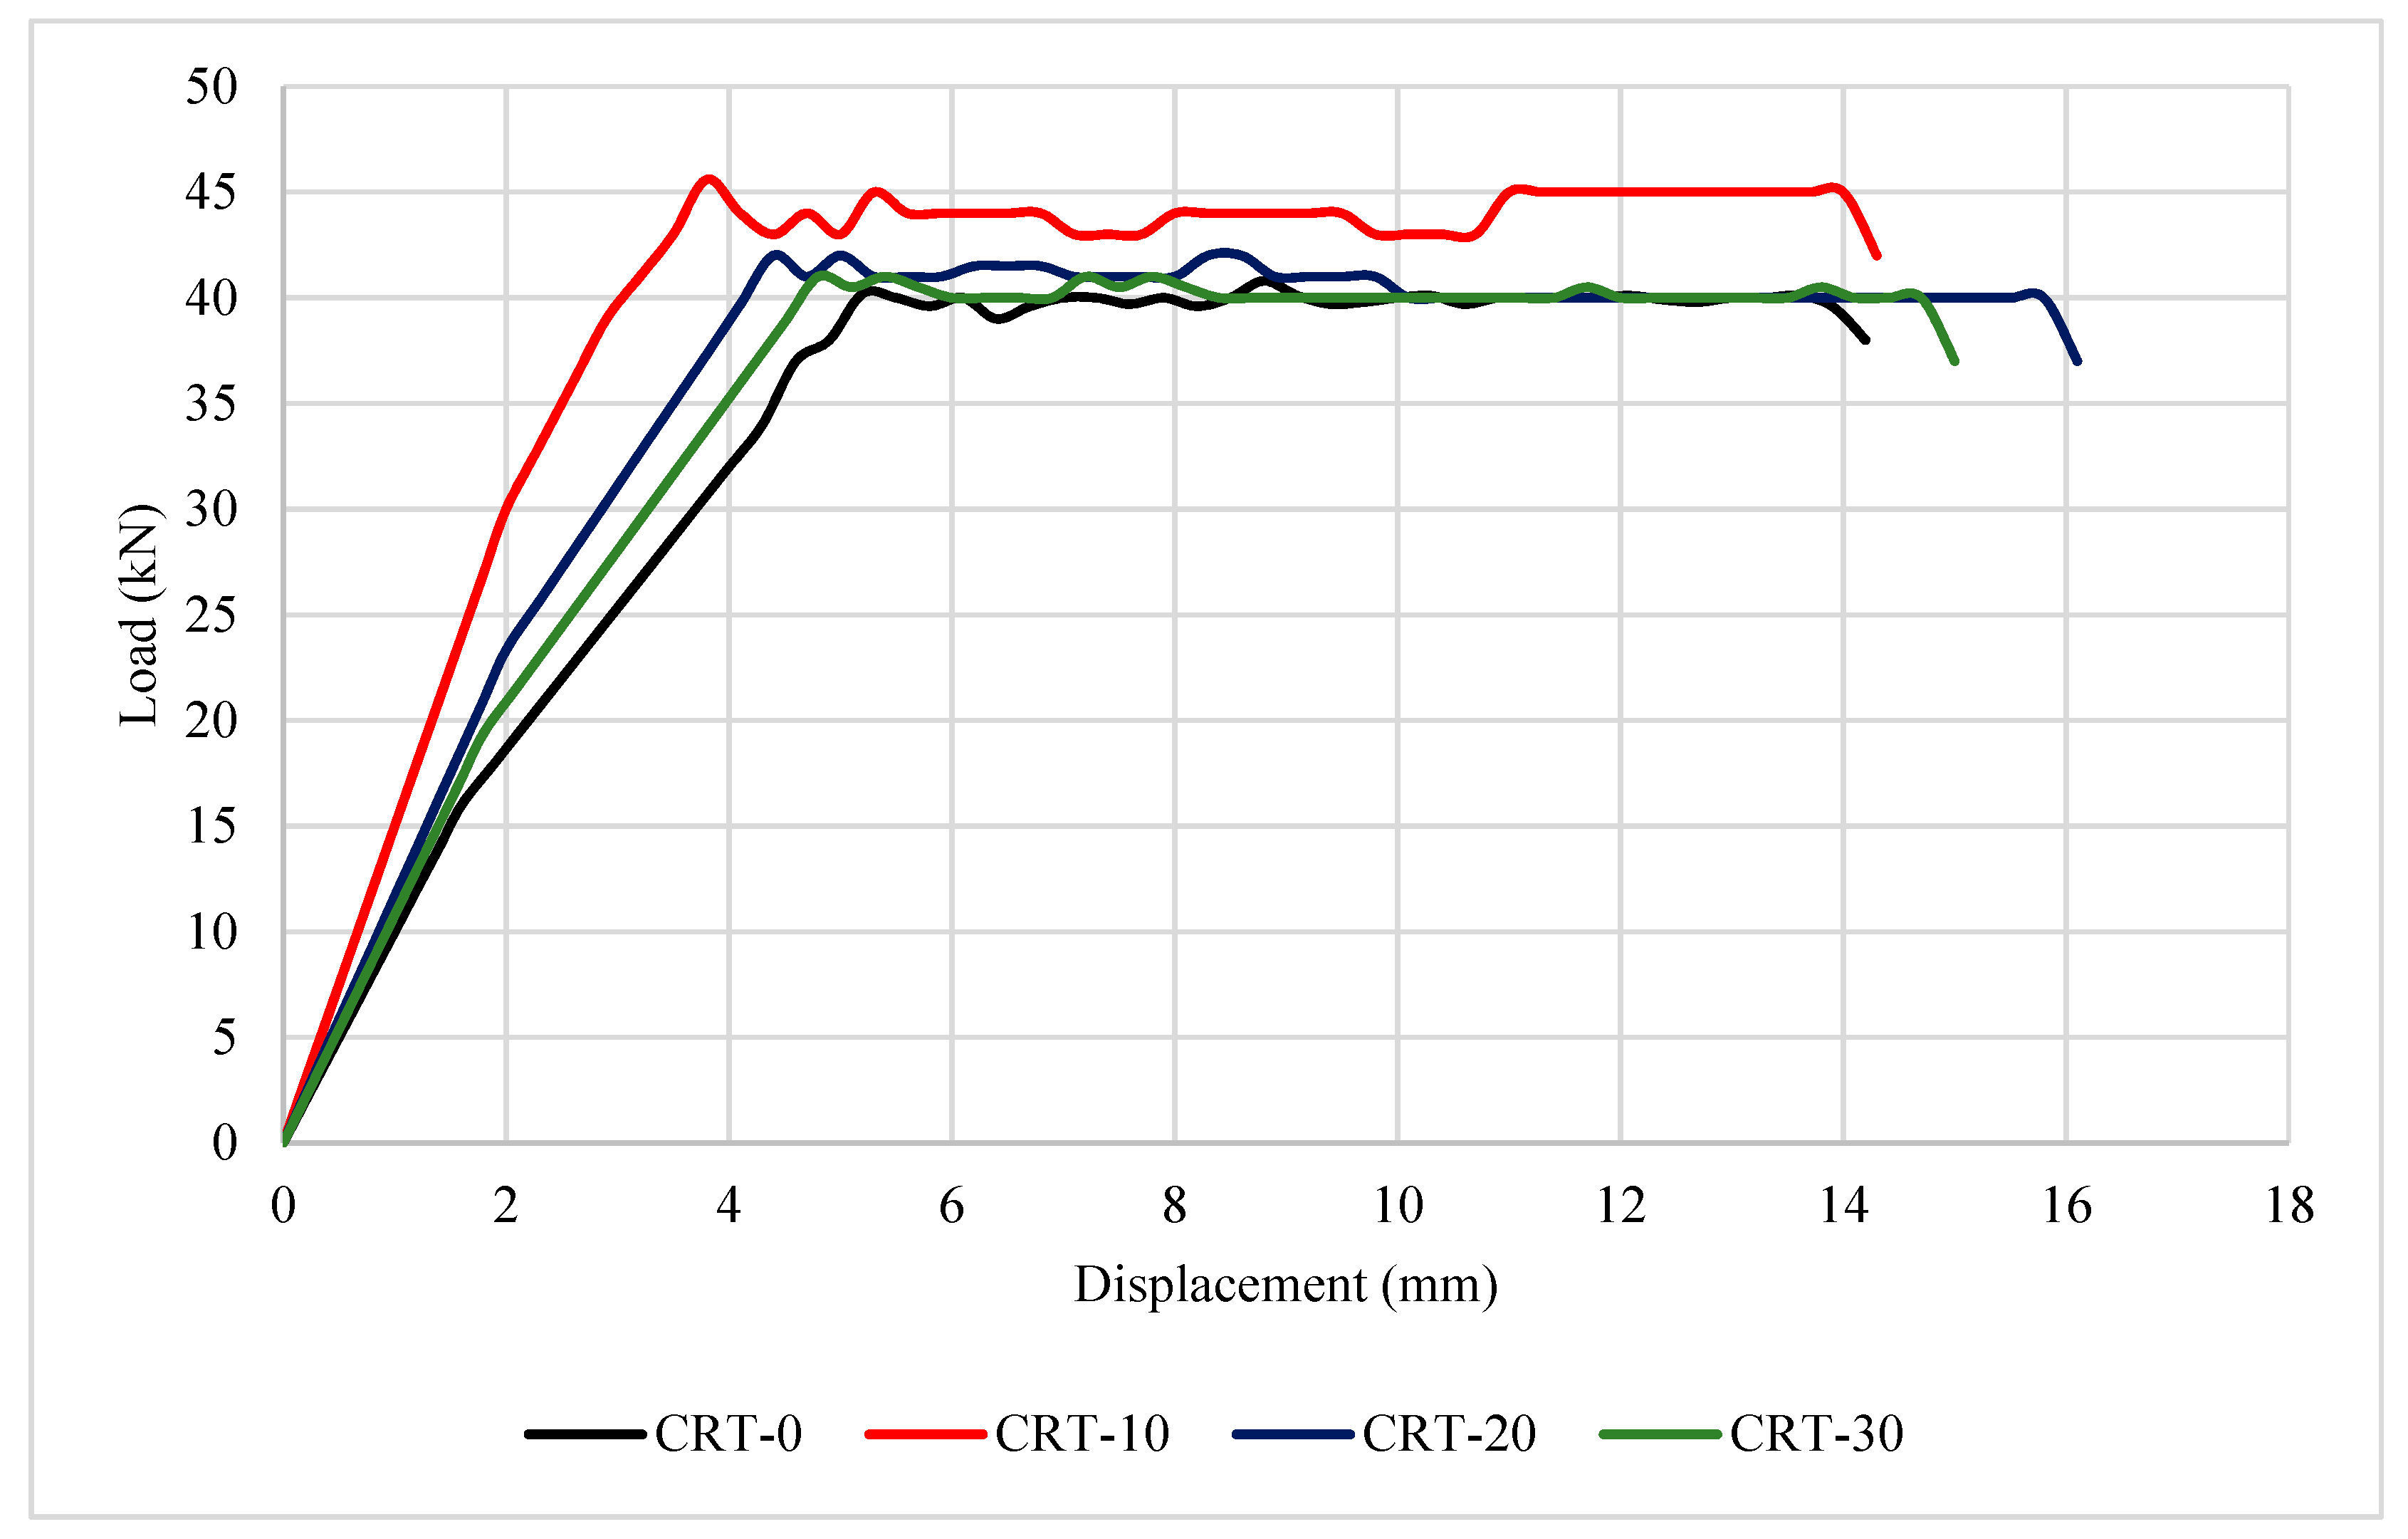
Figure 6 shows the load–deflection curve for the reinforced concrete beams containing 0%, 10%, 20%, 30% CRT glass at 28 days of curing. For all beams, the curve was linear until the first crack. After cracking, the curve continued to be linear but with lower slope until the yield of the reinforcing steel, where CRT glass may have affected the maximum deflection for each beam due to the stiffening effect. The beam is considered failed when there is a noticeable drop in the load after the ultimate load. The maximum displacement of all beams range between 14 and 16 mm. This value is at its minimum at 0% CRT replacement (control) where the central deflection of the beam reached only 14 mm. It can be inferred that CRT glass contributed to the slight increase in the maximum displacement of the reinforced concrete beams.
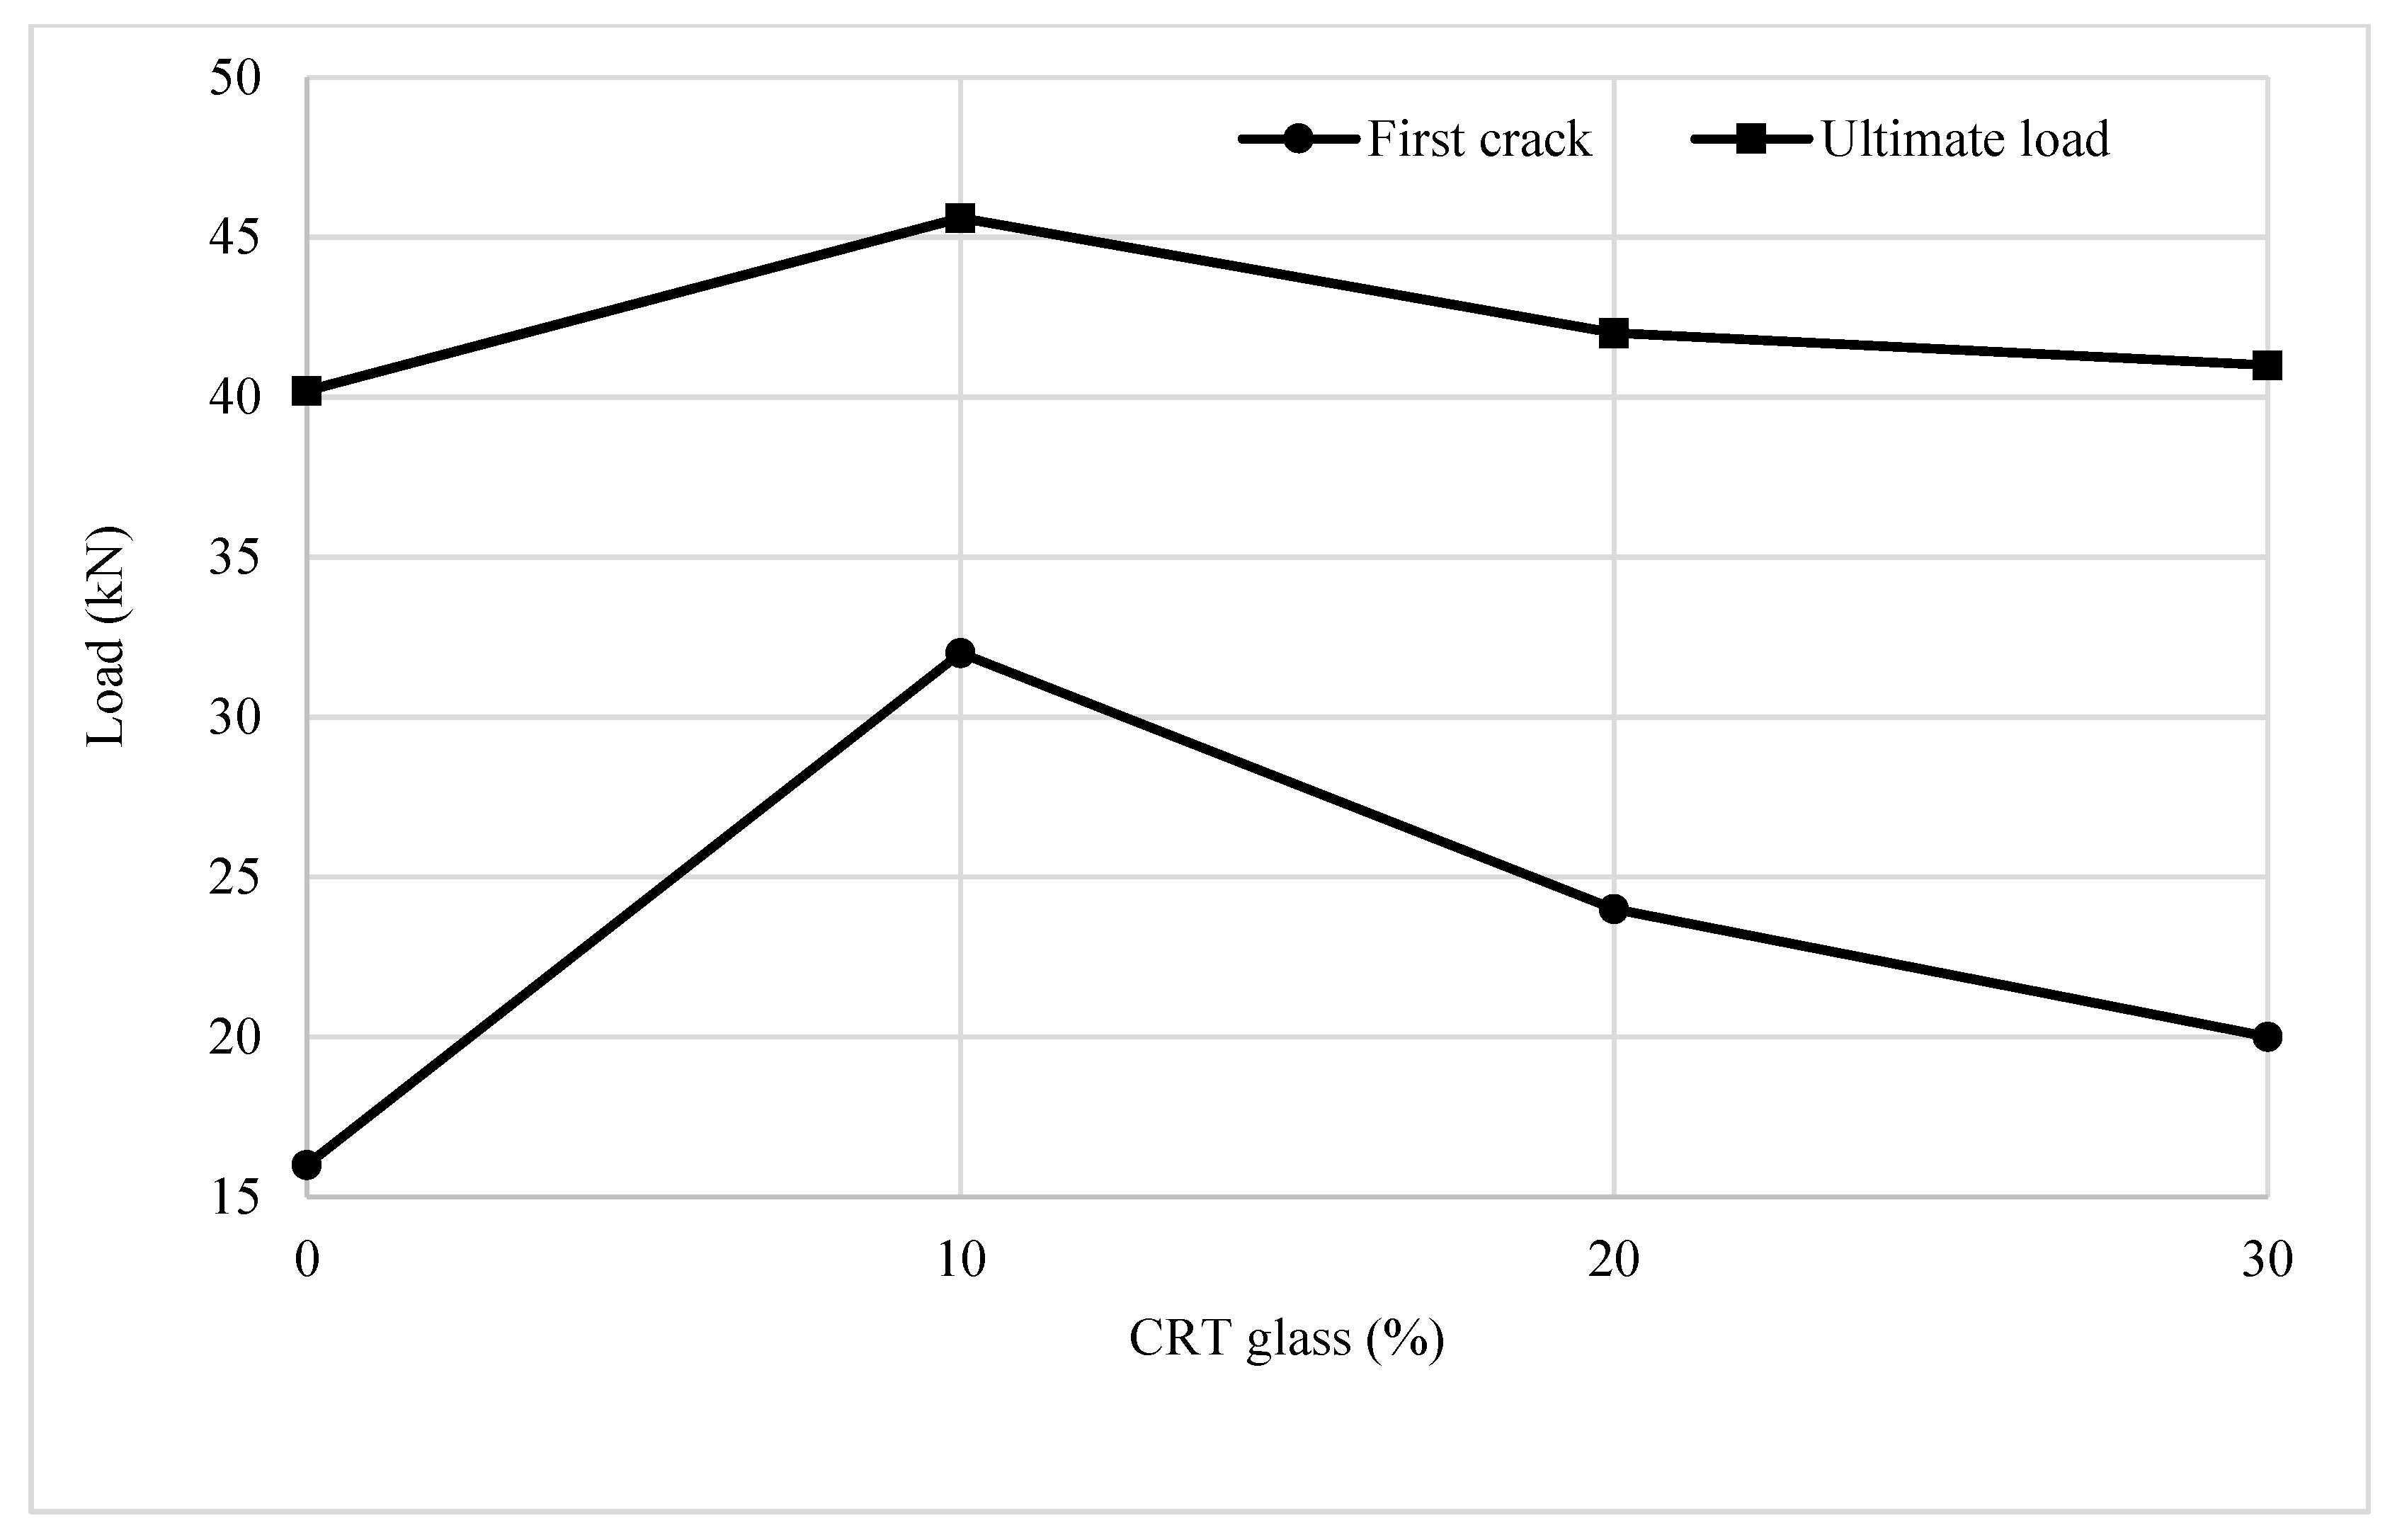
Figure 7 shows the load at first crack and the ultimate load for reinforced concrete beams containing 0%, 10%, 20% and 30% CRT glass. It can be noticed that the beam containing 10% replacement level of CRT glass had the highest load at first crack (32 kN) and the highest ultimate load (45.6 kN). On the other hand, the control beam (CRT-0) had the lowest load at first crack (16 kN) and ultimate load (40.2 kN). Although differences are slight, this trend is similar to that of compressive strength, splitting tensile strength, and modulus of elasticity (Table 2). This is in agreement with results obtained elsewhere [31,33].
3.3. Yield Displacement
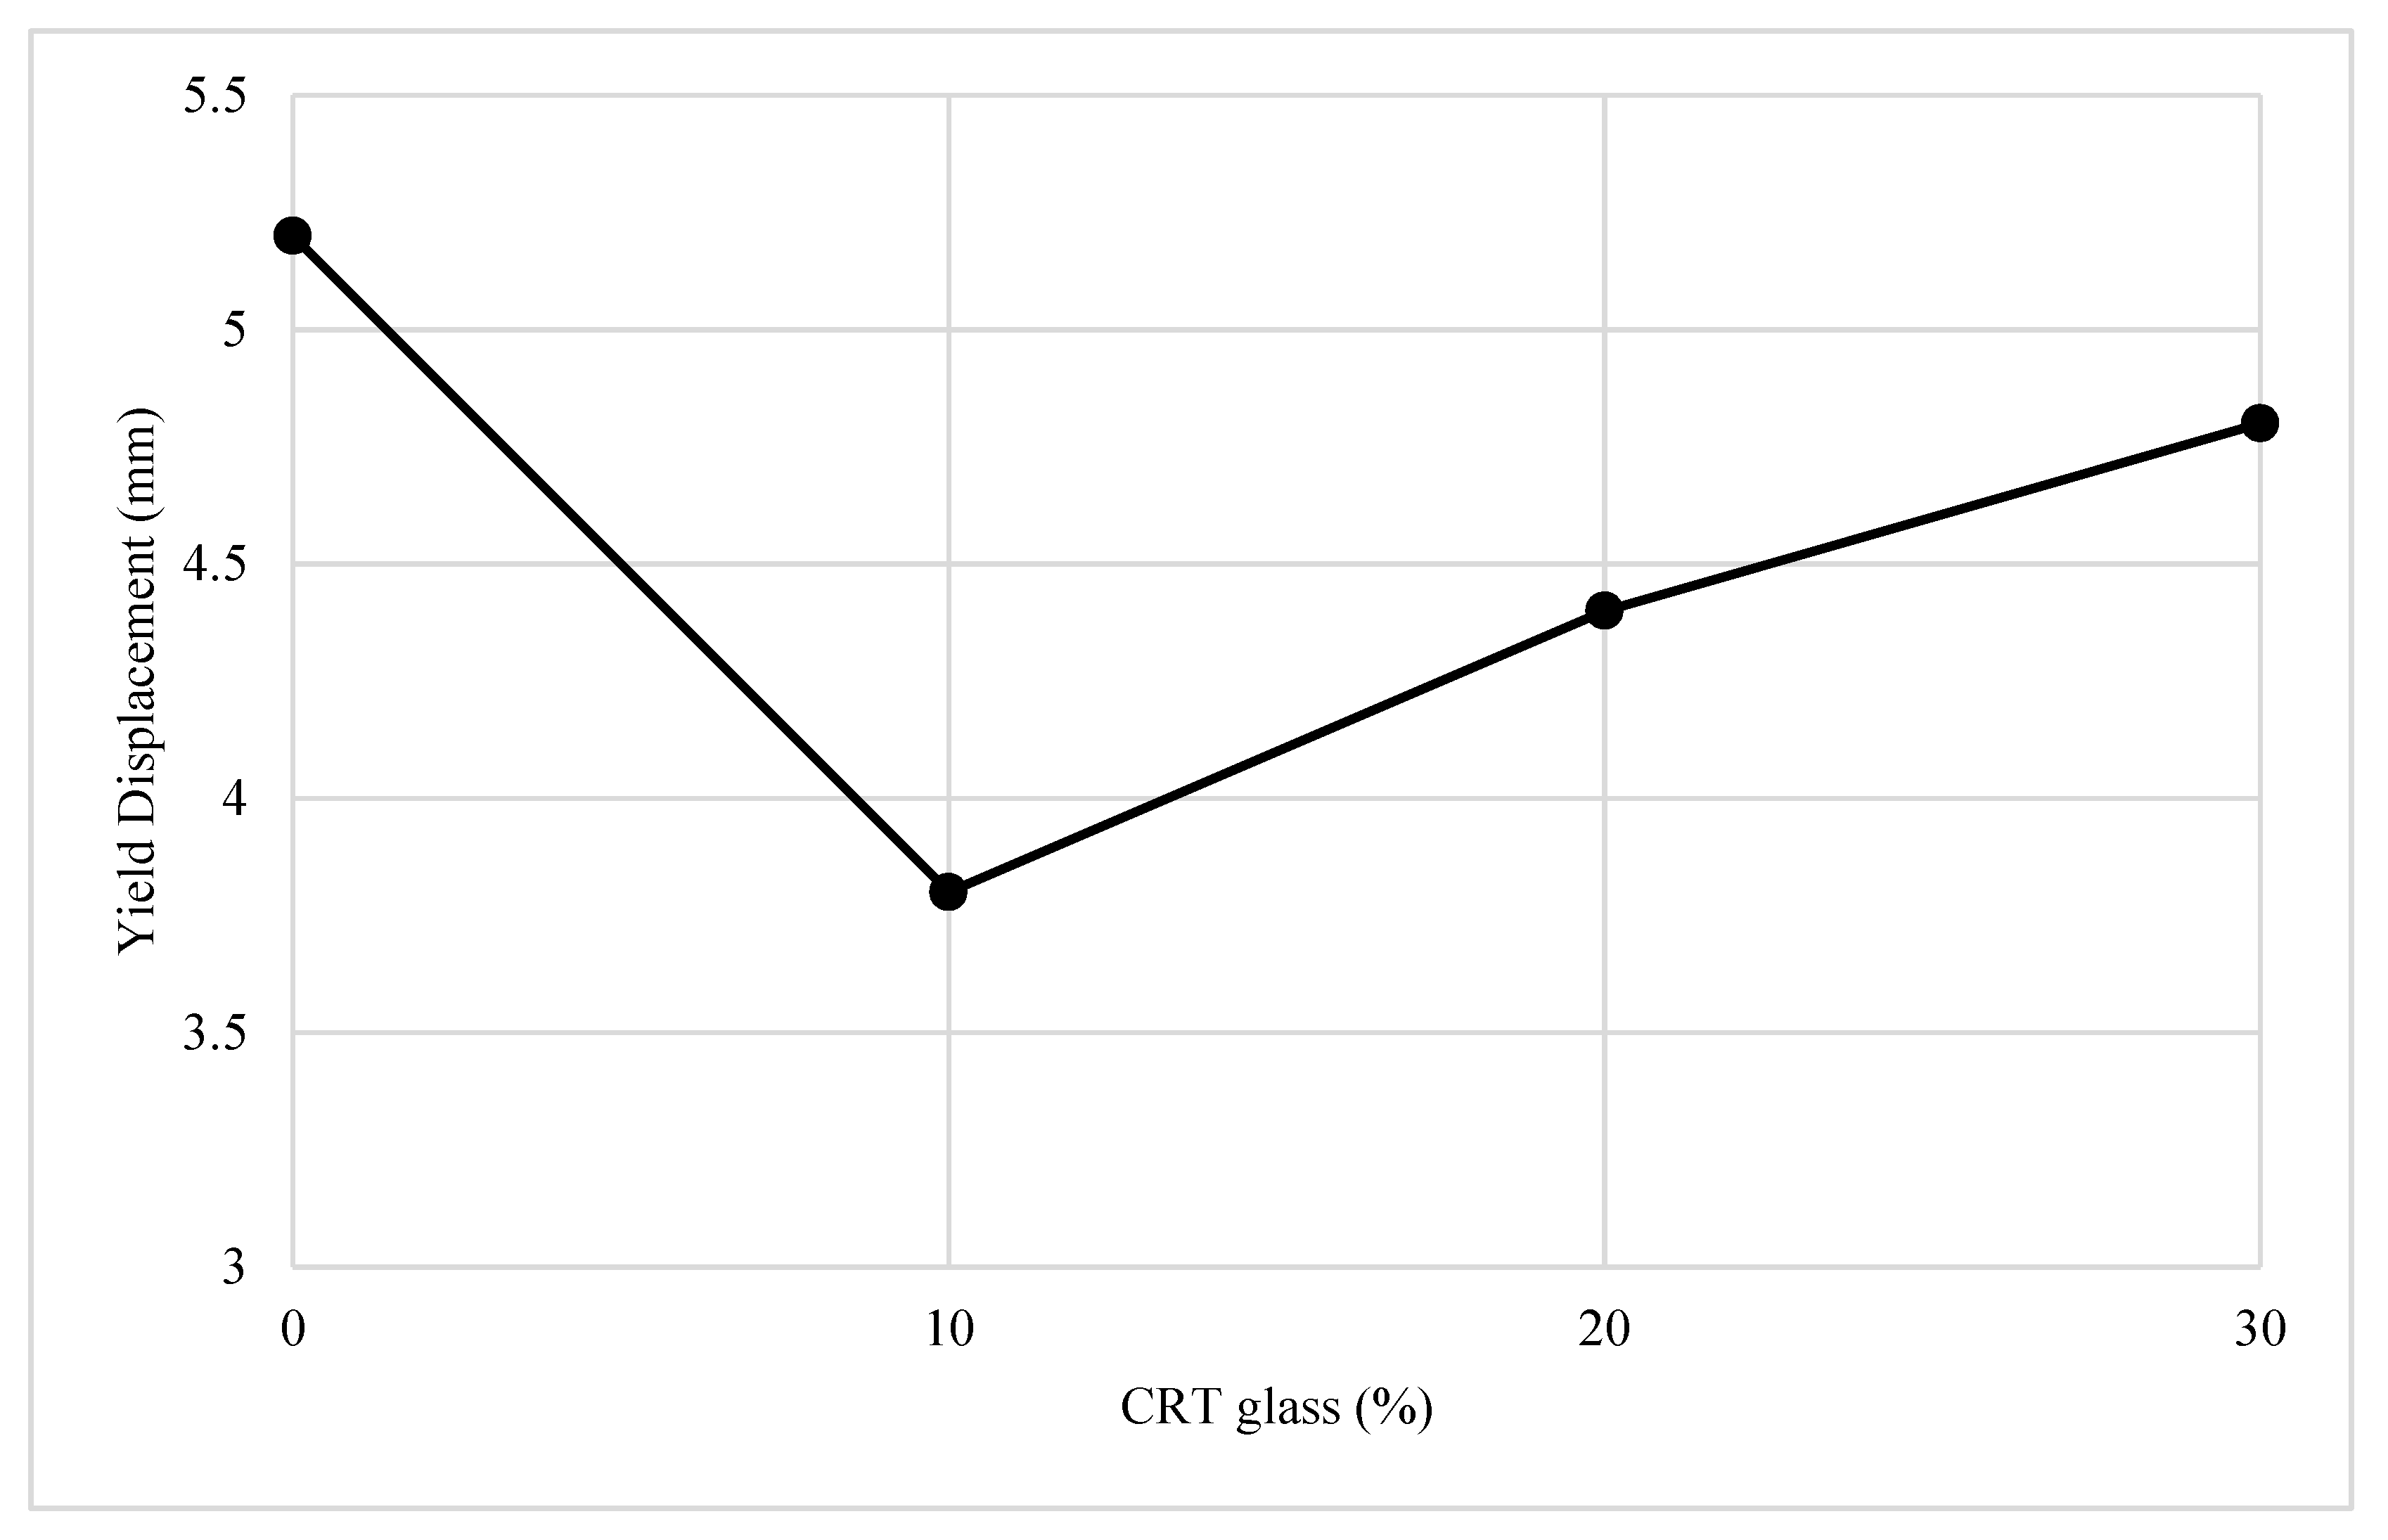
Figure 8 shows the displacement at yield point for the reinforced concrete beams containing 0%, 10%, 20% and 30% CRT glass. It can be noticed that the maximum displacement is for the control mix (CRT-0), where it reached 5.2 mm. The displacement is lower when CRT glass is present, where it reaches only 3.8 mm at 10% replacement level, indicating more brittleness. The CRT-20 and CRT-30 had a displacement of 4.4 and 4.8 mm, respectively.
3.4. Crack Appearance and Strain Distribution
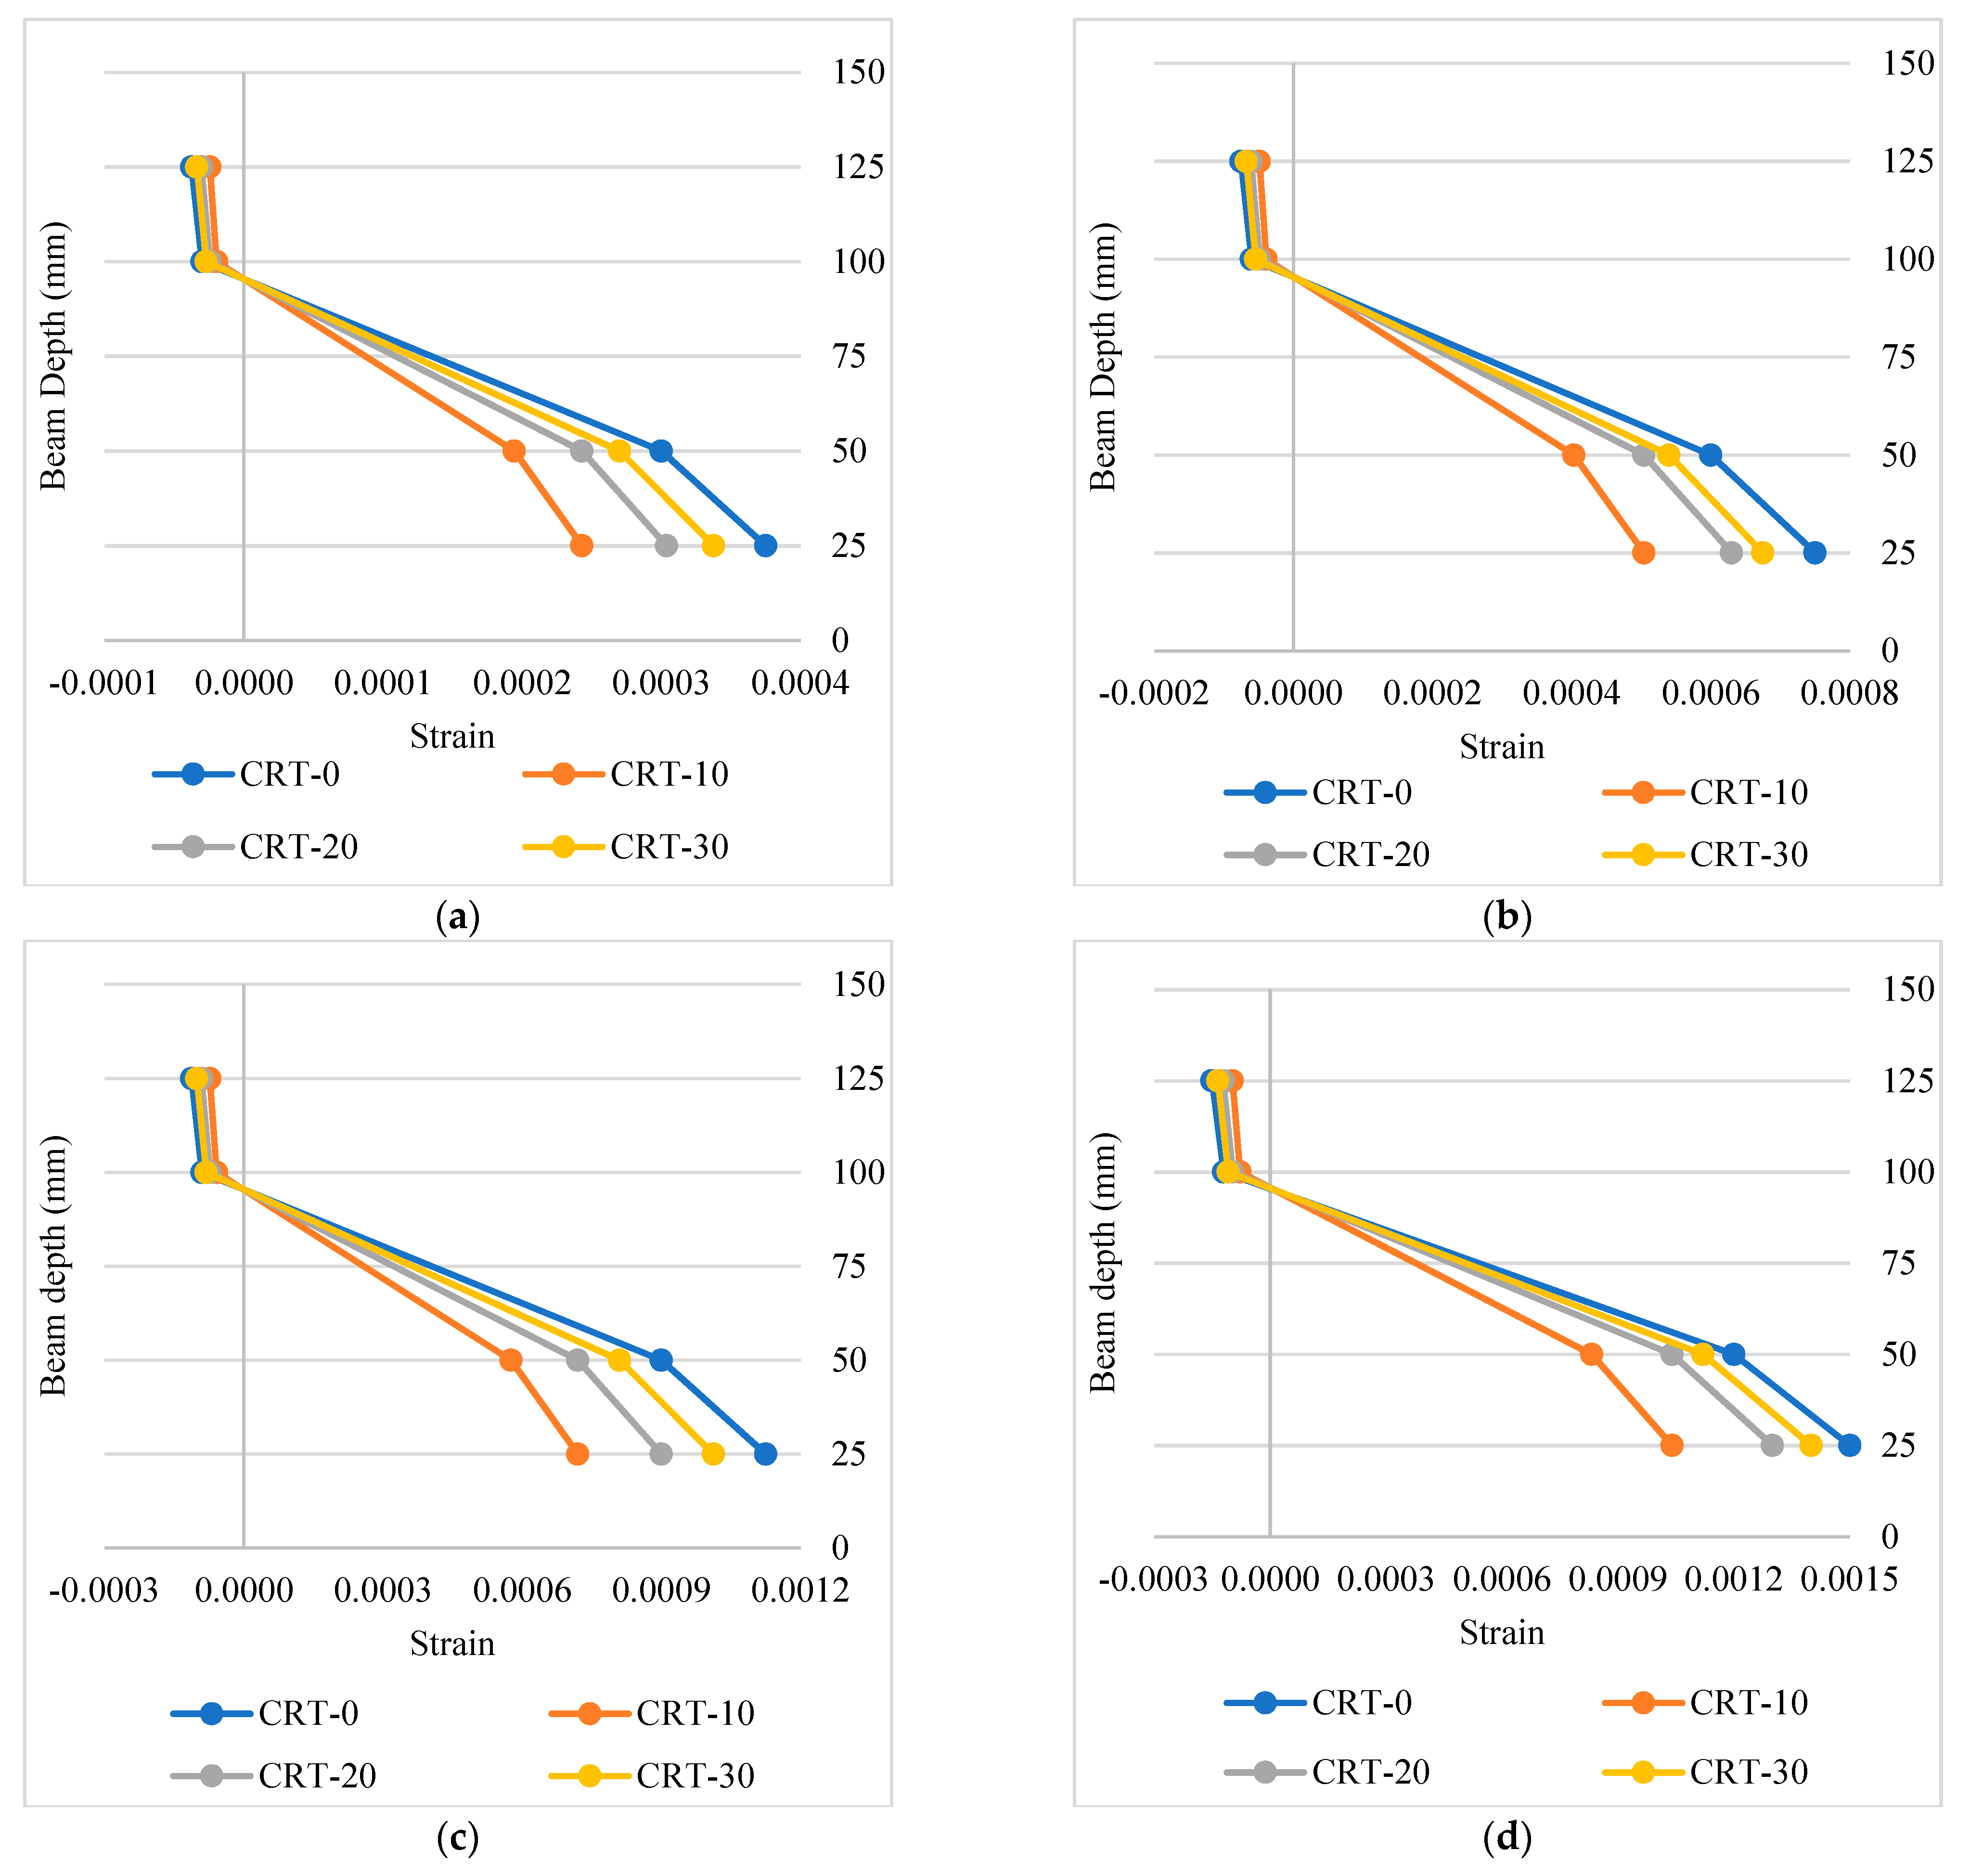
Figure 9a–d plot the strain distribution at different locations (25, 50, 100, and 125 mm from the bottom) for all beams at 8, 16, 24, and 32 kN, respectively. The strain at each DEMEC point was measured using mechanical strain gauge. Generally, and as can be expected, the top part of the beam undergoes compression while the bottom part is under tension. It can be inferred from the figures that the CRT-10 beam showed the least deformation at all locations compared with the other beams and at all loads (8, 16, 24, 32 kN), while CRT-0 (control) beam had the largest deformations at these loads. This can be attributed to the modulus of elasticity found earlier, where a higher modulus of elasticity indicates less deformability at the same load.
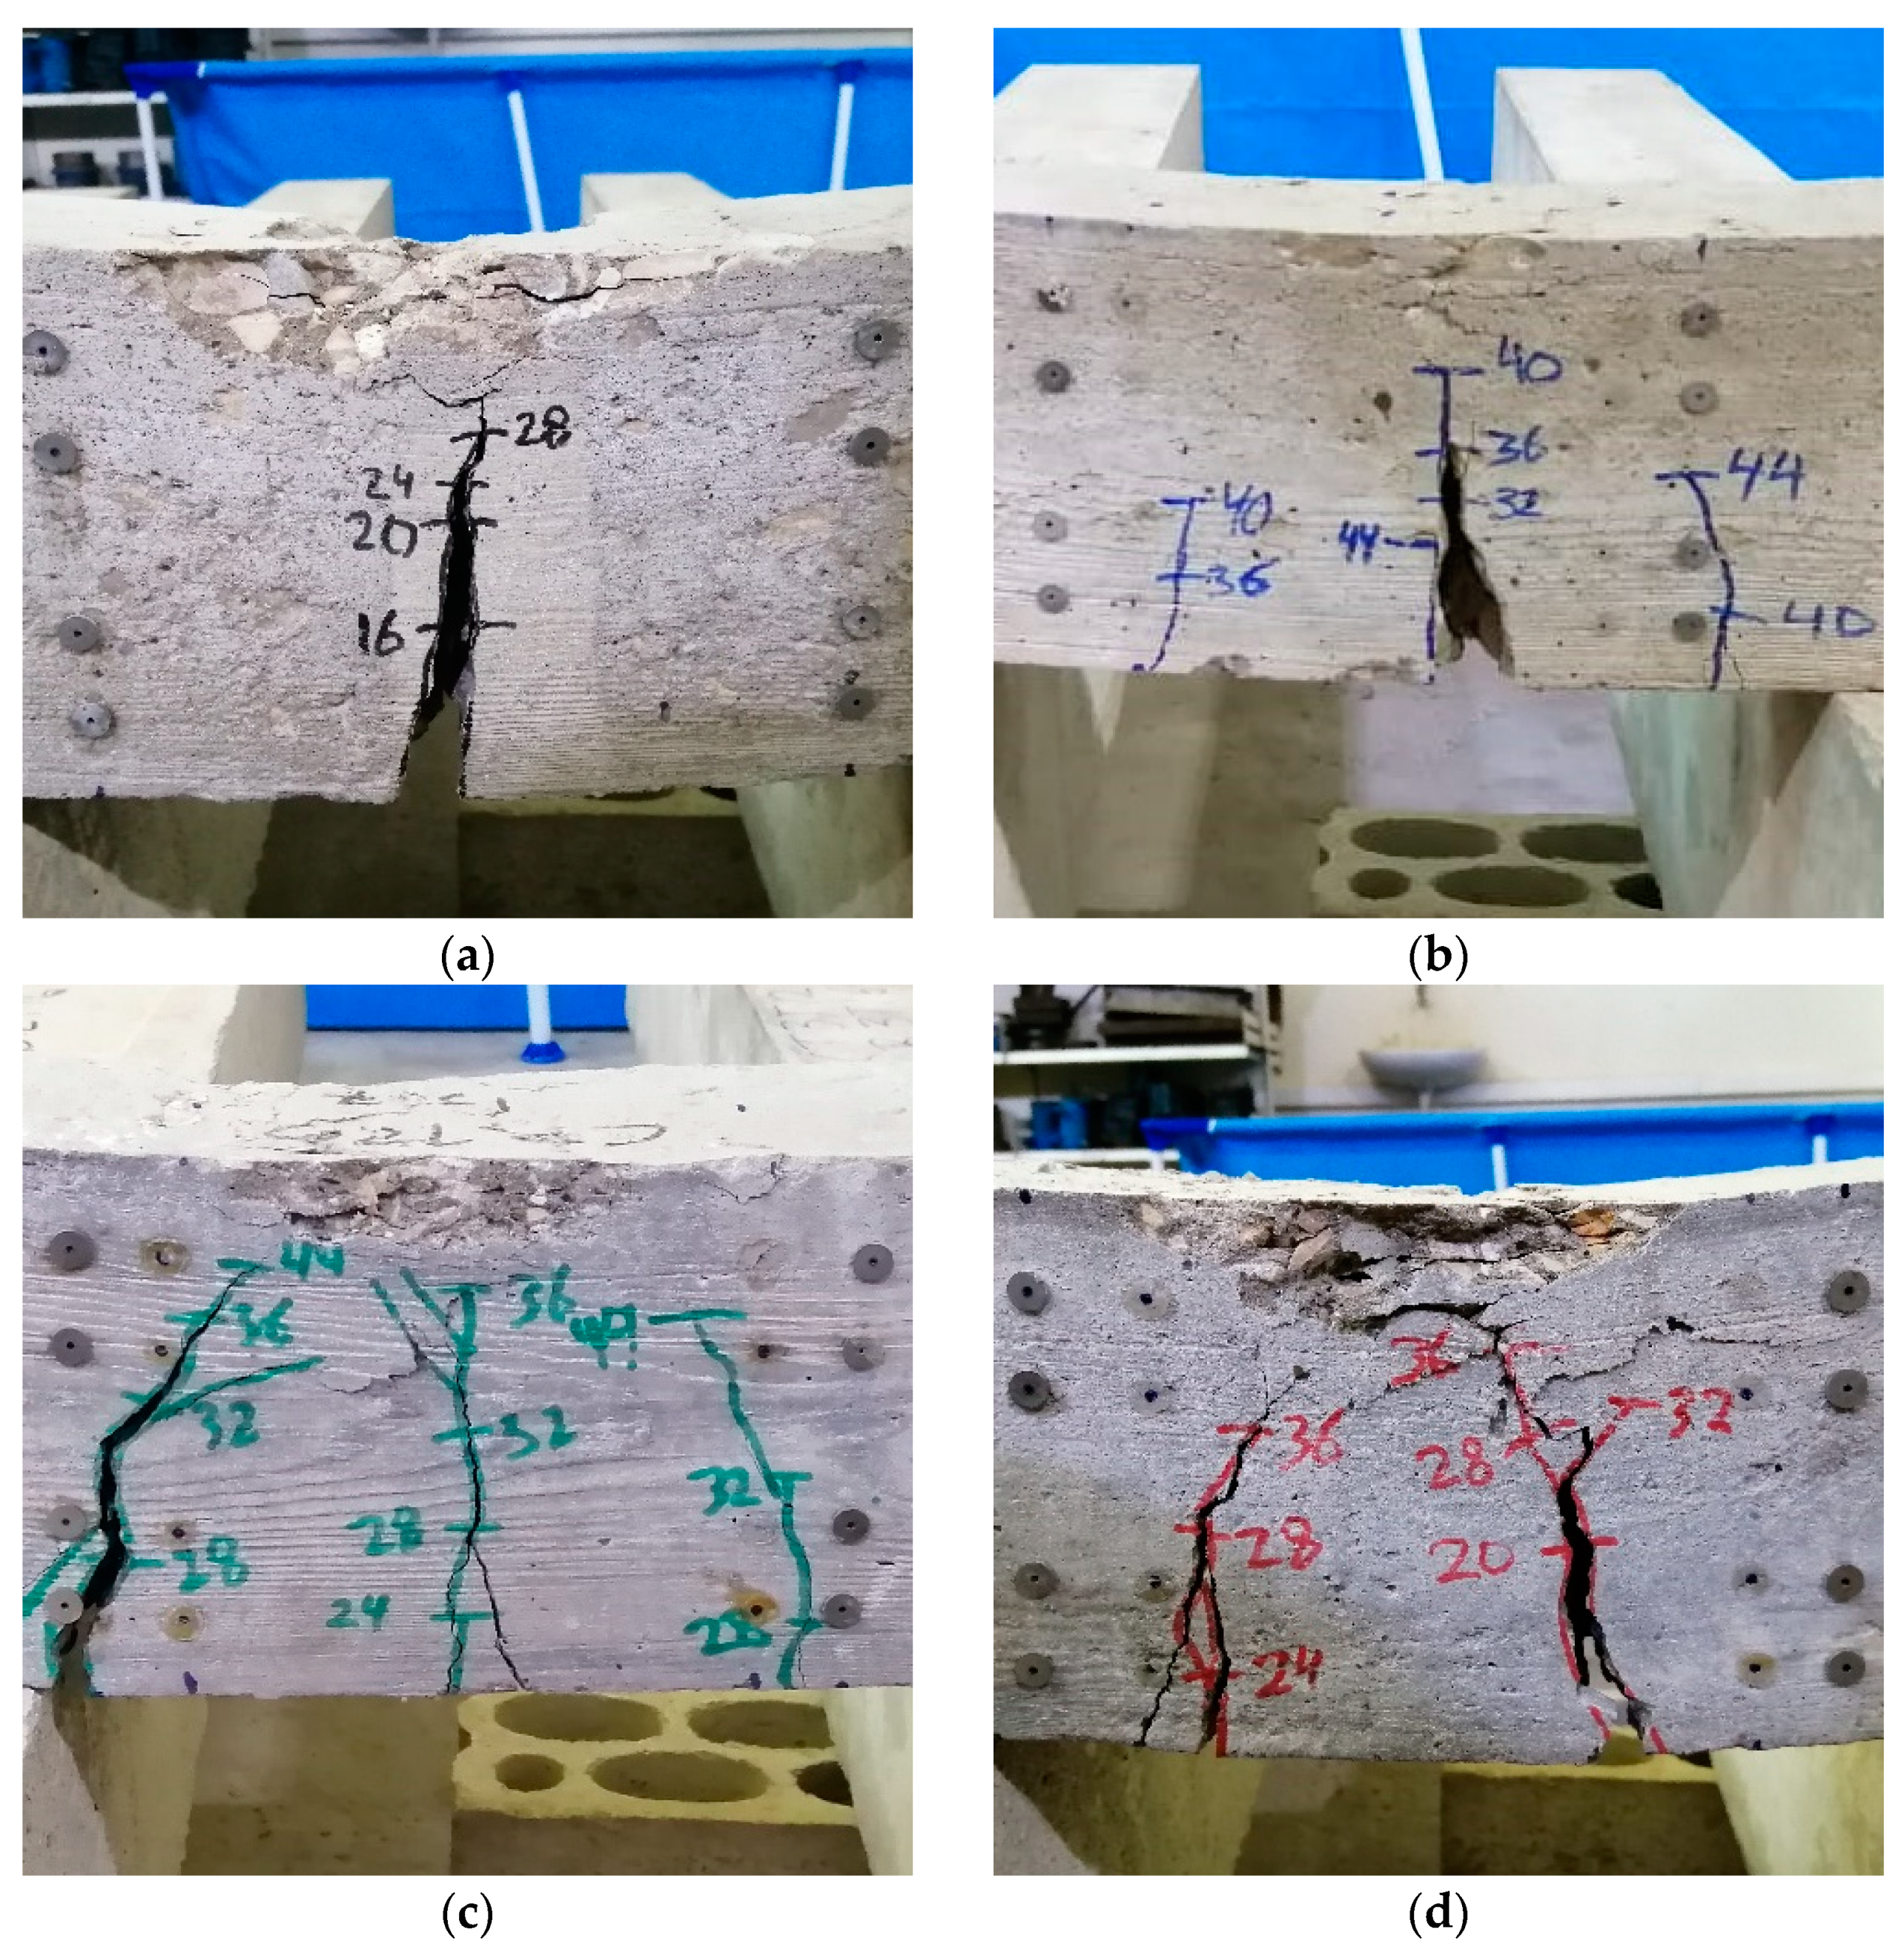
The failure mode and crack propagation of the beams is shown in Figure 10a–d for beams with 0%, 10%, 20%, and 30% CRT glass. As expected, cracks developed in the tensile zone and propagated vertically upwards, mainly in the middle part of the beam. This occurred in all beams, regardless of the CRT glass content. Crack propagation was relatively slow until the yield of the reinforcing steel. After that, the cracks widened and flexural failure took place. All beams showed similar behavior in terms of crack propagation and failure pattern. All beams failed in flexure regardless of the CRT content. However, at 20% and 30% replacement levels, multiple crack propagation was observed. This may be due to the stiffening effect and the changes in the bond between concrete and steel reinforcement after the increase in CRT content.
3.5. Numerical Analysis
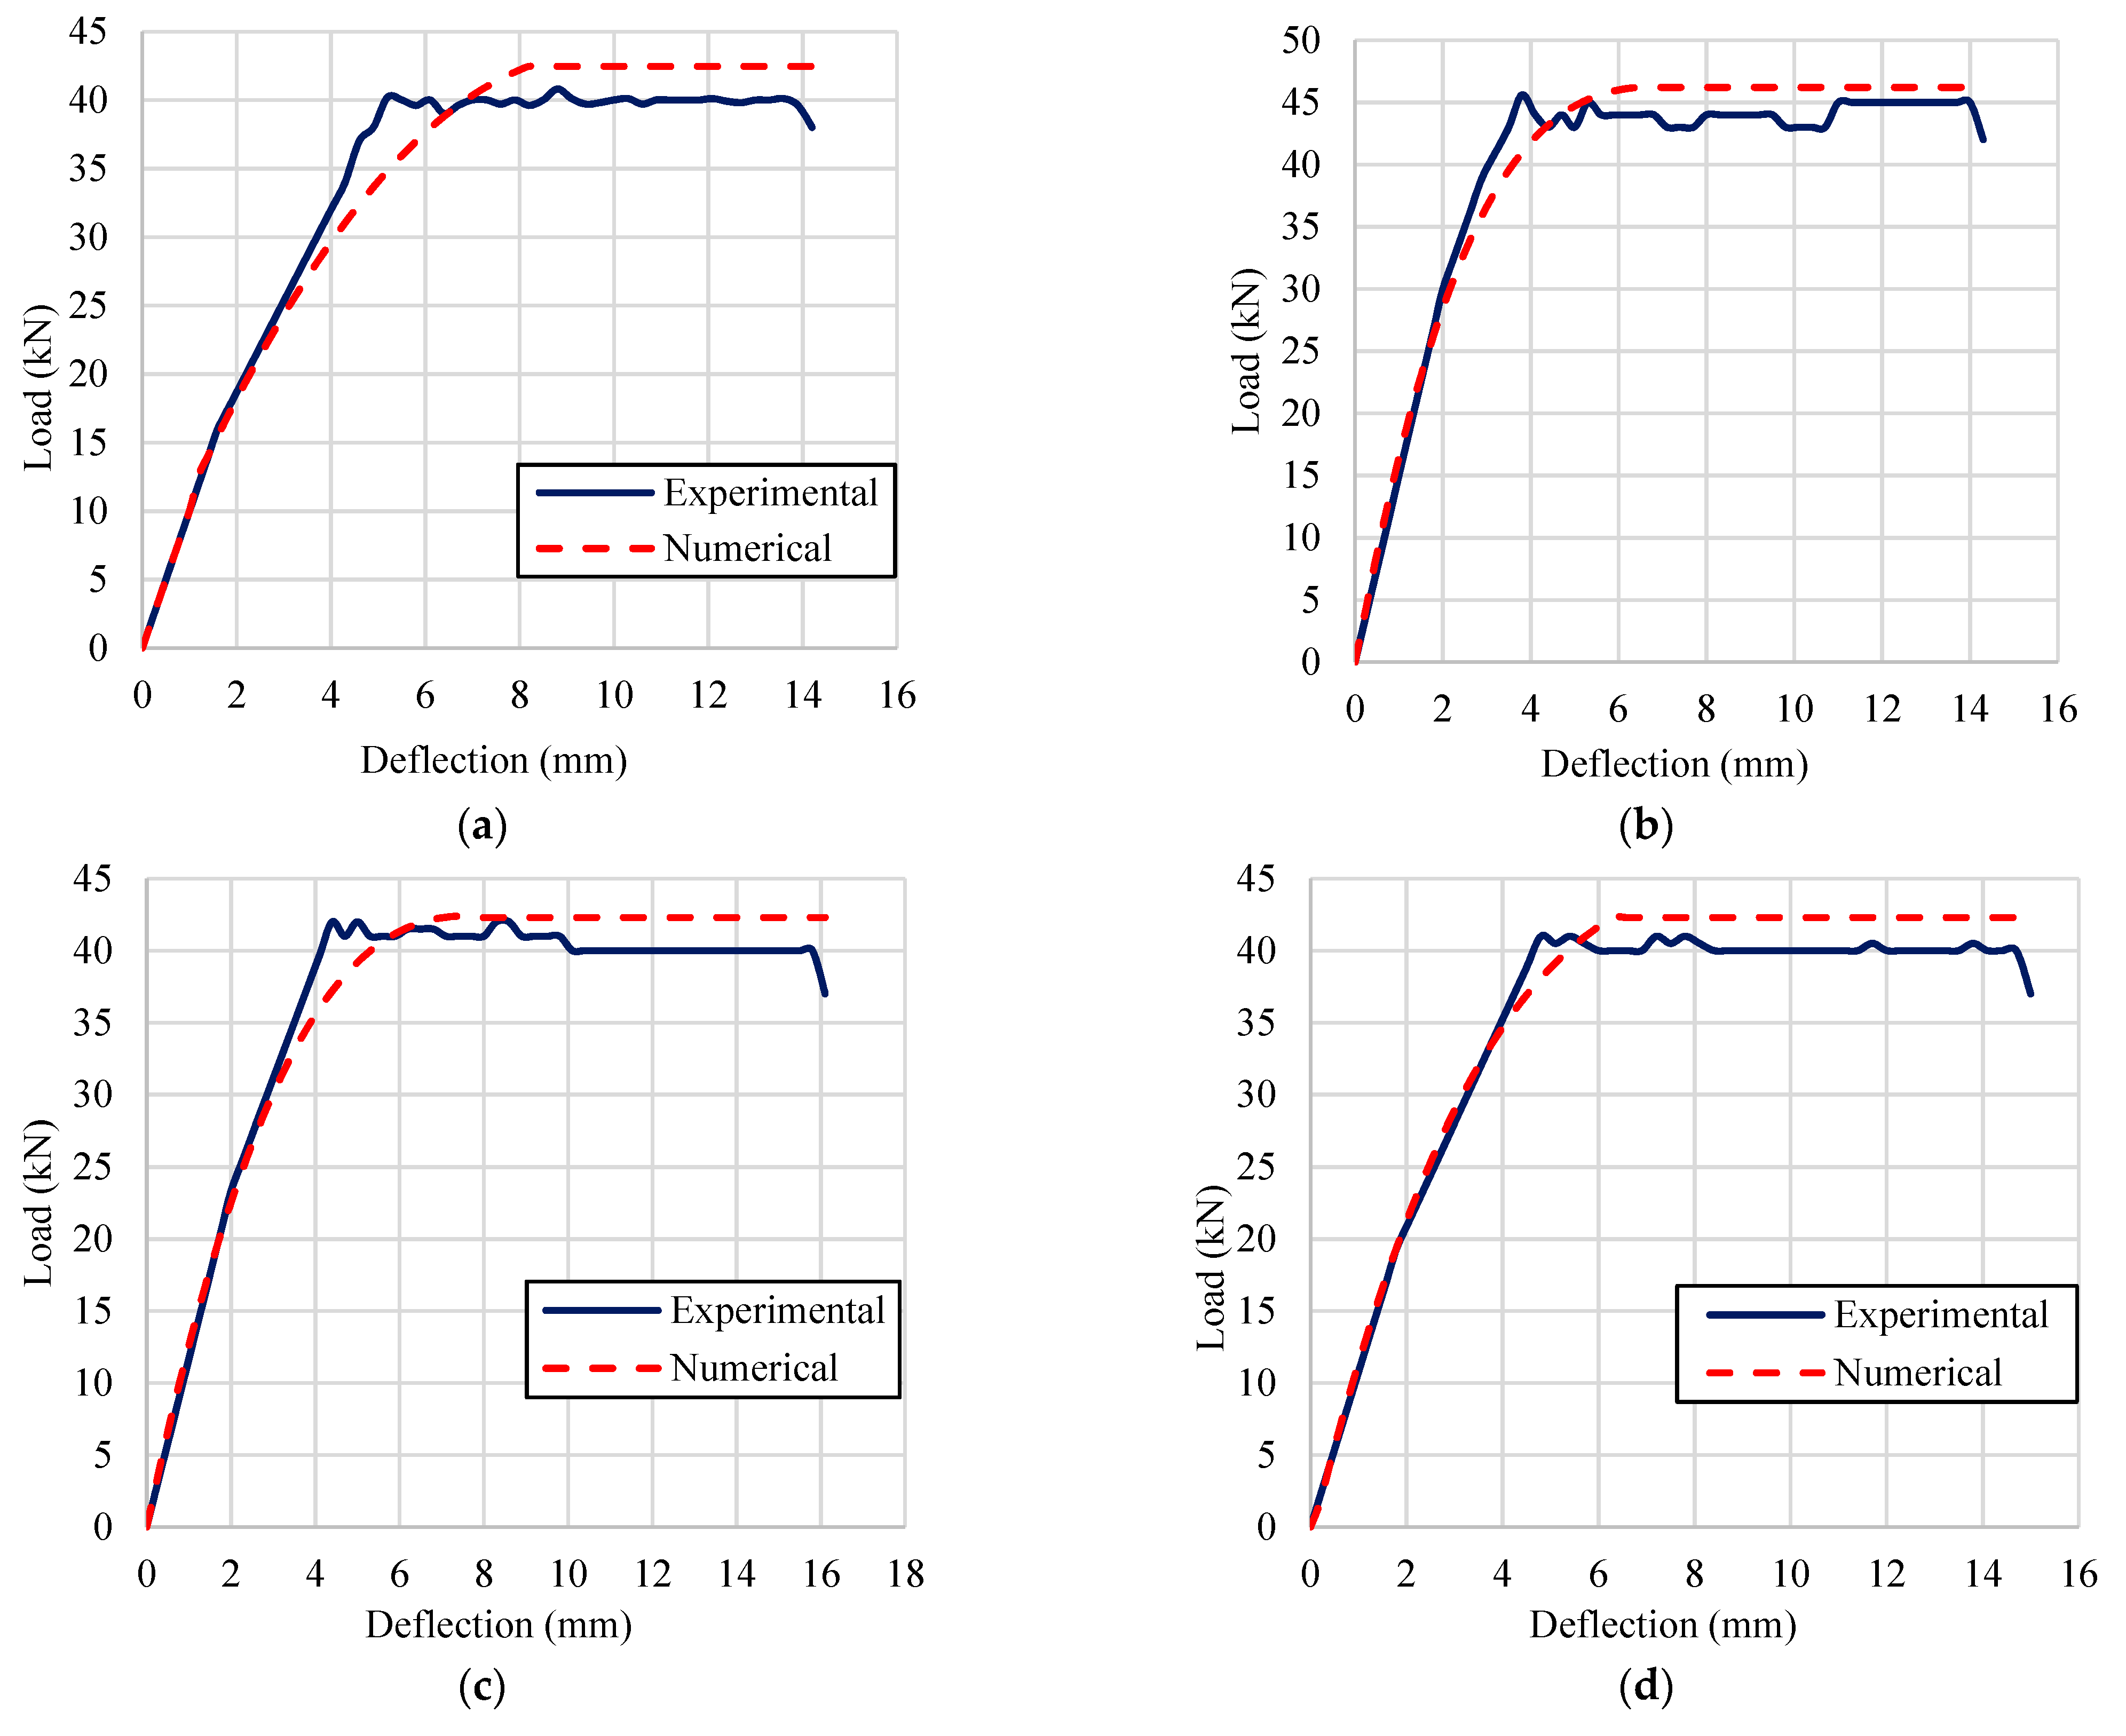
Table 4 summarizes the maximum load and maximum deflection for reinforced concrete beams containing 0%, 10%, 20%, and 30% CRT glass. It is obvious that the numerical maximum load capacities were close to the experimental results. The error percentages ranged between 0.7% and 5.5%. Similarly, the maximum deflection results generated by the software were remarkably close to the maximum deflection results obtained experimentally. The error percentages ranged between 0% and 2%.
The load-deflection curves for all beams obtained from the experimental results and those generated by the software are shown in Figure 11a–d. It can be noticed that the curves produced by numerical analysis display a behavior equivalent to that of the curves found experimentally. This is an indication of the validity of the numerical model for further analysis.
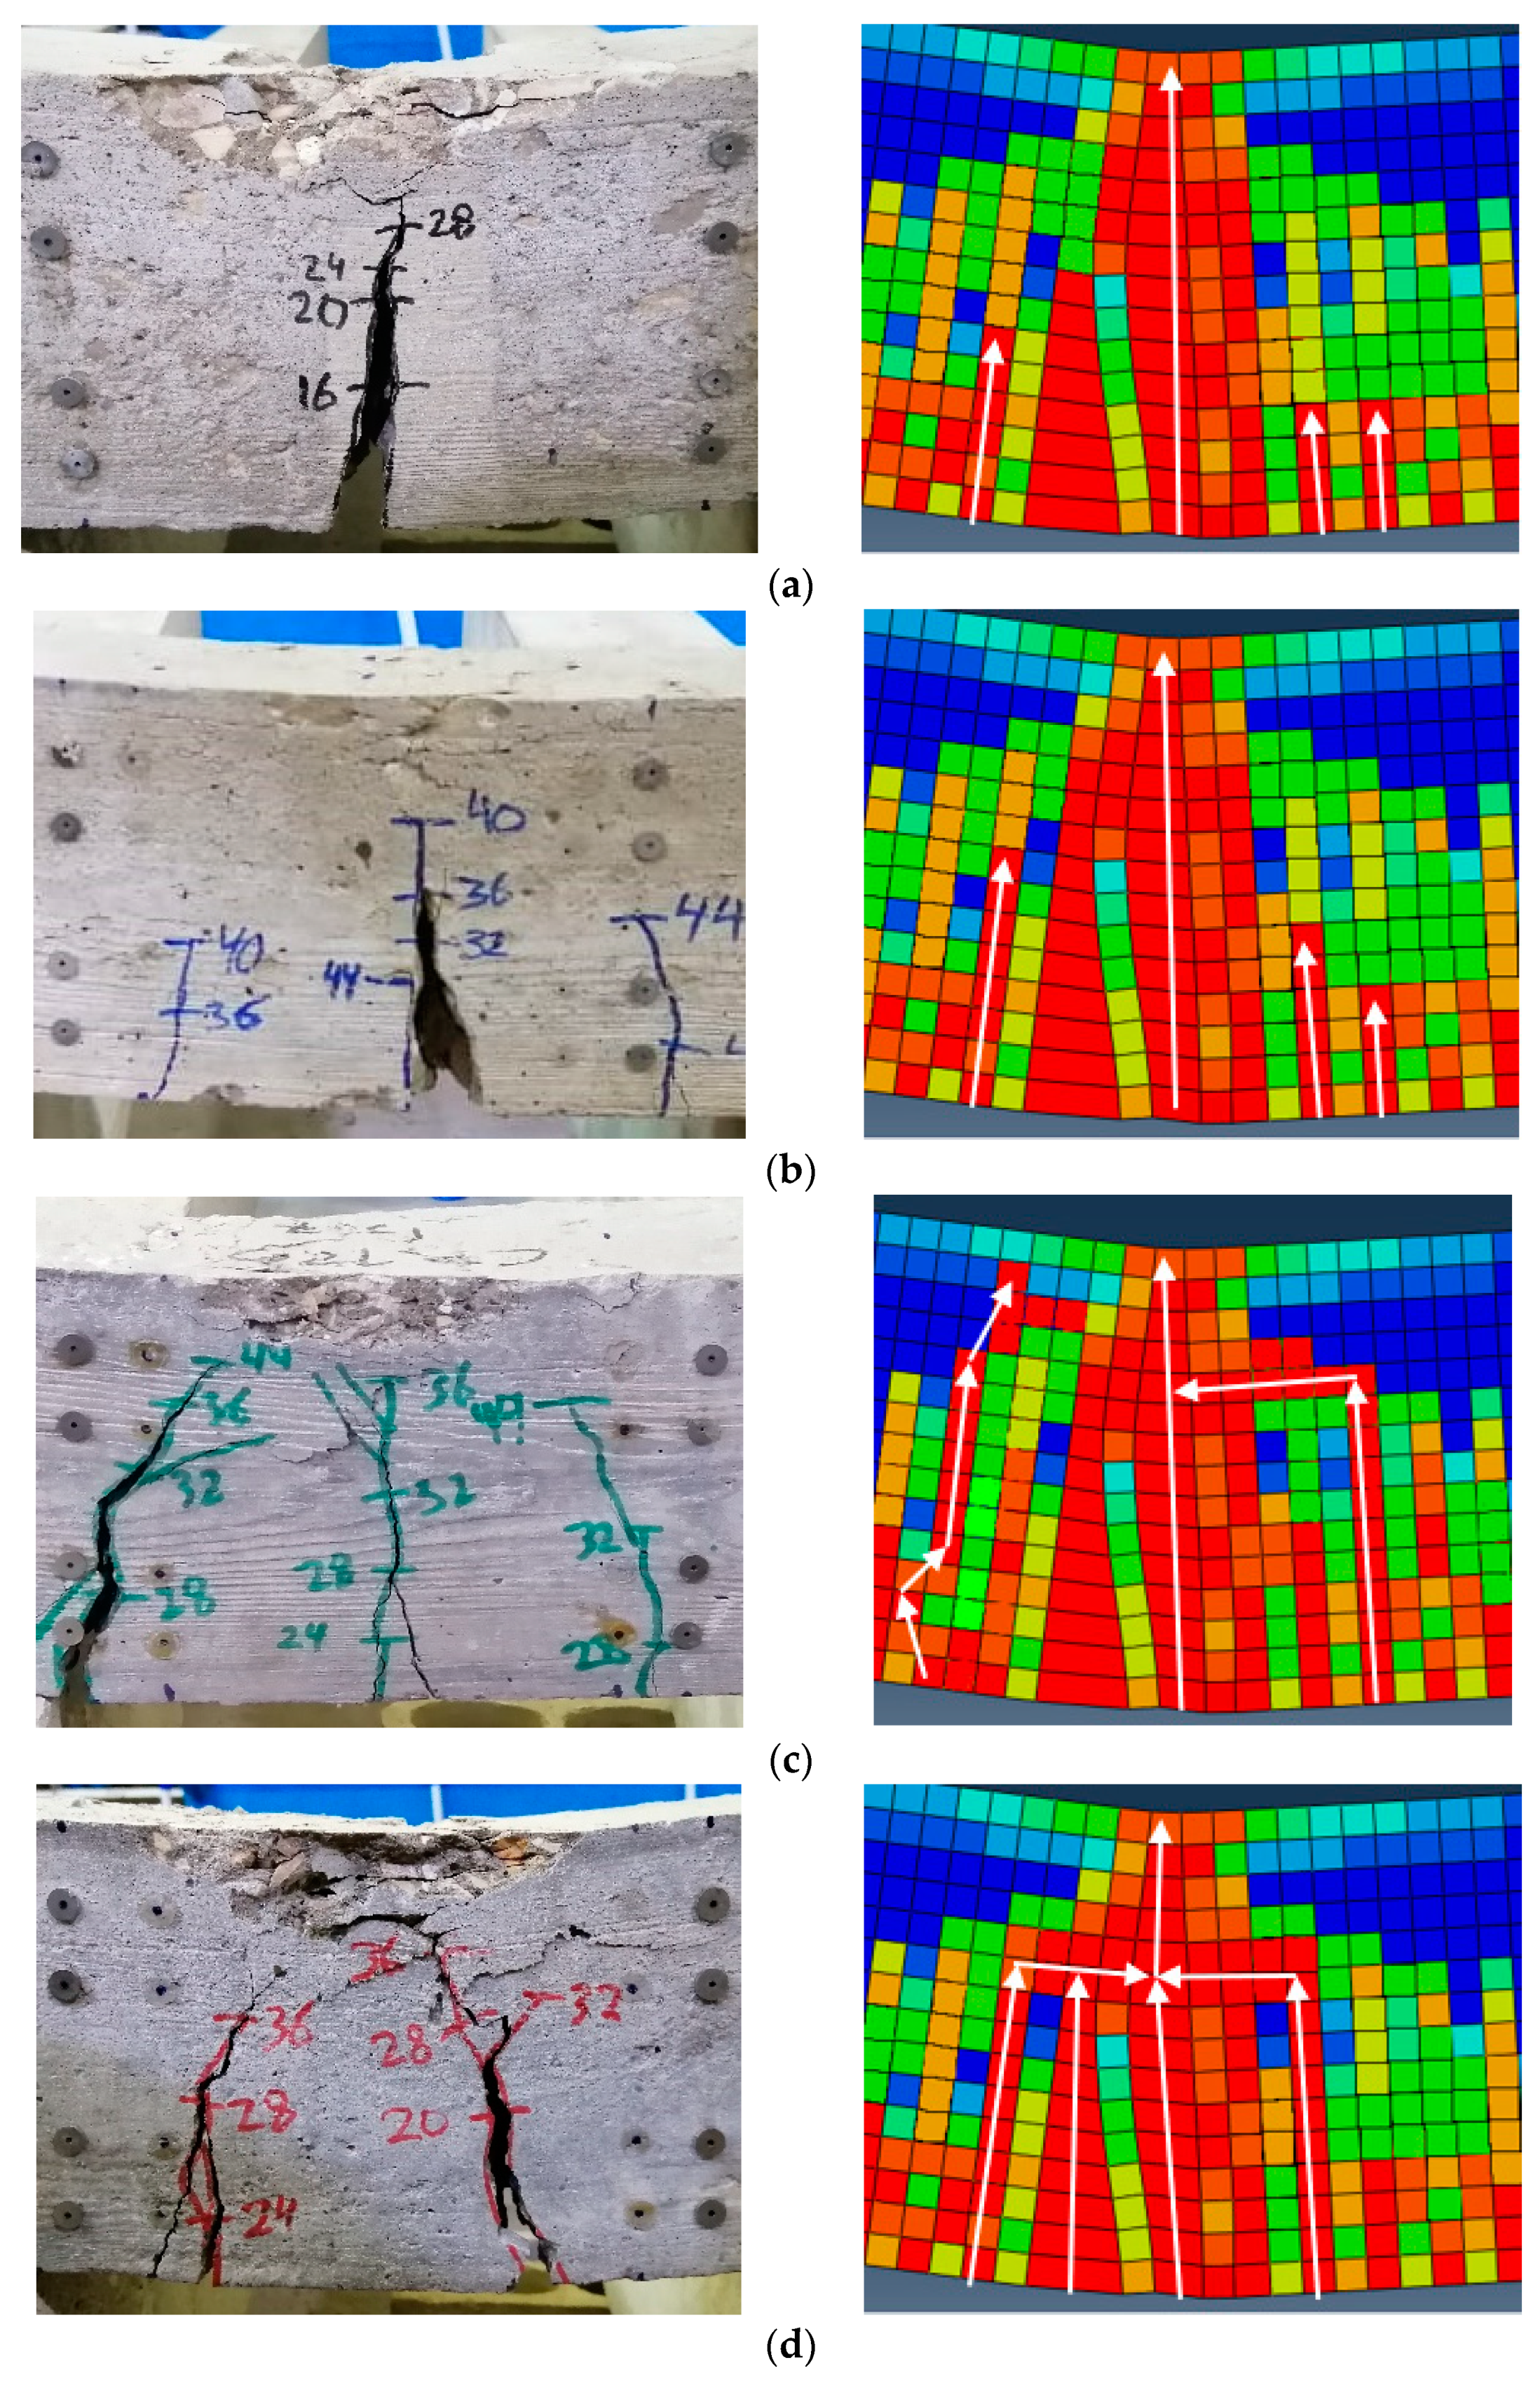
Figure 12a–d show the tensile damage in reinforced concrete beams containing 0%, 10%, 20%, and 30% CRT glass from the numerical analysis compared to the beams obtained by experimental work. It can be noticed that the beams in both cases experienced flexural failure from the crack patterns. However, there are slight variations in the crack patterns. These differences could be generally attributed to the uncertainties in the conditions of the experimental testing, whereas the numerical modeling assumes perfect symmetry in both supporting and loading conditions.
4. Conclusions
In this study, four concrete mixes including 0%, 10%, 20% and 30% CRT glass waste as partial substitution of sand were prepared. Several tests investigating concrete properties and structural performance of reinforced concrete beams were conducted. Several conclusions can be inferred based on the current investigation.
As for the mechanical properties of the concrete mixes, using 10% CRT as a partial substitution of fine aggregate leads to a higher compressive strength, splitting tensile strength, and modulus of elasticity compared with the control. At 10% replacement level, the compressive strength of concrete increased by about 21% when compared with the control mix.
Concerning the flexural performance of the beams, the maximum load carrying capacity of reinforced concrete beam occurs at the 10% replacement level of CRT glass, which is around a 13% increase. In addition, the presence of CRT glass in reinforced concrete beams leads to a higher ductility, especially at 10% replacement level where the ductility index was about twice that of the control beam. The control beam had the largest deformations along the depth compared with beams containing varying amounts of CRT glass.
The numerical analysis conducted by ABAQUS accurately predicted the load capacity and maximum deflections of the beams with minimal errors ranging between 0% and 5.5%. ABAQUS produced load–deflection curves showing a behavior remarkably similar to the curves obtained by experimental work. In addition, the numerical analysis predicted a tensile damage comparable to the damage found in the experimental program.
Author Contributions
Conceptualization, J.K. and A.E.; methodology, J.K.; software, A.J.; validation, J.K., E.G. and A.E.; formal analysis, J.B., A.J. and E.G.; investigation, J.B.; resources, J.B.; data curation, J.B. and A.J.; writing—original draft preparation, J.B.; writing—review and editing, J.K.; visualization, J.B.; supervision, J.K. and A.E.; project administration, A.E.; All authors have read and agreed to the published version of the manuscript.
Funding
This research received no external funding.
Institutional Review Board Statement
Not applicable.
Informed Consent Statement
Not applicable.
Data Availability Statement
Data sharing not applicable.
Conflicts of Interest
The authors declare no conflict of interest.
References
- Baldé, C.P.; Forti, V.; Gray, V.; Kuehr, R.; Stegmann, P. The Global E-Waste Monitor 2017: Quantities, Flows and Resources; United Nations University, ITU and ISWA: Bonn, Germany, 2017; ISBN 9789280890. [Google Scholar]
- Poon, C.S. Management of CRT glass from discarded computer monitors and TV sets. Waste Manag. 2008, 28, 6389. [Google Scholar] [CrossRef]
- Jiang, X.J.; Liu, J.X.; Yan, K.; Guo, X.Y. Prediction of electronic waste amount and metal cumulative amount features. Nonferrous Met. Sci. Eng. 2016, 7, 104–109. [Google Scholar]
- Rocchetti, L.; Beolchini, F. Environmental burdens in the management of end-of-life cathode ray tubes. Waste Manag. 2014, 34, 468–474. [Google Scholar] [CrossRef]
- Qi, Y.; Xiao, X.; Lu, Y.; Shu, J.; Wang, J.; Chen, M. Cathode ray tubes glass recycling: A review. Sci. Total Environ. 2019, 650, 2842–2849. [Google Scholar] [CrossRef] [PubMed]
- Singh, N.; Li, J.; Zeng, X. Global responses for recycling waste CRTs in e-waste. Waste Manag. 2016. [Google Scholar] [CrossRef]
- Andreola, F.; Barbieri, L.; Corradi, A.; Lancellotti, I. CRT glass state of the art: A case study: Recycling in ceramic glazes. J. Eur. Ceram. Soc. 2007, 27, 1623–1629. [Google Scholar] [CrossRef]
- Andreola, F.; Barbieri, L.; Corradi, A.; Lancellotti, I. Cathode ray tube glass recycling: An example of clean technology. Waste Manag. Res. 2005. [Google Scholar] [CrossRef]
- Lee, C.; Hsi, C. Recycling of Scrap Cathode Ray Tubes. Environ. Sci. Technol. 2002, 36, 69–75. [Google Scholar] [CrossRef]
- Singh, N.; Wang, J.; Li, J. Waste Cathode Rays Tube: An Assessment of Global Demand for Processing. Procedia Environ. Sci. 2016, 31, 465–474. [Google Scholar] [CrossRef] [Green Version]
- Elshkaki, A.; van der Voet, E.; Timmermans, V.; Van Holderbeke, M. Dynamic stock modelling: A method for the identification and estimation of future waste streams and emissions based on past production and product stock characteristics. Energy 2005, 30, 1353–1363. [Google Scholar] [CrossRef]
- Seeberger, J.; Grandhi, R.; Kim, S.S.; Mase, W.A.; Reponen, T.; Ho, S.; Chen, A. E-Waste Management in the United States and Public Health Implications. J. Environ. Health 2016, 79, 8–17. [Google Scholar]
- Singh, N.; Li, J.; Zeng, X. Solutions and Challenges in Recycling Waste Cathode-Ray Tubes. J. Clean. Prod. 2016. [Google Scholar] [CrossRef]
- Zhao, H.; Poon, C.S. A comparative study on the properties of the mortar with the cathode ray tube funnel glass sand at different treatment methods. Constr. Build. Mater. 2017, 148, 900–909. [Google Scholar] [CrossRef]
- Taha, B.; Nounu, G. Properties of concrete contains mixed colour waste recycled glass as sand and cement replacement. Constr. Build. Mater. 2008, 22, 713–720. [Google Scholar] [CrossRef]
- Kim, I.S.; Choi, S.Y.; Yang, E.I. Evaluation of durability of concrete substituted heavyweight waste glass as fine aggregate. Constr. Build. Mater. 2018, 184, 269–277. [Google Scholar] [CrossRef]
- Romero, D.; James, J.; Mora, R.; Hays, C.D. Study on the mechanical and environmental properties of concrete containing cathode ray tube glass aggregate. Waste Manag. 2013, 33, 1659–1666. [Google Scholar] [CrossRef]
- Ling, T.C.; Poon, C.S. A comparative study on the feasible use of recycled beverage and CRT funnel glass as fine aggregate in cement mortar. J. Clean. Prod. 2012, 29–30, 46–52. [Google Scholar] [CrossRef]
- Bawab, J.; Khatib, J.; Jahami, A.; Kenai, S.; Elkordi, A. Effect of Using Cathode-Ray Tubes (CRT) Waste Glass on Concrete Properties. BAU J.-Sci. Technol. 2020, 2. Available online: https://digitalcommons.bau.edu.lb/stjournal/vol2/iss1/3 (accessed on 3 January 2021).
- Jóźwiak-Niedźwiedzka, D.; Lessing, P.A. High-density and radiation shielding concrete. In Developments in the Formulation and Reinforcement of Concrete; Elsevier: Amsterdam, The Netherlands, 2019; pp. 193–228. [Google Scholar]
- Ling, T.C.; Poon, C.S. Effects of particle size of treated CRT funnel glass on properties of cement mortar. Mater. Struct. Constr. 2013, 46, 25–34. [Google Scholar] [CrossRef]
- Ling, T.C.; Poon, C.S.; Lam, W.S.; Chan, T.P.; Fung, K.K.L. Utilization of recycled cathode ray tubes glass in cement mortar for X-ray radiation-shielding applications. J. Hazard. Mater. 2012, 199–200, 321–327. [Google Scholar] [CrossRef]
- Ouldkhaoua, Y.; Benabed, B.; Abousnina, R.; Kadri, E.-H.; Khatib, J. Effect of using metakaolin as supplementary cementitious material and recycled CRT funnel glass as fine aggregate on the durability of green self-compacting concrete. Constr. Build. Mater. 2020, 235, 117802. [Google Scholar] [CrossRef]
- Wang, J.; Guo, S.; Dai, Q.; Si, R.; Ma, Y. Evaluation of cathode ray tube (CRT) glass concrete with/without surface treatment. J. Clean. Prod. 2019, 226, 85–95. [Google Scholar] [CrossRef]
- Song, W.; Zou, D.; Liu, T.; Teng, J.; Li, L. Effects of recycled CRT glass fine aggregate size and content on mechanical and damping properties of concrete. Constr. Build. Mater. 2019, 202, 332–340. [Google Scholar] [CrossRef]
- Hui, Z.; Sun, W. Study of properties of mortar containing cathode ray tubes (CRT) glass as replacement for river sand fine aggregate. Constr. Build. Mater. 2011, 25, 4059–4064. [Google Scholar] [CrossRef]
- Zhao, H.; Poon, C.S.; Ling, T.C. Utilizing recycled cathode ray tube funnel glass sand as river sand replacement in the high-density concrete. J. Clean. Prod. 2013, 51, 184–190. [Google Scholar] [CrossRef]
- Hama, S.H.; Mahmoud, A.S.; Yassen, M.M. Flexural behavior of reinforced concrete beam incorporating waste glass powder. Structures 2019, 20, 510–518. [Google Scholar] [CrossRef]
- Metawei, H.; Arafa, D. The Flexural Behavior of Reinforced Concrete Beam with Recycled Coarse and Fine Glass Aggregate. In Proceedings of the 2nd International conference Sustainable Construction and Project Management-Sustainable Infrastructure and Transportation for Future Cities, Aswan, Egypt, 16 December 2018. [Google Scholar]
- Khatib, J.; Jahami, A.; Elkordi, A.; Baalbaki, O. Structural performance of reinforced concrete beams containing plastic waste caps. Mag. Civ. Eng. 2019, 91, 73–79. [Google Scholar] [CrossRef]
- Khatib, J.; Jefimiuk, A.; Khatib, S. Flexural behaviour of reinforced concrete Beams containing expanded glass as Lightweight aggregates. Slovak J. Civ. Eng. 2015, 23, 1–7. [Google Scholar] [CrossRef] [Green Version]
- Jahami, A.; Khatib, J.; Baalbaki, O.; Sonebi, M. Prediction of deflection in reinforced concrete beams containing plastic waste. Acad. J. Civ. Eng. 2019, 37, 551–555. [Google Scholar] [CrossRef]
- Jahami, A.; Khatib, J.; Bakri, A.; Alaina, R.; Lushnikova, N. Study of the Influence of Waste Plastic Straw Fibers on Concrete Properties. 2020. Available online: https://ssrn.com/abstract=3560342 (accessed on 3 January 2021).
- Khatib, J.; Shariff, S.; Negim, E.M. Effect of incorporating foamed glass on the flexural behaviour of reinforced concrete beams. World Appl. Sci. J. 2012, 19, 47–51. [Google Scholar]
- Cardinale, T.; D’Amato, M.; Sulla, R.; Cardinale, N. Mechanical and Physical Characterization of Papercrete as New Eco-Friendly Construction Material. Appl. Sci. 2021, 11, 1011. [Google Scholar] [CrossRef]
- Ferrándiz-Mas, V.; Bond, T.; García-Alcocel, E.; Cheesman, C.R. Lightweight mortars containing expanded polystyrene and paper sludge ash. Constr. Build. Mater. 2014, 61, 285–292. [Google Scholar] [CrossRef] [Green Version]
- Temsah, Y.; Jahami, A.; Khatib, J.; Sonebi, M. Numerical analysis of a reinforced concrete beam under blast loading. In MATEC Web of Conferences; EDP Sciences: Ulis, France, 2018; Volume 149, p. 02063. [Google Scholar] [CrossRef]
- Temsah, Y.; Jahami, A.; Khatib, J.; Sonebi, M. Numerical Derivation of Iso-Damaged Curve for a Reinforced Concrete Beam Subjected to Blast Loading. In MATEC Web of Conferences; EDP Sciences: Ulis, France, 2018; Volume 149, p. 02016. [Google Scholar] [CrossRef] [Green Version]
- Jahami, A.; Temasah, Y.; Khatib, J. The efficiency of using CFRP as a strengthening technique for reinforced concrete beams subjected to blast loading. Int. J. Adv. Struct. Eng. 2019, 11, 411–420. [Google Scholar] [CrossRef] [Green Version]
- Jahami, A.; Temsah, Y.; Khatib, J.; Baalbaki, O.; Darwiche, M.; Chaaban, S. Impact behavior of rehabilitated post-tensioned slabs previously damaged by impact loading. Mag. Civ. Eng. 2020, 93, 134–146. [Google Scholar] [CrossRef]
- BS EN 12350-6. Testing Fresh Concrete. Density; BSI: London, UK, 2009. [Google Scholar]
- BS EN 12504-4. Testing Concrete. Determination of Ultrasonic Pulse Velocity; BSI: London, UK, 2004. [Google Scholar]
- BS EN 12390-3. Testing Hardened Concrete-Part 3: Compressive Strength of Test Specimens; BSI: London, UK, 2002. [Google Scholar]
- BS EN 12390-6. Testing Hardened Concrete-Part 6: Tensile Splitting Strength of Test Specimens; BSI: London, UK, 2009. [Google Scholar]
- BS EN 12390-13. Testing Hardened Concrete–Part 13: Determination of Secant Modulus of Elasticity in Compression; BSI: London, UK, 2013. [Google Scholar]
- Hibbitt, H.; Karlsson, B.; Sorensen, P. Abaqus Analysis User’s Manual Version 6.10. Dassault Systèmes Simulia Corp. Provid: Johnston, RI, USA, 2011. [Google Scholar]
- Lawson, I.; Danso, K.A.; Odoi, H.C.; Adjei, C.A.; Quashie, F.K.; Mumuni, I.I.; Ibrahim, I.S. Non-destructive evaluation of concrete using ultrasonic pulse velocity. Res. J. Appl. Sci. Eng. Technol. 2011, 3, 499–504. [Google Scholar]
- Yildirim, S. Research on Strength, Alkali-Silica Reaction and Abrasion Resistance of Concrete with Cathode Ray Tube Glass Sand. In Sustainable Buildings—Interaction Between a Holistic Conceptual Act and Materials Properties; IntechOpen: London, UK, 2018; pp. 131–150. [Google Scholar]
Figure 1.
(a) CRT glass before crushing and (b) after crushing.

Figure 2.
Concrete in molds.

Figure 3.
Details of the reinforced concrete beams: (a) longitudinal section (in mm); (b) cross-section; (c) DEMEC point locations.
Figure 3.
Details of the reinforced concrete beams: (a) longitudinal section (in mm); (b) cross-section; (c) DEMEC point locations.

Figure 4.
Mechanical strain gauge.

Figure 5.
Numerical model details: (a) Concrete beam details, (b) Steel reinforcement details.

Figure 6.
Load versus central deflection for beams with different CRT replacement levels.

Figure 7.
Load at first crack and ultimate load for all beams.

Figure 8.
Yield displacement for all beams.

Figure 9.
Strain distribution for all beams at (a) 8 kN (b) 16 kN (c) 24 kN and (d) 32 kN.

Figure 10.
Failure mode and crack propagation for beam (a) CRT-0, (b) CRT-10, (c) CRT-20, and (d) CRT-30.
Figure 10.
Failure mode and crack propagation for beam (a) CRT-0, (b) CRT-10, (c) CRT-20, and (d) CRT-30.

Figure 11.
Comparison of load–deflection curves between experimental and numerical for beam (a) CRT-0, (b) CRT-10, (c) CRT-20, and (d) CRT-30.
Figure 11.
Comparison of load–deflection curves between experimental and numerical for beam (a) CRT-0, (b) CRT-10, (c) CRT-20, and (d) CRT-30.

Figure 12.
Comparison of tensile damage of reinforced concrete beams obtained by experimental and numerical methods for (a) CRT-0, (b) CRT-10, (c) CRT-20, (d) CRT-30.
Figure 12.
Comparison of tensile damage of reinforced concrete beams obtained by experimental and numerical methods for (a) CRT-0, (b) CRT-10, (c) CRT-20, (d) CRT-30.


Table 1.
Details of concrete mixes.
| Mix Code | Quantities (Kg/m3) | ||||||
|---|---|---|---|---|---|---|---|
| OPC | Sand | CRT 1 | Gravel | Water | SP | W/C | |
| CRT-0 | 334 | 668 | 0 | 1336 | 173.68 | 5.34 | 0.52 |
| CRT-10 | 334 | 601 | 74.5 | 1336 | 173.68 | 4.34 | 0.52 |
| CRT-20 | 334 | 534 | 150 | 1336 | 173.68 | 3.34 | 0.52 |
| CRT-30 | 334 | 468 | 224 | 1336 | 173.68 | 2.34 | 0.52 |
1 Cathode-ray tube glass waste.
Table 2.
Default parameters for numerical modeling.
| Parameter | Symbol | Value |
|---|---|---|
| Poisson’s ratio | υ | 0.2 |
| Dilation angle (°) | ψ | 36 |
| Eccentricity | ɛ | 0.1 |
| Bi-axial to Uni-axial strength ratio | fb0/ft0 | 1.16 |
| Second stress invariant ratio | K | 0.67 |
| Viscosity parameter | μ | 0 |
Table 3.
Mechanical properties of concrete mixes at 28 days of curing.
| Mix | Density (Kg/m3) | UPV (m/s) and (% Error) | Compressive Strength (MPa) and (% Error) | Tensile Strength (MPa) | Modulus of Elasticity (MPa) |
|---|---|---|---|---|---|
| CRT-0 | 2465 | 4732 (±1.3%) | 31.4 (±10%) | 2.957 | 30,688 |
| CRT-10 | 2470 | 4854 (±3.4%) | 37.9 (±0.9%) | 3.263 | 34,331 |
| CRT-20 | 2484 | 4831 (±3.4%) | 34.2 (±5.0%) | 2.964 | 32,618 |
| CRT-30 | 2534 | 4751 (±0.2%) | 32.8 (±4.0%) | 2.926 | 31,444 |
Table 4.
Comparison between experimental and numerical results.
| Beam | Maximum Load (kN) | Maximum Deflection (mm) | ||||
|---|---|---|---|---|---|---|
| Experimental | Numerical | Error | Experimental | Numerical | Error | |
| CRT-0 | 40.2 | 42.4 | 5.5% | 14.2 | 14.2 | 0% |
| CRT-10 | 45.6 | 46.2 | 1.3% | 14.3 | 14.0 | 2.1% |
| CRT-20 | 42 | 42.3 | 0.7% | 16.1 | 15.8 | 1.9% |
| CRT-30 | 41 | 42.3 | 3.2% | 15 | 14.7 | 2% |
Publisher’s Note: MDPI stays neutral with regard to jurisdictional claims in published maps and institutional affiliations. |
© 2021 by the authors. Licensee MDPI, Basel, Switzerland. This article is an open access article distributed under the terms and conditions of the Creative Commons Attribution (CC BY) license (http://creativecommons.org/licenses/by/4.0/).
Share and Cite
MDPI and ACS Style
Bawab, J.; Khatib, J.; Jahami, A.; Elkordi, A.; Ghorbel, E. Structural Performance of Reinforced Concrete Beams Incorporating Cathode-Ray Tube (CRT) Glass Waste. Buildings 2021, 11, 67. https://doi.org/10.3390/buildings11020067
AMA Style
Bawab J, Khatib J, Jahami A, Elkordi A, Ghorbel E. Structural Performance of Reinforced Concrete Beams Incorporating Cathode-Ray Tube (CRT) Glass Waste. Buildings. 2021; 11(2):67. https://doi.org/10.3390/buildings11020067
Chicago/Turabian StyleBawab, Jad, Jamal Khatib, Ali Jahami, Adel Elkordi, and Elhem Ghorbel. 2021. "Structural Performance of Reinforced Concrete Beams Incorporating Cathode-Ray Tube (CRT) Glass Waste" Buildings 11, no. 2: 67. https://doi.org/10.3390/buildings11020067
Note that from the first issue of 2016, this journal uses article numbers instead of page numbers. See further details here.