Green Roofs and Greenpass

1
Institute of Soil-Bioengineering and Landscape Construction, Department of Civil Engineering and Natural Hazards, University of Natural Resources and Life Sciences, 1190 Vienna, Austria
2
GREENPASS GmbH, 1070 Vienna, Austria
*
Author to whom correspondence should be addressed.
Buildings 2019, 9(9), 205; https://doi.org/10.3390/buildings9090205
Submission received: 2 July 2019
/
Revised: 20 August 2019
/
Accepted: 10 September 2019
/
Published: 14 September 2019
(This article belongs to the Special Issue Quantification of Green Roof Benefits and the Implementation into Urban Politics)
Abstract
:The United Nations have identified climate change as the greatest threat to human life. As current research shows, urban areas are more vulnerable to climate change than rural areas. Numerous people are affected by climate change in their daily life, health and well-being. The need to react is undisputed and has led to numerous guidelines and directives for urban climate adaptation. Plants are commonly mentioned and recommended as one key to urban climate adaptation. Due to shading of open space and building surfaces, as well as evapotranspiration, plants reduce the energy load on the urban fabric and increase thermal comfort and climate resilience amongst many other ecosystem services. Plants, therefore, are described as green infrastructure (GI), because of the beneficial effects they provide. Extensive green roofs are often discussed regarding their impact on thermal comfort for pedestrians and physical properties of buildings. By means of Stadslab2050 project Elief Playhouse in Antwerp, Belgium, a single-story building in the courtyard of a perimeter block, the effects of different extensive green roof designs (A and B) on the microclimate, human comfort at ground and roof level, as well as building physics are analyzed and compared to the actual roofing (bitumen membrane) as the Status Quo variant. For the analyses and evaluation of the different designs the innovative Green Performance Assessment System (GREENPASS®) method has been chosen. The planning tool combines spatial and volumetric analyses with complex 3D microclimate simulations to calculate key performance indicators such as thermal comfort score, thermal storage score, thermal load score, run-off and carbon sequestration. Complementary maps and graphs are compiled. Overall, the chosen method allows to understand, compare and optimize project designs and performance. The results for the Elief Playhouse show that the implementation of green roofs serves a slight contribution to the urban energy balance but a huge impact on the building and humans. Variant B with entire greening performs better in all considered indicators, than the less greened design Variant A and the actual Status Quo. Variant B will probably bring a greater cost/benefit than Variant A and is thus recommended.
1. Introduction
The United Nations recently published a list of the main threats and challenges to human life [1]. Climate change is ranked on top of that list together with destruction of the environment, as the largest threats to human life.
Current research shows clearly, that urban areas are more vulnerable to climate change than rural areas [2,3,4]. A recent publication from Bastin et al. [5] illustrates the impacts of climate change on large cities using city analogies. For 77% of all global large cities a climatic analogy could be found, comparing their respective climate in 2050 to that of large cities today. For example, they predict that London will have climatic conditions in 2050 comparable to Barcelona today. This dramatic and impressive comparison highlights the urgency and relevance of measures to adapt urban areas to climate change. Especially, when considering that more than 50% of humanity already lives in cities worldwide and even more than 70% in Europe. According to the United Nations report the number of citizens is increasing rapidly [6]. All these people are and will be even more affected by the impacts of climate change on their city in their daily life, health and well-being. The socioeconomic consequences have been investigated by several research projects and summarized in a publication of the European Union. This paper states that heat waves are responsible for more than 60% of deaths caused by natural hazards in Europe [7].
As a consequence, research efforts from different fields of science have been increased to improve climate resilience and thermal comfort for urbanites. A special focus is laid on the building sector, which is responsible for 40% of energy consumption in Europe. The European Union passed an explicit directive to foster a change in building quality and energy demand [8]. New construction technologies and materials shall help to reduce energy demand for heating and cooling [9,10].
Amongst others, green infrastructures (GI) or nature-based solutions (NbS) are mentioned as a promising measure to improve climate resilience of urban areas and at the same time enhance biodiversity and quality of life for people [2]. Until now, a growing number of guidelines have been published on international, national and local levels [3,11,12,13,14,15,16,17] to promote the application of GI and improve climate resilience of urban areas.
Green roofs represent one out of many GI typologies. Throughout Europe, green roofs are a widely applied technology that is defined and described in directives and standards [18,19,20]. The Austrian standard, for example, distinguishes four types of green roofs: reduced extensive green roofs, extensive green roofs, reduced intensive green roofs and intensive green roofs. The different typologies are characterized mainly by the construction height. So called extensive green roofs are the predominant type of installed green roofs. They have a typical height of construction of 8 to 15 cm and are habitat for succulents, grasses and herbs (in this paper, the effects of such a green roof are analyzed). Frequently, green roofs are described as an element in the realm of sponge city and urban water management [18,21,22,23,24]. The run-off coefficient of green roofs is described in different standards and regulations [19,20] with regard to the construction type of the green roof. The Austrian standard [20] demands a minimum run-off coefficient of 0.3 for extensive green roofs, to give an example. While contribution to water management is broadly accepted, the effects on urban micro- and mesoclimate [25] are still discussed. In recent years the number of published papers focusing on effects derived by green roofs raised significantly [26]. Many studies relate to climatic as well as buildings’ physical effects on the thermal comfort of pedestrians. For instance, Peng and Jim [27] and Zhang et al. [28] published their work regarding effects of green roofs on the thermal comfort at the pedestrian level. Both papers found a reduction of air temperature at the pedestrian level of around 0.1 to 0.3 °C. Köhler and Kaiser [29] present evidence that green roofs contribute to mitigation of climate change. But other authors did not find relevant effects on thermal comfort [30,31].
The effects of green roofs on the insulation properties of the building envelope are noticed by many papers [18,32,33,34,35]. Also, positive effects on the microclimate have been investigated and published [27,32,36,37,38,39,40], very often linked to the green roof typology, e.g., an extensive green roof. Recently, a long-term investigation of an extensive green roof has been published that shows a minor but clear impact on the microclimate [41]. Some authors conclude that there are only minor effects on the thermal comfort of pedestrians [29,31], while others present relevant improvements [27,28,42].
In contrast to other GI typologies, green roofs do not compete with open space usages such as mobility but with technologies as photovoltaic or white roofs. The latter have been promoted by cities [43] for years to reflect solar radiation. While the actual effects of white roofs are still under discussion within the scientific community, the increase of reflectance of urban materials appears to be commonly accepted as meaningful [44].
Many mentioned papers used simulations software to investigate the effects of green roofs on climate and building physics. Presented findings are limited to average air and surface temperature or physiological equivalent temperature indices.
This paper presents a new method that aims on the application by practitioners within a typical planning process. The method has been developed towards the need to integrate the climate-resilience issue in urban development and architectural processes and to generate specific statements regarding urban heat and the quality of different designs in urban microclimate context. It is capable to include GI designs in planning processes and allows to evaluate, compare and optimize their positive effects using key performance indicators, diagrams and maps. The chosen method is called the Green Performance Assessment System (GREENPASS®). By means of a project in Belgium, not only the effects of different green roof designs on the urban energy balance, human comfort and the building are analyzed compared to the actual Status Quo, but also the method itself has been evaluated towards applicability.
2. Materials and Methods
This section presents the applied method and limitations and gives comprehensive information regarding the selected case study and green roof project in Antwerp, Belgium.
2.1. GREENPASS® Method
GREENPASS® is the worldwide first software as a service solution (SaaS) for climate-resilient and resource-efficient urban planning and architecture, addressing up to six urban challenges: climate, water, air, energy, biodiversity and cost. It has been developed in the last 9 years in course of international research and design projects with more than €4 million in total funding [45]. To allow considering the effects of GI as green roofs in urban planning or architectural design processes regarding the named six urban challenges, the method of simulation has been chosen and combined with transparent and standardized processes with respect to the planning phase of a project. The standardized GREENPASS® method uses ENVI-met® microclimate simulation [46,47] for microclimatic input data within the planning, evaluation and optimization process. All physical calculations are based on outdoor field test validation and numerous scientific publications [48].
The evaluation method is standardized focusing on impact analysis for summer, which is probably the most affected period in urban areas by climate change and further, of most interest in terms of open space usage due to the frequency and possibility for usage by people. Thus, the method is limited in its standardized set-up to impact results for the summer period only. By available resources, additional diurnal analysis for seasonal (spring, autumn or winter) or a yearly period can be chosen as an extension by the application of the method. At same time, this tends to exceed monetary and temporal resources in planning processes by considering long-term analysis, as long as interaction of simulation software and availability of computational power for needed computation processes is technically restricted and not efficiently suitable for sophisticated and state-of-the-art simulation techniques and planning processes.
2.1.1. Toolbox
An international review of planning processes [49] revealed that worldwide planning processes basically follow a standardized pattern starting with preliminary design, followed by concept design and detailed design. To every phase of the planning process different resources (personnel, time and budget) are allocated. The toolbox accounts for that and provides tailored services for every phase, as described above, in accordance with the given resources [50].
- Assessment for preliminary design phase (01): low level of planning detail, results (five key performance indicators (KPIs)) produced based on machine learning engine, time of service: 3 h per project design;
- Pre-certification for concept design phase (02): low level of planning detail, results (12 KPIs, 3 urban challenges) produced based on simplified simulation and assessment process, time of service from 2 days per project design;
- Certification for detailed design phase (03): high level of planning detail, iterative optimization based on complex simulation and assessment processes (27 KPIs, six urban challenges), time of service depending on project progress.
For the selected case study, the pre-certification (02) has been chosen for application.
2.1.2. GREENPASS® Pre-Certification
The presented project results were elaborated following the GREENPASS® pre-certification process (02) [51] that includes in total 12 key performance scores (KPSs) and indicators (KPIs) and addresses five urban challenges—climate, water, air, energy and biodiversity:
- TLS—Thermal Load Score: temperature difference of in and out streaming air body;
- TCS—Thermal Comfort Score: numerical rating of thermal comfort areas;
- TSS—Thermal Storage Score: heat energy storage in materials within project area;
- ROF—Run-Off Score: proportion of retained rainwater to project area;
- CSS—Carbon Sequestration Score: storage of CO2 by green infrastructure in project area;
- PET—Physiological Equivalent Temperature: maps of PET at 15:00, 22:00 and 04:00;
- RAD—Radiation: sum of shortwave radiation coming into project area;
- ALB—Albedo: average albedo of the project area;
- EVA—Evapotranspiration: evaporation of soil and transpiration of plants;
- SAF—Shading Area Factor: ratio of shaded area;
- LA—Leaf Area: sum of total leaf area;
- WF—Wind Flow Map: direction and velocity of wind at 15:00.
The aim of the project was to compare different green roof designs on a building with the status quo (SQ) situation regarding the set of KPSs and KPIs. The following variants are distinguished:
- Variant Status Quo (SQ): existing building and material situation;
- Variant A: extensive green roof design;
- Variant B: extensive green roof design.
For this paper the following extracted KPSs and KPIs were selected to illustrate the difference between the three variants:
- AT—air temperature at 15:00 and 04:00 at ground (1.5 m) and roof level (2.7 m);
- PET—at 15:00 and 04:00 at ground (1.5 m) and roof level (2.7 m);
- IAT—Indoor Air Temperature: hourly day profile;
- EFB—Energy Flux of Building: hourly day profile;
- TLS—Thermal Load Score: temperature difference of in- and out-streaming air bodies;
- TCS—Thermal Comfort Score: numerical rating of thermal comforts;
- TSS—Thermal Storage Score: heat energy storage in project area;
- ROF—Run-Off Score: proportion of retained rainwater to project area;
- CSS—Carbon Sequestration Score: storage of CO2 by green infrastructure in project area.
Based on the AT and PET maps, additional difference maps were elaborated to show the direct difference of the variants. The indicators were calculated by algorithms out of the simulation results and are linked to a multiparametric area analysis regarding land use categorization. The overall results of the applied method were finally documented in an easily understandable and illustrative report for decision-making.
2.1.3. GREENPASS® Editor
By the use of the chosen method, the presented project was edited using the GREENPASS® Editor, an independent GIS-based software and the crucial interface between scientific world of microclimate simulation and practical planning world. Common planning data, like CAD (.dxf) or GIS (.shp) formats, can be imported to the software in a straight and easy way. The planning project can then be edited within the software, e.g. assigning materials from a comprehensive database (linked with ENVI-met®) to project elements, adding green infrastructures etc. The software finally automatically transforms the modelled data to a digital simulation model in ENVI-met® compatible data file format (.inx) [52].
2.2. Case Study—Elief Playhouse Antwerp
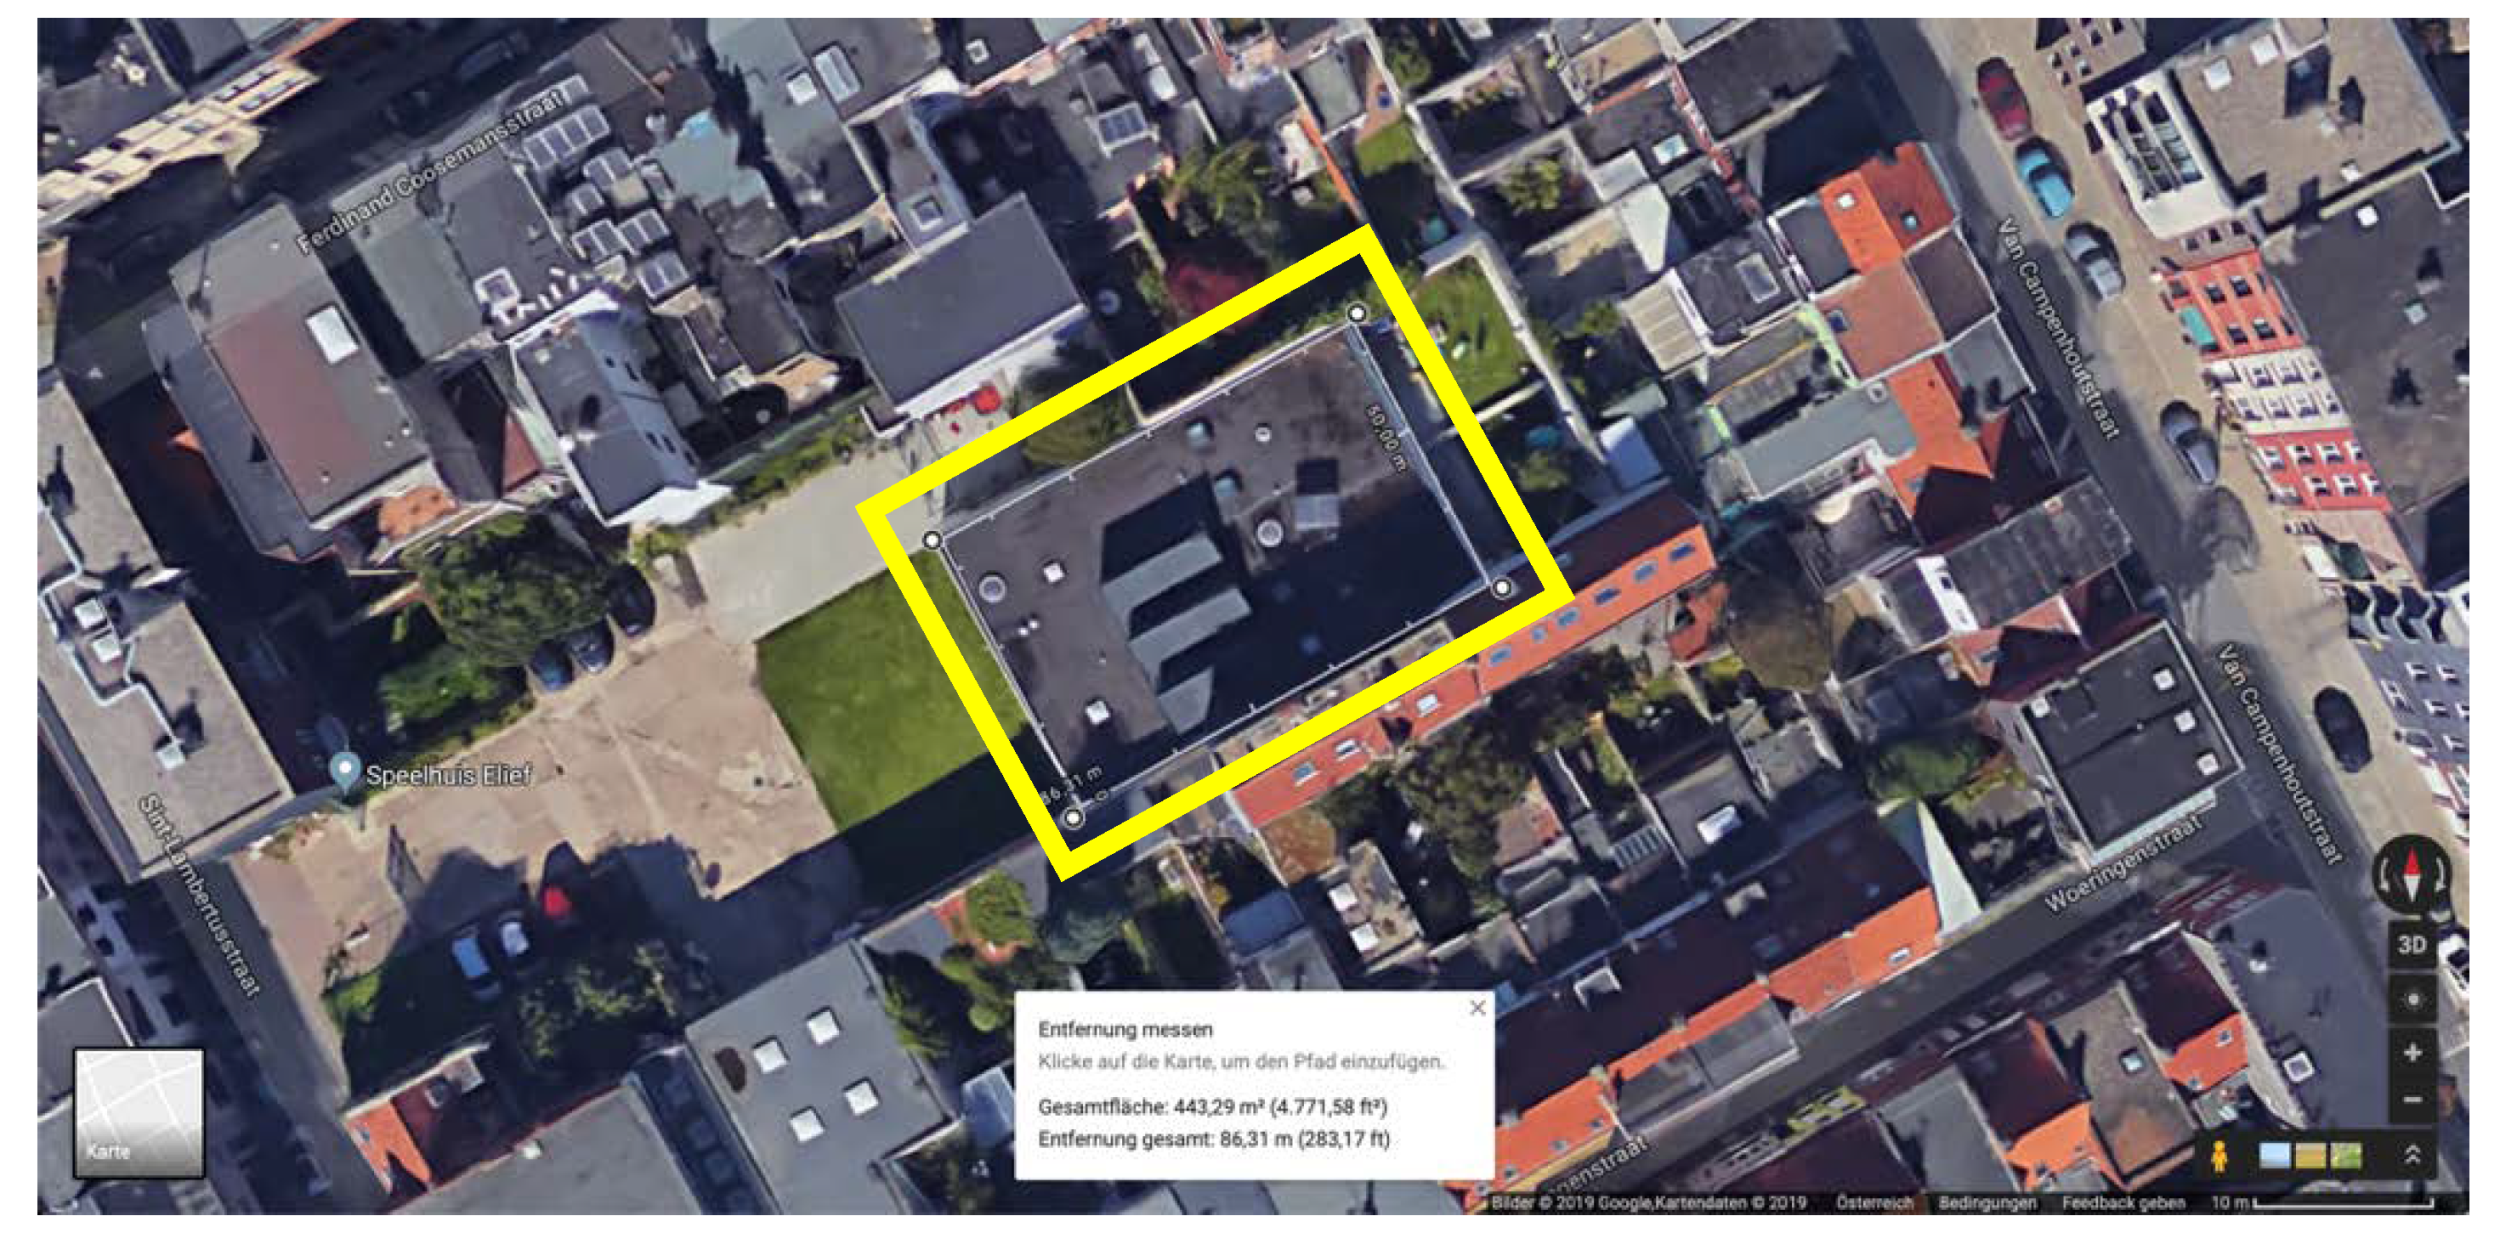
For this paper, the Elief Playhouse Antwerp (Speelhuis Elief) has been chosen as a case study project. Elief Playhouse is a daycare facility for children with an approximately 440 m2 large one-floor building in the district Berchem in the southwest of Antwerp/Belgium.
The project is one out of four selected roofs in the frame of the Stadslab2050 initiative of the city of Antwerp, which serves as an urban laboratory to accelerate a sustainable urban development and climate adaptation in Antwerp [53]. The roofs will become greened with climate-robust green roof installations in different variations. The Elief Playhouse is located in a courtyard within a perimeter block, surrounded by low buildings with up to three floors (Figure 1). The courtyard is shaped by a large-scale sealed area and a lawn adjacent to the building. The old building has a flat bitumen roof with several light domes and 3 additional angled roof structures.
For the roof, two different greening scenarios were designed by an international expert for green infrastructure and green roofs:
- Variant A;
- Variant B.
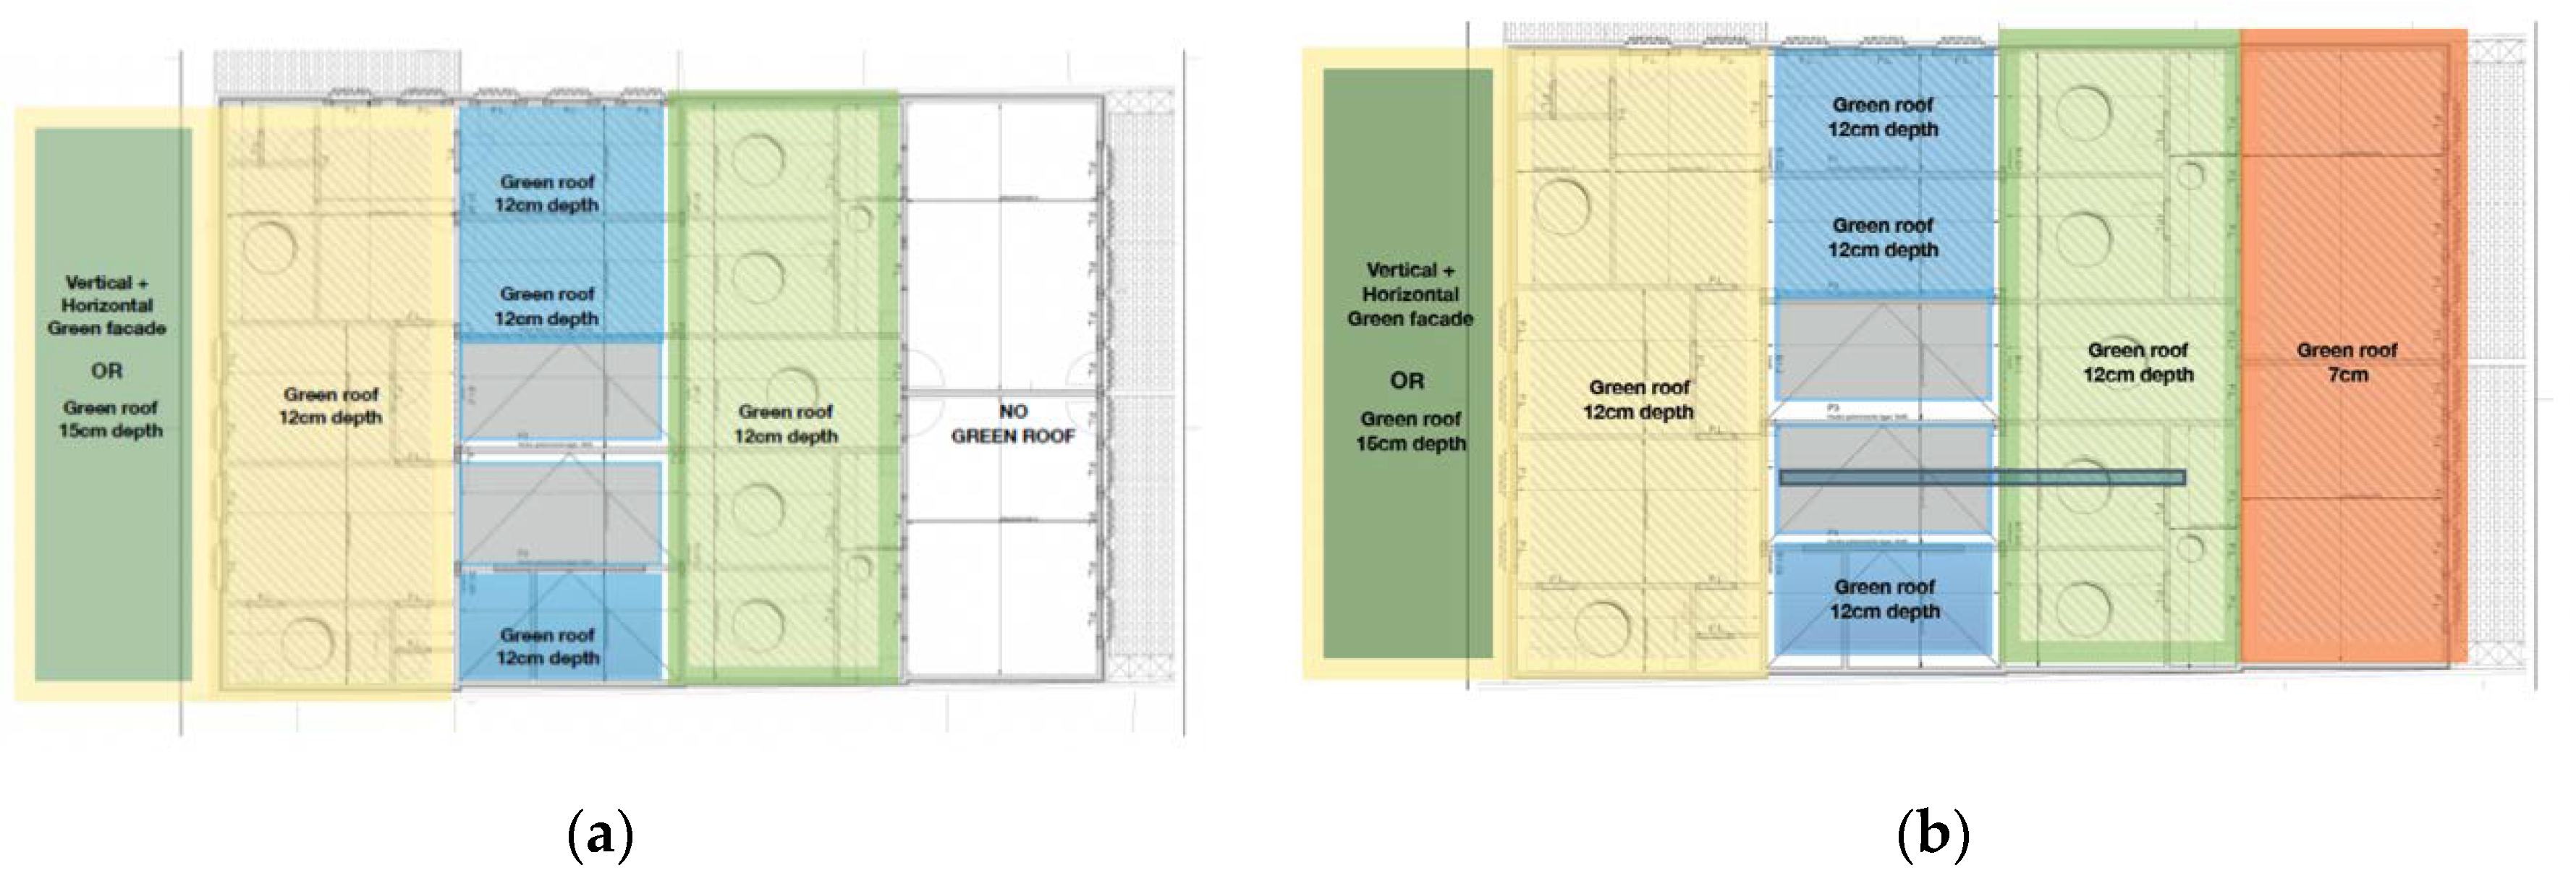
Both scenarios were composed of extensive green roofs with different planting zones adapted to the limited roof load capacity. The roof of Variant A was greened approximately 75%, while Variant B was fully greened. The green roof construction heights varied from 7 to 15 cm with respect to the load capacity of the roof. The green roofs could be assigned as extensive green roofs with diverse modelling heights for different habitats to promote biodiversity (Figure 2).
The roof construction was built of a two-layer concrete with a thickness of 25 cm in total with average thermal conductivity of 1.3 W/(m K), a density of 1840 kg/m3 and specific heat of 920 J/(kg K). It was covered with an 8 mm layer of bitumen membrane with a specific heat of 1255 J/(kg K) and a thermal conductivity of 0.032 W/(m K).
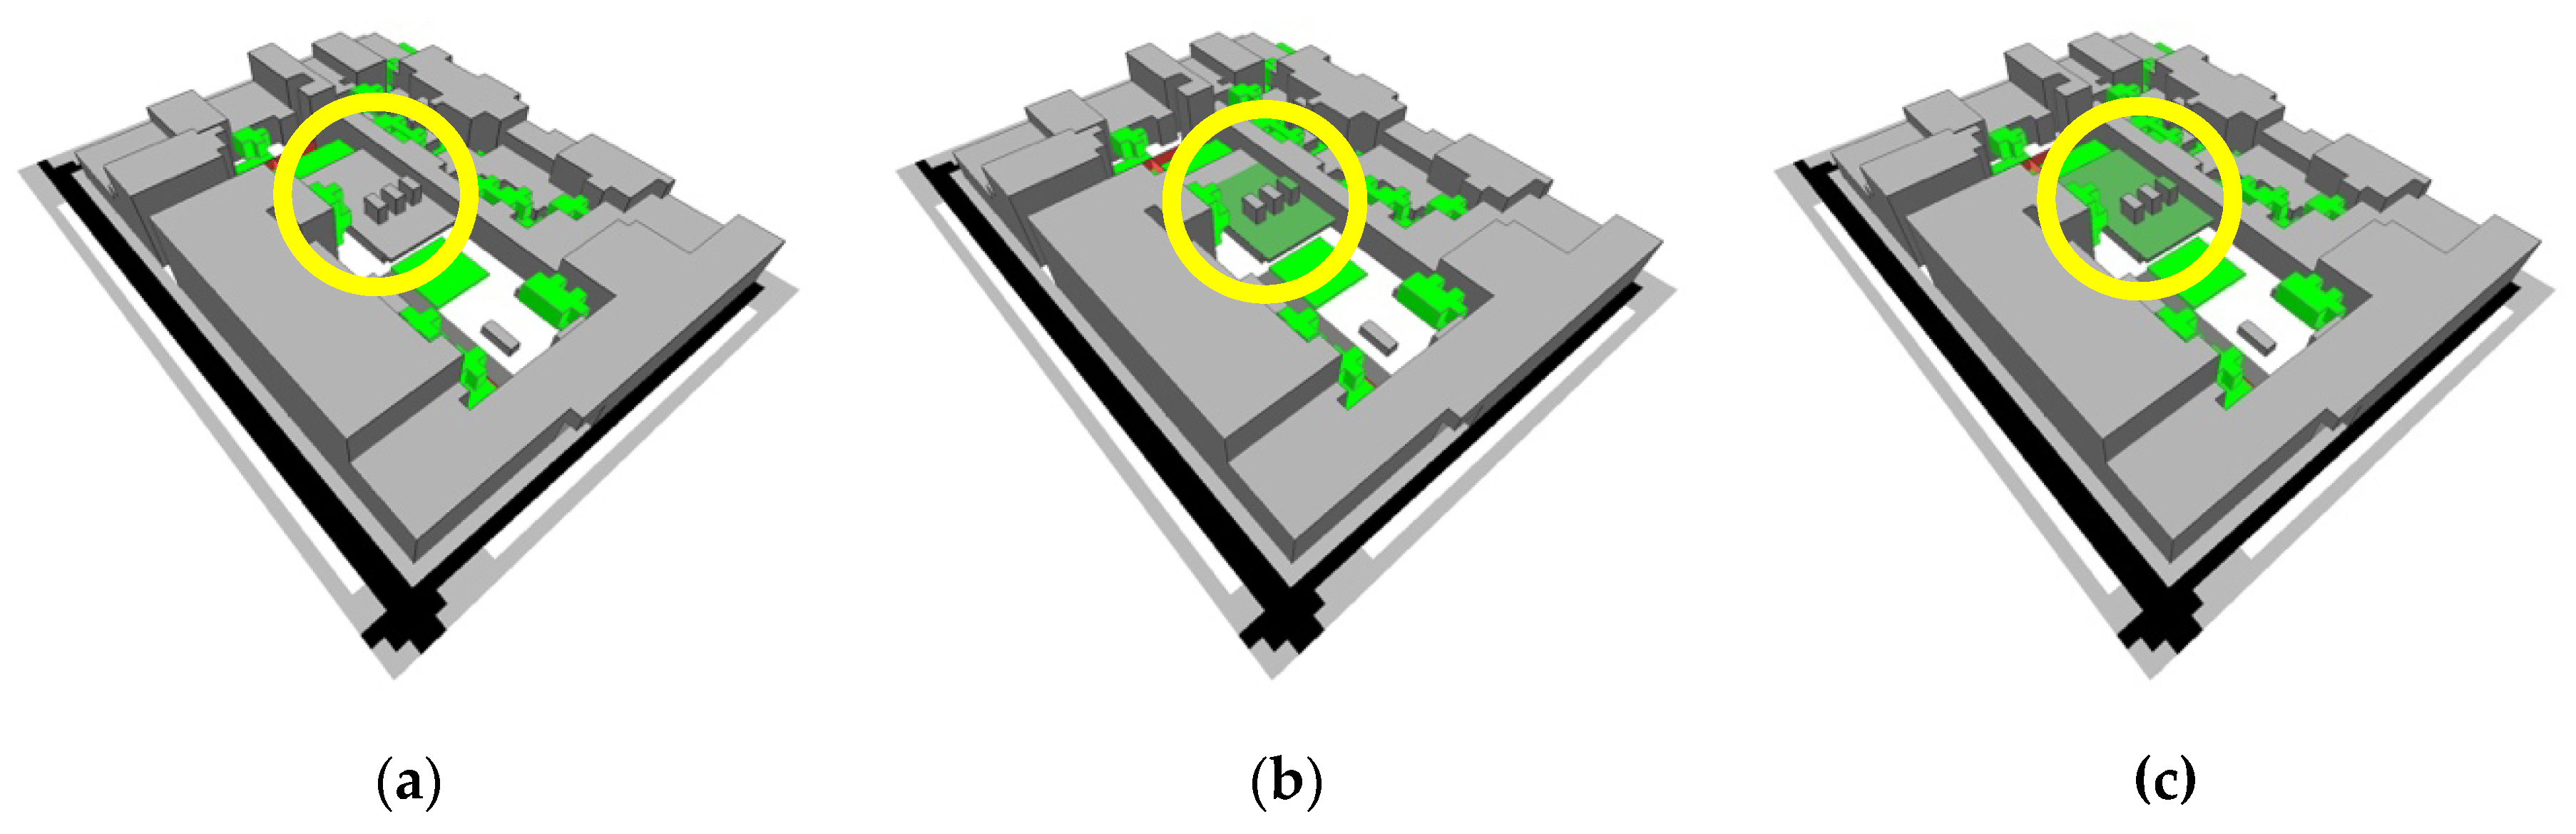
Figure 3 shows the generated digital ENVI-met® simulation models for the different scenarios for Elief Playhouse Antwerp, out of the GREENPASS® Editor. The difference of the three models is limited to the green roof area of the playhouse (see yellow circles in Figure 3).
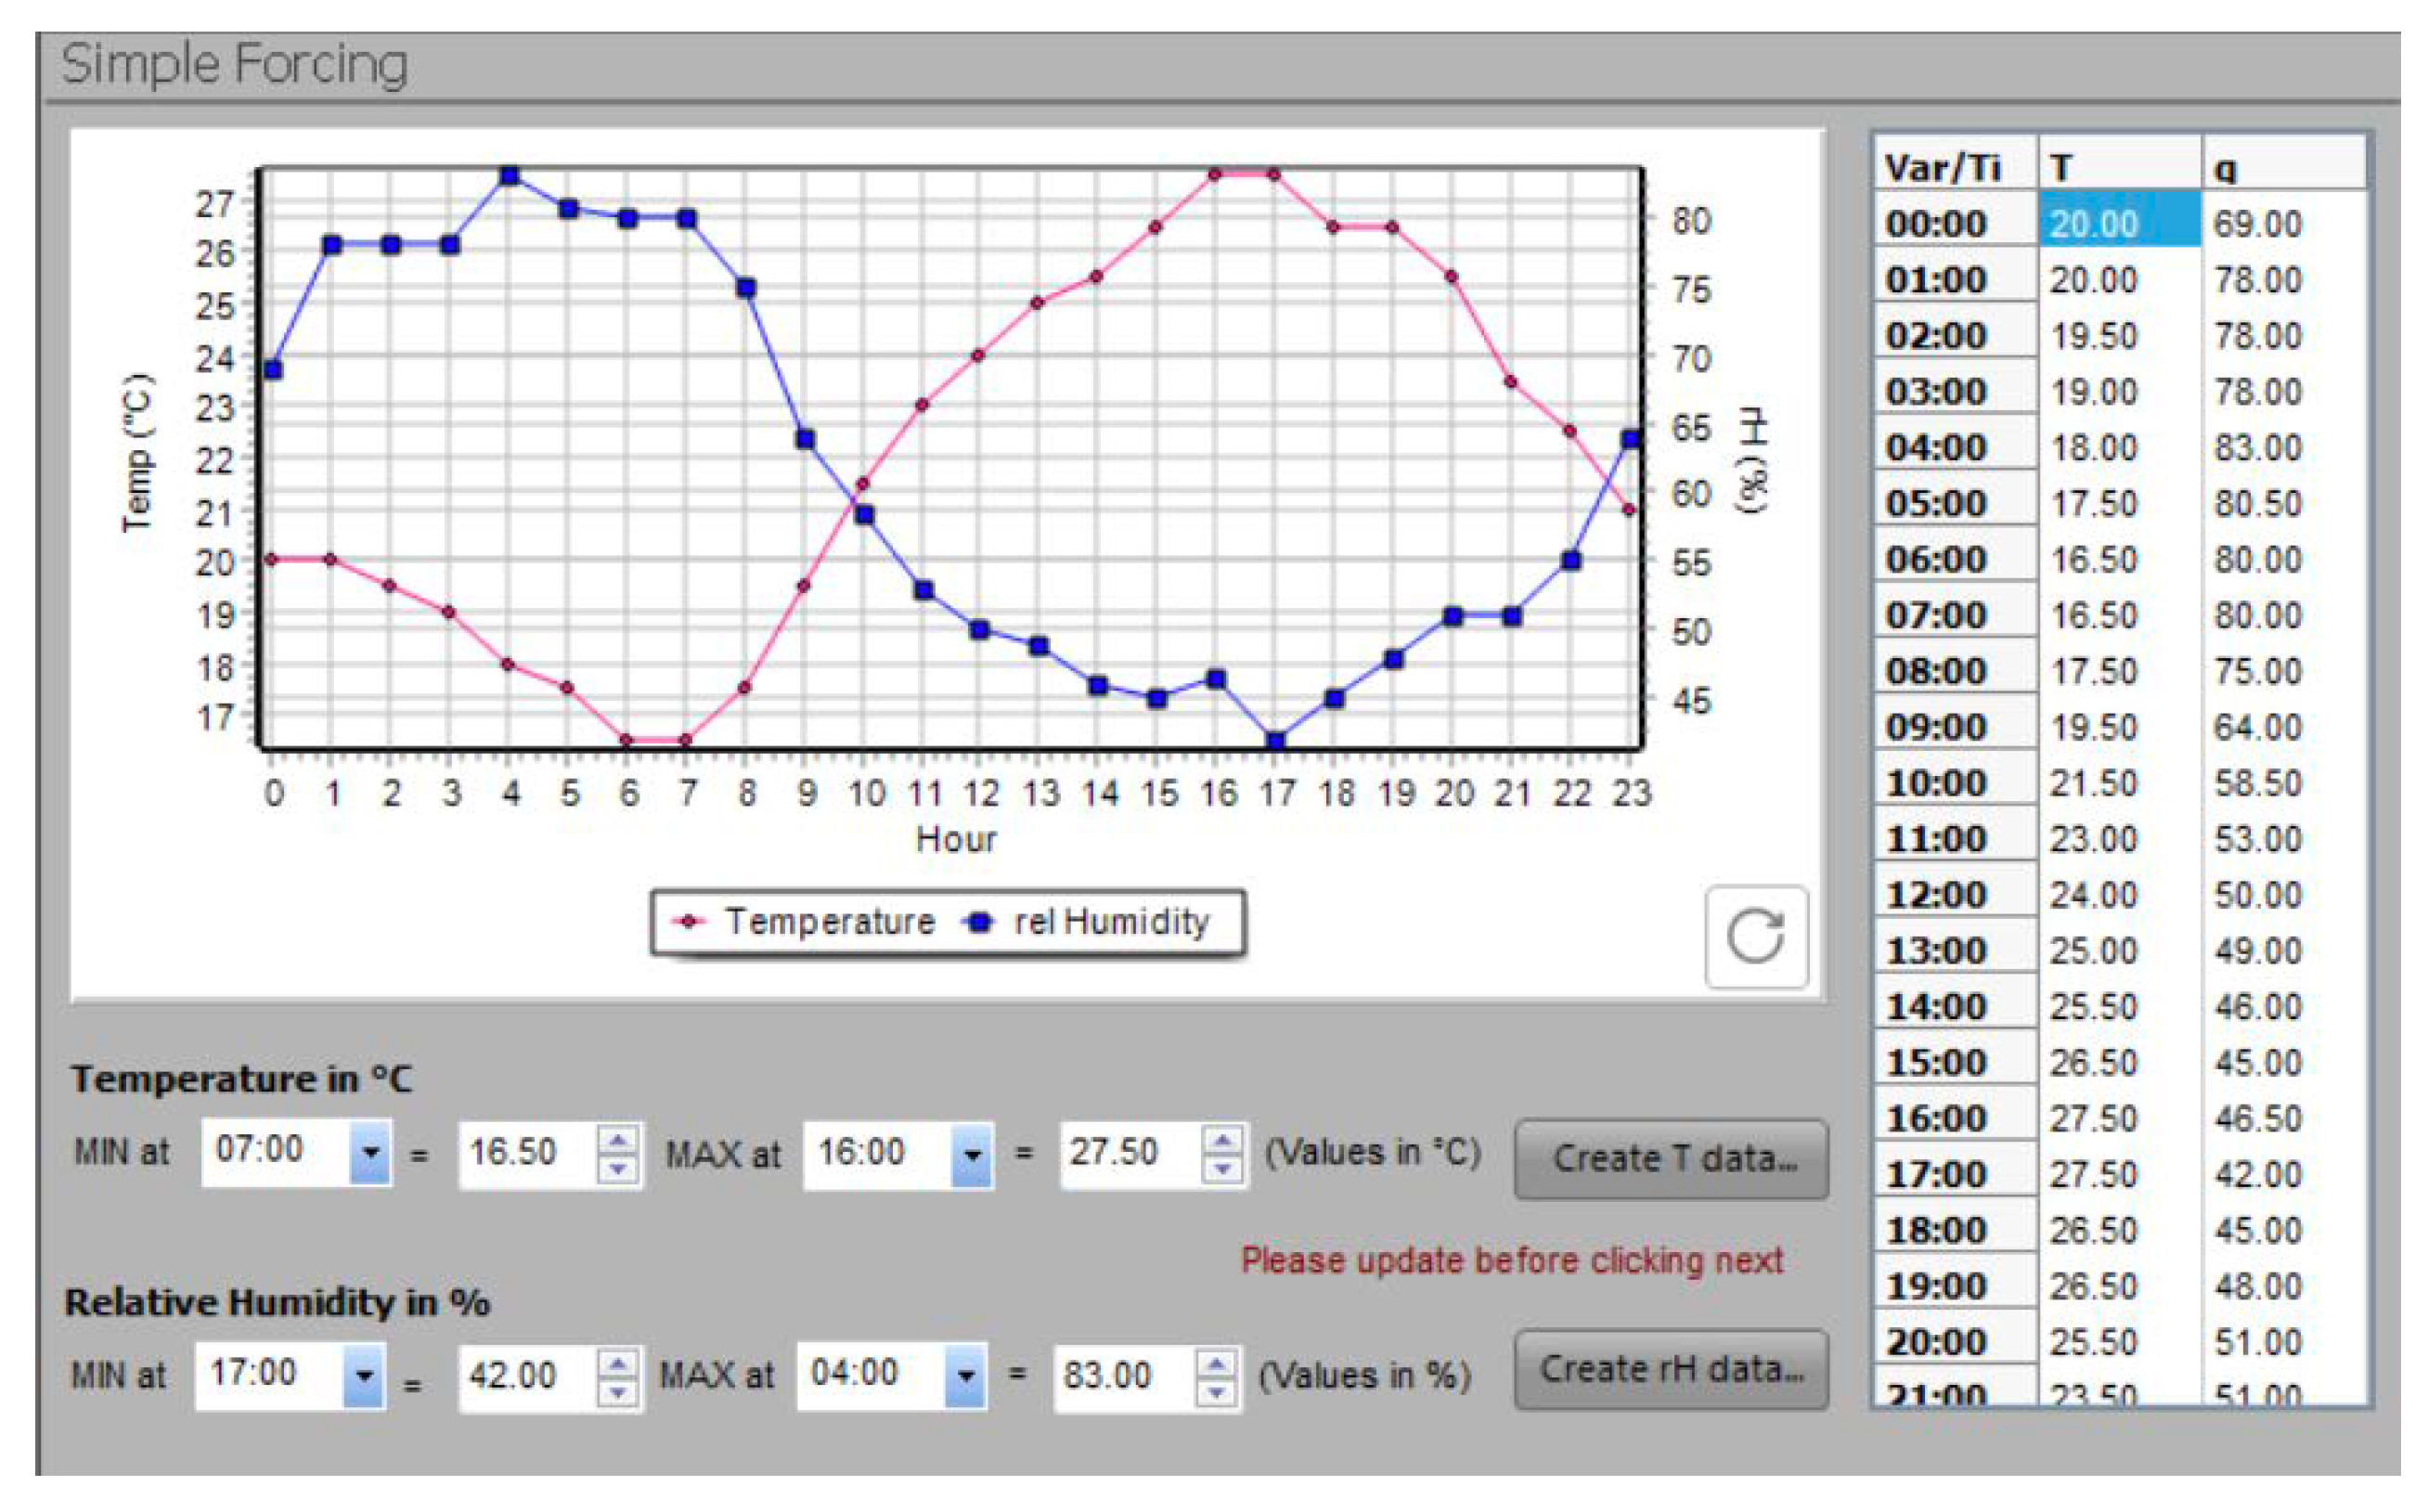
The input data for the ENVI-met® microclimate simulation was taken according to GREENPASS® standardized process for an idealized hot summer day (21.07). The method was standardized focusing on impacts in summer, to generate results and allow statements regarding urban heat topic. Therefore, weather data from rp5.ru have been taken for the station Antwerp Deurne Airport METAR for the month July in the period 2013–2018 [54]. The 80th percentiles for the period 11–31 July (only days with no precipitation) were extracted out from the data. The idealized day had a maximum air temperature of 27.5 °C (Figure 4) and wind speed of 5 m/s at 10 m over ground [54] with SW inflow (based on main wind direction coming from windfinder.com data [55] for Antwerp Deurne Airport station).
3. Results—Case Study Elief Playhouse Antwerp
The project evaluated the benefits of green roofs compared to standard roofing based on the example of a playhouse in Antwerp, Belgium. Therefore, the status quo situation was evaluated together with the two planning variants (A and B). The design variants were compared regarding several KPSs and KPIs for an idealized and typical hot summer day.
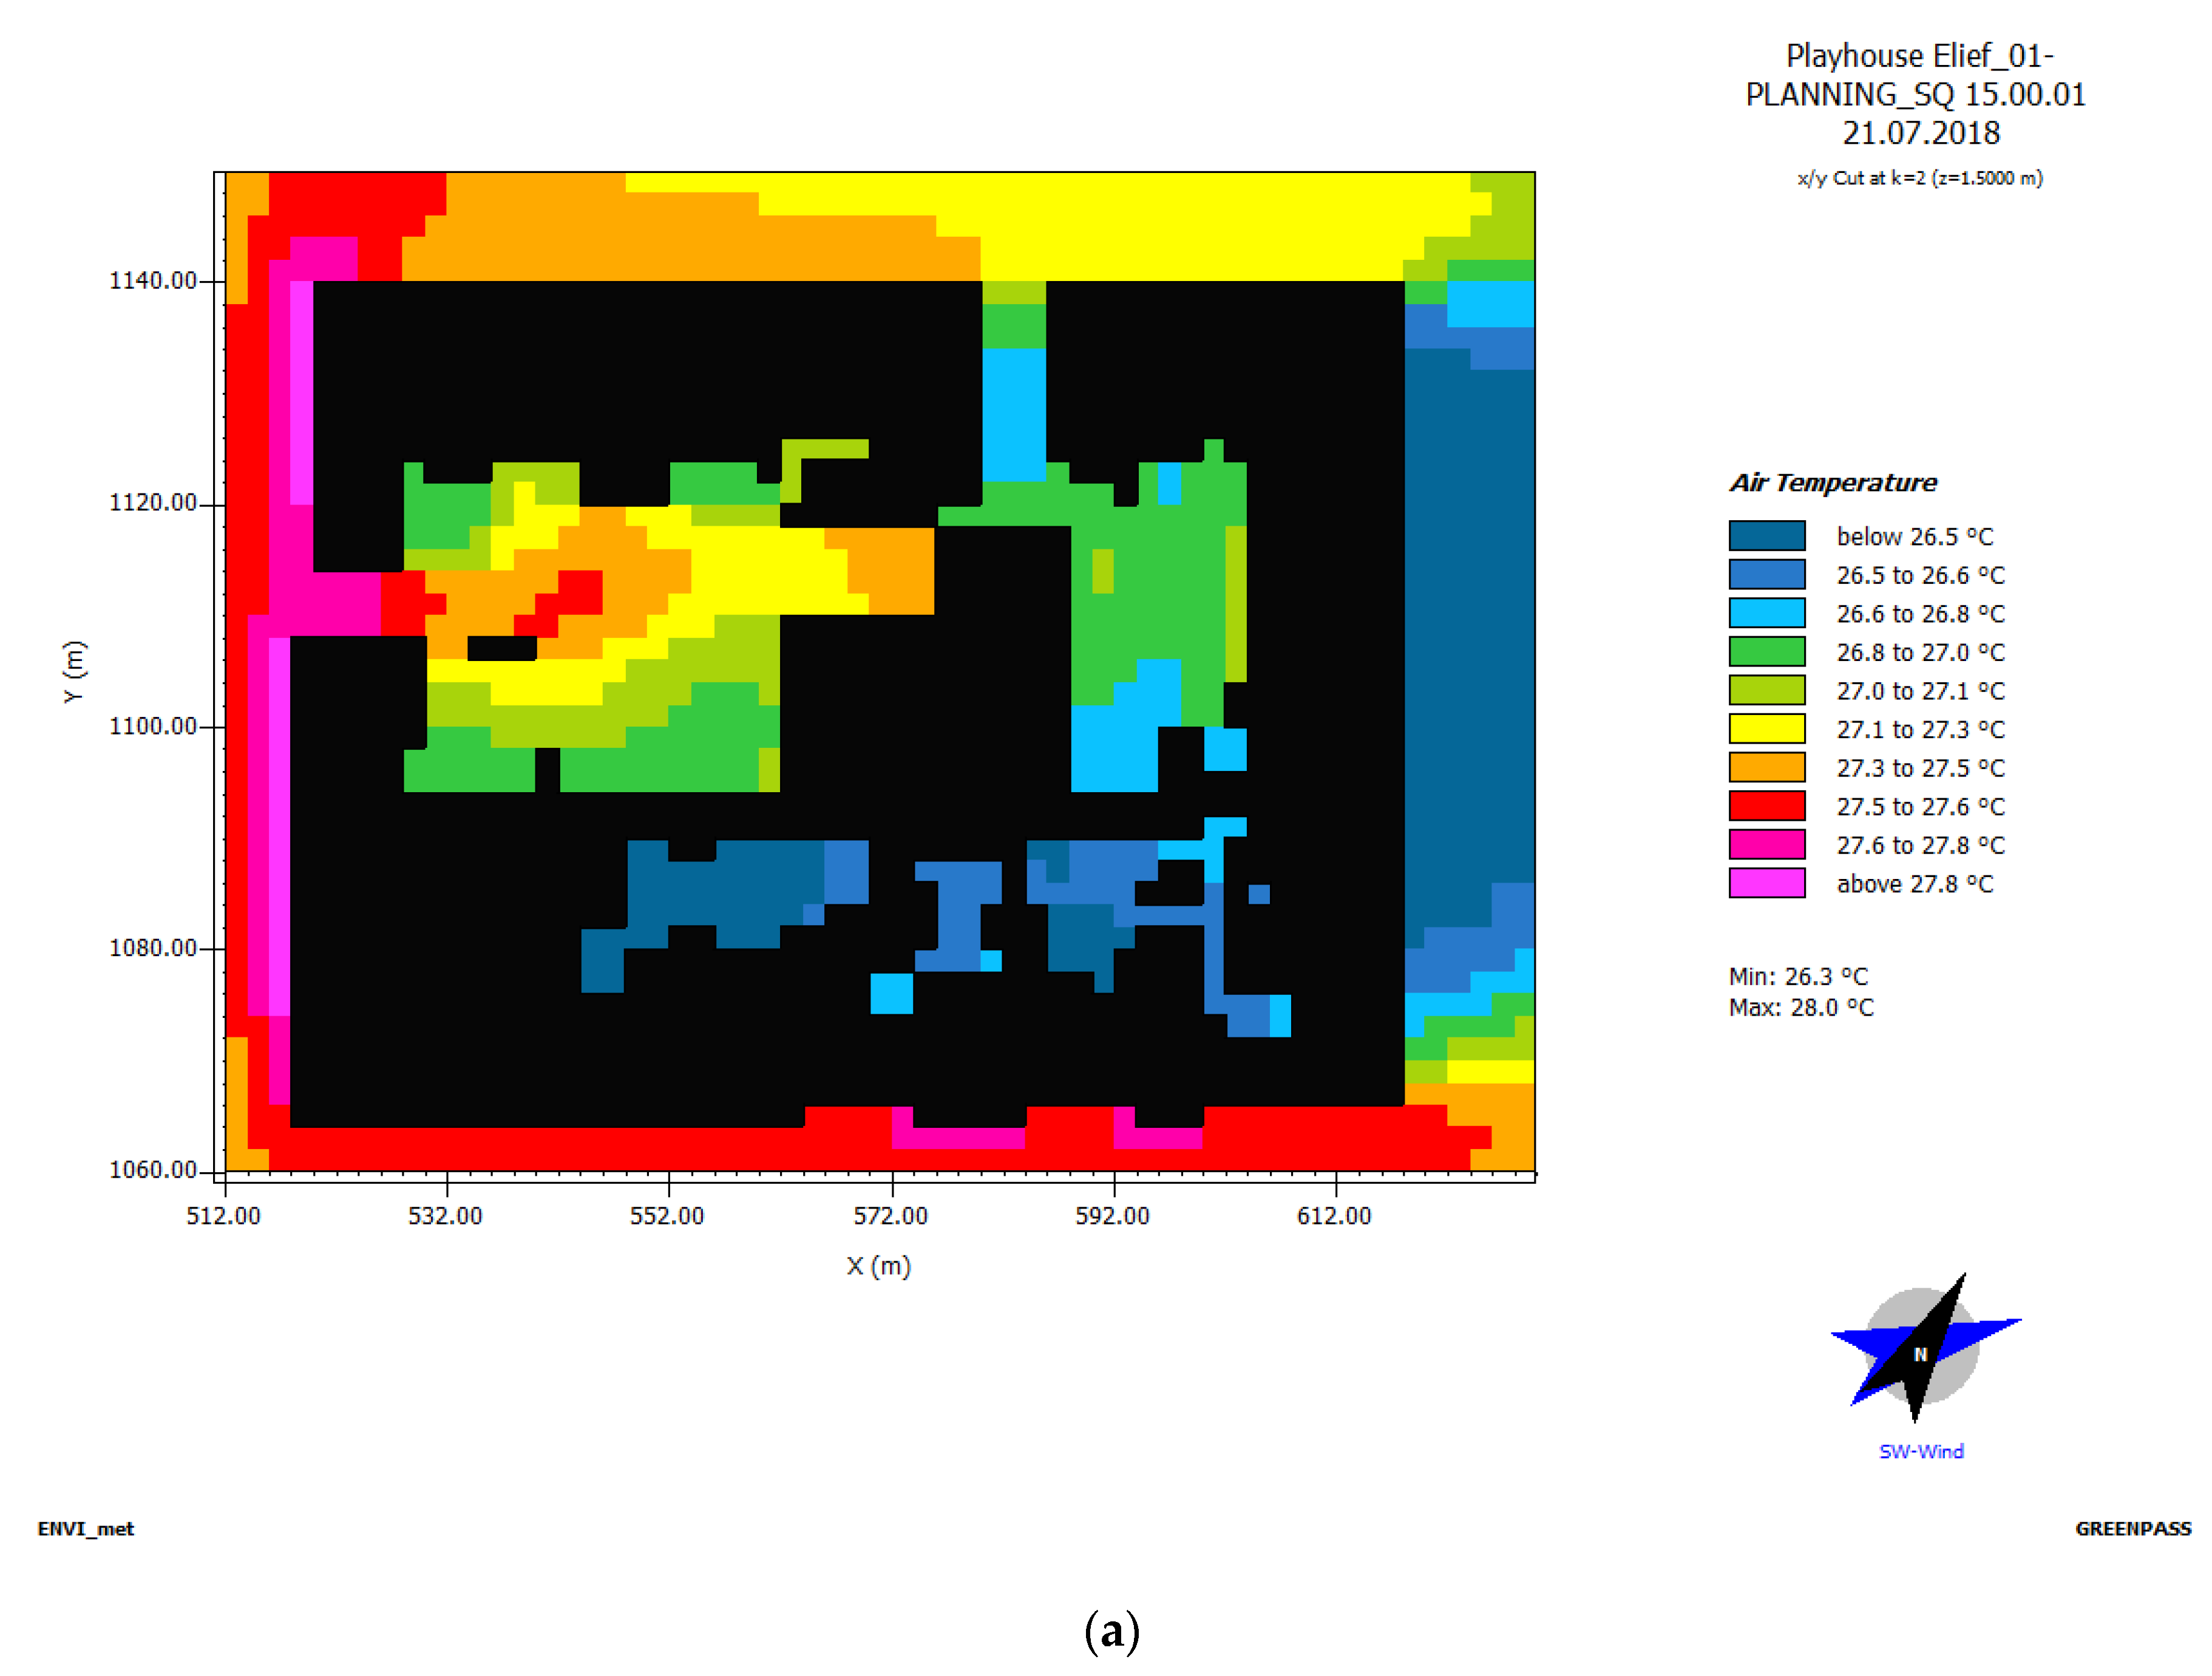
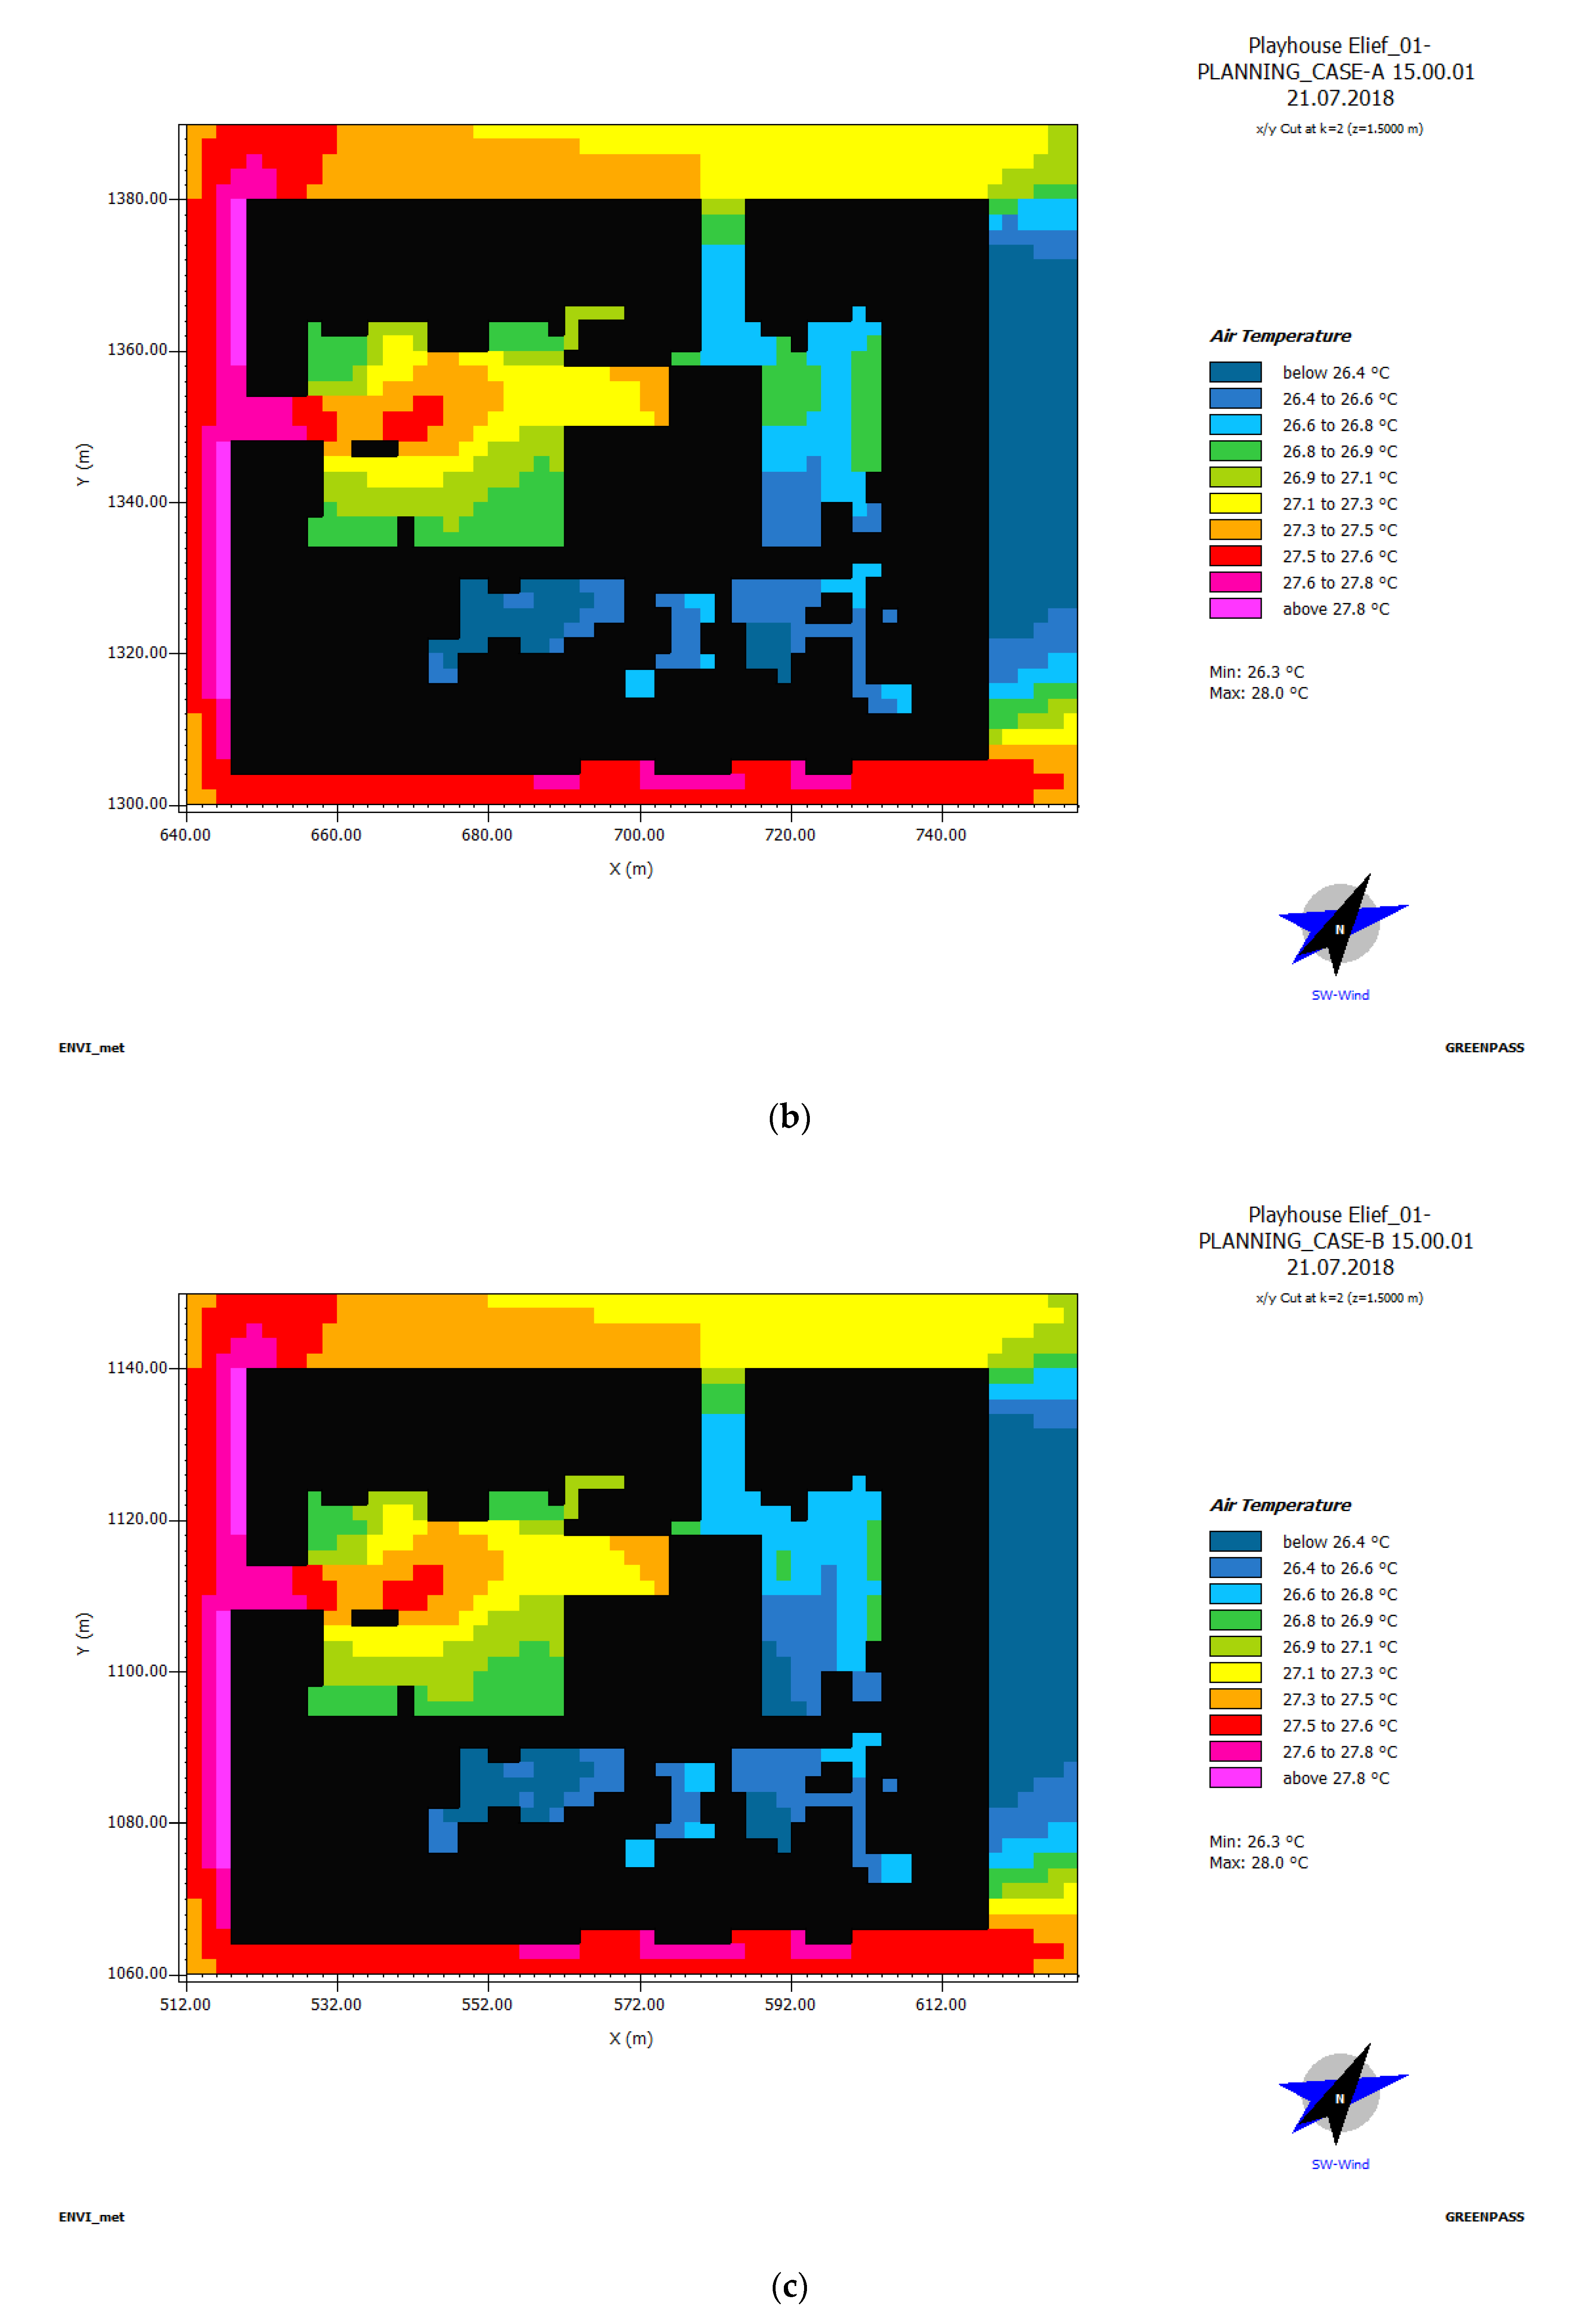
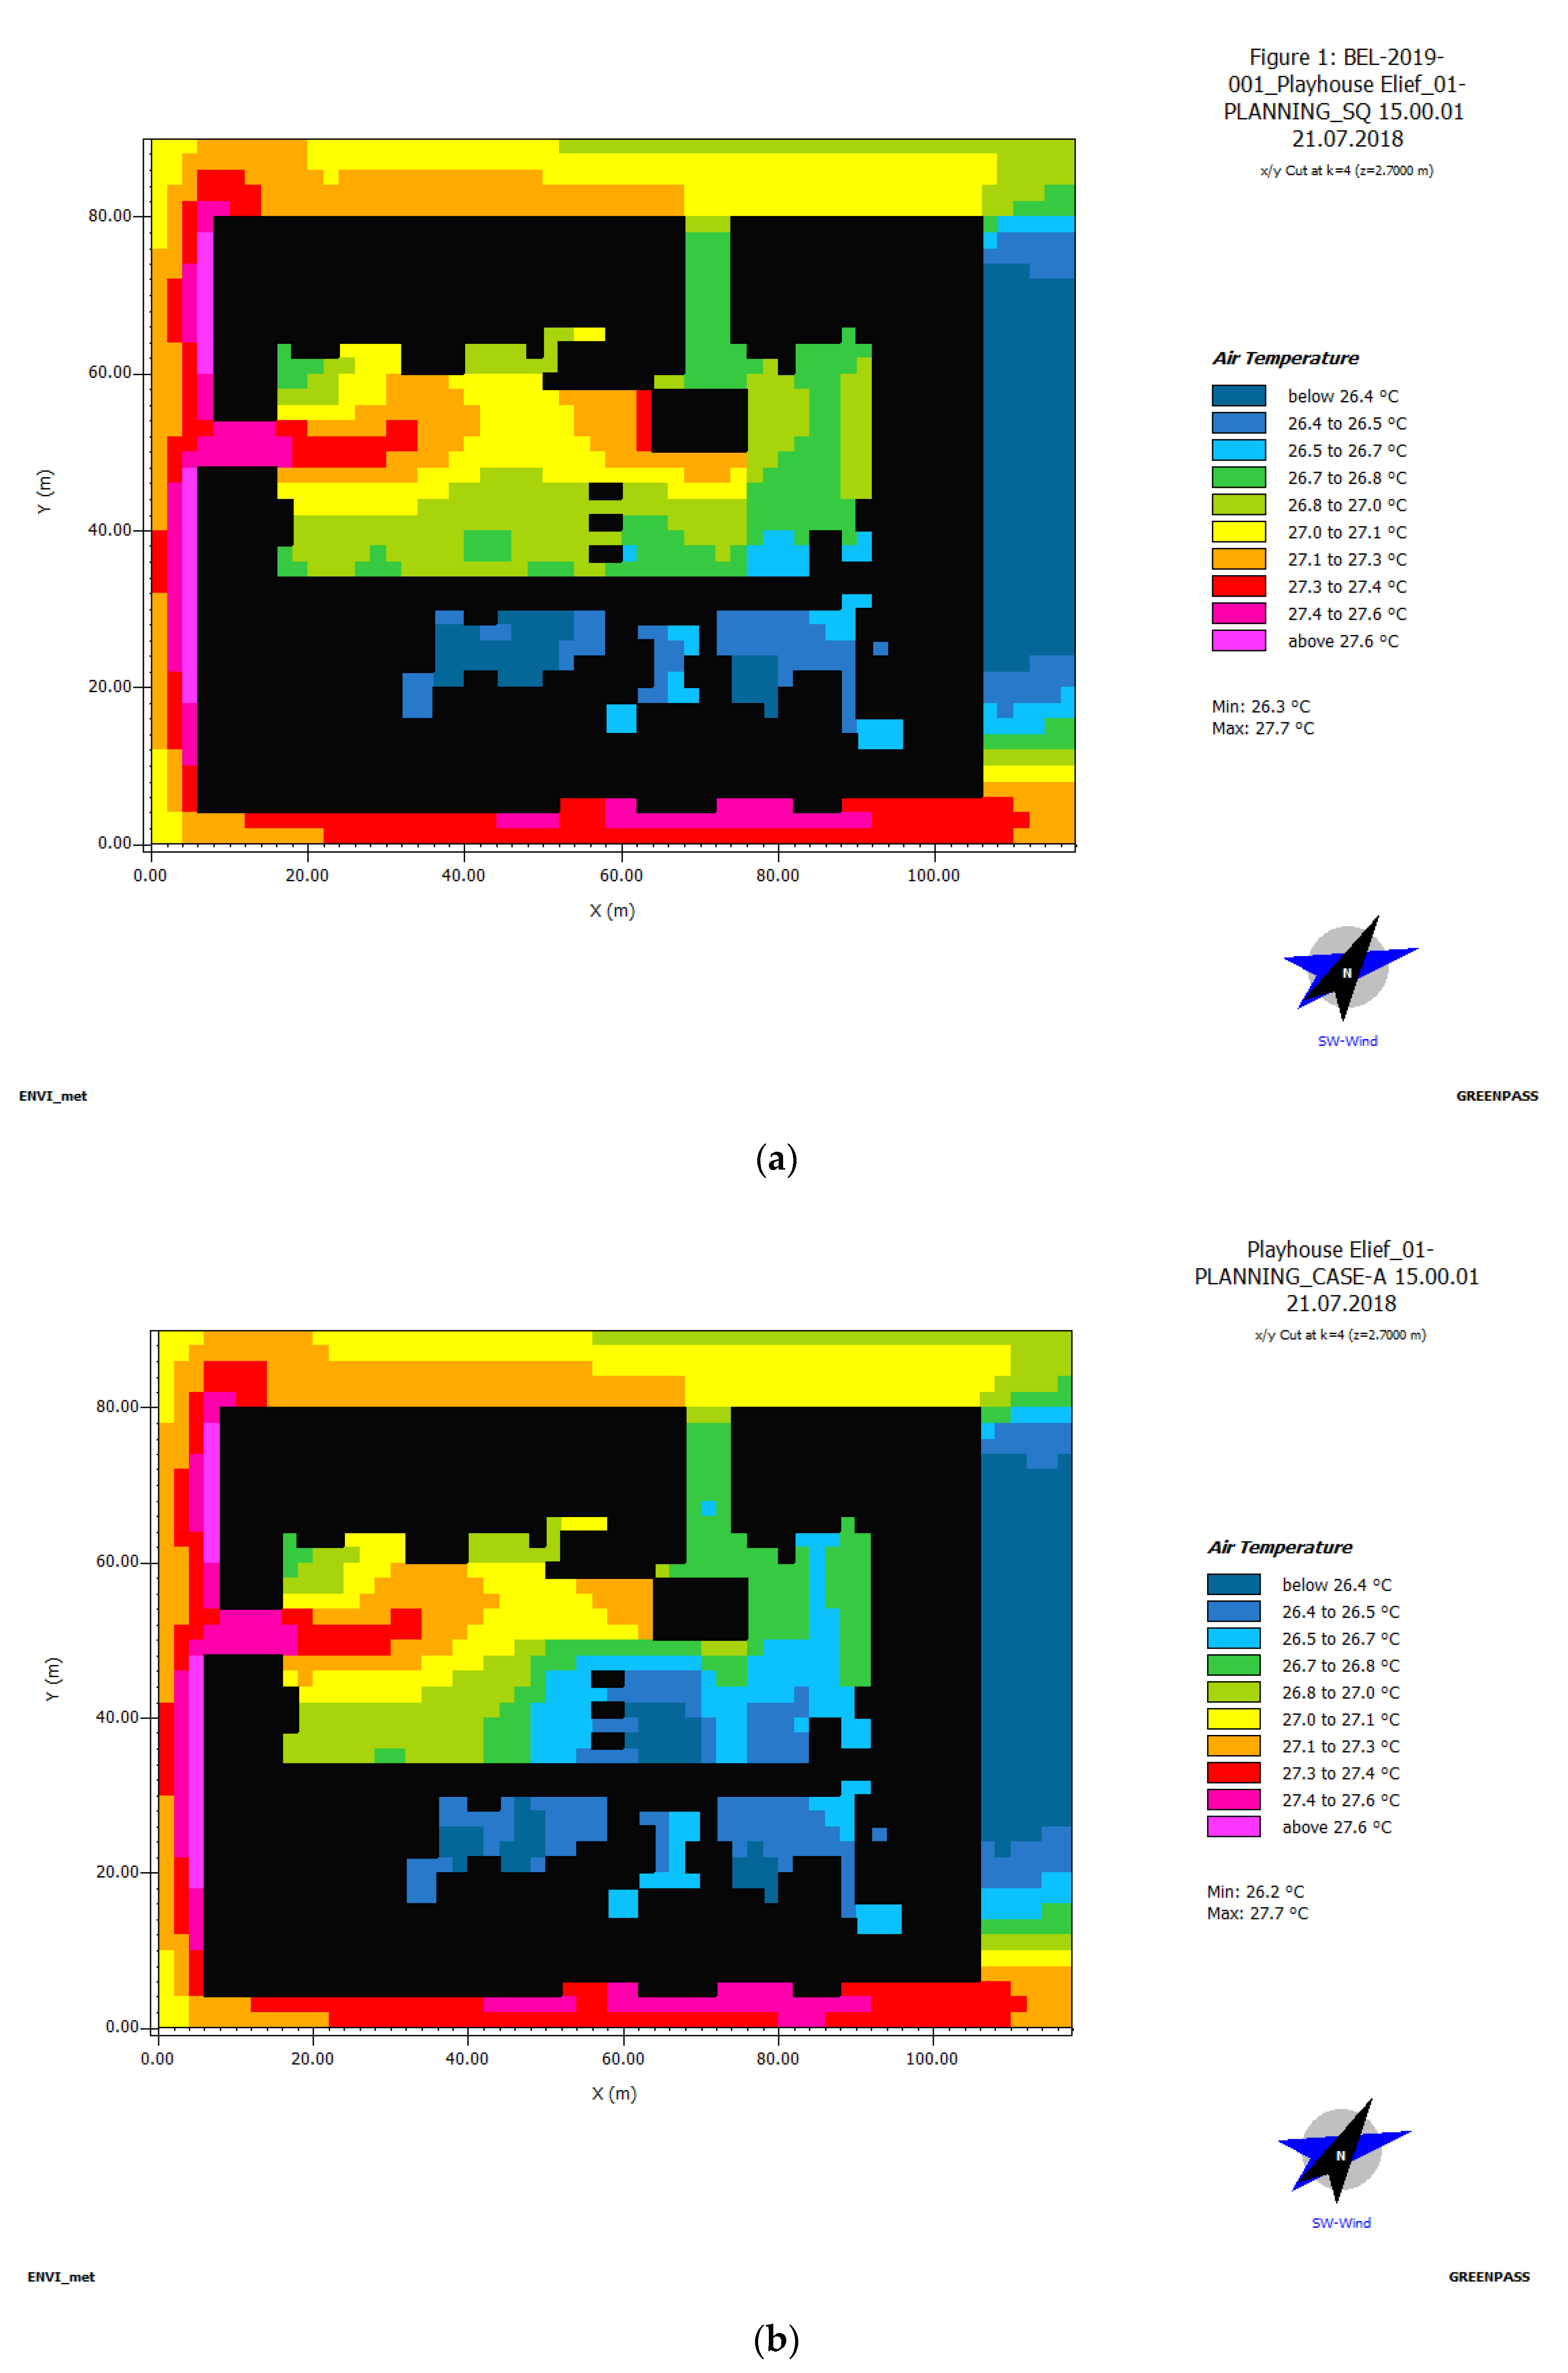
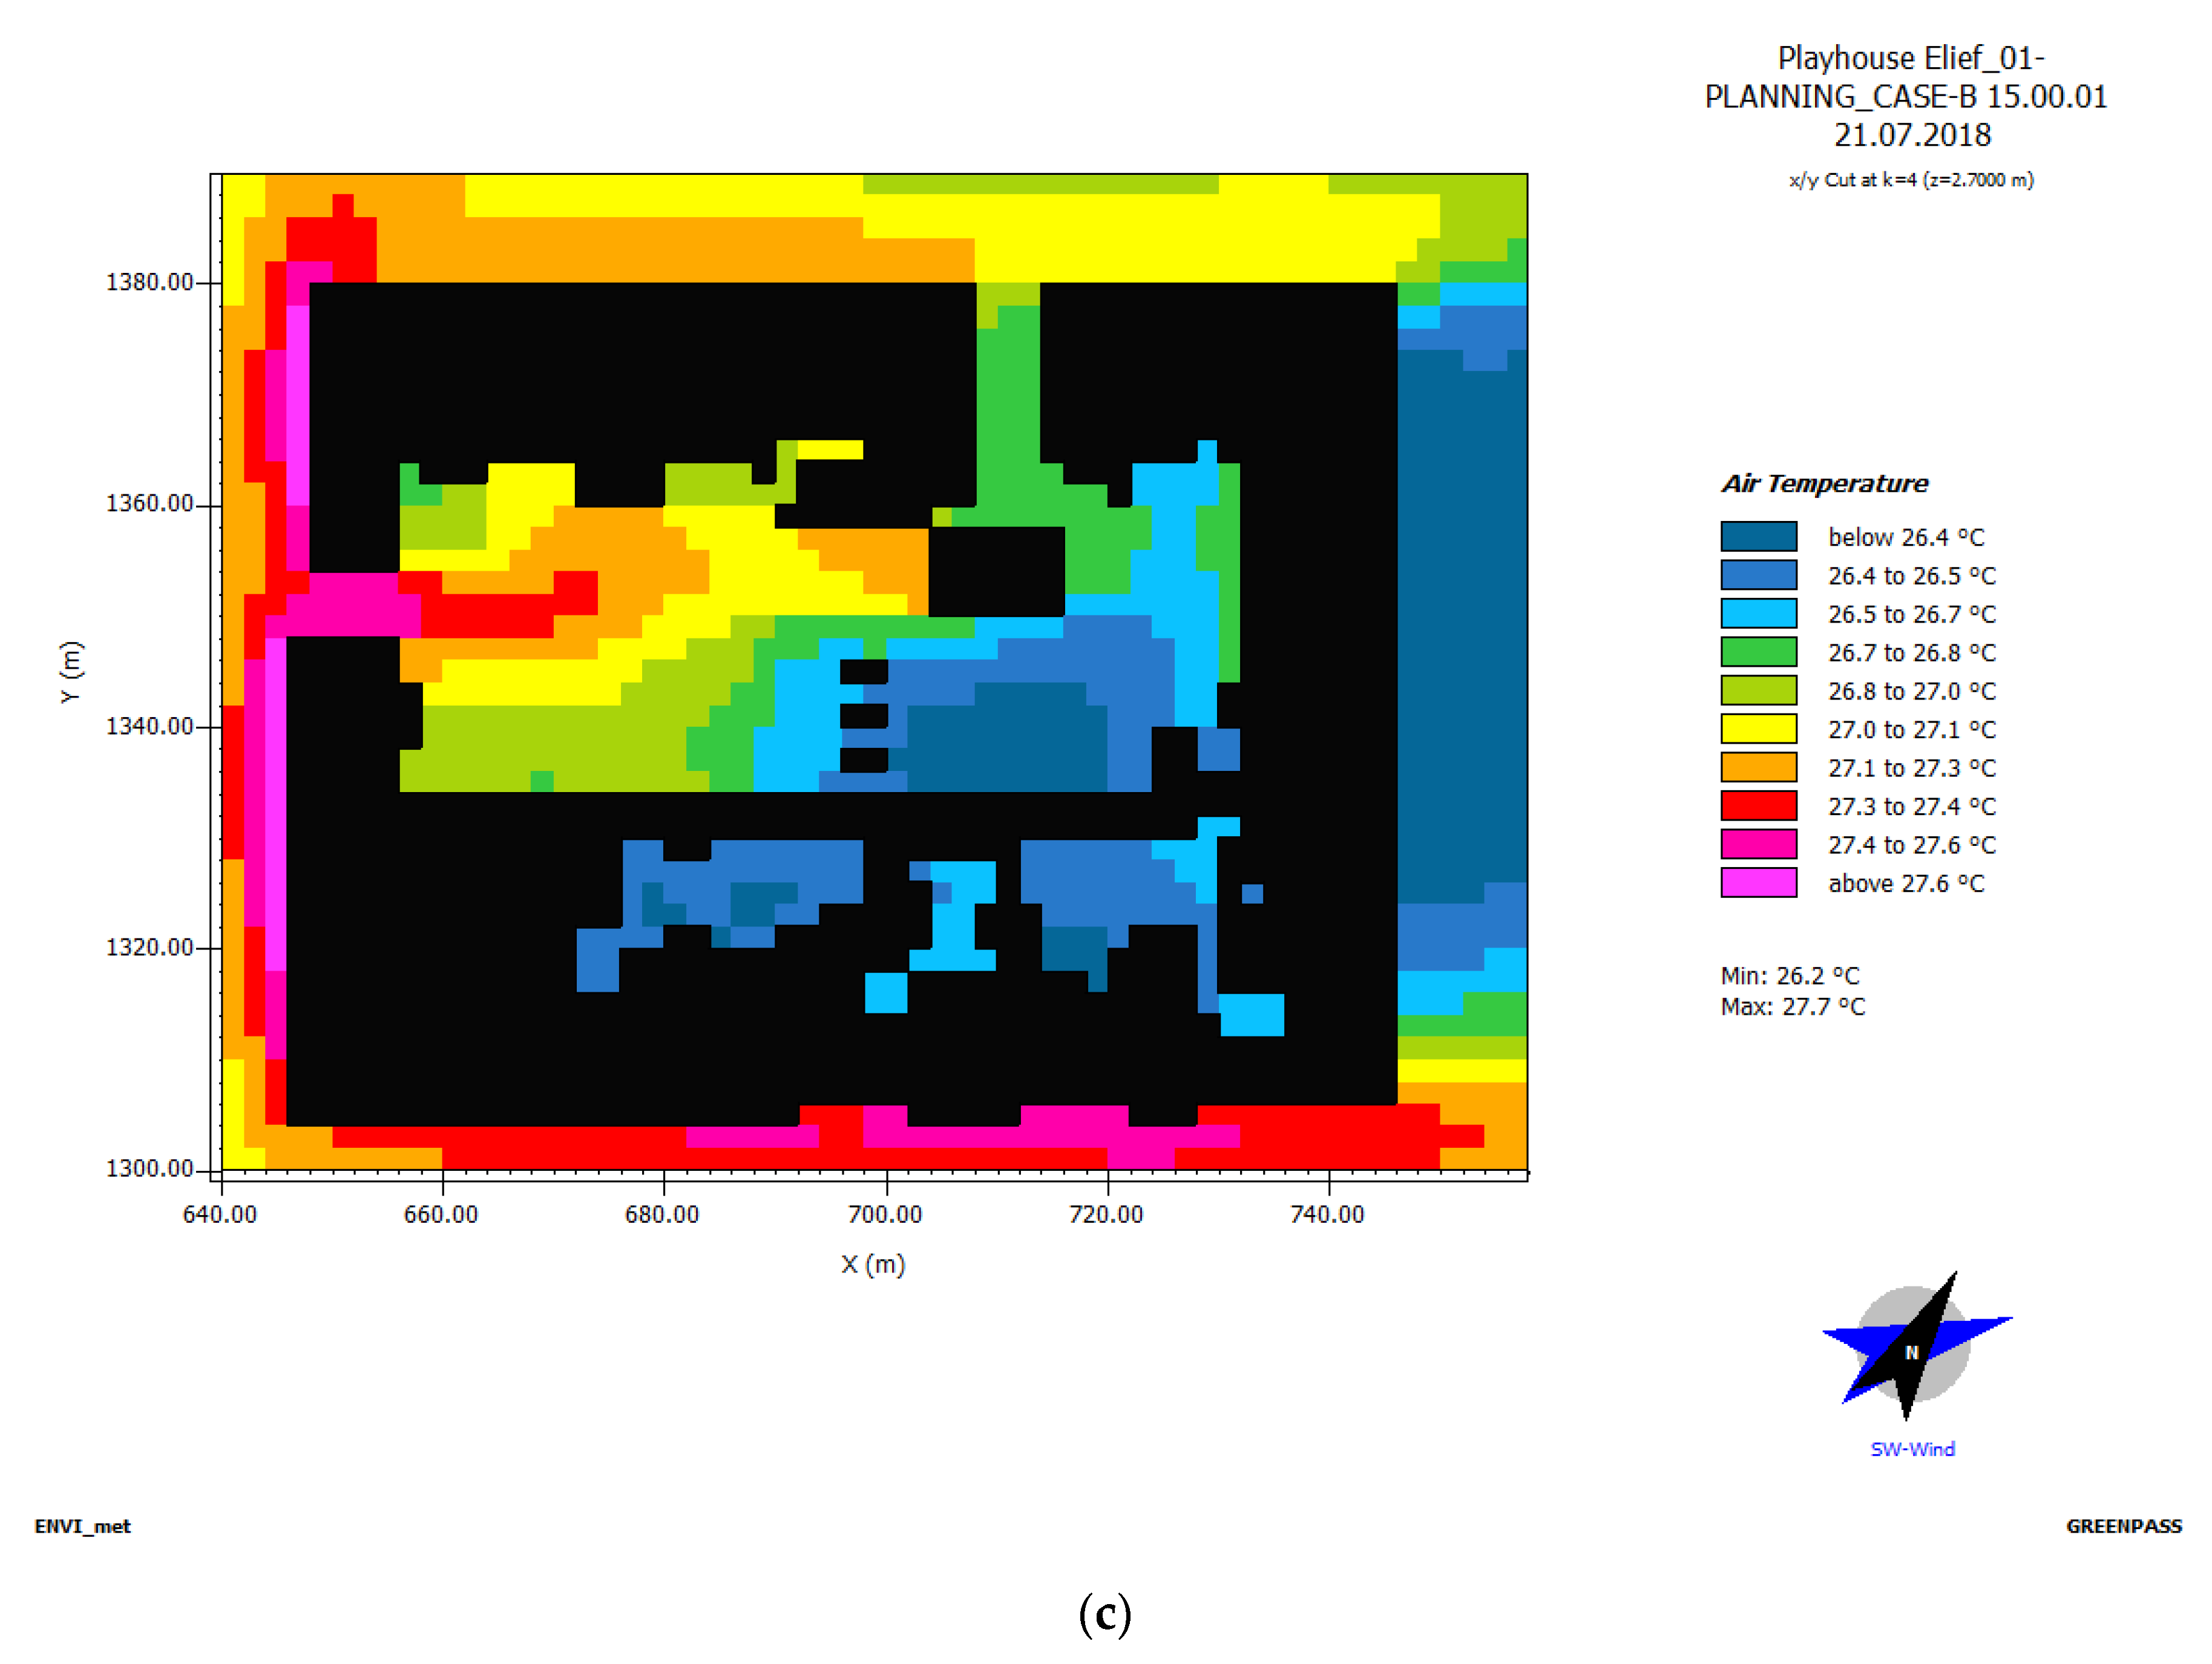
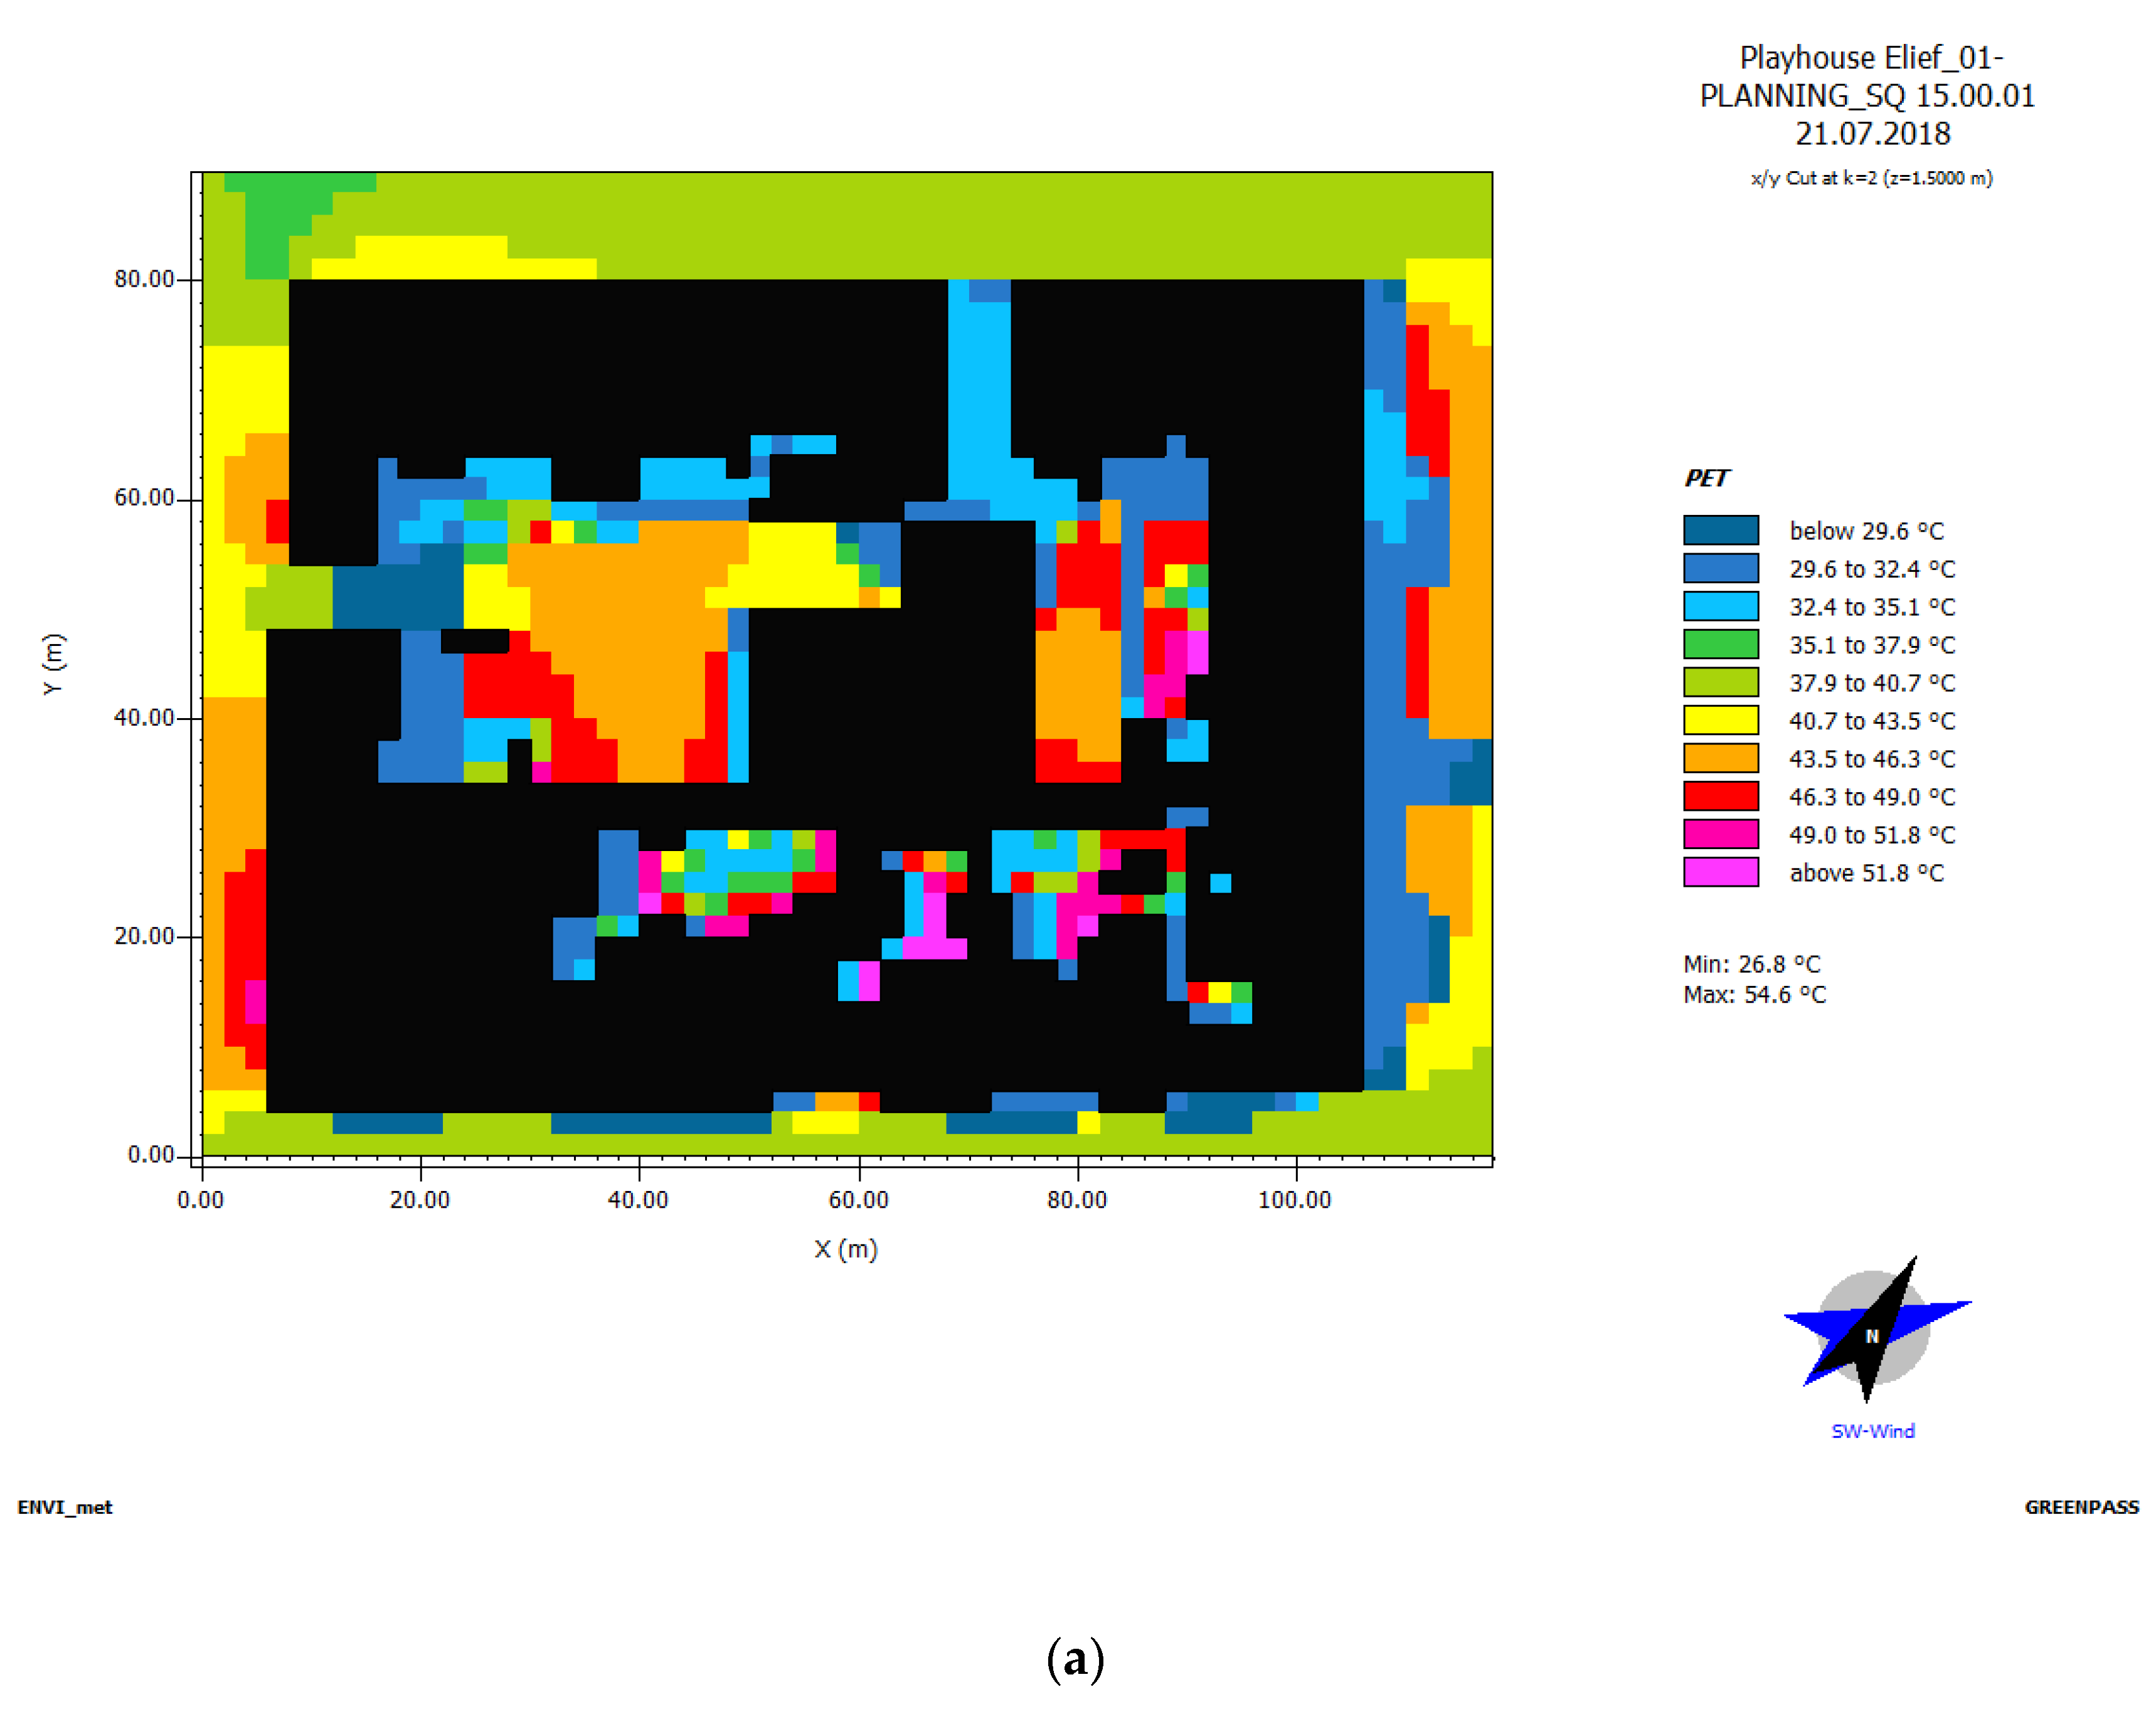
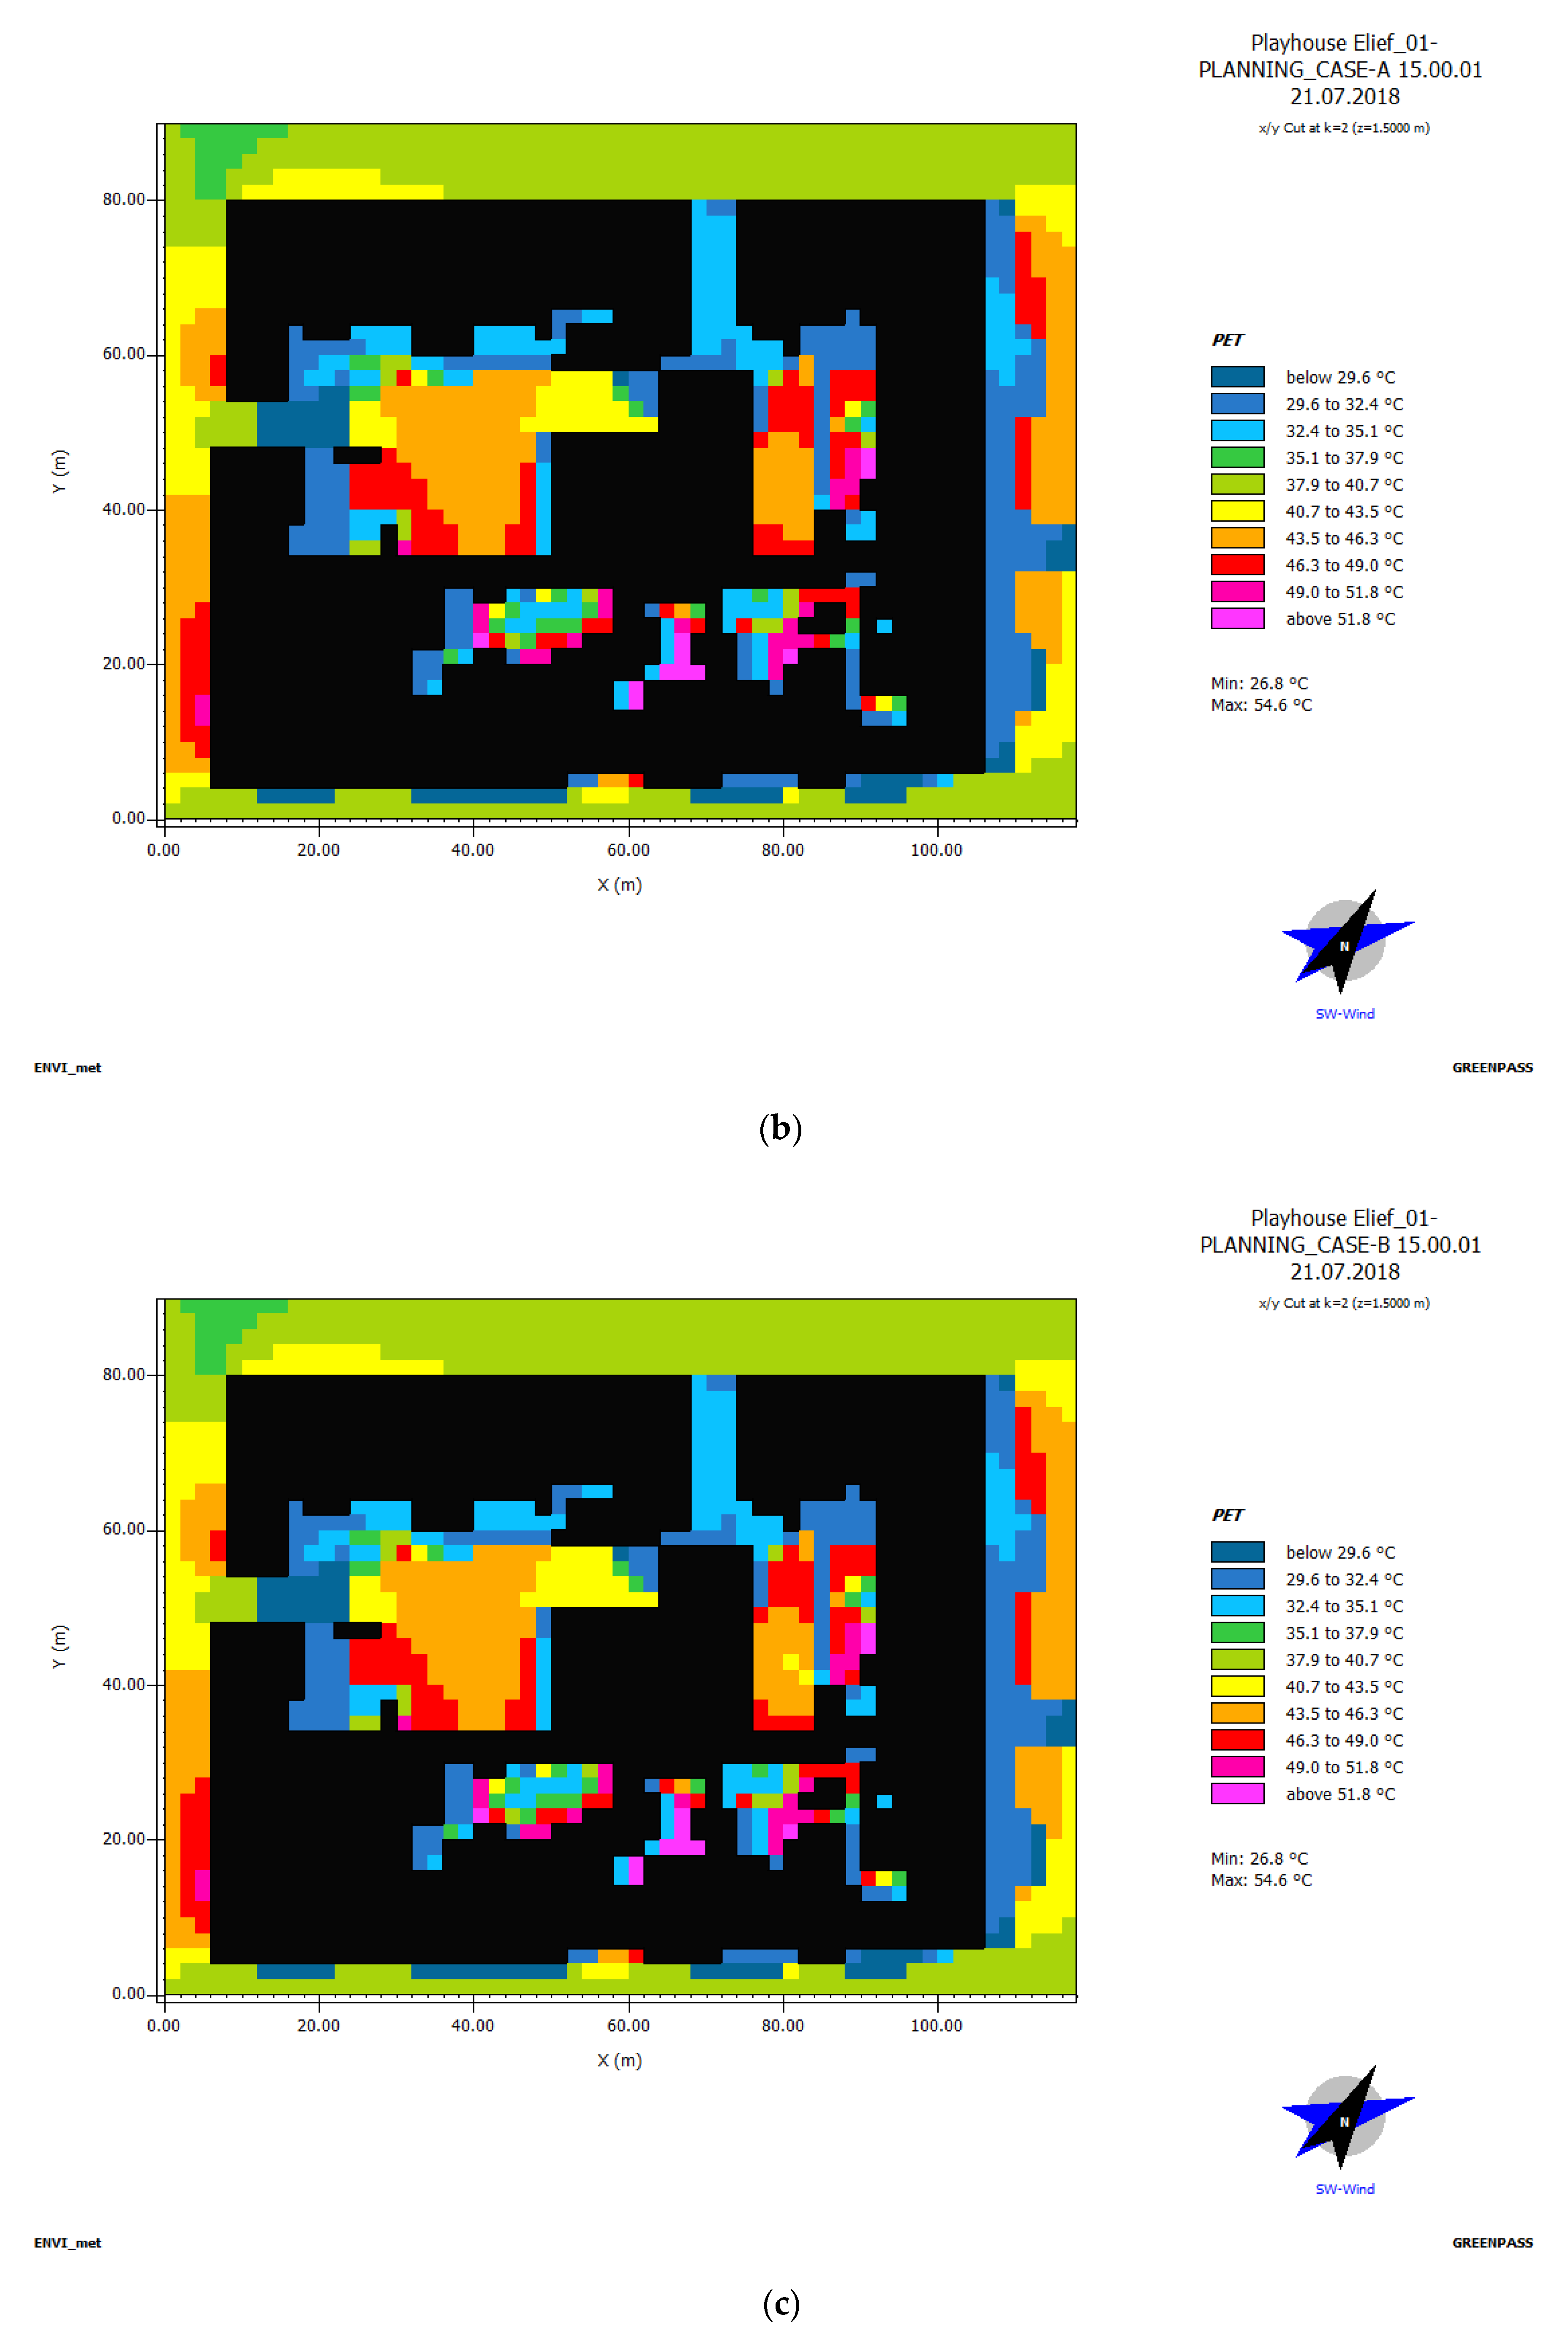
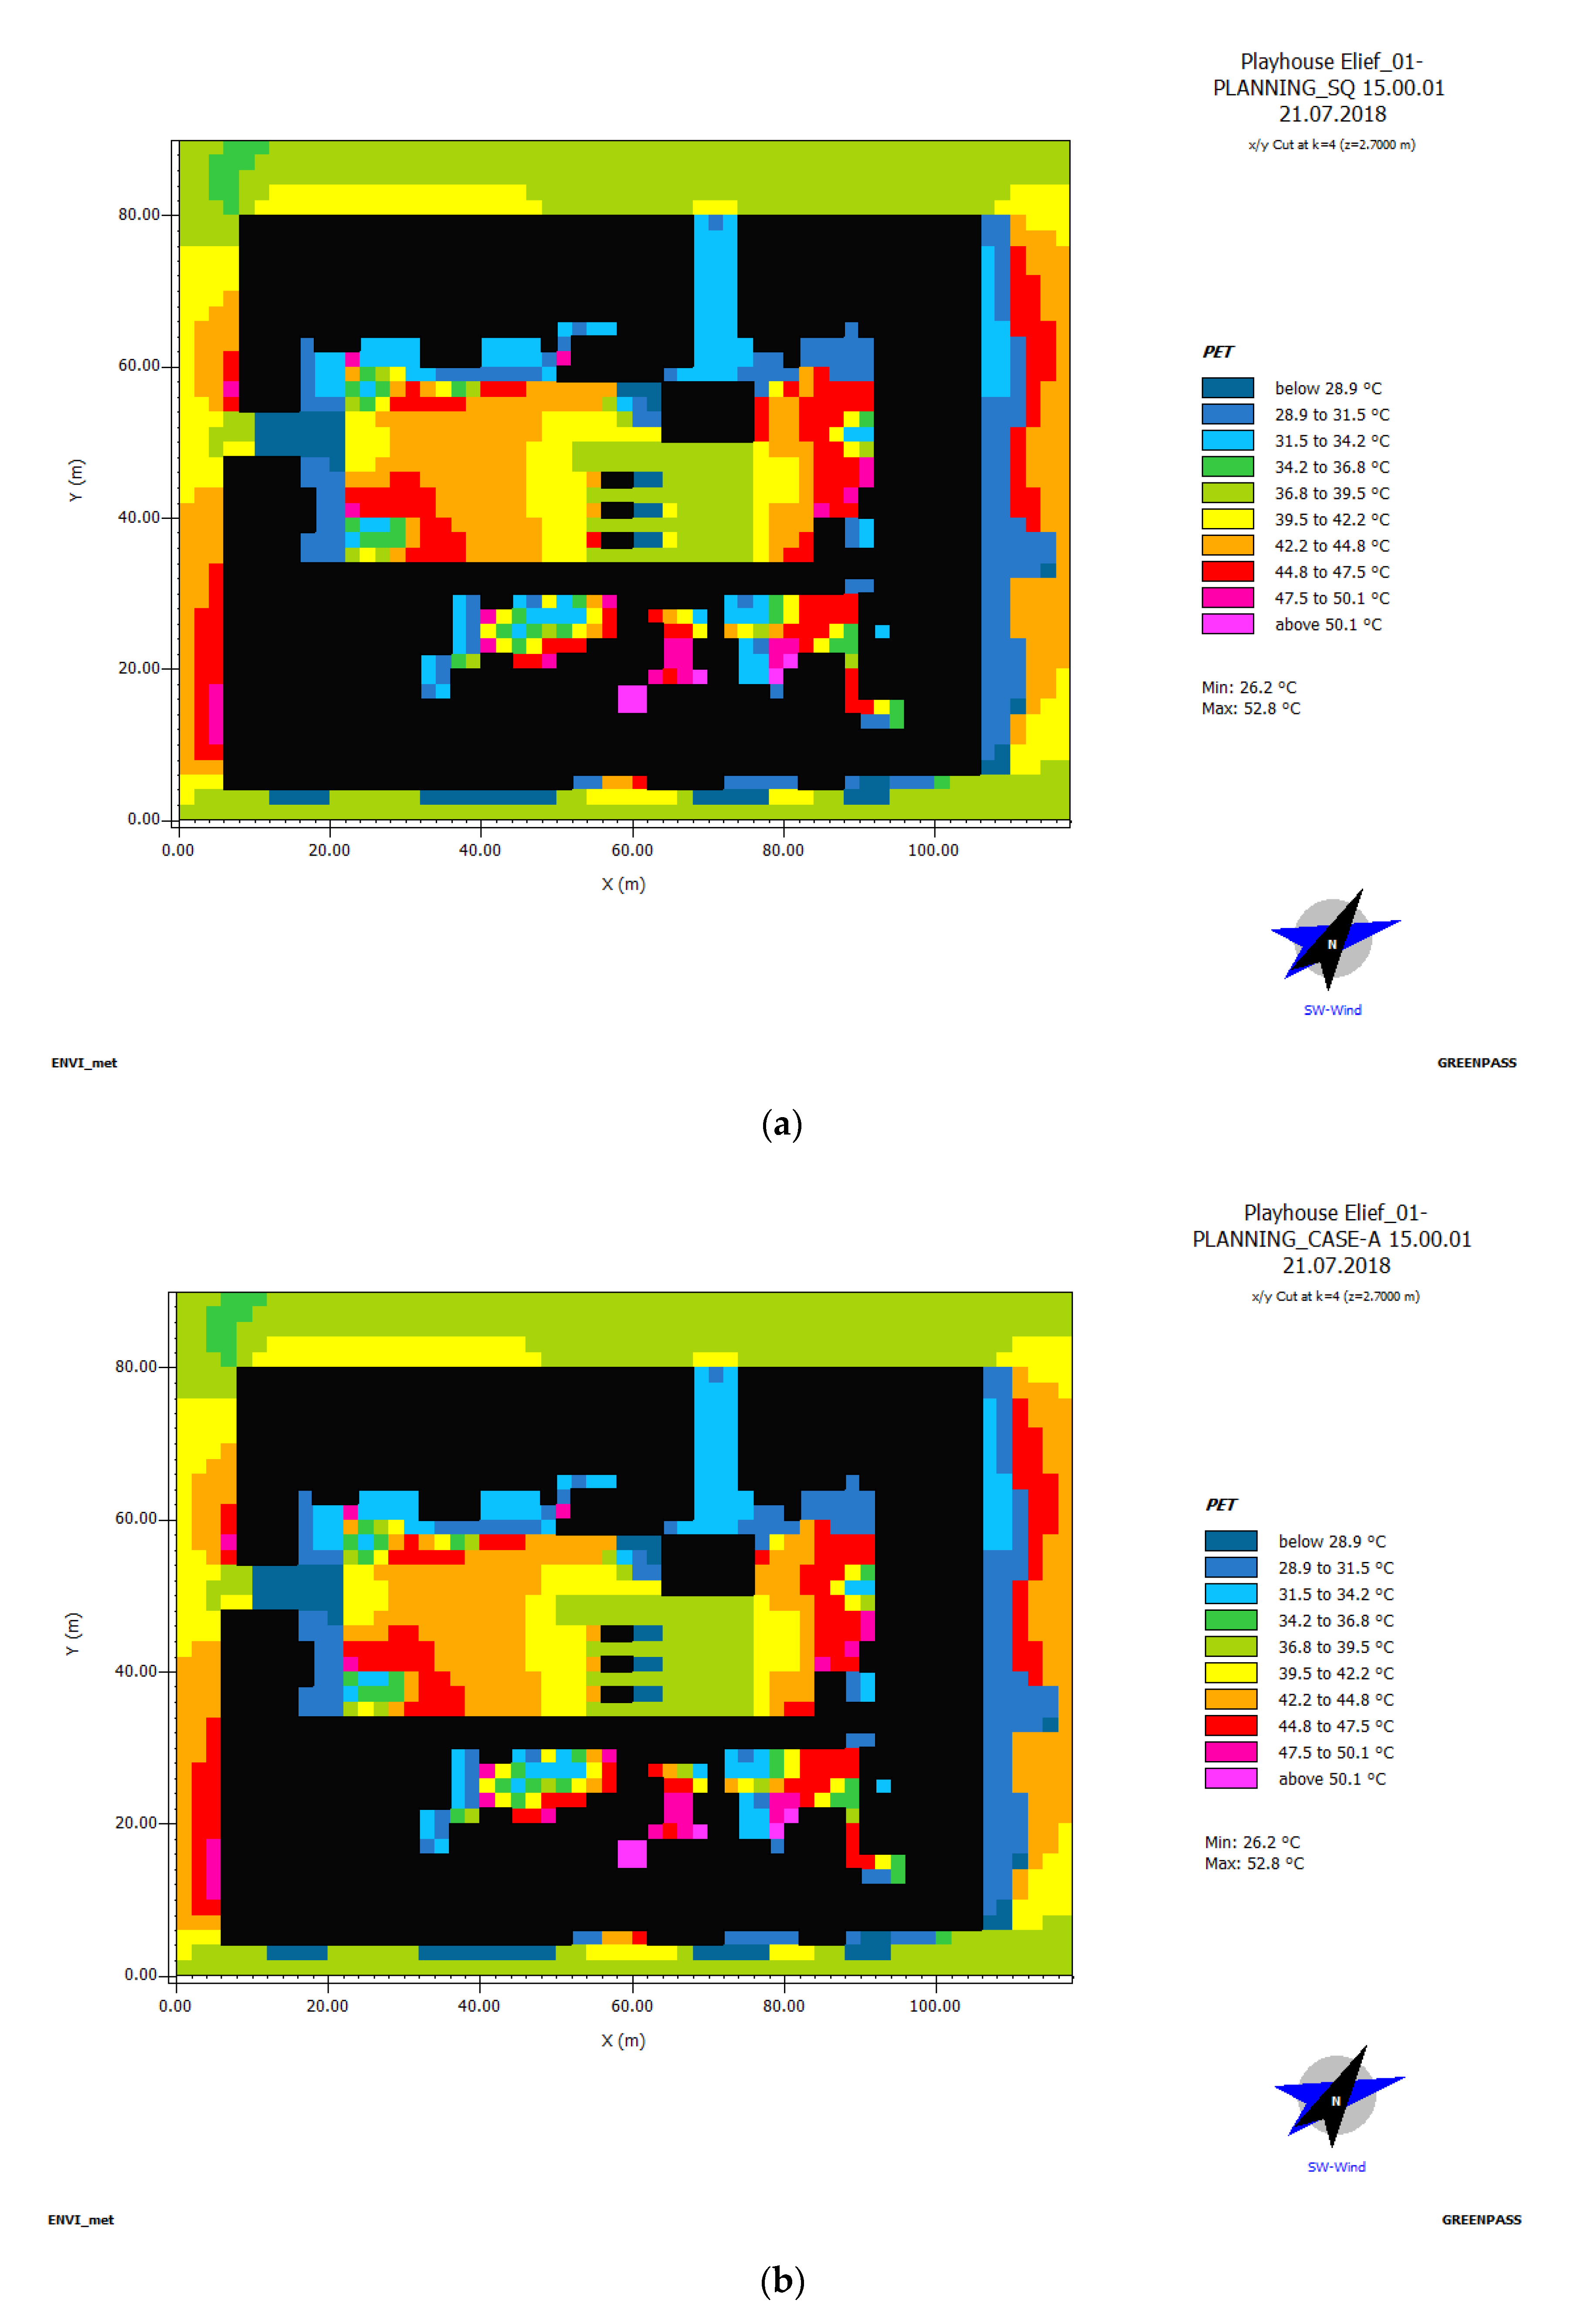
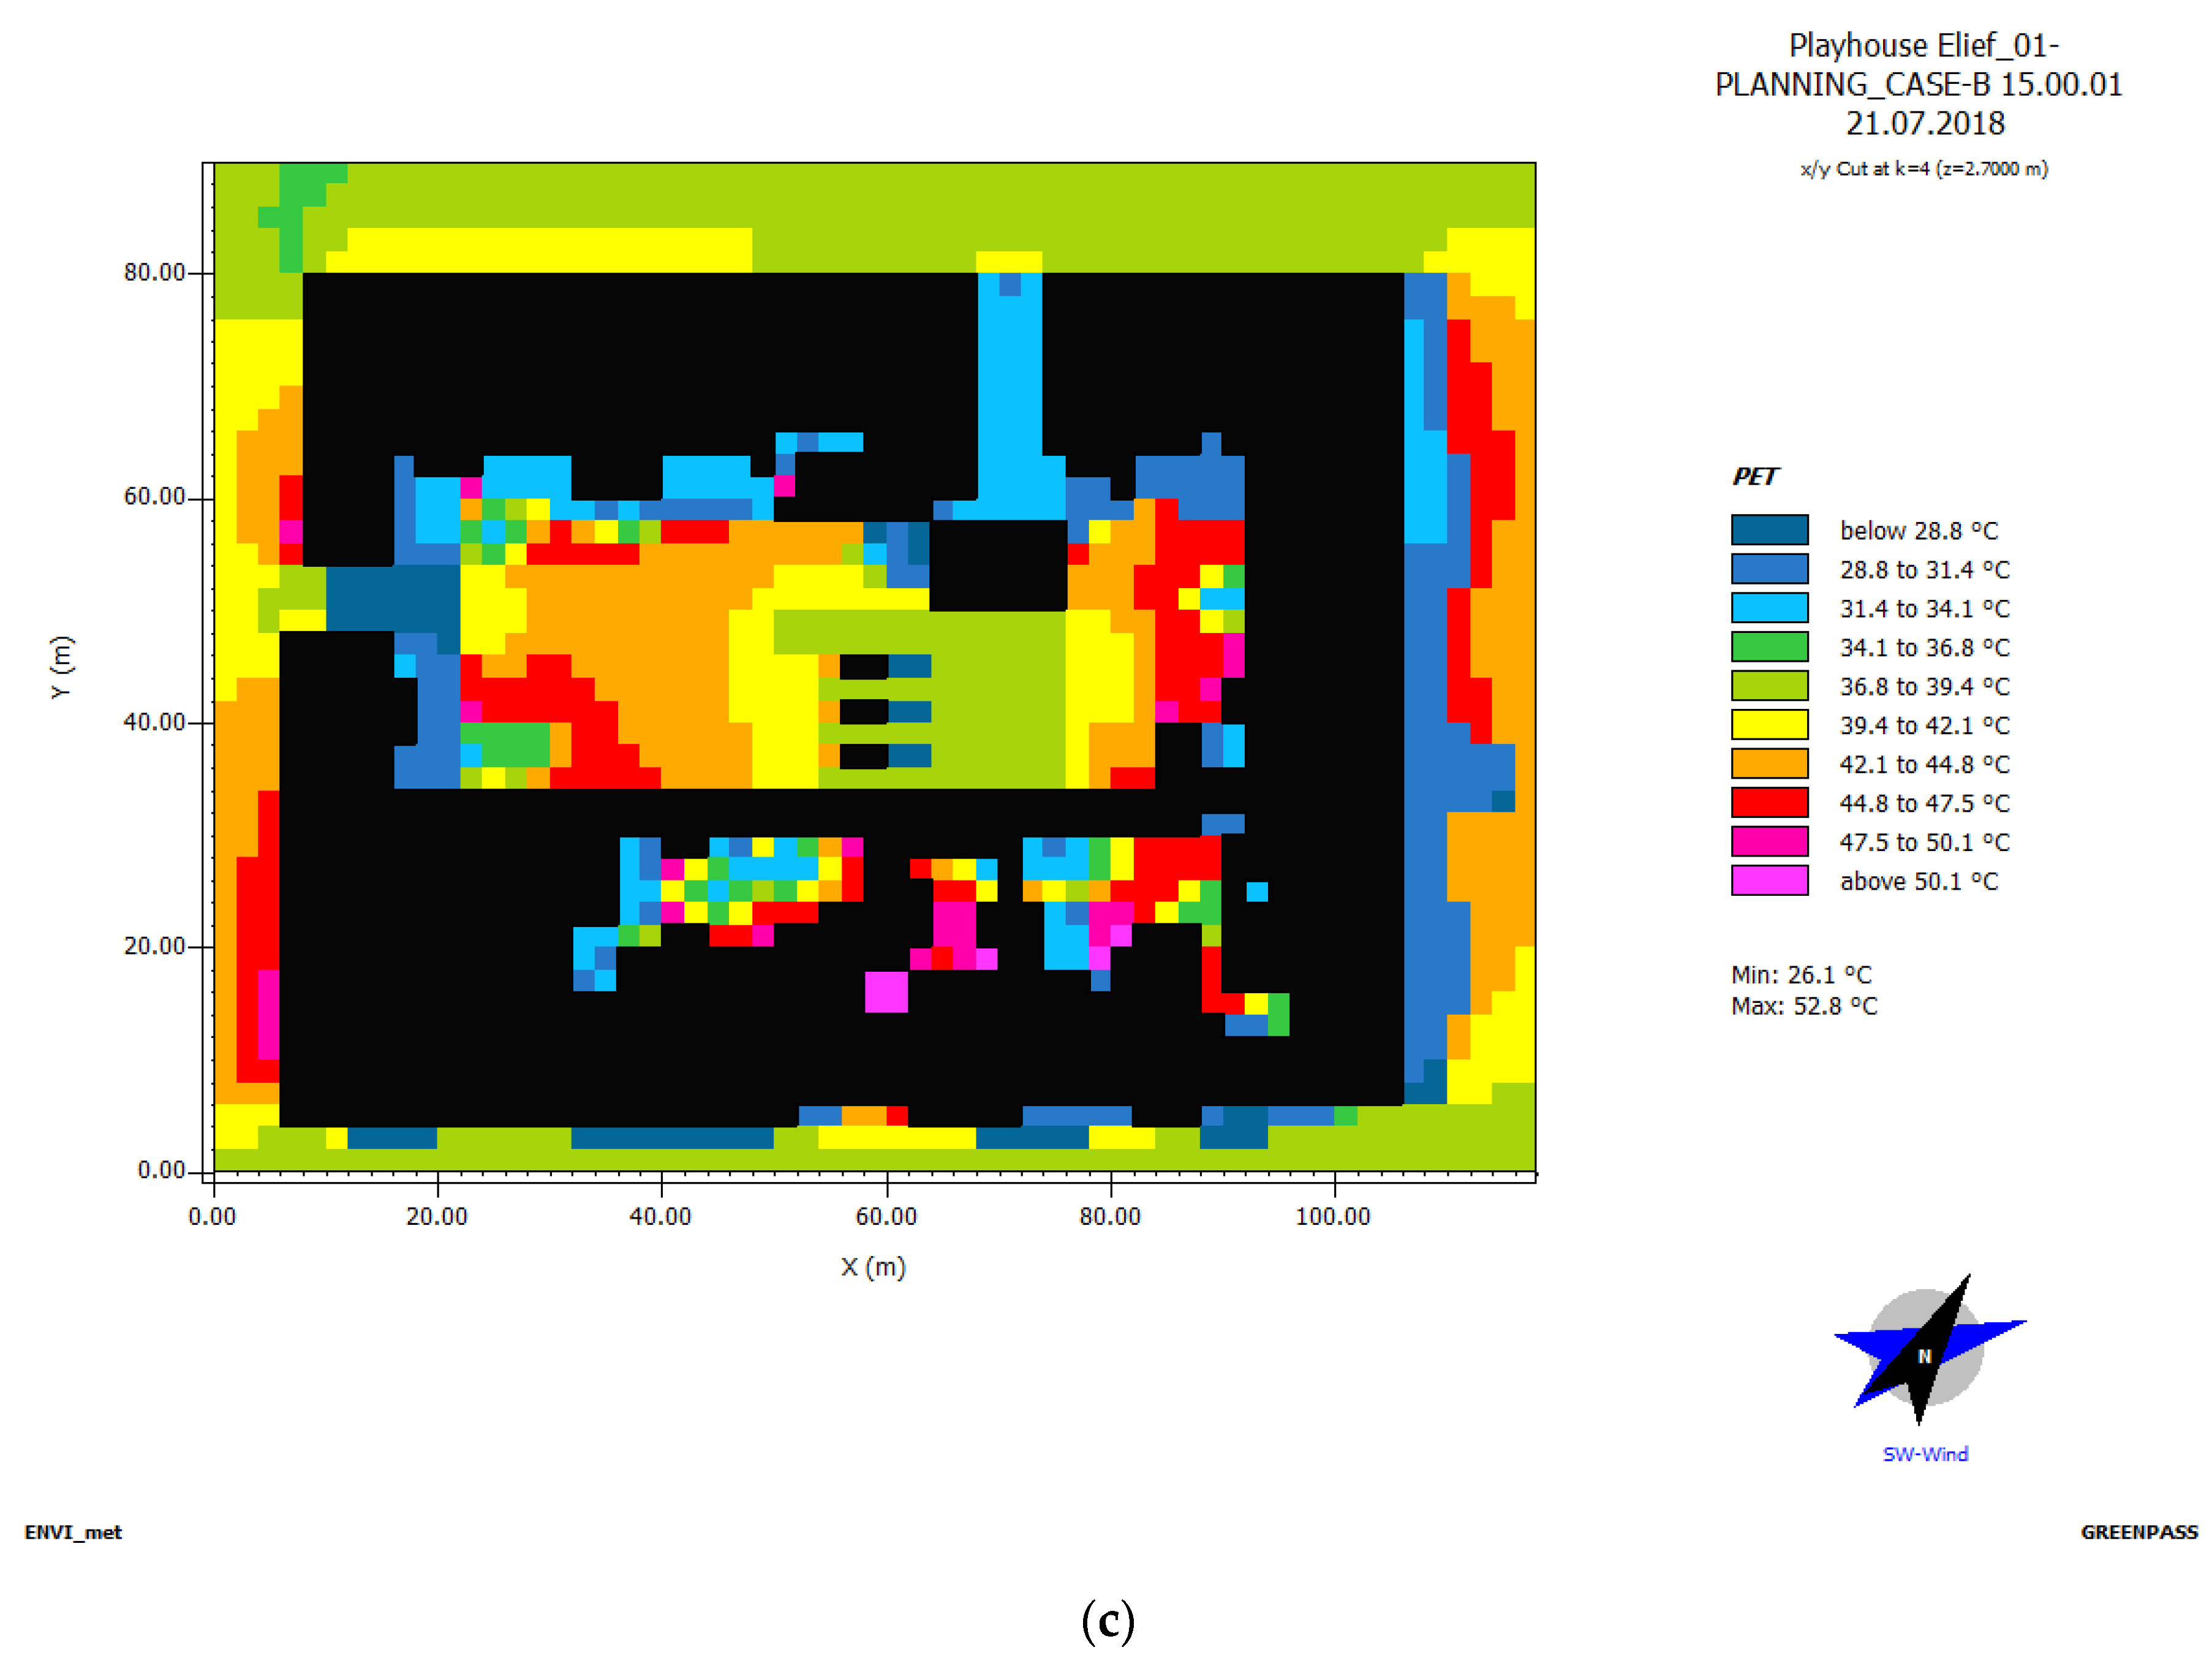
Figure 5 shows the AT of the three designs at 15:00 at ground level and Figure 6 shows the AT of the same designs at roof level. On the simulated day, the air temperature of the courtyard would reach temperatures of up to 28.6 °C (Figure 5a–c). The air temperature at roof level reached 27.7 °C (Figure 6a–c). Figure 7 and Figure 8 display the same information for PET, accordingly. The physiological equivalent temperature (PET) reached up to 54.6 °C in the courtyard area at ground level (Figure 7a–c), while the roof level showed a PET from 28.9–47.5 °C (Figure 8a) in the Status Quo variant and between 28.9–44.8 °C in the planning variants (Figure 8b,c).
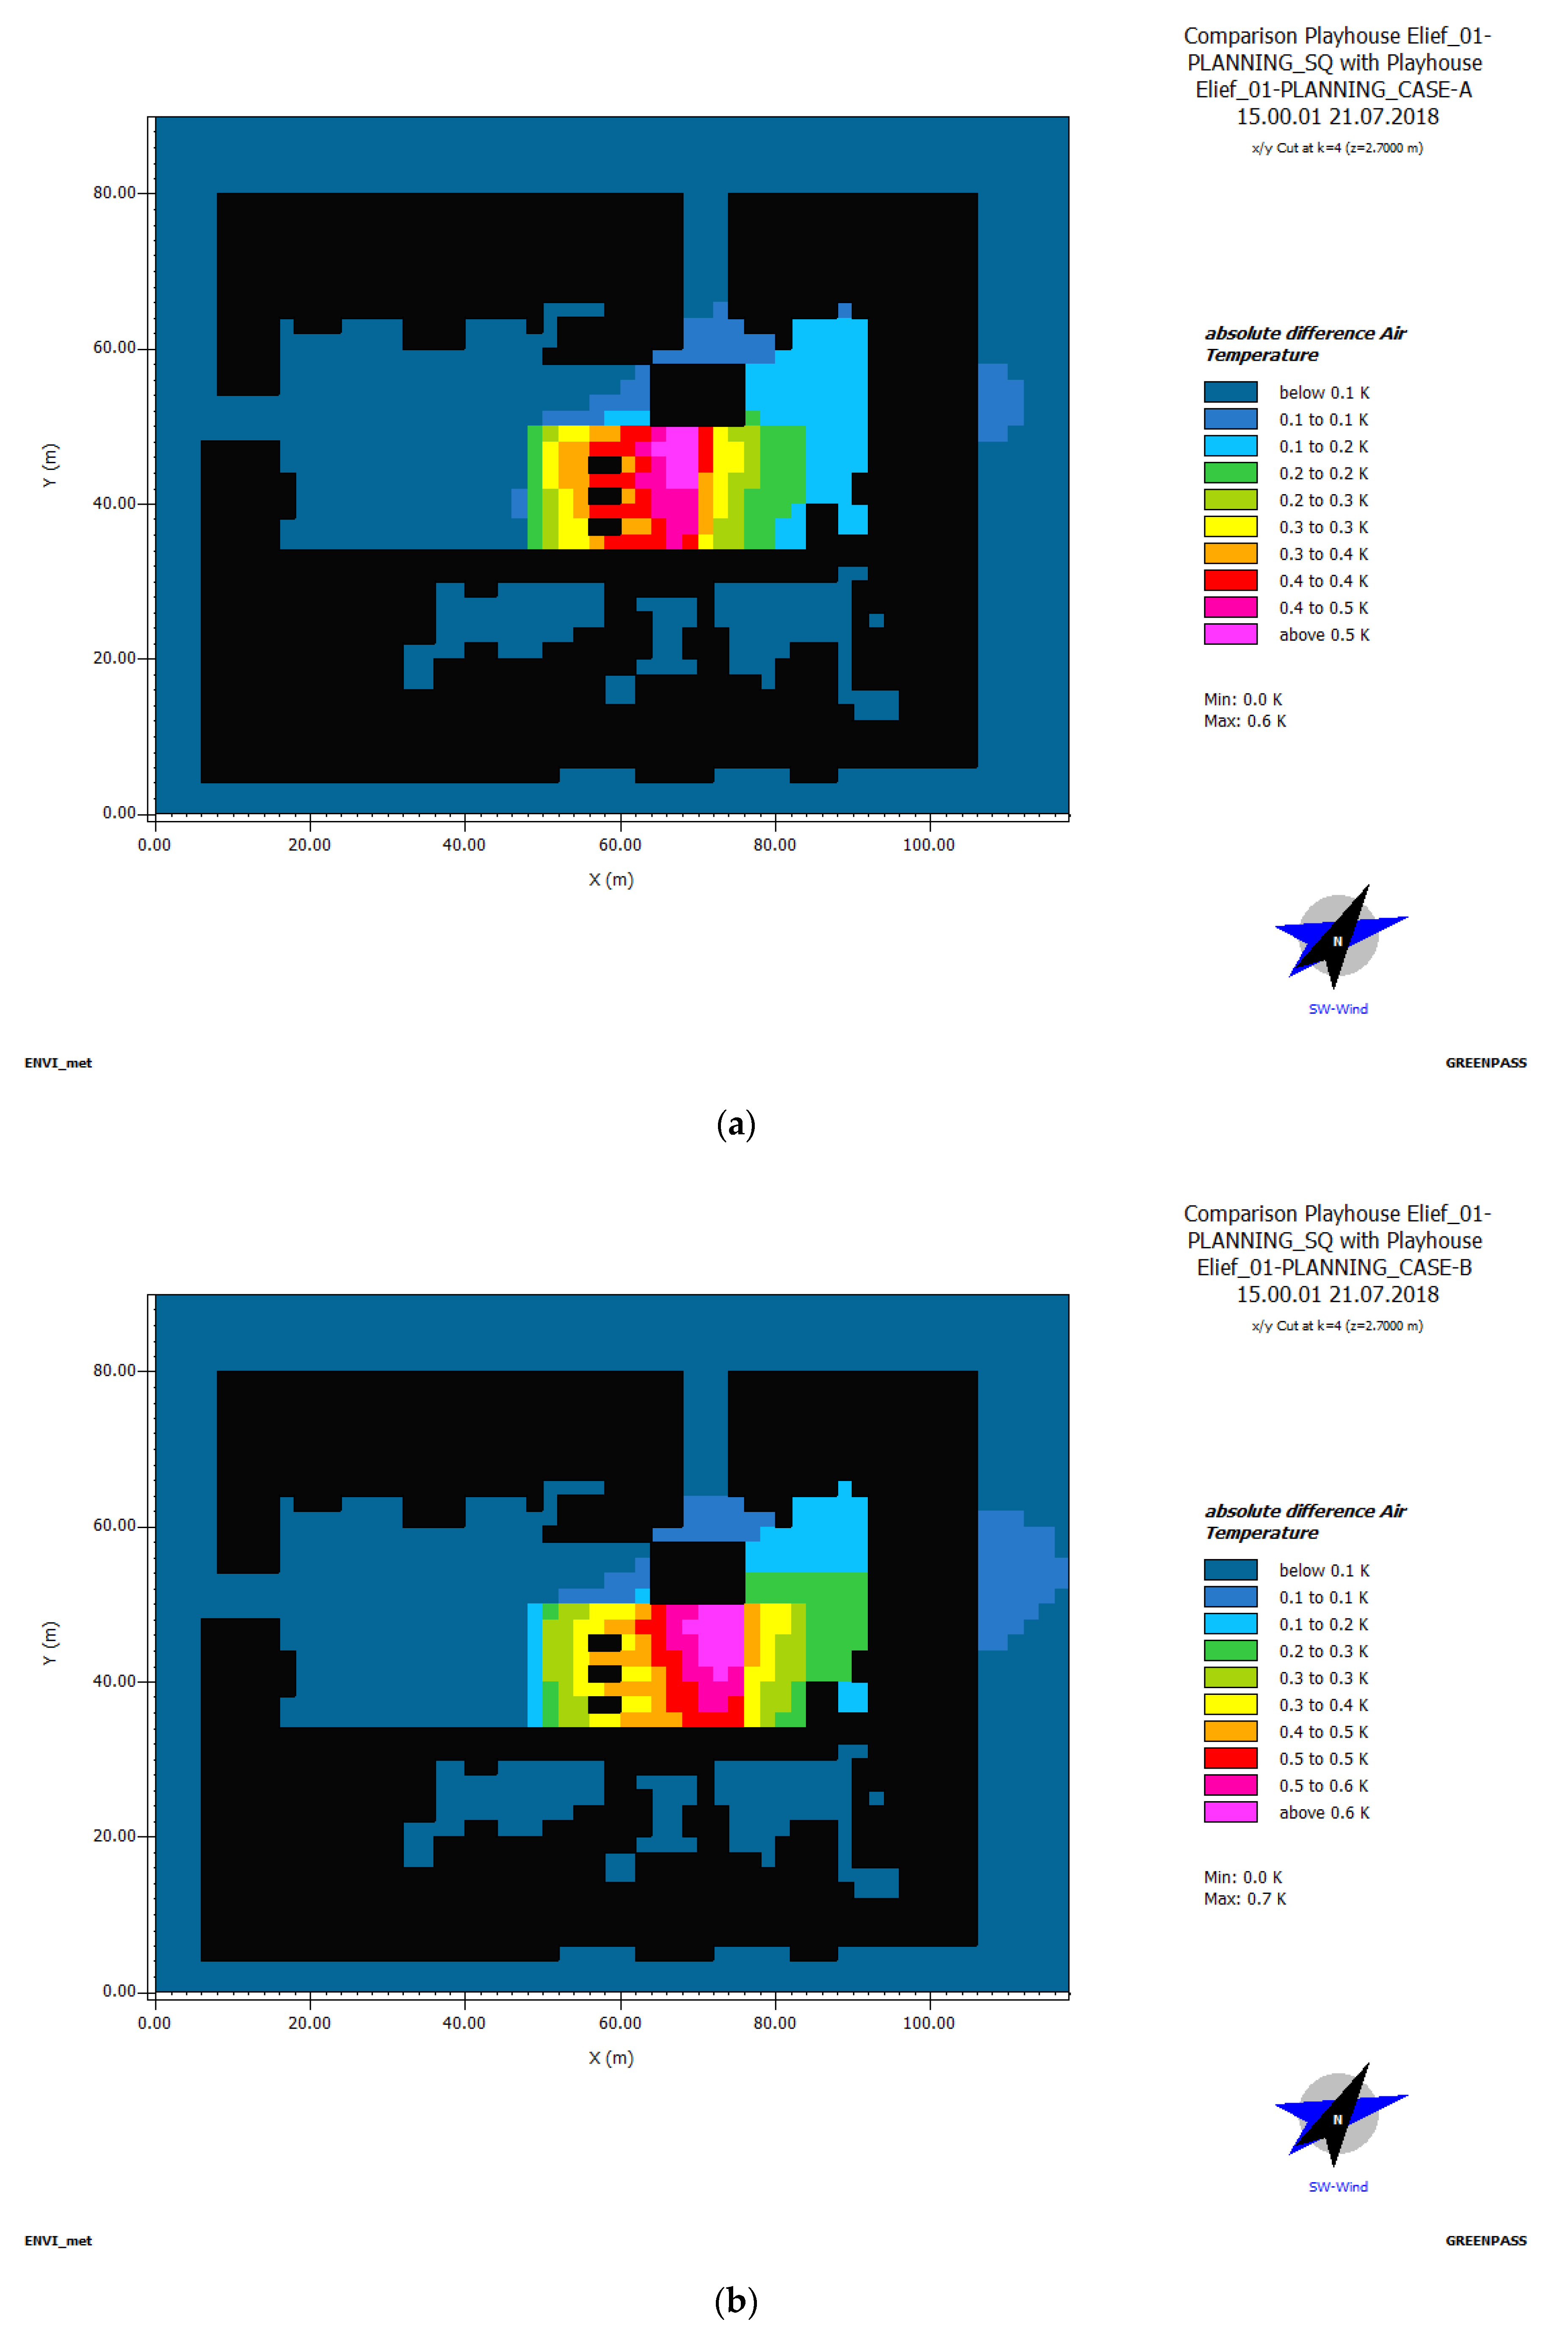
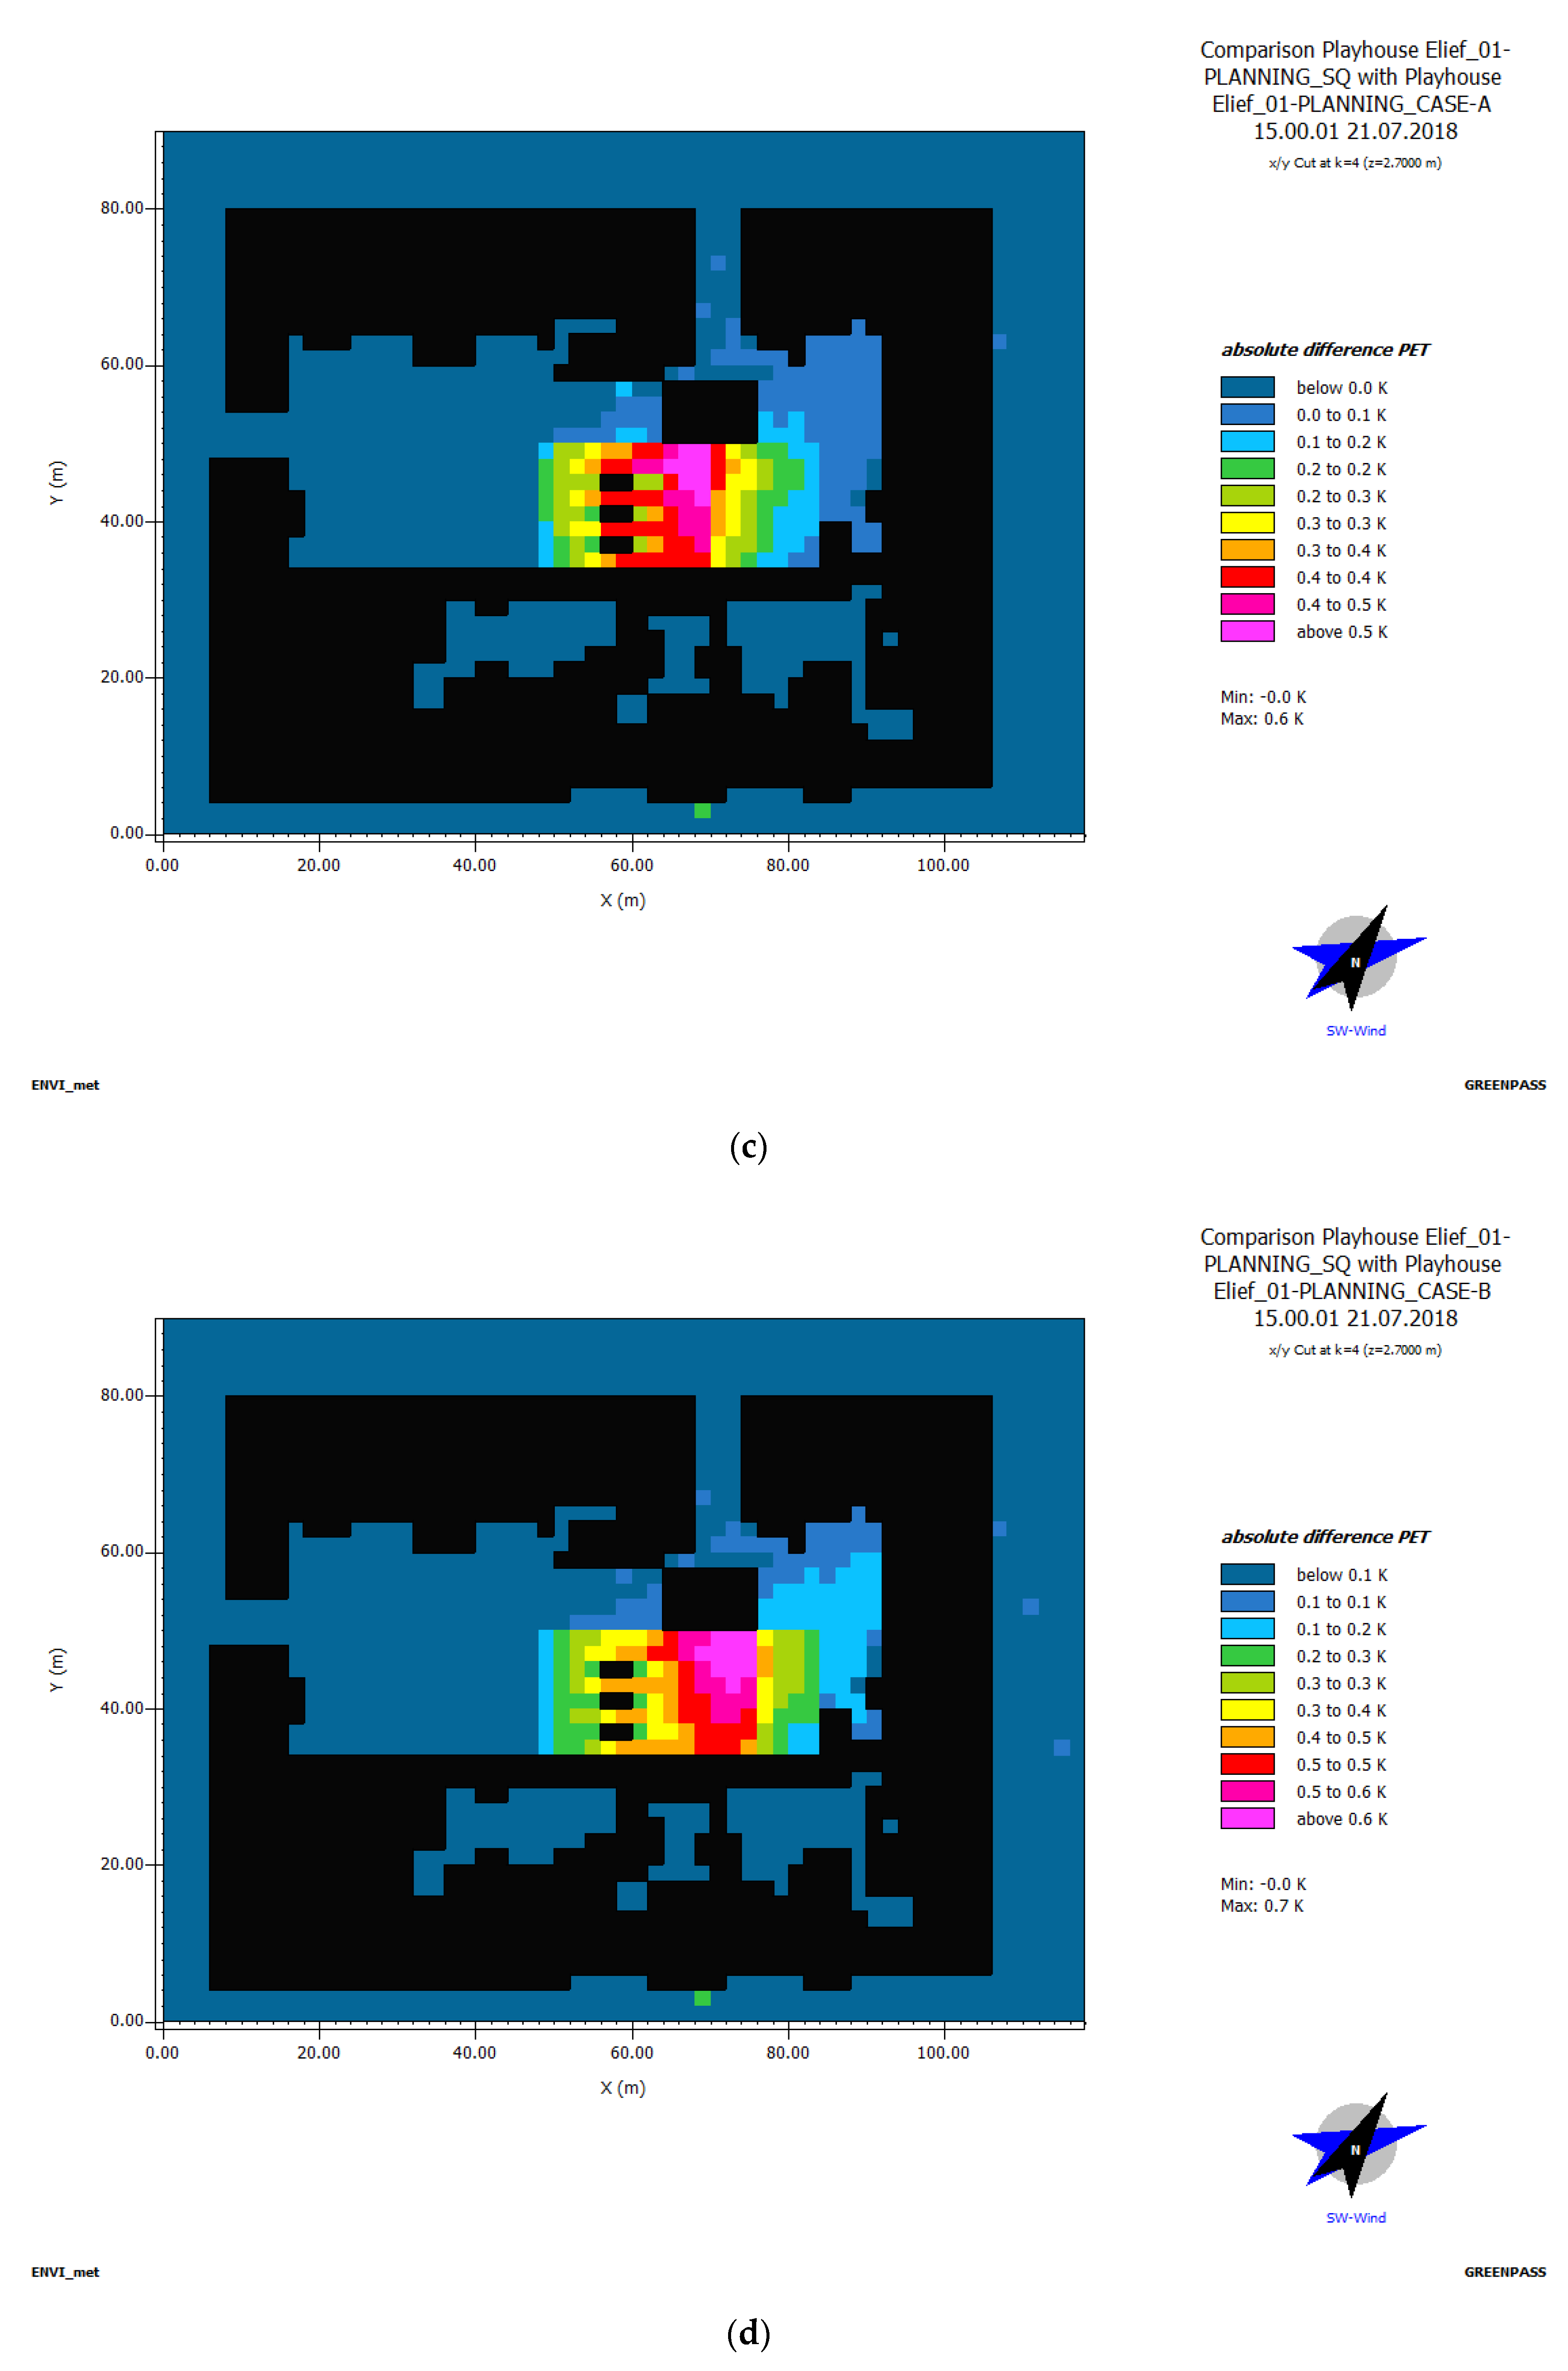
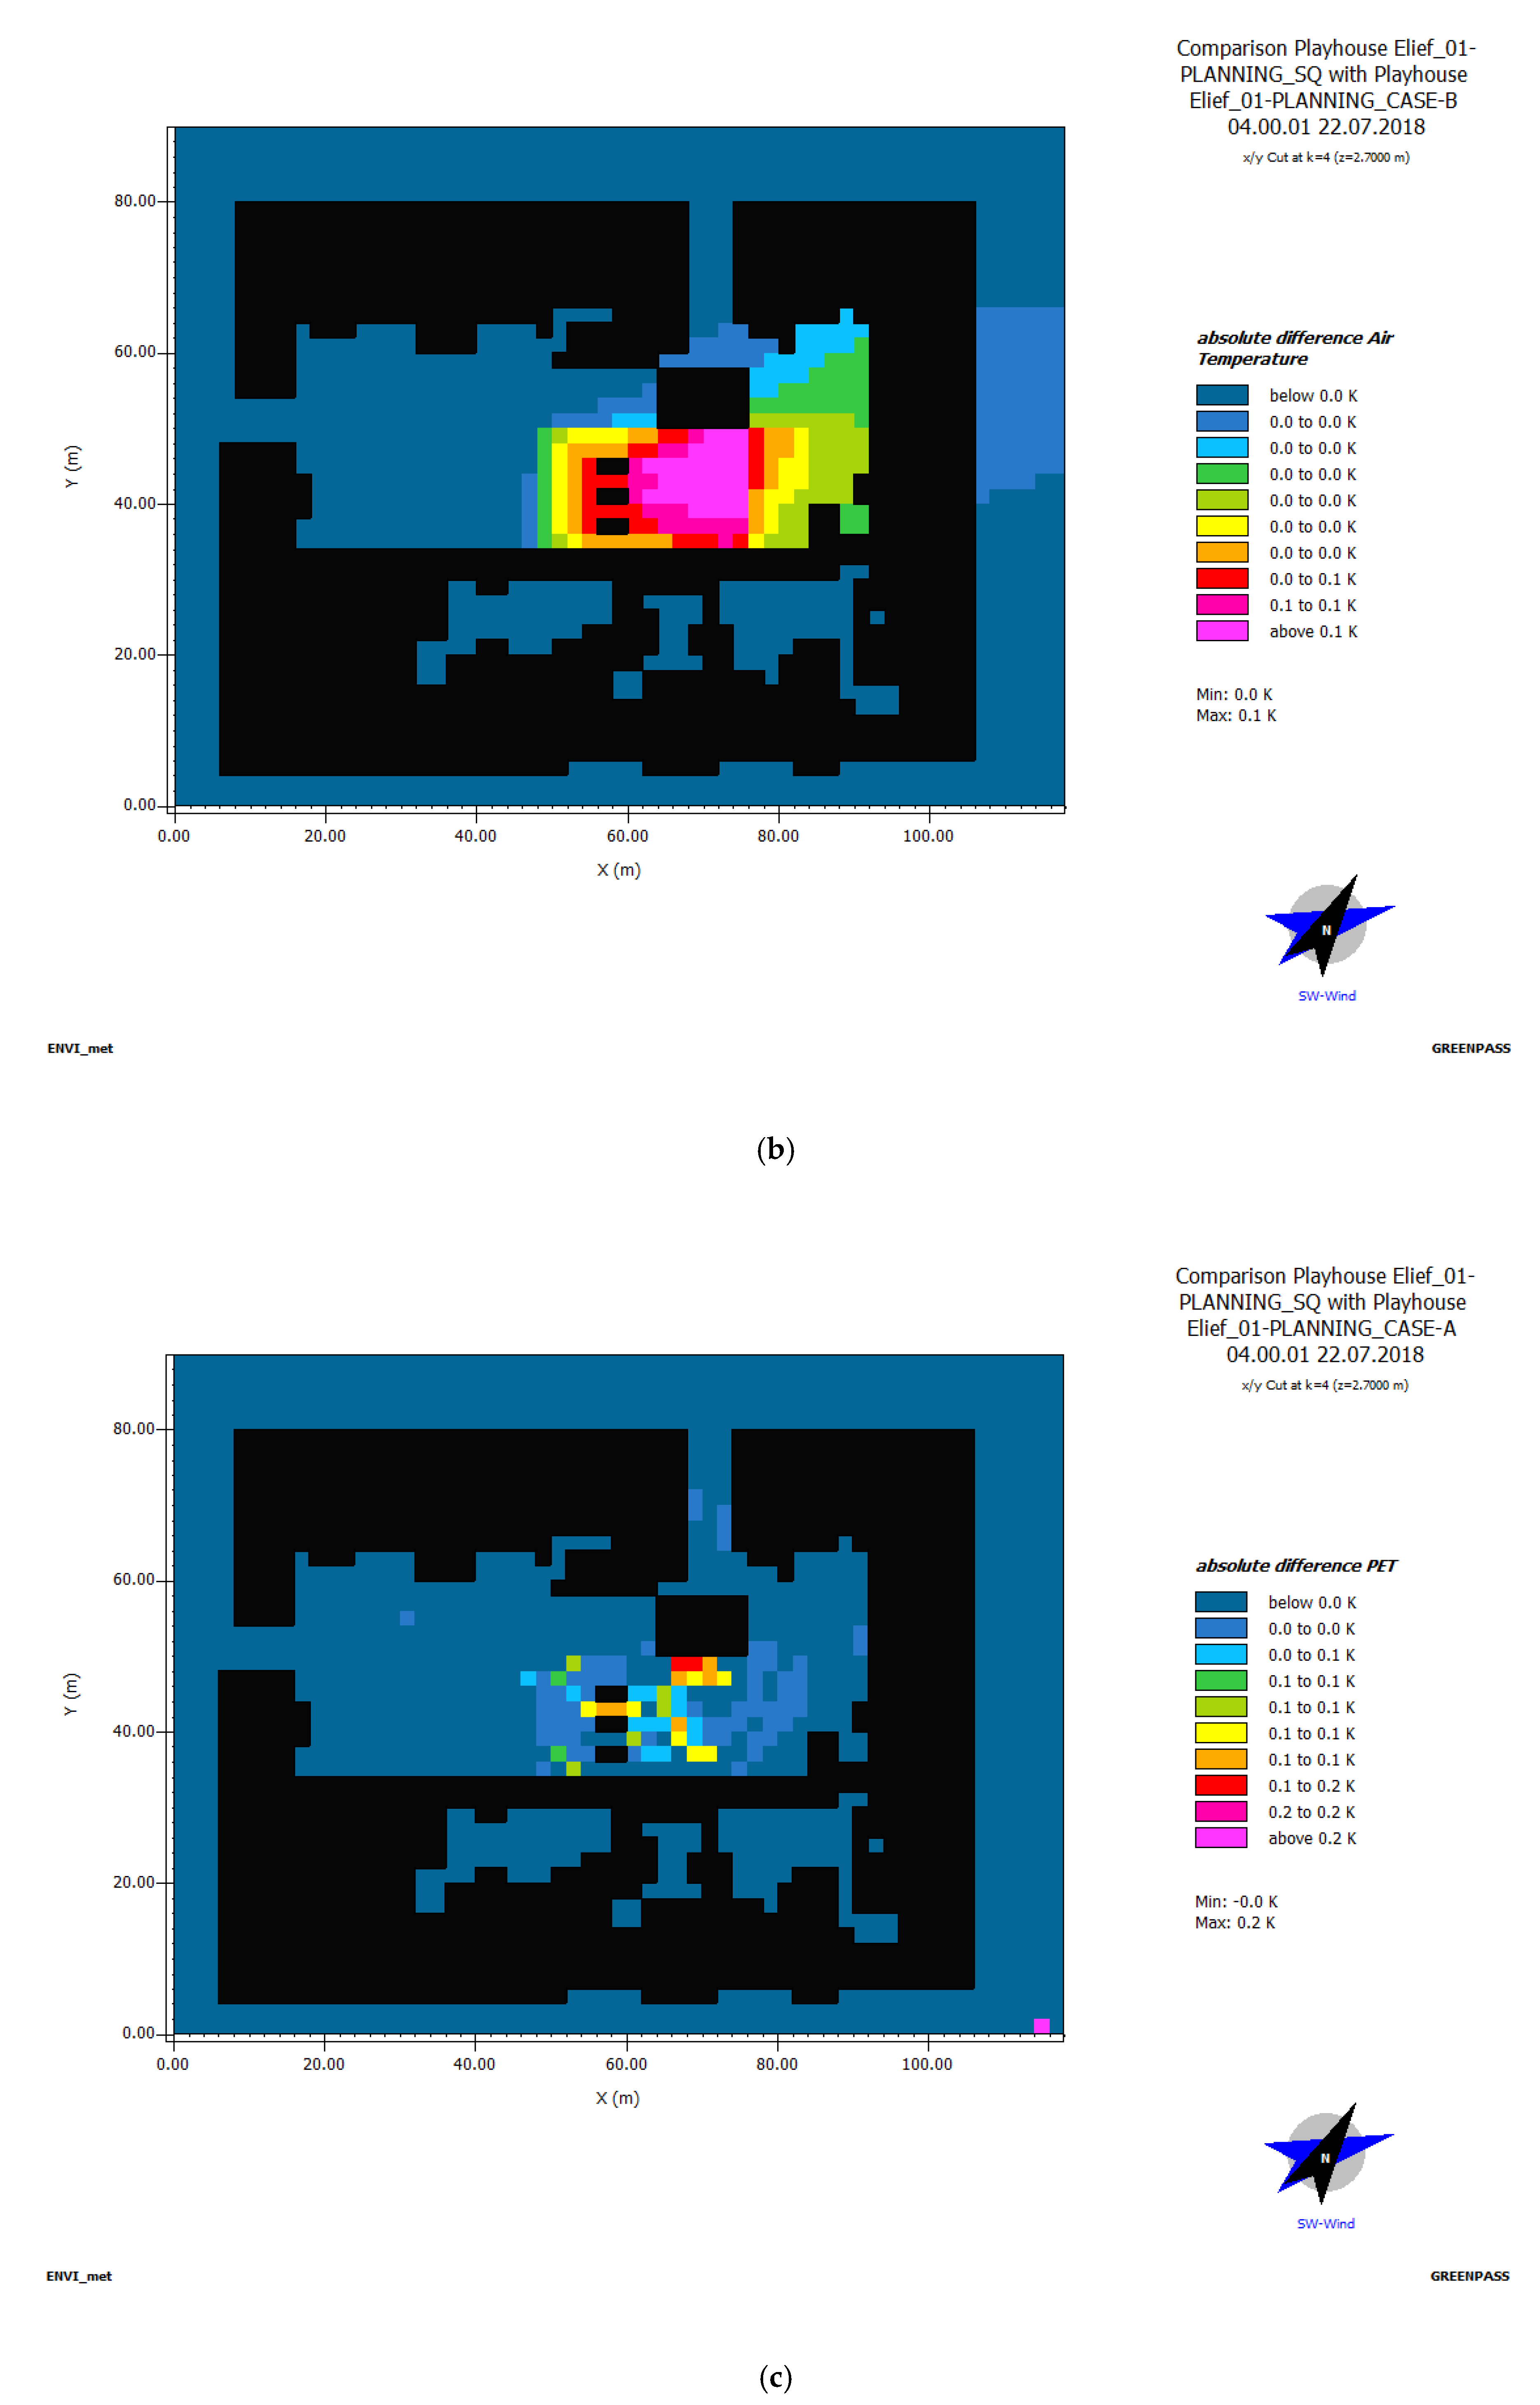
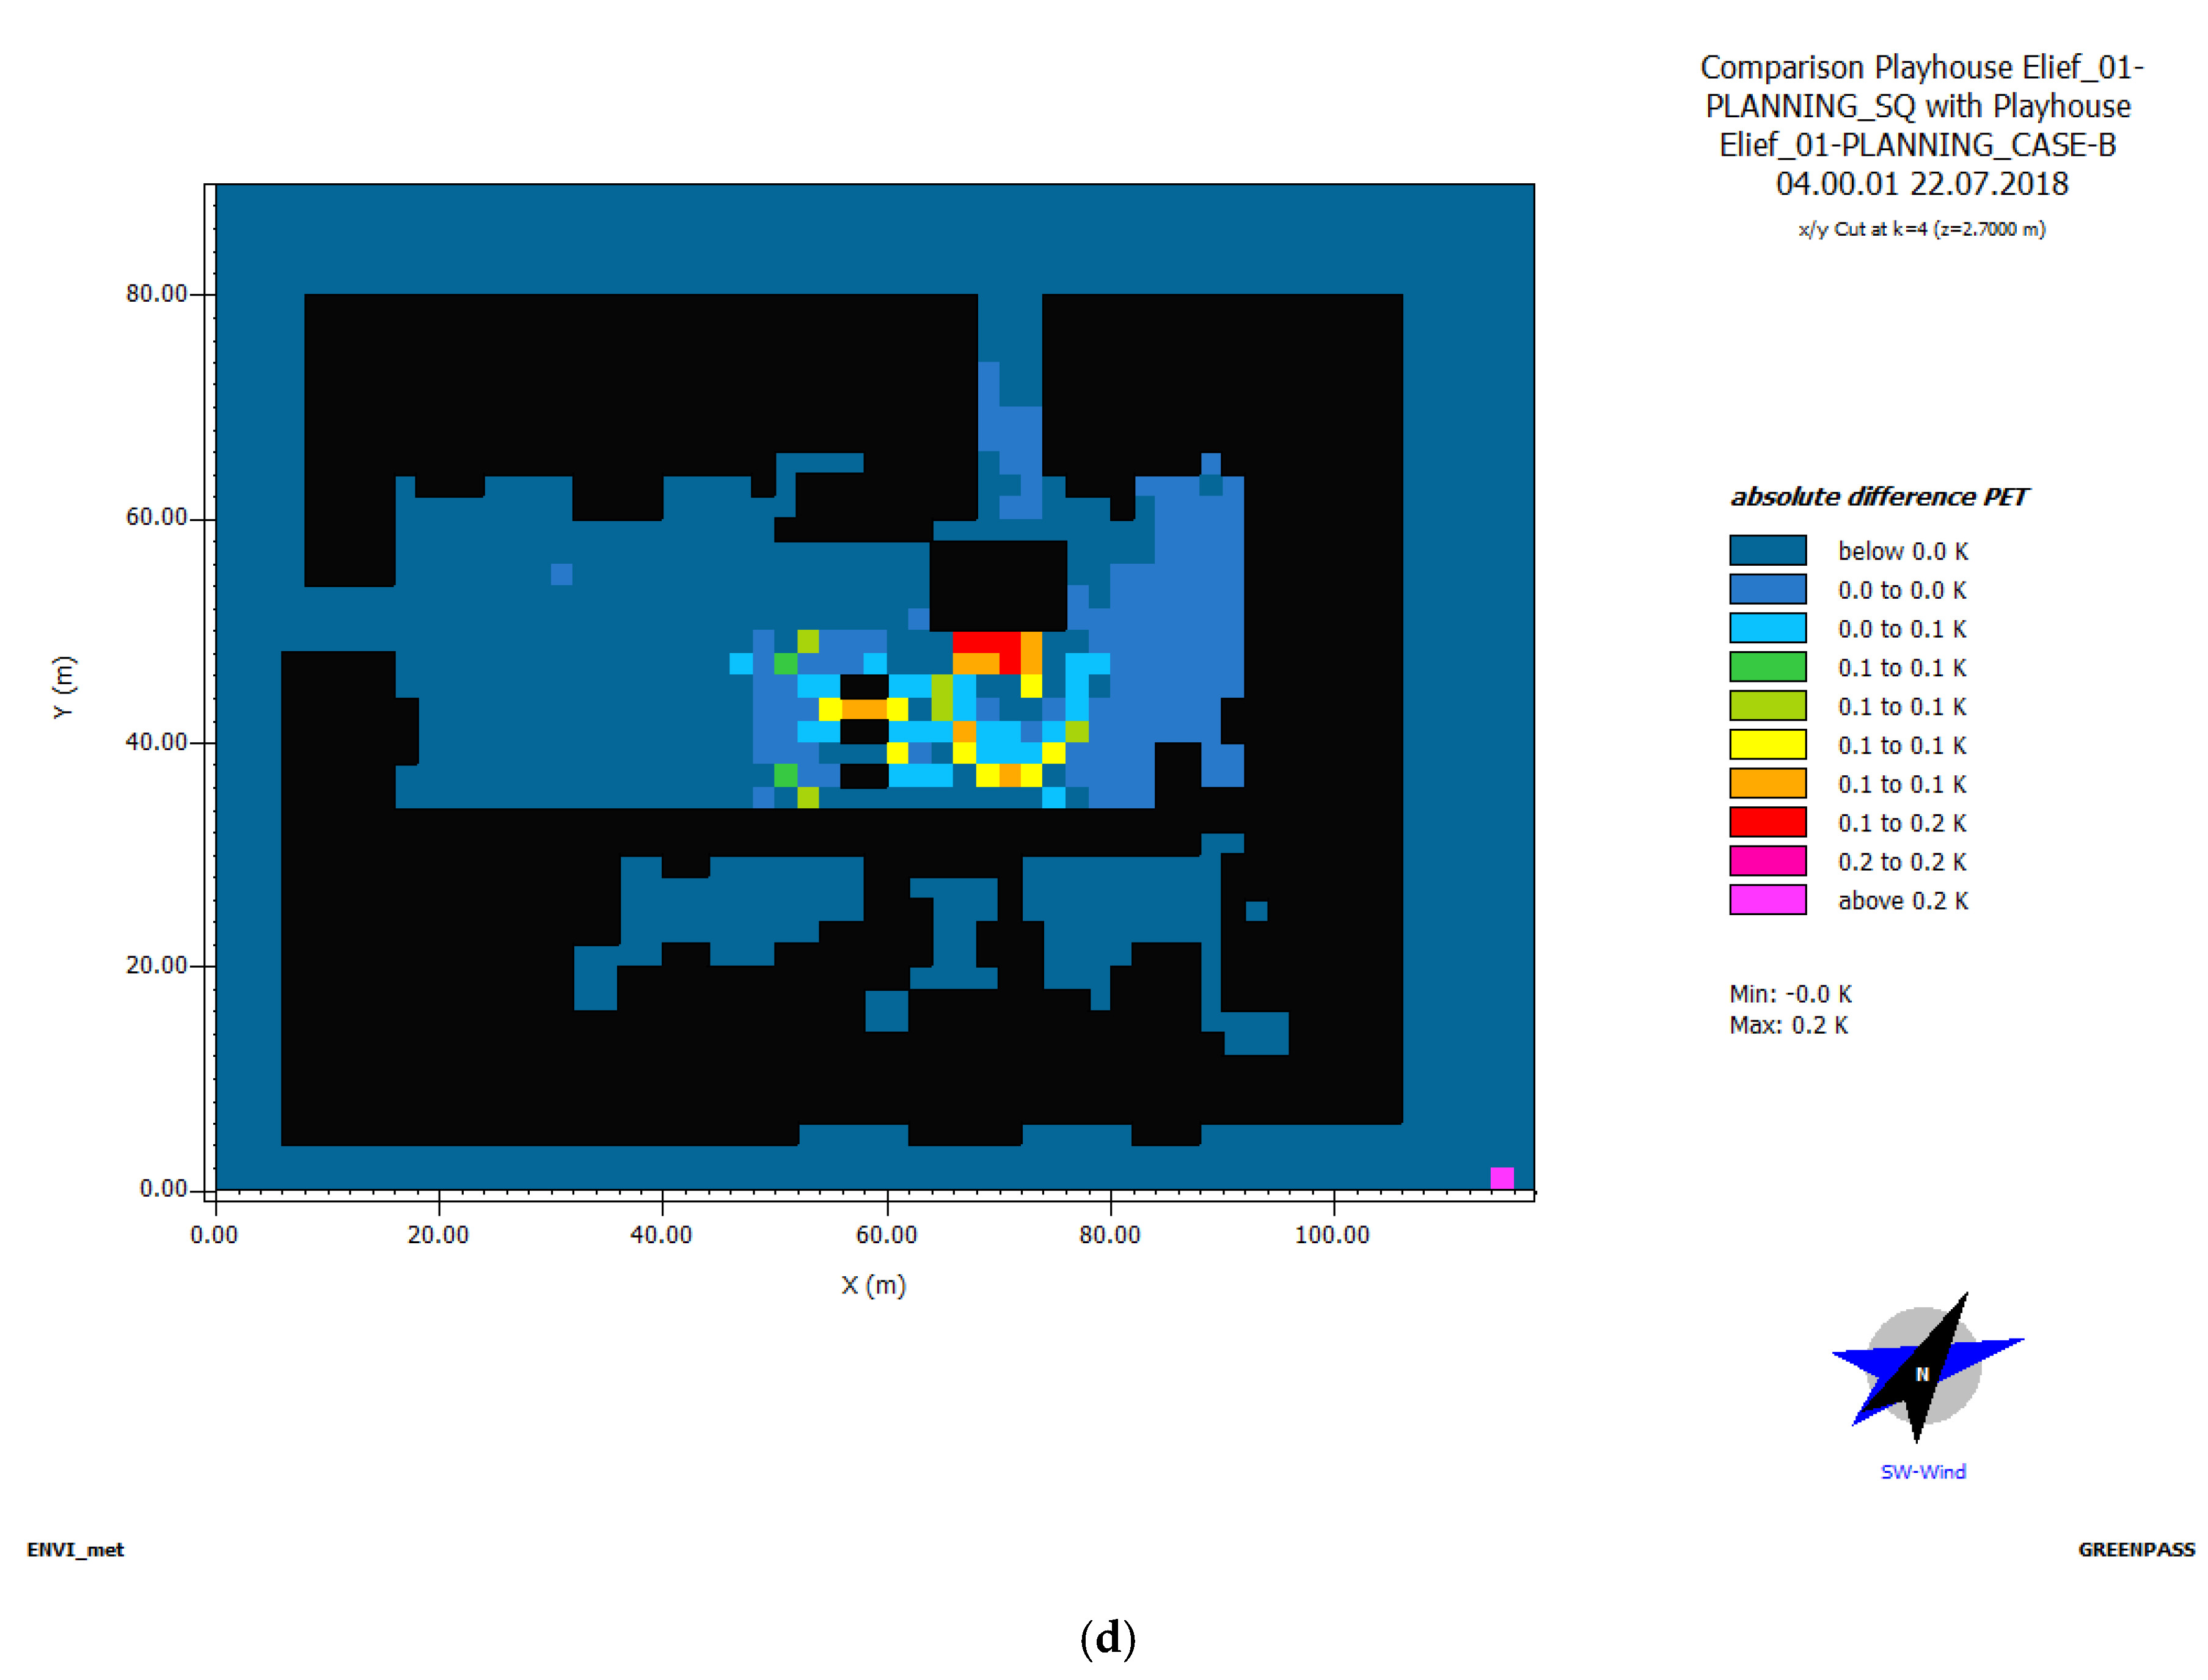
In Figure 9 the difference of air temperature is shown. The Status Quo Variant was compared either to design Variants A and B, on ground and roof levels at 15:00. Figure 9a shows a large-scale air temperature difference between the Status Quo and planning Variant A scenario of up to 0.5 °C at the roof level at 15:00. Compared to that, planning Variant B gained an air temperature difference of up to 0.7 °C on roof level (Figure 10c). The comparison regarding the PET at the roof level shows that Variant A had an absolute difference of up to 0.6 °C at 15:00 (Figure 9d) while Variant B had a larger sized performance difference regarding the PET of up to 0.7 °C at the same time (Figure 9f). The implementation of one of the green roof designs would even have impacts on the ground level by up to 0.1 °C PET reduction for Variant A (Figure 9c) and up to 0.2 °C PET for Variant B (Figure 9e), compared to the actual situation and due to the low building height.
Table 1 summarizes the difference of AT and PET variation of Status Quo with the different design Variants A and B at the ground (1.5 m) and roof level (2.7 m) at day (15:00) and night-time (04:00), extracted out of results expressed in Figure 9 and Figure 10.
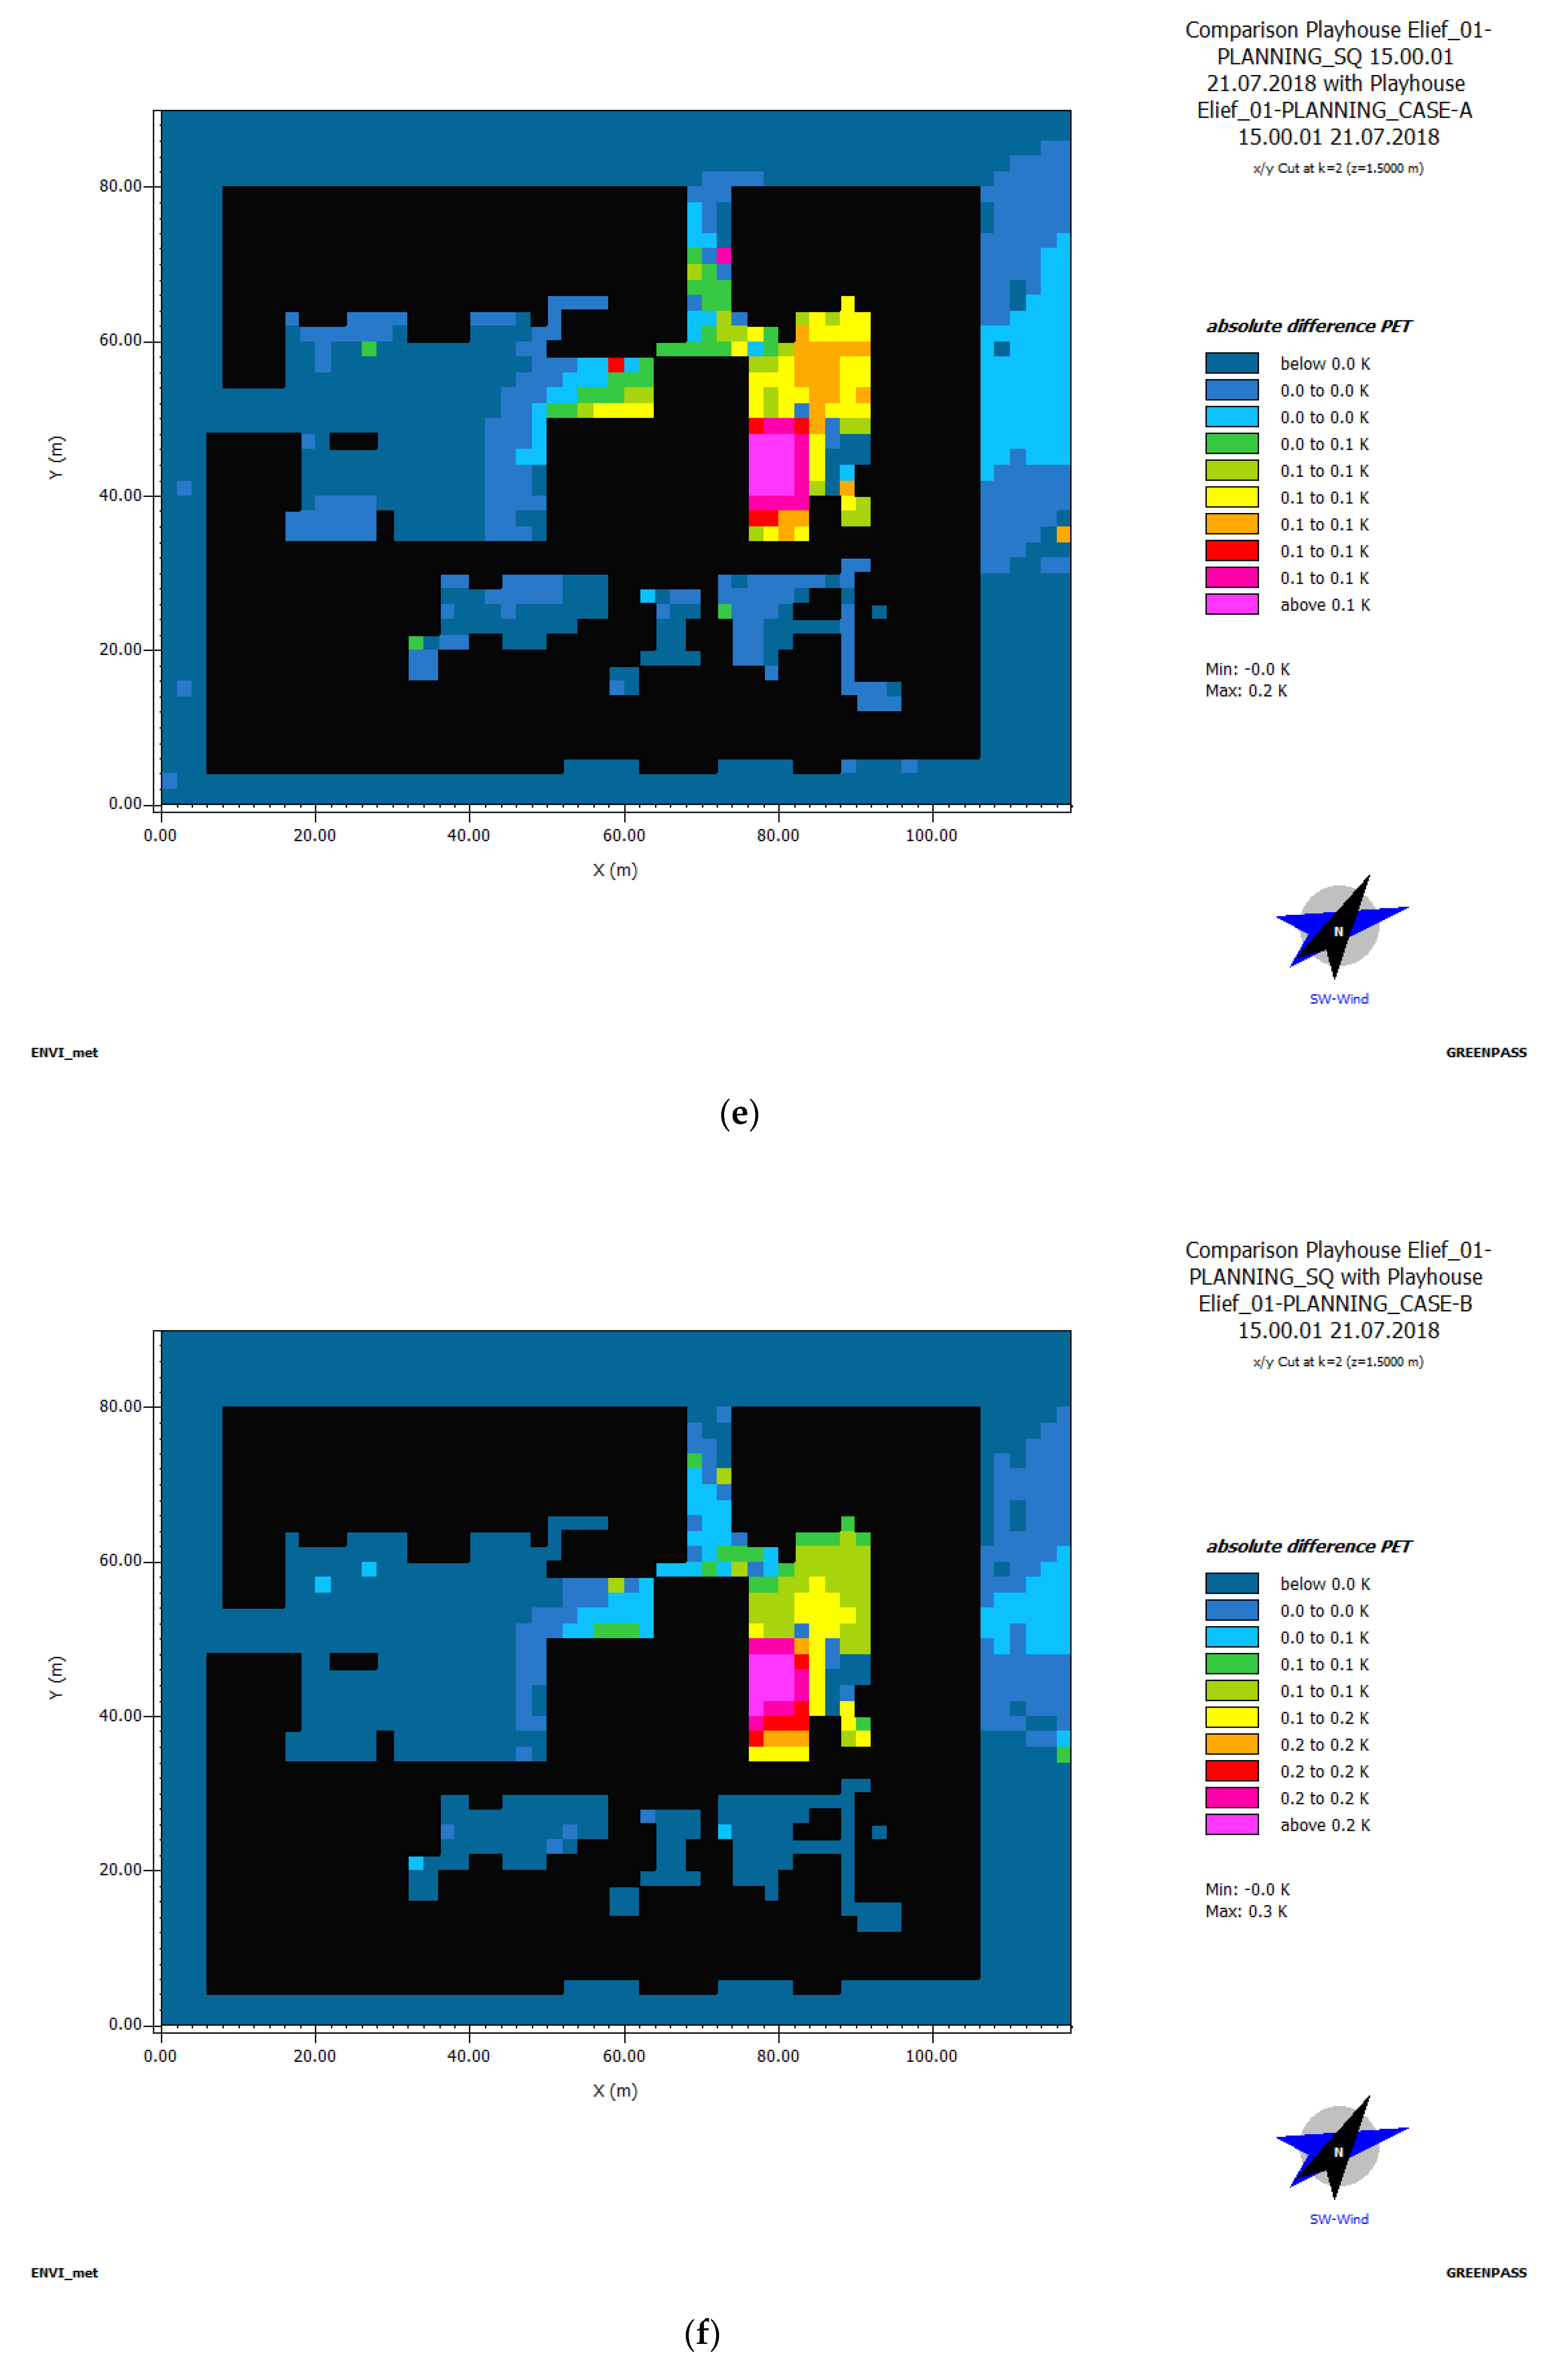
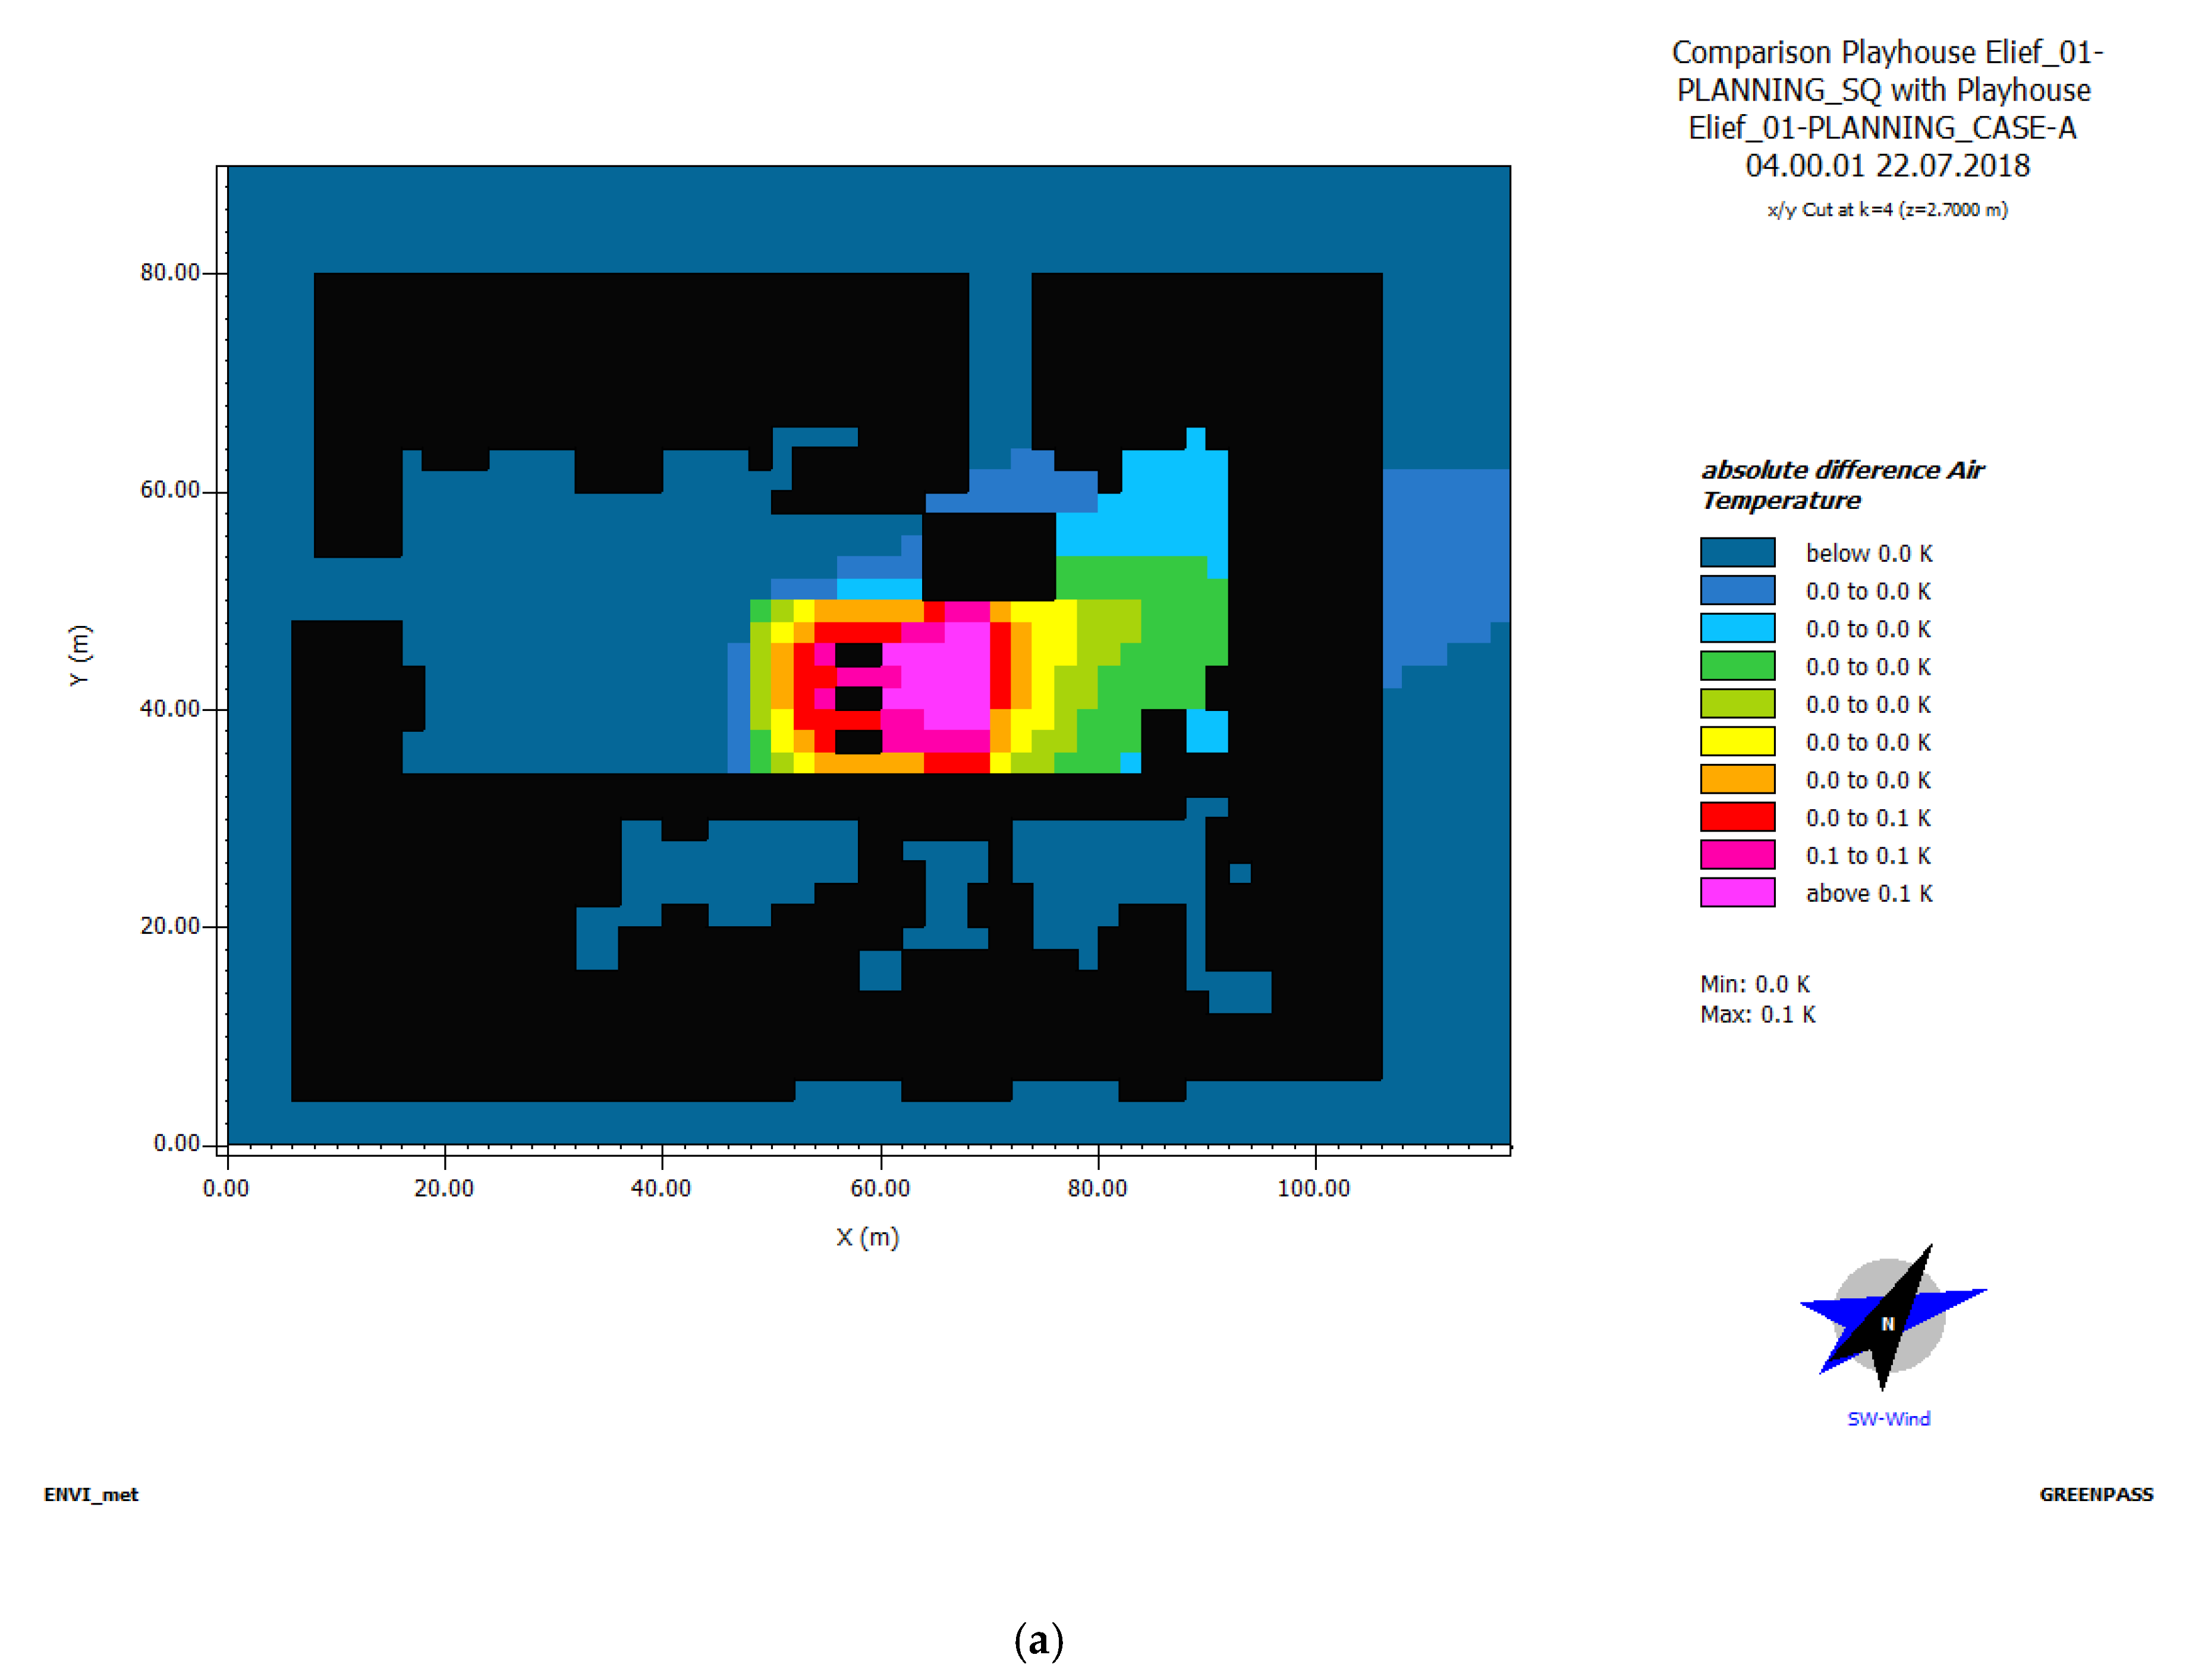
Also at night-time, the planning variants brought a reduction in air temperature and PET, compared to the actual situation. Both planning Variants A and B had an air temperature reduction of up to 0.1 °C (Figure 10a,b) and of up to 0.2 °C PET (Figure 10c,d). Regarding night-time cooling the green roof designs thus also had a slightly higher performance than the actual situation.
In extension, the indoor air temperature (IAT) has also been analyzed for the whole building’s body and volume (with abstraction of no inner differentiation of rooms and windows) to show the impact of green roof installation on the building’s indoor environment, by using ENVI-met® simulation software.
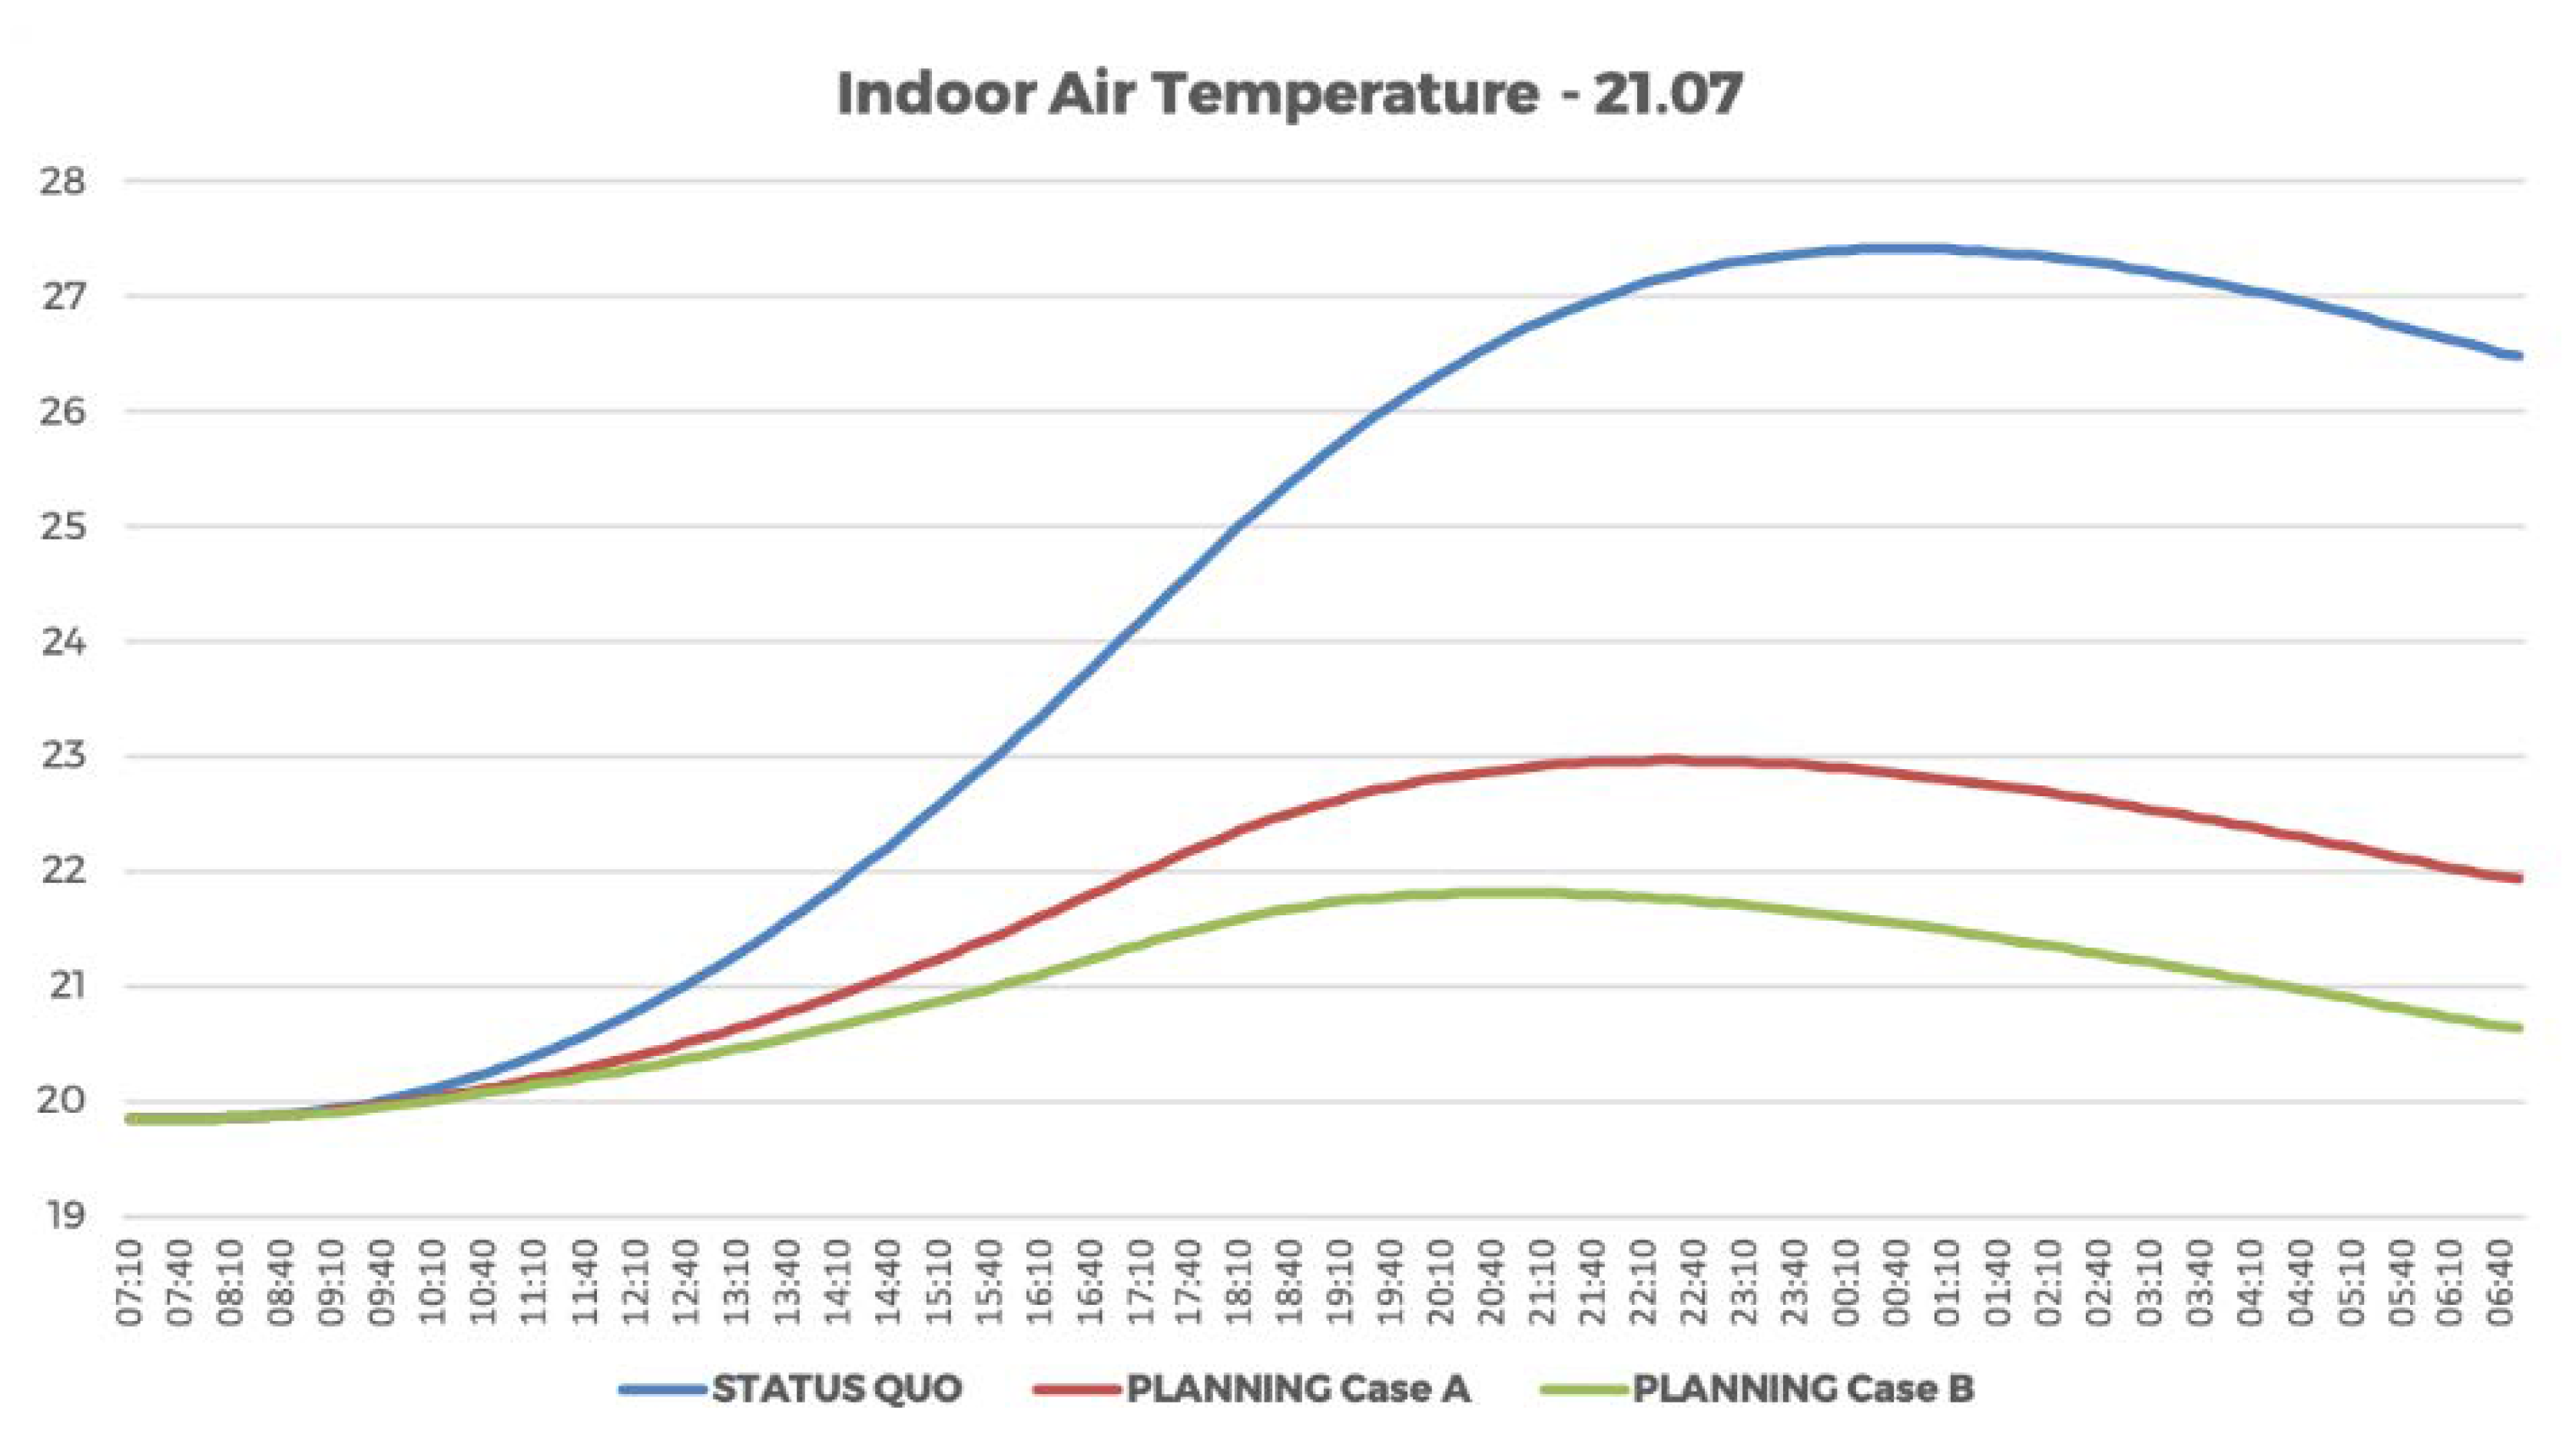
The following Figure 11 shows, that the Status Quo building would reach on a typical hot summer day more than 27 °C IAT in its peak at 12:00 (from an indoor air temperature of 19.8 °C, at simulation start), which was a significantly higher load, compared to the greened reference scenarios, Variants A and B (Figure 11 and Table 2) with approximately 23 °C (Variant A) and approximately 22 °C (Variant B) in their peaks at the evening.
The implementation of the extensive green roof served a reduction of the IAT by more than 5 °C at the peak and following, indicating a higher indoor comfort for the users in summer-time.
The difference in the mean IAT shows, that the green roof planning Variant A had, on a typical hot summer day with 21.74 °C, a 2.63 °C lower air temperature load within the building. While the entire greened Variant B had, with a 3.38 °C lower mean IAT, even a more respectable higher performance, both Variants A and B will cool the building in summer days through the green roof installation (Table 2).
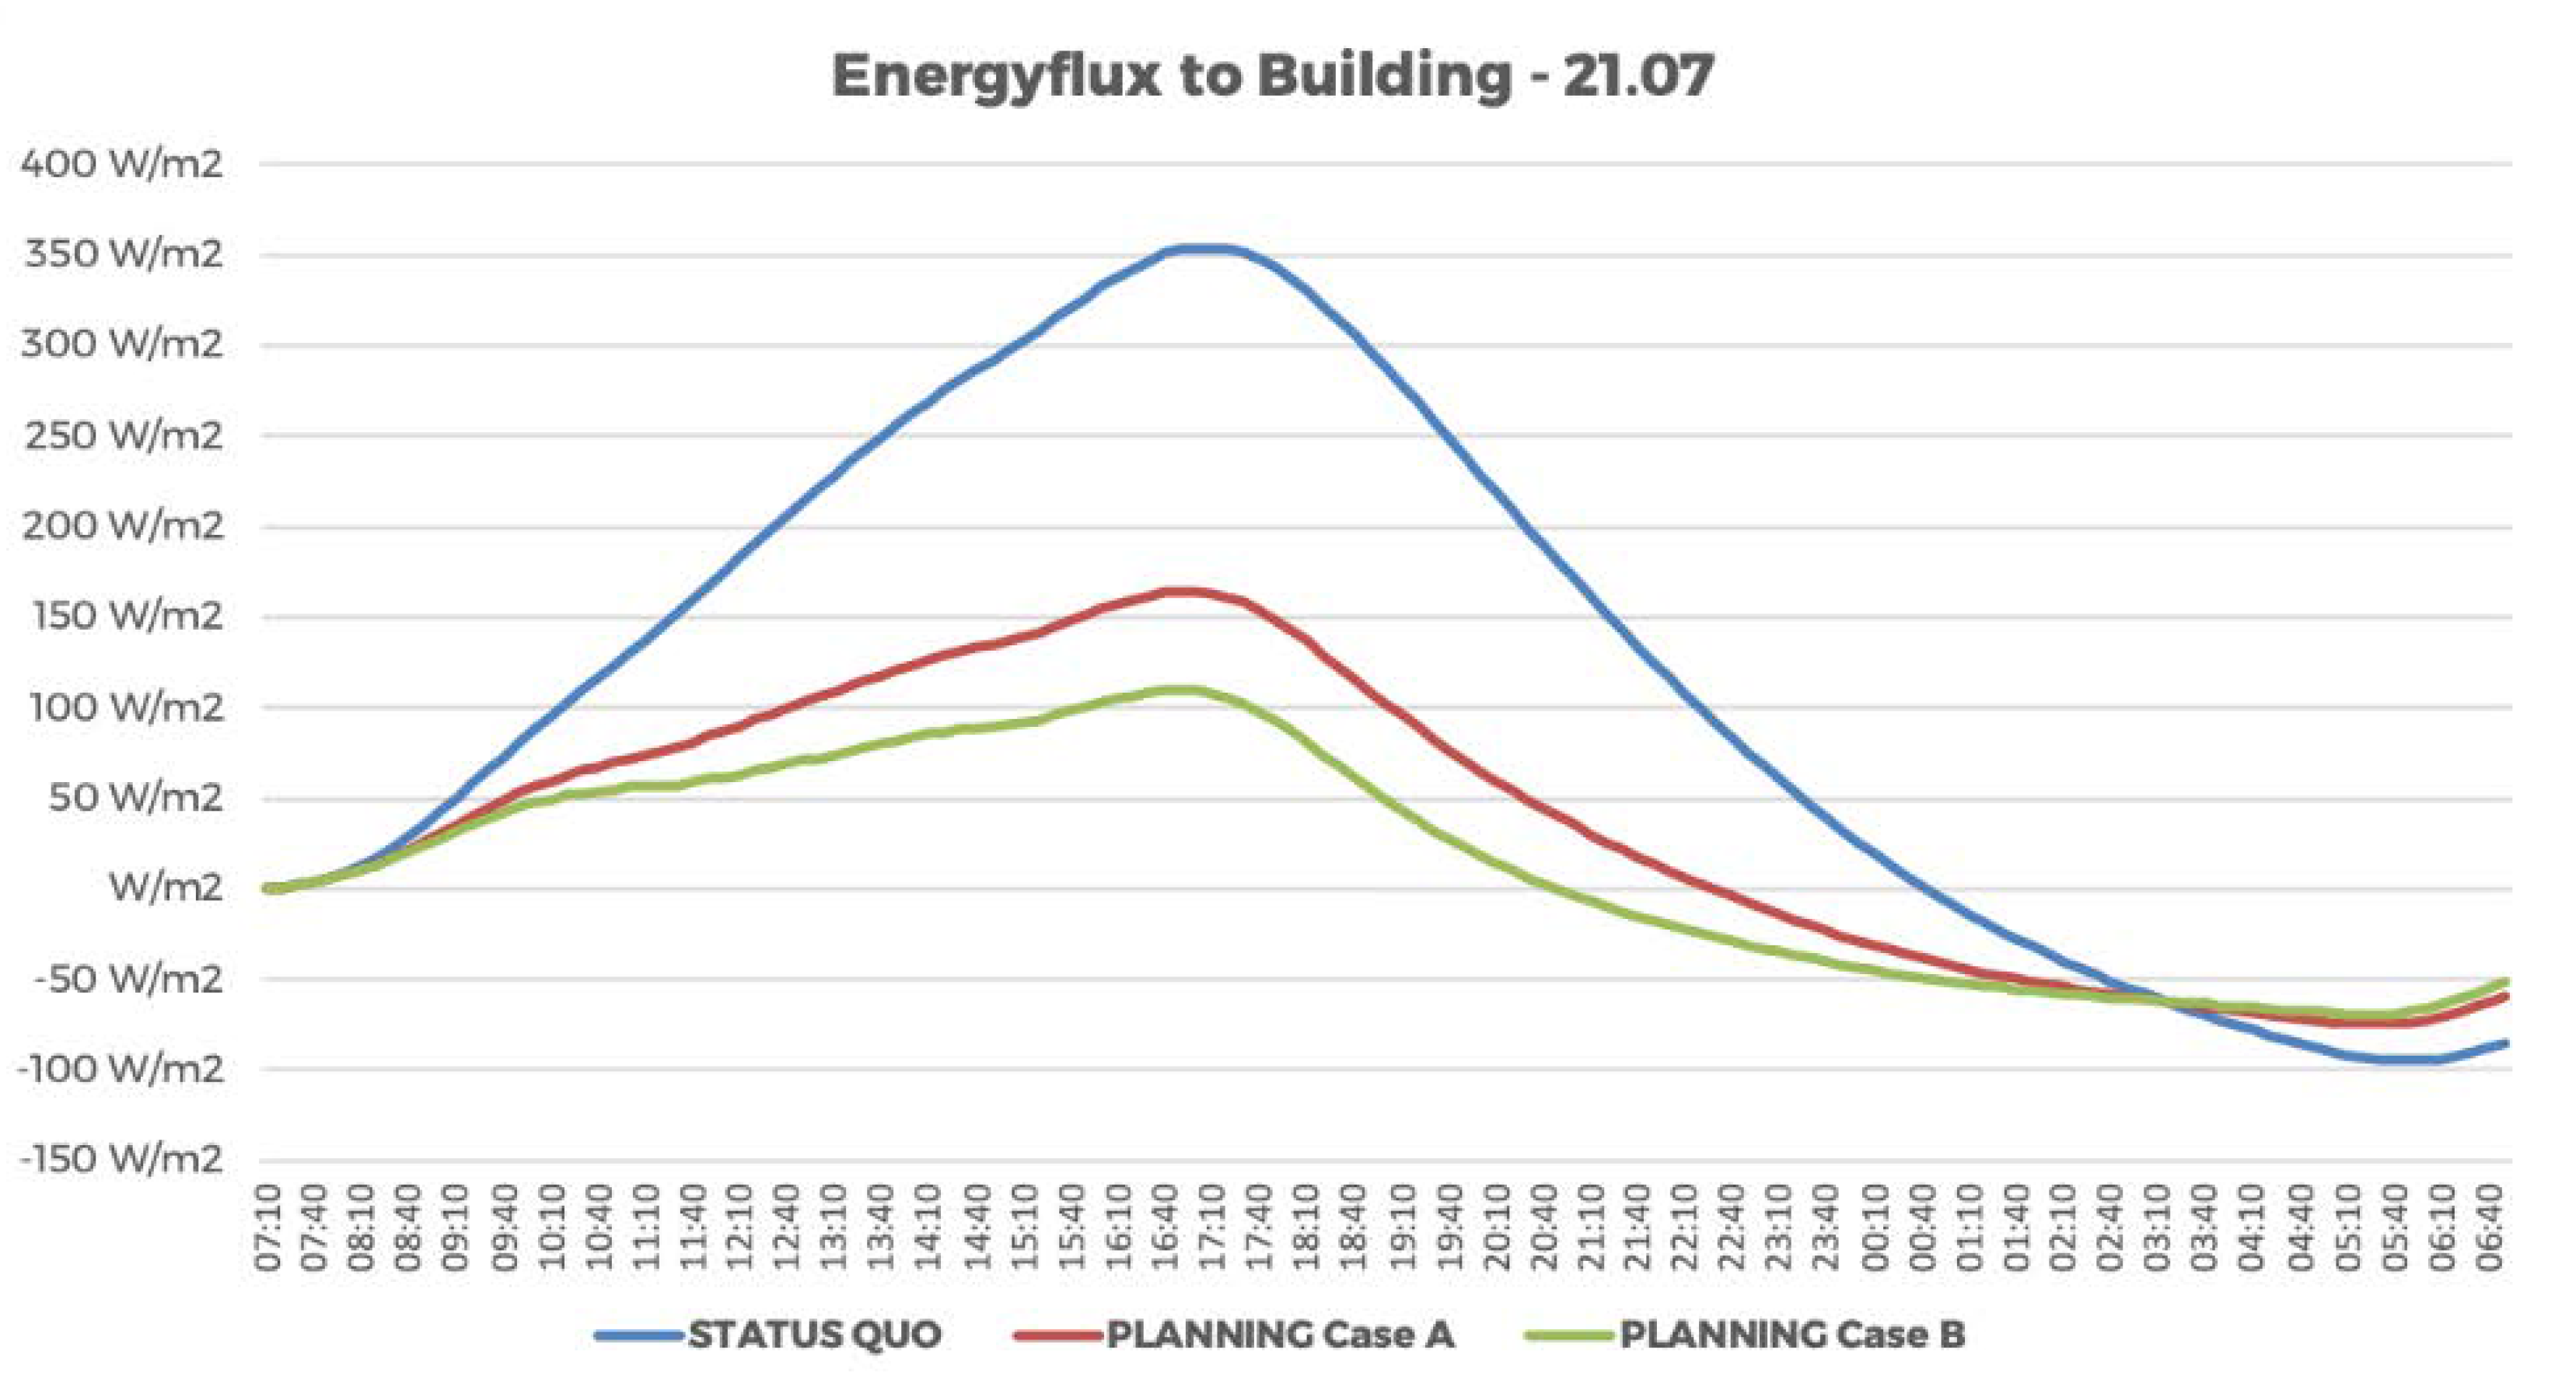
Furthermore, the energy flux (EFB) of the entire building was analyzed for the different variants. Figure 12 shows that the Status Quo building at the same time had, with approximately 350 W/m2 at approximately 17:00, the highest energy flux of the building, compared to the greened planning designs Variant A (with approximately 150 W/m2) and Variant B (with approximately 100 W/m2) at their peaks.
The Status Quo building had, with more than 16,000 W/m2 in sum, a significantly higher energy flux of the building on a typical hot summer day, compared to the greened planning design Variant A with approximately 5000 W/m2 and Variant B with approximately 2000 W/m2 (Table 3).
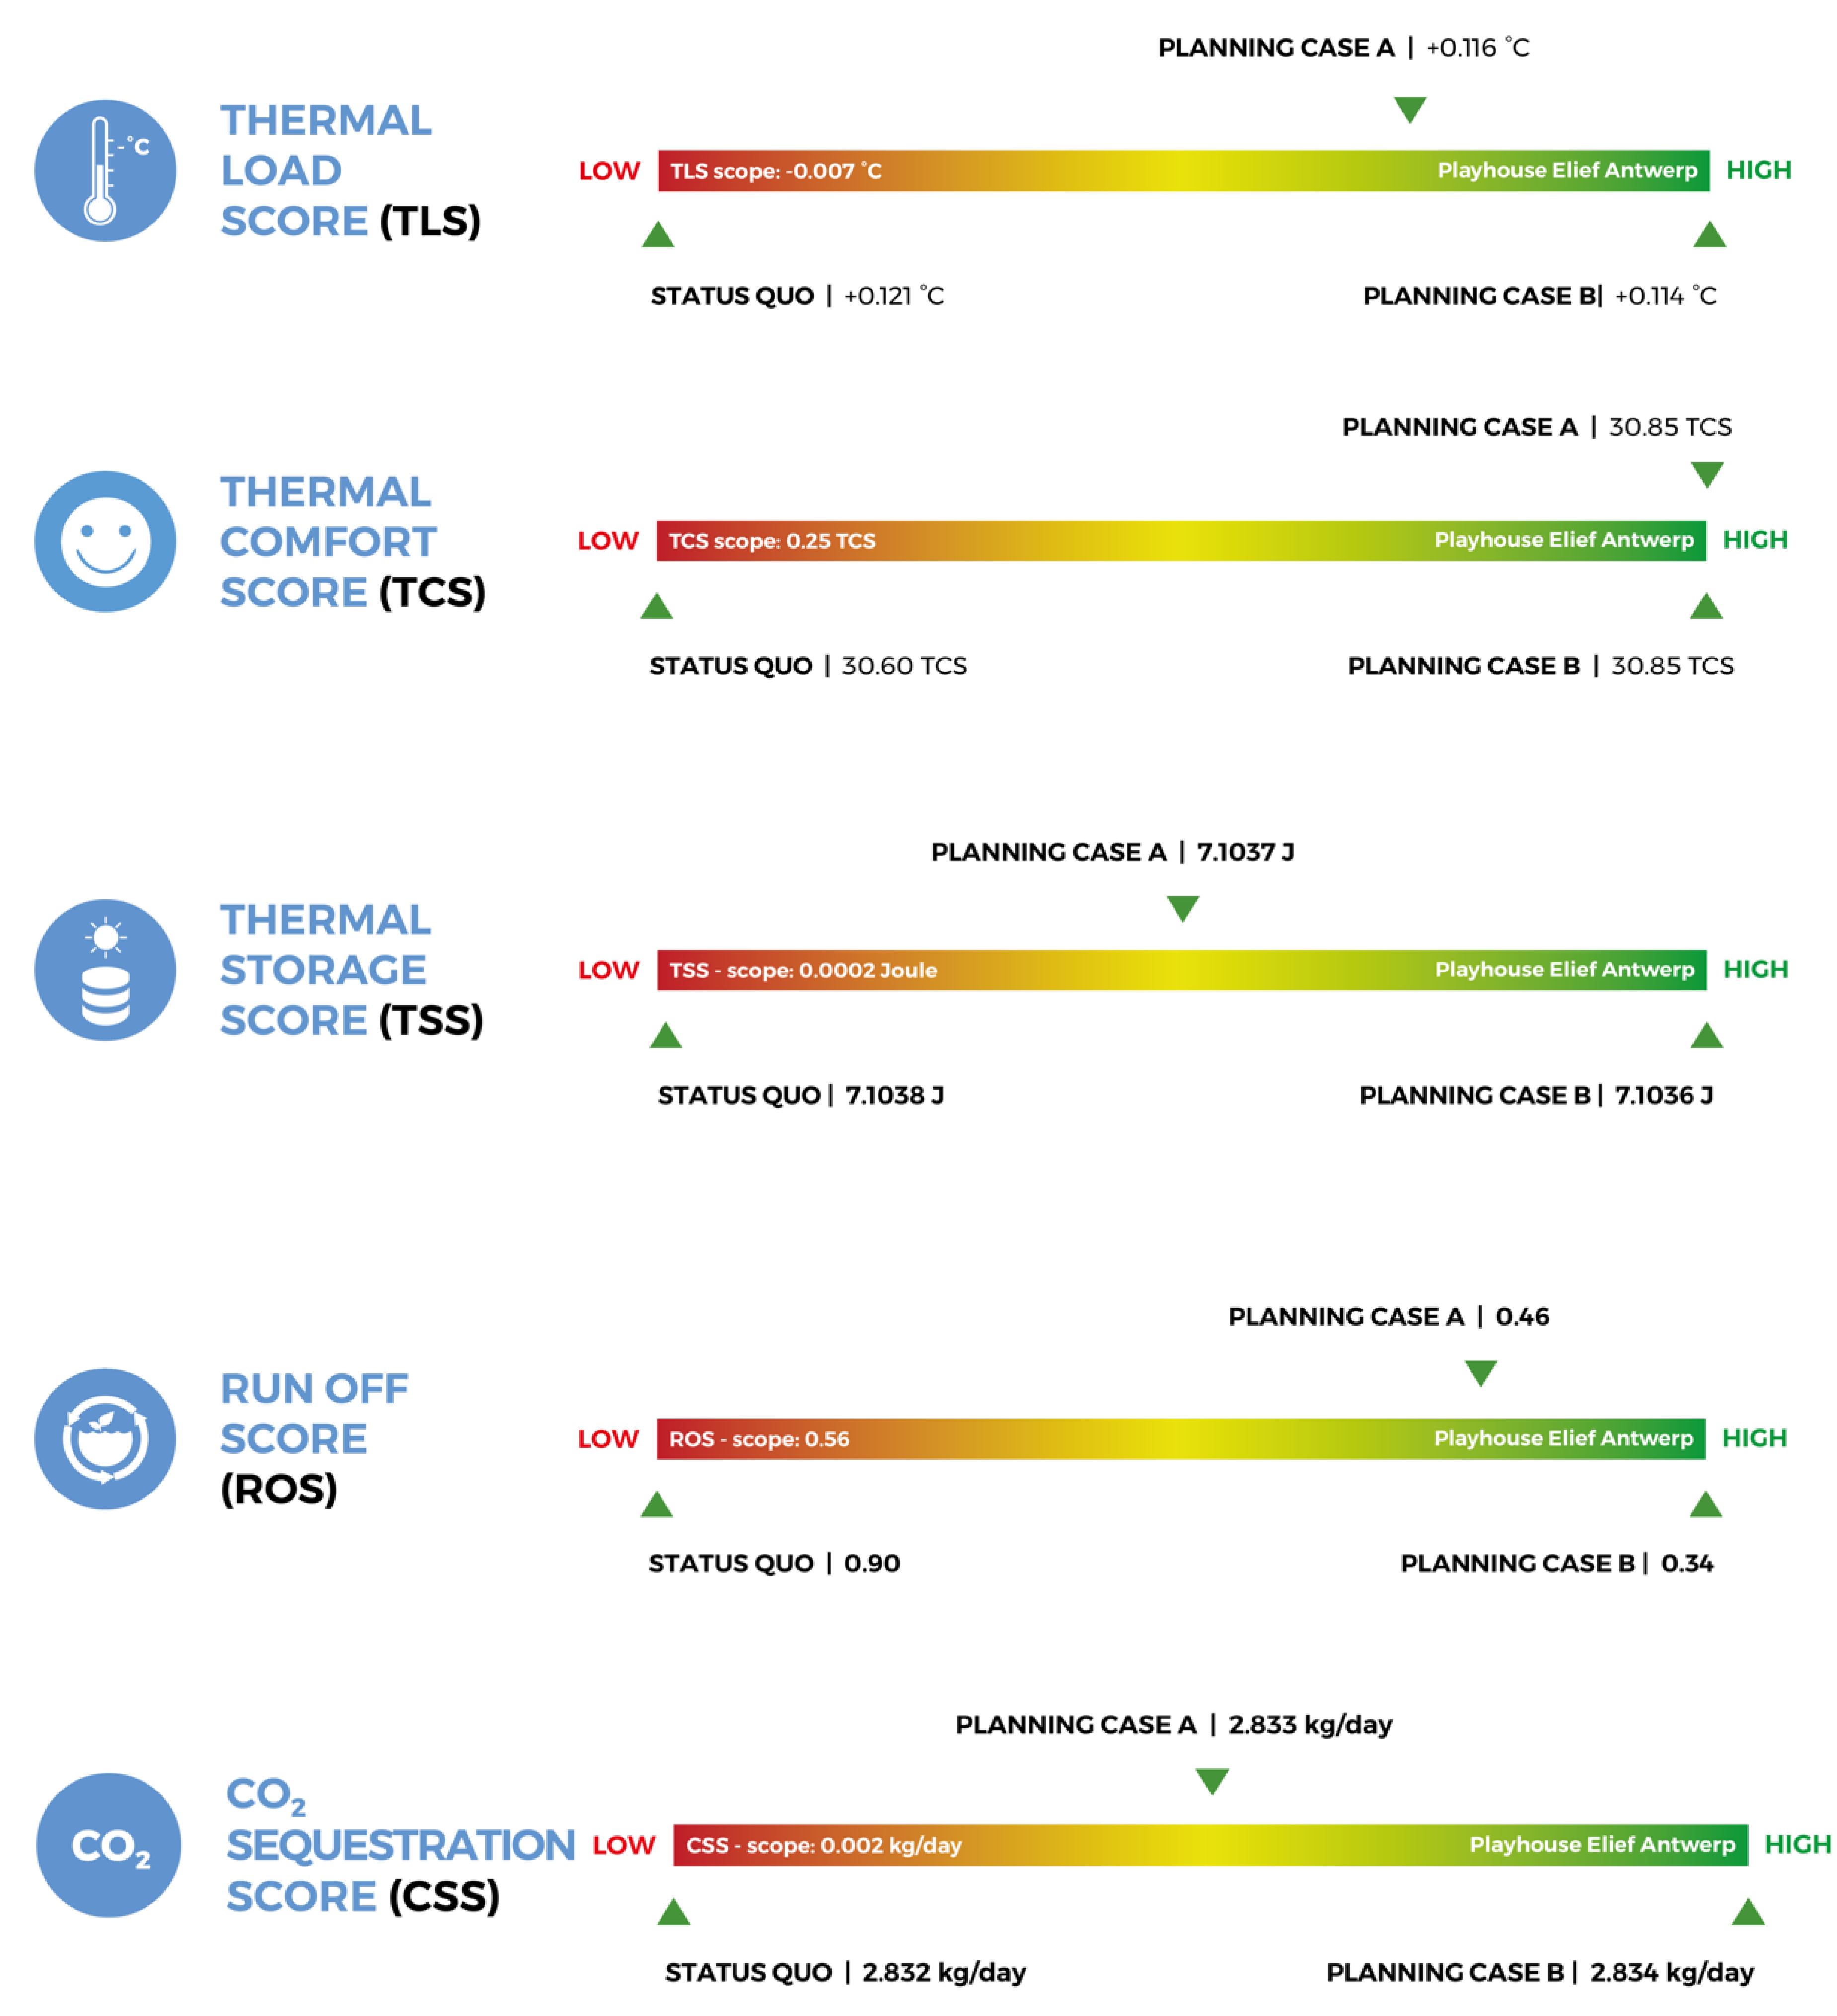
Figure 13 shows the results of the KPSs of the two green roofs designs compared to the status quo situation.
The application of only approximately 440 m2 of green roof in a project area of approximately 10,800 m2 led to a slightly reduced temperature of the out-streaming air body compared to Status Quo. Only 4% of the total project area constructed as green roof resulted further in an improved TCS of 30.85 at roof level. The storage of energy of the whole project simulation model could be reduced by the installation of the green roof Variants A or B. The runoff is improved significantly for the roof from the actual 0.9, to 0.46 for Variant A and 0.34 for Variant B, and showed the performance of greened roofs regarding water retention. The rather shallow green roofs with extensive greening (mostly succulents) added only 2 grams carbon sequestration performance per day to the existing greenery within the project area (Figure 13).
4. Results and Discussion
This paper presents the results of an impact assessment of different design variants of a playhouse in Antwerp. The design variants of Status Quo situation, green roof Variant A and green roof Variant B have been analyzed using the GREENPASS® method, a planning and optimization tool for design decision-making with a focus on a typical hot summer day.
It is shown, that already only a 440 m2 green roof implementation in a rough surrounding derives an improvement regarding the urban challenges of climate, water, air and energy. The effects may appear limited in some respects e.g., climate. However, one has to bear in mind that the green roof area covers only approximately 4% of the total project area.
Both green roof variants showed better performance potential than the actual Status Quo regarding the urban challenges of climate (TLS, TCS, AT), water (ROS), air (CSS) and energy (TSS, IAT, EFB). Apart from this, a green roof derives numerous other positive impacts and improvements on the environment, humans and buildings. In a direct performance comparison of the two design Variants A and B, Variant B delivers obvious advantages and larger impacts, due to better results for all considered KPSs and KPIs.
4.1. Urban Challenge of Climate: Thermal Comfort on Pedestrian Level
The impact assessment of the green roof designs regarding thermal comfort at the pedestrian level result in an improvement of 0.1 to 0.2 °C. Peng and Jim [27] published their investigation on that topic in 2013. Zhang et al. [28] found a reduction of air temperature at the pedestrian level of 0.1 to 0.3 °C. Both support and approve the findings of the presented paper. Ng et al. [29] as well as Rosenzweig [31] in contrast concluded that green roofs have only a neglectable influence on the thermal comfort at the pedestrian level. One has to bear in mind that they derived their findings from simulations performed for areas dominated by high rise buildings, compared to Elief Playhouse.
4.2. Urban Challenge of Water: Runoff
Regarding urban challenge of water, the green roof installations have a huge impact, compared to the actual Status Quo according to the performed assessment. The results are not surprising when considering that a bitumen foil roof barely retains water, while green roofs can store water in return. According to the Austrian standard [20] typical for green roofs, a run-off coefficient for every type of green roof (extensive, intensive, etc.) is requested. Greenings with more than 10 cm have to reach a runoff coefficient of 0.3. The calculated ROS for the extensive greened designs is close to this requirement and only varies slightly, due to further consideration of non-greened project (roof) area too. The relevance of green roofs for sustainable urban water management has also been addressed in many papers in recent years [21,22,23,24].
4.3. Urban Challenge of Energy: Indoor Air Temperature and Energy Flux
Especially in terms of energy, both green design variants deliver a significant impact on the building. The applied methodology includes only a simplified calculation of the building’s physical processes and assumes the building being one volume and air body.
Both green roof designs reduce the mean indoor air temperature by 2.6 °C respectively 3.4 °C in a timespan of only 24 h. The energy flux into the building compared to the actual Status Quo is reduced to less than 1/3 for Variant A and approximately 12% for Variant B. Building physical investigations of green roofs regularly reveal their building physical potential. Papers and scientific thesis as published by Scharf and Zluwa [40], Pitha et al. [21], Mattuschka [35], amongst others [32,33,34,41] showed comparable effects for green roofs. The papers point out that the improvement of the insulation properties of buildings obviously correlates to the initial situation. The case study analyzed in this paper was equipped with bituminous foil and only 12 cm of insulation on a concrete slab. Therefore, the results of this paper appear to be reasonable.
4.4. GREENPASS® Method
The selected method for analyses of different green roof designs and comparison to the actual situation was not applied on such a small-scale project before. The interventions of the designs affected only 440 m2 or 4% of the total simulation model area.
Nevertheless, the applied assessment method provided understandable and plausible values regarding the investigated effects of green roofs in summer. A comparison with existing related papers and projects [21,27,28,33,34,35,36,40,42,56] shows that the produced results sound feasible and can be definitely realistic, due to various outdoor and indoor field measurements of green roof impacts on the environment, human thermal comfort and the building.
In contrast to standard microclimate simulations, the GREENPASS® method provides not only AT and PET maps, etc., but provides a series of KPSs and KPIs presented in Figure 13. These indicators allow a good understandability and comparability even for non-experts. The paper confirmed that the indicators actually illustrate the partly minimal differences between the design variants that can hardly be seen on the maps.
These two aspects allow a clear understanding of what impact the chosen designs will have and how the performance of a project regarding the urban challenges of climate, water, air and energy can be influenced and optimized. The method delivers results that allow fact-based decision-making and can be used for (public) communication purposes. The method in its standardized form does not aim a seasonal study, since it is not common in terms of microclimate analysis. The practical method is standardized focusing on a typical hot summer day with a time scale of 24 to 72 h (depending on the grade of detail) and is thus limited to results for a hot summer day. As standardized, it does not deliver all-seasonal impact results, due the focus on the microclimate common to the urban heat issue, but still enabling fact-based design decision-making for climate-resilient urban development and architecture.
The method further does not replace a detailed long-term building physics expert analysis, but rather delivers first rough results as a decision-making basis regarding the building’s performance in summer by considering the needs and possibilities in urban design stages, where a detailed analysis within the concept phase is often not expedient due a restricted grade of detail for building materials.
To become all-seasonal impacts results of the measures regarding the urban and building thermal complex and interdependencies beyond the summer focus, a more detailed and diurnal analysis for seasonal or a yearly period is needed.
5. Green Roofs and Greenpass—Conclusions
The presented project and assessment revealed that even small green roofs (only 4% of total area) derive significant and valuable effects on climate resilience regarding water retention, building physics and thermal comfort at the pedestrian level.
The applied GREENPASS® method is efficient for assessment of design impacts for providing reliable and (in line with thematically related papers) easily understandable results regarding the project performance related to different urban challenges, serving for fact-based decision-making and communication and specially focusing on the urban heat topic.
The presented project underlines the relevance of green roofs in the context of urban energy and water balance. Even small green roofs contribute significantly to the building, climate and neighborhood in summer. However, a significant city-wide effect can be achieved only when a network of green roofs and other green infrastructures is installed within the urban fabric [36]. Thanks to new planning and design support tools, such as the presented GREENPASS® method, these effects can be assessed precisely and optimized within the planning phase.
Author Contributions
Both authors have contributed to all chapters.
Funding
This research was funded by the City of Antwerp in the frame of Stadslab2050.
Acknowledgments
Thanks to City of Antwerp and Dusty Gedge for their support.
Conflicts of Interest
The authors declare no conflict of interest.
References
- United Nations. Transforming Our World: The 2030 Agenda for Sustainable Development; A/RES/70/1; United Nations: New York, NY, USA, 2015. [Google Scholar]
- Intergovernmental Panel on Climate Change. Global Warming of 1.5 °C; An IPCC Special Report on the Impacts of Global Warming of 1.5 °C above Pre-Industrial Levels and Related Global Greenhouse Gas Emission Pathways, in the Context of Strengthening the Global Response to the Threat of Climate Change, Sustainable Development, and Efforts to Eradicate Poverty; IPCC: Geneva, Switzerland, October 2018; ISBN 978-92-9169-151-7. [Google Scholar]
- Noble, I.R.; Huq, S.; Anokhin, Y.A.; Carmin, J.; Goudou, D.; Lansigan, F.P.; Osman-Elasha, B.; Villamizar, A. Adaptation needs and options. In Climate Change 2014: Impacts, Adaptation, and Vulnerability. Part A: Global and Sectoral Aspects; Contribution of Working Group II to the Fifth Assessment Report of the Intergovernmental Panel on Climate Change; Field, C.B., Barros, V.R., Dokken, D.J., Mach, K.J., Mastrandrea, M.D., Bilir, T.E., Chatterjee, M., Ebi, K.L., Estrada, Y.O., Genova, R.C., et al., Eds.; Cambridge University Press: Cambridge, UK; New York, NY, USA, 2014; pp. 833–868. [Google Scholar]
- Revi, A.; Satterthwaite, D.E.; Aragón-Durand, F.; Corfee-Morlot, J.; Kiunsi, R.B.R.; Pelling, M.; Roberts, D.C.; Solecki, W. Urban areas. In Climate Change 2014: Impacts, Adaptation, and Vulnerability. Part A: Global and Sectoral Aspects; Contribution of Working Group II to the Fifth Assessment Report of the Intergovernmental Panel on Climate Change; Field, C.B., Barros, V.R., Dokken, D.J., Mach, K.J., Mastrandrea, M.D., Bilir, T.E., Chatterjee, M., Ebi, K.L., Estrada, Y.O., Genova, R.C., et al., Eds.; Cambridge University Press: Cambridge, UK; New York, NY, USA, 2014; pp. 535–612. [Google Scholar]
- Bastin, J.-F.; Clark, E.; Elliott, T.; Hart, S.; van den Hoogen, J.; Hordijk, I.; Ma, H.; Majumder, S.; Manoli, G.; Maschler, J.; et al. Understanding Climate Change from a Global Analysis of City Analogues; Crowther Lab, Department of Environmental Systems Science, Institute of Integrative Biology, ETH Zürich: Zürich, Switzerland; Plant Ecology, Department of Environmental Systems Science, Institute of Integrative Biology, ETH Zürich: Zürich, Switzerland; Department of Civil, Environmental and Geomatic Engineering, Institute of Environmental Engineering, ETH Zürich: Zürich, Switzerland, 2019. [Google Scholar]
- United Nations. World Urbanization Prospects: The 2018 Revision; Department of Economic and Social Affairs, Population Division: New York, NY, USA, 2018. [Google Scholar]
- European Union. Towards an EU Research and Innovation Policy Agenda for Nature-Based Solutions & Re-Naturing Cities; Final Report of the Horizon 2020 Expert Group on ‘Nature-Based Solutions and Re-Naturing, Cities’; Directorate-General for Research and Innovation; Climate Action, Environment, Resource Efficiency and Raw Materials EN, (Full Version); Publications Office of the European Union: Luxembourg, 2015; ISBN 978-92-79-46051-7. [Google Scholar]
- The European Parliament and the Council of the European Union. Directive 2010/31/EU of the European Parliament and of the councial of 19 May 2010 on the energy performance of buildings. Offi. J. Eur. Union 2010, L 153, 13–35.
- Neri, M.; Lezzi, A.M.; Beretta, G.P.; Pilotelli, M. Energy- and Exergy-Based Analysis for Reducing Energy Demand in Heat Processes for Aluminum Casting. J. Energy Resour. Technol. Trans. ASME 2019, 141, 104501. [Google Scholar] [CrossRef]
- Young, B.A.; Gabriel, F.; Zhenyu, S.; Thiele, A.M.; Wei, Z.; Narayanan, N.; Sant, G.; Pilon, D. Early-age temperature evolutions in concrete pavements containing microencapsulated phase change materials. Constr. Build. Mater. 2017, 4, 150. [Google Scholar] [CrossRef]
- Bundesministerium für Umwelt, Naturschutz, Bau und Reaktorsicherheit (BMUB) Referat Öffentlichkeitsarbeit. Weißbuch Stadtgrün, Grün in der Stadt—Für eine lebenswerte Zukunft; Brandenburgische Universitätsdruckerei und Verlagsgesellschaft Potsdam mbH, Bundesministerium für Umwelt, Naturschutz, Bau und Reaktorsicherheit (BMUB): Berlin, Germany, 2007. [Google Scholar]
- United Nations Environment Programme. Ecosystem-Based Adaptation. Available online: https://www.unenvironment.org/explore-topics/climate-change/what-we-do/adaptation-and-resilience/ecosystem-based-adaptation (accessed on 25 November 2018).
- EEA. Urban Adaptation to Climate Change in Europe: Challenges and Opportunities for Cities Together with Supportive National and European Policies; EEA Report, No. 2/2012; European Environment Agency (EEA): Copenhagen, Denmark, 2012; p. 143. [Google Scholar]
- Rizvi, A.R.; Baig, S.; Verdone, M. Ecosystems Based Adaptation: Knowledge Gaps in Making an Economic Case for Investing in Nature Based Solutions for Climate Change; IUCN: Gland, Switzerland, 2015; p. 48. [Google Scholar]
- European Commission. Urban Agenda for the EU ‘Pact of Amsterdam’; European Commission: Amsterdam, The Netherlands, 2016. [Google Scholar]
- European Commission. Communication from the Commission to the European Parliament, the Council, the European Economic and Social Committee and the Committee of the Regions; Green Infrastructure (GI)—Enhancing Europe’s Natural Capital {SWD(2013) 155 Final}; European Commission: Brussels, Belgium, 2013. [Google Scholar]
- Magistrat der Stadt Wien, Wiener Umweltschutzabteilung—Magistratsabteilung 22. Urban Heat Islands Strategieplan Wien; Brandenburg, C., Damyanovic, D., Reinwald, F., Allex, B., Gantner, B., Czachs, C., Eds.; Jürgen Preiss, Christian Härtel Wiener Umweltschutzabteilung—Magistratsabteilung 22: Projektkoordination, Magistrat der Stadt Wien, Wiener Umweltschutzabteilung—Magistratsabteilung 22: Vienna, Austria, 2015. [Google Scholar]
- Gutiérrez, A.I.; Ramos-Mejía, M. Function-Based and Multi-Scale Approach to Green Roof Guidelines for Urban Sustainability Transitions: The Case of Bogota. Buildings 2019, 9, 151. [Google Scholar] [CrossRef]
- Forschungsgesellschaft Landschaftsentwicklung Landschaftsbau e. V. Dachbegrünungsrichtlinien—Richtlinien für Planung, Bau und Instandhaltung von Dachbegrünungen; Forschungsgesellschaft Landschaftsentwicklung Landschaftsbau e.V.—FLL: Bonn, Germany, 2018. [Google Scholar]
- Austrian Standards Institut. ÖNORM L 1131 Gartengestaltung und Landschaftsbau—Begrünung von Dächern und Decken auf Bauwerken—Anforderungen an Planung, Ausführung und Erhaltung; Austrian Standards Institute/Österreichisches Normungsinstitut (ON): Wien, Austria, 2010. [Google Scholar]
- Pitha, U.; Scharf, B.; Enzi, V. Comparison of laboratory and in-field water storage properties of different green roofs and gravel roof. In Proceedings of the World Green Roof Congress, Urban Grey to Urban Green, Copenhagen, Denmark, 18–21 September 2012. [Google Scholar]
- Hu, S.; Lijiao, L.; Cao, J.; Chen, N.; Wang, Z. Water Resilience by Centipedegrass Green Roof: A Case Study. Buildings 2019, 9, 141. [Google Scholar] [CrossRef]
- Chan, F.K.S.; Griffiths, J.A.; Higgitt, D.; Xu, S.; Zhu, F.; Tang, Y.T.; Xu, Y.; Thorne, C.R. “Sponge City” in China—A breakthrough of planning and flood risk management in the urban context. Land Use Policy 2018, 76, 772–778. [Google Scholar] [CrossRef]
- Shafique, M.; Kim, R.; Rafiq, M. Green roof benefits, opportunities and challenges—A review. Renew. Sustain. Energy Rev. 2018, 90, 757–773. [Google Scholar] [CrossRef]
- Oke, T.R. Boundary Layer Climates; Routledge: Vancouver, BC, Canada, 1988; ISBN 0-203-40721-0. [Google Scholar]
- Andenaes, E.; Kvande, T.; Muthana, T.M.; Lohne, J. Performance of Blue-Green Roofs in Cold Climates: A Scoping Review. Buildings 2018, 8, 55. [Google Scholar] [CrossRef]
- Peng, L.L.; Jim, C.Y. Green-roof effects on neighborhood microclimate and human thermal sensation. Energies 2013, 6, 598–618. [Google Scholar] [CrossRef]
- Zhang, G.; He, B.-J.; Zhu, Z.; Dewancker, B.J. Impact of Morphological Characteristics of Green Roofs on Pedestrian Cooling in Subtropical Climates. Int. J. Environ. Res. Public Health 2019, 16, 179. [Google Scholar] [CrossRef] [PubMed]
- Köhler, M.; Kaiser, D. Evidence of the Climate Mitigation Effect of Green Roofs—A 20 Year Weather Study on an Extensive Green Roof (EGR) in Northeast Germany. Buildings 2019, 9, 157. [Google Scholar] [CrossRef]
- Ng, E.; Chen, L.; Wang, Y.; Wang, Y.C. A study on the cooling effects of greening in a high-density city: An experience from Hong Kong. Build. Environ. 2012, 47, 256–271. [Google Scholar] [CrossRef]
- Rosenzweig, C.; Gaffin, S.; Parshall, L. Green Roofs in the New York Metropolitan Region; Research Report; Columbia University Center for Climate Systems Research NASA Goddard Institute for Space Studies: New York, NY, USA, 2006. [Google Scholar]
- Morakinyo, T.E.; Dahanayake, K.K.C.; Ng, E.; Chow, C.L. Temperature and cooling demand reduction by green-roof types in different climates and urban densities: A co-simulation parametric study. Energy Build. 2017, 145, 226–237. [Google Scholar] [CrossRef]
- Scharf, B.; Pitha, U.; Trimmel, H. Thermal performance of green roofs. In Proceedings of the World Green Roof Congress, Urban Grey to Urban Green, Copenhagen, Denmark, 18–21 September 2012. [Google Scholar]
- Schmidt, M. Pflanzlicher Sonnenschutz—Gebäudebegrünung, Energieeinsparung und Klimaschutz im Doppelpack; Landschaftsarchitekten 02/2017; Patzer Verlag GmbH & Co KG: Berlin/Hannover, Germany, 2017. [Google Scholar]
- Mattuschka, F. Untersuchung gebäudeintegrierter Begrünungen, sowie deren bauphysikalische Wirkungen im Zuge des PROGREENcity-Projekts am Versuchsgebäude in Aranjuez (Spanien). Master’s Thesis, Universität für Bodenkultur Wien, Department für Bautechnik und Naturgefahren, Institut für Ingenieurbiologie und Landschaftsbau, Vienna, Austria, 2019. [Google Scholar]
- Smith, K.R.; Roebber, P.J. Green Roof Mitigation Potential for a Proxy Future Climate Scenario in Chicago, Illinois; Atmospheric Science Group, Department of Mathematical Sciences, University of Wisconsin: Milwaukee, WI, USA, 2010. [Google Scholar]
- Köhler, M.; Schmidt, M.; Laar, M. Green Roofs as a contribution to reduce urban heat islands. In Proceedings of the RIO 3—World Climate & Energy Event, Rio de Janeiro, Brazil, 1–5 December 2003. [Google Scholar]
- Santamouris, M. Cooling the cities—A review of reflective and green roof mitigation technologies to fight heat island and improve comfort in urban environments. Sol. Energy 2014, 103, 682–703. [Google Scholar] [CrossRef]
- Lotte, F.M.F.; Marina, B.J. Benefits of green roofs: A systematic review of the evidence for three ecosystem services. Urban For. Urban Green. 2017, 28, 167–176. [Google Scholar] [CrossRef]
- Scharf, B.; Zluwa, I. Case study investigation of the building physical properties of seven different green roof systems. Energy Build. 2017, 151, 564–573. [Google Scholar] [CrossRef]
- Kraus, F.; Scharf, B. Management of Urban Climate Adaptation with NBS and GREENPASS®; EGU: Vienna, Austria, 2019. [Google Scholar]
- James, E.; Rajagopalan, P. The effect of green roofs on pedestrian level air temperature. In Proceedings of the BS2015: 14th Conference of International Building Performance Simulation Association, Hyderabad, India, 7–9 December 2015. [Google Scholar]
- NYC Mayor’s Office of Sustainability. NYC Coolroofs. Available online: https://coolroofs.org/documents/NYC_CoolRoofs_6-14-17_Presentation.pdf (accessed on 10 June 2019).
- Akbari, H.; Matthews, H.D.; Seto, D. The long-term effect of increasing the albedo of urban areas. IOP Publ. Environ. Res. Lett. 2012, 7, 024004. [Google Scholar] [CrossRef]
- Scharf, B. Coole Städte Planen—Mit der “Greenpass-Methode”; Neue Landschaft 01/2018; Patzer Verlag: Berlin/Hannover, Germany, 2018. [Google Scholar]
- Bruse, M. ENVI-Met Documentation; Universität Mainz: Mainz, Germany, 2004. [Google Scholar]
- Simon, H. Modeling Urban Microclimate—Development, Implementation and Evaluation of New and Improved Calculation Methods for the Urban Microclimate Model ENVI-Met; Universität Mainz: Mainz, Germany, 2016. [Google Scholar]
- ENVI-met (nA). Evaluations & Reviews. Available online: http://www.envi-met.info/doku.php?id=kb:review (accessed on 10 June 2019).
- Green4cities. Development of an Evaluation Tool for Green Infrastructure and Their Positive Effects Derived for Cities Worldwide; ERA-SME R&D Project; Green4Cities: Vienna, Austria, 2012–2015. [Google Scholar]
- Kraus, F. The GREENPASS® Methodology; Pan European Network—Government 23 Publication: UK, 2017. [Google Scholar]
- Elagiry, M.; Kraus, F.; Scharf, B.; Costa, A.; De Lotto, R. Nature 4 Cities: Nature-Based Solutions and Climate Resilient Urban Planning and Decision Making with GREENPASS® Tool—A Case Study in Segrate/Milano/IT; Building Simulations: Rome, Italy, 2017. [Google Scholar]
- Greenpass Modelling (Ed.) GP.Me; R&D Project Vienna Business Agency: Vienna, Austria, 2015–2016. [Google Scholar]
- Stadslab2050 (nA). Wat Is Stadslabor2050? Available online: https://stadslab2050.be/het-lerend-lab/wat-doet-een-stadslab/wat-stadslab2050 (accessed on 10 June 2019).
- rp5.ru (nA). Weather Data Antwerpen, Deurne. Available online: https://rp5.ru/Wetterarchiv_in_Antwerpen,_Deurne_(Flughafen),_METAR (accessed on 10 June 2019).
- windfinder.com (nA). Wind statistics Antwerpen Luchthaven. Available online: https://www.windfinder.com/windstatistics/antwerpen (accessed on 10 June 2019).
- Berardi, U. The outdoor microclimate benefits and energy saving resulting from green roofs retrofits. Energy Build. 2016, 121, 217–229. [Google Scholar] [CrossRef]
Figure 1.
Mapping and project area of the Elief Playhouse in Antwerp/Belgium marked in yellow (© google.com).
Figure 1.
Mapping and project area of the Elief Playhouse in Antwerp/Belgium marked in yellow (© google.com).

Figure 2.
Design drafts for Stadslab2050 case study Elief Playhouse Antwerp: (a) Planning Variant A and (b) Planning Variant B (© Dusty Gedge/Green Infrastructure Consultancy).
Figure 2.
Design drafts for Stadslab2050 case study Elief Playhouse Antwerp: (a) Planning Variant A and (b) Planning Variant B (© Dusty Gedge/Green Infrastructure Consultancy).

Figure 3.
Digital ENVI-met® simulation models out of GREENPASS® Editor for Elief Playhouse Antwerp scenarios: (a) Status Quo (SQ), (b) Planning Variant A and (c) Planning Variant B.
Figure 3.
Digital ENVI-met® simulation models out of GREENPASS® Editor for Elief Playhouse Antwerp scenarios: (a) Status Quo (SQ), (b) Planning Variant A and (c) Planning Variant B.

Figure 4.
Screenshot of the meteorological input data for the ENVI-met® simulation in an hourly profile using simple forcing method for the Elief case study.
Figure 4.
Screenshot of the meteorological input data for the ENVI-met® simulation in an hourly profile using simple forcing method for the Elief case study.

Figure 5.
Results of microclimate simulation—Playhouse Elief Antwerp, comparison on a hot summer day 21.07. (a) Variant SQ—air temperature 15:00 at ground level; (b) Variant A—air temperature 15:00 at ground level; (c) Variant B—air temperature 15:00 at ground level.
Figure 5.
Results of microclimate simulation—Playhouse Elief Antwerp, comparison on a hot summer day 21.07. (a) Variant SQ—air temperature 15:00 at ground level; (b) Variant A—air temperature 15:00 at ground level; (c) Variant B—air temperature 15:00 at ground level.


Figure 6.
Results of microclimate simulation—Playhouse Elief Antwerp, comparison on a hot summer day 21.07. (a) Variant SQ—air temperature 15:00 at roof level; (b) Variant A—air temperature 15:00 at roof level; (c) Variant B—air temperature 15:00 at roof level.
Figure 6.
Results of microclimate simulation—Playhouse Elief Antwerp, comparison on a hot summer day 21.07. (a) Variant SQ—air temperature 15:00 at roof level; (b) Variant A—air temperature 15:00 at roof level; (c) Variant B—air temperature 15:00 at roof level.


Figure 7.
Results of microclimatic simulation Playhouse Elief Antwerp, comparison on a hot summer day 21.7. (a) Variant SQ—Physiological equivalent temperature (PET) 15:00 at ground level; (b) Variant A—PET 15:00 at ground level; (c) Variant B—PET 15:00 at ground level.
Figure 7.
Results of microclimatic simulation Playhouse Elief Antwerp, comparison on a hot summer day 21.7. (a) Variant SQ—Physiological equivalent temperature (PET) 15:00 at ground level; (b) Variant A—PET 15:00 at ground level; (c) Variant B—PET 15:00 at ground level.


Figure 8.
Results of microclimatic simulation Playhouse Elief Antwerp, comparison on a hot summer day 21.7: (a) Variant SQ—PET 15:00 at roof level; (b) Variant A—PET 15:00 at roof level; (c) Variant B—PET 15:00 at roof level.
Figure 8.
Results of microclimatic simulation Playhouse Elief Antwerp, comparison on a hot summer day 21.7: (a) Variant SQ—PET 15:00 at roof level; (b) Variant A—PET 15:00 at roof level; (c) Variant B—PET 15:00 at roof level.


Figure 9.
Results of microclimate simulation—Playhouse Elief Antwerp, comparison on a hot summer day 21.07. (a) Scenario SQ with Variant A—air temperature 15:00 at roof level; (b) Scenario SQ with Variant B—air temperature 15:00 at roof level; (c) Scenario SQ with Variant A—PET 15:00 at roof level; (d) Scenario SQ with Variant B—PET 15:00 at roof level; (e) Scenario SQ with Variant A—PET 15:00 at ground level; (f) Scenario SQ with Variant B—PET 15:00 at ground level.


Figure 10.
Results of microclimate simulation—Playhouse Elief Antwerp, comparison on a hot summer day 21.07. (a) Variant SQ—air temperature 04:00 at roof level; (b) Variant B—air temperature 04:00 at roof level; (c) Variant A—PET 04:00 at roof level; (d) Variant BPET 04:00 at roof level.
Figure 10.
Results of microclimate simulation—Playhouse Elief Antwerp, comparison on a hot summer day 21.07. (a) Variant SQ—air temperature 04:00 at roof level; (b) Variant B—air temperature 04:00 at roof level; (c) Variant A—PET 04:00 at roof level; (d) Variant BPET 04:00 at roof level.


Figure 11.
Key performance indicator (KPI) indoor air temperature (IAT) day profile for Elief Playhouse Antwerp scenarios on an idealized typical hot summer day (21.07).
Figure 11.
Key performance indicator (KPI) indoor air temperature (IAT) day profile for Elief Playhouse Antwerp scenarios on an idealized typical hot summer day (21.07).

Figure 12.
KPI energy flux of building (EFB) day profile for Elief Playhouse Antwerp scenarios on an idealized typical hot summer day (21.07).
Figure 12.
KPI energy flux of building (EFB) day profile for Elief Playhouse Antwerp scenarios on an idealized typical hot summer day (21.07).

Figure 13.
GREENPASS key performance scores (KPS)—Playhouse Elief Antwerp, three design variants (SQ, A, B).
Figure 13.
GREENPASS key performance scores (KPS)—Playhouse Elief Antwerp, three design variants (SQ, A, B).


Table 1.
Difference of air temperature (AT) and physiological equivalent temperature (PET) of Status Quo compared to the different design Variants A and B at the ground and roof level at day (15:00) and night-time (04:00).
Table 1.
Difference of air temperature (AT) and physiological equivalent temperature (PET) of Status Quo compared to the different design Variants A and B at the ground and roof level at day (15:00) and night-time (04:00).
| Maximum Difference in °C, Compared to Status Quo | Variant A | Variant B |
|---|---|---|
| AT—Roof Level—15:00 | −0.6 | −0.7 |
| AT—Roof Level—04:00 | −0.1 | −0.1 |
| PET—Roof Level—15:00 | −0.6 | −0.7 |
| PET—Roof Level—04:00 | −0.2 | −0.2 |
| PET—Ground Level—15:00 | −0.2 | −0.3 |
Table 2.
Indoor air temperature for Elief Playhouse variants on an idealized hot summer day (21.07).
Table 2.
Indoor air temperature for Elief Playhouse variants on an idealized hot summer day (21.07).
| Parameter | Status Quo | Variant A | Variant B |
|---|---|---|---|
| Mean Indoor Air Temperature °C | 24.37 | 21.74 | 20.99 |
| Difference to Status Quo °C | 2.63 | 3.38 |
Table 3.
Energy flux for Elief Playhouse Antwerp scenarios on a typical hot summer day (21.07).
| Parameter | Status Quo | Variant A | Variant B |
|---|---|---|---|
| Energy flux of building W/m2 | 16,499 | 5156 | 1932 |
© 2019 by the authors. Licensee MDPI, Basel, Switzerland. This article is an open access article distributed under the terms and conditions of the Creative Commons Attribution (CC BY) license (http://creativecommons.org/licenses/by/4.0/).
Share and Cite
MDPI and ACS Style
Scharf, B.; Kraus, F. Green Roofs and Greenpass. Buildings 2019, 9, 205. https://doi.org/10.3390/buildings9090205
AMA Style
Scharf B, Kraus F. Green Roofs and Greenpass. Buildings. 2019; 9(9):205. https://doi.org/10.3390/buildings9090205
Chicago/Turabian StyleScharf, Bernhard, and Florian Kraus. 2019. "Green Roofs and Greenpass" Buildings 9, no. 9: 205. https://doi.org/10.3390/buildings9090205
Note that from the first issue of 2016, this journal uses article numbers instead of page numbers. See further details here.