1. Introduction
Carbon nanotubes (CNTs) exhibit mechanical and electrical properties that render them inherently multifunctional [
1,
2]. Studies of CNT yarns have shown that upon the application of mechanical strain, their resistance changes. This phenomenon is known as piezoresistivity and can be tailored to achieve automated structural health monitoring (SHM) in composite materials as CNT yarns can be used as a mechanism for sensing and actuation in real-time [
3,
4,
5,
6].
The size of the individual CNTs and the wire-like assemblies of axially aligned CNT yarns make them easy to integrate and widely distribute into composite materials for damage detection and strain measurement. However, before the CNT assemblies may be used on a large scale, their thermomechanical and electrical responses need to be studied under varying conditions and states including their performance at the subscale. Little attention has been devoted to the time-dependent responses of CNTs and distortions in their unique lattices due to loading. For CNTs to be utilized in macro-scale applications, it is critical to understand how the electronic activities of the nanotubes aggregate to the unique properties observable and measurable in normal testing conditions.
In this paper, the effect of cyclic loading on the coupled mechanical and electrical response of the unconstrained CNT yarns will be studied to determine any potential hysteresis or time-dependent phenomena under a uniaxial tensile stress state. Uniaxially loading and unloading the CNT yarns in complete cycles and determining the permanent or plastic strain and resistance evolution will allow the understanding of the inner-workings of the CNT yarn throughout the entire deformation range. One of the interesting features of the CNT yarns is the piezoresistive property observed in carbon nanotubes. Lekawa-Raus
et al. [
7] described this effect in terms of relative changes in the lattice, bandgap and electrical resistivity of the CNT yarns. On application of the load, the number of contact point changes as strain is induced and thus affects the amount and rate of change of the electrical resistance. The uniaxial tensile stress exerted to the CNT yarn results in the stretching of the nanotubes, which causes an increase in its resistance. As the distance between the CNTs increases due to increasing strain, the contact area decreases resulting in a rise in resistance and band gap such that charge carriers will need to tunnel across the gap. It is worth mentioning that the net piezoresistance has to be accounted for by the net distribution of chiralities in the CNT yarn. Upon unloading, a hysteresis loop could be observed as the CNT yarn returns to its original state. A lesser amount of energy is needed to unload relative to the loading segment and the difference in energy between the segments causes the lag. At low strain levels, the piezoresistance is dependent upon the armchair nanotubes because they account for the least resistance. The resistance increases by the opening of their band gaps until it is countered by the resistance of the zig-zag nanotubes, which reduces the net resistance by closing of their bandgaps at higher strains [
7].
Due to the complex morphology of the CNT yarn, its response under tension is affected by not only chiral symmetry, but also diameter, twist geometry, strain rate, test duration and temperature. Hysteresis as well as any other time-dependent nonlinearities will be studied at specific strain values, 0.1%, 0.5% and 1%, in order to determine the mechanical and electrical characteristics during a uniaxial tension test. The coupled mechanical and electrical response of the unconstrained CNT yarns under quasi-static monotonic loading had been studied at a specific strain rate [
8,
9,
10] but the cyclic loading of this study adds the time variable to that response.
The significance of this study is to shed light into the response of the CNT yarns when used as piezoresistive strain sensors integrated in materials or structures that are subjected to dynamic loading including fatigue or impact, or quasi-static cyclic loading. Once the stress and the strain are calculated, they will be compared with the resistance in order to determine any correlations between these three variables. By graphing the stress-strain curve and the resistance-strain curve together, the mechanical properties of the CNT yarn can be correlated to changes in the electrical resistance. Additionally, the effects of the strain rate, stress relaxation and the electrical measurement methodology on these responses will be analyzed to reach a deeper understanding of the interplay between the mechanical and electromechanical behaviors, which can in turn contribute to a better understanding of the yarn sensor mechanisms.
2. Materials and Methods
2.1. Carbon Nanotube Yarn
For the experiments in this study, the CNTs were grown into a vertically aligned CNT array on a substrate and then spun to form a yarn (
Figure 1a,b) [
11]. The CNT array is approximately 400 μm in height, with a distribution of nanotubes consisting of 1 up to 6 or 7 walls. The CNT yarn diameter is approximately 30 μm and the twist angle is about 30° with no post-processing. The CNTs are usually bonded together by van der Waals forces and local entanglements. One of the most influential fabrication factors on the properties of the CNT yarn is the twist angle used when spinning the CNT yarn from the array. In general, CNT yarns made with higher twist angles are more desirable since this allows more turns of CNTs per unit length and increases the density of the CNT yarn [
2,
12]. Additionally, this will increase electrical conductivity by creating more contact points between CNTs. After the CNTs are twisted, they are spun onto a spool for safekeeping (
Figure 1c). It is worth mentioning that 1-thread yarns were used in this study (
Figure 1).
Figure 1.
Scanning electron microscope (SEM) images of the carbon nanotube (CNT) yarn: (a) 1-thread CNT yarn; (b) 1-thread yarn CNT under tension; (c) Optical image of spool with wound 1-thread CNT yarn.
Figure 1.
Scanning electron microscope (SEM) images of the carbon nanotube (CNT) yarn: (a) 1-thread CNT yarn; (b) 1-thread yarn CNT under tension; (c) Optical image of spool with wound 1-thread CNT yarn.
Since the physical and mechanical properties of the CNT yarn depend on the fabrication process, especially the twist angle and the diameter of the yarn, when comparing different batches of CNT yarn, there are deviations in the mechanical and electrical measurements. The tensile strength and elastic modulus will increase as the twist angle increases, until the angle becomes excessive, resulting in a plateau and eventual decline in the strength and elastic modulus [
2,
12]. For reference, the maximum value of the elastic modulus per mass density or specific elastic modulus, occurs at a twist angle of approximately 10°, while the maximum tensile strength per mass density or specific strength occurs at an angle of about 20° [
2,
12].
2.2. Experimental Setup
In order to characterize the CNT yarn, it is laid over a cardstock, cut out, and centered along the centerline. This configuration is able to support the CNT yarn during fabrication of the sample and insertion into the test fixture, yet allowing the tested portion of the CNT yarn (the section that lies within the diamond cutout) to move freely in the vertical direction [
9,
10]. One end of the CNT yarn is taped down using Scotch Tape
TM up to the mark and the CNT yarn is checked to ensure its alignment. In order to measure the resistance of the CNT yarn during testing, four point probe measurements are taken for accuracy since they eliminate contact and spreading resistance in comparison to two point probe measurements. A high contact resistance means that the voltage measured across the resistance in question includes the resistance of the wires (leads) and contacts as well. Typical lead resistances range from 10 mΩ to 1 Ω making it very difficult to obtain accurate measurements using two point probe resistance measurements when the resistance of the CNT yarn under testing is lower than 100 Ω.
The inner wires are attached to the opposite side of the CNT yarn and the outer wires to the top side [
10]. Since there is a thickness difference between the wires and the CNT yarn due to the thickness of the card, the section of the inner wires that overlap the diamond cutout are lightly pressed down without touching the CNT yarn. A drop of conductive paint (Bare Paint
TM) is used to connect the CNT yarn with the electrical wires. The conductive paint has a rubberizing characteristic, thus reducing any stiffness to the CNT yarn that may be contributed by the paint. After the conductive paint has cured, a second layer of tape is applied to cover any section of the CNT yarn that is not within the diamond cutout. Finally, straight cuts are made allowing only the gauge length of the CNT yarn sample to be tested under uniaxial tensile loading. To ensure that no loads are applied during this process, the sample is firmly held down to ensure that it will not move. The final sample can be moved and inserted into the testing frame without any additional load applied onto the sample.
2.3. Mechanical and Electrical Measurements
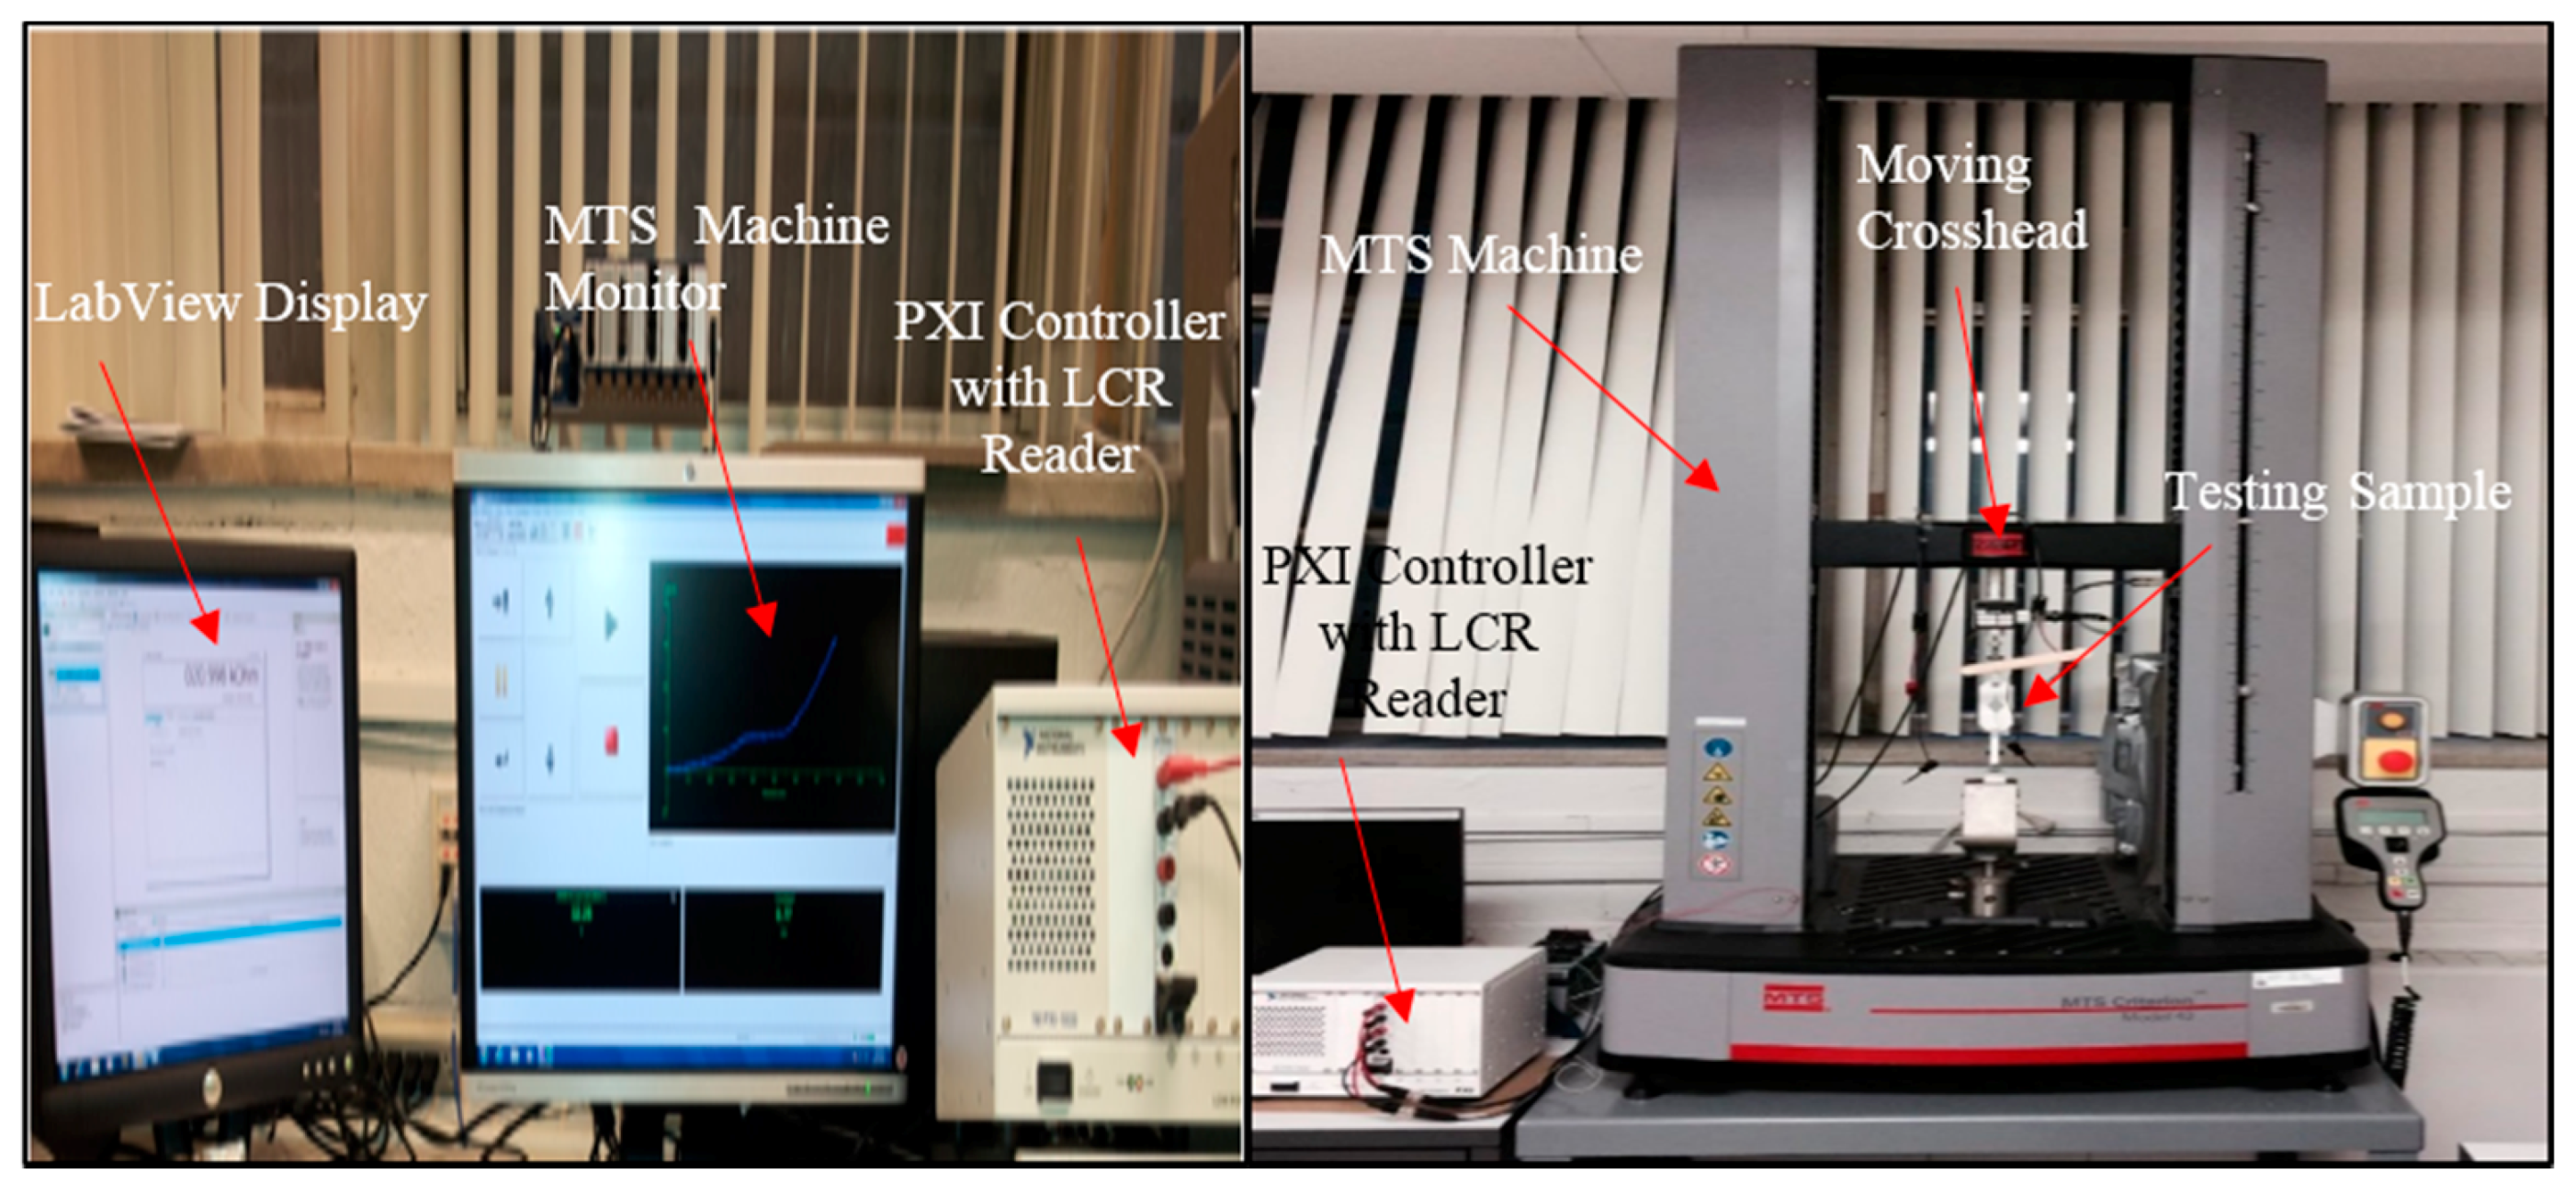
To determine the mechanical response of the CNT yarns, an MTS Criterion 43 electromechanical loading machine was used along with a 1-N-capacity load cell. When placed in the testing frame, the CNT yarn sample is first attached to the upper grip and aligned so that the CNT yarn is centered in the grips. This allows the CNT yarn to be monitored during testing. The testing frame is slowly moved downward, while the lower grip is held open, until the sample can be clamped by the lower grip. Gently, the lower grip is released, thus securing the sample into the testing frame. To record electrical measurements during testing, a NI 4072 LCR (Inductance-Capacitance-Resistance) reader mounted on a NI-PXI 1033 chassis is connected to the CNT yarn sample. Four E-Z clip wire attachments were used to connect the LCR reader to the CNT yarn due to their easy maneuverability around the testing frame. To ensure that the four clips will not apply any load to the CNT yarn prior or during testing, they are taped to the moving portion of the testing frame (where the 1-N load cell and upper grip are attached). Thus, the clips are able to move along with the testing frame. The experimental setup is shown in
Figure 2.
Figure 2.
Optical image of experimental setup including MTS system and LCR reader.
Figure 2.
Optical image of experimental setup including MTS system and LCR reader.
2.4. Methodology
An electromechanical loading machine and an LCR reader are used to determine the mechanical and electrical response of the CNT yarn. Once the maximum load is reached, the loading machine stops and then gradually unloads the sample until no load is applied and the crosshead extension reaches its original position. The MTS Criterion 43 is controlled via the TestWorks4 software and is programmed to apply a uniaxial tension load to the sample at specific displacement rates of 25 μm·min−1 or 150 μm·min−1 until a specified cross head extension is reached. The MTS MultiCycle package was used to apply cyclic loading. The load applied to the sample and the crosshead extensions are recorded as a function of time. Additionally, the LCR reader simultaneously measures changes in resistance during the test. The results are analyzed using MATLABTM and Microsoft ExcelTM.
3. Results and Discussion
3.1. Effect of Strain Level
A series of experiments were conducted using a constant displacement rate of 150 μm·min−1 or a strain rate of 0.006 min−1 (0.0001 s−1) considering that the gauge length was 25 mm. Five CNT yarn samples were tested at a low strain level, 0.1%, seven at an intermediate strain level, 0.5%, and another seven samples were tested at a high strain level, 1.0%.
3.1.1. Low Strain Level
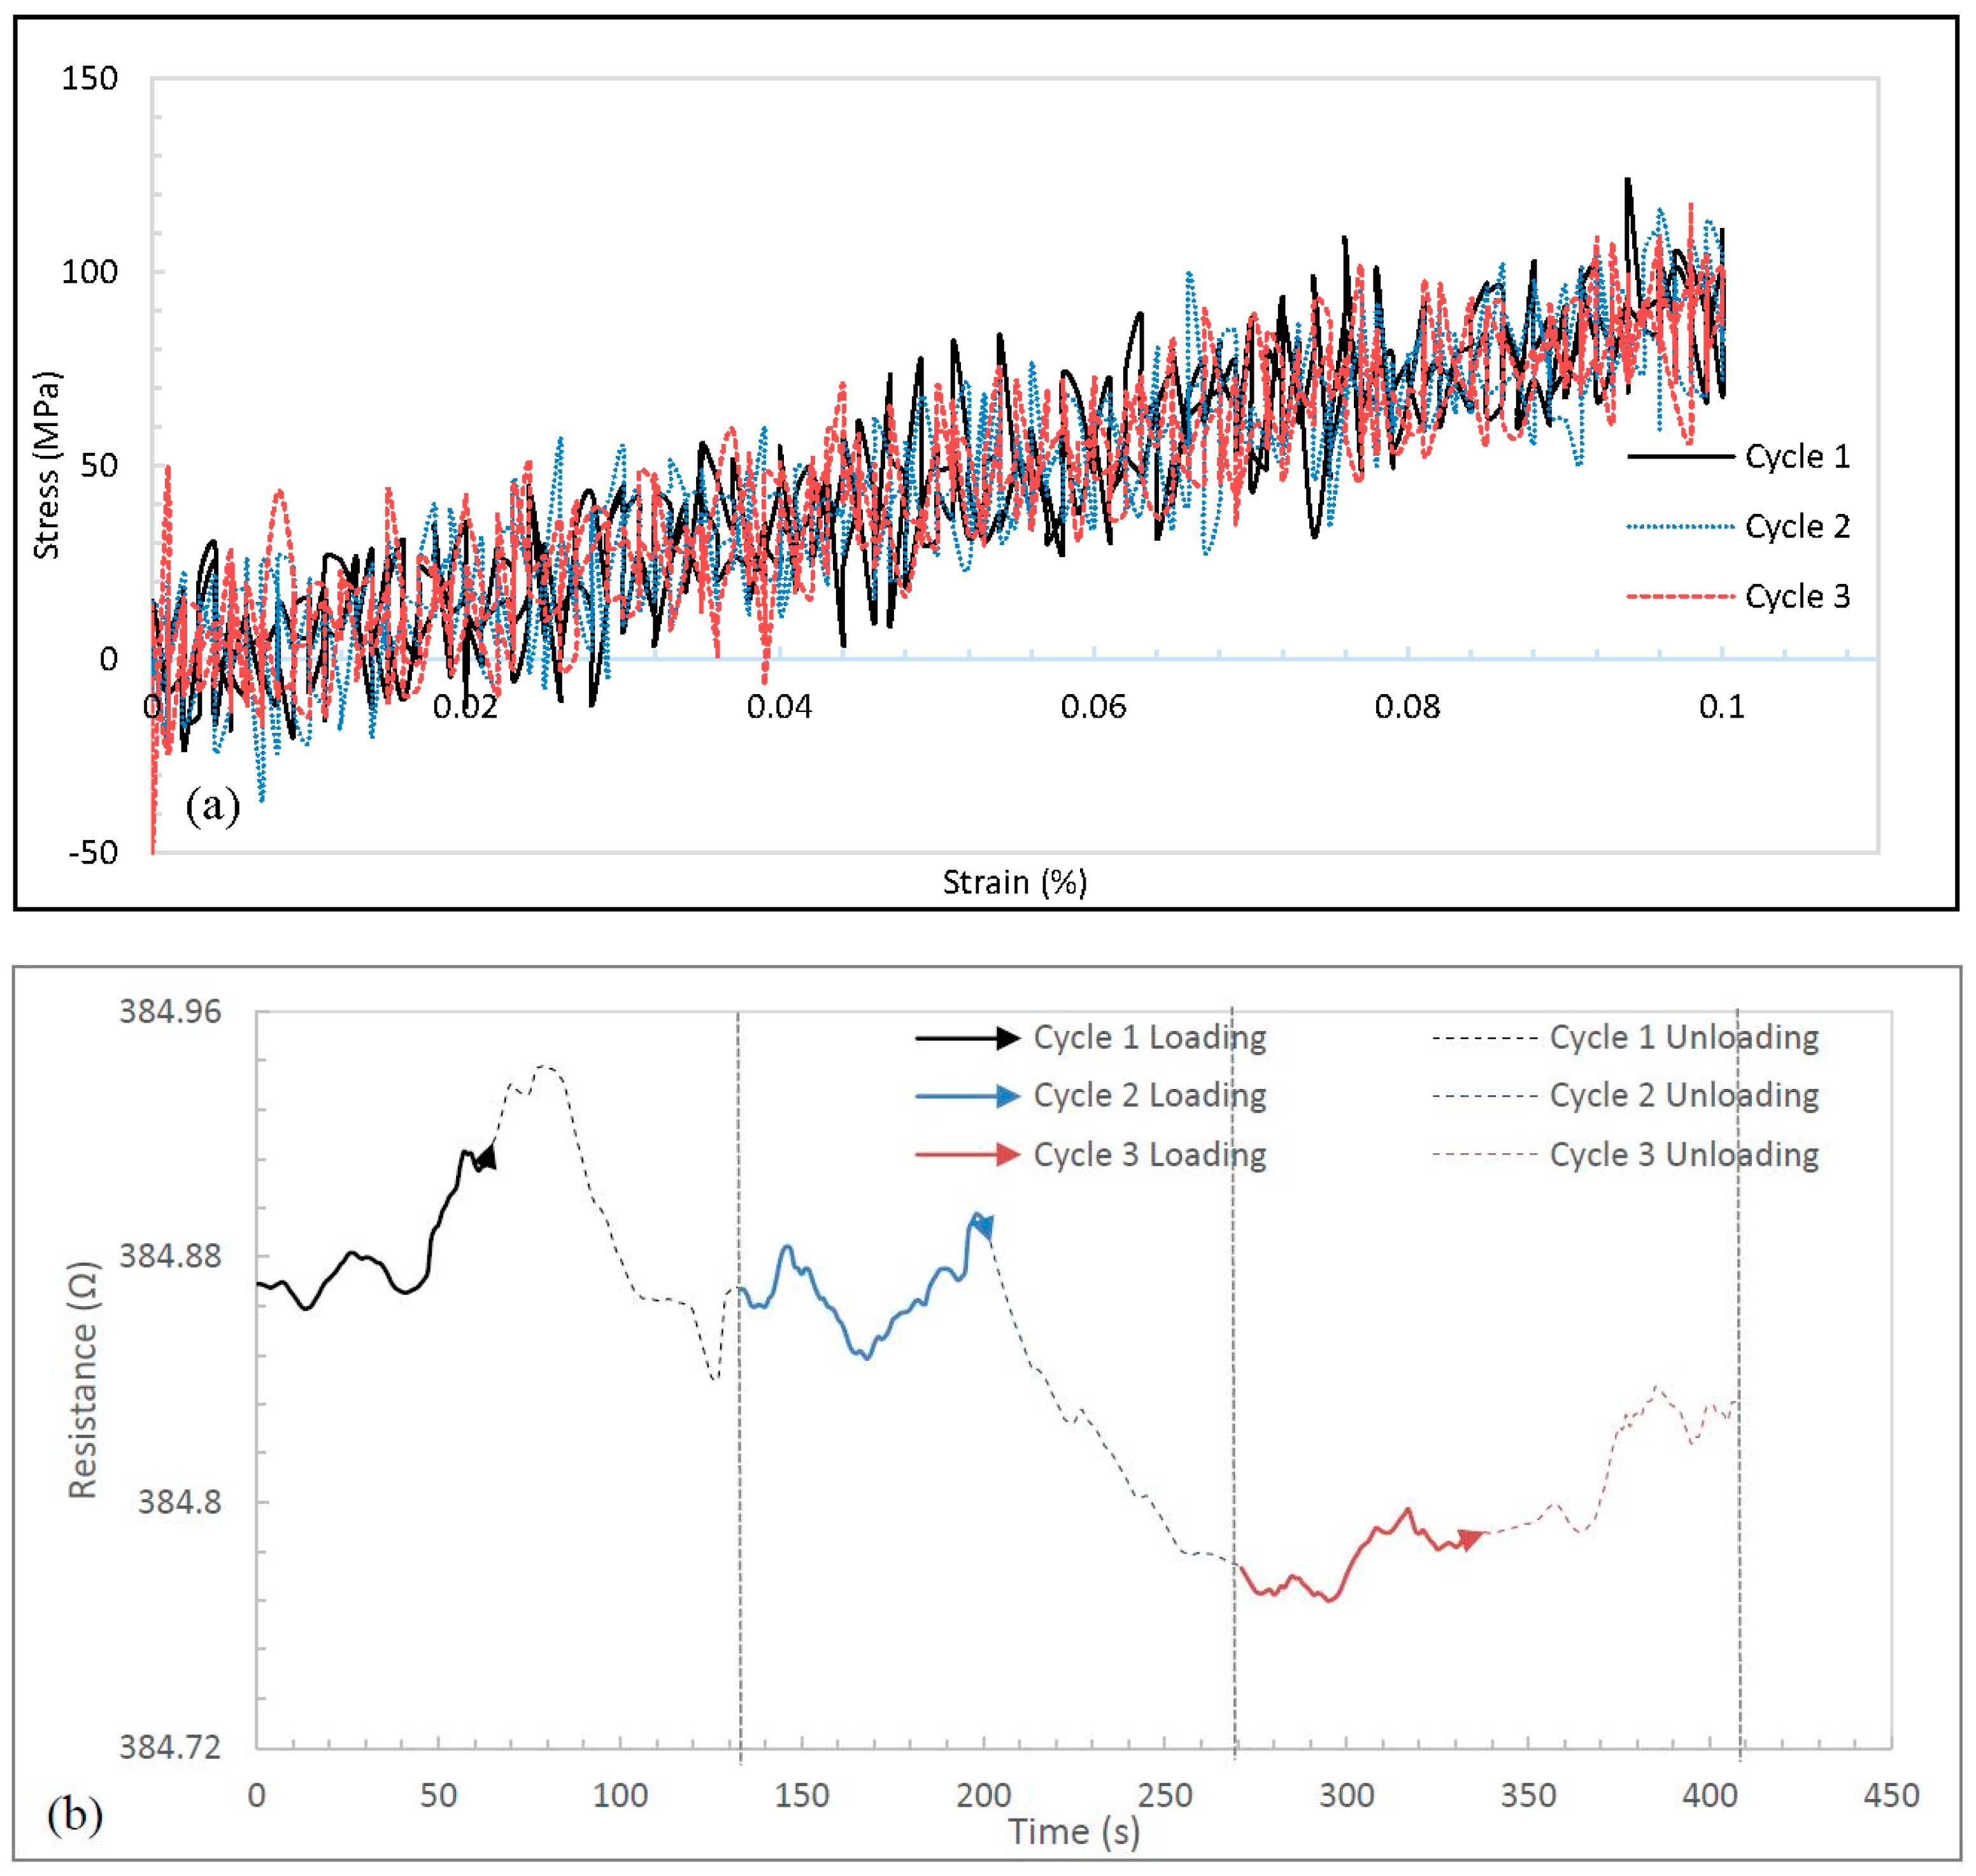
Initially, all CNT yarn samples were subjected to a maximum strain level of 0.1%.
Figure 3a shows the stress-strain curves to a maximum strain of 0.1% during 10 cycles. These curves show hysteresis paths as the CNT yarns return to their original shape during unloading. The hysteresis loop decreases proportionally with increasing cycle. The negative stress could be interpreted as a compressive effect on the CNT yarn as the strain causes a little additional extension, which is not recovered completely at the end of the loading segment, and thus requires a negative stress to return to the original gauge length as the test was run under displacement control. At a maximum strain of 0.1%, the corresponding stress was 215.92 MPa. The end or minimum stress corresponding to a strain of 0% was −15.56 MPa. The compressive stress could be explained by the atomic readjustment within the CNT yarn as it becomes strain-free.
Figure 3.
Data for a maximum strain of 0.1% during 10 cycles at a strain rate of 0.006 min−1: (a) Stress-strain curves (Inset: curve of cycle 1); (b) Resistance history curves.
Figure 3.
Data for a maximum strain of 0.1% during 10 cycles at a strain rate of 0.006 min−1: (a) Stress-strain curves (Inset: curve of cycle 1); (b) Resistance history curves.
The hysteresis loop is narrow at this strain level since little energy is used during the loading segment although it is expected that higher strain levels may produce wider hysteresis loops demonstrating that an amount of energy is dissipated due to internal friction as the CNT yarn returns to its original shape after the work done during the loading segment.
During the second cycle, auxiliary valleys appear with noise amplification and an expansion of localized damage just like in metals where fatigue occurs progressively at a stress level much lower than the nominal maximum stress at any stress concentration point. The concentrator in this case could be attributed to the presence of imperfections or metal catalyst particles, or even errors in samples preparation. The impact of environmental laboratory conditions during the experiments could not be discounted although significant care was taken to minimize their impact.
Figure 3b shows the resistance history of the CNT yarn subjected to 10 consecutive loading-unloading cycles. A gradual reduction is observed in the maximum values of the resistance. Irrespective of further cycle, it is observed that the downward trend of the resistance is maintained. Even when there are outliers in the form of auxiliary peaks observed in the third, fifth and sixth cycles, the overall resistance history curve maintained a progressive reduction in the maximum resistance.
3.1.2. Intermediate Strain Level
The stress-strain curves corresponding to a maximum strain of 0.5% (
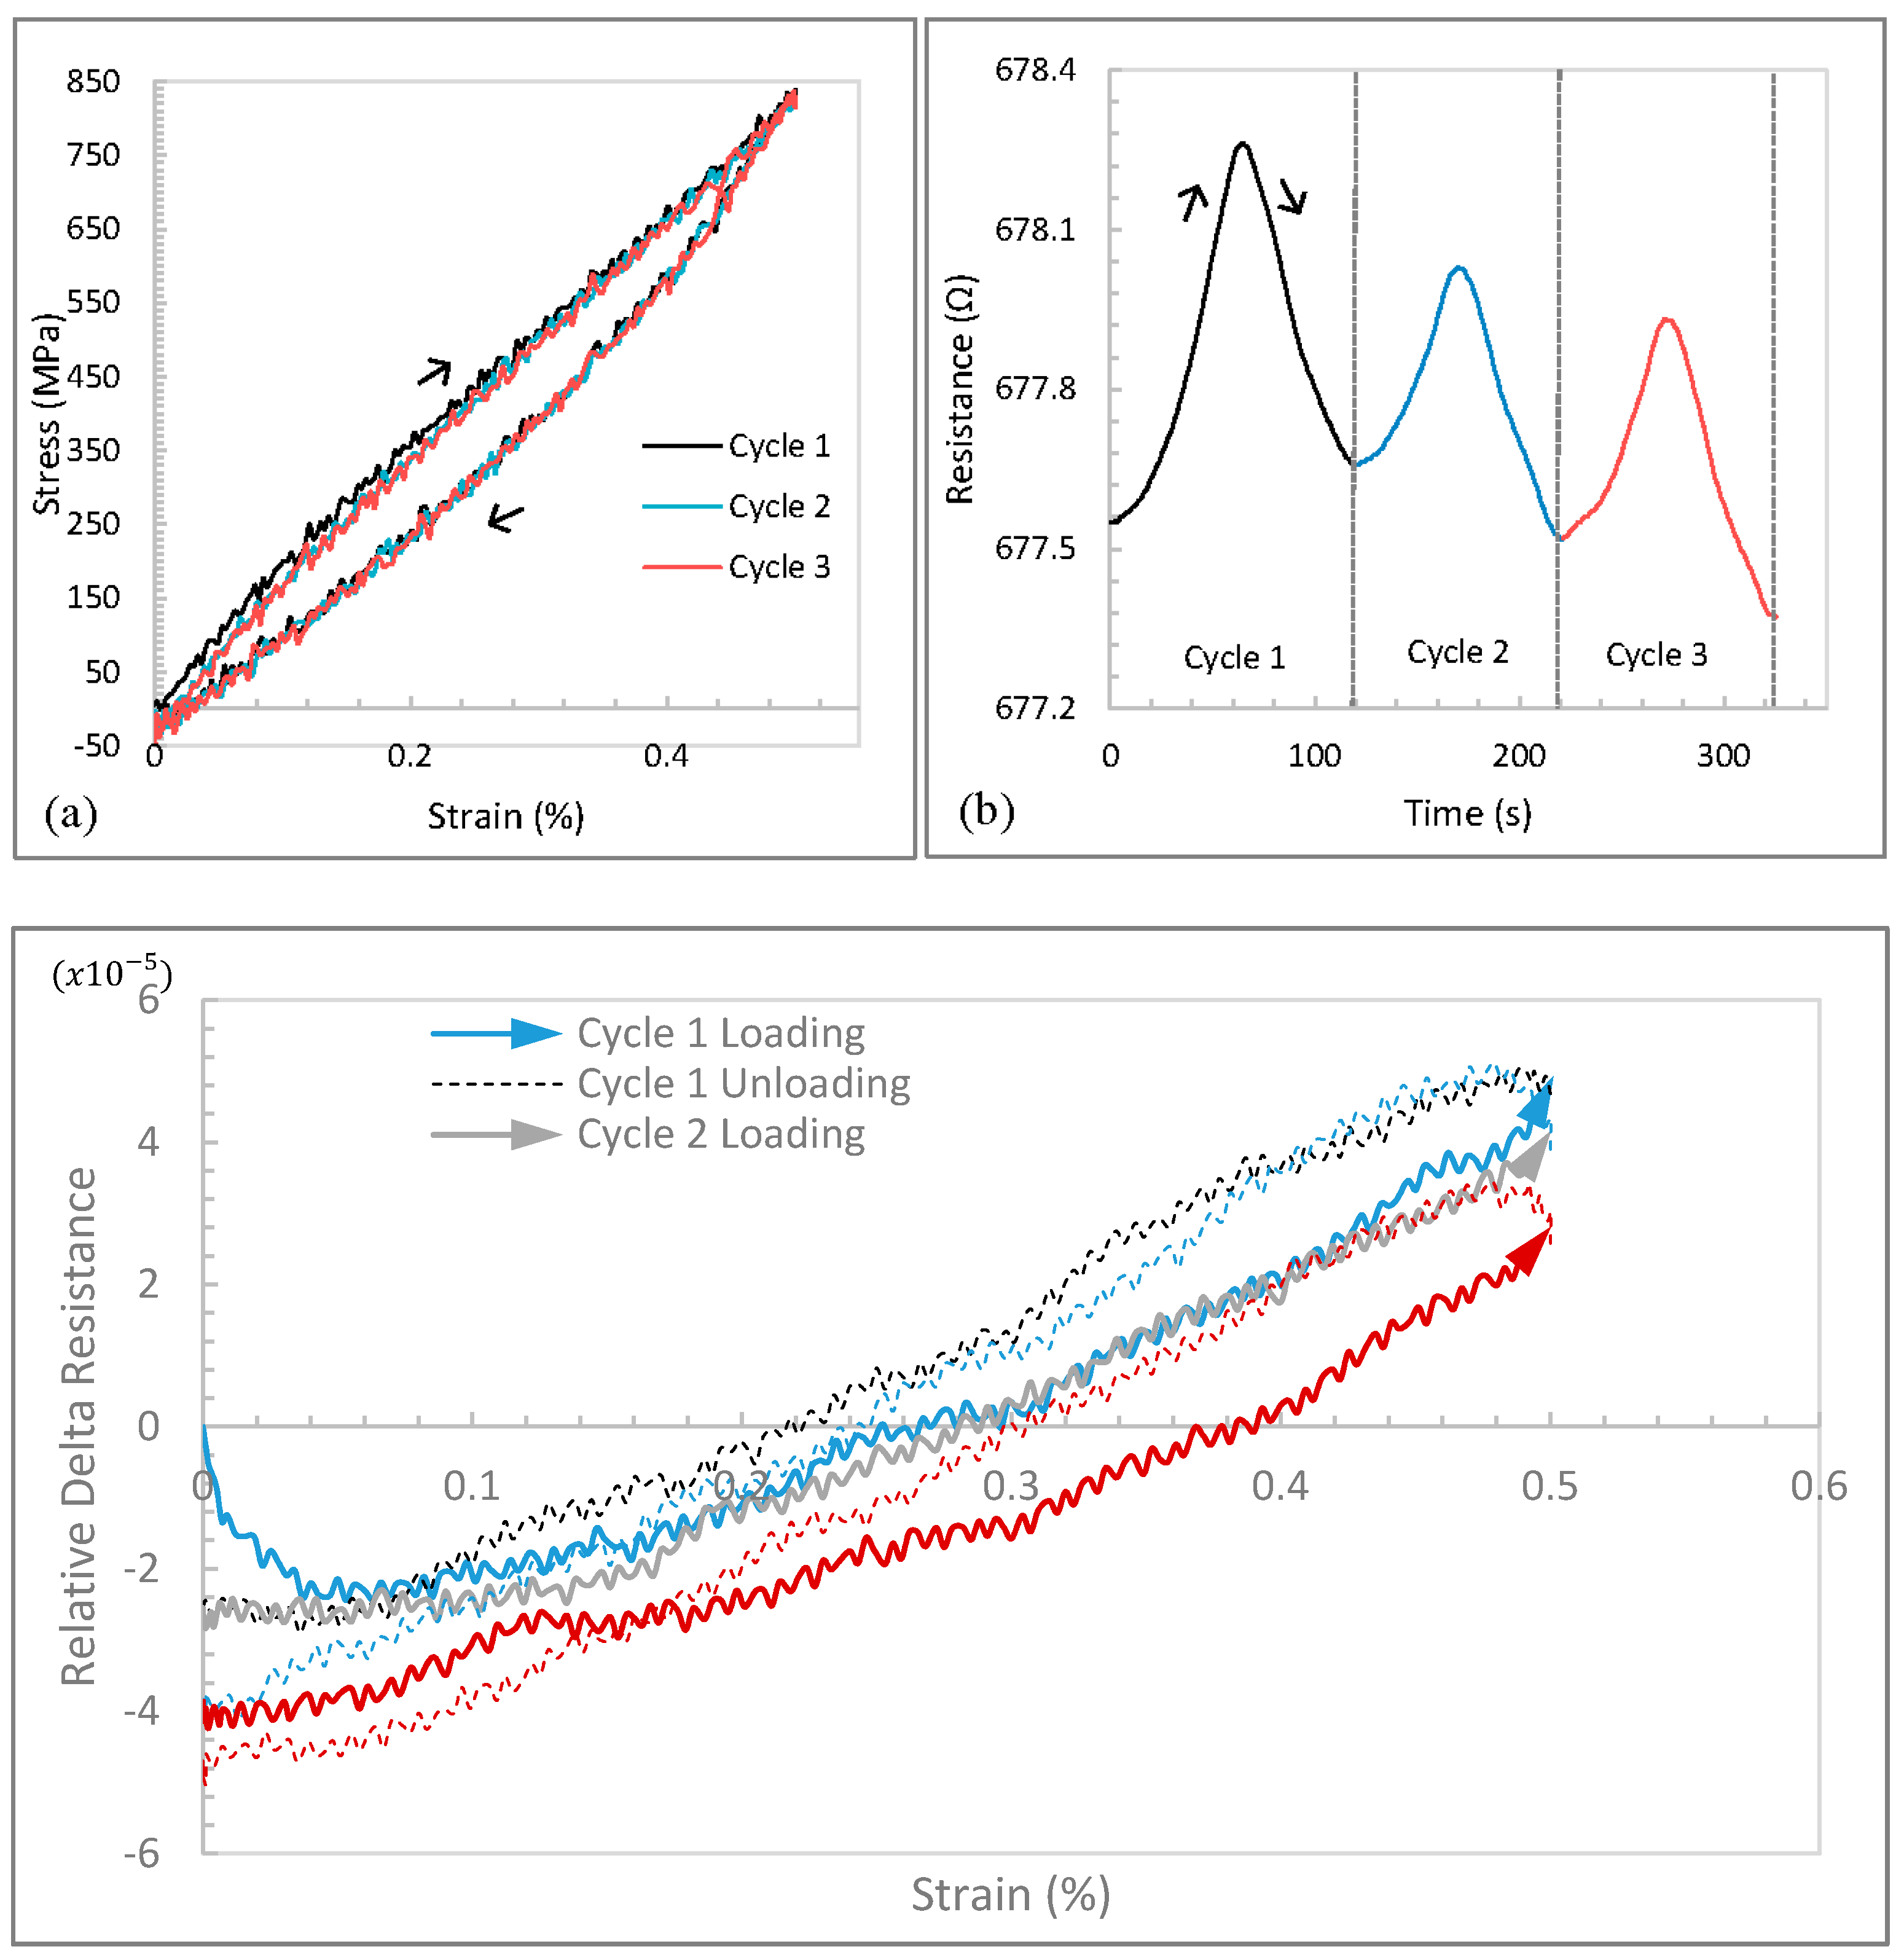
Figure 4a) have more pronounced features than those of the lower maximum strain level. The response of the CNT yarn to a maximum strain of 0.5% is very similar to that of a maximum strain of 0.1%. However, the width of the hysteresis loop is bigger owing to the increase in strain level. As the strain level increases, more energy is introduced into the CNT yarn and dissipated in the form of heat. The loop decreases a little bit after each new cycle and the resistance also decreases after each new cycle (
Figure 4b). The maximum resistance during the first cycle was 678.32 Ω and it dwindled to 677.86 Ω during the third cycle (
Figure 4b). This is consistent with the decrease in resistance upon increasing cycle trend observed at the 0.1% strain case. It is worthy to note that CNT yarns in general are very sensitive to miniscule defects, which may be magnified at higher strain levels and thus affect the resistance. The trend may also be affected by the noise from the equipment and the background.
Figure 4.
Data for a maximum strain of 0.5% during 3 cycles at a strain rate of 0.006 min−1: (a) Stress-strain curves; (b) Resistance history curves; (c) Relative delta resistance-strain curves.
Figure 4.
Data for a maximum strain of 0.5% during 3 cycles at a strain rate of 0.006 min−1: (a) Stress-strain curves; (b) Resistance history curves; (c) Relative delta resistance-strain curves.
3.1.3. High Strain Level
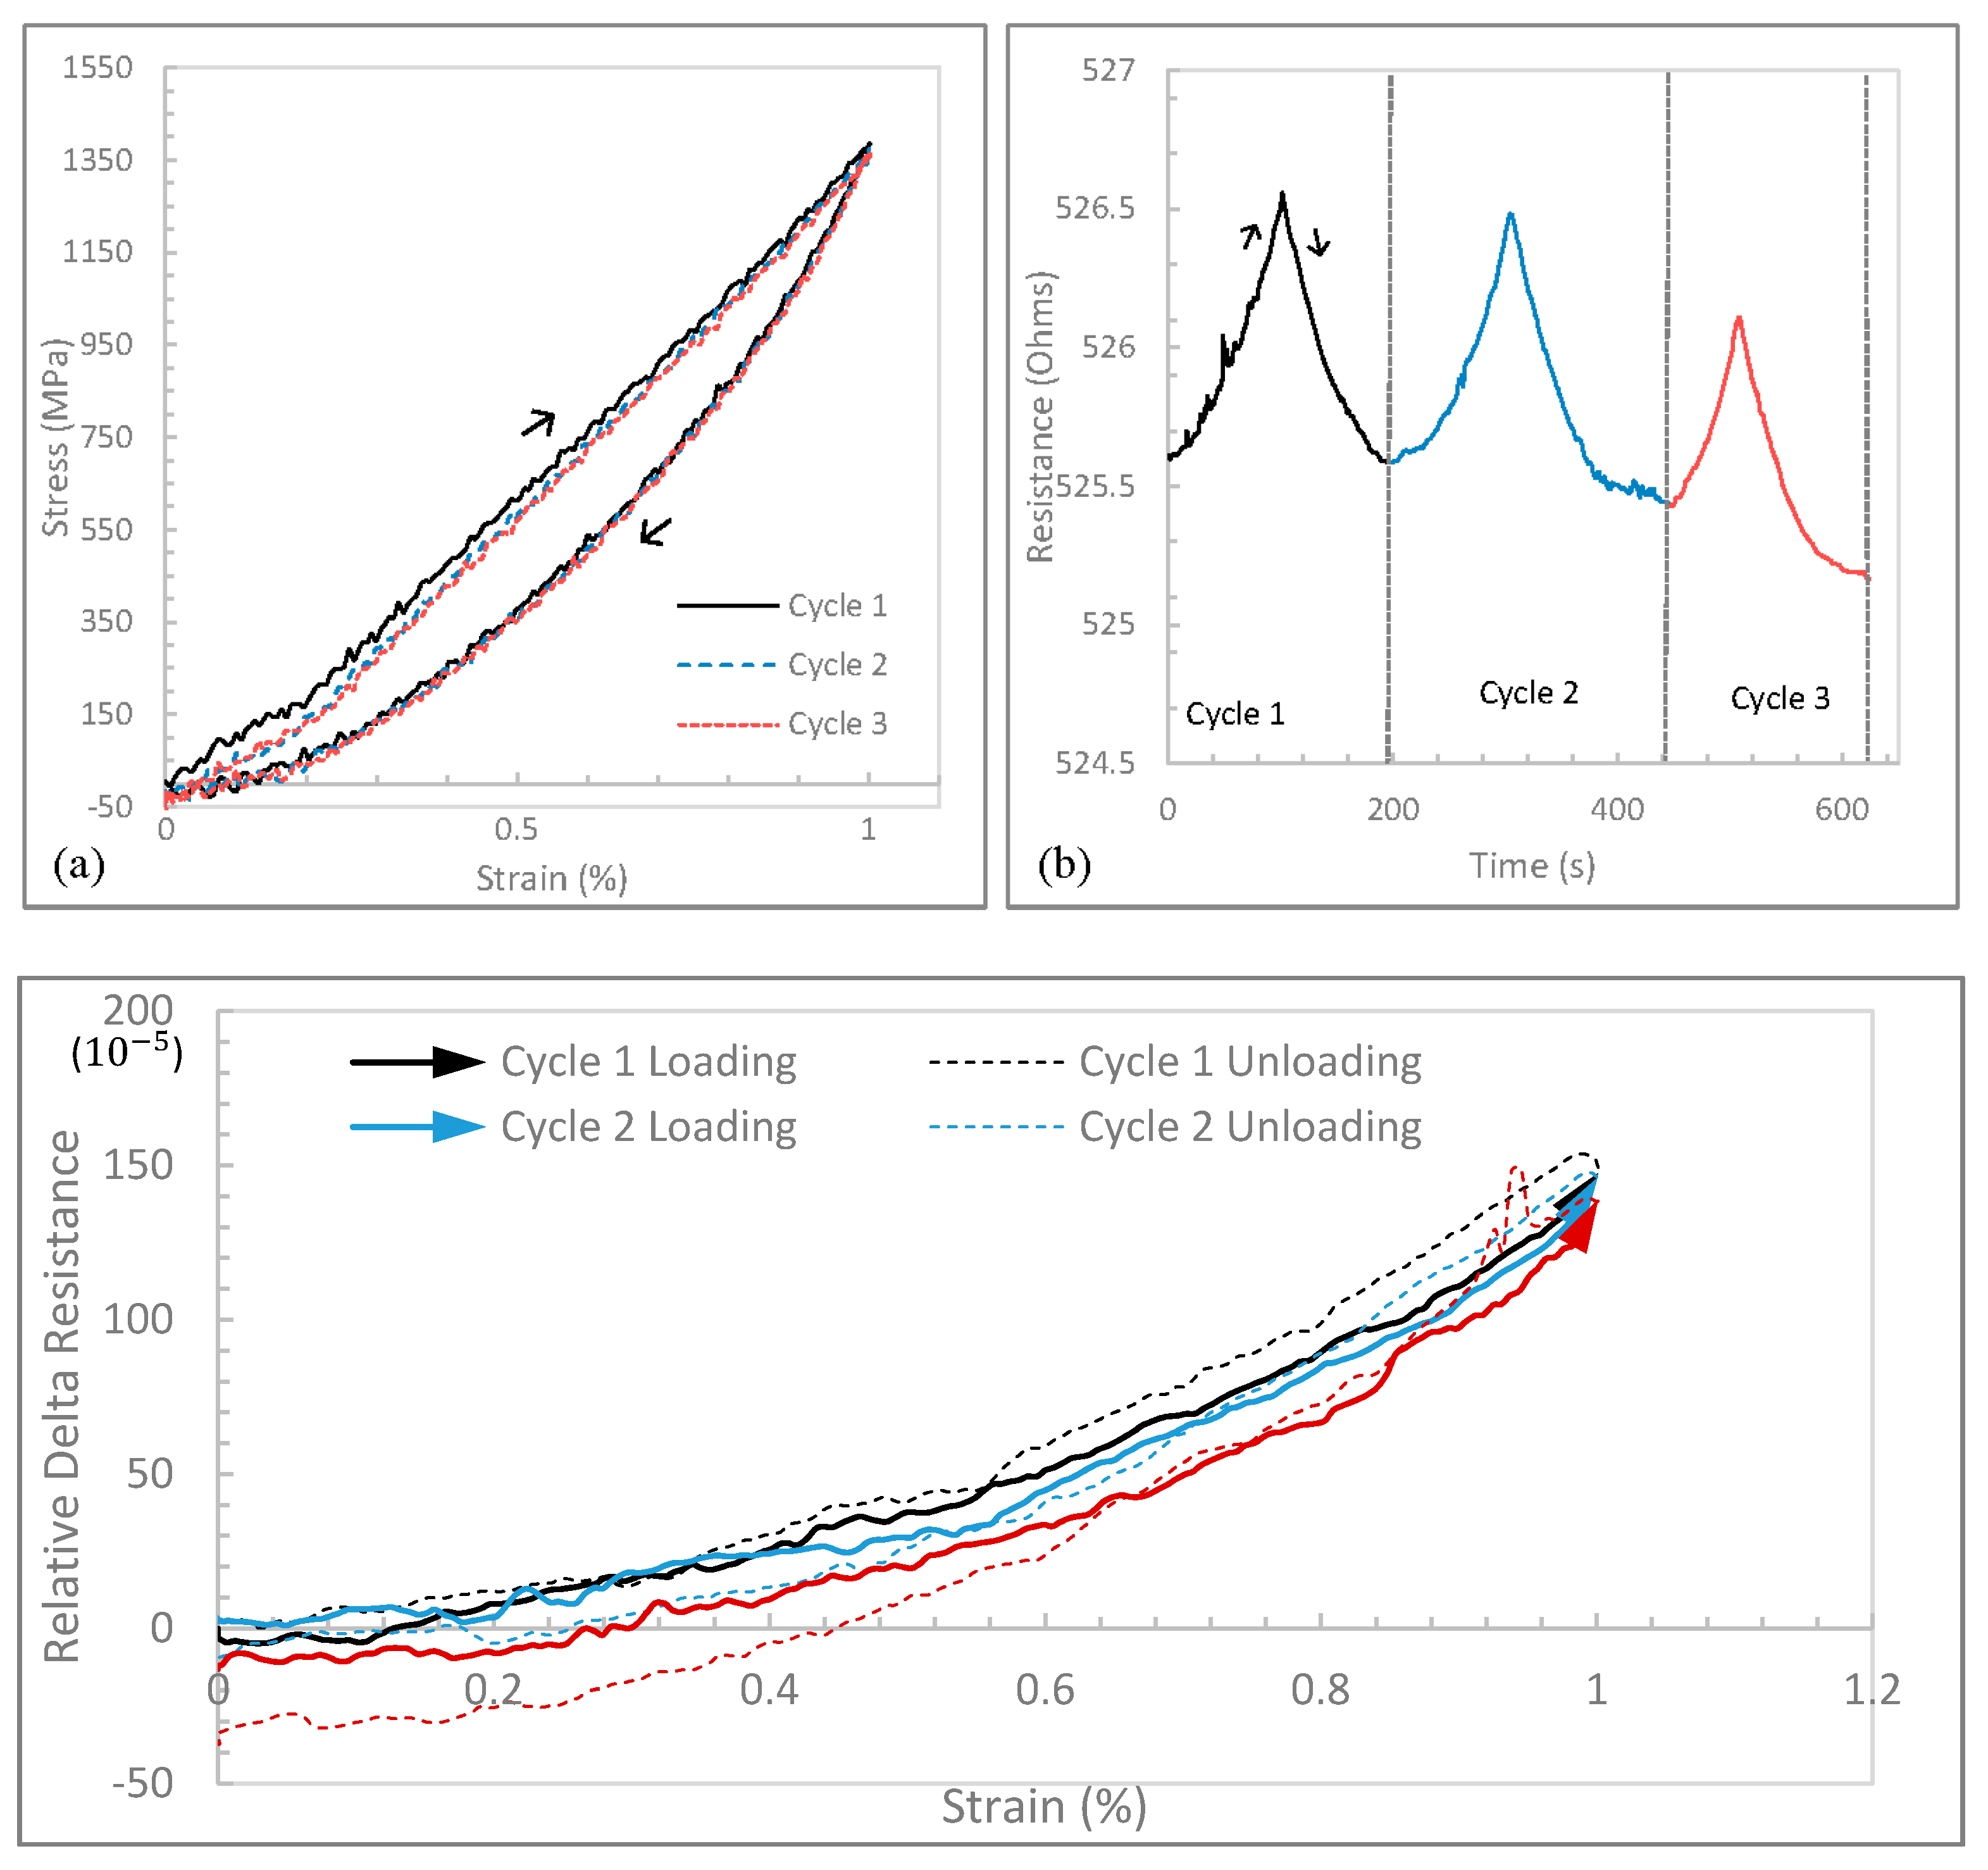
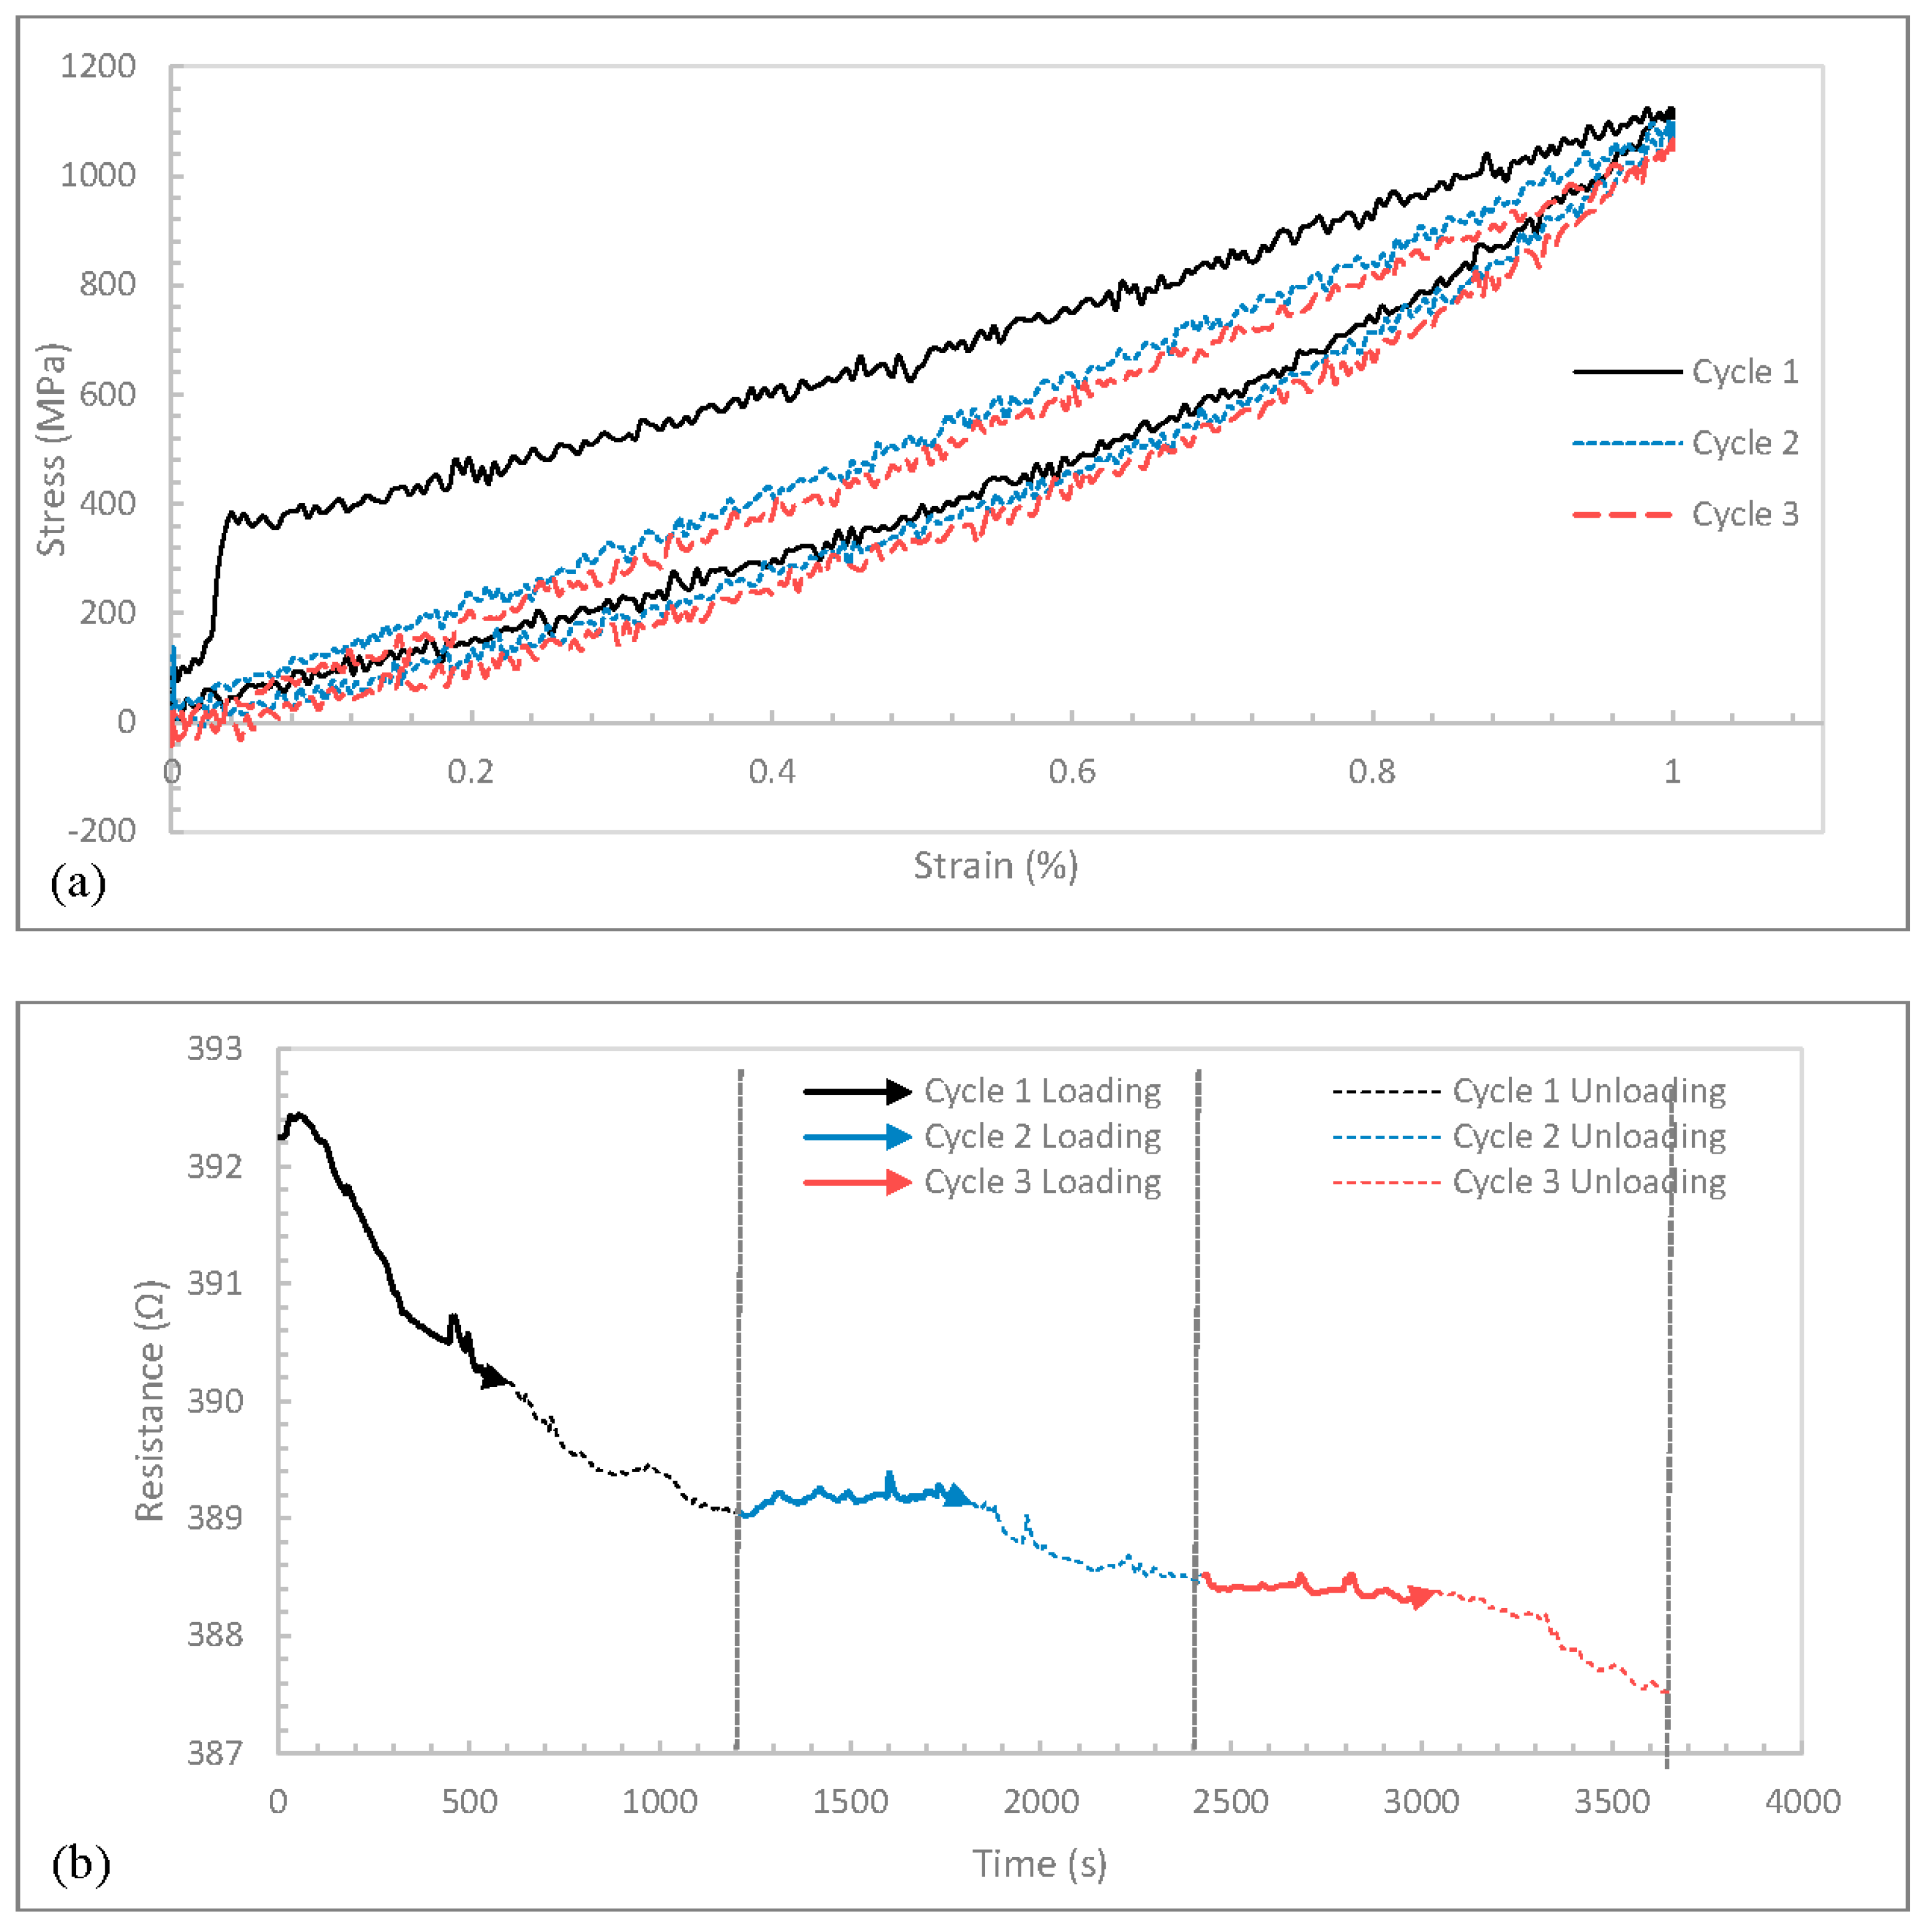
The stress-strain curves corresponding to a maximum strain level of 1% are shown in
Figure 5a and they exhibit more prominent hysteresis than those observed at lower strain levels. Energy loss was observed in spite of the strain being reversible. This may be attributed to the fact that during unloading, the CNT yarn would try to recover with the stretched bonds trying to regain their initial state. There is a time lag associated with this recovery, which accounts for the hysteresis loop.
Figure 5.
Data for a maximum strain of 1% during 3 cycles at a strain rate of 0.006 min−1: (a) Stress-strain curves; (b) Resistance history curves; (c) Relative delta resistance-strain curves.
Figure 5.
Data for a maximum strain of 1% during 3 cycles at a strain rate of 0.006 min−1: (a) Stress-strain curves; (b) Resistance history curves; (c) Relative delta resistance-strain curves.
For a maximum strain of 1%, a consistent decrease in the resistance was observed with increasing cycle number as shown in
Figure 5b. It started with a maximum resistance of 526.52 Ω in the first cycle and progressively decreased to 526.48 Ω, and 526.09 Ω, in the second and third cycles, respectively. It could also be observed that as the maximum strain level increased, the difference in delta resistance between loading and unloading segments decreased. It was also observed that the maximum resistance in each cycle increased with increasing maximum strain level.
The relative change (delta) in resistance was graphed against the strain as shown in
Figure 4c and
Figure 5c, and a trend line was considered to calculate the strain gauge factor. The gauge factor (GF) provides a measure of the sensitivity of the CNT yarn to measure strain and is given by the following expression:
where
R is the initial resistance,
is the delta resistance, ε is the strain, which is defined as the ratio of the change in length,
over the original length,
L. In the case of the maximum strain level of 1%, the gauge factor was determined to be 0.15. At higher strains, the sensitivity of the CNT yarn appears to be higher, implying that the gauge factor may exhibit a directly proportional response with increasing strain. The presence of hysteresis in the relative delta resistance-strain curves was also observed.
3.2. Effect of Strain Rate
The effect of the strain rate on the coupled mechanical and electrical response of the CNT yarn was studied by testing the CNT yarns under different displacement rates including 150 μm·min
−1 and 25 μm·min
−1. Since the gauge length was 25 mm, these displacement rates corresponded to 0.006 min
−1 (0.0001 s
−1) and 0.001 min
−1 (1.67 × 10
−5 s
−1), respectively. All the previous experimental results were obtained at a strain rate of 0.006 min
−1. Similar experiments were run at a much lower strain rate of 0.001 min
−1 to observe any effect on the resistance of the CNT yarn (
Figure 6,
Figure 7 and
Figure 8).
At a strain rate of 0.001 min
−1, the hysteresis trend observed at the higher strain rate remained the same and the width of the hysteresis loop increased with increasing strain level (
Figure 6a,
Figure 7a and
Figure 8a) as also observed at the higher strain rate. At a strain level of 0.1%, an overlapping loop was observed in all three cycles. This strain level was too low to induce a significant hysteresis effect. A negative piezoresistance was observed during both the loading and unloading segments for all strain levels including 0.1%, 0.5% and 1% (
Figure 6b,
Figure 7b and
Figure 8b). However, the resistance history flattened out with increasing maximum strain level and became very conspicuous at the maximum strain level of 1% (
Figure 8b).
Figure 6.
Data for a maximum strain of 0.1% during three cycles at a strain rate of 0.001 min−1: (a) Stress-strain curves; (b) Resistance history curves.
Figure 6.
Data for a maximum strain of 0.1% during three cycles at a strain rate of 0.001 min−1: (a) Stress-strain curves; (b) Resistance history curves.
Figure 7.
Data for a maximum strain of 0.5% during three cycles at a strain rate of 0.001 min−1: (a) Stress-strain curves; (b) Resistance history curves.
Figure 7.
Data for a maximum strain of 0.5% during three cycles at a strain rate of 0.001 min−1: (a) Stress-strain curves; (b) Resistance history curves.
It is worth mentioning that a mean stress of 1165 MPa with a standard deviation of 5.5% and a mean maximum resistance of 512 Ω with a standard deviation of 2.8% were obtained in the case of a maximum strain level of 1%, irrespective of cycle number, and a strain rate of 0.006 min−1.
Based on the experimental results obtained, it is hypothesized that there are two underlying phenomena governing the mechanical and electrical response of the CNT yarns: (1) an expansion of the carbon nanotubes in their bundles as they untwist during the loading segments that leads to a resistance increase and a contraction of the carbon nanotubes in the bundles during the unloading segments that leads to a resistance decrease; and (2) a lateral contraction of the carbon nanotube bundles due to Poisson’s effect during the loading segments that leads to a resistance decrease and a lateral expansion of the carbon nanotube bundles due to Poisson’s effect during the unloading segments that leads to a resistance increase. In the case of the higher strain rate, the first phenomenon dominates during both the loading and unloading segments. The findings of this study are consistent with previous results of other authors [
7]. In the case of the lower strain rate, the second phenomenon dominates during the loading segment and the first phenomenon dominates during the unloading segment. A decreasing resistance during loading at this same strain rate had been previously reported [
9,
13] and the experiments in this study revealed a similar trend.
Figure 8.
Data for a maximum strain of 1% during three cycles at a strain rate of 0.001 min−1: (a) Stress-strain curves; (b) Resistance history curves.
Figure 8.
Data for a maximum strain of 1% during three cycles at a strain rate of 0.001 min−1: (a) Stress-strain curves; (b) Resistance history curves.
3.3. Effect of Stress Relaxation
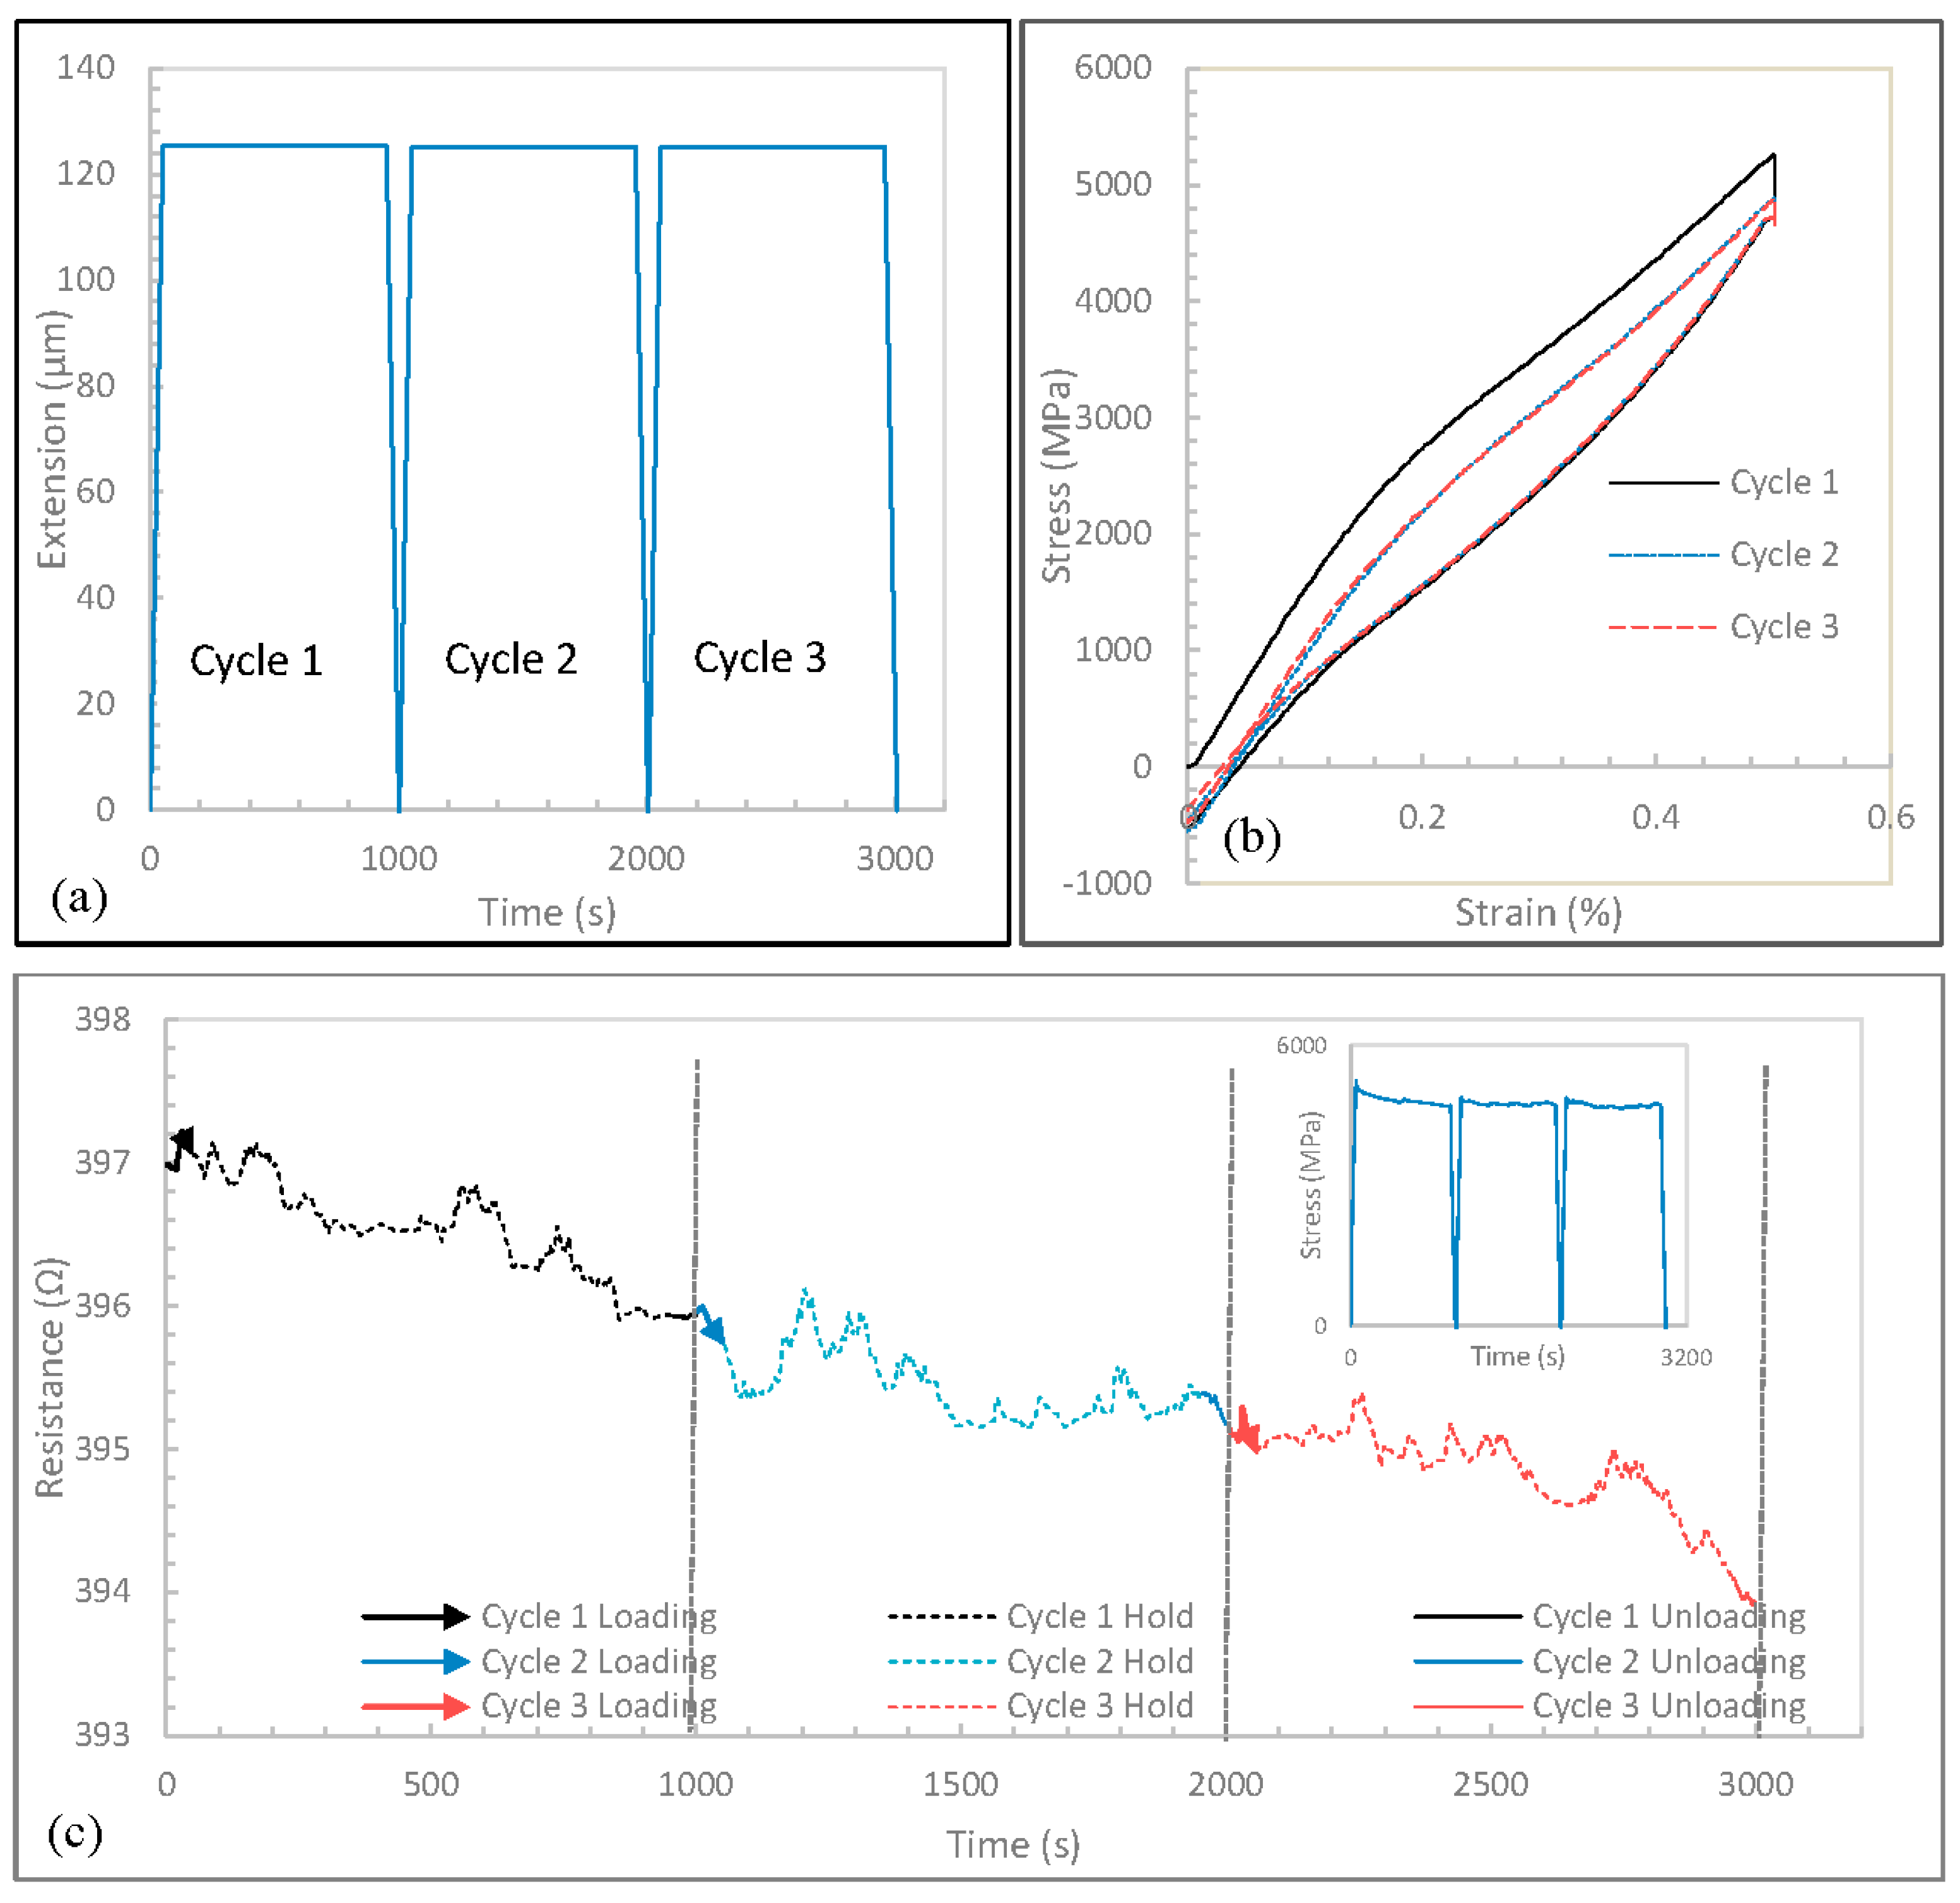
In order to determine time-dependent effects on the coupled mechanical and electrical response of the CNT yarn such as stress recovery and the change in resistance with time delays, the load was held during 15 min in between the loading and unloading segments and this was repeated during three cycles (
Figure 9a). At a strain rate of 0.006 min
−1 and a maximum strain level of 0.5%, the stress-strain curves are shown in
Figure 9b and the resistance increased with increasing strain during the first cycle but continued to decrease with increasing strain in subsequent cycles (
Figure 9c). Within the 15-min hold segment, the resistance continued to decrease even as the stress relaxes (
Figure 9c). This shows that the stress built up before the holding segments is sufficient to alter the electrical response of the strained CNT yarn. During the unloading segments, the resistance also continued to decrease. The decrease was still observed when the loading segment of the next cycle started. The decreasing resistance pattern could be due to localized stress that builds up across the CNT yarn unevenly due to its complex geometry. The same results were obtained for the CNT yarns tested at the lower strain rate of 0.001 min
−1. More experimental work is still needed to explain these observations.
Figure 9.
(a) Crosshead extension history exerted into the CNT yarn including hold segments of 15 min between the loading and unloading segments. Data for a maximum strain of 0.5% during 3 cycles at a strain rate of 0.006 min−1 with 15 min delay between loading and unloading segments: (b) Stress-strain curves; (c) Resistance history curves (Inset: stress history curve).
3.4. Effect of Two and Four Point Probe Measurements
As mentioned earlier, the measurement with two point probes includes the resistance of both the leads and the electrodes. In the experimental setup of this study, a second set of wires was used for sensing. The two inner wires are current-carrying probes and the other two are voltage-measuring probes. Because of the high input impedance, there is negligible current in the sensing circuit so there is no useful Current-Resistance (I-R) drop in the leads, and the voltage seen by the sensing terminals is the same as the voltage developed across the unknown lead [
14]. The contact and spreading resistance associated with the voltage probes are negligible, thus yielding an accurate calculation of the CNT yarn’s resistance. The resistance history and the relative delta resistance history of both measurement methods at a strain rate of 0.006 min
−1 are presented in
Figure 10a,b, respectively. A difference of 56.3 Ω in the initial resistance was observed between the two methods (
Figure 10a). Thus, two point probe measurement is not suitable for low resistance measurements due to the I-R drop in the test leads. After 1 min, the delta resistance was determined to be 3.3 Ω using two point probe measurements and 1 Ω using four point probe measurements. Although the delta resistance values remain within the same order of magnitude, they significantly affect the slope in the relative delta resistance
versus strain curves (
Figure 10b). Similar results were obtained at a strain rate of 0.001 min
−1.
Figure 10.
Results for two point and four point probe measurements at a strain rate of 0.006 min−1: (a) Resistance history curves; (b) Relative delta resistance history curves.
Figure 10.
Results for two point and four point probe measurements at a strain rate of 0.006 min−1: (a) Resistance history curves; (b) Relative delta resistance history curves.
4. Conclusions
It is desired of a strain-sensitive material to be devoid of characteristics like creep and hysteresis. By subjecting an unconstrained carbon nanotube yarn to single and multiple tensile loading-unloading cycles, the hysteresis and time-dependent effects on its coupled mechanical and electrical characteristics were observed during uniaxial tensile loading. It was determined that the strain rate significantly affects the mechanical and electrical response of the carbon nanotube yarns.
In the case of the higher strain rate, the resistance of the carbon nanotube yarn increases with increasing strain and decreases with decreasing strain for all maximum strain levels, 0.1%, 0.5% and 1%. It was observed that the maximum resistance in each cycle increases with increasing maximum strain level. It was also observed that as the maximum strain level increases, the difference in delta resistance between loading and unloading segments decreases. It is hypothesized that there are two underlying phenomena that govern the mechanical and electrical response of the carbon nanotube yarns: (1) an expansion of the carbon nanotubes in the bundles during the loading segments that leads to a resistance increase and a contraction of the carbon nanotubes in the bundles during the unloading segments that leads to a resistance decrease; and (2) a lateral contraction of the carbon nanotube bundles due to Poisson’s effect during the loading segments that leads to a resistance decrease or a lateral expansion of the carbon nanotube bundles due to Poisson’s effect during the unloading segments that leads to a resistance increase. In the case of the higher strain rate, the first phenomenon dominates during both the loading and unloading segments.
In the case of the lower strain rate, the resistance of the carbon nanotube yarn decreases both with increasing strain and with decreasing strain. This resistance reduction tends to decrease with increasing number of cycles. At a low strain level, 0.1%, the stress-strain exhibits almost no hysteresis and the resistance history exhibits barely noticeable peaks. However, at higher strain levels, 0.5% and 1%, hysteresis is observed in the stress-strain curves and the resistance history starts to flatten out. In the case of this lower strain rate, the second phenomenon dominates during the loading segment and the first phenomenon dominates during the unloading segment.
It is worth mentioning that it is difficult to control or measure certain parameters of the carbon nanotube yarns including the amount of defects attributed to production like the amount of residual metal catalyst from material synthesis, the alignment of the carbon nanotubes, and the distribution of chirality of the nanotubes in the yarn. Similarly, errors during the sample preparation in the laboratory and environmental testing conditions could affect the overall response of the carbon nanotube yarn. The latter was minimized by careful preparation and by running several samples but it was difficult to quantify the former given the complexity of the morphology and characteristics of carbon nanotube yarns and the difficulty in growing carbon nanotubes with controlled chirality. Testing the carbon nanotube yarn up to a maximum strain of 1%–2% or until failure could further determine if hysteresis and other time-dependent effects are present during these ranges. In addition, monitoring the evolution of the morphology of the carbon nanotube yarn including the cross-sectional area changes during loading and unloading could also improve the understanding of their coupled mechanical and electrical response.
Acknowledgments
The authors thank Tareq Alosh for insightful observations and comments about this research, Khawla AlHamdan for preparing the testing samples, and all the students in the Intelligent Materials laboratory at The Catholic University of America for their logistical support. Abot thanks also Kalayu Belay at Florida A&M University for his continuing collaborative support. Abot acknowledges the financial support from the Air Force Office of Scientific Research (AFOSR) through Grants FA9550-10-1-0040 and FA9550-15-1-0177, both with program officer David Stargel, and from the National Aeronautics Space Administration (NASA) District of Columbia Space Grant Consortium (DCSGC) through Grant 31154.
Author Contributions
Jude C. Anike and Angeline Bajar conducted the experiments. Jude C. Anike and Jandro L. Abot co-wrote the paper.
Conflicts of Interest
The authors declare no conflict of interest.
References
- Zhang, M.; Atkinson, K.R.; Baughman, R.H. Multifunctional carbon nanotube yarns by downsizing an ancient technology. Science 2004, 306, 1358–1361. [Google Scholar] [CrossRef] [PubMed]
- Lu, W.; Zu, M.; Byun, J.-H.; Kim, B.-S.; Chou, T.-W. State of the art of carbon nanotube fibers: Opportunities and challenges. Adv. Mater. 2012, 24, 1805–1833. [Google Scholar] [CrossRef] [PubMed]
- Abot, J.L.; Schulz, M.J.; Song, Y.; Medikonda, S.; Rooy, N. Novel distributed strain sensing in polymeric materials. Smart Mater. Struct. 2010, 19, 085007. [Google Scholar] [CrossRef]
- Abot, J.L.; Song, Y.; Sri Vatsavaya, M.; Medikonda, S.; Kier, Z.; Jayasinghe, C. Delamination detection with carbon nanotube thread in self-sensing composite materials. Compos. Sci. Technol. 2010, 70, 1113–1119. [Google Scholar] [CrossRef]
- Jayasinghe, C.; Li, W.; Song, Y.; Abot, J.L.; Shanov, V.N.; Fialkova, S. Nanotube responsive materials. MRS Bull. 2010, 35, 682–692. [Google Scholar] [CrossRef]
- Abot, J.L.; Bajar, A.; Anike, J. Hysteresis and Time-Dependent Effects on the Coupled Mechanical-Electrical Response of Unconstrained Carbon Nanotube Yarns Subjected to Uniaxial Tensile Loading. In Proceedings of the 30th American Society for Composites Conference, Lansing, Michigan, USA, 28–30 September 2015.
- Lekawa-Raus, A.; Koziol, K.K.K.; Windle, A.H. Piezoresistive effect in carbon nanotube fibers. ACS Nano 2014, 8, 1114–1124. [Google Scholar] [CrossRef] [PubMed]
- Zhao, H.; Zhang, Y.; Bradford, D.; Zhou, Q.; Jia, Q.; Yuan, G.; Zhu, Y. Carbon nanotube yarn strain sensors. Nanotechnology 2010, 21, 305502. [Google Scholar] [CrossRef] [PubMed]
- Abot, J.L.; Alosh, T.; Belay, K. Strain dependence of electrical resistance in carbon nanotube yarns. Carbon 2014, 70, 95–102. [Google Scholar] [CrossRef]
- Alosh, T. Electrical Resistivity Dependence on Mechanical Stresses in Carbon Nanotube Yarns. Master’s Thesis, The Catholic University of America, Washington, DC, USA, 2013. [Google Scholar]
- Schulz, M.; Shanov, V.; Yin, Z. Nanotube Superfiber Materials: Changing Engineering Design; Elsevier: Oxford, UK, 2014. [Google Scholar]
- Miao, M. Yarn spun from carbon nanotube forests: Production, structure, properties and applications. Particuology 2013, 11, 378–393. [Google Scholar] [CrossRef]
- Bajar, A. Hysteresis and Time-Dependent Effects on the Coupled Mechanical-Electrical Response of Carbon Nanotube Yarns Subjected to Tensile Loading. Master’s Thesis, The Catholic University of America, Washington, DC, USA, 2015. [Google Scholar]
- Keithley Instruments, Inc. I-V Measurements of Nanoscale Wires and Tubes with the Model 4200-SCS and Zyvex S100 Nanomanipulator; Application Note Series 2004, No. 2481; Keithley Instruments, Inc.: Solon, OH, USA.
© 2016 by the authors. Licensee MDPI, Basel, Switzerland. This article is an open access article distributed under the terms and conditions of the Creative Commons by Attribution (CC-BY) license ( http://creativecommons.org/licenses/by/4.0/).


