Article

Polymerization of Vinylpyrrolidone to Form a Neutral Coating on Anionic Nanomaterials in Aqueous Suspension for Rapid Sedimentation

Department of Chemistry, Carleton University, 1125 Colonel by Drive, Ottawa, ON K1S 5B6, Canada
*
Author to whom correspondence should be addressed.
Coatings 2014, 4(2), 340-355; https://doi.org/10.3390/coatings4020340
Submission received: 7 February 2014 / Revised: 29 April 2014 / Accepted: 9 May 2014 / Published: 20 May 2014
(This article belongs to the Special Issue Effects of Polymer Coatings on Toxicity of Nanomaterials)

Abstract

:
Nanomaterials in water present an array of identifiable potential hazards to ecological and human health. There is no general consensus about the influence of anionic or cationic charge on the toxicity of nanomaterials on environmental ecology. One challenge is the limited number of scalable technologies available for the removal of charged nanomaterials from water. A new method based on polymer coating has been developed in our laboratory for rapid sedimentation of nanomaterials in aqueous suspension. Using colloidal silica as a model inorganic oxide, coating of polyvinylpyrrolidone (PVP) around the SiO2 nanoparticles produced SiO2@PVP particles, as indicated by a linear increase of nephelometric turbidity. Purification of the water sample was afforded by total sedimentation of SiO2@PVP particles when left for 24 h. Characterization by capillary electrophoresis (CE) revealed nearly zero ionic charge on the particles. Further coating of polydopamine (PDA) around those particles in aqueous suspension produced an intense dark color due to the formation of SiO2@PVP@PDA. The SiO2@PVP@PDA peak appeared at a characteristic migration time of 4.2 min that allowed for quantitative CE-UV analysis to determine the original SiO2 concentration with enhanced sensitivity and without any ambiguous identity.

1. Introduction

Nanomaterials are well known for their technological importance due to unique biological, chemical and physical properties at the nanoscopic scale [1]. Maynard has estimated that the production of engineered nanomaterials will reach 58,000 tons between 2011 and 2020, which represents a large increase from the 2004 estimate of only 2000 tons [2]. Nanoparticles are used in a wide range of products for biomedicine, cosmetics, electronics, environmental technologies, pharmaceuticals and textiles [3,4,5,6,7]. In the field of photodynamic therapy, photosensitizers have been linked to silica nanoparticles in order to combine their photophysical and biological properties [8], for conditioning the uptake into target cells. Disposal of these products will inevitably lead to unintended contamination of downstream wastewaters [9,10,11,12]. The presence of nanomaterials in nature may cause hazardous biological effects due to frequent interactions with biotic and abiotic components of the ecosystems [13], and nano-silica has been found in the gastrointestinal tract [14]. Researchers are concerned about the surface charge of nanomaterials, especially the cytotoxicity of cationic nanoparticles due to their strong interaction with cell membranes [15,16]. Anionic silica (SiO2) nanoparticles can aggravate cardiovascular toxicity by involving oxidative stress in inflammatory reaction [17], apoptosis [18], and endothelial dysfunction in rats [19]. They can also induce acute inflammation in the liver, generate mitochondrial dysfunction, and eventually cause hepatocyte necrosis in mice [20]. The synergistic toxicity of SiO2 nanoparticles with cadmium chloride has been reported [21]; Cd-SiO2 nanoparticles induced mortality (about 50%) at 1 μg/mL and CdCl2 at 25 μg/mL [22]. SiO2–COO NP had a slower agglomeration rate, formed smaller aggregates, and exhibited lower cytotoxicity compared to SiO2 and SiO2–NH2 [23].
Currently the biggest challenge is the limited number of scalable technologies available for the removal of nanomaterials from water. W.L. Gore & Associates and CT Associates have discovered a method for removing nanoparticles from ultra-pure water, which is highly useful for semiconductor manufacturers [24]. Their method involves evaporating water into an aerosol, which enables the capture of nanoparticles since they are forced to remain in the gas phase. Another strategy would be binding of nanomaterials with specific agents and surfactants for coagulation and subsequent sedimentation in water treatment [25]. Liu and coworkers added aluminum chloride to modify the surface physicochemical properties of nanosilica in order to produce aggregates. More than 99% of the turbidity was removed after sedimentation [26]. Critical coagulant concentrations of 0.01–0.1 mM cetyltrimethylammonium bromide were also determined for the aggregation of silica nanoparticles in the size range from 30 to 75 nm [27], and the adsorption films of silica nanoparticles modified by a cetyltrimethylammonium bromide at the air–water interface were investigated by dilational surface rheology and optical methods [28].
Generally, surface coatings of nanomaterials are applied in order to selectively change distinct particle properties such as their ionic charge. Polyvinylpyrrolidone (PVP) is soluble in water and is non-toxic [29,30]. It has been used as a coating agent for iron oxide nanoparticles to enhance magnetic resonance imaging (MRI) contrast [31], and palladium nanoparticles for the study of H2–O2 reaction kinetics in water [32]. The primary objective of our present work was to investigate the growth of PVP on nanomaterials suspended in water that could result in precipitation within 24 h. Colloidal silica (SiO2) is commercially available and can be used as a model inorganic oxide nanomaterial. SiO2 nanoparticles were chosen as a good model mainly for the reason that DNA damage was evident at 0.1 μg/mL and cytotoxicity was observed at nanoparticle concentrations above 1 μg/mL [33]. Insight into the PVP growth mechanism was gained through UV-visible spectroscopy and turbidimetry. Our ultimate goal would be to attain an efficient and cost-effective method for the removal of nanomaterials in water. Simultaneous removal of other hazardous compounds in water would be possible using the SiO2@PVP nanoparticles as a solid phase extraction (SPE) substrate.

2. Experimental Section

2.1. Materials

The compound 2,2'-Azobis(2-isobutyronitrile) (AIBN) was bought from Pfaltz & Bauer (Waterbury, CT, USA). Absolute ethanol (EtOH, reagent grade, ≥95%), disodium hydrogen phosphate (Na2HPO4, ≥99%), dopamine hydrochloride (DA.HCl, ≥99.5%), hydrochloric acid (HCl, reagent grade, 37% aqueous solution), mesityl oxide (MO, ≥90%), sodium dodecyl sulfate (SDS, ≥99%), sodium hydroxide (NaOH, 99.99%) and 1-vinyl-2-pyrrolidone (VP, ≥99%) were all obtained from Sigma-Aldrich (Oakville, ON, Canada). Titanium dioxide nanopowder was purchased from Anachemia Chemicals (Montreal, QC, Canada). HPLC-grade methanol (MeOH) was purchased from Caledon (Georgetown, ON, Canada). LUDOX® AM colloidal silica (SiO2, 30% suspension in H2O) was commercially available from Sigma-Aldrich with a surface area of 198–250 m2/g [33]. Analysis of a dry sample by TEM revealed nanospheres with a mean diameter of 14 ± 3 nm.

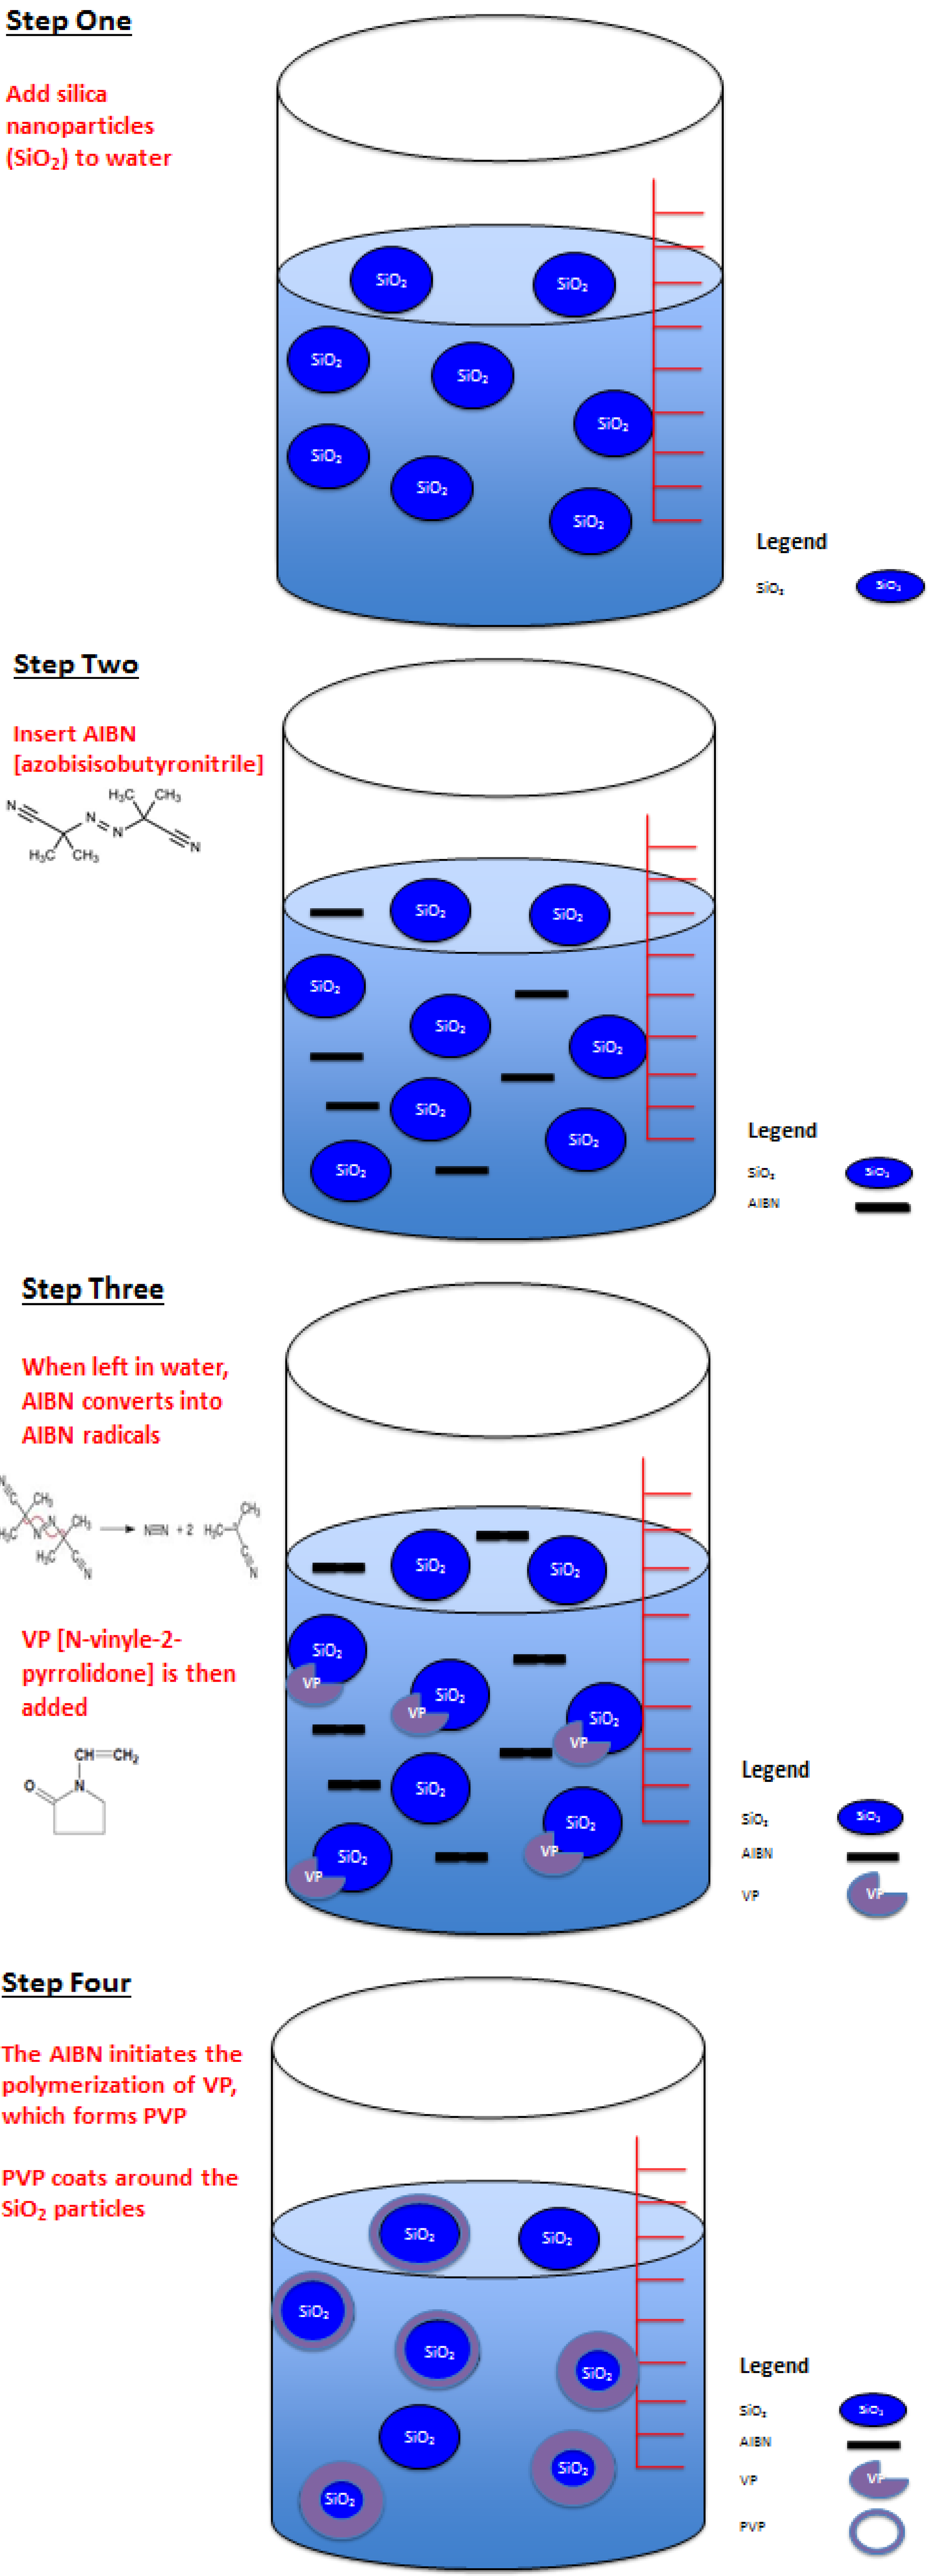
2.2. Polypyrrolidone and Polydopamine Growth on Nanomaterials in Water

Coating of nanomaterials with VP was adopted from a method previously reported [34], with modifications. Different amounts of dopamine (DA) (0 or 10 g/L), colloidal SiO2 (1.5 mL of 30 wt%) and VP (20–50 µL) were added into 2 mL of 20 mM Na2HPO4 (pH 8.5 ± 0.2) background electrolyte (BGE) in a glass vial, and the mixture was left at ambient condition for PDA growth on the nanoparticles. Measured amounts of DA and colloidal SiO2 were directly added into another glass vial without BGE. The pH was increased to 13.0 by adding 60 µL of 1.5 M NaOH, and a temperature of 90 °C [35] was applied using a BioShake iQ 3000-rpm thermoshaker (Quantifoil Instruments, Jena, Germany) to study the formation of a PDA coating around the SiO2@PVP particles by CE-UV analysis.

2.3. Ultraviolet-Visible Spectroscopy

Ultraviolet-visible (UV-Vis) spectroscopy was done to monitor the growth of PVP on SiO2 particles under different pH and temperature conditions. A Genesys 10S series UV-Vis spectrophotometer (Thermo Scientific, Madison, WI, USA) was used to measure the UV-Vis absorption spectra of VP (1 g/L) solution and SiO2@PVP (SiO2 = 10 g/L, VP = 1 g/L and AIBN = 10 mg/L) particles in aqueous suspension to study the polymerization kinetics.

2.4. Turbidimetry and Dynamic Light Scattering

After ultrasonication for 15 min, particles in aqueous suspension were analyzed for turbidity on a Hach 2100 turbidimeter (Loveland, CO, USA) at 15–45 min and the results were expressed in nephelometric turbidity units (NTU). Dynamic light scattering (DLS) analysis of freshly prepared particles in aqueous suspension was performed on a Brookhaven nanoDLS analyzer (Holtsville, NY, USA) to determine their hydrodynamic diameter and to measure their size distribution (n ≥ 50).

2.5. CE-UV Analysis

CE analyses were performed on a lab-built system including a Spellman CZE1000R high voltage power supply (Hauppauge, NY, USA). The fused silica capillary was purchased from Polymicro Technologies (Phoenix, AZ, USA). The BGE was composed of 10–20 mM Na2HPO4 in distilled deionized water to attain pH 7.5–8.5. The capillary was equilibrated with the BGE at an ambient temperature of 22 ± 2 °C. The colloidal silica particles were suspended in water at pH 8.6–9.3, which were loaded into the capillary by electrokinetic injection at 17 kV for 3–6 s. Electrophoretic separation was conducted under an applied voltage of 20 kV. A Bischoff Lambda 1010 (Leonberg, Germany) UV detector was employed to monitor the migration of particles at a wavelength of 190 nm. The detector output signal was acquired by SRI Instruments Peak Simple model 203 (Torrance, CA, USA) chromatography data software. At the end of each CE analysis, the capillary was conditioned by running the buffer for an additional minute before starting the next analysis. A neutral marker, mesityl oxide, was analyzed separately by CE-UV for determining the migration time of uncharged analytes.

3. Results and Discussion

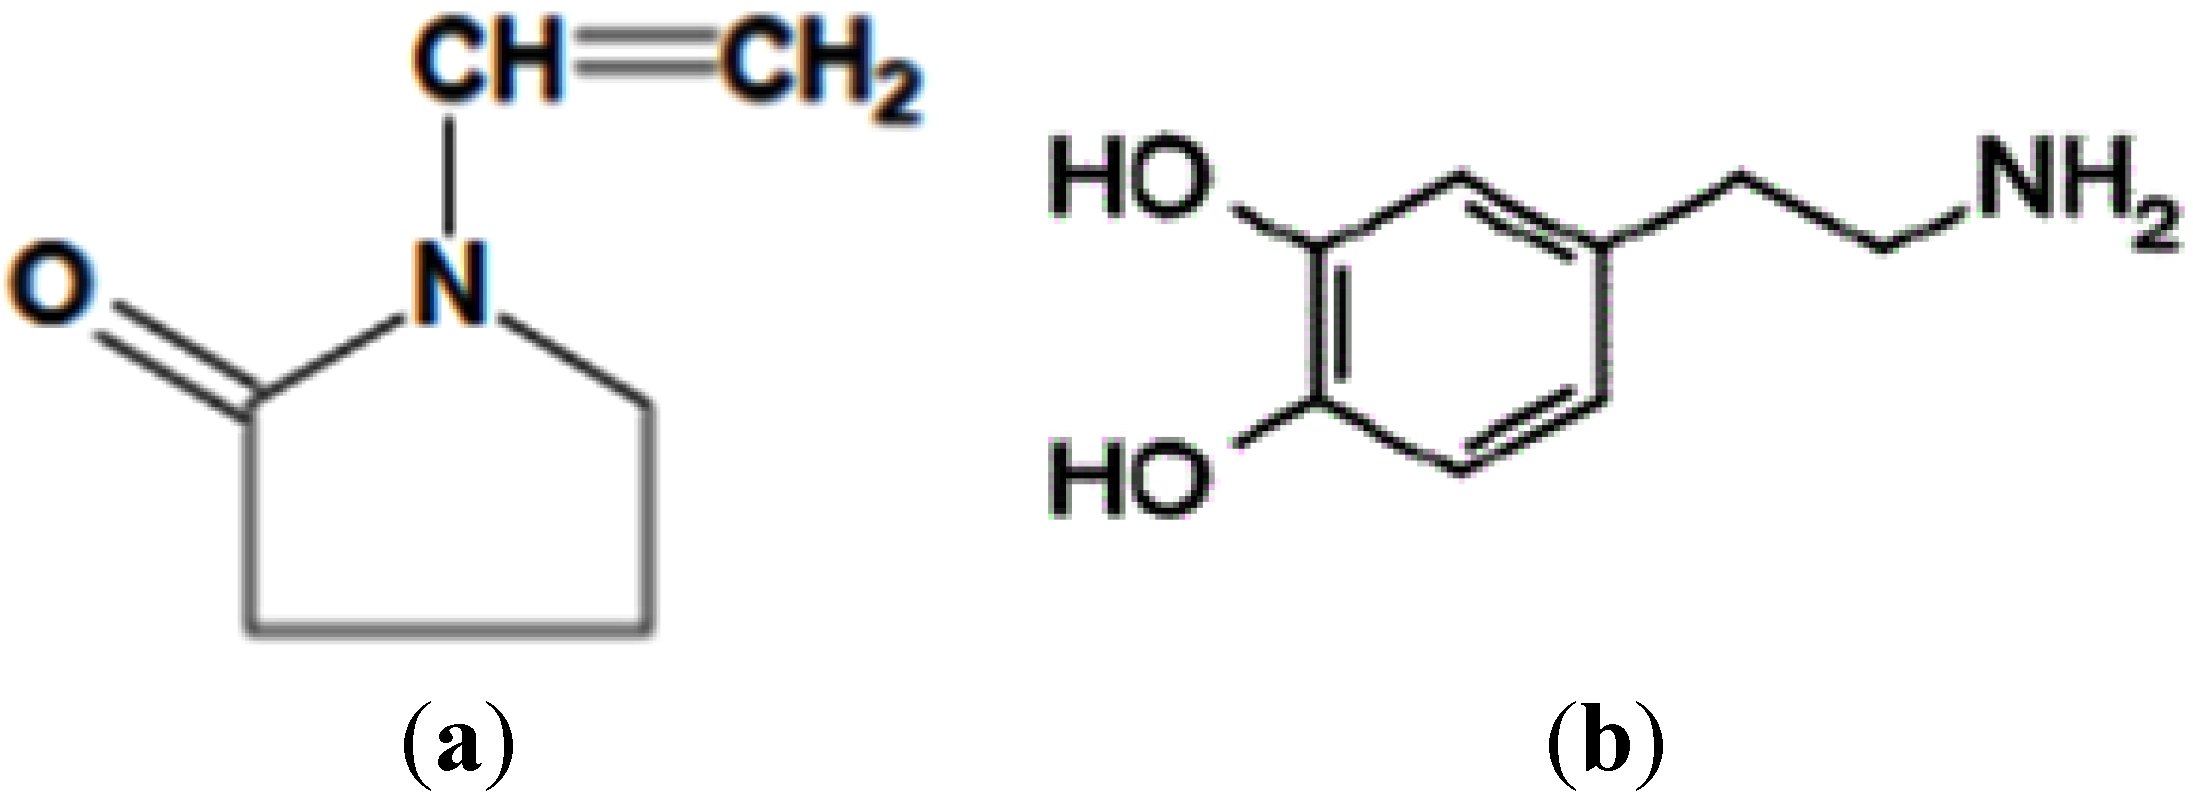
3.1. Model Nanomaterial

Silica nanoparticles have enhanced adsorption to allow polymer coating through adhesion [36]. This property is related directly to the surface area of the nanoparticles, which is dependent on their size. The smaller the SiO2 nanoparticle is, the higher the concentration of Si–H and ≡Si–OH groups on its surface. These two hydrogen related species increase the chemical reactivity of the nanoparticles. The nanoparticles also contain neutral Si bonds, neutral oxygen deficient centers (≡Si–Si≡) and self-trapped exciton which can alter the extent of PVP adhesion. Furthermore, the surface of SiO2 nanoparticles is negatively charged with zeta potentials of −45 to −52 mV for 20–100 nm diameters [37]. This high negative potential creates repulsive forces that prevent aggregation of the nanoparticles in the BGE during CE analysis.

3.2. Polyvinylpyrrolidone Growth on Nanomaterial in Water

In order for a polymer to coat SiO2 nanoparticles in an aqueous suspension, it must have unique properties such as adhesion, solubility, cross-linking, and rapid polymerization with no heat required. As illustrated in Figure 1, N-vinyl-2-pyrrolidone (VP) is a strong proton acceptor, and cross-linkable. The radical polymerization of VP can be initiated with azobisisobutyronitrile (AIBN) which forms two 2-cyanoprop-2-yl radicals. These radicals will then react with VP to form a long chain until the propagation is terminated by reaction with a hydroxy radical [38]. Polyvinylpyrrolidone (PVP) is adhesive to metals, plastics, and nanoparticles [39]. Its solubility remains the same regardless of the pH of water. As a proton acceptor, PVP will interact with hydrogen-rich functional groups (such as silane and silanol) on the surface of SiO2 particles. The PVP coating gradually grows around each SiO2 nanoparticle to form SiO2@PVP particles that appeared white in the aqueous suspension just as a normal colloidal phenomenon. The white particles settle down at the bottom if the sample is left standing for 24 h or more. Nathanson and co-workers had previously tagged PVP directly onto SiO2 nanoparticles for the purification of human blood monocytes by isopycnic centrifugation on discontinuous density gradient [40]. In our work, PVP-coating of SiO2 nanoparticles started with the monomer VP. Their interaction became a very important phenomenon to study. Luckily the growth of PVP on SiO2 particles could be visually observed as a white coloration in the sample vial. No modification of the nanoparticles through surface absorption or reaction with small molecules (such as silane coupling agents) was necessary [41]. All samples prepared using different initial concentrations of SiO2 and VP were analyzed by FTIR to confirm a coating of PVP on SiO2. Several instrumental methods were employed to determine the rate of PVP growth around the nanoparticles as detailed below.
Figure 1. Molecular structures of monomers: (a) N-vinyl-2-pyrrolidone; and (b) dopamine.
Coatings 04 00340 g001
The polymerization of dopamine is initiated by oxygen radicals. A re-arrangement occurs, at pH 8.8 when NaOH is added/present, leading to the formation of 5,6-dihydroxyindole. The propagation then leads to the formation of polydopamine.
Different concentrations of VP were added to SiO2 nanoparticles in aqueous suspension, followed by addition of AIBN to initiate the polymerization. The samples were then either left on the bench for thirty minutes, or heated continuously at 60 °C for 10 min to speed up the polymerization. The physical changes are shown in Figure 2. Precipitation of SiO2@PVP was visible 24 h later to complete this procedure.
Figure 2. Formation of SiO2@PVP (polyvinylpyrrolidone).
Coatings 04 00340 g002
The formation of PDA layer on SiO2@PVP is due to the addition of 10 g/L of dopamine followed by the addition of 60 µL of 1.5 M of NaOH. The samples were then heated using the bio-shaker at 90 °C for 10 min.

3.3. UV-Visible Spectroscopy
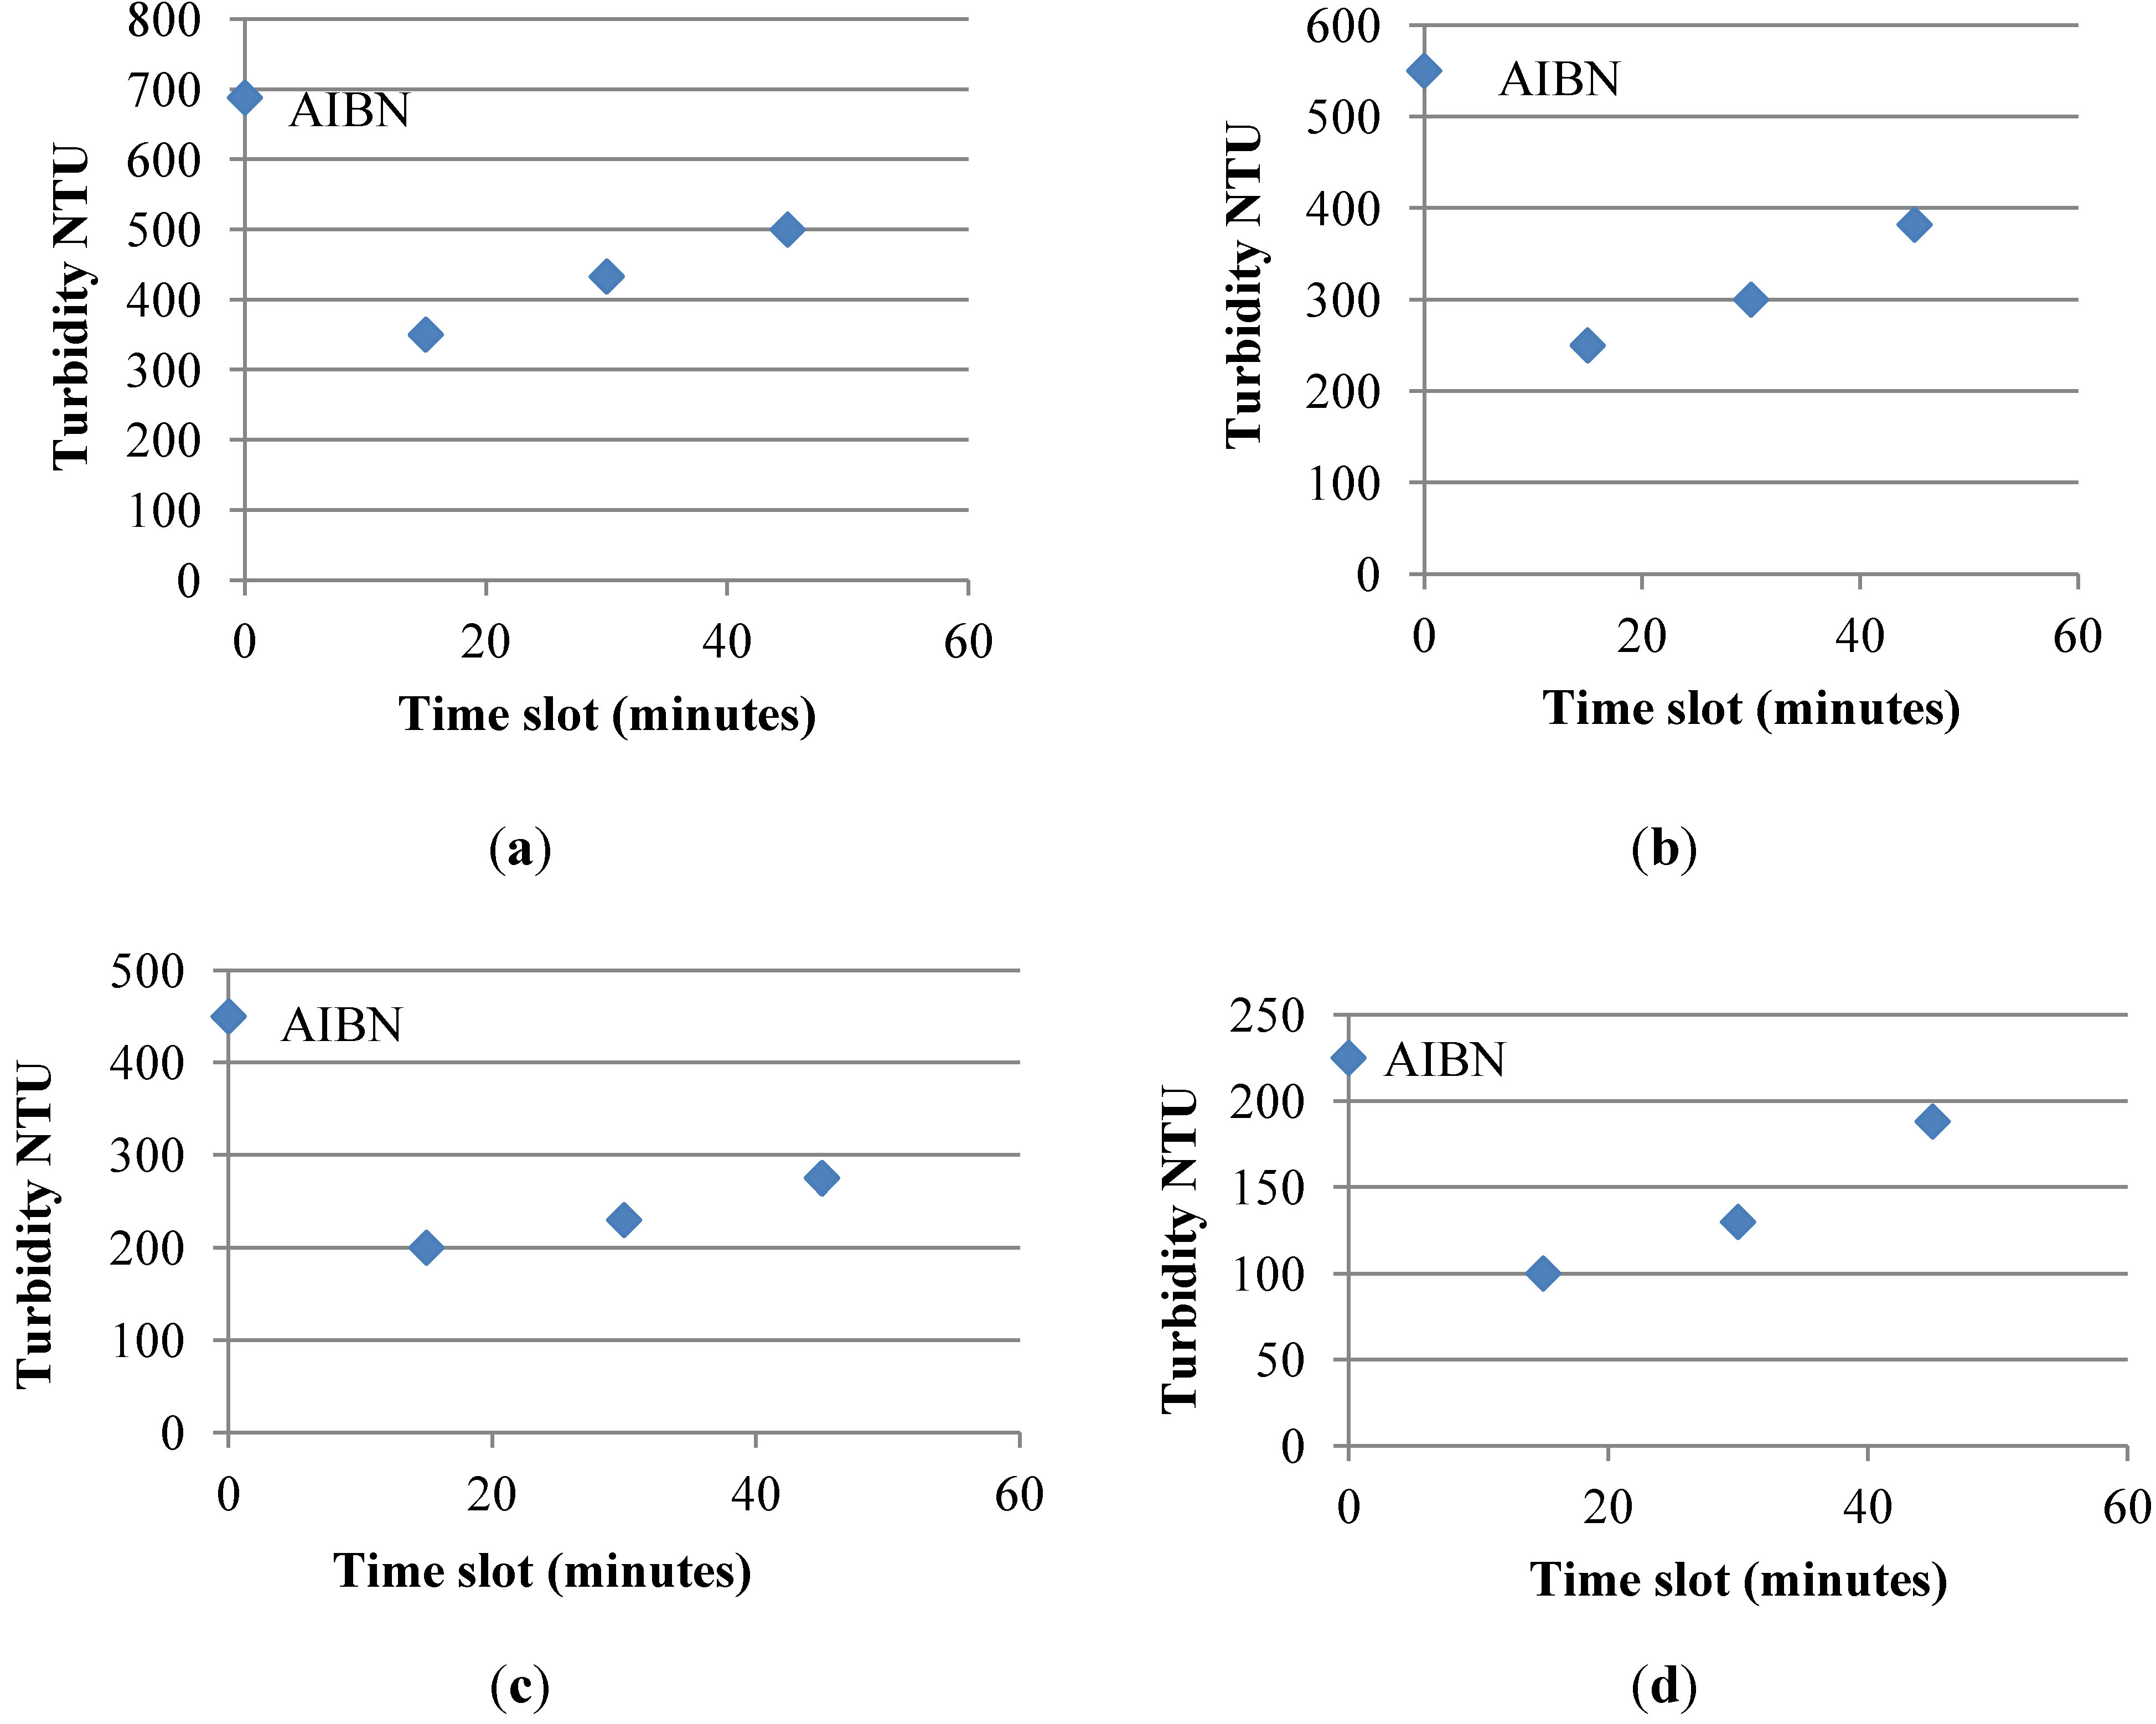
A range of samples containing SiO2@PVP particles were analyzed by UV-visible spectroscopy. The VP spectrum exhibited a peak with maximum absorption at 287 nm. Each carbonyl group behaved as a chromophore unit with nπ* and ππ* excited states [42]. The PVP spectrum showed an absorption peak at the same wavelength, albeit with a higher intensity due to a large number of repeating carbonyl groups in the macromolecule. In Figure 3, the UV-Vis spectra for four samples containing the same amount of silica, AIBN, but increasing concentration of VP show a pattern of increasing absorbance after polymerization over four days. A higher monomer concentration leads to the formation of a larger amount of polymer. The rate of polymerization is directly related to the monomer concentration, as expected for ideal kinetics. The higher the rate of polymerization, the higher the PVP growth, with less monomer left. Furthermore, different concentrations of silica were analyzed using UV-Vis at a wavelength of 279 nm to obtain different absorbance results.
Figure 3. The UV-Vis spectra for samples #1 to #4 containing 10 mg of AIBN, 1.5 mL of 30% silica and 20, 30, 40 or 50 µL of N-vinyl-2-pyrrolidone, respectively.
Coatings 04 00340 g003

3.4. Turbidimetry

The particle size and concentration had a direct effect on the turbidity of samples containing nanoparticles. At low concentrations of SiO2, the turbidity result would stay the same regardless of the particle size [43]. The higher the SiO2 concentration, on the other hand, the higher the variation of turbidity results with different particle sizes. It is not scientifically possible to determine the concentration of particles based on turbidity without knowing the nature of particles. Also, the concentration can only be known if the particles are mono-dispersed. In our work, the purpose of measuring turbidity values was to monitor the extent of polymer growth on the silica colloid used (30% by weight with an average particle size of 14 ± 2 nm). An increasing trend of turbidity value versus polymerization time was observed in Figure 4 to indicate PVP growth. The turbidity of samples just containing silica had an average value of 100 ± 5 NTU. After the addition of 50 µL of VP and 10 mg of AIBN to one SiO2 sample, it was heated at 60 °C for 60 min and its turbidity was then tracked for 4 days. As PVP grew around the SiO2 nanoparticles, the turbidity increased linearly due to increasing particle sizes with time. On the other hand, visual observations over the four days served as another indication of growth of PVP around silica. The sample after one day was visualized to be a suspension of white particles. The suspended particles increased their sizes as the next three days went by. On the fourth day, the sample had suspended white particles along with many white precipitates on the inside wall of the vial.
Figure 4. Turbidity values versus polymerization time for a sample containing 10 mg of AIBN, 1.5 mL of 30% silica, and 70 µL of N-vinyl-2-pyrrolidone.
Coatings 04 00340 g004
Several samples containing SiO2@PVP particles prepared from 30% SiO2 and different concentrations of VP were heated for an hour at 60 °C. Their turbidity values were then measured every fifteen minutes for plotting in Figure 5. The heat led to faster polymerization for all four samples, giving each a linear trend of increasing turbidity over just 50 min. The sample with the highest VP concentration had the highest polymerization growth and hence the highest turbidity values. On the other hand, the sample with the lowest VP concentration had the lowest polymerization growth and hence the lowest turbidity values. All samples started with a very high turbidity value (as indicated by the point labeled AIBN at 0 min) due to the presence of AIBN before heating. Once the heating started, the AIBN got used up and hence the turbidity value decreased precipitously to the data point measured at 15 min. As the polymerization continued to propagate for every fifteen minutes of heating, the turbidity of each sample increased linearly corresponding to the growth of PVP around the SiO2 nanoparticles.

3.5. Dynamic Light Scattering (DLS)

The hydrodynamic diameters were measured for SiO2, SiO2@PVP and SiO2@PVP@PDA using DLS. Average values of 90 ± 1 nm, 96 ± 2 nm and 100 ± 2 nm were obtained. Obviously the larger size of SiO2@PVP verified the coating of SiO2 with PVP, in accordance with the higher turbidity results presented in Figure 4 and Figure 5. The DLS measurements were meant to be characterization of the particles only; no aggregation or sedimentation over time was measured.
Figure 5. Turbidity values versus heating time at 60 °C for four samples containing 10 mg of AIBN, 1.5 mL of 30% silica and different volumes (a) 60 µL; (b) 50 µL; (c) 40 µL; (d) 30 µLof vinyl-2-pyrrolidone (VP) in a total volume of 2.0 mL. A reference value is included for 2,2'-azobis(2-isobutyronitrile) (AIBN) at 0 min.
Coatings 04 00340 g005

3.6. CE-UV Analysis

Capillary electrophoresis (CE) with ultra-violet (UV) detection is a highly efficient technique available for the separation of nanomaterials in water [44,45,46]. The use of CE is advantageous due to its ability to separate any anionic and cationic analytes from neutral ones, low sample volume requirement, simple instrumentation, short analysis time, small buffer volumes, and excellent separation efficiency. The behavior of bare SiO2 nanoparticles in CE-UV analysis has previously been reported in our early work [47]. As shown in Figure 6a, a migration time of 2.9 ± 0.2 min is observed for a neutral marker such as mesityl oxide (MO). In Figure 6b, only a VP peak appears at 3.0 ± 0.1 min followed by an irregular SiO2 peak at 4.5–6.4 min. With AIBN present, Figure 6c exhibits a strong PVP peak at 3.1 ± 0.1 min and a weak SiO2 peak. This diminishing SiO2 peak serves as good evidence for the coating of SiO2 by PVP. The newborn SiO2@PVP peak is probably covered by the PVP peak. A higher initial concentration of VP in Figure 6d leads to a strong SiO2@PVP peak at 3.4 ± 0.2 min and no SiO2 peak. Apparently, coating of PVP around the SiO2 particles effectively covered up their negative charges to produce the SiO2@PVP peak at a migration time that suggested a small negative charge. The only drawback is that the SiO2@PVP peak can be confused with the PVP peak to make the quantification of SiO2 rather ambiguous.
Figure 6. Capillary electrophoresis with ultra-violet detection (CE-UV) electropherograms of (a) mesityl oxide (20 mM) in 10 mM Na2HPO4 BGE; (b) a mixture of N-vinylpyrrolidone (14 g/L) and 30 wt% silica suspension; (c) residual N-vinylpyrrolidone (initial concentration = 28 g/L), polyvinylpyrrolidone, and polyvinylpyrrolidone-coated silica nanoparticles; and (d) residual N-vinylpyrrolidone (initial concentration = 42 g/L), polyvinylpyrrolidone, and polyvinylpyrrolidone-coated silica nanoparticles. Electrokinetic injection at 17 kV for 3 s; CE analysis at 20 kV. UV detection at 190 nm; y-scale is presented in milli absorbance units (mAU).
Coatings 04 00340 g006

3.7. Polydopamine Coating

For better analytical visibility, DA and NaOH were introduced to the white SiO2@PVP particles in aqueous suspension. Coating of PDA around the particles was observed through the production of an intense dark color. As shown in Figure 7, four samples contained different concentrations of SiO2 and VP (albeit at a constant mole ratio of 1:1) but same amounts of AIBN, DA and NaOH. This dark color proved that PDA formed a coating around the SiO2@PVP particles. However, the lower the concentrations of SiO2 and VP in the sample, the darker it became after addition of DA and NaOH. These samples were next analyzed by UV-visible spectrophotometry and the results are summarized in Table 1 to confirm the visual observation. Further investigation will be needed to unravel the mechanistic details.
Figure 7. All samples contained 10 mg AIBN, 250 µL of 10 g/L DA, 60 µL of 1.5 M NaOH. (a) 50 µL of VP + 1.50 mL of 22.5 wt% SiO2; (b) 40 µL of VP + 1.25 mL of 22.5 wt% SiO2 (in duplicate); (c) 30 µL of VP + 1.00 mL of 22.5 wt% SiO2; and (d) 20 µL of VP and 0.75mL of 22.5 wt% SiO2.
Coatings 04 00340 g007
Table 1. UV-visible spectrophotometric analysis of four samples containing different concentrations of SiO2 and vinyl-2-pyrrolidone (VP) (albeit at a constant mole ratio of 1:1) but the same amounts of azobisisobutyronitrile (AIBN) (10 mg), DA (250 µL of 10 g/L) and NaOH (60 µL of 1.5 M).
Sample componentsWavelength of maximum absorbance (nm)Maximum absorbance (a.u.)Color
50 µL of VP + 1.50 mL of 22.5 wt% SiO22983.31Light brown
40 µL of VP + 1.25 mL of 22.5 wt% SiO24923.56Dark brown
30 µL of VP + 1.00 mL of 22.5 wt% SiO25254.64Very dark brown
20 µL of VP + 0.75 mL of 22.5 wt% SiO25994.52Black
2 mL of 22.5 wt% SiO22304.12Colorless
A typical electropherogram obtained from the CE-UV analysis of one sample containing SiO2@PVP@PDA particles is shown in Figure 8a. All the VP, PVP, DA and PDA peaks appeared in the range of migration time from 3.1 to 4.0 min. As this sample was prepared using 14 g/L of VP (which is lower than the 28 g/L used in Figure 6c), incomplete coating by PVP is evidenced by the residual SiO2 peak at 6–8 min. The CE-UV electropherogram of another sample containing 42 g/L of VP is shown in Figure 8b, where the VP, PVP, DA and PDA peaks are observed in the range from 3.8 to 5.6 min. No peak for SiO2 can be seen due to complete coating by PVP. Although these electropherograms look similar to those in Figure 6, the peaks at 3.8–5.6 min are actually stronger (because the full y-scale is 400 mV rather than 90 mV) due to the high molar absorptivity of PDA. The SiO2@PVP@PDA peak appeared at a characteristic migration time of 4.2 ± 0.2 min that allowed for both quantitative CE-UV determination of the original SiO2 concentration with enhanced sensitivity analysis and without any ambiguous identity.
Figure 8. CE-UV electropherograms of SiO2@PVP@PDA particles prepared using 10 mg of AIBN, 1.5 mL of 22.5 wt% SiO2, 10 g/L of DA, 60 µL of 1.5 M NaOH, and either (a) 14 g/L or (b) 42 g/L N-vinylpyrrolidone. Electrokinetic injection at 17 kV for 3 s; CE analysis at 20 kV. UV detection at 190 nm.
Coatings 04 00340 g008

3.8. Electron Microscopy

Transmission electron microscopy (TEM) of the three kinds of particles is illustrated in Figure 9 to clarify many questions such as thickness of the polymer layers, size and size distribution of the particles, surface morphology, roughness etc. Clearly SiO2 particles (13.02–13.09 nm), SiO2@PVP particles (14.16–16.22 nm) and SiO2@PVP@PDA particles (16.48–18.28 nm) are distinguished from each other. These results support those obtained above by UV-visible spectroscopy and DLS; they are also consistent with Figure 5 in our previous report that showed the progressive growth of PDA on SiO2 particles (from 15.7 ± 2.3 nm to 19.9 ± 2.3 nm) over eleven days [47].
Figure 9. Transmission electron microscopy of SiO2, SiO2@PVP and SiO2@PVP@PDA particles.
Coatings 04 00340 g009

4. Conclusions

This report puts the spot light on the polymerization of vinylpyrrolidone to form a neutral coating around anionic SiO2 nanoparticles in aqueous suspension for rapid sedimentation. Only 1 g/L of VP is necessary to remove 10 g/L of SiO2 from the water phase. The resulting SiO2@PVP particles can be further coated with PDA to enhance the sensitivity of quantitative analysis by CE-UV. Eventually these particles settle down over 24 h to enable facile removal from the water. Coating of charged nanomaterials with non-toxic neutral polymers can prevent direct contact between the toxic nanomaterials to cells [48]. Three other nanomaterials (CeO2, TiO2 and Fe3O4) will also be tested as model inorganic oxides in water to further validate this method for water treatment. Simultaneous removal of other hazardous organic compounds in water would be possible using the PVP-coated nanoparticles as a solid phase extraction substrate.

Acknowledgments

The authors are grateful for the financial support of a Natural Sciences and Engineering Research Council of Canada grant to EPCL. ZI thanks the Bangladesh Agricultural University for funding his study leave.

Author Contributions

All the PVP experiments in this work were carried out by Sherif Nour under the supervision of Edward Lai. Other experiments involving PDA were conducted by Sherif Nour and Zafar Iqbal. The manuscript was written by Edward Lai and Zafar Iqbal based on Sherif Nour’s B.Sc. Honours thesis.

Conflicts of Interest

The authors declare no conflict of interest.

References

  1. Aillon, K.L.; Xie, Y.; El-Gendy, N.; Berkland, C.J.; Forresta, M.L. Effects of nanomaterial physicochemical properties on in vivo toxicity. Adv. Drug Deliv. Rev. 2009, 61, 457–466. [Google Scholar]
  2. Maynard, A.D. Nanotechnology: A Research Strategy for Addressing Risk; Woodrow Wilson International Centre for Scholars: Washington, DC, USA, 2006; pp. 1–45. [Google Scholar]
  3. Organization of Economic Co-operation and Development. Six Years of OECD Work on the Safety of Manufactured Nanomaterials: Achievements and Future Opportunities. Available online: http://www.oecd.org/env/ehs/nanosafety/Nano%20Brochure%20Sept%202012%20for%20Website%20%20(2).pdf (accessed on 28 April 2014).
  4. Biskos, G.; Schmidt-Ott, A. Airborne engineered nanoparticles: Potential risks and monitoring challenges for assessing their impacts on children. Paediatr. Respir. Rev. 2012, 13, 79–83. [Google Scholar] [CrossRef]
  5. Naahidi, S.; Jafari, M.; Edalat, F.; Raymond, K.; Khademhosseini, A.; Chen, P. Biocompatibility of engineered nanoparticles for drug delivery. J. Control. Release 2013, 166, 182–194. [Google Scholar] [CrossRef]
  6. Rezić, I. Determination of engineered nanoparticles on textiles and in textile wastewaters. TrAC Trends Anal. Chem. 2011, 30, 1159–1167. [Google Scholar] [CrossRef]
  7. Daghrir, R.; Drogui, P.; Robert, D. Photoelectrocatalytic technologies for environmental applications. J. Photochem. Photobiol. A Chem. 2012, 238, 41–52. [Google Scholar] [CrossRef]
  8. Figueira, F.; Cavaleiro, J.A.S.; Tomé, J.P.C. Silica nanoparticles functionalized with porphyrins and analogs for biomedical studies. J. Porphyr. Phthalocyanines 2011, 15, 517–533. [Google Scholar] [CrossRef]
  9. Kumar, P.; Fennell, P.; Robins, A. Comparison of the behaviour of manufactured and other airborne nanoparticles and the consequences for prioritizing research and regulation activities. J. Nanopart. Res. 2010, 12, 1523–1530. [Google Scholar] [CrossRef]
  10. Valcárcel, M. Nanoparticles in the water cycle—Properties, analysis, and environmental relevance. Anal. Bioanal. Chem. 2011, 400, 2679–2680. [Google Scholar] [CrossRef]
  11. Weinberg, H.; Galyean, A.; Leopold, M. Evaluating engineered nanoparticles in natural waters. TrAC Trends Anal. Chem. 2011, 30, 72–83. [Google Scholar] [CrossRef]
  12. Brar, S.K.; Verma, M.; Tyagi, R.D.; Surampalli, R.Y. Engineered nanoparticles in wastewater and wastewater sludge—Evidence and impacts. Waste Manag. 2010, 30, 504–520. [Google Scholar] [CrossRef]
  13. Bhatt, I.; Tripathi, B.N. Interaction of engineered nanoparticles with various components of the environment and possible strategies for their risk assessment. Chemosphere 2011, 82, 308–317. [Google Scholar] [CrossRef]
  14. Dekkers, S.; Bouwmeester, H.; Bos, P.M.J.; Peters, R.J.B.; Rietveld, A.; Oomen, A.G. Knowledge gaps in risk assessment of nanosilica in food: Evaluation of the dissolution and toxicity of different forms of silica. Nanotoxicology 2013, 7, 367–377. [Google Scholar] [CrossRef]
  15. Pelaz, B.; Charron, G.; Pfeiffer, C.; Zhao, Y.; de la Fuente, J.M.; Liang, X.J.; Parak, W.J.; del Pino, P. Interfacing engineered nanoparticles with biological systems: Anticipating adverse nano-bio interactions. Small 2013, 9, 1573–1584. [Google Scholar] [CrossRef]
  16. Arvizo, R.R.; Miranda, O.R.; Thompson, M.A.; Pabelick, C.M.; Bhattacharya, R.; Robertson, J.D.; Rotello, V.M.; Prakash, Y.S.; Mukherjee, P. Effect of nanoparticle surface charge at the plasma membrane and beyond. Nano Lett. 2010, 10, 2543–2548. [Google Scholar] [CrossRef]
  17. Passagne, I.; Morille, M.; Rousset, M.; Pujalté, I.; L’azou, B. Implication of oxidative stress in size-dependent toxicity of silica nanoparticles in kidney cells. Toxicology 2012, 299, 112–124. [Google Scholar] [CrossRef]
  18. Duan, J.; Yu, Y.; Li, Y.; Yu, Y.; Sun, Z. Cardiovascular toxicity evaluation of silica nanoparticles in endothelial cells and zebrafish model. Biomaterials 2013, 34, 5853–5862. [Google Scholar] [CrossRef]
  19. Du, Z.; Zhao, D.; Jing, L.; Cui, G.; Jin, M.; Li, Y.; Liu, X.; Liu, Y.; Du, H.; Guo, C.; et al. Cardiovascular toxicity of different sizes amorphous silica nanoparticles in rats after intratracheal instillation. Cardiovasc. Toxicol. 2013, 13, 194–207. [Google Scholar] [CrossRef]
  20. Lu, X.; Jin, T.; Jin, Y.; Wu, L.; Hu, B.; Tian, Y.; Fan, X. Toxicogenomic analysis of the particle dose- and size-response relationship of silica particles-induced toxicity in mice. Nanotechnology 2013, 24. [Google Scholar] [CrossRef]
  21. Guo, M.; Xu, X.; Yan, X.; Wang, S.; Gao, S.; Zhu, S. In vivo biodistribution and synergistic toxicity of silica nanoparticles and cadmium chloride in mice. J. Hazard. Mater. 2013, 260, 780–788. [Google Scholar] [CrossRef]
  22. De Simone, U.; Manzo, L.; Profumo, A.; Coccini, T. In vitro toxicity evaluation of engineered cadmium-coated silica nanoparticles on human pulmonary cells. J. Toxicol. 2013, 2013, 931785:1–931785:10. [Google Scholar]
  23. Mortensen, N.P.; Hurst, G.B.; Wang, W.; Foster, C.M.; Nallathamby, P.D.; Retterer, S.T. Dynamic development of the protein corona on silica nanoparticles: Composition and role in toxicity. Nanoscale 2013, 5, 6372–6380. [Google Scholar] [CrossRef]
  24. Measuring and Removing Nanoparticles in Semiconductor Processing Water. Available online: http://www.electronicsnews.com.au/news/measuring-and-removing-nanoparticles-in-semiconduc (accessed on 28 April 2014).
  25. Sun, Q.; Li, Y.; Tang, T.; Yuan, Z.; Yu, C. Removal of silver nanoparticles by coagulation processes. J. Hazard. Mater. 2013, 261, 414–420. [Google Scholar] [CrossRef]
  26. Liu, Y.; Tourbin, M.; Lachaize, S.; Guiraud, P. Silica nanoparticle separation from water by aggregation with AlCl3. Ind. Eng. Chem. Res. 2013. [Google Scholar] [CrossRef]
  27. Liu, Y.; Tourbin, M.; Lachaize, S.; Guiraud, P. Silica nanoparticles separation from water: Aggregation by cetyltrimethyl-ammonium bromide (CTAB). Chemosphere 2013, 92, 681–687. [Google Scholar] [CrossRef]
  28. Yazhgur, P.A.; Noskov, B.A.; Liggieri, L.; Lin, S.Y.; Loglio, G.; Millere, R.; Ravera, F. Dynamic properties of mixed nanoparticle/surfactant adsorption layers. Soft Matter 2013, 9, 3305–3314. [Google Scholar] [CrossRef]
  29. McClanahan, J.S.; Lin, Y.C.; Digenis, G.A. Disposition of N-vinyl-2-pyrrolidnone in the rat. Drug Chem. Toxical. 1984, 7, 129–148. [Google Scholar] [CrossRef]
  30. Liparoti, S.; Adami, R.; Caputo, G.; Reverchon, E. Supercritical assisted atomization: Polyvinylpyrrolidone as carrier for drugs with poor solubility in water. J. Chem. 2013, 2013, 801069:1–801069:5. [Google Scholar]
  31. Lee, H.; Lee, S.; Xu, C. Synthesis and characterization of PVP-coated large core iron oxide nanoparticles as an MRI contrast agent. Nanotechnology 2008, 19. [Google Scholar] [CrossRef]
  32. Deguchi, T.; Yamano, H.; Iwamoto, M. Dynamics of direct H2O2 synthesis from H2 and O2 on a Pd nano-particle catalyst protected with polyvinylpyrrolidone. J. Catal. 2012, 2487, 55–61. [Google Scholar]
  33. Mu, Q.; Hondow, N.S.; Krzemiński, L.; Brown, A.P.; Jeuken, L.J.C.; Routledge, M.N. Mechanism of cellular uptake of genotoxic silica nanoparticles. Part. Fibre Toxicol. 2012, 9, 29:1–29:11. [Google Scholar]
  34. LUDOX® AM colloidal silica. Available online: http://www.sigmaaldrich.com/catalog/product/aldrich/420875?lang=en&region=CA (accessed on 28 April 2014).
  35. Petr, J.; Varenne, A.; Teste, B.; Descroix, S.; Siaugue, J.M.; Gareil, P.A. Separation of alpha-lactalbumin grafted- and non-grafted maghemite core/silica shell nanoparticles by capillary zone electrophoresis. Electrophoresis 2010, 31, 2754–2761. [Google Scholar] [CrossRef]
  36. Ryu, S.; Bae, W.M.; Hong, W.J.; Ihn, K.; Jung, Y.M. Characterization of chain transfer reaction during radical polymerization of silver nanocomposite polyvinylpyrrolidone by using 2D hetero-spectral IR/NMR correlation spectroscopy. J. Vib. Spectrosc. 2011, 60, 168–172. [Google Scholar]
  37. Rahman, I.; Padavettan, V. Synthesis of silica nanoparticles by sol-gel: Size-dependent properties, surface modification, and applications in silica-polymer nanocomposites. J. Nanomater. 2012, 2012, 132424:1–132424:15. [Google Scholar]
  38. Kim, J.; Lawler, D.F. Characteristics of zeta potential distribution in silica particles. Bull. Korean Chem. Soc. 2005, 26, 1083–1089. [Google Scholar] [CrossRef]
  39. Witteler, H.; Gotsche, M. Chemistry and Physicochemical Properties of Povidone. Available online: http://www.pharma-ingredients.basf.com/Documents/ENP/ExAct/Nr_002_1999-07_ExAct_02.pdf (accessed on 16 May 2014).
  40. Nathanson, S.D.; Zamfirescu, P.L.; Drew, S.I.; Wilbur, S. Two-step separation of human peripheral blood monocytes on discontinuous density gradients of colloidal silica-polyvinylpyrrolidinone. J. Immunol. Methods 1977, 18, 225–234. [Google Scholar] [CrossRef]
  41. Kango, S.; Kalia, S.; Celli, A.; Njuguna, J.; Habibi, Y.; Kumar, R. Surface modification of inorganic nanoparticles for development of organic–inorganic nanocomposites—A review. Prog. Polym. Sci. 2013, 38, 1232–1261. [Google Scholar]
  42. Turro, N.J. Photochemistry of Enones and Dienones. Columbia University. Available online: http://turroserver.chem.columbia.edu/courses/MMP_Chapter_Updates/MMP+Ch11%20051404.pdf (accessed on 28 April 2014).
  43. Kim, I.; Kim, Y.; Lim, H.B. Turbidimetric measurement for on-line monitoring of SiO2 particles. Bull. Korean Chem. Soc. 2004, 25, 801–805. [Google Scholar] [CrossRef]
  44. Chang, C.W.; Tseng, W.L. Gold nanoparticle extraction followed by capillary electrophoresis to determine the total, free, and protein-bound aminothiols in plasma. Anal. Chem. 2010, 82, 2696–2702. [Google Scholar] [CrossRef]
  45. Yeh, P.R.; Tseng, W.L. Human serum albumin-coated gold nanoparticles for selective extraction of lysozyme from real-world samples prior to capillary electrophoresis. J. Chromatogr. A 2012, 1268, 166–172. [Google Scholar]
  46. Lin, T.H.; Lu, C.Y.; Tseng, W.L. Selective enrichment of catecholamines using iron oxide nanoparticles followed by CE with UV detection. Electrophoresis 2013, 34, 297–303. [Google Scholar] [CrossRef]
  47. Iqbal, Z.; Lai, E.P.C. Investigation of polydopamine growth on nanomaterials in water. J. Nanomater. Mol. Nanotechnol. 2013, 2, 1–6. [Google Scholar]
  48. Mu, Q.; Yang, L.; Davis, J.C.; Vankayala, R.; Hwang, K.C.; Zhao, J.; Yan, B. Biocompatibility of polymer grafted core/shell iron/carbon nanoparticles. Biomaterials 2010, 31, 5083–5090. [Google Scholar] [CrossRef]

