Influence of the Rake Angle on Nanocutting of Fe Single Crystals: A Molecular-Dynamics Study


Physics Department and Research Center OPTIMAS, University Kaiserslautern, Erwin-Schrödinger-Straße, D-67663 Kaiserslautern, Germany
*
Author to whom correspondence should be addressed.
Crystals 2020, 10(6), 516; https://doi.org/10.3390/cryst10060516
Submission received: 13 May 2020
/
Revised: 8 June 2020
/
Accepted: 13 June 2020
/
Published: 17 June 2020
(This article belongs to the Special Issue Crystal Plasticity at Micro- and Nano-scale Dimensions)
Abstract
:Using molecular dynamics simulation, we study the cutting of an Fe single crystal using tools with various rake angles . We focus on the (110)[001] cut system, since here, the crystal plasticity is governed by a simple mechanism for not too strongly negative rake angles. In this case, the evolution of the chip is driven by the generation of edge dislocations with the Burgers vector , such that a fixed shear angle of is established. It is independent of the rake angle of the tool. The chip form is rectangular, and the chip thickness agrees with the theoretical result calculated for this shear angle from the law of mass conservation. We find that the force angle between the direction of the force and the cutting direction is independent of the rake angle; however, it does not obey the predictions of macroscopic cutting theories, nor the correlations observed in experiments of (polycrystalline) cutting of mild steel. Only for (strongly) negative rake angles, the mechanism of plasticity changes, leading to a complex chip shape or even suppressing the formation of a chip. In these cases, the force angle strongly increases while the friction angle tends to zero.
1. Introduction
While in applications, cutting processes are usually performed on poly-crystalline materials, from a materials-science point of view, it is also interesting to study the cutting of single crystals. In micro- and nano-cutting [1], the cutting depth may be smaller than the grain size of the material, so that crystal plasticity effects need to be taken into account.
However, also from the point of view of machining mechanics, this topic is interesting. The theory of cutting is largely based on the concept of a single shear plane responsible for the cut and the geometry of the chip formed [2,3]. For cutting polycrystalline materials, it is known that this concept is an idealization (see for instance the critical review by Astakhov [4]), and several extensions of the basic framework have been formulated [5,6,7]. The application of these concepts to nanocutting has been recently reviewed by Fang and Xu [1]. However, in the cutting of single crystals, plasticity will as a rule be based on the dislocation slip. If the cut system—that is, the surface orientation and the cut direction—is carefully chosen, only a single slip system will be activated, and thus, the shear plane is determined by crystallography.
Molecular dynamics (MD) simulation has been repeatedly used for studying machining processes such as nanoindentation [8,9] or the scratching of surfaces [10,11]. Furthermore, cutting has been simulated as well for fcc [12,13,14,15,16,17,18] as for bcc [19,20,21,22] metals and also for metallic glasses [23], ceramics [24,25,26,27,28,29,30,31], and composites [32]. MD is based on solving Newton’s equations of motion for the atoms that make up the workpiece such that this simulation method allows obtaining atomistic insight into the plasticity processes relevant for machining at the nanoscale.
The analysis of MD simulations of the cutting process has often been based for the macroscopic concept of a “stagnation point” that divides the material moving upwards to form the chip from the material that moves downward into the material interior below the tool [1,33]. In this scenario, in particular the effect of tool edge curvature has been investigated [34,35]. Furthermore, a minimum cutting depth and a minimum rake angle (of the order of to ) have been postulated; for shallower cuts or blunter rakes, the material will be buried beneath the tool, and no chip is formed [1,33]. However, these ideas do not appear to have been combined up to now with a crystal plasticity analysis of the dislocation processes responsible for material separation and chip formation.
In the present paper, we will use MD simulation to study the application of machining theories to a well studied cut system, the (110)[001] cutting system of bcc Fe, since here, it was shown that indeed a single dislocation slip system is dominant in chip formation [21,22]. By varying the rake angle of the tool, we can vary the magnitude and orientation of the forces during cutting and analyze to what extent traditional machining theories describe the cutting of this system. While a few MD simulations studied the effect of the rake angle previously [33,36,37], they did not analyze the results obtained for dislocation plasticity in terms of available cutting theories. It is the objective of the present study to identify the influence of the rake angle of the cutting tool on the cutting of single crystals in terms of the dislocation plasticity.
A further motivation for studying the effect of the rake angle on metal cutting is given by the fact that in nanomachining, the geometry of the tool edge is not well characterized in the nanometer scale. On this scale, often the tool edge may be idealized by a geometry with a negative rake angle, even though the macroscopic form is sharp, possessing a positive rake angle. This issue provides a further motivation to study the influence of the rake angle on machining processes.
2. Simulation Method
In this study, we focus on the (110)[001] cutting system of bcc Fe; this means that the top surface had a (110) orientation, and the cutting direction was along [001]. The tool edge was along the direction. We showed previously [21,22] that this cutting system allows for a simple quasi-two-dimensional understanding of the cutting process, since the major dislocation systems involved in chip formation—those with the Burgers vector —have their dislocation lines aligned with the tool edge. In Appendix A, we illustrate the complexities that can arise for other cut systems.
The substrate was single crystalline with a (110) surface, while the cutting direction was along [001]. It was built from Fe atoms, extended 611 Å along the cutting direction, and had a height of 404 Åand a thickness of 81 Å. Fe atoms interact with each other according to the Mendelev potential [38], which is known to describe the elastic and plastic properties of Fe, as well as the surface energies relevant for cleavage processes, faithfully [39,40,41].
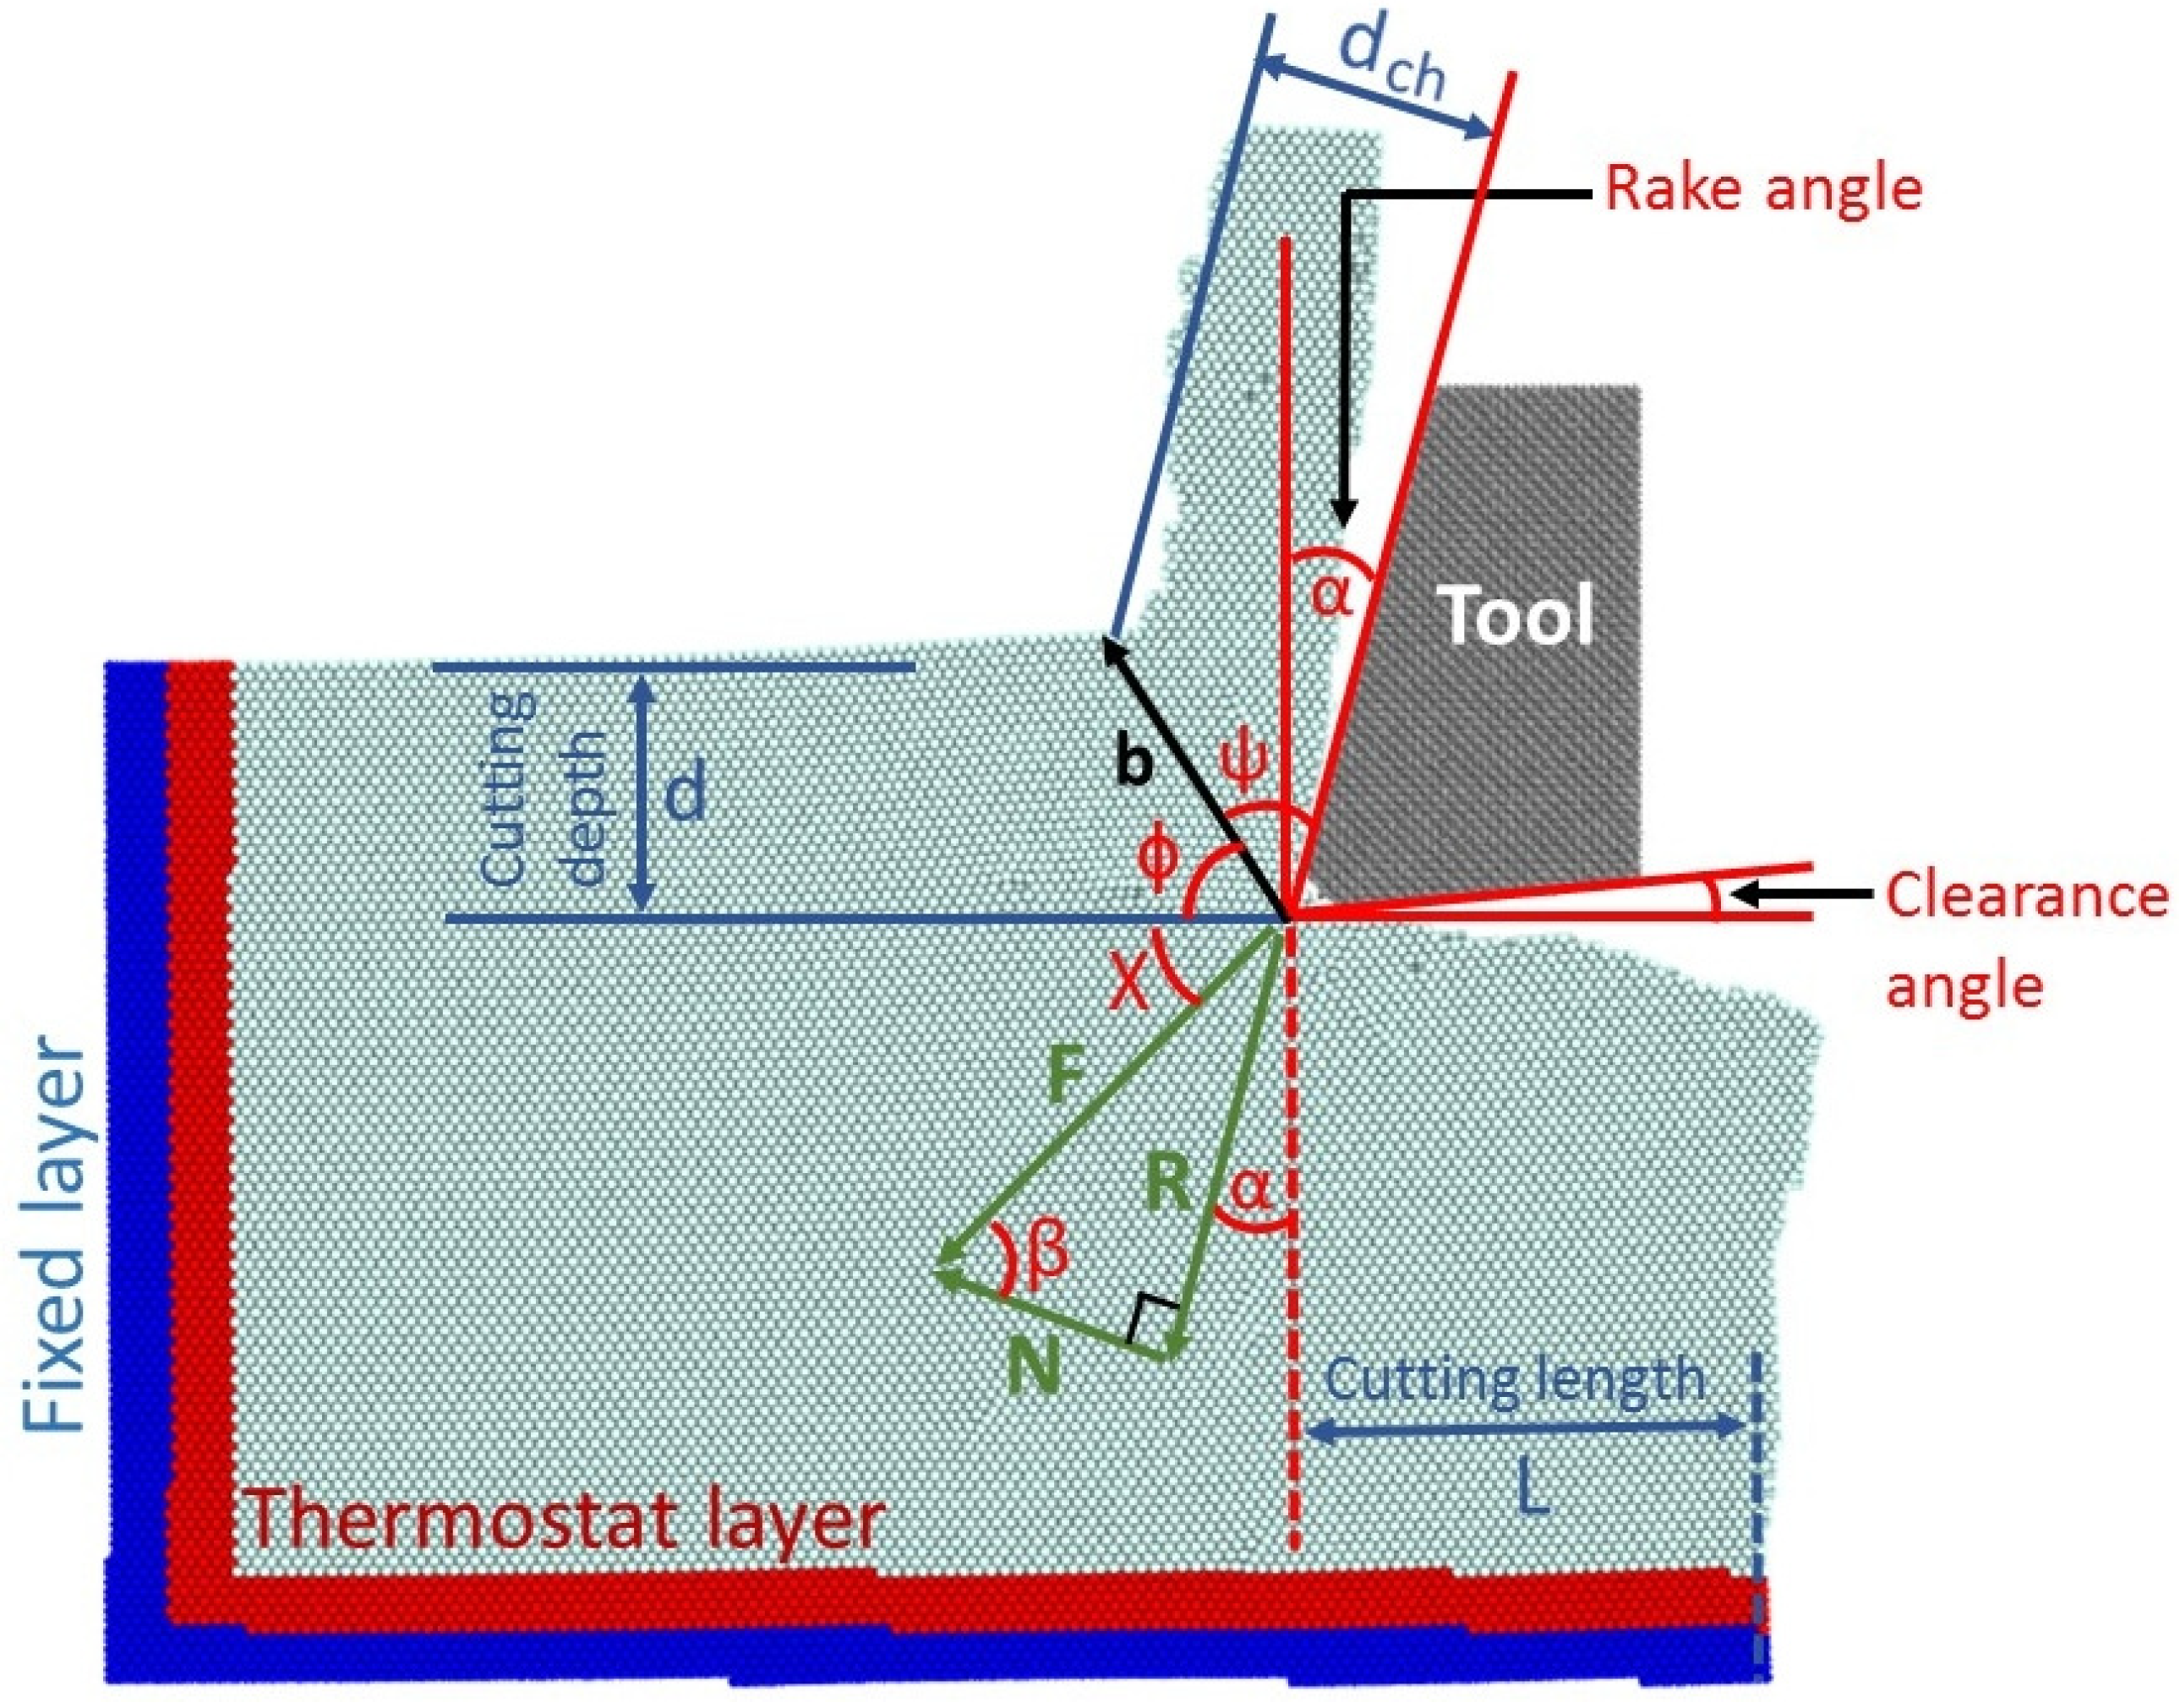
The simulation system is displayed schematically in Figure 1. In order to prevent the substrate from any translation or rotation during the machining process, its bottom and the left boundary contained two fixed atom layers. The next two atom layers were thermostatted at a low temperature, <1 K, to ease detection of dislocations and other defects in the system. In the direction along the tool edge (the direction), periodic boundary conditions were applied, while the top and the right-hand side boundaries were free.
The tool was built from between (44–166) carbon atoms; it was rigid, i.e., no C atom could move with respect to the others. It is known from nanoindentation studies [42] that the atomistic surface structure of the tool may influence the nucleation of dislocations; we believe, however, that this effect lost its importance during the long cutting simulations performed in the present study. It had a clearance angle of and a rounded edge with a curvature radius of Å. The rake angle, , of the tool was varied in this study between and . Fe and C atoms interact purely repulsively with each other; their interaction is described by a Lennard–Jones potential [43] that was cut off at its minimum at 4.2 Å [20]. In all simulations presented here, the cutting depth amounted to Å. The tool moved with a velocity of 20 m/s, and the total cutting length was 100 Å. This length might be considered as too small to provide steady-state cutting values, in particular for the negative rake angles; we therefore check this issue in Appendix B.
3. Results
3.1. Plastic Deformation
Let us first discuss cutting for and , which proceeded via the same plastic mechanism. Figure 2 shows the dislocations that formed during the cutting process. The dominant mechanism was the formation of edge dislocation with the Burgers vector , which moved upward in the [111] direction. Their motion transported atoms upwards at the front of the tool out of the surface and thus formed the chip. The motion could effectively be described as the shear of the material with the shear plane given by the glide plane of the dislocation system; this shear plane is conventionally denoted as the primary shear plane (PSZ). The shear angle was hence given by the angle between the Burgers vector of the dislocations and the cutting direction [001]; it amounted to . We emphasize that Figure 2 demonstrates that all plasticity occurring during the cut was confined to a single shear plane; this cutting system therefore provided a textbook example of the so-called single shear plane cutting model in machining theories [2,3,5,6,7,50,51]. A previous analysis of this cut system for the rake angle of gave the same conclusions on the plastic behavior during cutting [21,22].
Besides the dislocations that are immediately responsible for chip formation, Figure 2 also shows the presence of several other dislocation systems. All of them are edge dislocations with their dislocation lines oriented parallel to the tool edge. Among these are edge dislocations, which move along the cutting direction, [001], to the left, parallel to the surface, as well as dislocations, which move into the substrate interior. Both of these glide systems transport material away from the cut zone, but do not contribute to chip formation.
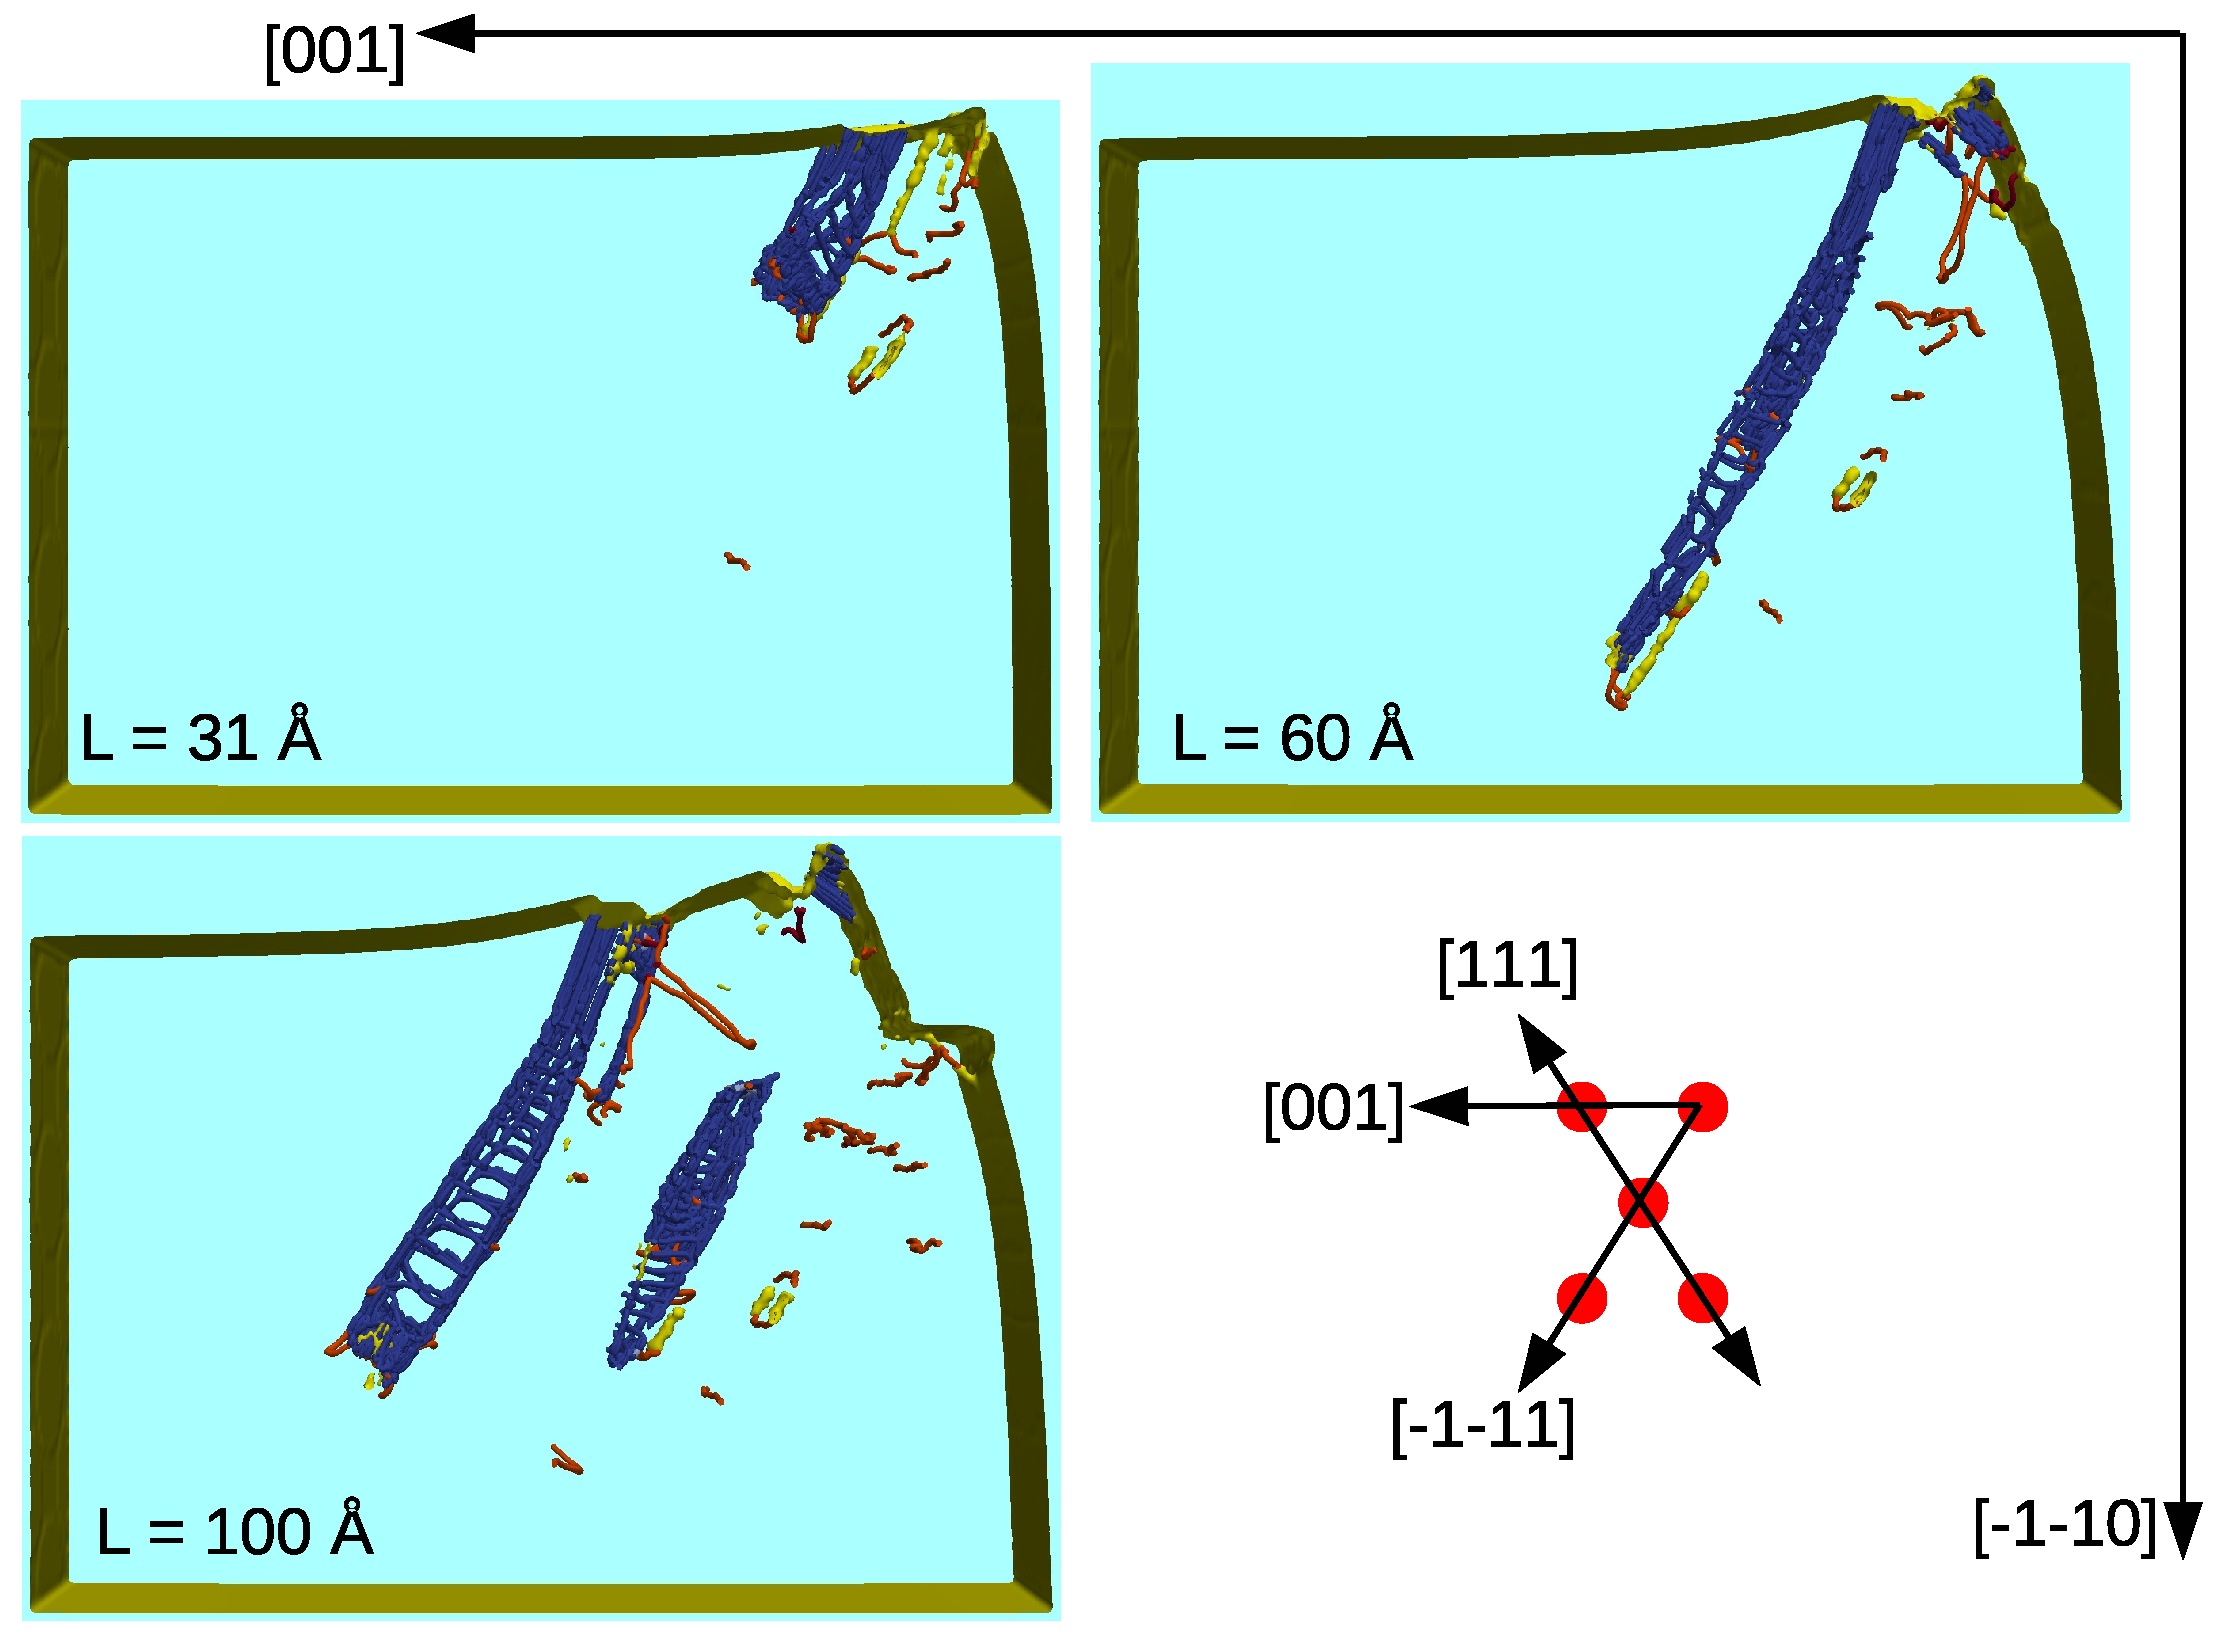
For a rake angle of , plasticity is illustrated in Figure 3 for various cutting lengths L. Here, the action of the dislocations, close to the rake face, as barely visible, since the angle between the glide direction and the rake face was quite small, only , such that dislocations had only little time (and space) for moving towards the surface, before the rake surface covered them up. Due to the small activity of dislocations in the [111] direction, the upper surface started bending elastically upwards. This bending generated a large number of partial dislocations (in the following abbreviated as “partials”) flowing in the direction; they created a step on the surface at the positions where the partials were emitted (seen at a cutting length Å). These partials had Burgers vectors of the form with , 6, or 12; they formed twinning boundaries, such that the volume enclosed by these partials was by nanotwins. After this nanotwin grew to span almost the entire simulation volume ( Å), the process of the generation of twinning partials in the elastically bent material in front of the tool repeated itself ( Å).
Finally, Figure 4 shows the plastic activity when cutting with a rake angle of . Emission of dislocations was completely suppressed as their glide direction lied within the rake tool. Now, a large amount of partial dislocations were activated, which transported the material backward. These latter dislocations led to a deformation of the frontal (right-hand side) surface, where the tool entered. As a consequence, the cutting process did not lead to chip formation on the top surface, but rather to a deformation of the frontal surface.
We concluded that for , a single dislocation system—with the Burgers vector —was responsible for cutting. For a positive rake angle, hence, cutting could be well described by a single shear angle, . Even for , this system still contributed to cutting, but was no longer dominant. For , the system was completely deactivated.
3.2. Angles
For the analysis of the simulation results, we introduced several angles; see Figure 1. The shear angle is the angle between the PSZ and the original surface plane. Analogously, we define as the angle between the rake face and the PSZ; it is:
The force angle is the angle between the total force and the original surface plane. It satisfies the relation:
with the friction angle . This friction angle is given by the components of the force parallel (R) and perpendicular (N) to the rake face by:
3.3. Chip Thickness
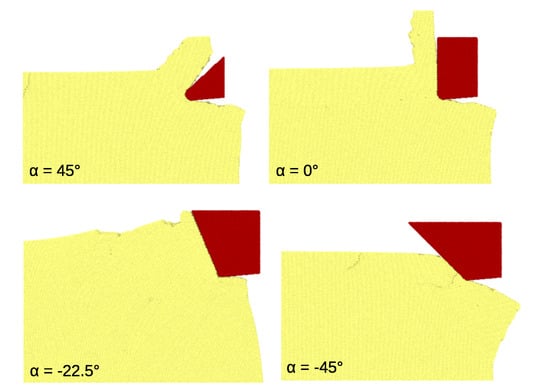
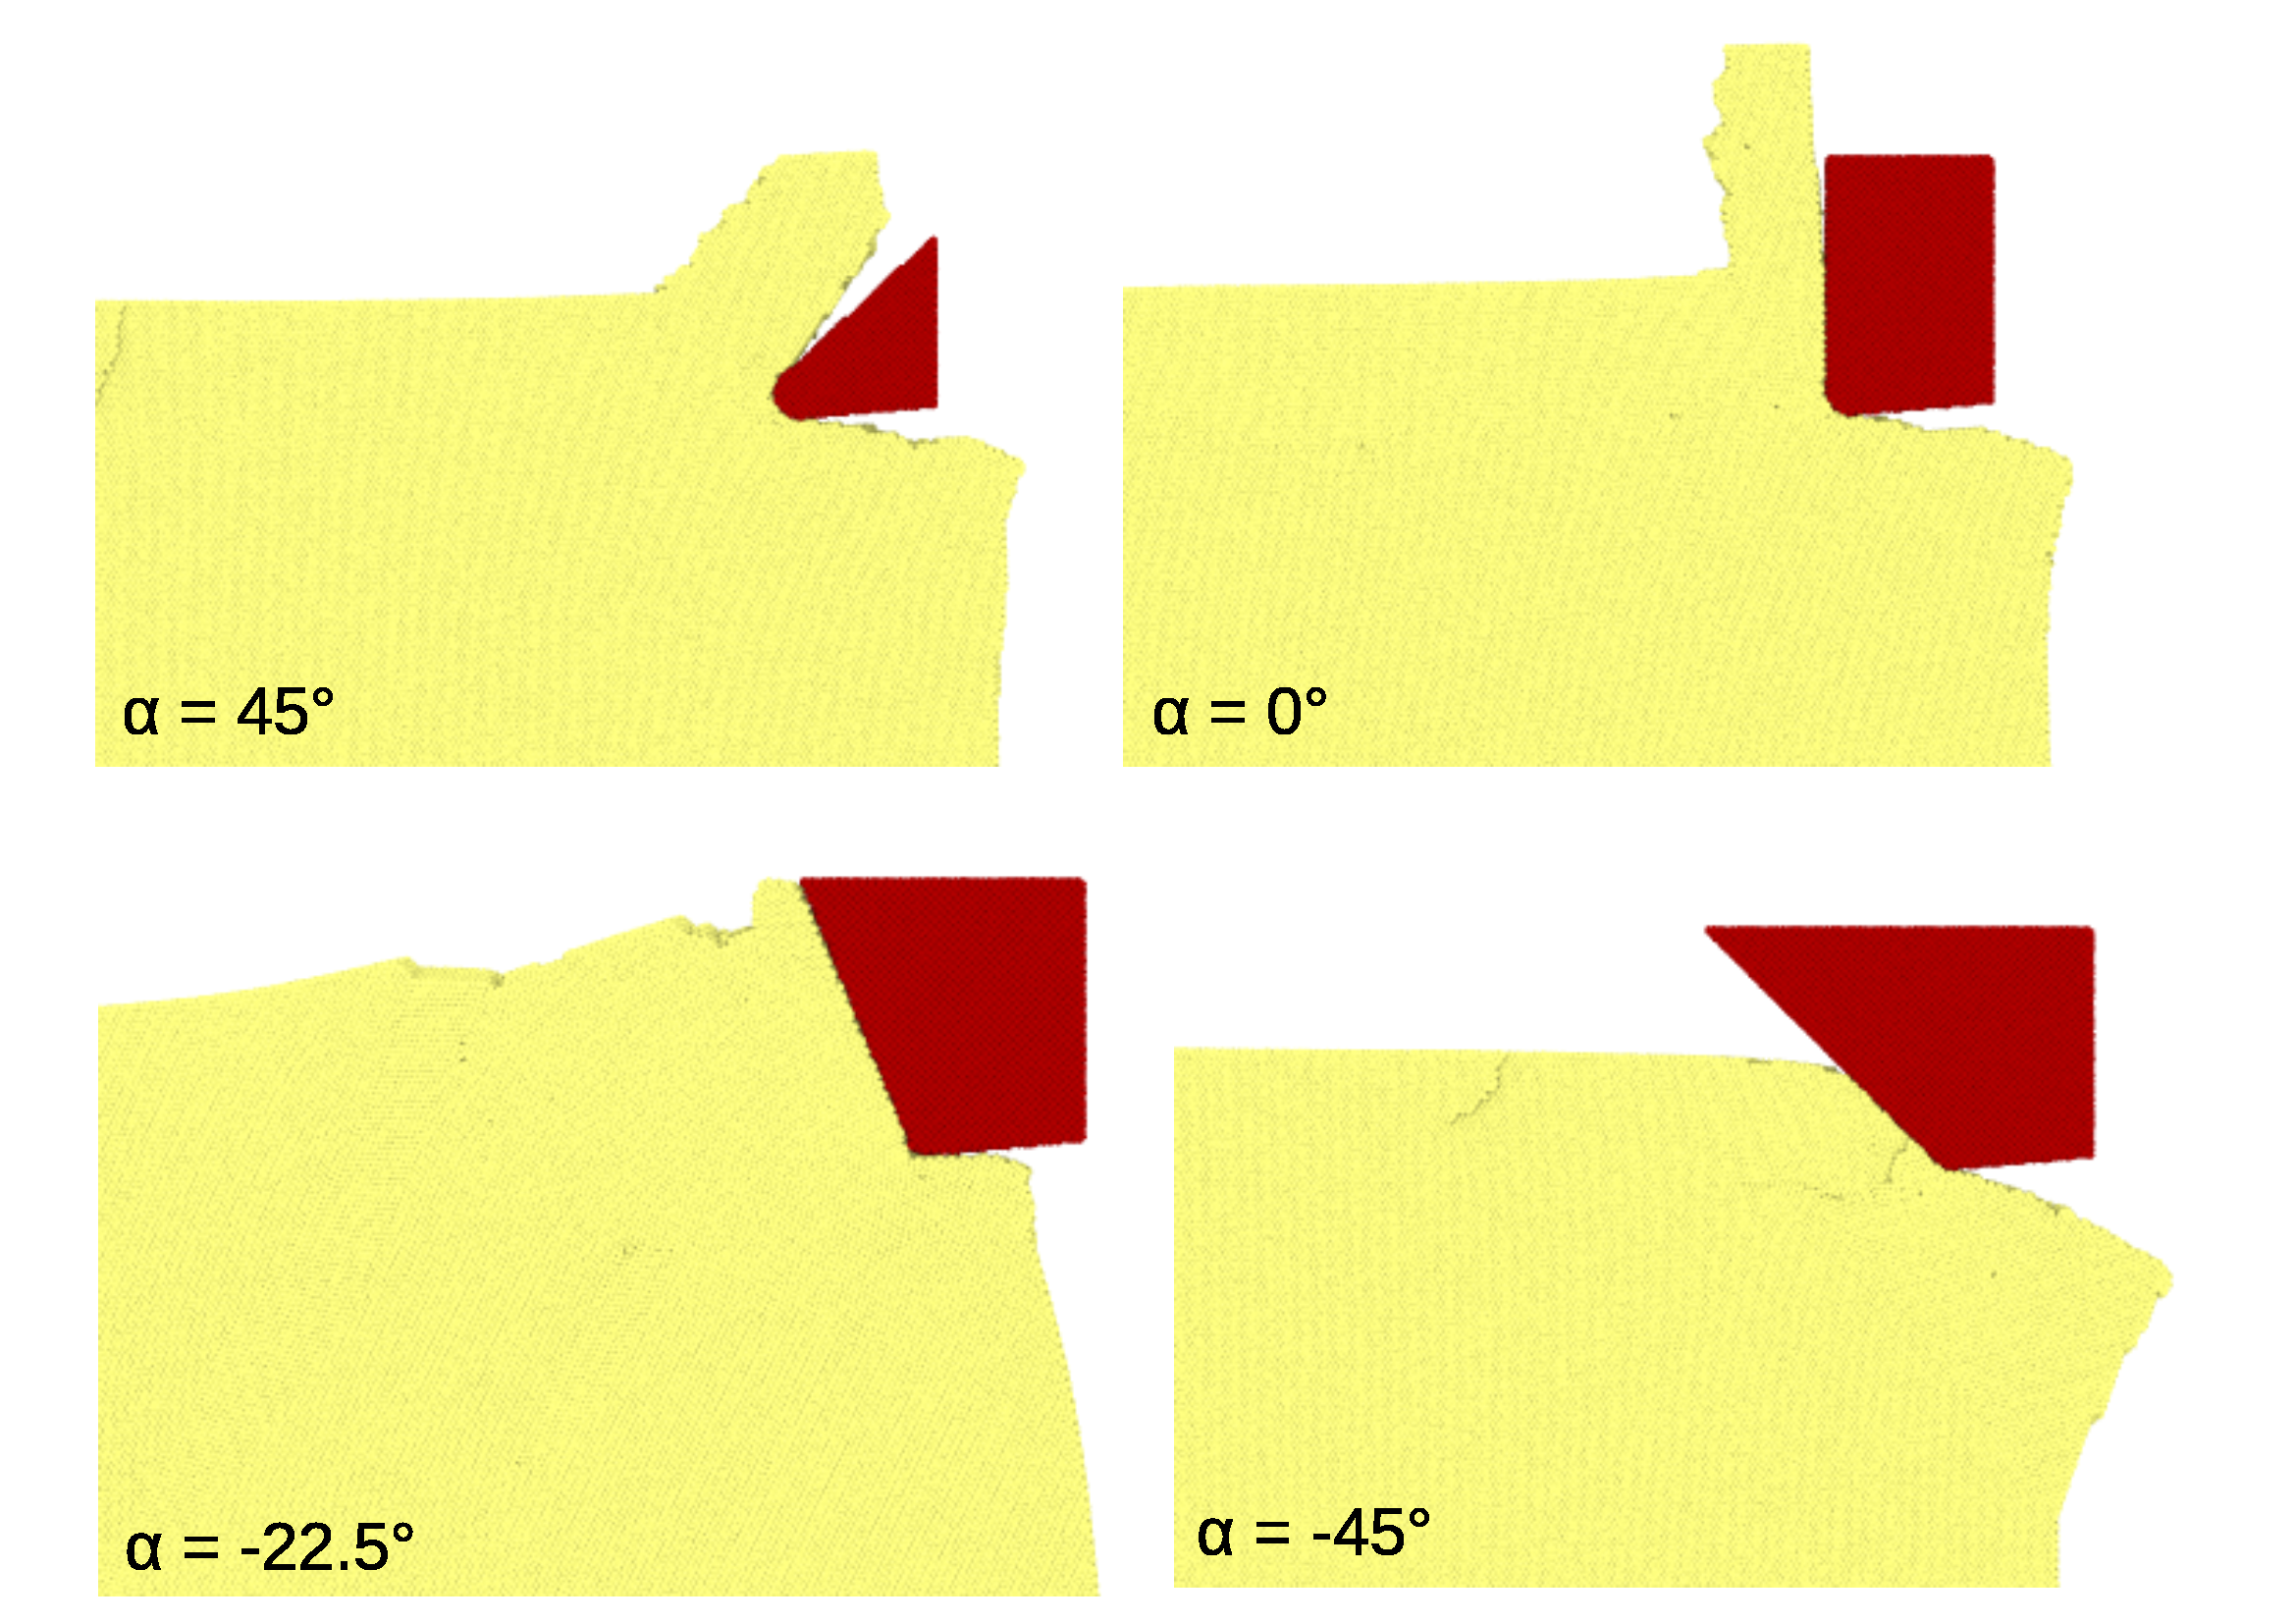
Figure 5 assembles the chip shapes obtained by the cutting process. For and (and also for ; see [21,22]), the chip had a roughly rectangular cross-section with a constant thickness . This feature was easily explained by the action of the single dislocation system forming the chip. Even for , a small chip immediately adjacent to the rake face could be discerned, which was formed by the same dislocation system. In addition, for this rake angle, the other plastic processes discussed above contributed to forming a very broad chip extending a considerable distance in front of the tool. For , no chip was formed.
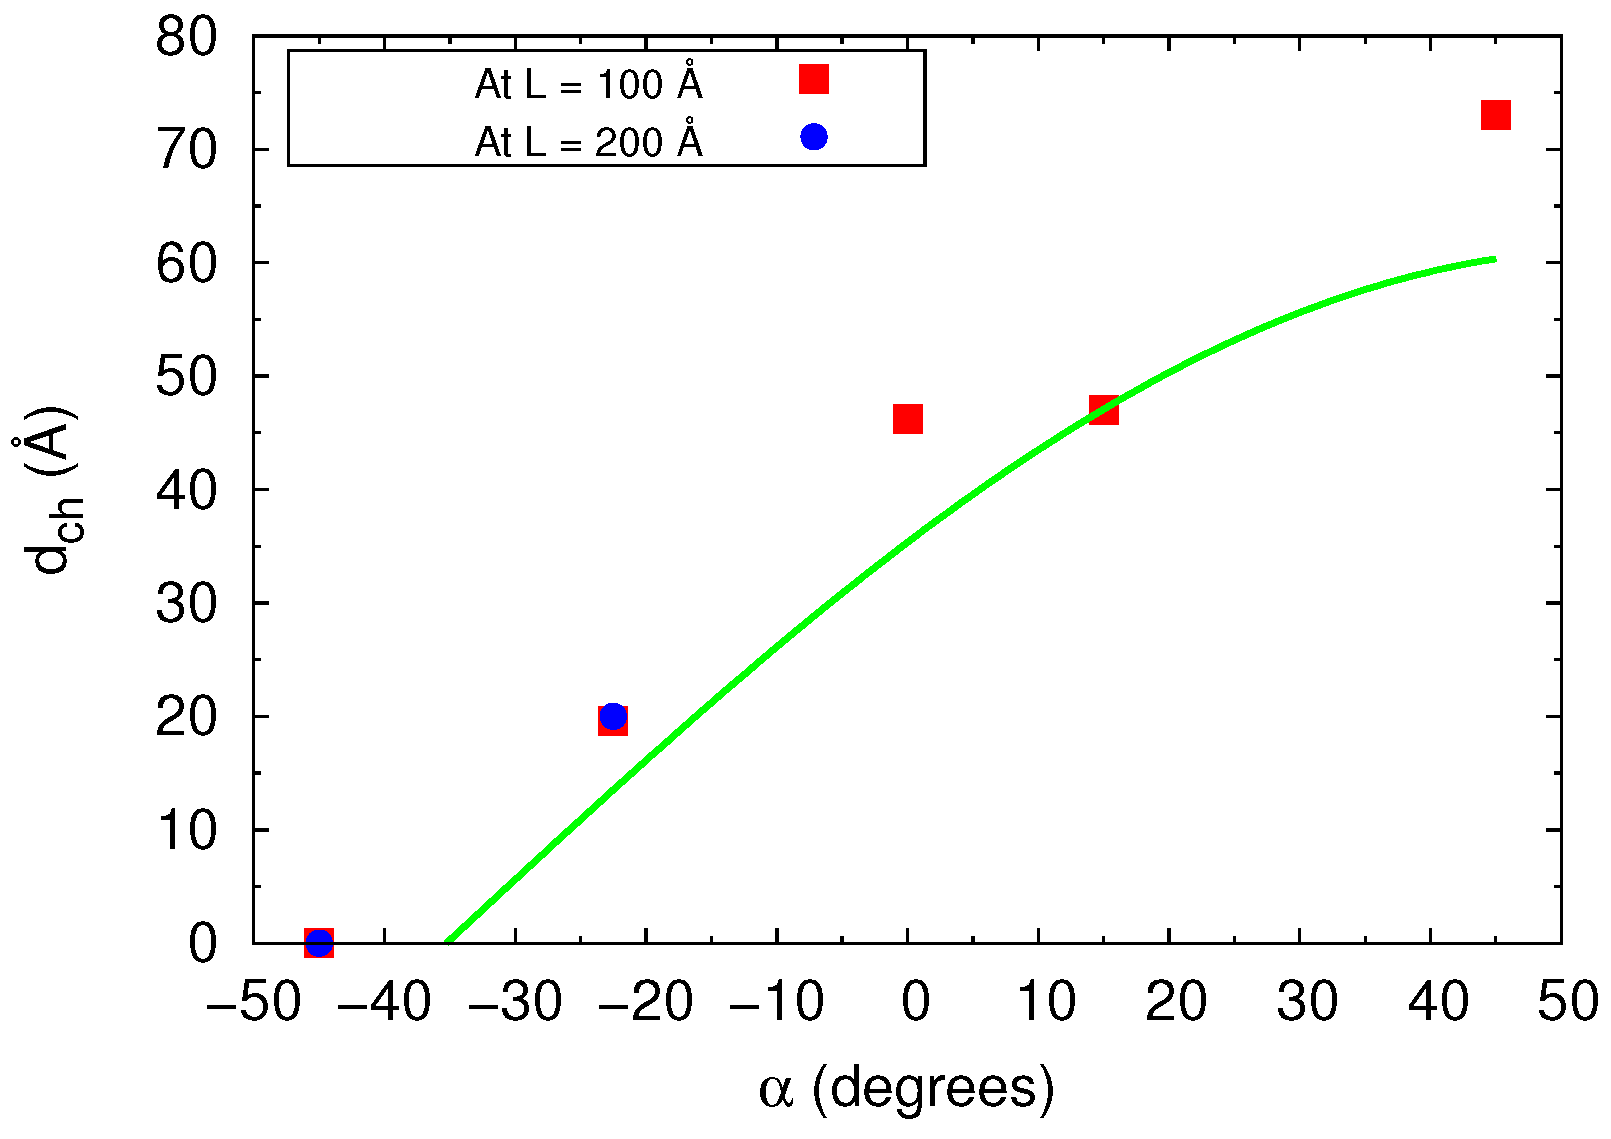
We determined the chip thickness as the extension of the chip perpendicular to the rake face (see Figure 1) and measured it at the base of the chip close to the PSZ; the values are assembled in Table 1. For the complex chip form of , we only considered the part of the chip adjacent to the rake face. The decline of with decreasing illustrated in Figure 6 could be rationalized as follows.
From mass conservation, the chip thickness, , is related to the cutting depth, d, by:
3.4. Forces
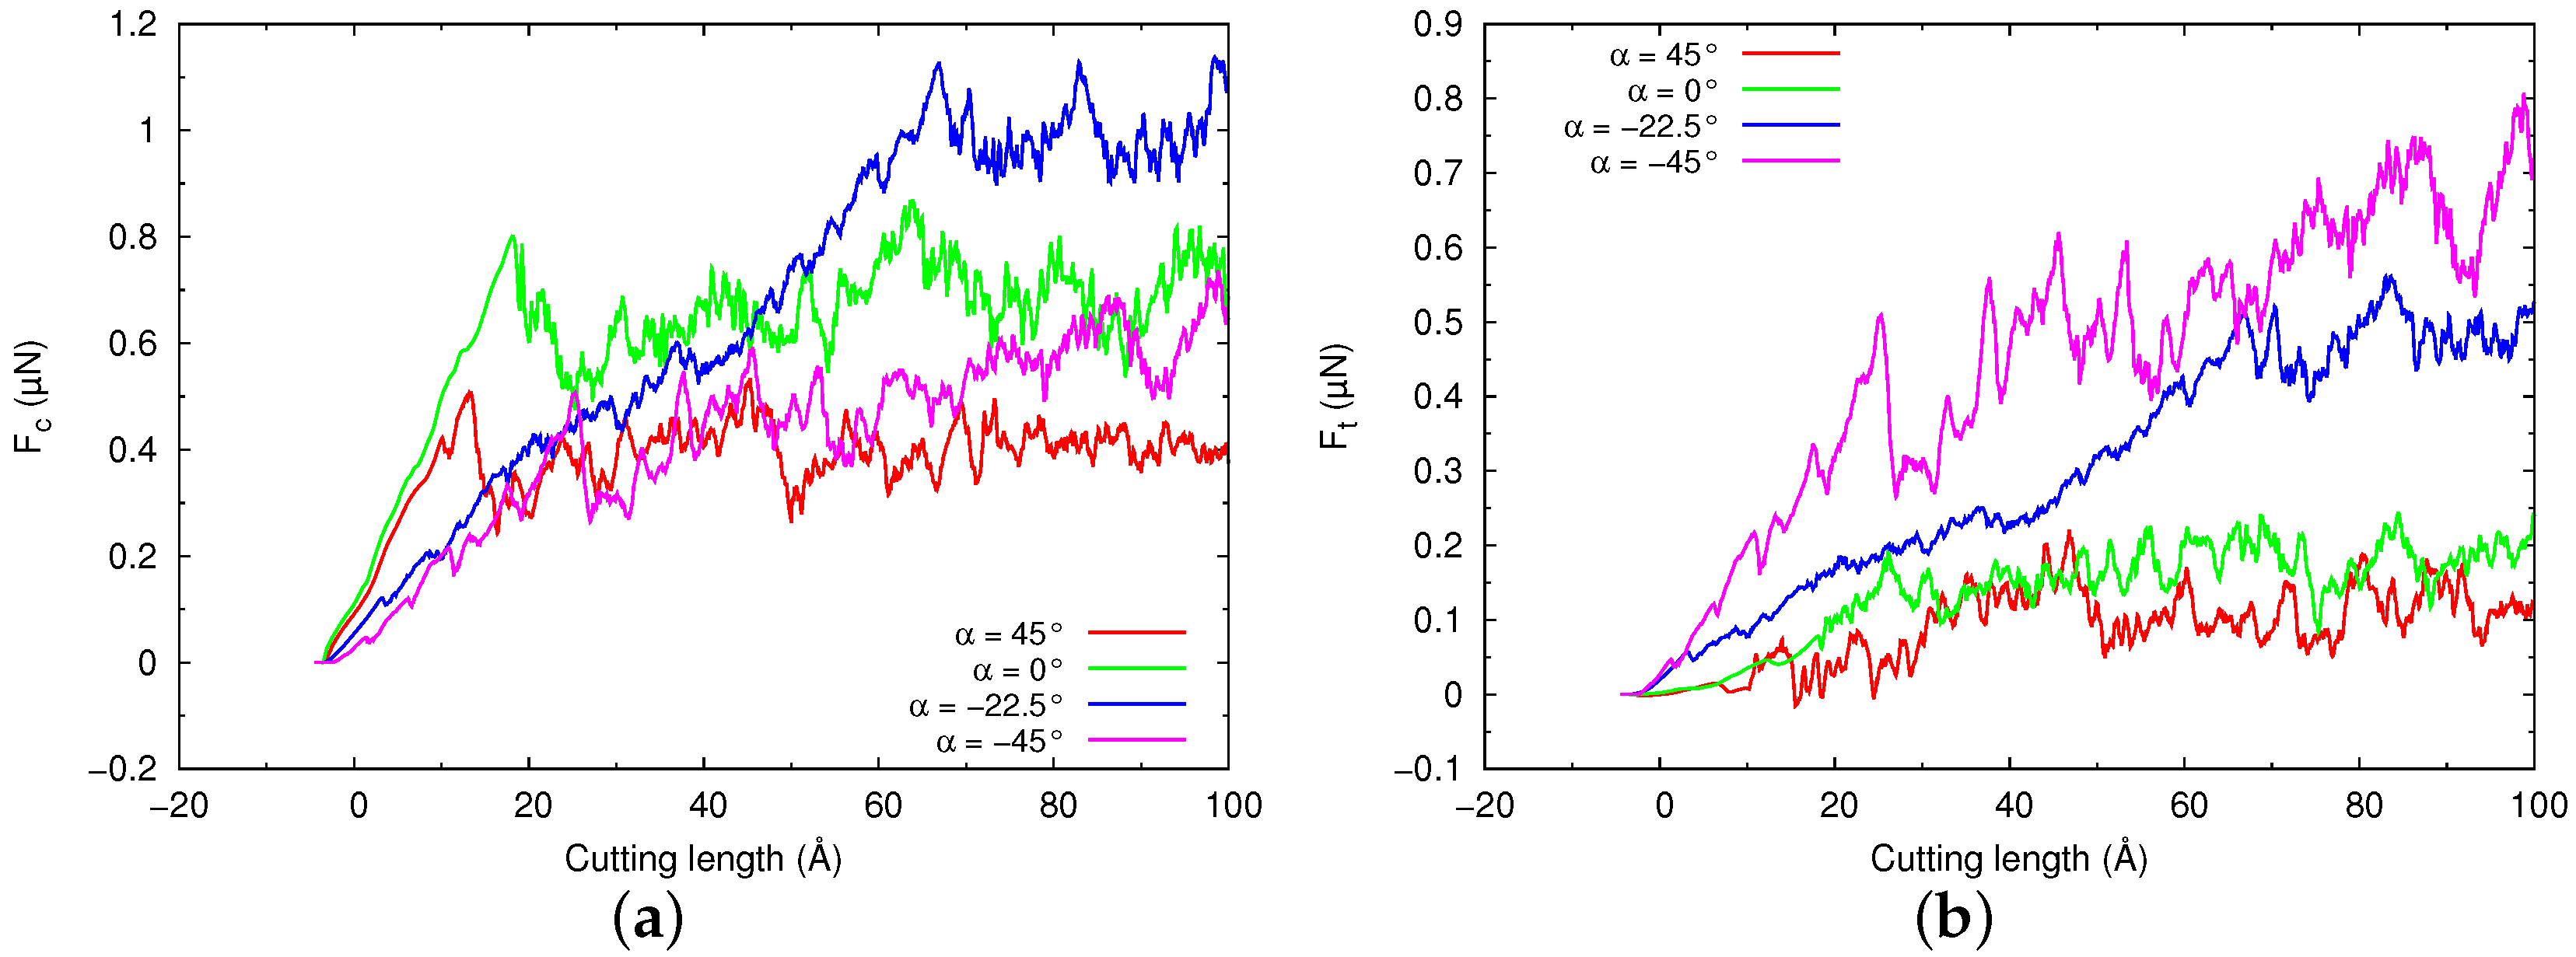
The force on the tool was readily measured in an MD simulation. Figure 7 shows the evolution of the force with cutting length; the components of the force in the cutting direction, , and normal to the original surface, , which are denoted as cutting and thrust forces, respectively, are displayed. After the tool contacted the substrate (at Cutting Length 0), the forces started increasing. The increase was, however, not monotonous, since the generation of dislocations led to force drops. Towards the end of the cut, a sort of steady-state appeared to develop—with the possible exception of the thrust force at rake angle . We assemble the averages of the forces over the last 30 Å of the cut in Table 1.
The thrust forces increased with decreasing showing that a stronger perpendicular force was needed to keep a wider tool at its prescribed depth. With decreasing , also the cutting force increased; this increase illustrated the fact that larger forces were needed to shear the material and form the chip. Here, the case of was exceptional, as the cutting force was quite small, even below the values of . This could be explained by the fact that in this case, no chip was formed (see Section 3.3), and we hence, did not have a case of real “cutting” here.
3.5. Force Angle
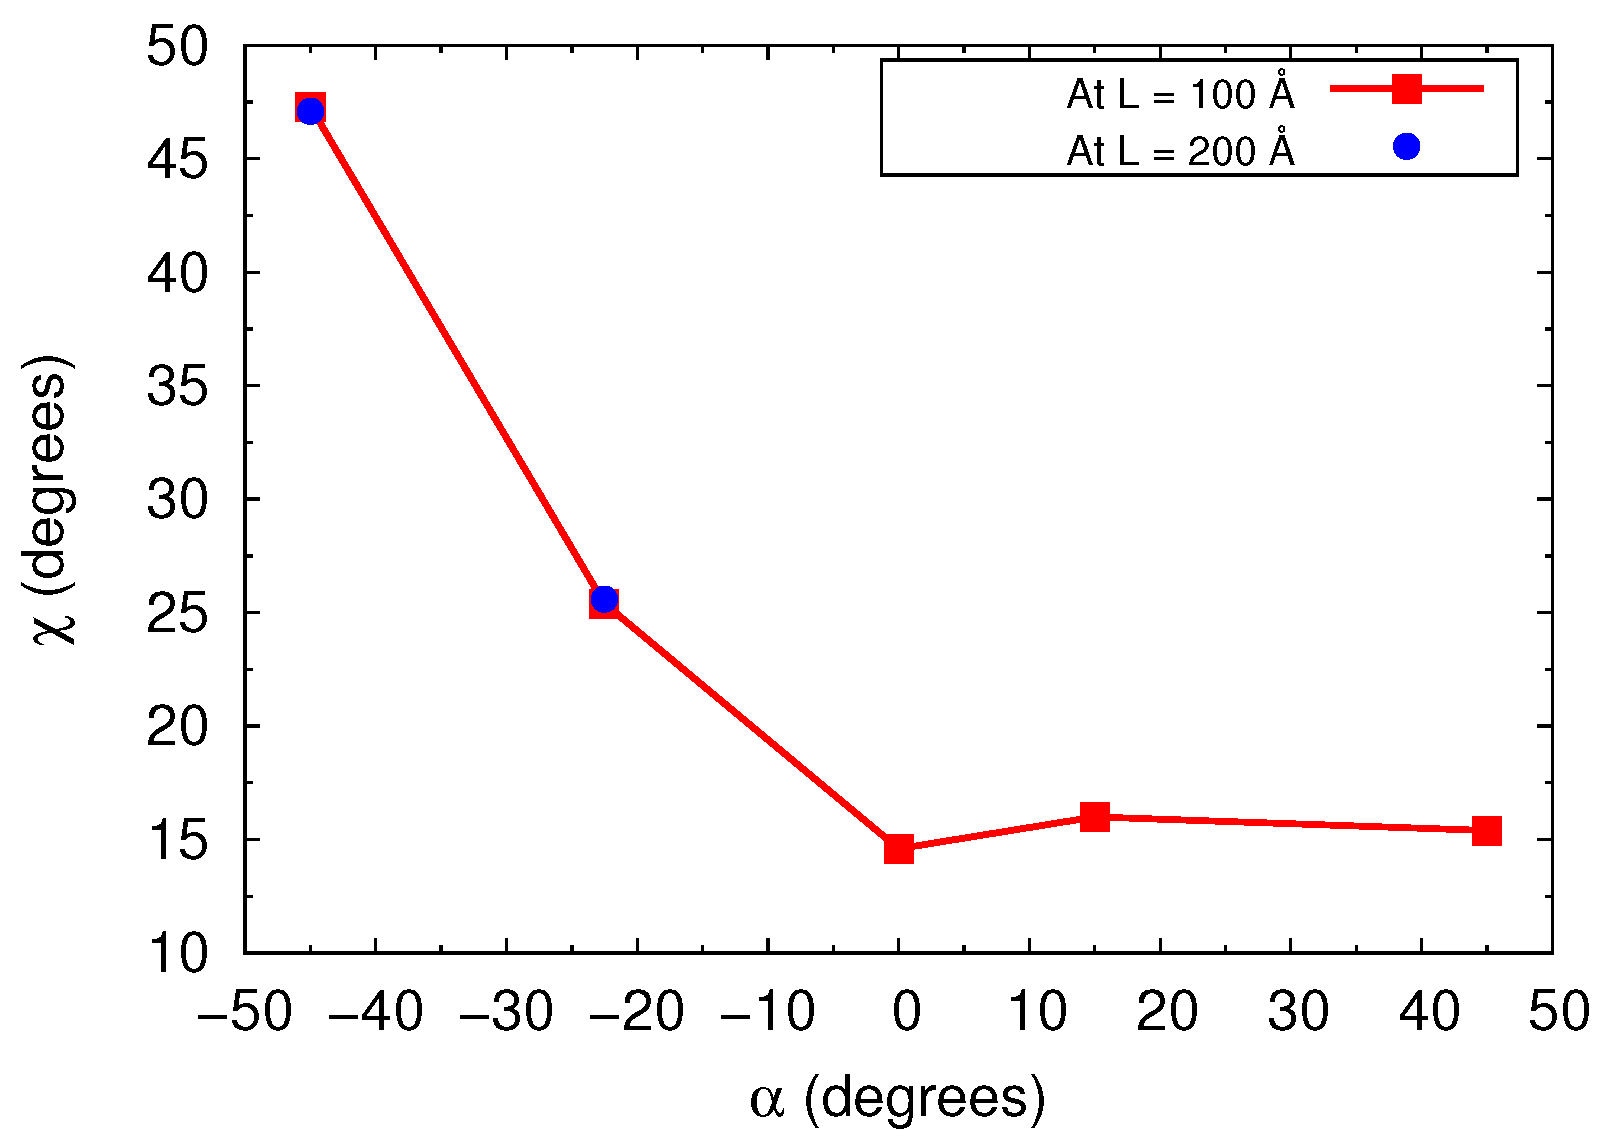
From the forces determined in the simulation, we could calculate the friction angle; see Table 1. It allowed us to calculate the force angle; we display it in Figure 8. It showed that in the regime of chip formation, , the force angle was constant, , and only increased for negative , where no chips were formed. This feature—constant for constant –is important as the relation between these two angles is an important ingredient of available cutting theories.
Mechanical theories of cutting result in a linear relationship between shear angle and force angle [6],
From theoretical arguments, the law, Equation (5), is derived with and or 0.5, depending on whether it is assumed that shear should occur in the direction of maximum shear stress or the power needed for cutting is minimized, respectively [2,3,5,6,7,50,51]. In particular, the so-called Merchant’s law [2] with and forms the basis of textbook treatments of cutting [51]. On the other hand, from experimental data compiled for mild steel by Pugh [52], coefficients of and can be read off (Figure 2) [6]. A shear angle of would hence correspond to a force angle of ; this corresponds to a force pointing out of the surface, which is totally unphysical. On the other hand, our measured force angle of corresponded to , which was in direct contrast to the shear observed in the simulation.
Our results also lay strongly outside the simple theoretical dependencies and or 0.5, which would predict a force angle of () and . Again, the large shear angle would require a negative force angle.
We note that MD simulation of cutting an isotropic material (metallic glass) corroborated Merchant’s law [2]), i.e., Equation (5) with and [53].
We concluded that our results of single crystal cutting showed a fixed force angle for a fixed shear angle, in agreement with available cutting theories. However, the value of was incompatible with these theories.
4. Summary
We used MD simulation to study the cutting of an Fe single crystal using tools with various rake angles. Focusing on the (110)[001] cut system, we obtained the following findings.
- For the (110)[001] cut system, at not too strongly negative rake angles, the crystal plasticity was governed by a simple mechanism: the evolution of the chip was driven by the generation of edge dislocations with the Burgers vector . These fixed the shear angle to , independently of the rake angle of the tool.
- For positive , the thickness of the cut chip corresponded well to the law predicted by mass conservation, Equation (4).
- While macroscopic cutting of (polycrystalline) iron is governed by a linear relationship between the shear angle and the force angle , in our system, the shear angle was fixed, and also, the force angle was fixed, at . The relation between and was, however, outside that found for macroscopic cutting, Equation (5), of macroscopic (polycrystalline) mild steels and also of other data found experimentally for metal cutting.
- The relation observed between and was even far away from relations derived theoretically, which were shown to hold true in MD simulations of isotropic materials (metallic glasses) [53].
- The chip form was simple—a rectangular shape, showing negligible curvature—as long as a single dislocation glide mechanism governed plasticity. This changed for (strongly) negative rake angles.
- Only for (strongly) negative rake angles, the mechanism of plasticity changed, leading to a complex chip shape or even suppressing the formation of a chip. In these cases, the force angle strongly increased while the friction angle tended to zero.
The dependencies were simple as long as cutting was dictated by a single dislocation glide mechanism. For other cut systems, the situation became more complex and could no longer be described in the framework of the single shear cutting model. An example is given in Appendix A.
In future work, it will be interesting to investigate how the cutting depth d and the curvature radius r of the tool edge influence our conclusions. In applications, these two lengths will be larger than the values adopted in the present study, but may have a similar relation, , as the one adopted in the present work, where we used . As long as a single crystalline grain is cut, one could therefore presume that our ideas are relevant; but this hypothesis needs to be further investigated. In particular, experimental verification of our prediction of the effect of the rake angle on the cutting of single crystals would be highly appreciated.
Author Contributions
I.A.A. performed the simulations and analyzed the results. I.A.A. and H.M.U. designed the work, discussed the results, and wrote the manuscript. All authors read and agreed to the published version of the manuscript.
Funding
This research was funded by the Deutsche Forschungsgemeinschaft (DFG, German Research Foundation), Project Number 172116086–SFB 926.
Acknowledgments
Access to the computational resources provided by the compute cluster “Elwetritsch” of the University of Kaiserslautern is appreciated.
Conflicts of Interest
The authors declare no conflict of interest.
Appendix A. The (100)[011] Cut System: Twinning
For general cut surfaces and cut directions, more than one dislocation slip system—and hence shear plane—contributes to chip formation [22], and the analysis provided here for the (110)[001] system will not hold. We illustrate the complexities arising with the example of the (100)[011] system.
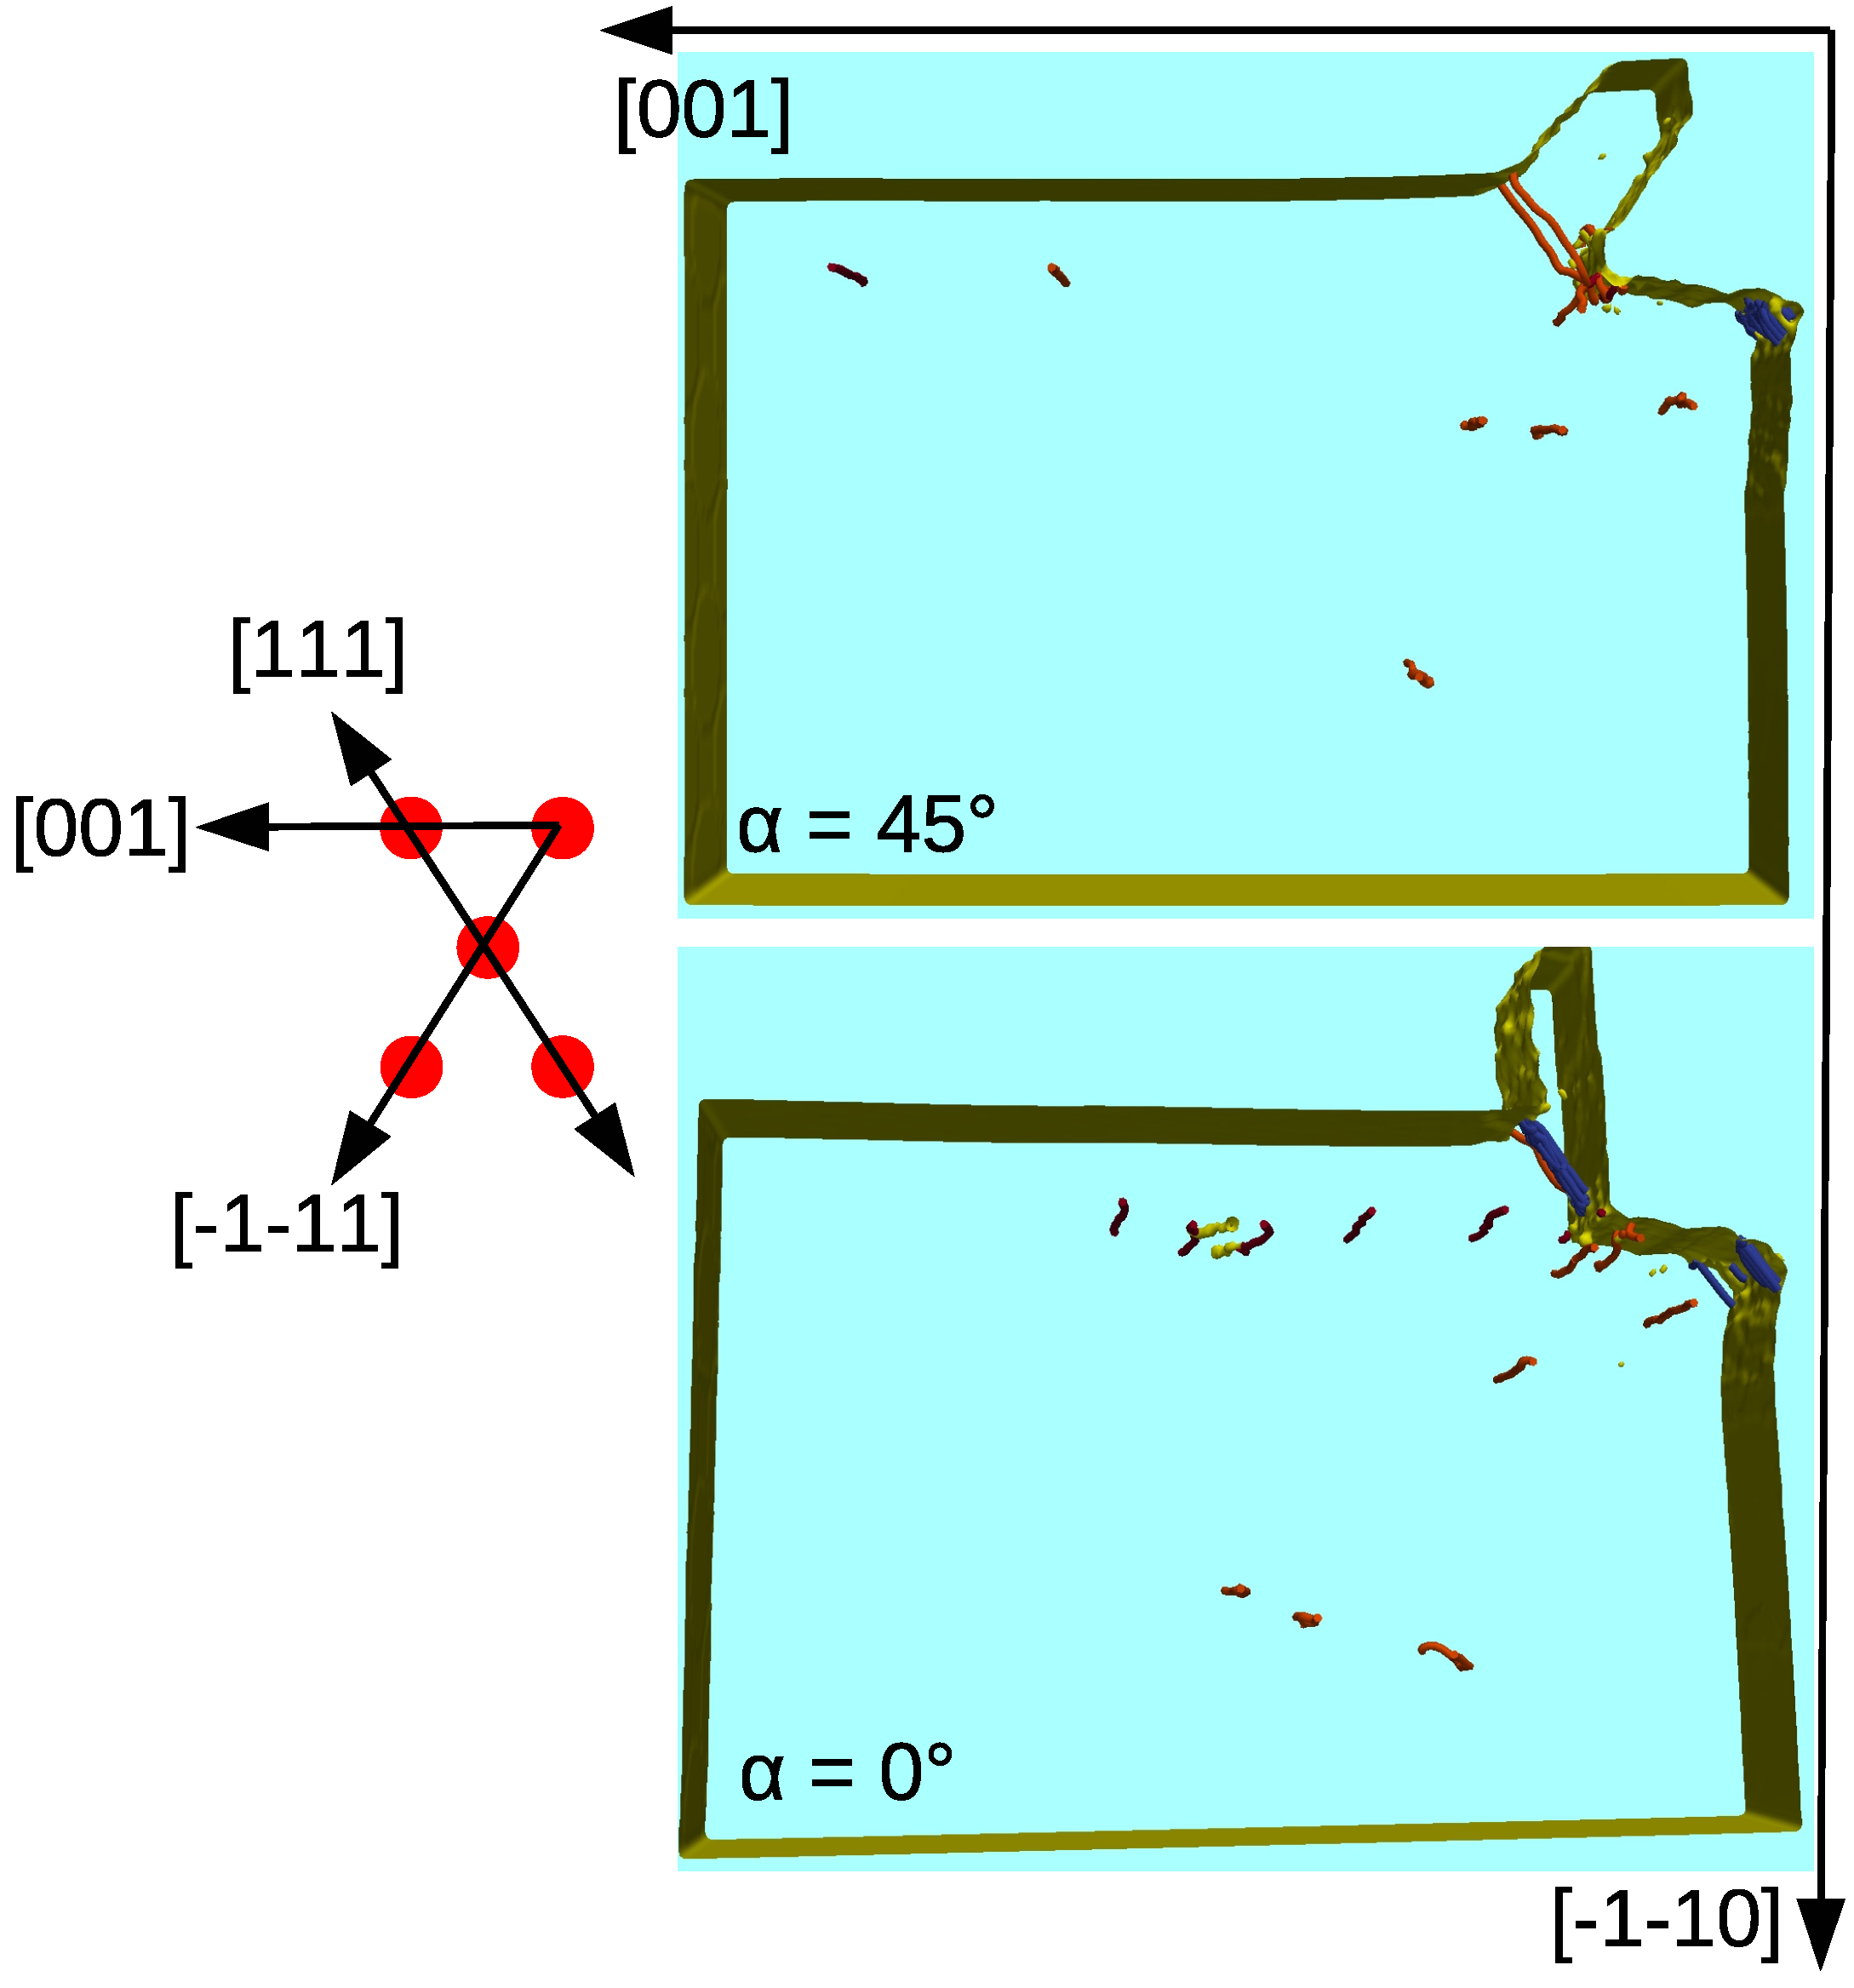
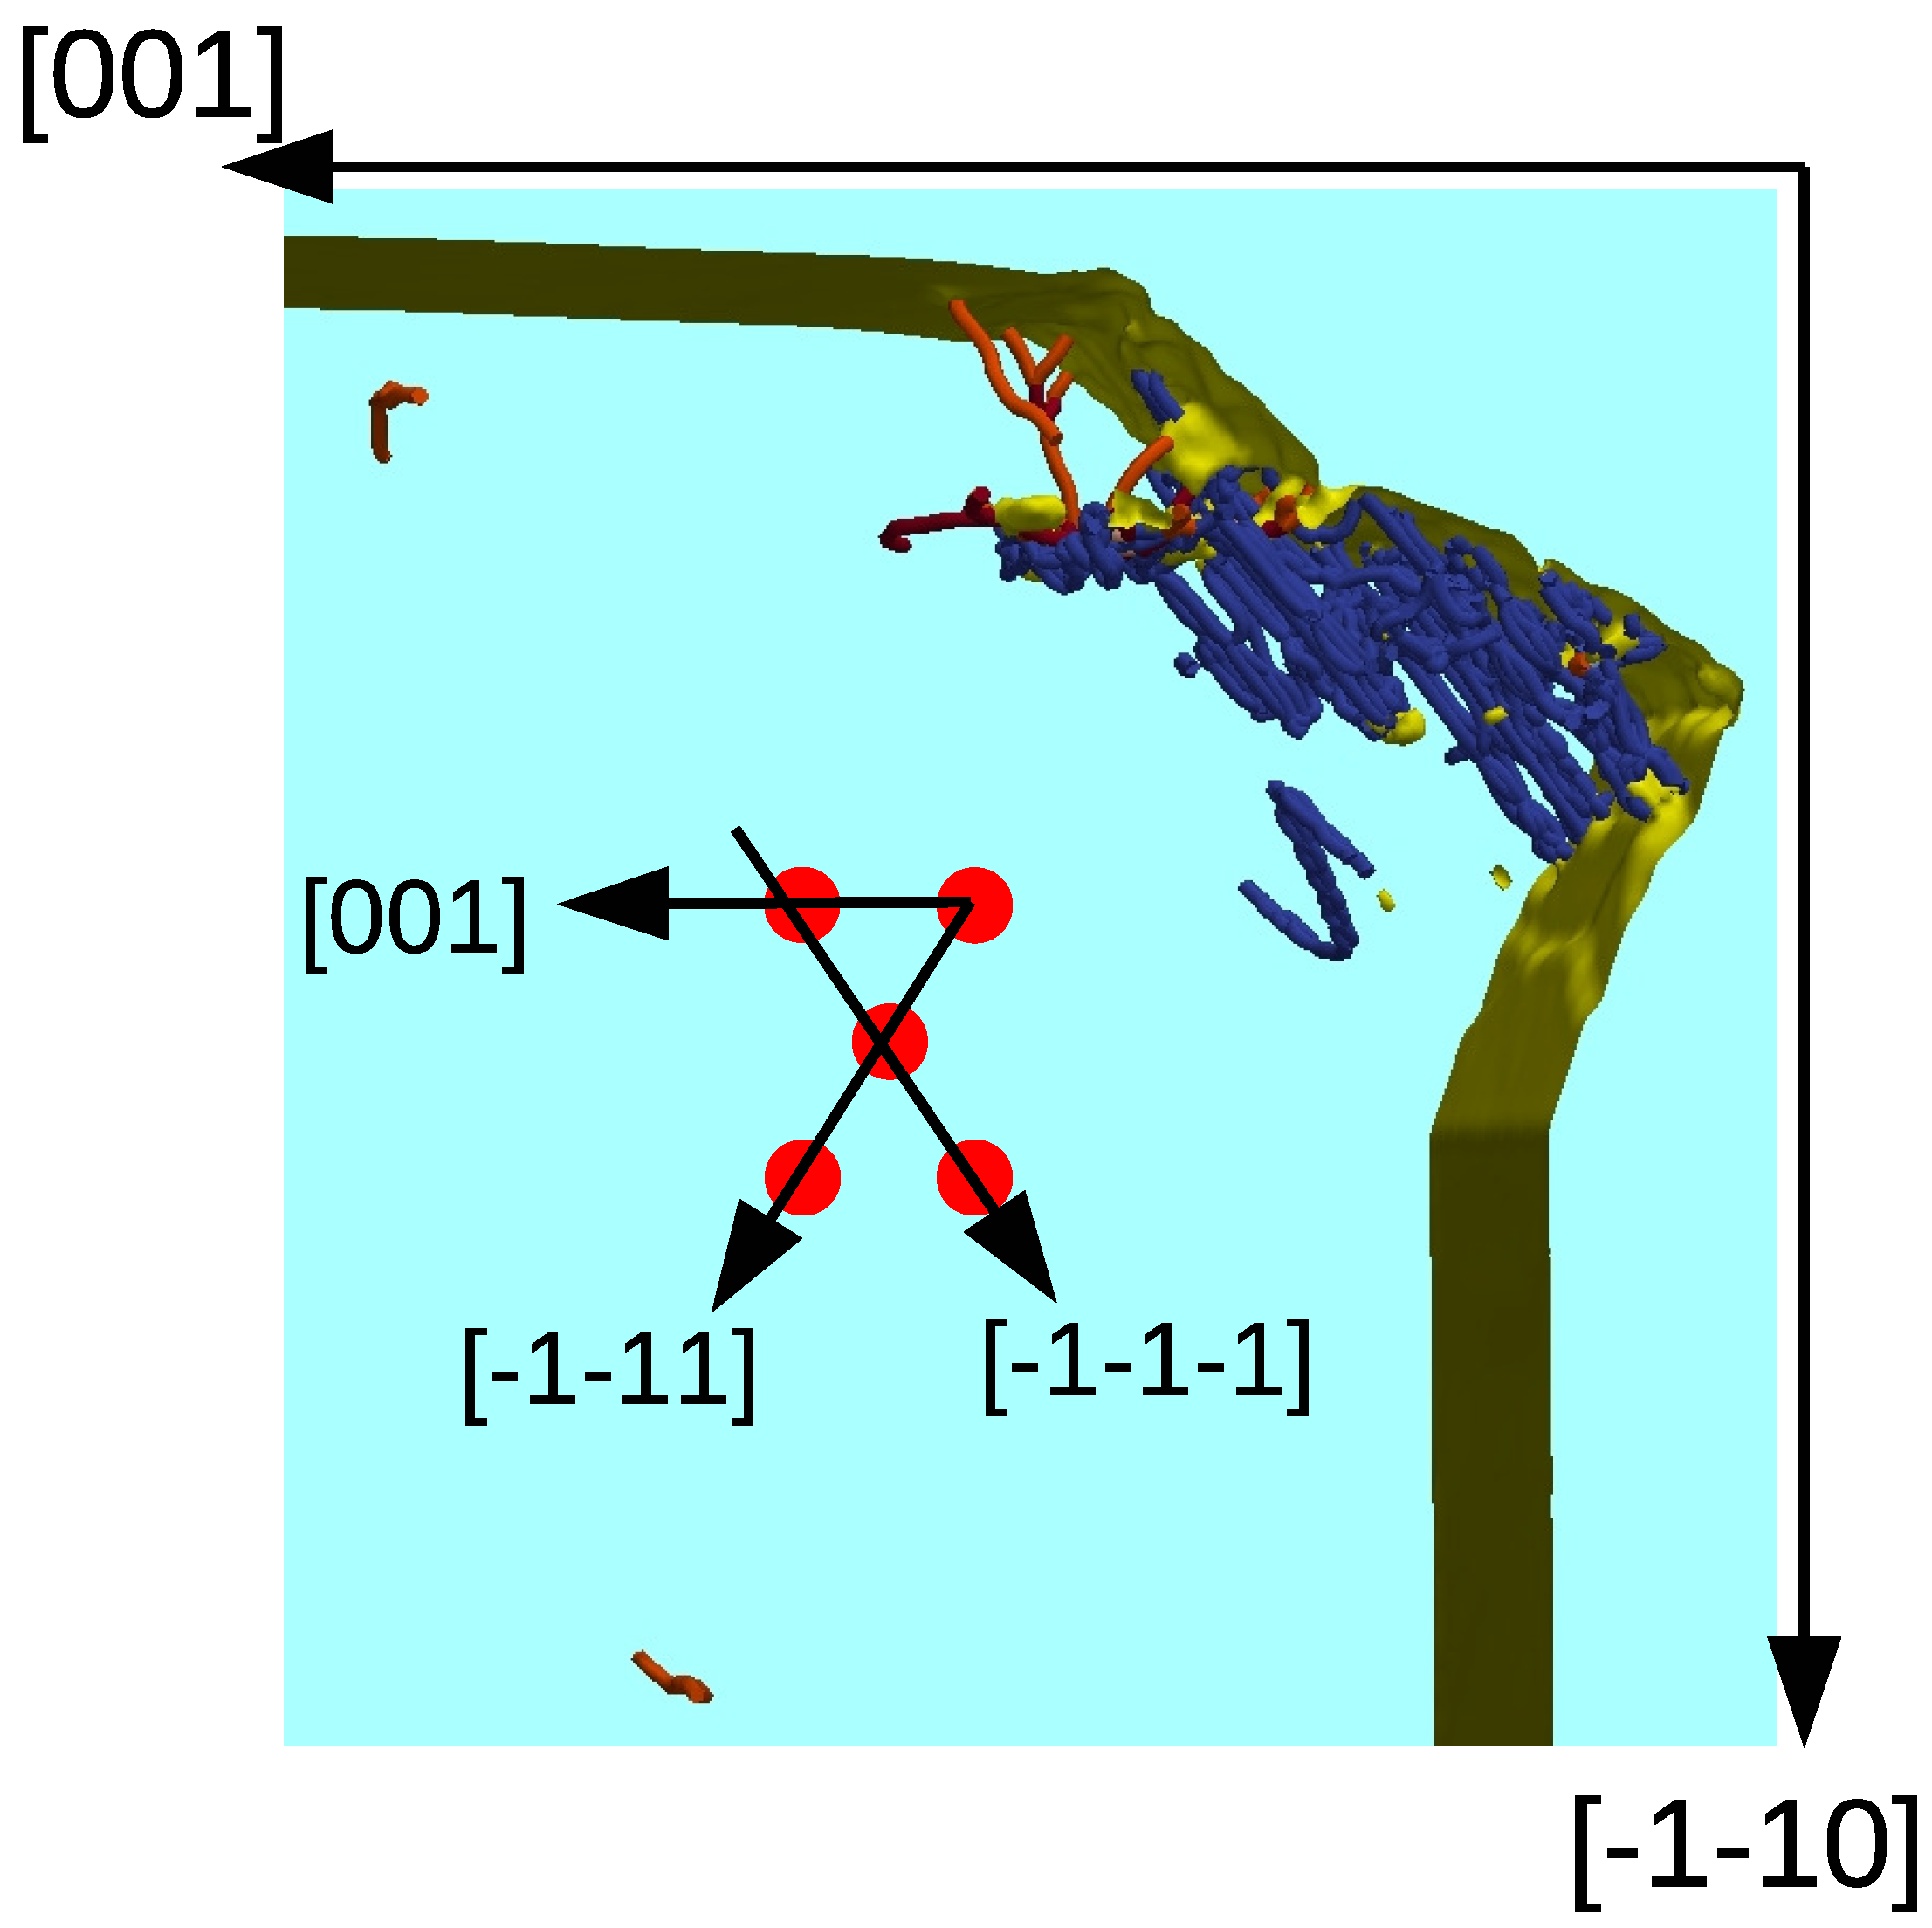
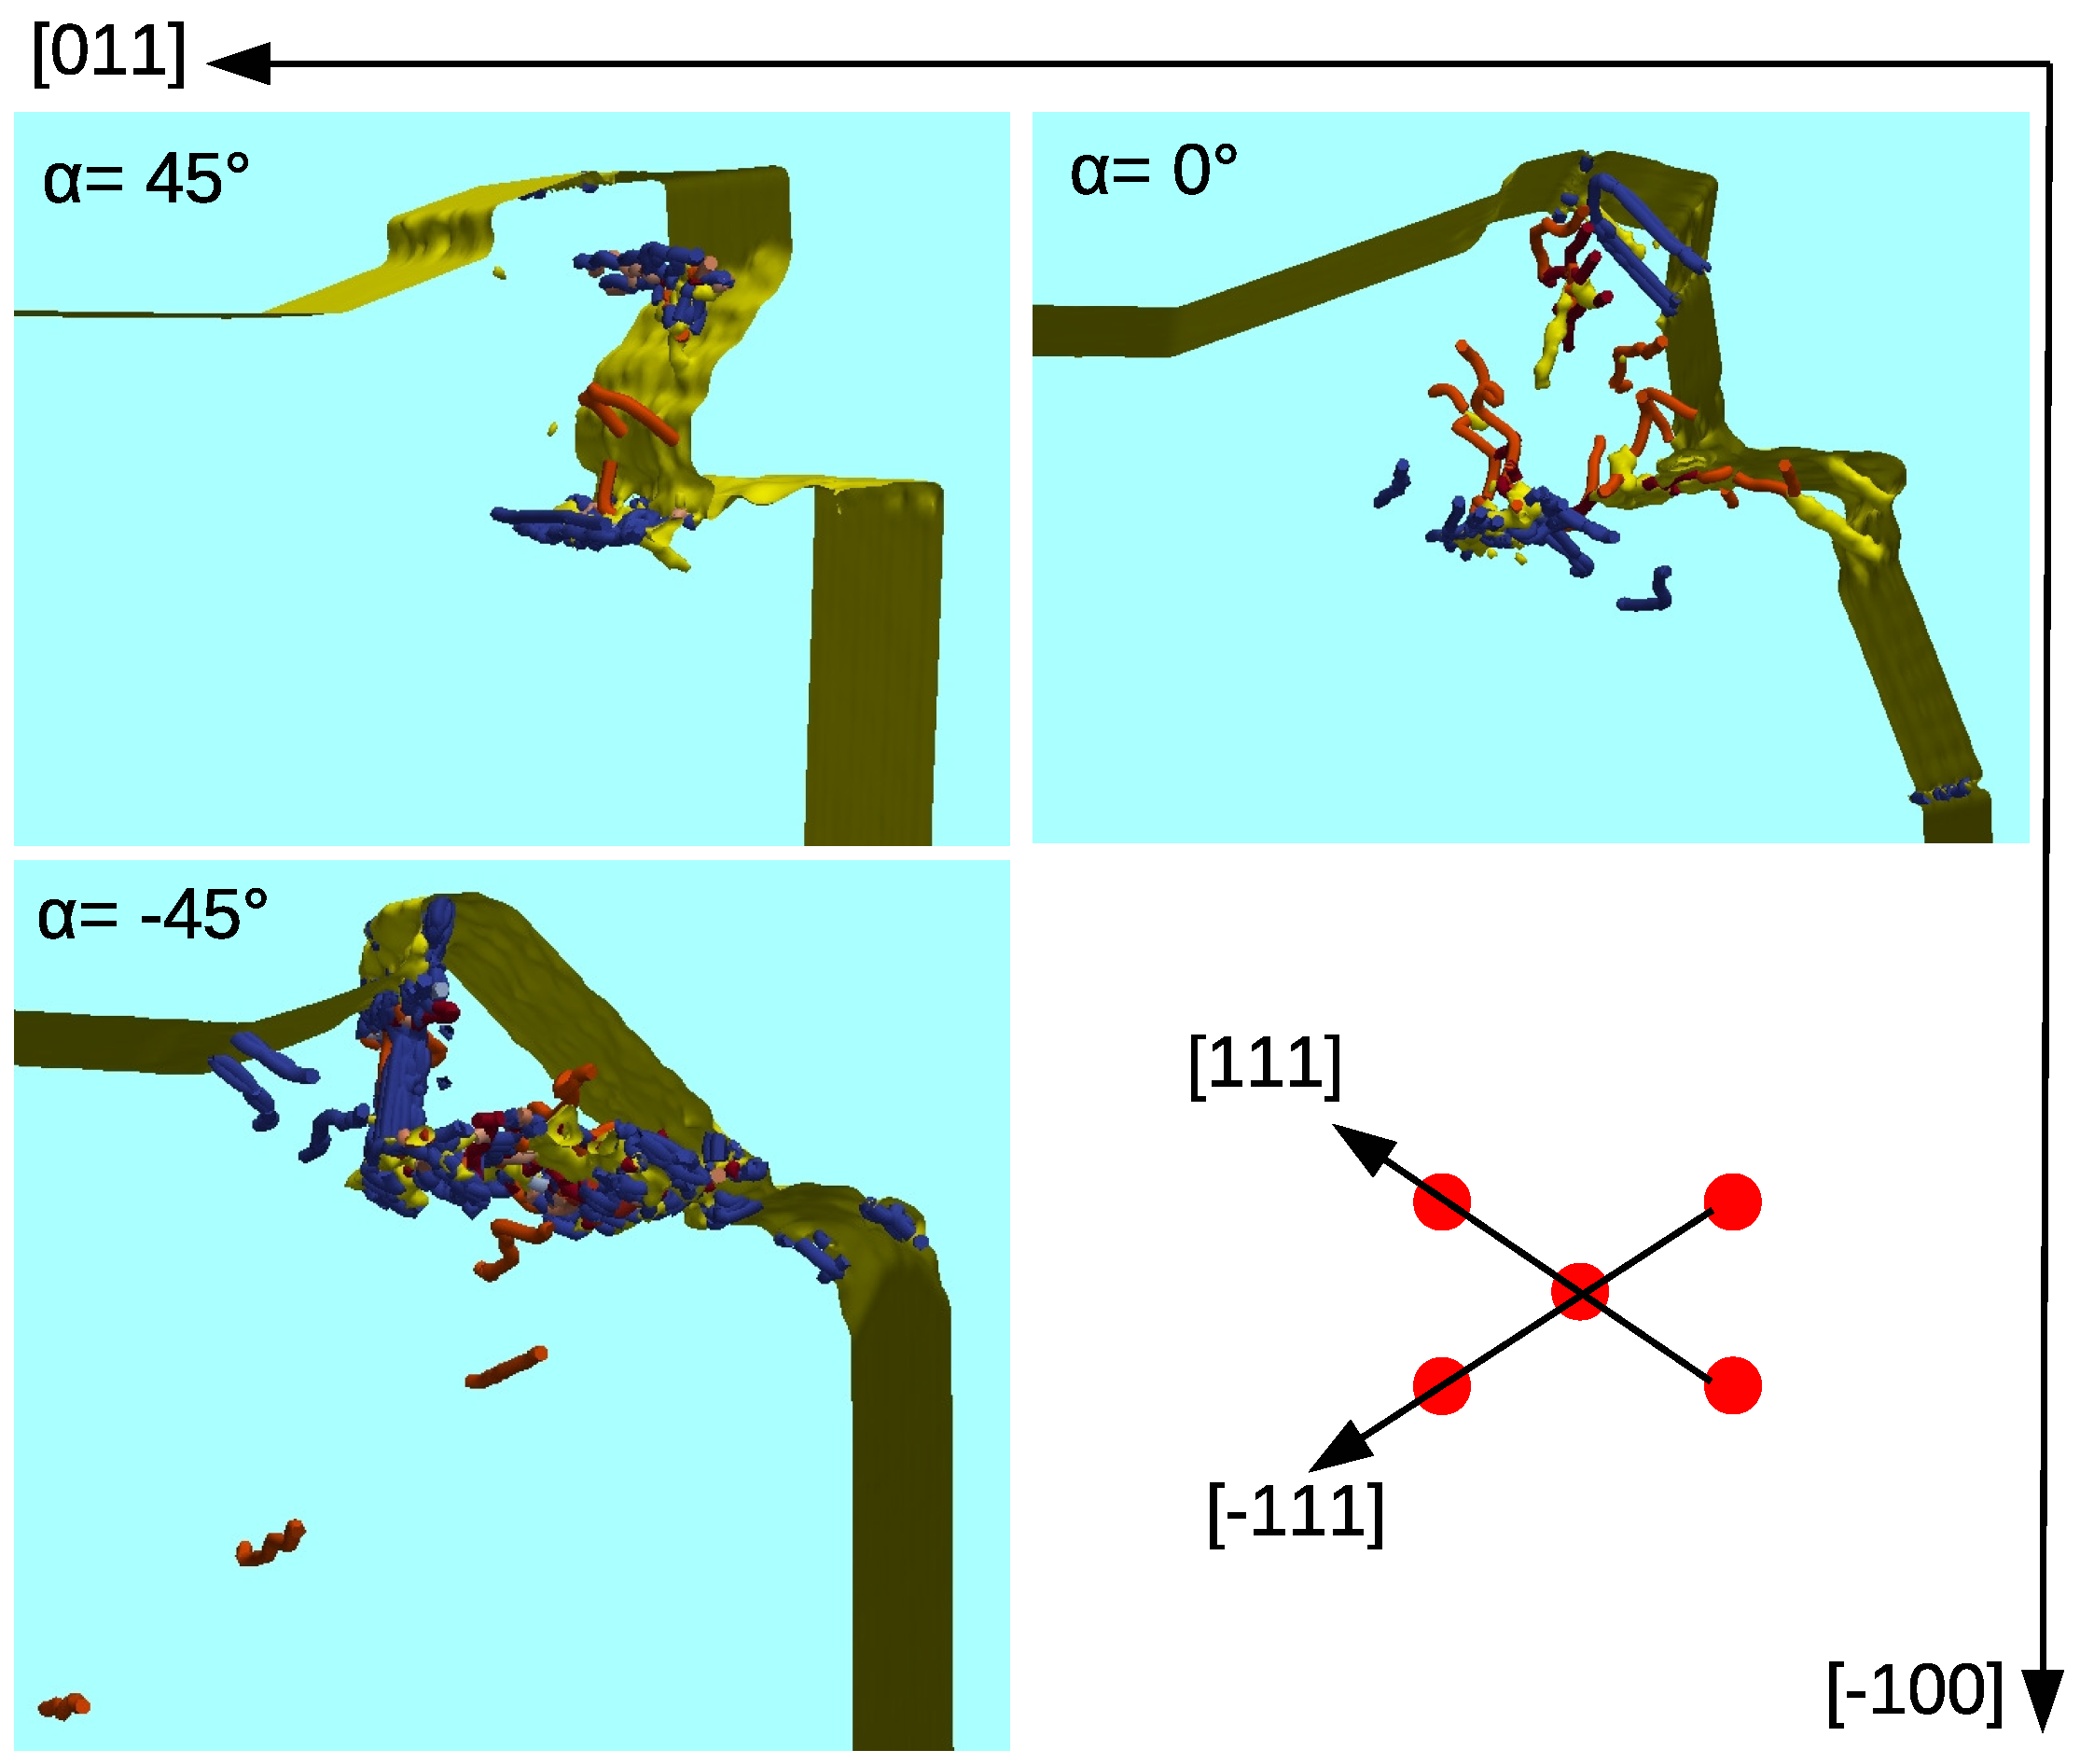
In this system, the slip direction responsible for chip formation, [111], made an angle of to the surface. Figure A1 illustrates the deformation occurring under cutting for three rake angles, , , and . Perfect dislocations with the Burgers vector were activated, which glided to the top surface. In addition, and more pronouncedly, twinning partials showed up. The generation of a twinning boundary is most clearly seen in the figure for the rake angle of , where it is marked by a dense net of partial dislocations. The slip direction was only activated for .
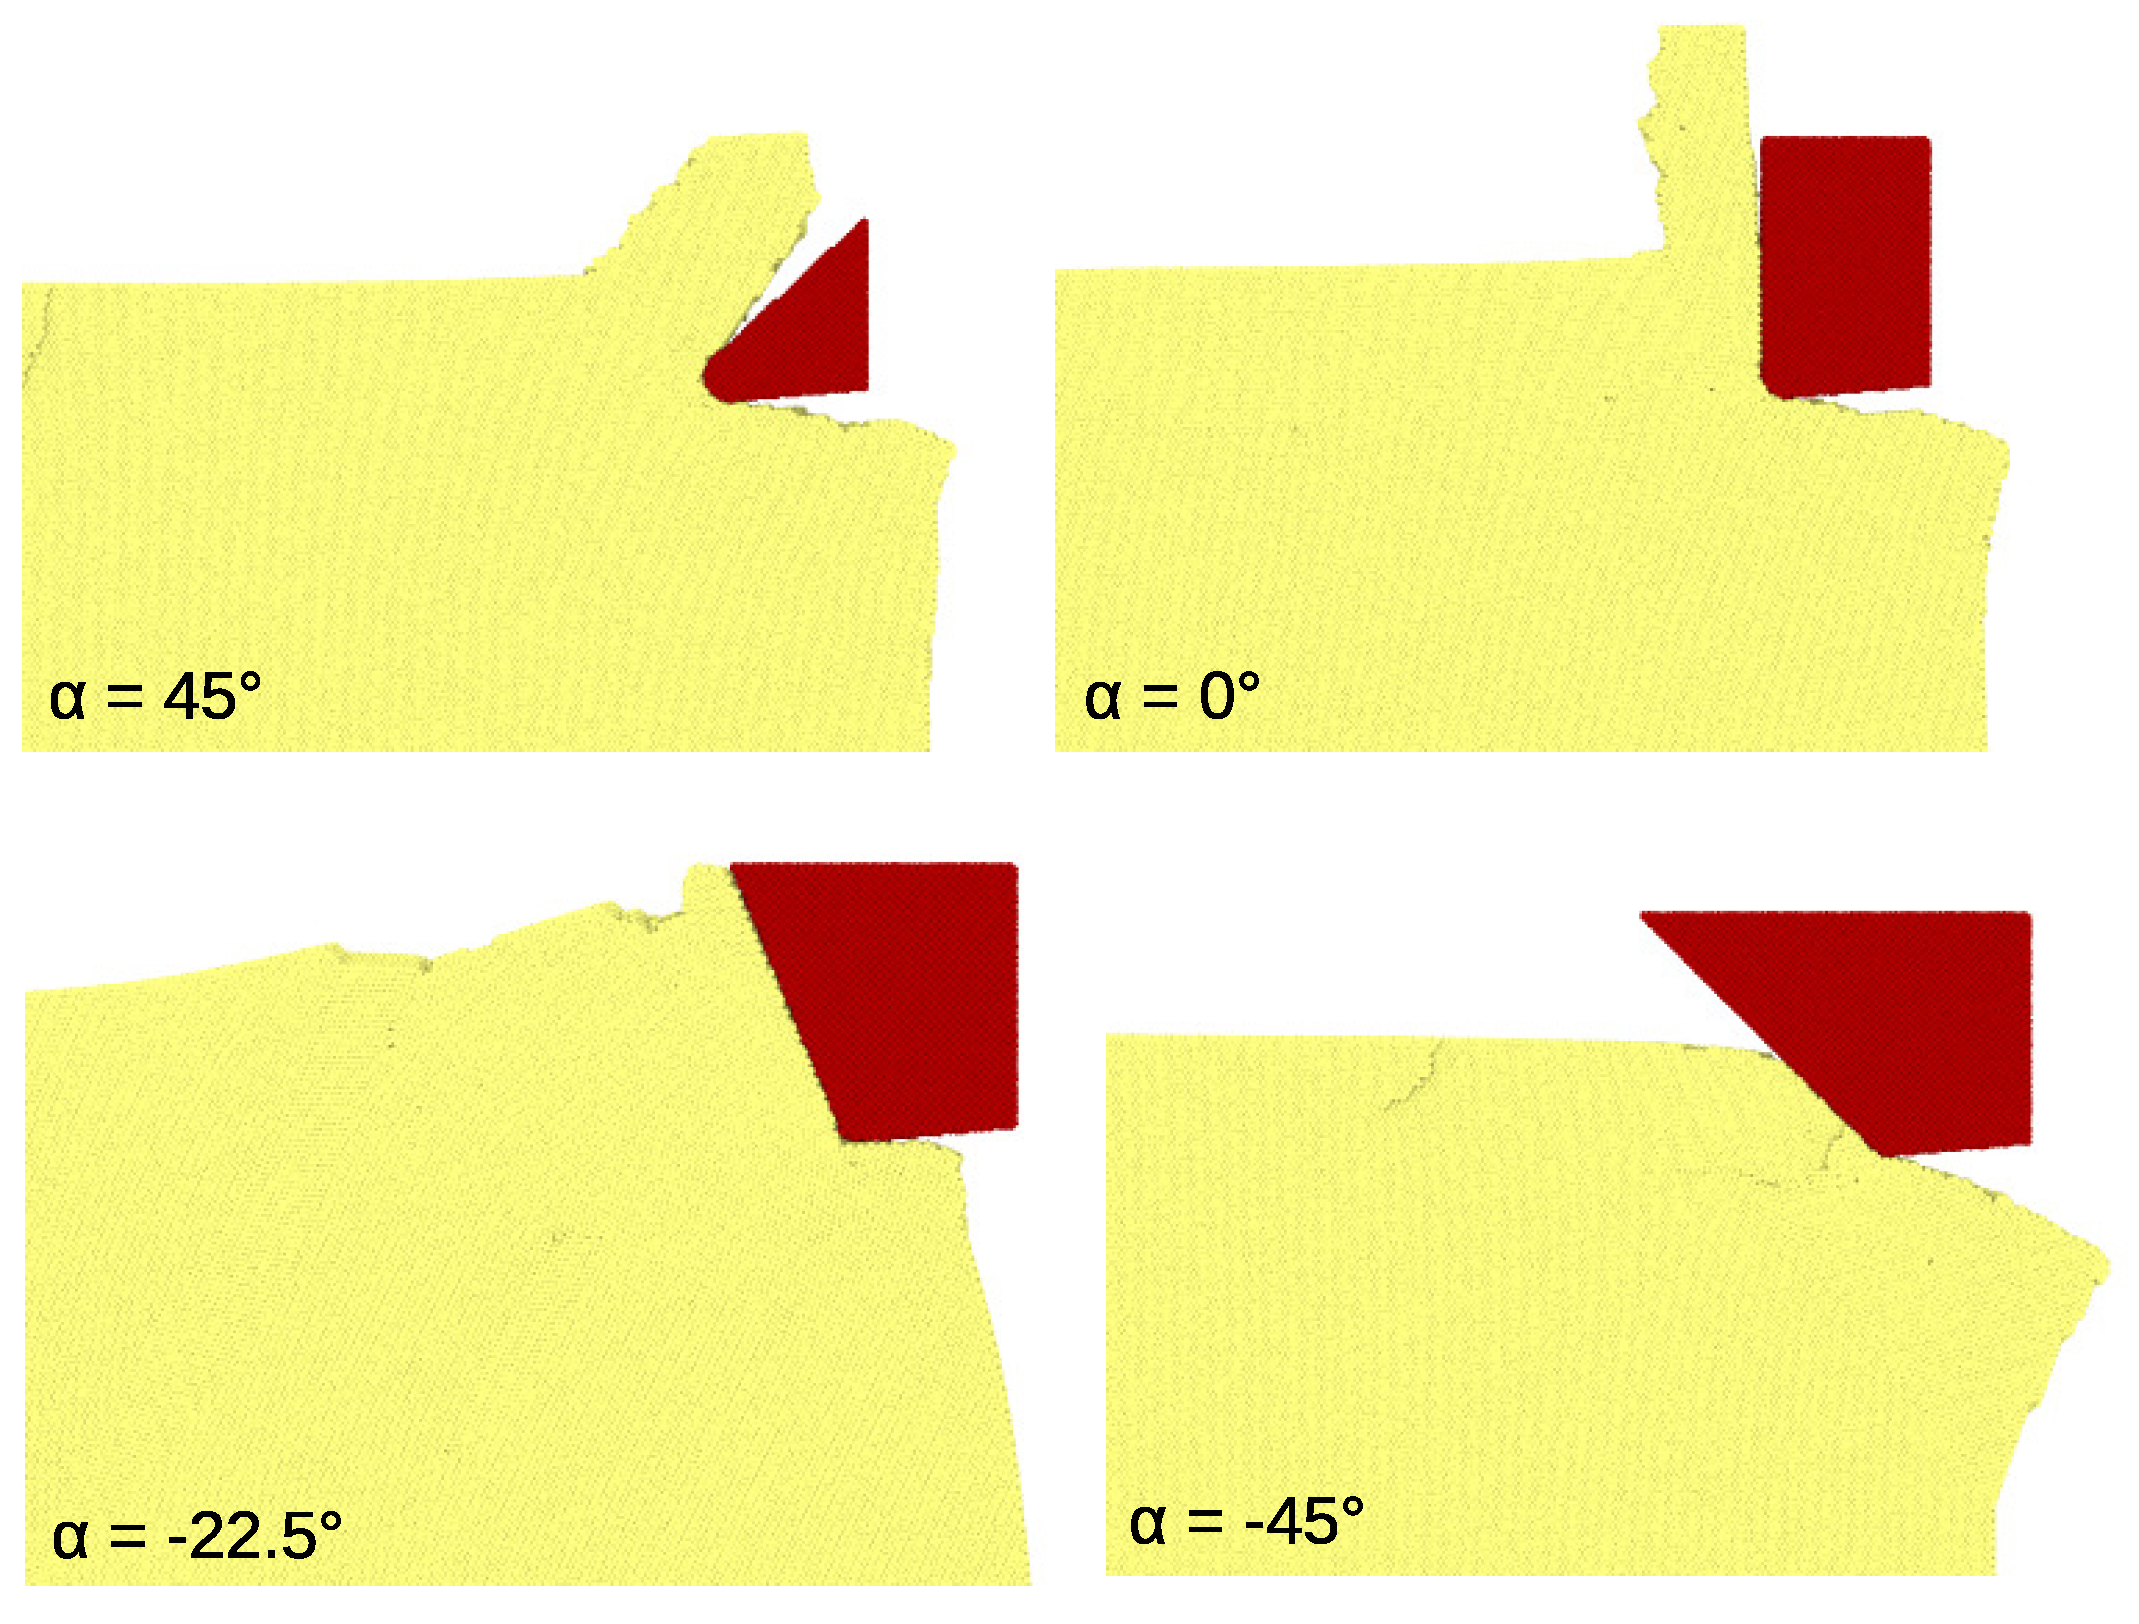
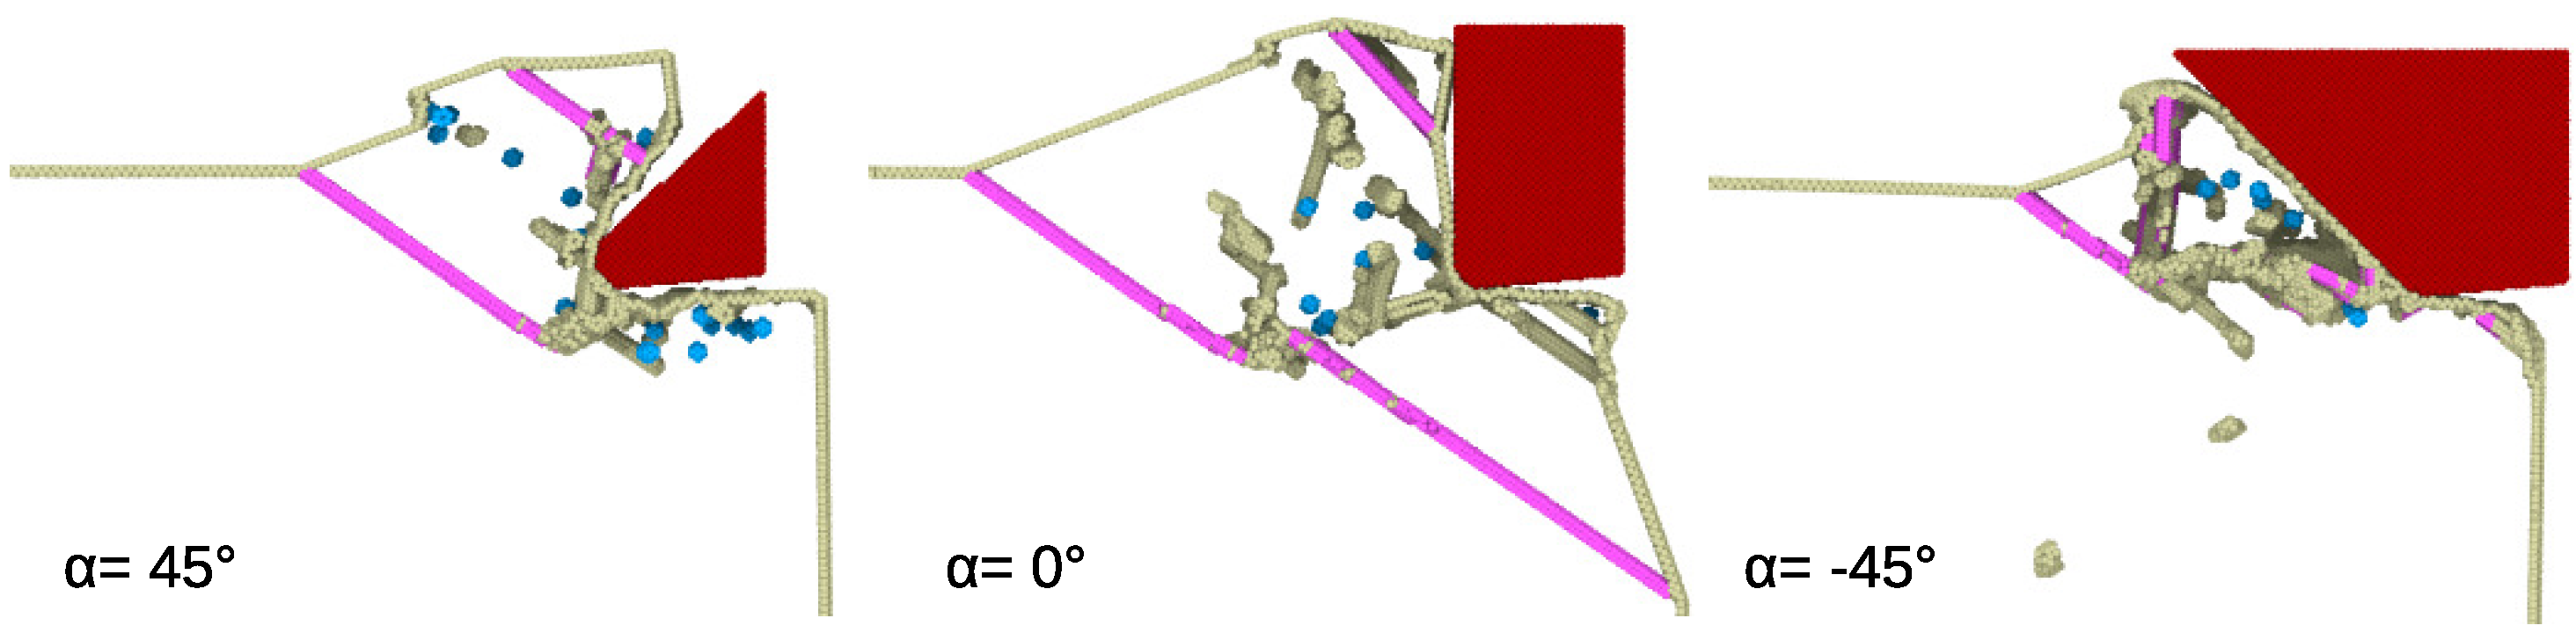
The twinning partials led to the generation of twin boundaries, which are highlighted in Figure A2. The largest twin was generated for . Twinned surfaces were recognizable by their smooth surfaces, while the dislocations arriving at the surface led to surface roughening. Note that for this cutting system, even the tool led to chip formation, since now the shear angle was smaller, enabling dislocation glide to the surface even for strongly negative rake angles.
The twinning occurring in front of the tool was equivalent to several shear planes being active temporarily during the cutting process and thus complicated any simple analysis in terms of the single shear plane model.
Figure A1.
Side view of the dislocations generated in the Fe (100)[011] cutting system at cutting length 100 Å with a cutting tool of rake angles , , and . Dislocations and slip directions are denoted as in Figure 2.
Figure A1.
Side view of the dislocations generated in the Fe (100)[011] cutting system at cutting length 100 Å with a cutting tool of rake angles , , and . Dislocations and slip directions are denoted as in Figure 2.

Figure A2.
Same cutting systems as in Figure A1, but highlighting twinning boundaries (pink). Vacancies are shown in blue, while surfaces and dislocations are colored gray.
Figure A2.
Same cutting systems as in Figure A1, but highlighting twinning boundaries (pink). Vacancies are shown in blue, while surfaces and dislocations are colored gray.

Appendix B. Extended Cutting Length
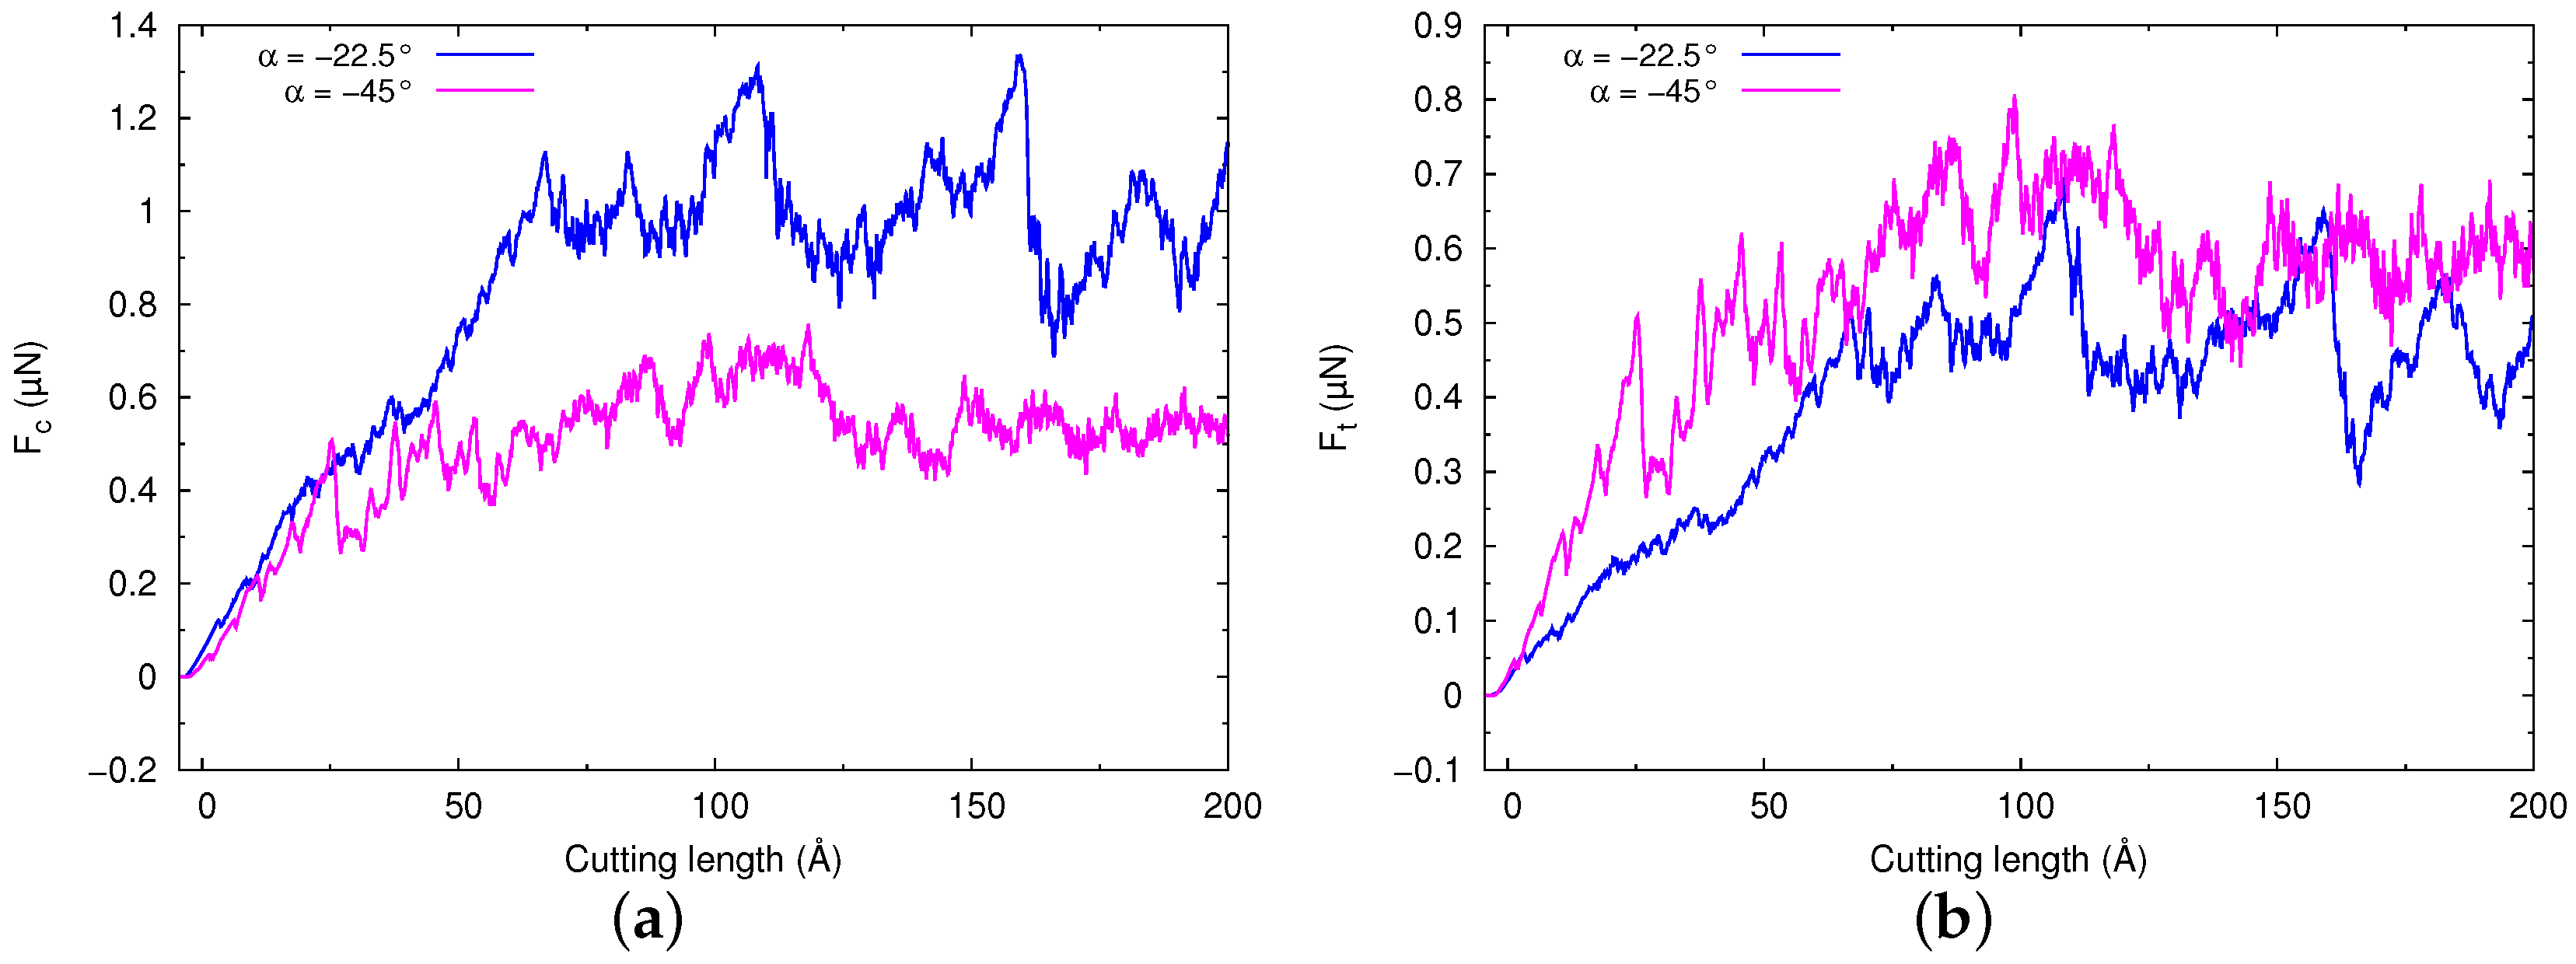
It might be speculated that a cutting length of Å is not sufficient to obtain steady-state cutting conditions, in particular for the negative rake angles. We therefore increased the cutting length in these cases to 200 Å. The evolution of the cutting force and of the thrust force shown in Figure A3 demonstrated that the simulation results indeed stabilized at Å. The data for cutting lengths between 100 and 200 Å showed, apart from fluctuations caused by the discontinuous emission of dislocations, the same average behavior. We assemble the averages over the last 100 Å in these extended runs in Table 1, which shows that deviations of % showed up between the 100 Å run and the new extended run. As a consequence, also the friction angle and the force angle showed only minor deviations from the shorter run, cf. Figure 8, and the conclusions stated in the main part of the text remain valid.
Figure A3.
(a) Cutting force, , and (b) thrust force, , as a function of the cutting length L for an extended simulation up to 200 Å for the negative rake angles, and .
Figure A3.
(a) Cutting force, , and (b) thrust force, , as a function of the cutting length L for an extended simulation up to 200 Å for the negative rake angles, and .

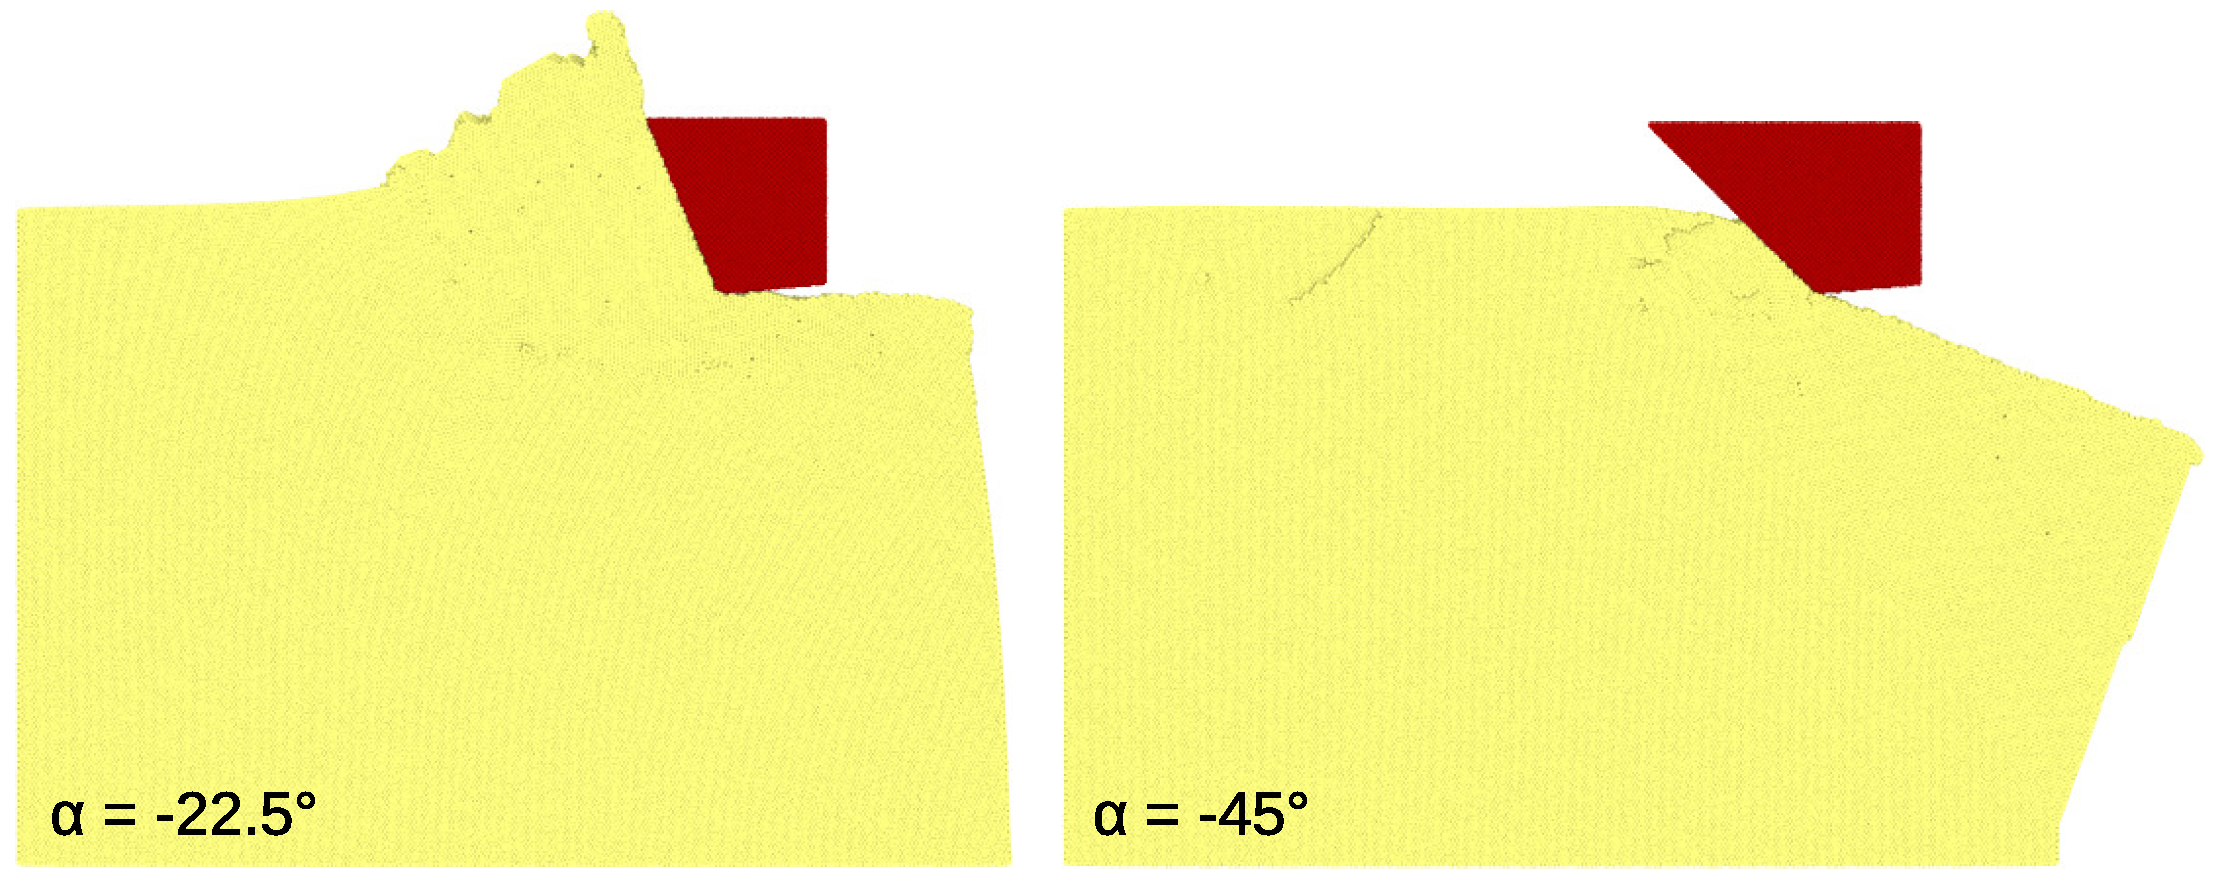
The chip shapes also (Figure A4) showed no new features compared to the shorter runs shown in Figure 5. In particular, for the most negative rake angle of , no chip was formed on the top surface. The chip for the rake angle grew in size, but its structure consisting of several sub-peaks remained intact. Note that the very first peak (close to the rake face), which was created by the glide of 1/2[111] dislocations, retained its identity. Its width did not change (see Table 1), which indicated that this feature did not change any more after Å, in close agreement with the result obtained after cutting of 100 Å. Our conclusion that the chip thickness fits again nicely with the theoretical prediction, Equation (4), was hence unchanged.
Figure A4.
Side views of the chips formed during cutting for an extended simulation up to 200 Å for the negative rake angles, and .
Figure A4.
Side views of the chips formed during cutting for an extended simulation up to 200 Å for the negative rake angles, and .

Finally, we display in Figure A5 the dislocations generated after cutting the crystals for the extended cutting length of Å. For the rake angle of , again, the large number of partials dominated the picture; these were responsible for the substructure of the chip containing several peaks. Indeed, when comparing Figure A5a with Figure 3, a new dislocation emission center at the chip front emerged, which induced a new peak at the front of the chip. For the rake angle of , dislocation emission in directions proceeded and was responsible for the increased deformation of the frontal (right-hand side) surface, which now extended almost over the entire simulated crystal face in the direction. The tangle of dislocations beneath the front part of the tool increased under extended cutting. Due to dislocation reactions, for both rake angles shown in Figure A5, vacancies were created, which are visualized as small yellow spheres.
Figure A5.
As in Figure 2, but for an extended cutting length, Å. Snapshots are for a rake angle of (a) and of (b) .
Figure A5.
As in Figure 2, but for an extended cutting length, Å. Snapshots are for a rake angle of (a) and of (b) .

We concluded that after increasing the cutting length from to 200 Å, the dislocation generation proceeded in analogy to the shorter cutting length, and no qualitatively new features showed up.
References
- Fang, F.; Xu, F. Recent Advances in Micro/Nano-cutting: Effect of Tool Edge and Material Properties. Nanomanuf. Metrol. 2018, 1, 4–31. [Google Scholar] [CrossRef]
- Merchant, M.E. Mechanics of the Metal Cutting Process. I. Orthogonal Cutting and a Type 2 Chip. J. Appl. Phys. 1945, 16, 267–275. [Google Scholar] [CrossRef]
- Merchant, M.E. Mechanics of the Metal Cutting Process. II. Plasticity Conditions in Orthogonal Cutting. J. Appl. Phys. 1945, 16, 318–324. [Google Scholar] [CrossRef]
- Astakhov, V.P. On the inadequacy of the single shear plane model of chip formation. Int. J. Mech. Sci. 2005, 47, 1649–1672. [Google Scholar] [CrossRef]
- Oxley, P.L.B. A strain-hardening solution for the “shear angle” in orthogonal metal cutting. Int. J. Mech. Sci. 1961, 3, 68–79. [Google Scholar] [CrossRef]
- Atkins, A.G. Modelling metal cutting using modern ductile fracture mechanics: quantitative explanations for some longstanding problems. Int. J. Mech. Sci. 2003, 45, 373–396. [Google Scholar] [CrossRef]
- Atkins, A.G. Toughness and cutting: A new way of simultaneously determining ductile fracture toughness and strength. Eng. Fract. Mech. 2005, 72, 849–860. [Google Scholar] [CrossRef]
- Ruestes, C.J.; Bringa, E.M.; Gao, Y.; Urbassek, H.M. Molecular dynamics modeling of nanoindentation. In Applied Nanoindentation in Advanced Materials; Tiwari, A., Natarajan, S., Eds.; Wiley: Chichester, UK, 2017; Chapter 14; pp. 313–345. [Google Scholar] [CrossRef]
- Ruestes, C.J.; Alabd Alhafez, I.; Urbassek, H.M. Atomistic Studies of Nanoindentation–A Review of Recent Advances. Crystals 2017, 7, 293. [Google Scholar] [CrossRef] [Green Version]
- Gao, Y.; Brodyanski, A.; Kopnarski, M.; Urbassek, H.M. Nanoscratching of iron: A molecular dynamics study of the influence of surface orientation and scratching direction. Comput. Mater. Sci. 2015, 103, 77–89. [Google Scholar] [CrossRef]
- Alabd Alhafez, I.; Brodyanski, A.; Kopnarski, M.; Urbassek, H.M. Influence of Tip Geometry on Nanoscratching. Tribol. Lett. 2017, 65, 26. [Google Scholar] [CrossRef]
- Komanduri, R.; Chandrasekaran, N.; Raff, L.M. MD simulation of exit failure in nanometric cutting. Mat. Sci. Eng. A 2001, 311, 1. [Google Scholar] [CrossRef]
- Fang, T.H.; Chang, W.J.; Weng, C.I. Nanoindentation and nanomachining characteristics of gold and platinum thin films. Mat. Sci. Eng. A 2006, 430, 332–340. [Google Scholar] [CrossRef]
- Pei, Q.X.; Lu, C.; Fang, F.Z.; Wu, H. Nanometric cutting of copper: A molecular dynamics study. Comput. Mater. Sci. 2006, 37, 434–441. [Google Scholar] [CrossRef]
- Chu, C.Y.; Tan, C.M. Deformation analysis of nanocutting using atomistic model. Int. J. Solids Struct. 2009, 46, 1807–1814. [Google Scholar] [CrossRef] [Green Version]
- Pen, H.M.; Liang, Y.C.; Luo, X.C.; Bai, Q.S.; Goel, S.; Ritchie, J.M. Multiscale simulation of nanometric cutting of single crystal copper and its experimental validation. Comput. Mater. Sci. 2011, 50, 3431–3441. [Google Scholar] [CrossRef] [Green Version]
- Romero, P.A.; Anciaux, G.; Molinari, A.; Molinari, J.F. Friction at the tool-chip interface during orthogonal nanometric machining. Model. Simul. Mater. Sci. Eng. 2012, 20, 055007. [Google Scholar] [CrossRef]
- Zhang, L.; Zhao, H.; Dai, L.; Yang, Y.; Du, X.; Tang, P.; Zhang, L. Molecular dynamics simulation of deformation accumulation in repeated nanometric cutting on single crystal copper. RCS Adv. 2015, 5, 12678. [Google Scholar] [CrossRef]
- Narulkar, R.; Bukkapatnam, S.; Raff, L.M.; Komanduri, R. Graphitization as a precursor to wear of diamond in machining pure iron: A molecular dynamics investigation. Comput. Mater. Sci. 2009, 45, 358–366. [Google Scholar] [CrossRef]
- Gao, Y.; Urbassek, H.M. Evolution of plasticity in nanometric cutting of Fe single crystals. Appl. Surf. Sci. 2014, 317, 6–10. [Google Scholar] [CrossRef]
- Alabd Alhafez, I.; Gao, Y.; Urbassek, H.M. Nanocutting: A comparative molecular-dynamics study of fcc, bcc, and hcp metals. Curr. Nanosci. 2017, 13, 40–47. [Google Scholar] [CrossRef] [Green Version]
- Alabd Alhafez, I.; Urbassek, H.M. Orientation dependence in nanocutting of Fe single crystals: A molecular-dynamics study. Comput. Mater. Sci. 2018, 143, 286–294. [Google Scholar] [CrossRef]
- Avila, K.E.; Küchemann, S.; Alabd Alhafez, I.; Urbassek, H.M. An atomistic study of shear-band formation during cutting of metallic glasses. J. Appl. Phys. 2020, 127, 115101. [Google Scholar] [CrossRef]
- Komanduri, R.; Chandrasekaran, N.; Raff, L.M. Molecular dynamics simulation of the nanometric cutting of silicon. Philos. Mag. B 2001, 81, 1989–2019. [Google Scholar] [CrossRef]
- Han, X.S.; Lin, B.; Yu, S.Y.; Wang, S.X. Investigation of tool geometry in nanometric cutting by molecular dynamics simulation. J. Mater. Process. Tech. 2002, 129, 105–108. [Google Scholar] [CrossRef]
- Fang, F.Z.; Wu, H.; Liu, Y.C. Modelling and experimental investigation on nanometric cutting of monocrystalline silicon. Int. J. Mach. Tool Manu. 2005, 45, 1681–1686. [Google Scholar] [CrossRef]
- Cai, M.B.; Li, X.P.; Rahman, M. Study of the temperature and stress in nanoscale ductile mode cutting of silicon using molecular dynamics simulation. J. Mater. Process. Technol. 2007, 192–193, 607–612. [Google Scholar] [CrossRef]
- Lai, M.; Zhang, X.; Fang, F.; Wang, Y.; Feng, M.; Tian, W. Study on nanometric cutting of germanium by molecular dynamics simulation. Nanoscale Res. Lett. 2013, 8, 13. [Google Scholar] [CrossRef] [Green Version]
- Goel, S.; Stukowski, A.; Luo, X.; Agrawal, A.; Reuben, R.L. Anisotropy of single crystal 3C-SiC during nanometric cutting. Model. Simul. Mater. Sci. Eng. 2013, 21, 065004. [Google Scholar] [CrossRef]
- Goel, S.; Kovalchenko, A.; Stukowski, A.; Cross, G. Influence of microstructure on the cutting behaviour of silicon. Acta Mater. 2016, 105, 464–478. [Google Scholar] [CrossRef] [Green Version]
- Xu, F.; Fang, F.; Zhang, X. Study on surface generation in nano-cutting by large-scale molecular dynamics simulation. Int. J. Adv. Manuf. Technol. 2019, 104, 4325–4329. [Google Scholar] [CrossRef]
- Vardanyan, V.H.; Zhang, Z.; Alabd Alhafez, I.; Urbassek, H.M. Cutting of Al/Si bilayer systems: Molecular dynamics study of twinning, phase transformation, and cracking. Int. J. Adv. Manuf. Technol. 2020, 107, 1297–1307. [Google Scholar] [CrossRef] [Green Version]
- Lai, M.; Zhang, X.D.; Fang, F.Z. Study on critical rake angle in nanometric cutting. Appl. Phys. A 2012, 108, 809–818. [Google Scholar] [CrossRef]
- Hosseini, S.V.; Vahdati, M. Modeling the effect of tool edge radius on contact zone in nanomachining. Comput. Mater. Sci. 2012, 65, 29. [Google Scholar] [CrossRef]
- Xu, F.; Wang, J.; Fang, F.; Zhang, X. A study on the tool edge geometry effect on nano-cutting. Int. J. Adv. Manuf. Technol. 2017, 91, 2787–2797. [Google Scholar] [CrossRef]
- Komanduri, R.; Chandrasekaran, N.; Raff, L.M. Some aspects of machining with negative-rake tools simulating grinding: A molecular dynamics simulation approach. Philos. Mag. B 1999, 79, 955. [Google Scholar] [CrossRef]
- Dai, H.; Du, H.; Chen, J.; Chen, G. Investigation of tool geometry in nanoscale cutting single crystal copper by molecular dynamics simulation. Proc. Inst. Mech. Eng. Part J J. Eng. Tribol. 2019, 233, 1208–1220. [Google Scholar] [CrossRef]
- Mendelev, M.I.; Han, S.; Srolovitz, D.J.; Ackland, G.J.; Sun, D.Y.; Asta, M. Development of new interatomic potentials appropriate for crystalline and liquid iron. Philos. Mag. 2003, 83, 3977–3994. [Google Scholar] [CrossRef]
- Malerba, L.; Marinica, M.C.; Anento, N.; Björkas, C.; Nguyen, H.; Domain, C.; Djurabekova, F.; Olsson, P.; Nordlund, K.; Serra, A.; et al. Comparison of empirical interatomic potentials for iron applied to radiation damage studies. J. Nucl. Mater. 2010, 406, 19–38. [Google Scholar] [CrossRef]
- Gunkelmann, N.; Bringa, E.M.; Kang, K.; Ackland, G.J.; Ruestes, C.J.; Urbassek, H.M. Polycrystalline iron under compression: Plasticity and phase transitions. Phys. Rev. B 2012, 86, 144111. [Google Scholar] [CrossRef]
- Haghighat, S.M.H.; von Pezold, J.; Race, C.P.; Körmann, F.; Friak, M.; Neugebauer, J.; Raabe, D. Influence of the dislocation core on the glide of the 〈111〉{110} edge dislocation in bcc-iron: An embedded atom method study. Comput. Mater. Sci. 2014, 87, 274–282. [Google Scholar] [CrossRef]
- Wagner, R.J.; Ma, L.; Tavazza, F.; Levine, L.E. Dislocation nucleation during nanoindentation of aluminum. J. Appl. Phys. 2008, 104, 114311. [Google Scholar] [CrossRef]
- Banerjee, S.; Naha, S.; Puri, I.K. Molecular simulation of the carbon nanotube growth mode during catalytic synthesis. Appl. Phys. Lett. 2008, 92, 233121. [Google Scholar] [CrossRef] [Green Version]
- Plimpton, S. Fast Parallel Algorithms for Short-Range Molecular Dynamics. J. Comput. Phys. 1995, 117, 1–19. Available online: http://lammps.sandia.gov/ (accessed on 13 May 2020). [CrossRef] [Green Version]
- Stukowski, A.; Bulatov, V.V.; Arsenlis, A. Automated identification and indexing of dislocations in crystal interfaces. Model. Simul. Mater. Sci. Eng. 2012, 20, 085007. [Google Scholar] [CrossRef]
- Stukowski, A. Structure identification methods for atomistic simulations of crystalline materials. Model. Simul. Mater. Sci. Eng. 2012, 20, 045021. [Google Scholar] [CrossRef]
- Stukowski, A.; Arsenlis, A. On the elastic-plastic decomposition of crystal deformation at the atomic scale. Model. Simul. Mater. Sci. Eng. 2012, 20, 035012. [Google Scholar] [CrossRef]
- Stukowski, A. Visualization and analysis of atomistic simulation data with OVITO –the Open Visualization Tool. Model. Simul. Mater. Sci. Eng. 2010, 18, 015012. Available online: http://www.ovito.org/ (accessed on 13 May 2020). [CrossRef]
- Henderson, A. ParaView Guide, A Parallel Visualization Application; Kitware Inc.: Clifton Park, NY, USA, 2007; Available online: http://www.paraview.org (accessed on 13 May 2020).
- Krystof, J.; Schallbroch, H. Grundlagen der Zerspanung; Berichte über betriebswissenschaftliche Arbeiten; VDI-Verlag: Berlin, Germany, 1939; Volume 12. [Google Scholar]
- Klocke, F.; König, W. Fertigungsverfahren, 8th ed.; Drehen, Fräsen, Bohren; Springer: Berlin, Germany, 2008; Volume 1. [Google Scholar]
- Pugh, H.L.D. Mechanics of the cutting process. In Proceedings of the Conference on Technology of Engineering Manufacture; The Institute of Mechanical Engineers: London, UK, 1958; pp. 237–254. [Google Scholar]
- Avila, K.E.; Vardanyan, V.H.; Alabd Alhafez, I.; Zimmermann, M.; Kirsch, B.; Urbassek, H.M. Applicability of cutting theory to nanocutting of metallic glasses: Atomistic simulation. 2020. submitted. [Google Scholar]
Figure 1.
Schematics of the simulation setup showing important quantities characterizing the geometry of the cutting and of the chip. Quantities are defined in the text.
Figure 1.
Schematics of the simulation setup showing important quantities characterizing the geometry of the cutting and of the chip. Quantities are defined in the text.

Figure 2.
Side view of the dislocations generated in the Fe crystal after a cutting length of 100 Å with a cutting tool of rake angle and . On the left-hand side, an atomistic sketch shows a 2D bcc unit cell in the plotted plane that explains the slip directions. Yellow: deformed surface including unidentified defects. Color code for dislocations classified by the Burgers vector : red: ; orange: ; blue: partial with , 6, or 12.

Figure 3.
As in Figure 2, but for a rake angle of and various cutting lengths L.
Figure 3.
As in Figure 2, but for a rake angle of and various cutting lengths L.

Figure 4.
As in Figure 2, but for a rake angle of at the end of the cut, Å.
Figure 4.
As in Figure 2, but for a rake angle of at the end of the cut, Å.

Figure 5.
Side views of the chips formed during cutting.

Figure 6.
Chip thickness, , as a function of the rake angle . Simulation results (squares) are compared to the theoretical prediction, Equation (4). For the negative rake angles, data were also obtained for a cutting length of 200 Å (circles); see Appendix B.
Figure 6.
Chip thickness, , as a function of the rake angle . Simulation results (squares) are compared to the theoretical prediction, Equation (4). For the negative rake angles, data were also obtained for a cutting length of 200 Å (circles); see Appendix B.

Figure 7.
(a) Cutting force, , and (b) thrust force, , as a function of the cutting length L.

Figure 8.
Force angle, , as a function of the rake angle . For the negative rake angles, data were also obtained for a cutting length of 200 Å (circles); see Appendix B.
Figure 8.
Force angle, , as a function of the rake angle . For the negative rake angles, data were also obtained for a cutting length of 200 Å (circles); see Appendix B.


Table 1.
Force and chip characteristics for various rake angles : cutting force, ; thrust force, ; force components perpendicular, N, and parallel, F, to the rake surface of the tool; friction angle, ; and chip thickness, . Force values are averaged over the last 30 Å of cutting. For the negative rake angles, data were also obtained for a cutting length of 200 Å see Appendix B; in the rows marked by (*), averages over the last 100 Å of cutting are presented.
| (N) | (N) | R (N) | N (N) | (Å) | ||
|---|---|---|---|---|---|---|
| 0.41 | 0.12 | 0.37 | 0.21 | 70.3 | ||
| 0.48 | 0.13 | 0.25 | 0.43 | 39.9 | ||
| 0.69 | 0.18 | 0.18 | 0.69 | 38.0 | ||
| 0.99 | 0.48 | 0.06 | 1.10 | 19.6 | ||
| (*) | 1.01 | 0.48 | 0.06 | 1.12 | 20.0 | |
| 0.60 | 0.66 | 0.04 | 0.89 | 0 | ||
| (*) | 0.56 | 0.60 | 0.03 | 0.82 | 0 |
© 2020 by the authors. Licensee MDPI, Basel, Switzerland. This article is an open access article distributed under the terms and conditions of the Creative Commons Attribution (CC BY) license (http://creativecommons.org/licenses/by/4.0/).
Share and Cite
MDPI and ACS Style
Alhafez, I.A.; Urbassek, H.M. Influence of the Rake Angle on Nanocutting of Fe Single Crystals: A Molecular-Dynamics Study. Crystals 2020, 10, 516. https://doi.org/10.3390/cryst10060516
AMA Style
Alhafez IA, Urbassek HM. Influence of the Rake Angle on Nanocutting of Fe Single Crystals: A Molecular-Dynamics Study. Crystals. 2020; 10(6):516. https://doi.org/10.3390/cryst10060516
Chicago/Turabian StyleAlhafez, Iyad Alabd, and Herbert M. Urbassek. 2020. "Influence of the Rake Angle on Nanocutting of Fe Single Crystals: A Molecular-Dynamics Study" Crystals 10, no. 6: 516. https://doi.org/10.3390/cryst10060516
Note that from the first issue of 2016, this journal uses article numbers instead of page numbers. See further details here.