Article

Effect of Continuous Annealing Temperature on the Microstructure, Mechanical Properties and Texture of Annealed Drawn and Ironed Plate

1
Collaborative Innovation Center of Steel Technology, University of Science and Technology Beijing, Beijing 100083, China
2
Beijing Laboratory for Modern Transportation Advanced Metal Materials and Processing Technology, University of Science and Technology Beijing, Beijing 100083, China
3
Technical Center, Shougang Jingtang United Iron and Steel Co., Ltd., Tangshan 063200, China
*
Author to whom correspondence should be addressed.
Crystals 2021, 11(12), 1569; https://doi.org/10.3390/cryst11121569
Submission received: 20 November 2021 / Revised: 9 December 2021 / Accepted: 14 December 2021 / Published: 16 December 2021
(This article belongs to the Special Issue Microstructure Characterization and Design of Alloys)

Abstract

:
To improve the production process and produce high-quality annealed drawn and ironed (DI) plate, continuous annealing experiments were carried out at 620 °C, 640 °C, 680 °C, and 720 °C, and the effect of continuous annealing temperature on the microstructure, mechanical characteristics, and texture of annealed DI plate were clarified. The microstructure was tested with a scanning electron microscope (SEM); the mechanical properties and weighted average of the plastic strain ratio ( r ¯ ) were measured using a tension test; and the texture characterizations were tested by X-ray powder diffractometer (XRD) and electron backscatter diffraction (EBSD). The results reveal that, with the increase of the annealing temperature, the average grain size grew from 5.14 μm to 6.56 μm, the yield strength and tensile strength decreased, and the elongation increased. The rolling textures drastically reduced after annealing. When annealed at a lower temperature of 620 °C, the texture content of {111} <110> was the highest. When the annealing temperature increased to 640 °C, 680 °C and 720 °C, the texture content of {111} <112> was higher than that of {111} <110>. The mechanical properties of the DI plate that was annealed at 640 °C are the best, with a higher r ¯ value and a lower planar anisotropy value.

Graphical Abstract

1. Introduction

The DI plate is regarded as one of the three finest carbon steel sheets and is one of the most technically complex high-end tinplate products. DI plate is primarily used in the production of high-quality food packaging for food and beverage cans, and it has high compressive strength and is easy to recycle. The packaging can has experienced a boost in recent years. In order to improve the competitiveness of the products, users have higher requirements for thinner thickness, higher hardness, greater strength, and good deep drawability [1]. On the basis of achieving the required thickness and mechanical properties, the texture component is a crucial indicator, as it affects the drawing performance and ear formation [2]. Ear formation will significantly impair the output, resulting in resource loss and higher costs. As a deep drawing sheet, the DI plate needs a higher r ¯ value and a smaller planar anisotropy value (∆r), because the larger the r ¯ value, the greater the sheet’s ability to resist instability and thinning, and the more advantageous it has for stamping. At the same time, the larger |Δr| value will produce larger ears.
Many researchers focused on the effects of secondary cold reduction rates on the tinplate’s microstructure and texture characteristics, but there have been few investigations on the effect of the continuous annealing temperature [3,4,5]. It is worth noting that the quality of the annealed DI plate will have a significant impact on the performance of the finished DI plate after tinning. The continuous annealing temperature will significantly affect the component of the recrystallized texture, which in turn affects the deep drawability of the sheet [6]. Therefore, the present study was carried out to investigate the microstructure, mechanical properties, r ¯ value and texture characteristics of an annealed DI plate with different annealing temperatures. A DI plate with outstanding performance is obtained by adjusting the parameters of the annealing temperature. The work provides a theoretical basis for the industrial production of the DI plate.

2. Materials and Methods

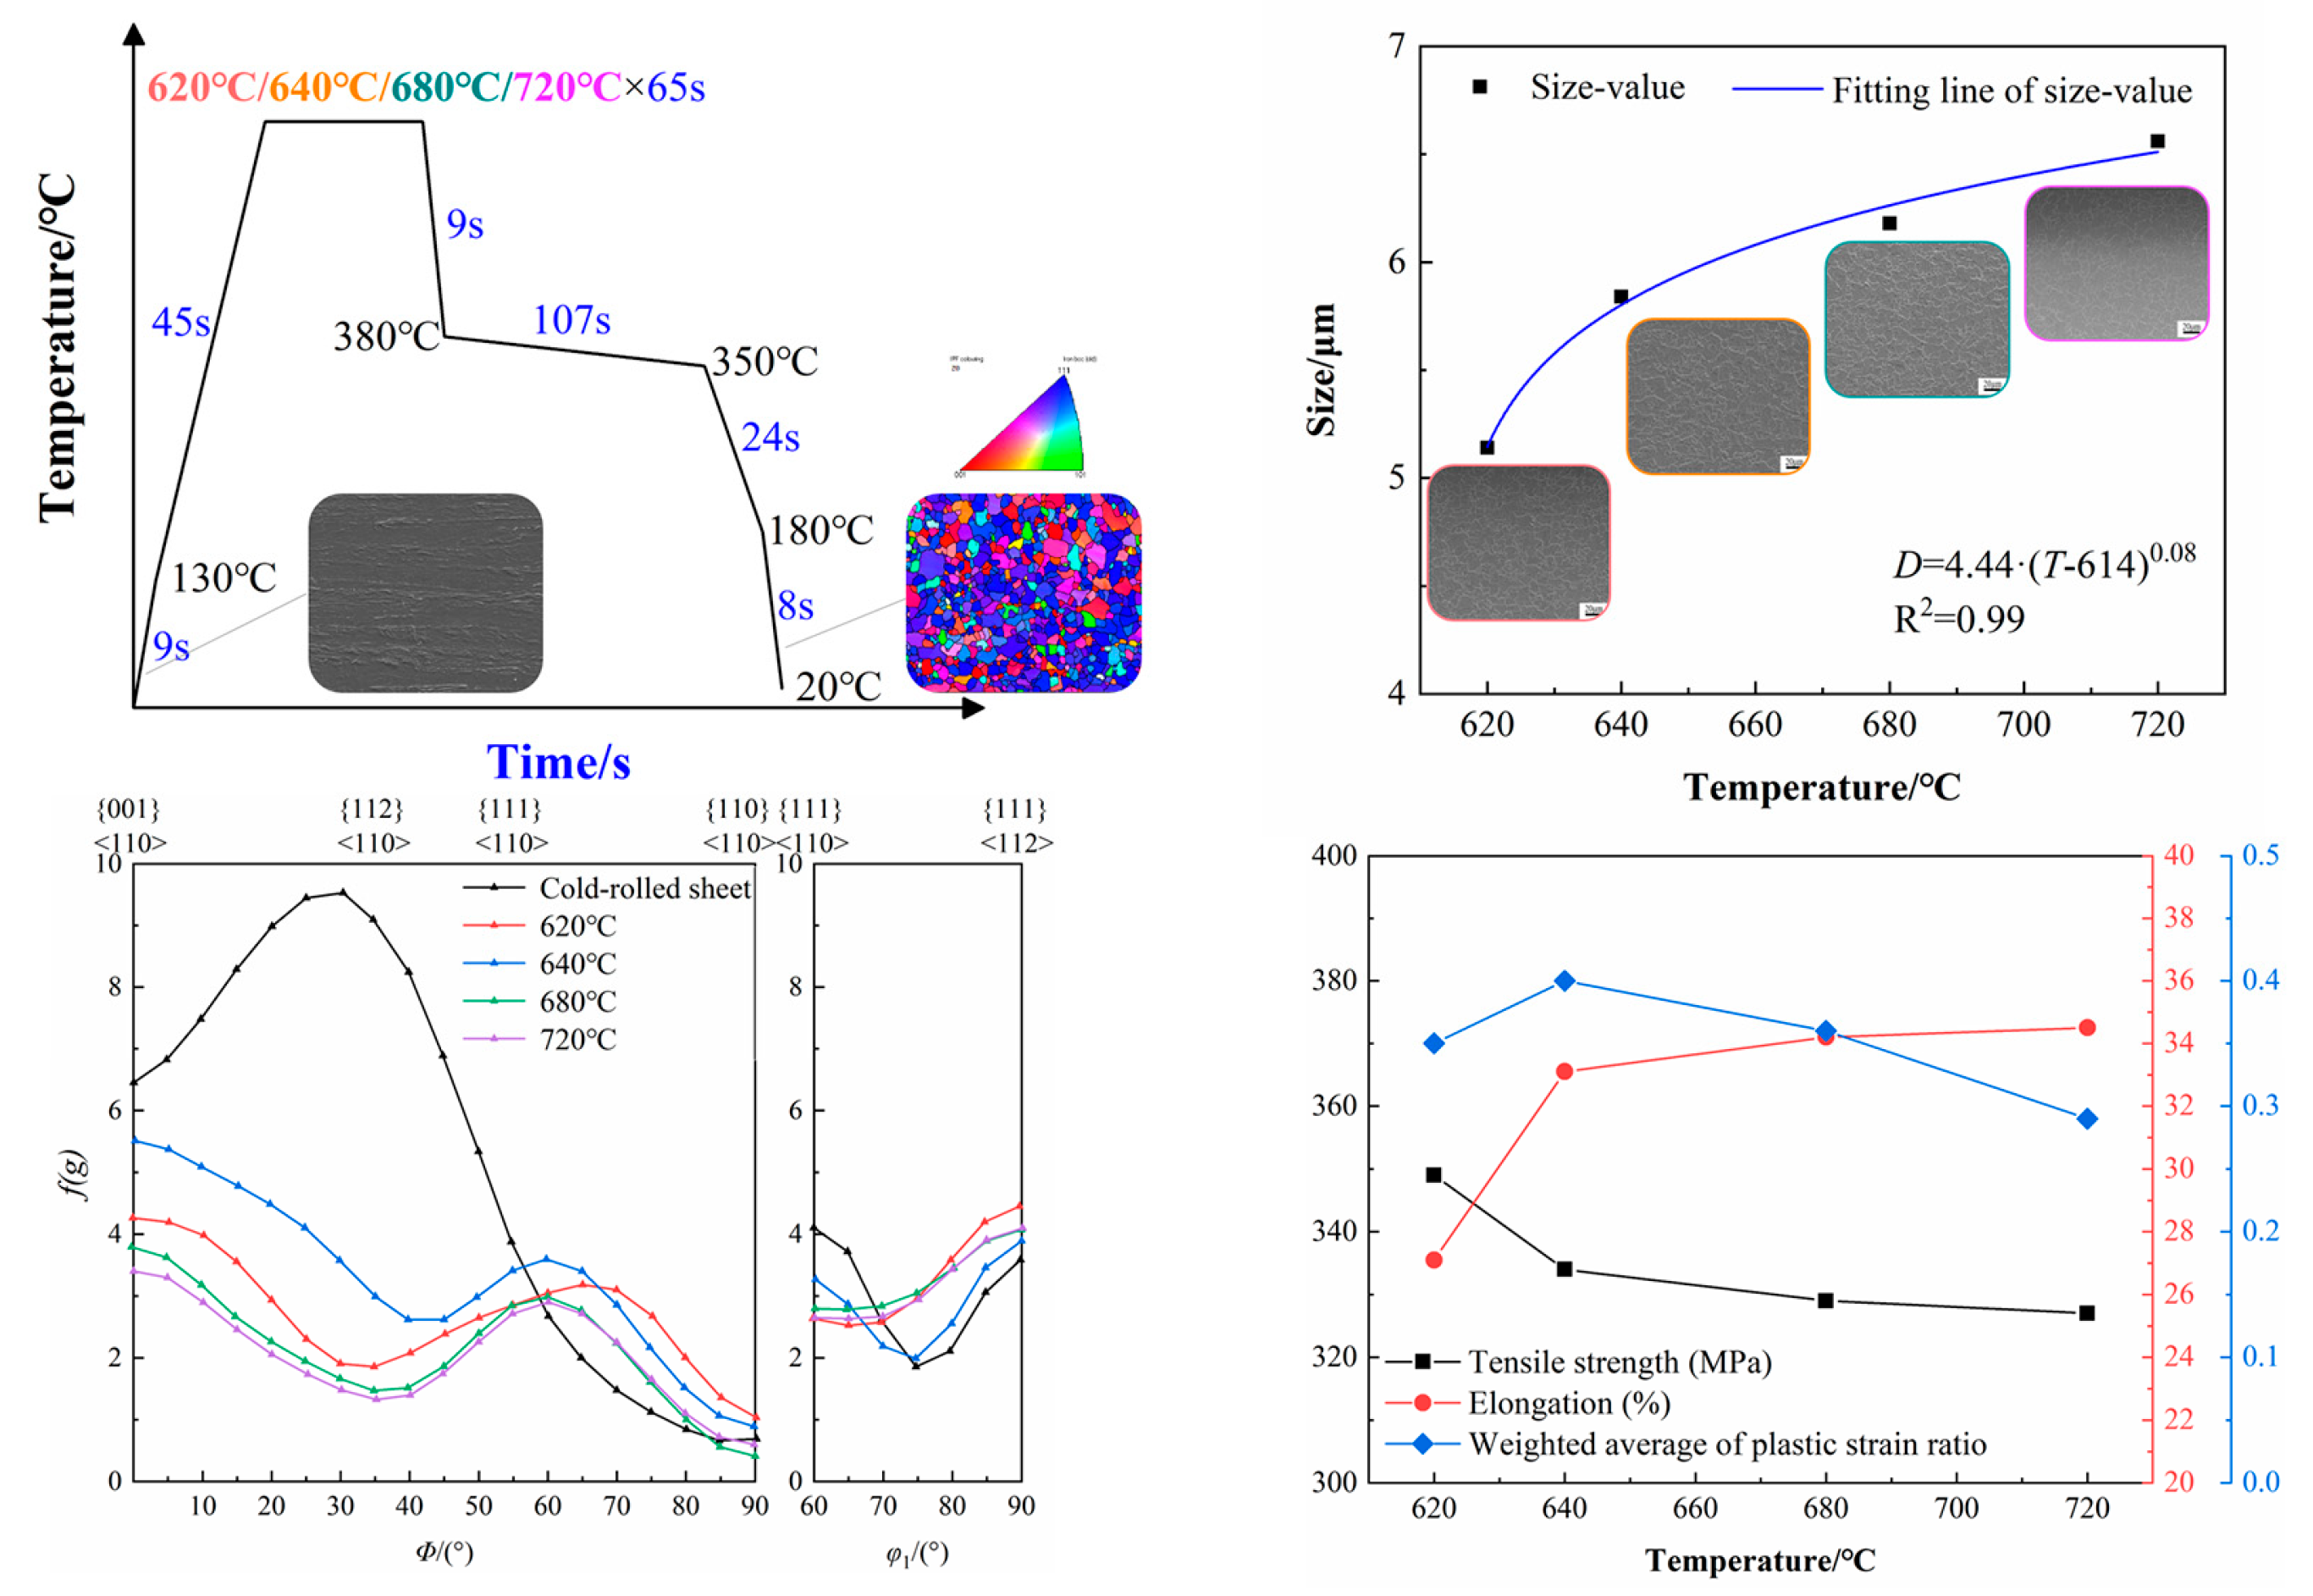
2.1. Materials and Heat Treatment

The chemical compositions of the tested steel are shown in Table 1. The tested steels were cold-rolled to 0.30 mm and were produced by a commercial steel company, with a 90.1% reduction rate. Specimens of 0.30 mm × 50 mm × 220 mm were cut from a cold-rolled strip along the directions of 0°, 45° and 90° to rolling direction, respectively, by wire-cut. Heat treatments were performed on the continuous annealing simulator (CCT-AY-II produced by Ulvac-Riko INC, Tokyo, Japan). Figure 1 depicts the continuous annealing process route. The cold-rolled steels were annealed at 620 °C, 640 °C, 680 °C and 720 °C for 65 s, followed by rapidly cooling to 380 °C. The tested steels were then over-aged between 380 °C and 350 °C and were finally cooled to room temperature.

2.2. Microstructure and Mechanical Properties Characterization

The 5 mm × 10 mm samples, cut from the continuous annealing sample, were ground, polished and etched with 4% nitric acid. Microstructures of tested steels under different processes were observed by SEM (ZEISS Gemini SEM 500, Oberkochen, Germany). Texture characterizations were tested by EBSD and XRD. EBSD measurements were carried out using a scanning electron microscope (20 kV, step size: 0.25 μm) after electrolytic polishing in an electrolyte solution at room temperature (10 vol.% perchloric acid and 90 vol.% ethanol). HKL CHANNEL5 flamenco software was used to process the EBSD data. In addition, XRD experiments were performed using a Bruker (Karlsruhe, Germany) type D8-Advance diffractometer. According to the standard GB 228, A50 tensile specimens were cut from the continuous annealing specimens. Tensile tests at room temperature were performed on the tensile testing machine at a tensile speed of 2 mm/min. Three samples were tested in the same direction on the same annealed sheet, and the average results were reported. The plastic strain ratio (r) in each direction, the Δr value and r ¯ value were measured in accordance with GB/T 5027 and they were determined in the Equations (1)–(3).
r = ln ( b 0 b ) ln ( L 0 b 0 L b )
Δr = (r0 + r90 − 2r45)/2
r = (r0 + r90 + 2r45)/4
where, L0 and b0 are the original gauge length and width, and L and b are the gauge length and width when the strain is 10~15%. The r0, r45 and r90 represent the r values in three directions of 0°, 45° and 90°.

3. Results and Discussion

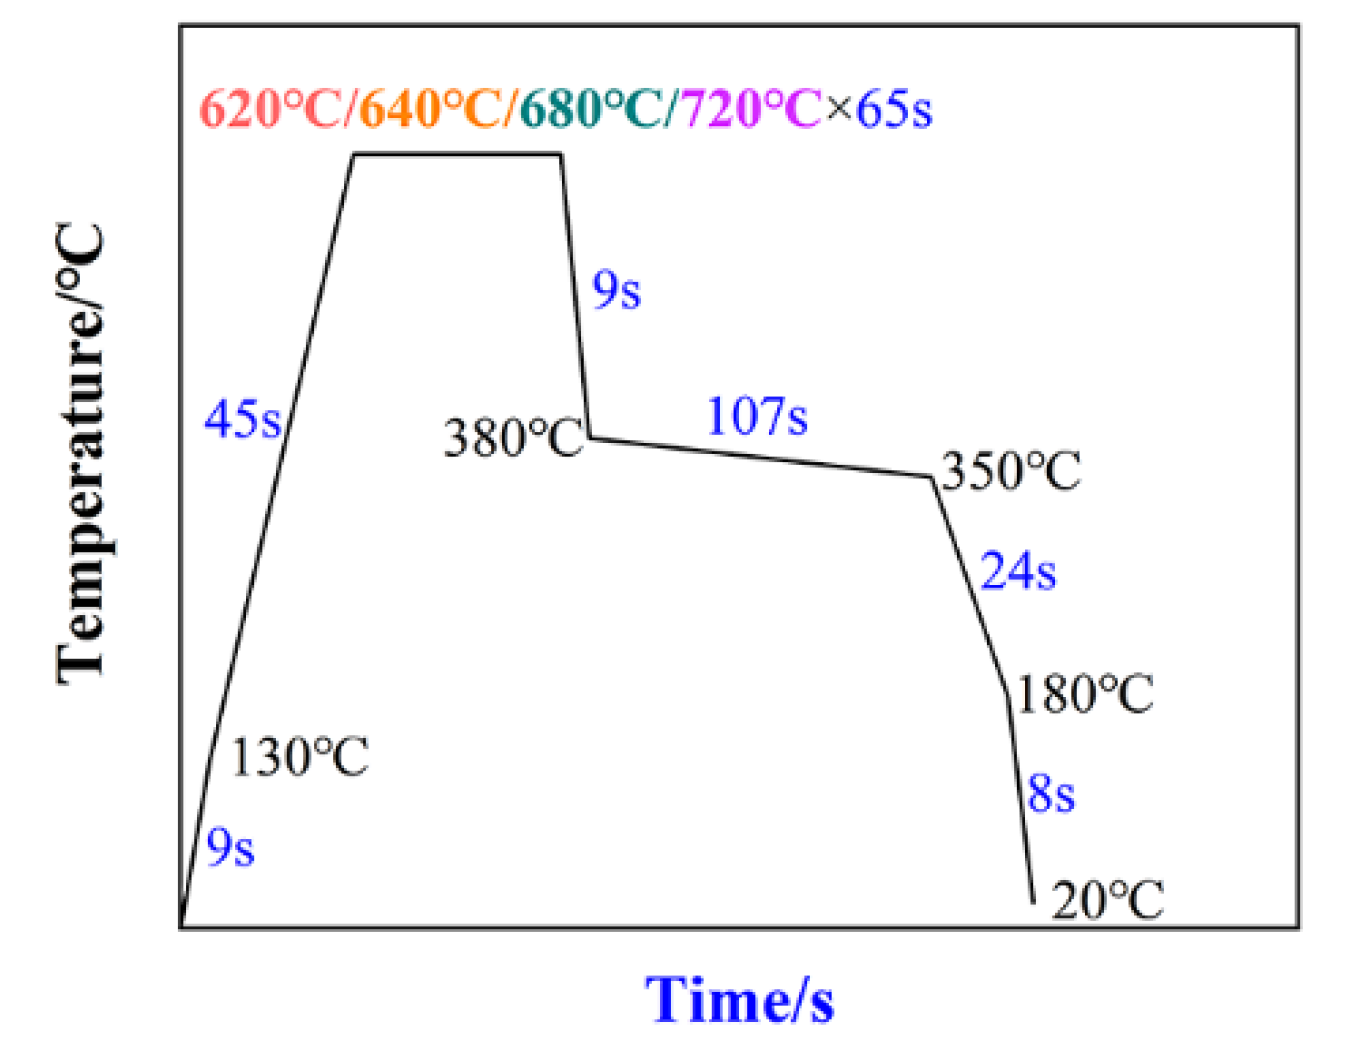
3.1. Microstructure Analysis

The microstructures of the cold-rolled sheet (CR) and the annealed samples treated by varied continuous annealing temperatures are shown in Figure 2. Cold-rolled sheets present elongated fibers along the rolling direction. The microstructures of the annealed samples are ferrite, which have undergone recrystallization but are still elongated along the rolling direction. The degree of recrystallization increases and the fraction of equiaxed grains rises as the annealing temperature rises. Around the recrystallized samples, fine sub-grains are formed mostly during the high temperature recovery process. With the increment of annealing temperature, the sub-grains merged to form recrystallized grains.
The grain size distribution of the samples at different annealing temperatures was measured by EBSD, as shown in Figure 3. As the annealing temperature rises from 620 °C to 720 °C, the average grain size increases from 5.14 μm to 6.56 μm, and the relative frequency of the large-size grains becomes higher, suggesting that the grains grow with the increment of annealing temperature. Based on this interesting phenomenon, we fitted a power function to establish a mathematical model of the relationship between the average grain size (D) and the annealing temperature (T). When the annealing temperature is higher than 620 °C, the formula is expressed as D = 4.44·(T − 614)0.08. When it reaches a lower temperature, the size of the recrystallized grains increases greatly with the increase of the annealing temperature. However, as the annealing temperature further increases, the size of the recrystallized grains tends to grow gently. This model can be used to revise the recrystallized grain size of the annealed DI plate.
The stored energy and grain boundary mobility are the internal factors which lead to recrystallization behavior and grain growth [7]. The larger reduction ratio cold-rolled sheet has larger stored energy, which acts as the driving force for recrystallization. The grain boundary’s mobility increases as the temperature elevates. The recrystallized grains’ size is proportional to the ratio of the growth rate ( G ) to the nucleation rate ( N ), and their variation of activation energy is similar with the increase of temperature. As a result, the annealing temperature has little impact on G / N [8]. The higher the annealing temperature, the faster the recrystallization rate and the grain boundary mobility, the sooner it enters the grain growth stage, and the larger the recrystallized grain size as the stored energy and annealing time are identical. Figure 2 shows that there is no deformed fibrous structure in the annealed samples after soaking for 65 s at various annealing temperatures, and the grain size is uneven. The volume fraction of equiaxed grains progressively increases as the annealing temperature rises, indicating that grain equiaxation and grain growth behavior are incomplete. The annealing temperature is lower, the recrystallization rate is slower and there are majorities of small-sized grains in the samples. The small-sized grains gradually grow up with the increase of the annealing temperature, and the average grain size changes greatly. By contrast, when the annealing temperature is higher, the recrystallization rate is quicker and the content of small-sized grains is lower. Meanwhile, the degree of grain size homogeneity is higher and the average grain size changes are smaller. Therefore, the increase in the recrystallized grain size steadily diminishes with the increase of the annealing temperature during a shorter annealing time.

3.2. Mechanical Properties

Table 2 demonstrates the mechanical properties of samples annealed at various temperatures in three directions (0°, 45°, and 90°). The yield strength declines from 321 MPa to 307 MPa as the annealing temperature rises from 620 °C to 720 °C, the tensile strength declines from 351 MPa to 327 MPa, and the elongation increases from 22.3% to 38.8% (perpendicular to the rolling direction). The cold-rolled sheet has a higher dislocation density and residual stress. The cold-rolled sheet is recrystallized after annealing, and the grain size gradually increases. Defects, such as dislocations are greatly reduced and the pinning effect of dislocations weakens, leading to the hardness and residual stress reductions [9]. As a result, increasing the annealing temperature lowers the yield strength and tensile strength, while increasing elongation. It can be seen that the r ¯ value first increases and then decreases with the increase of the annealing temperature. When the annealing temperature is 640 °C, the r ¯ value reaches the maximum, the |Δr| value is smaller, and the mechanical properties are better.

3.3. Texture Analysis

XRD was used to examine the textures of a cold-rolled sheet and the annealed samples. The texture intensity along the α and γ orientation lines is computed using the orientation distribution function (ODF) (Figure 4 and Figure 5). The texture intensity along the α orientation line of the cold-rolled sheet is relatively high. A peak value appears between the {001} <110> and the {112} <110> rolling textures, of which the maximum intensity is 9–10. Along the γ orientation line, the {111} <112> texture is less than the {111} <110> texture intensity. The {001} <110> and {112} <110> textures along the α orientation line of the annealed samples are weakened, whereas the {111} <110> textures are significantly enhanced. The peak gradually moves closer to the {111} <110> texture with Euler angles (0°, 45°, 55°) and gets sharper, and the spreading width decreases as the annealing temperature rises. The intensity of the {111} <110> texture is the highest when the temperature reaches 640 °C. The {111} <112> texture intensity along the γ orientation line of the annealed samples are higher than that of the cold-rolled sheet. The enhancement in drawability is boosted by an increase in the intensity of the {111} texture [10].
In order to further analyze the texture distribution, EBSD is used, as demonstrated in Figure 6 and Table 3. The divergence angle is 15°. The texture with the largest volume fraction in the cold-rolled sheet is {112} <110>, which is as high as 46.8%. When annealed at a lower temperature of 620 °C, the texture content of {111} <112> and {111} <110> increases significantly, and the texture content of {111} <110> is the largest. When the annealing temperature increases to 640 °C, 680 °C, and 720 °C, the texture content of {111} <112> is higher than that of {111} <110>. When the annealing temperature attains 720 °C, the {111} <112> is changed into the {001} <110>, {001} <001> and {112} <110> orientations. Varying cold-rolled textures have different stored energies for recrystallization. The texture is external factor which intensity determines whether the recrystallization grain growth appears [11,12]. The greater the cold-rolled texture’s stored energy, the greater the driving force for recrystallization, and the easier it is for the texture to nucleate first. The order of deformation stored energy of the cold-rolled texture components is as follows [13,14]:
E{110} <001> < E{001} <110> < E{112} <UVW> < E{111} <110> < E{111} <112> < E{110} <110>
During the annealing process of the cold-rolled steel sheet, the {111} texture with higher deformation stored energy preferentially forms new {111} recrystallized grains [15,16,17]. It then grows and develops into γ fibers by consuming the {111} deformed grains. At the same time, α fibers with a lower deformation storage energy are more difficult to recrystallize and they tend to be easily swallowed and consumed by the {111} recrystallized grains. As a result, the rolling texture component diminishes and the {111} texture gradually rises during the recrystallization process. When the annealing temperature is higher, the {111} <112> texture is stronger than the {111} <110> texture. This conclusion is consistent with the findings of Nagataki and Yang’s research [18,19]. Although the {111} <110> texture nucleation occurs sooner than the {111} <112> texture, the {111} <112> grains have the highest nucleation rate [20]. The strong {111} <110> texture is produced by preferred nucleation, while the {111} <112> texture is formed by preferential growth. Therefore, the {111} <112> are often more than {111} <110> in annealed steels with a higher cold-rolled reduction rate.
The texture component has a significant influence on the deep drawing performance of DI plate, and each texture has a varied effect on the deep drawing performance. Table 4 shows the r ¯ and ∆r for main texture components [13,21]. According to Table 4, the {111} <110> and {111} <112> texture are favorable texture for improving the deep drawing performance of the DI plate. The {111} <110> texture will cause ears in 30° and 90° directions, whereas the {111} <112> texture will cause ears in the 0° and 60° directions. As a result, two textures with the same fraction will greatly reduce the rate of punching ears. With increasing annealing temperature, the value of {111}/{100} increases first and then decreases, reaching the maximum value of 7.0 at 640 °C. The r ¯ value is consistent with the change trend of the {111}/{100} value, which is consistent with other studies [13,22]. The DI plate annealed at 640 °C has a higher r ¯ value and a lower |∆r| value. In conclusion, the DI plate annealed at 640 °C should best match the performance criteria in the factory, which has guiding importance for actual DI plate manufacturing and application.

4. Conclusions

The annealed DI plate with different continuous annealing temperatures of 620 °C, 640 °C, 680 °C and 720 °C was studied, and a detailed analysis of the microstructural characterization, mechanical properties, the r ¯ value, |∆r| value and texture characteristics was carried out using SEM, XRD, EBSD and a tension test. The following conclusions were presented:
(1)
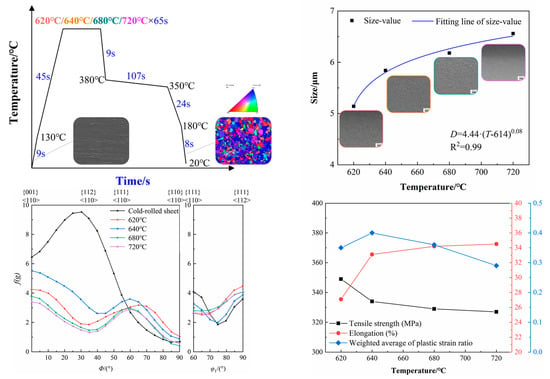
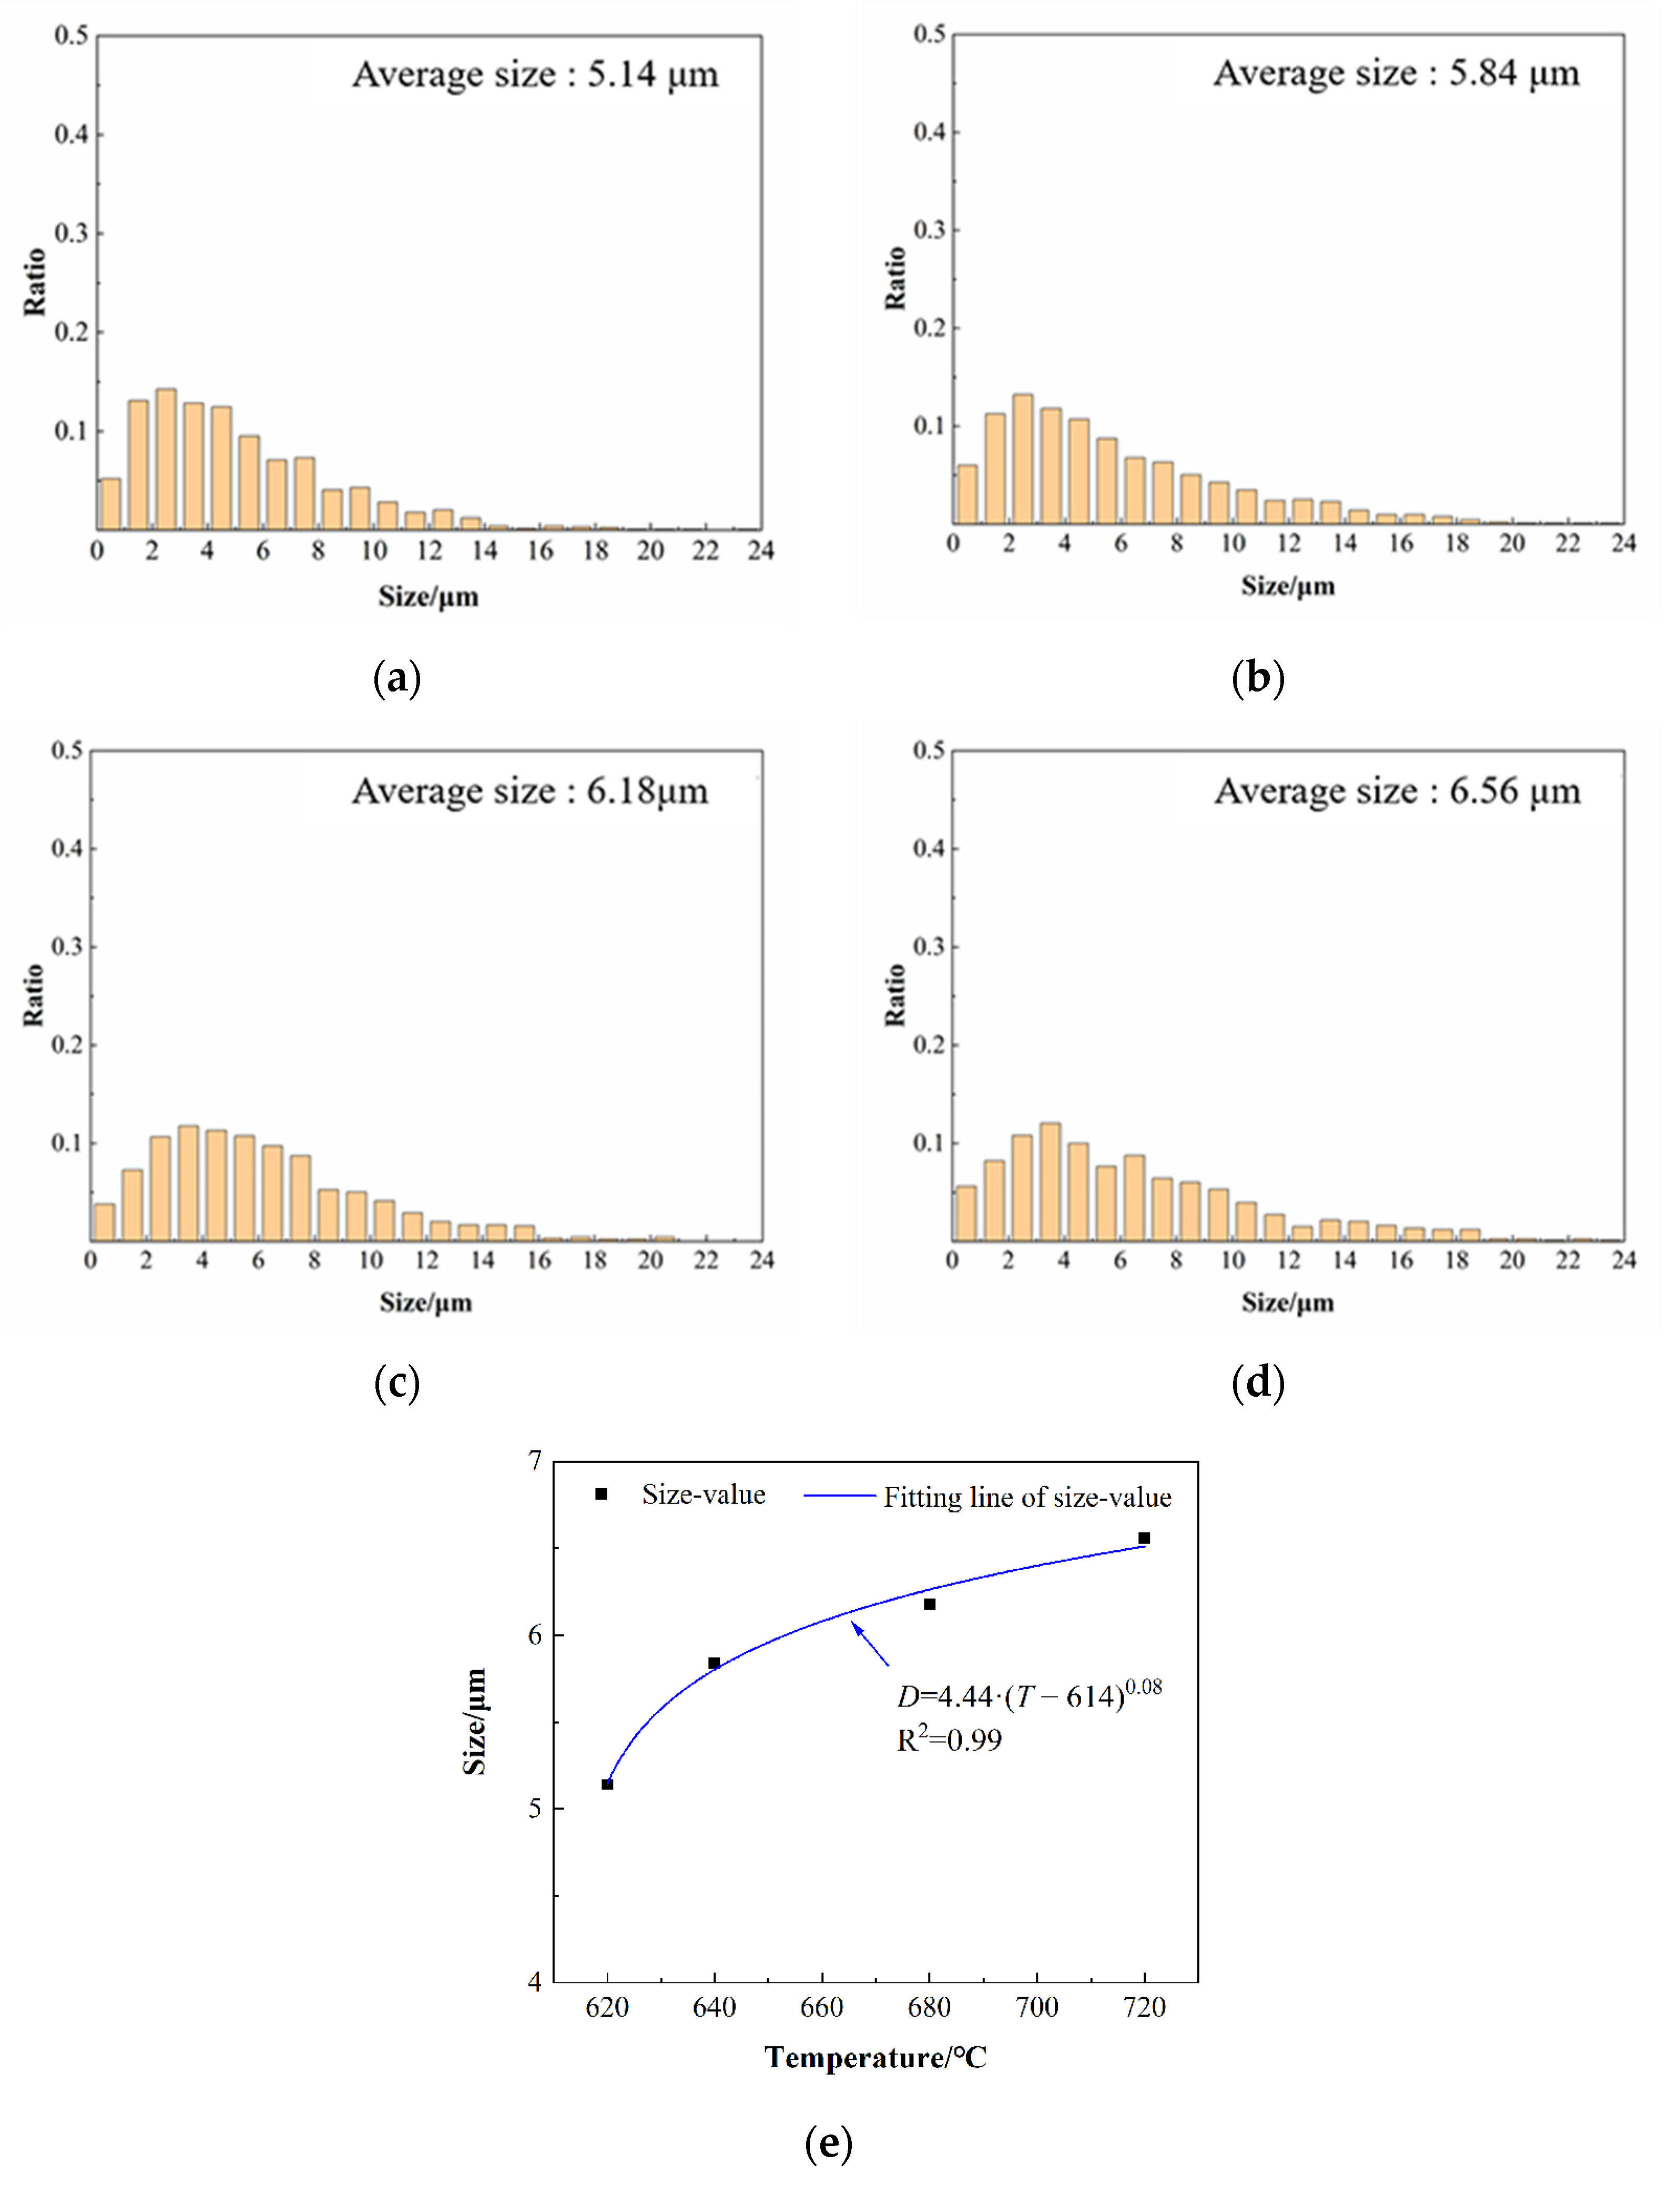
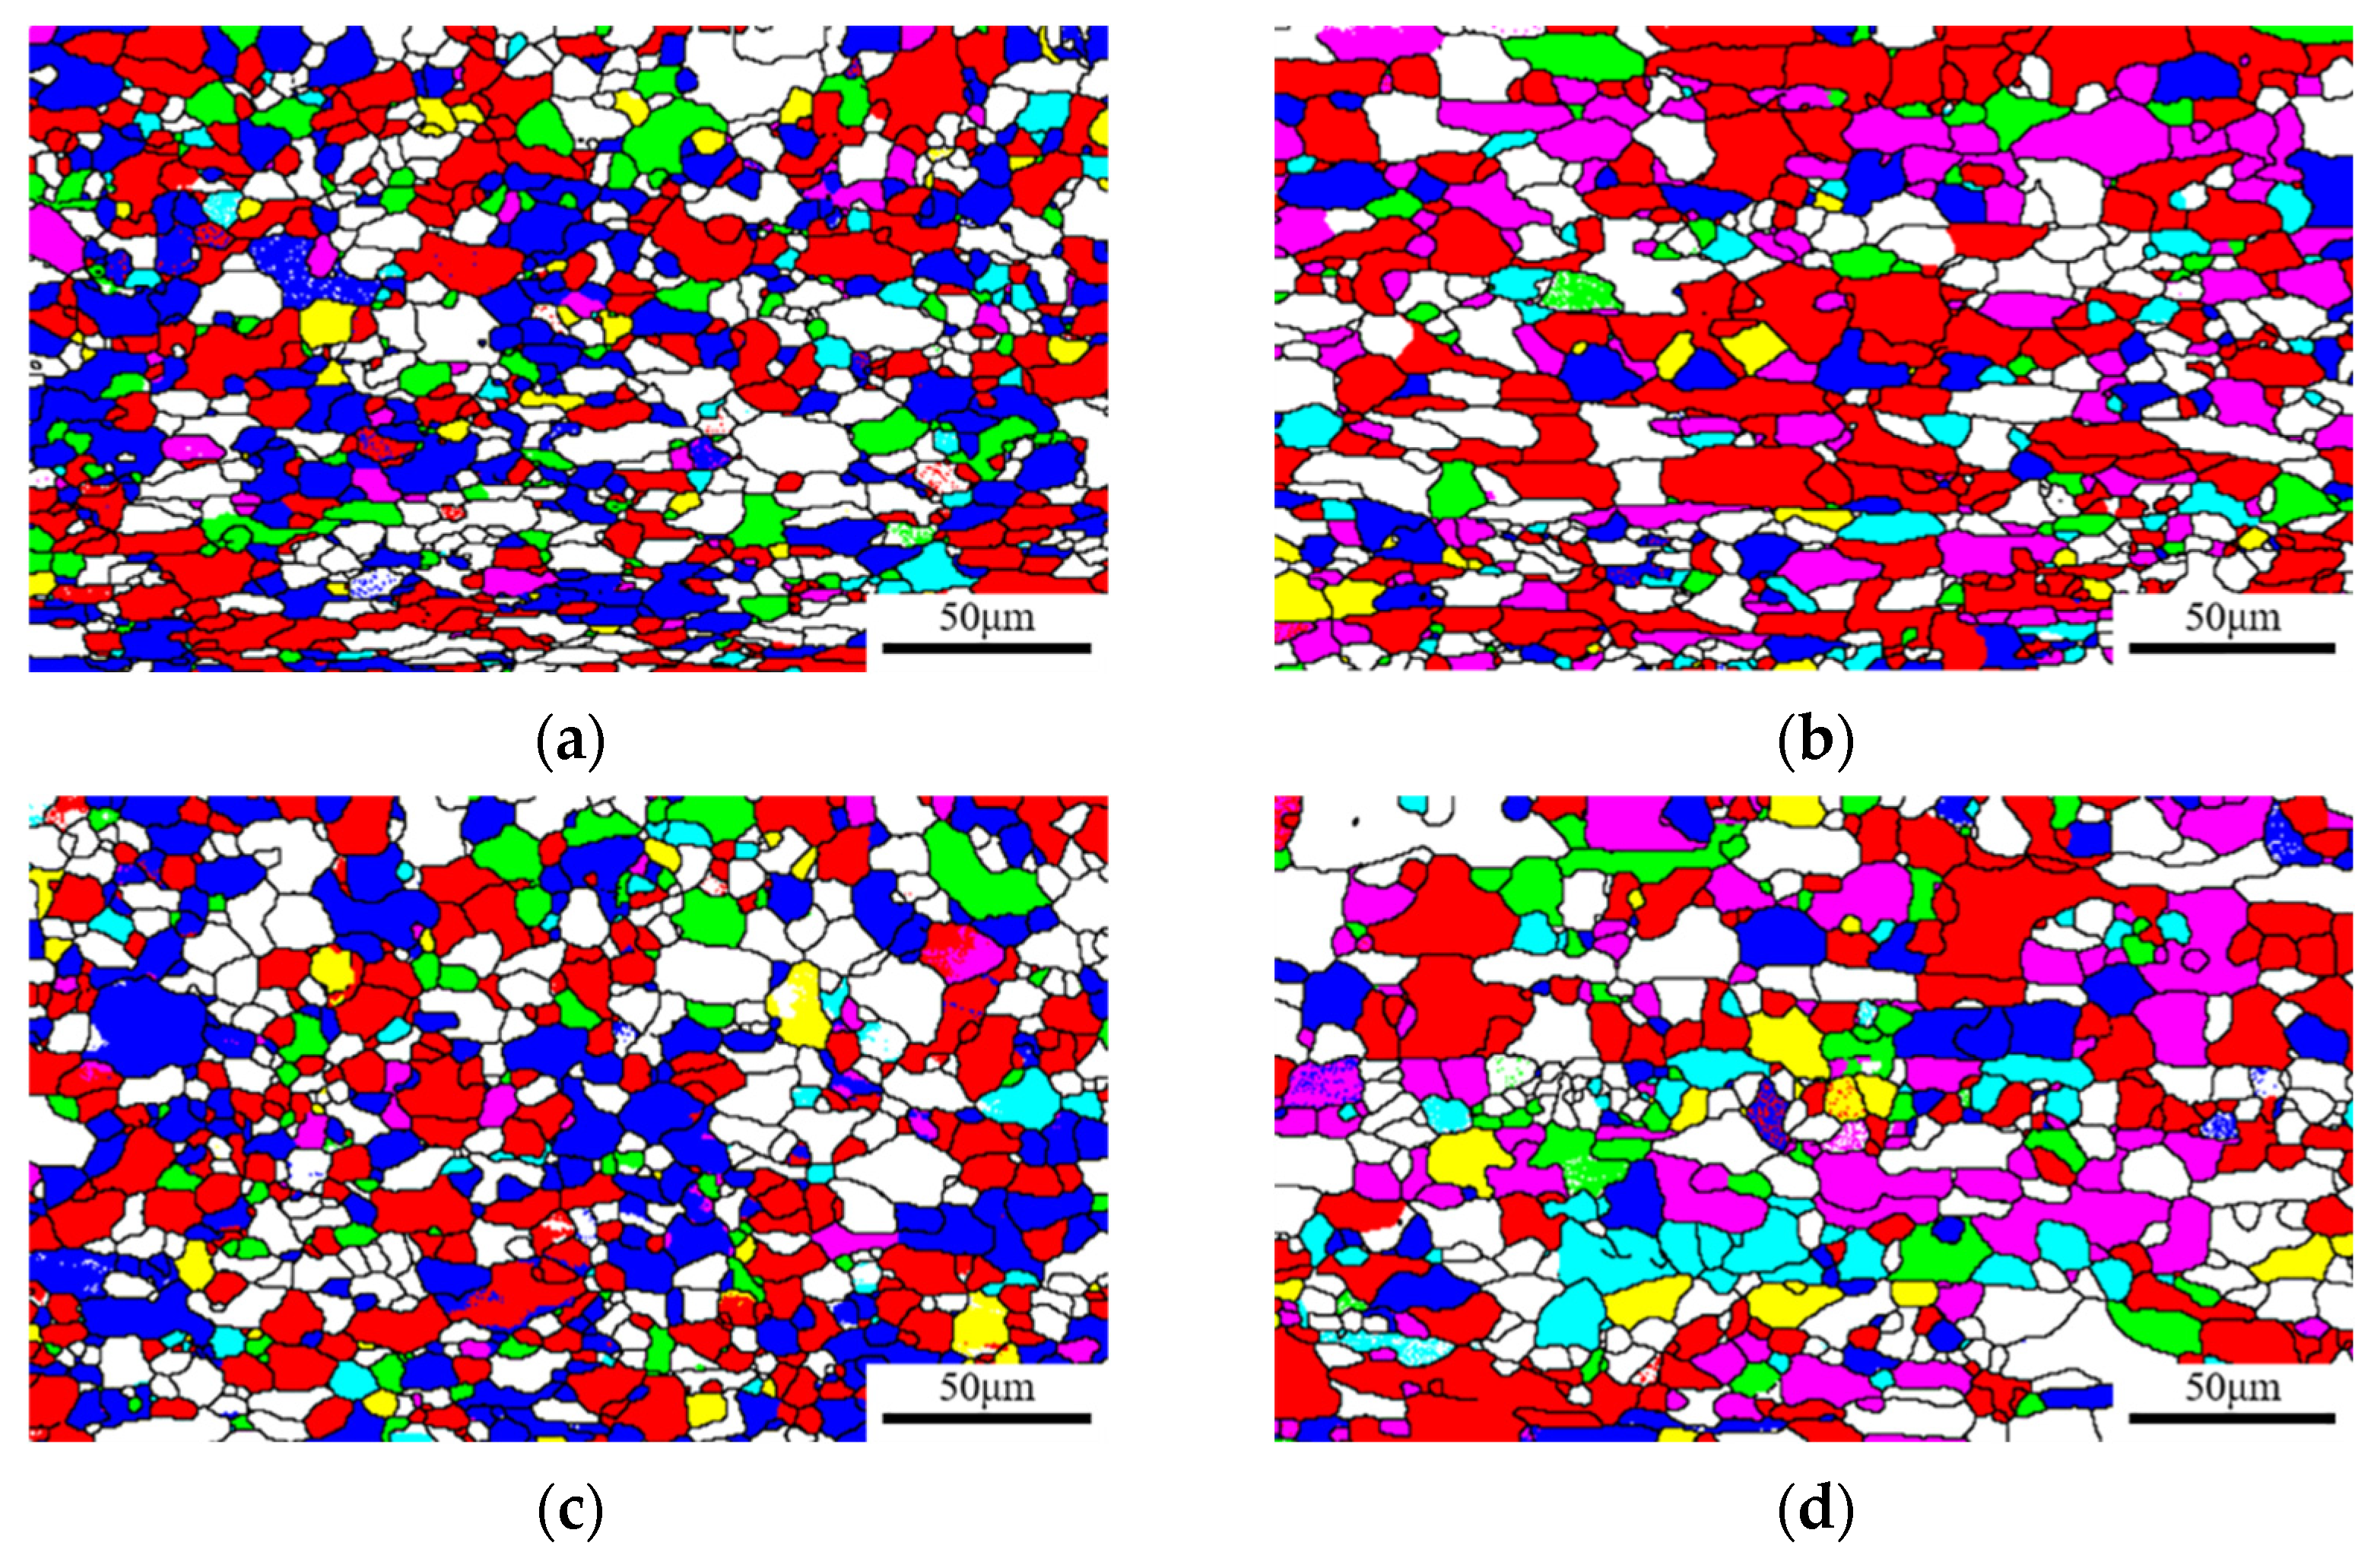
With the increase of the annealing temperature, the degree of recrystallization increased, the proportion of equiaxed grains improved and the average grain size grew from 5.14 μm to 6.56 μm. The formula D = 4.44·(T − 614)0.08 is used to establish the link between the average recrystallization grain size and the annealing temperature. It shows that the increase in recrystallized grain size steadily diminishes with the increase of the annealing temperature during a shorter annealing time.
(2)
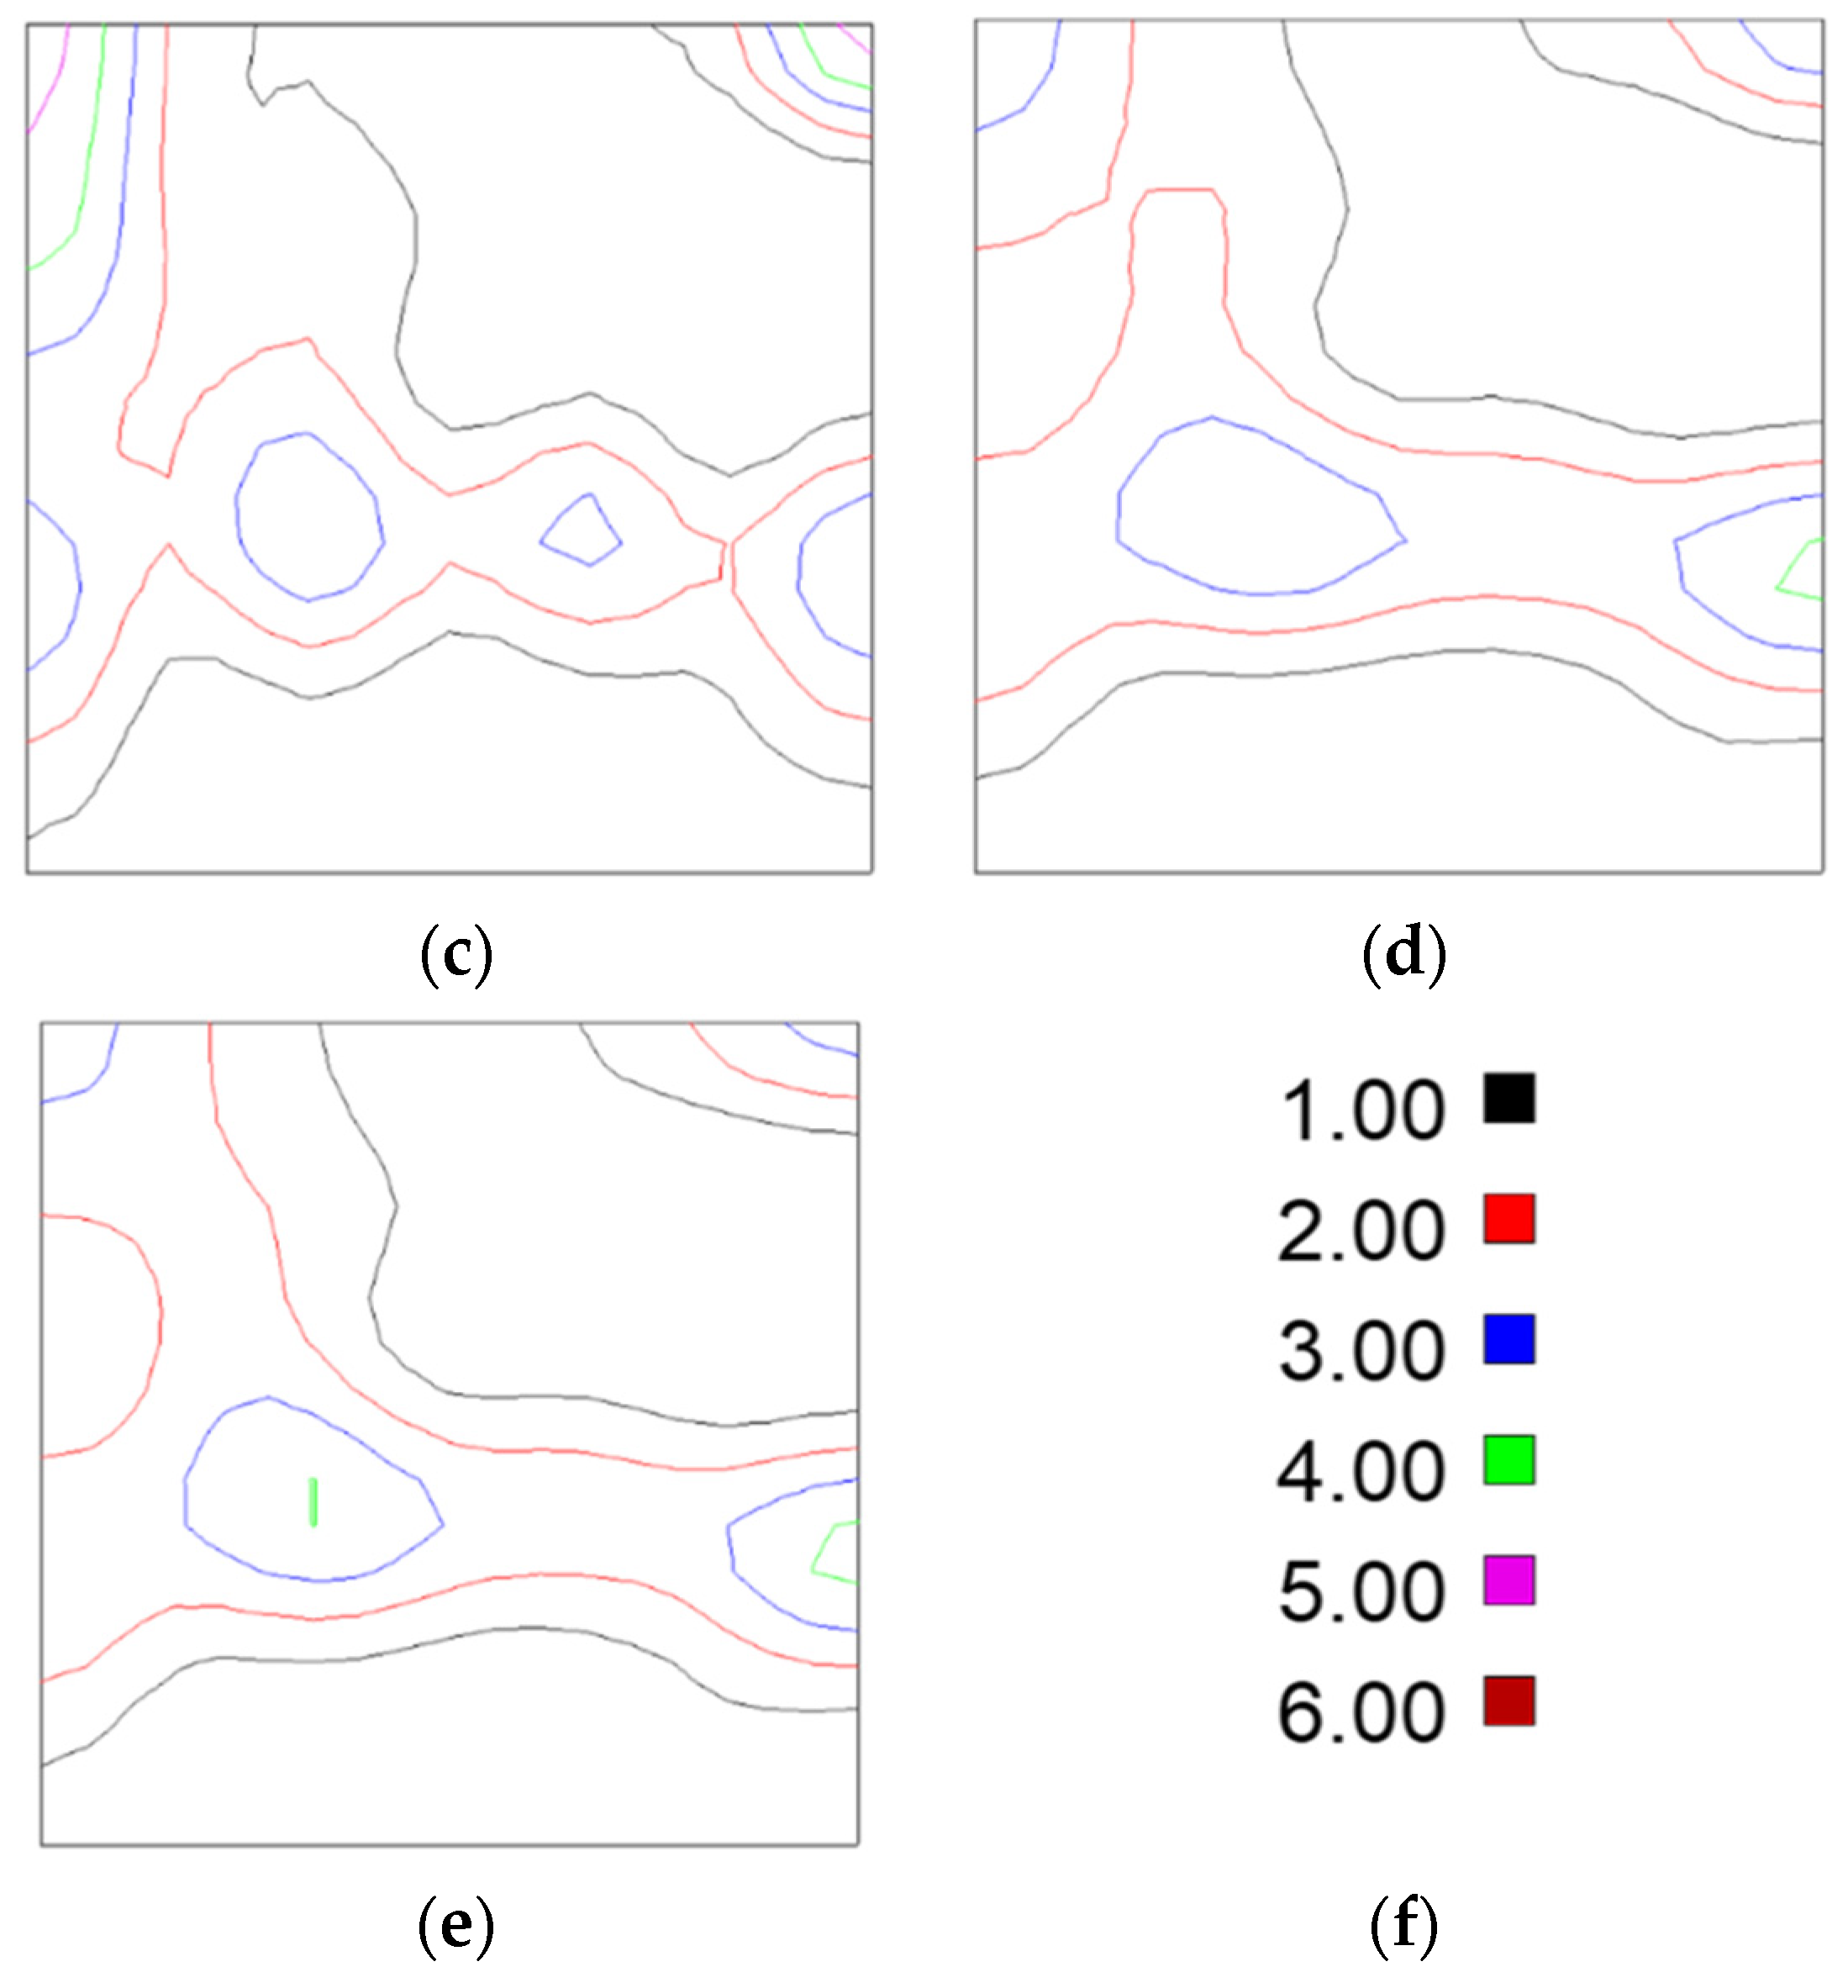
After annealing, the rolling textures greatly diminished, while the {111} textures significantly increased. The texture content of {111} <110> was the highest when annealed at a lower temperature of 620 °C. The texture content of {111} <112> was higher than that of {111} <110> when the annealing temperature increased to 640 °C, 680 °C and 720 °C.
(3)
When the annealing temperature rose from 620–720 °C, the yield strength and tensile strength decreased, the elongation increased, and the r ¯ value first increased and then decreased. The DI plate annealed at 640 °C possesses a higher r ¯ value and a lower |∆r| value, and its mechanical properties are the best, which will have guiding significance for the industrial production of the DI plate.

Author Contributions

Conceptualization, Z.M. and Z.Z.; methodology, Z.M. and H.C.; validation, Y.F. and P.G.; formal analysis, Z.M. and X.C.; investigation, Y.F.; writing—original draft preparation, Z.M.; writing—review and editing, X.C. and H.L.; visualization, X.Y.; supervision, D.Y.; project administration, Z.Z. All authors have read and agreed to the published version of the manuscript.

Funding

This research received no external funding.

Conflicts of Interest

The authors declare no conflict of interest.

References

  1. Dey, S.; Agrawal, D.M.K. Tinplate as a Sustainable Packaging Material: Recent Innovation and Developments to Remain Environment Friendly and Cost Effective. Int. J. Res. IT Manag. Eng. 2016, 8, 9–22. [Google Scholar]
  2. Hutchinson, W.B. Development and control of annealing textures in low-carbon steels. Int. Met. Rev. 1984, 29, 25–42. [Google Scholar] [CrossRef]
  3. Tian, P.; Liao, L.; Zhu, G.; Kang, Y. Effect of Secondary Cold Reduction Rates on Microstructure, Texture and Earing Behavior of Double Reduction Tinplate. Materials 2021, 14, 4040. [Google Scholar] [CrossRef]
  4. Liao, L.; Zheng, X.; Kang, Y.; Liu, W.; Yan, Y.; Mo, Z. Crystallographic texture and earing behavior analysis for different second cold reductions of double-reduction tinplate. Int. J. Miner. Metall. Mater. 2018, 25, 652–662. [Google Scholar] [CrossRef]
  5. Černík, M.; Gburík, R.; Hrabčáková, L.; Vranec, P. Texture analysis of tinplate steel and its application in production of double reduced high strength tinplate grades with controlled earing properties. IOP Conf. Ser. Mater. Sci. Eng. 2015, 82, 012108. [Google Scholar] [CrossRef] [Green Version]
  6. Saiji, M.; Kei, S.; Susumu, S.; Toshiyuki, K. Effect of hot-rolling strain rate in the ferrite region on the recrystallization texture of extra-low c sheet steels. ISIJ Int. 1994, 34, 77–84. [Google Scholar]
  7. Cai, G.; Li, C.; Wang, D.; Zhou, Y. Investigation of annealing temperature on microstructure and texture of Fe-19Cr-2Mo-Nb-Ti ferritic stainless steel. Mater. Charact. 2018, 141, 169–176. [Google Scholar] [CrossRef]
  8. Burke, J.E.; Turnbull, D. Recrystallization and Grain Growth. Prog. Met. Phys. 1952, 3, 220–292. [Google Scholar] [CrossRef]
  9. Shin, D.H.; Kim, B.C.; Park, K.-T.; Choo, W.Y. Microstructural changes in equal channel angular pressed low carbon steel by static annealing. Acta Mater. 2000, 48, 3245–3252. [Google Scholar] [CrossRef]
  10. Yazawa, Y. Development of ferritic stainless steel sheets with excellent deep drawability by {111} recrystallization texture control. JSAE Rev. 2003, 24, 483–488. [Google Scholar] [CrossRef]
  11. Wauthier-Monnin, A.; Chauveau, T.; Castelnau, O.; Réglé, H.; Bacroix, B. The evolution with strain of the stored energy in different texture components of cold-rolled IF steel revealed by high resolution X-ray diffraction. Mater. Charact. 2015, 104, 31–41. [Google Scholar] [CrossRef]
  12. Bernier, N.; Leunis, E.; Furtado, C.; Van De Putte, T.; Ban, G. EBSD study of angular deviations from the Goss component in grain-oriented electrical steels. Micron 2013, 54, 43–51. [Google Scholar] [CrossRef]
  13. Ray, R.K.; Jonas, J.J.; Hook, R.E. Cold rolling and annealing textures i~ low carbon and extra low carbon steels. Int. Mater. Rev. 1994, 39, 129–172. [Google Scholar] [CrossRef]
  14. Wierzbanowski, K.; Baczmanski, A.; Tarasiuk, J.; Lipiński, P.; Bacroix, B.; Lodini, A. Stored Energy and Recrystallisation in Cold Rolled Steel. Mater. Sci. Forum 2007, 558, 1207–1212. [Google Scholar] [CrossRef]
  15. Fang, C.; Garcia, C.I.; Choi, S.H.; DeArdo, A.J. Assessment of the Stored Energy Evolution during Batch Annealing Process of Cold Rolled HSLA Steels. Mater. Sci. Forum 2012, 715, 557–562. [Google Scholar] [CrossRef]
  16. Choi, S.-H.; Barlat, F.; Chung, J.H. Modeling of textures and yield surfaces during recrystallization in IF steel sheets. Scr. Mater. 2001, 45, 1155–1162. [Google Scholar] [CrossRef]
  17. Pan, H.; Wan, Y.; Wang, H.; Shen, X.; Fu, B.; Li, D.Y.; Dai, Y.; Yan, J. An Investigation of Friction Coefficient on Microstructure and Texture Evolution of Interstitial-Free Steel during Warm Rolling and Subsequent Annealing. Crystals 2019, 9, 565. [Google Scholar] [CrossRef] [Green Version]
  18. Nagataki, Y.; Hosoya, Y. Origin of the Recrystallization Texture Formation in an Interstitial Free Steel. ISIJ Int. 1996, 36, 451–460. [Google Scholar] [CrossRef]
  19. Yang, P.; Li, Z.C.; Mao, W.M.; Zhao, Z.S. Formation of the {111} <112> annealing texture in steels. Trans. Mater. Heat Treat. 2009, 30, 46. [Google Scholar]
  20. He, T.; Liu, Y.; Sun, W.; Zuo, L. Formation of Nuclei with {111} and {111} Orientations of IF Steel at Early Stage of Recrystallization Using EBSD Analysis. J. Iron Steel Res. Int. 2013, 20, 61–66. [Google Scholar] [CrossRef]
  21. Li, S.; Zhang, X.M. A new method for predicting earing tendency of textured sheets. Acta Metall. Sin. 1996, 32, 884–890. [Google Scholar]
  22. Ning, B.; Zhao, Z.; Mo, Z.; Wu, H.; Peng, C.; Gong, H. Influence of Continuous Annealing Temperature on Mechanical Properties and Texture of Battery Shell Steel. Metals 2019, 10, 52. [Google Scholar] [CrossRef] [Green Version]
Figure 1. Schematic diagram of continuous annealing process route.
Crystals 11 01569 g001
Figure 2. SEM images of the samples. (a) CR. (be) annealed samples at 620 °C, 640 °C, 680 °C and 720 °C, respectively.
Crystals 11 01569 g002
Figure 3. Grain size distribution of samples at different annealing temperature. (a) 620 °C, (b) 640 °C, (c) 680 °C and (d) 720 °C, respectively. (e) Fitting model of changes in the average grain size with annealing temperature.
Crystals 11 01569 g003
Figure 4. ODF sections (φ2 = 45°) of samples. (a) CR. (be) Annealed samples at 620 °C, 640 °C, 680 °C and 720 °C respectively. (f) Color scale.
Crystals 11 01569 g004aCrystals 11 01569 g004b
Figure 5. Texture intensity along α (a) and γ (b) orientation lines of samples.
Crystals 11 01569 g005
Figure 6. Distribution maps of typical textures at different annealing temperatures. (a) 620 °C, (b) 640 °C, (c) 680 °C and (d) 720 °C. Blue represents {111} <110> texture, red represents {111} <112>, yellow represents {110} <001>, purple represents {112} <110>, cyan represents {001} <100> and green represents {001} <110>.
Crystals 11 01569 g006
Table 1. Chemical composition of tested steels (wt.%).
C≤Si≤MnP≤S≤AlsN≤[O]≤
0.0030.0150.350.0100.0060.030.00250.0020
Table 2. The mechanical properties of samples annealed at different annealing temperatures.
Annealing TemperatureDirectionReL/MPaRm/MPaA/%r r ¯ r
620 °C31935221.50.280.350.19
90°32135122.30.62
45°31234927.10.26
640 °C31634034.50.360.40−0.06
90°30933530.80.39
45°29533433.10.43
680 °C27832534.60.260.36−0.10
90°29432836.00.35
45°30032934.20.41
720 °C29533637.80.290.290.02
90°30733938.80.27
45°27932734.50.31
Table 3. The volume fraction of each typical texture/%.
Samples{111} <112>{111} <110>{001} <001>{001} <011>{112} <110>{110} <001>{111}/{100}
CR14.726.40.7018.246.80.052.1
620 °C28.4362.637.232.742.26.5
640 °C36.622.93.924.5517.81.957.0
680 °C33.623.32.337.5222.51.815.8
720 °C24.819.87.057.0319.33.823.2
Table 4. The r ¯ and ∆r for main texture components.
Texture r ¯ Δr
{001} <110>0.4−0.8
{114} <110>1.2−2.1
{113} <110>1.0−1.7
{112} <110>2.1−2.7
{111} <110>2.60
{111} <112>2.60
{554} <225>2.61.1
{110} <001>5.18.9
Publisher’s Note: MDPI stays neutral with regard to jurisdictional claims in published maps and institutional affiliations.

