Elastic Properties of Orthorhombic YBa2Cu3O7 under Pressure

1
College of Civil Engineering, Chongqing Three Gorges University, Chongqing 404100, China
2
Department of Physics, Chongqing Three Gorges University, Chongqing 404100, China
3
Institute for Structure and Function, Chongqing University, Chongqing 401331, China
4
School of Mathematical Sciences and Physics, Jinggangshan University, Ji’an 343009, China
5
School of Materials Science and Engineering, Shanghai Jiaotong University, Shanghai 200240, China
*
Author to whom correspondence should be addressed.
Crystals 2019, 9(10), 497; https://doi.org/10.3390/cryst9100497
Submission received: 1 September 2019
/
Revised: 14 September 2019
/
Accepted: 19 September 2019
/
Published: 25 September 2019
(This article belongs to the Special Issue Elasticity and Micro- and Macro- Plasticity of Crystals)
Abstract
:The pressure dependence of the lattice and elastic constants of the orthorhombic YBaCuO are firstly investigated using the first principles calculations based on the density functional theory. The calculated lattice parameters at 0 GPa are in agreement with the available experimental data. By the elastic stability criteria under isotropic pressure, it is predicted that YBaCuO with and orthorhombic structure is mechanically stable under pressure up to 100 GPa. On the basis of the elastic constants, Pugh’s modulus ratio, Poisson’s ratio, elastic anisotropy, Debye temperature, and the minimum thermal conductivity of YBaCuO under pressure up to 100 GPa are further investigated. It is found that its ductility, Debye temperature, and minimum thermal conductivity increase with pressure.
1. Introduction
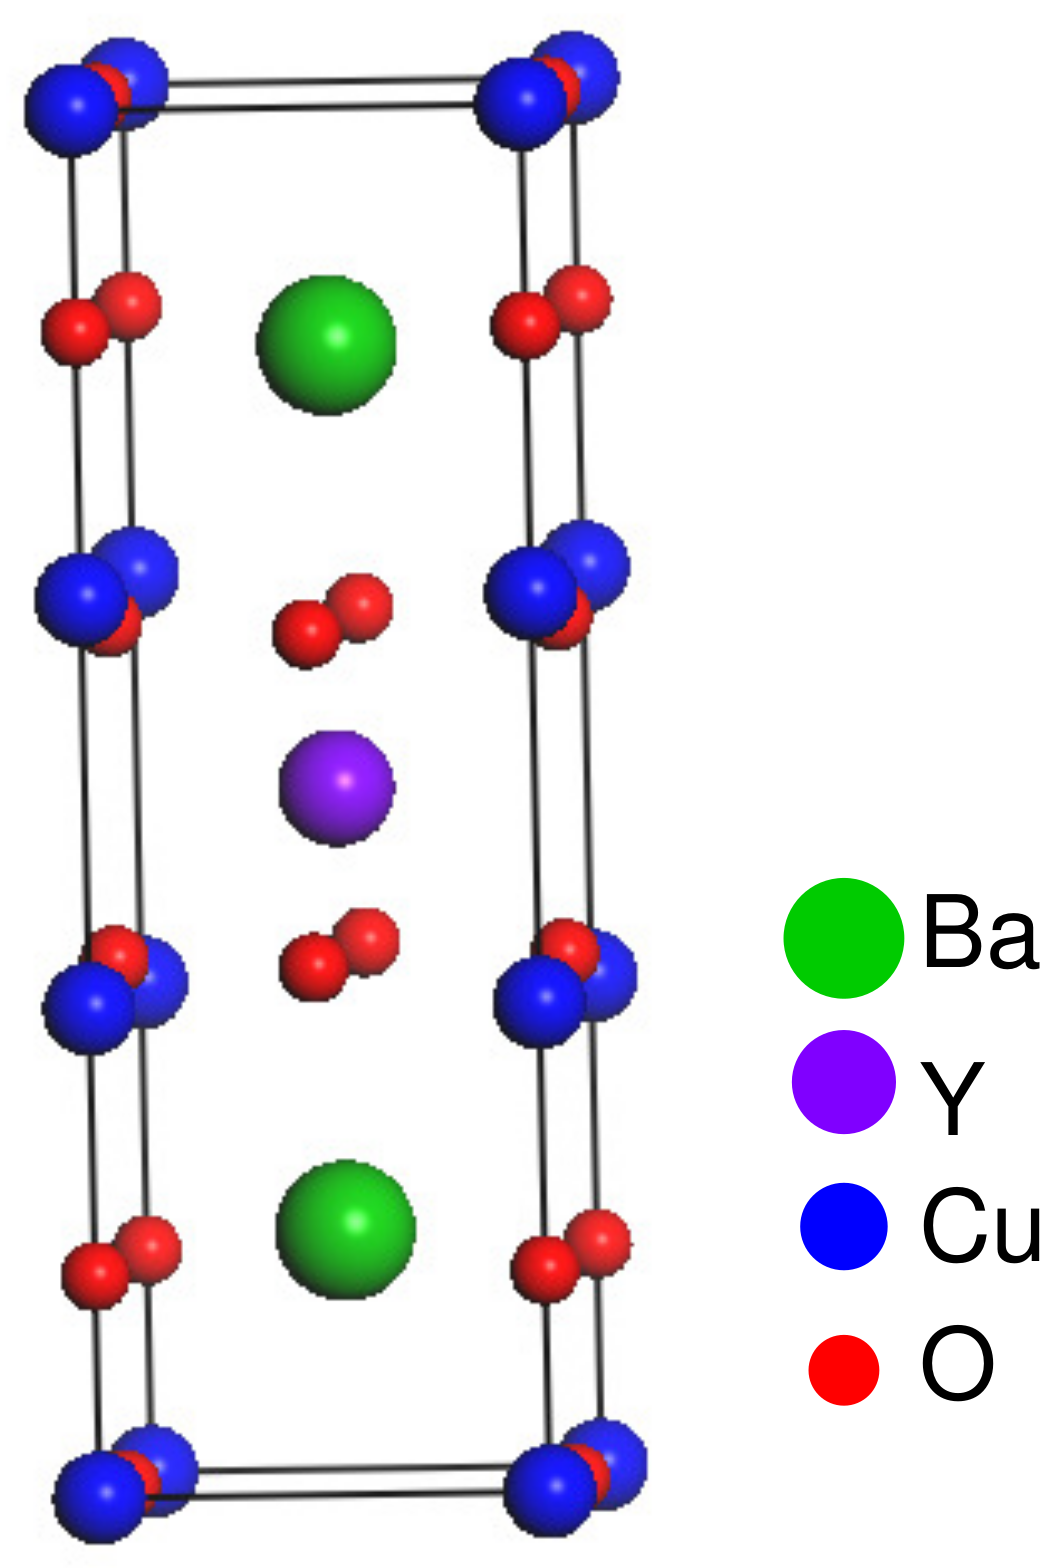
The discovery of the Ba-La-Cu-O system by Bednorz and Müller [1] with a superconducting transition temperature of 30 K has generated a great deal of tremendous interest among physicists and material scientists and sparked intensive studies of the cuprate systems. Further research has led Wu et al. [2] to the discovery of a superconducting transition temperature of 90 K in the multiphase Y-Ba-Cu-O system. One of the best-studied superconductors is nearly stoichiometric YBaCuO. YBaCuO has the space group, and its crystal structure is shown in Figure 1. There are thirteen atoms per primitive cell. This compound has a high superconducting transition temperature and a relatively simple structure, and much research is focused on this superconductor [3,4,5,6,7]. For example, Murakami et al. [8] used a standard vibrating sample magnetometer equipped with a cryostat to measure the magnetization of YBaCuO samples fabricated by the quench and melt growth (QMG) technique, and they found that the magnetization behavior of QMG-processed YBaCuO can be understood in terms of the Bean critical state model. Fong et al. [9] reported inelastic neutron scattering measurements at excitation energies ∼41 meV in YBaCuO, and their results indicated that magnetic scattering centered around 41 meV and q = (, ) appears in the superconducting state only. Sánchez-Valdé et al. [10] studied the nucleation, growth, and sintering stages of epitaxial YBaCuO superconducting thin films by means of in situ electrical measurements. Dadras et al. [11] investigated the effects of three samples of carbon-based nanostructure doping on the properties of the YBaCuO high-temperature superconductor, and they found that carbon nanostructures such as C, SiC, and CNT can improve the critical current density of YBaCuO. Horide [12] researched the influence of the matching field on the critical current density and irreversibility temperature in YBaCuO films containing BaMO (M = Zr, Sn, Hf) nanorods. Hapipi et al. [13] investigated the effect of the calcination process (single and multiple calculations) on the nominal composition YBaCuO (y-123) by using the four-point temperature resistance measurement, X-ray diffraction (XRD), and field-emission scanning electron microscopy (FESEM). All this research is mainly focused on experimental research, and the results are very important to further scientific and technical investigations. However, there is almost no theoretical research on the orthorhombic YBaCuO, and the elastic properties of YBaCuO under pressure have received little attention.
As is known, elastic properties are closely associated with many fundamental solid-state properties, such as bulk modulus, shear modulus, Young’s modulus, thermal expansion, Debye temperature, minimum thermal conductivity, etc. Besides, many practical applications related to the mechanical properties can be deduced from the elastic constants, for example load deflection, internal strain, and fracture toughness [14]. Single-crystal elastic constants at lower pressure for YBaCuO are scarce in literature due to the difficulties of the experiments, let alone the elastic constants at higher pressure. Besides, the pressure-induced structural phase transitions can be predicted from the elastic constants under different pressures. Hence, in this work, we pay close attention to the elastic properties of YBaCuO under pressure up to 100 GPa by using the first principles calculations. The rest of the paper is organized as follows. The theory and computational details based on the first principles methods are given in Section 2. Some results and discussion under pressure are presented in Section 3. Finally, the conclusions are drawn in Section 4.
2. Theory and Computational Details
In this work, the first principles calculations based on density functional theory (DFT) are performed by employing the plane wave basis projector augmented wave (PAW) method [15,16], as implemented in the VASPcode [17,18,19]. The exchange-correlation functional for all elements is described with the generalized gradient approximation (GGA) of Perdew–Burke–Ernzerhof (PBE) [20]. A plane-wave energy cutoff of 500 eV was employed throughout the calculations. The convergence of energy and force were set to eV and 10 eV/Å, respectively. The k-point meshes for Brillouin zone integrations were performed using the -centered Monkhorst–Pack scheme [21], and the k-point grids were used. The crystal at the given pressure is fully relaxed with respect to the volume, shape, and internal atomic positions until the change in the total energy is smaller than eV between two ionic step relaxations, and then, the lattice parameters under different pressures are determined.
We used the strain energy–strain curve to calculate the elastic constants. For YBaCuO with the orthorhombic structure, there are nine independent elastic constants , , , , , , , , and . To calculate the complete elastic constants, the nine Lagrangian strain tensors in terms of a parameter listed in Table 1 were introduced. For each strain, was varied between −0.02 and 0.02 with step 0.002, that is we needed to calculate the total strain energies of the 21 points for each strain tensor. The calculated points were then fitted to the least-squares polynomial, and the elastic constants could be concluded from the second-order derivatives of E with respect to . Details of the calculations were introduced in [22].
Based on the Voigt–Reuss–Hill approximation, other mechanical parameters for polycrystalline aggregates such as the bulk modulus B, shear modulus G, Poisson’s ratio , and Vickers’ hardness can be obtained via the elastic constants. According to the Voigt and Reuss approximation, the bulk modulus and shear modulus for orthorhombic crystals can be written as [23,24,25]:
with:
Using the Hill model, the shear modulus and the bulk modulus are the arithmetic averages of Voigt and Reuss bounds [26], that is:
3. Results and Discussion
3.1. Structure and Elastic Properties of under Different Pressures
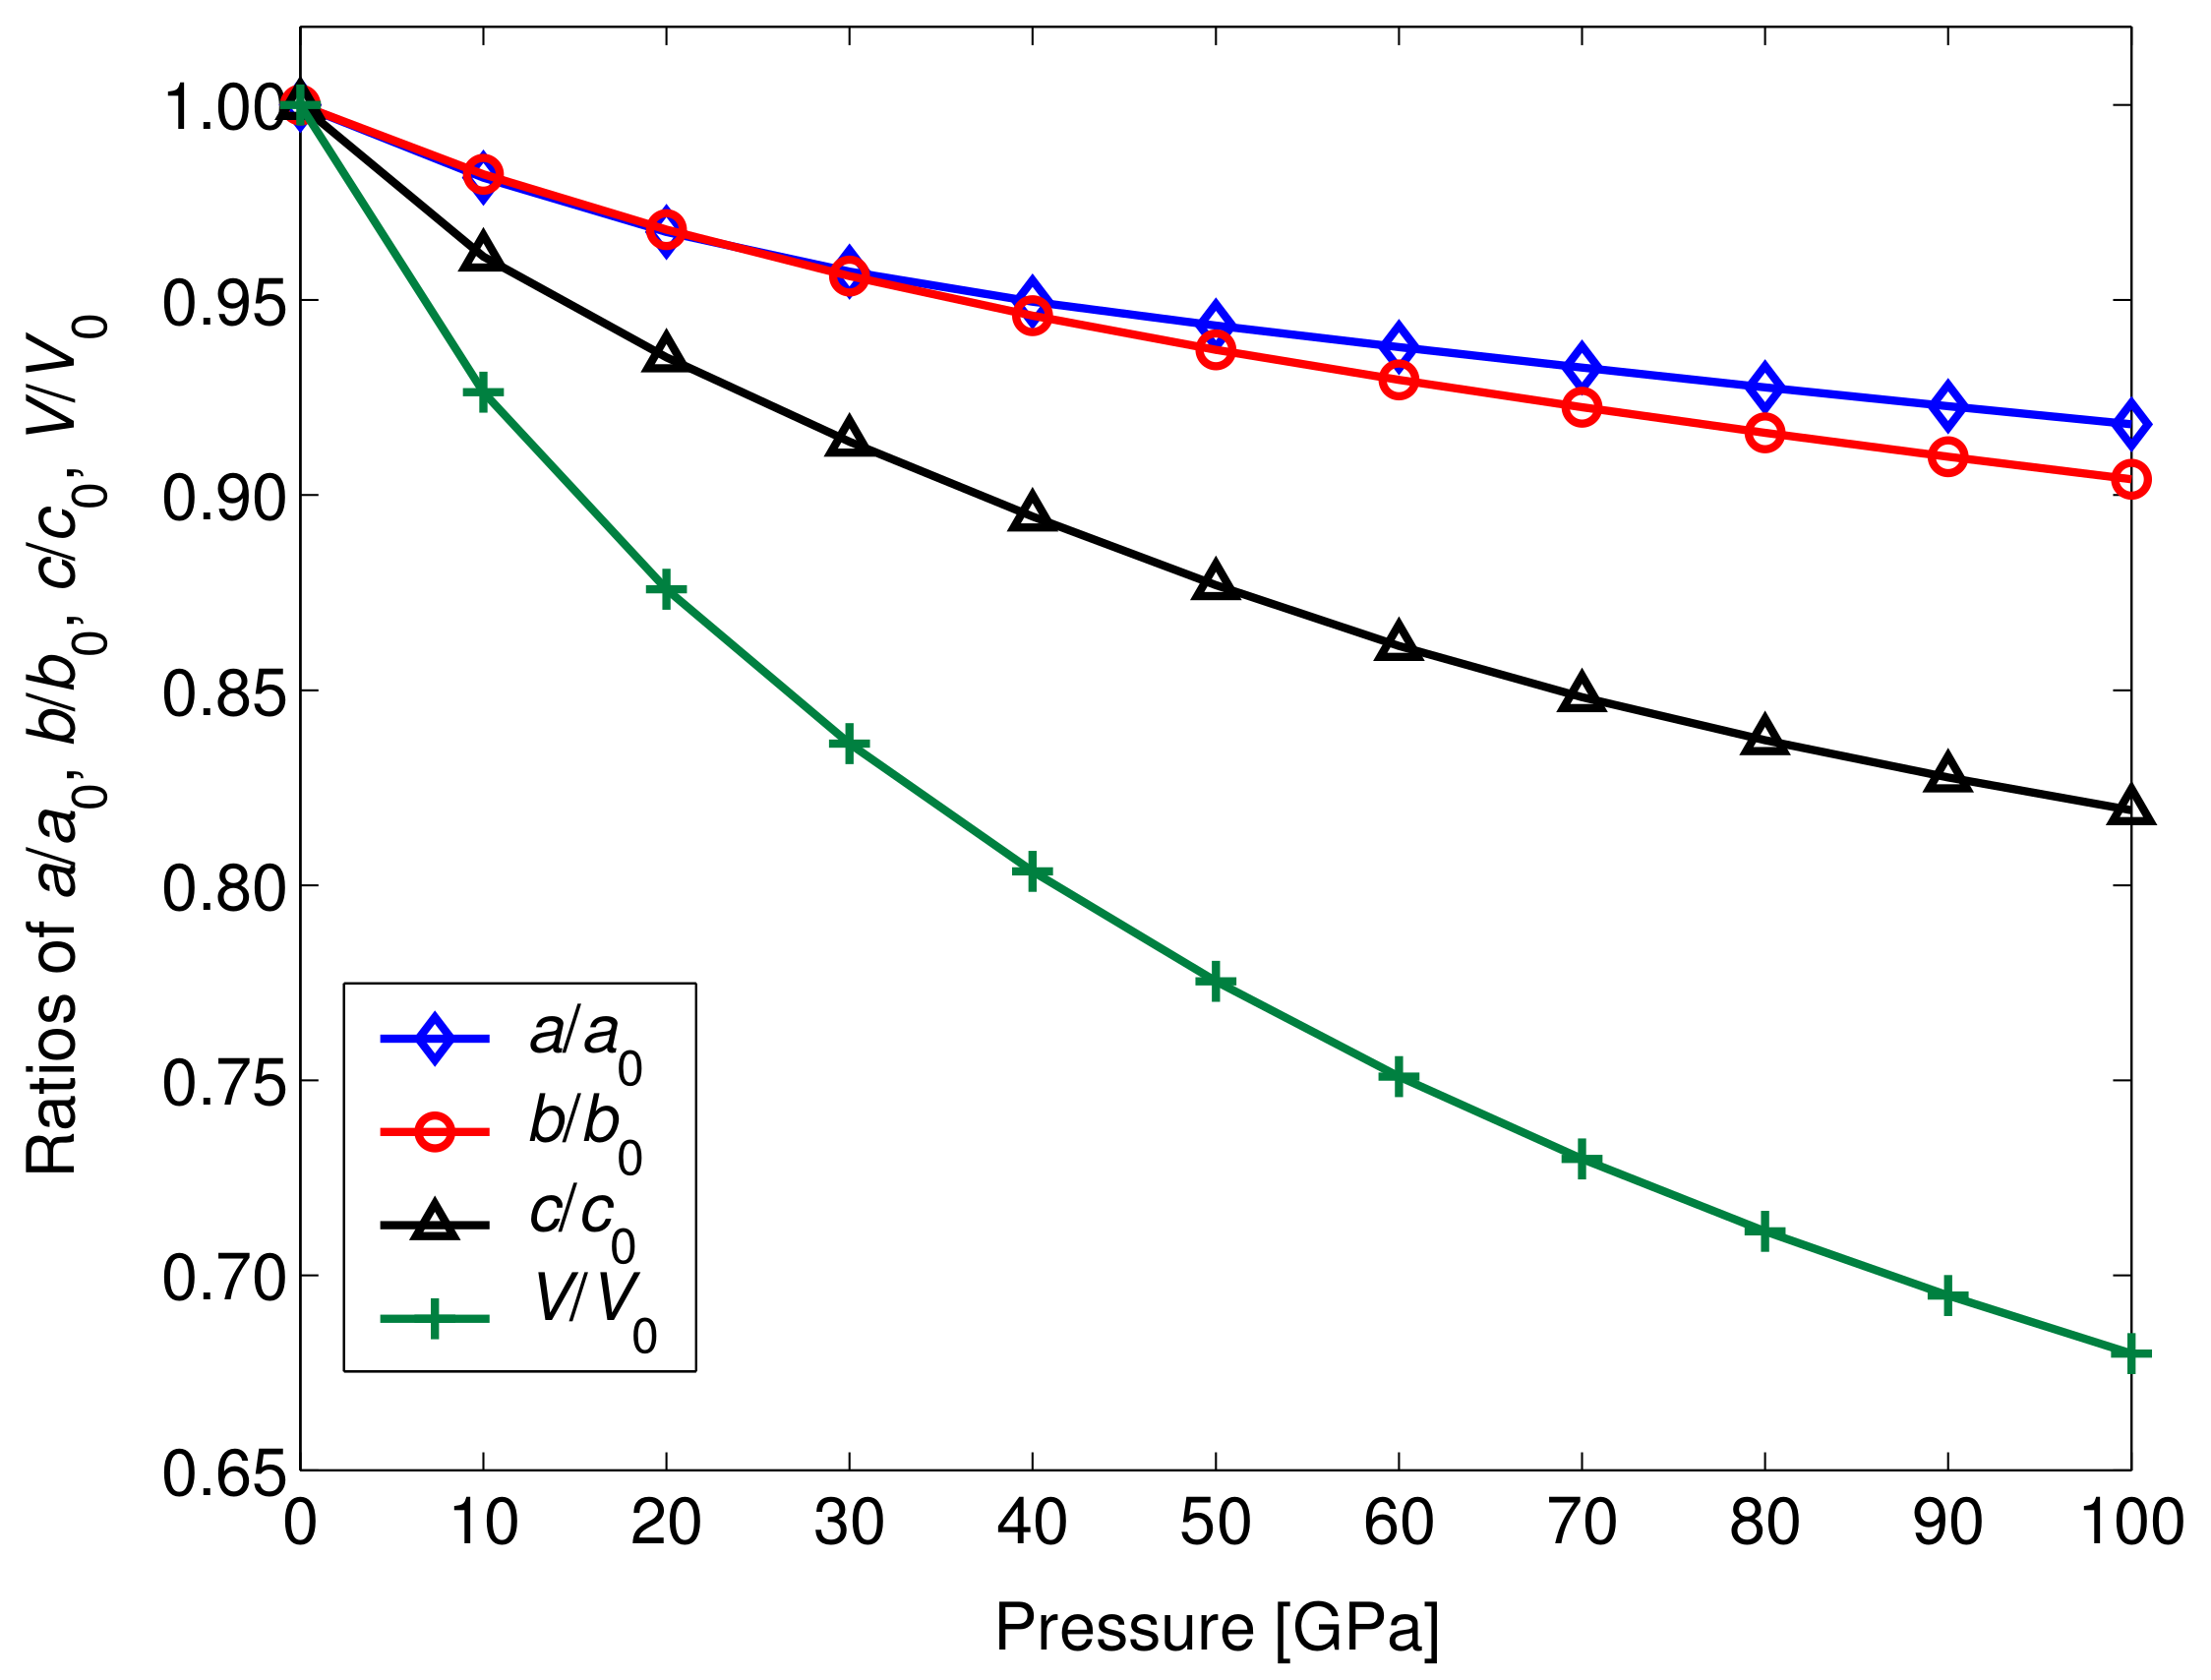
The lattice parameters and density of YBaCuO under pressure up to 100 GPa were firstly calculated, and the results are summarized in Table 2. Using high-resolution neutron powder diffraction, Beno et al. [27] determined the lattice constants of YBaCuO to be Å, Å, and Å, and from powder X-ray diffraction data, Cava et al. [28] proposed the unit cell of YBaCuO with Å, Å, Å. The difference between our results and experimental data were less than 1.5%, indicating that the computational methodology employed in the present work was reliable. Unfortunately, no experimental and theoretical values of the lattice parameters under high pressure are available for comparison. Furthermore, the pressure-dependent lattice parameters , , , (where , , , and are the equilibrium structure parameters and cell volume at 0 GPa) are plotted in Figure 2. It can be found that , , and decreased with increasing pressure, and the decreasing rate of was much larger than those of and , while a and b axes nearly had the same decreasing rate. Hence, it can be concluded that the c axis was most easily compressed.
Knowledge of the elastic constants is significant for understanding the structural stability and mechanical properties of a crystal. Table 3 gives the calculated elastic constants under different pressures. The present results at ground state ( GPa, GPa, GPa, GPa, GPa, GPa, GPa, GPa, GPa) nearly agreed well with the experimental results at room temperature ( GPa, GPa, GPa, GPa, GPa, GPa, GPa, GPa, GPa) obtained using resonant ultrasound spectroscopy [29]. For the orthorhombic crystals, the mechanical stability criterion under hydrostatic pressure can be written as: [30]
where ∼, , , . The elastic constants under different pressures obey these stability criteria, implying that the orthorhombic YBaCuO is mechanically stable within 100 GPa. As can be seen from Table 3, all the elastic constants increased monotonically with pressure. , , and represent the resistance to linear compression, and the other elastic constants are mainly associated with the elasticity in shape. In the entire pressure range of our calculations, , , and were much larger than those of the other elastic constants, indicating that the deformation resistances of YBaCuO along the axial directions were stronger than those of the non-axial directions. Further, the relationship under different pressures implied that the strength of the bonding along the [010] direction was stronger than those along the [100] and [001] directions.
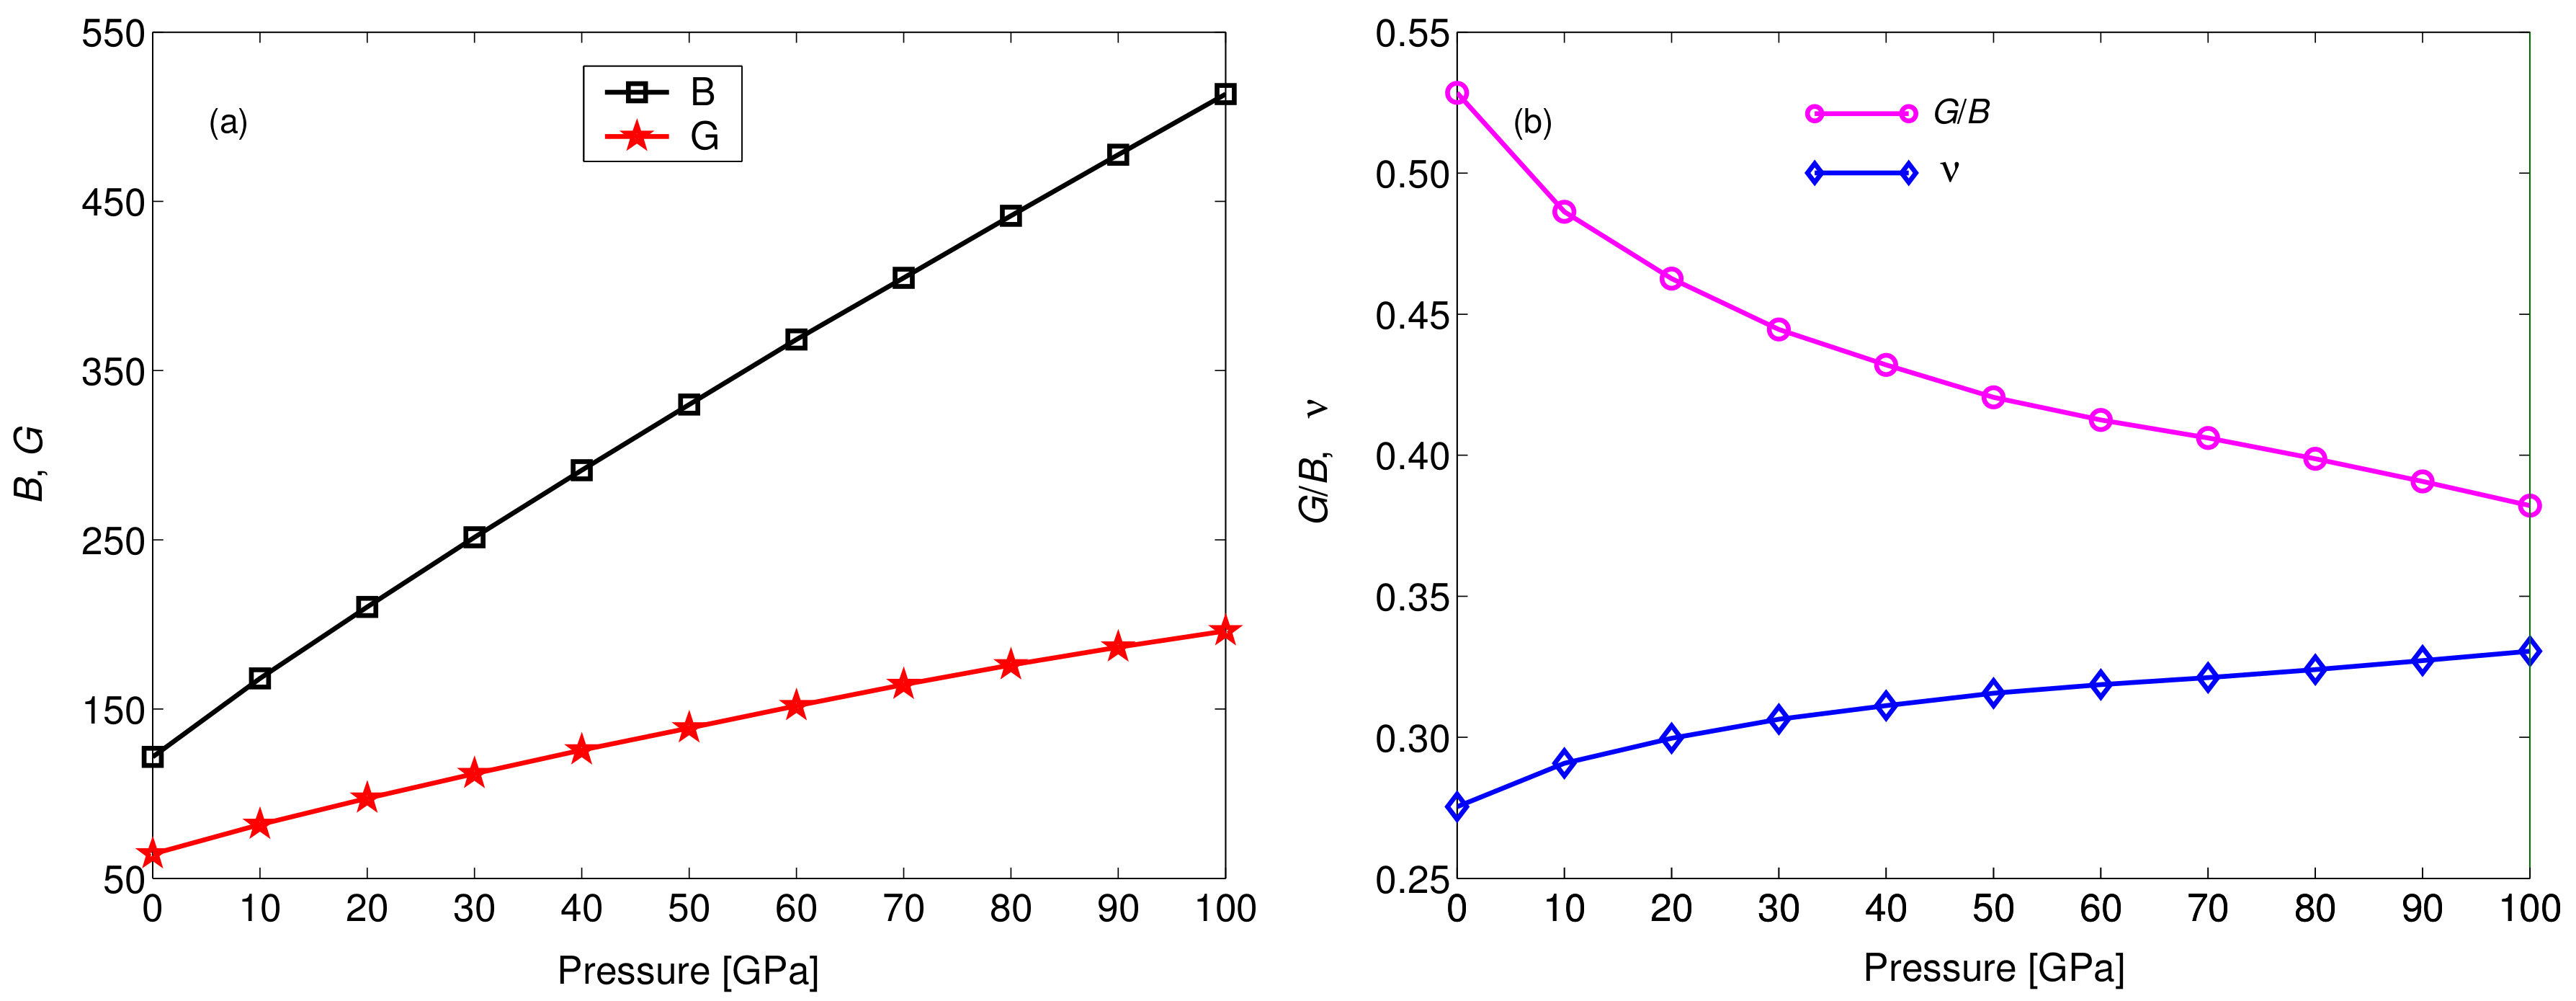
The bulk modulus B describes the resistance to volume (bond-length) change, and the shear modulus G represents the resistance to shape (bond-angle) change with applied stress, respectively. Generally, a material presents more ductility if it has a larger bulk modulus and a smaller shear modulus. The pressure dependence of B and G is plotted in Figure 3a. It can be seen that both B and G increased with increasing pressure. However, the increment of B was larger than that of G, indicating that pressure can effectively improve the ductility of YBaCuO. The quotient of the shear modulus to bulk modulus () proposed by Pugh [31] was used to predict the brittle or ductile behavior of a solid roughly. A lower (higher) value represents more ductility (more brittleness), and the critical value 0.57 separates the ductile and brittle materials. Figure 3b shows the values of as a function of pressure. The value of decreased automatically with pressure, and all the values were smaller than 0.57, implying that pressure can increase the ductility of YBaCuO; it is ductile itself in the pressure range of 0–100 GPa. In addition, Poisson’s ratio can also reflect the ductile properties of a material. This ratio usually takes a value from −1–0.5, and it is inversely proportional to . The pressure-dependent is also shown in Figure 3b. It can be found that Poisson’s ratio increases with increasing pressure, and hence, we can obtain the same conclusion from both and . Furthermore, all the values of were larger than 0.25. () was the lower (upper) limit for central force materials. The obtained values were all larger than 0.25, which indicates that the interatomic forces in YBaCuO were predominantly central forces under different pressures.
3.2. Elastic Anisotropy of under Different Pressures
Anisotropy is a key parameter for engineering science, as well as crystal physics, and it is highly correlated with the possibility to induce microcracks in materials [32]. The shear anisotropic factors can be used to measure the directional variability in bonding between atoms in different crystallographic planes. For the orthorhombic YBaCuO, there are three shear anisotropic factors [33,34], i.e., is the shear anisotropic factor along the plane between the 〈011〉 and 〈010〉 directions, is the shear anisotropic factor along the plane between the 〈101〉 and 〈001〉 directions, and is the shear anisotropic factor along the plane between the 〈110〉 and 〈010〉 directions. These shear anisotropic factors can be written as [33]:
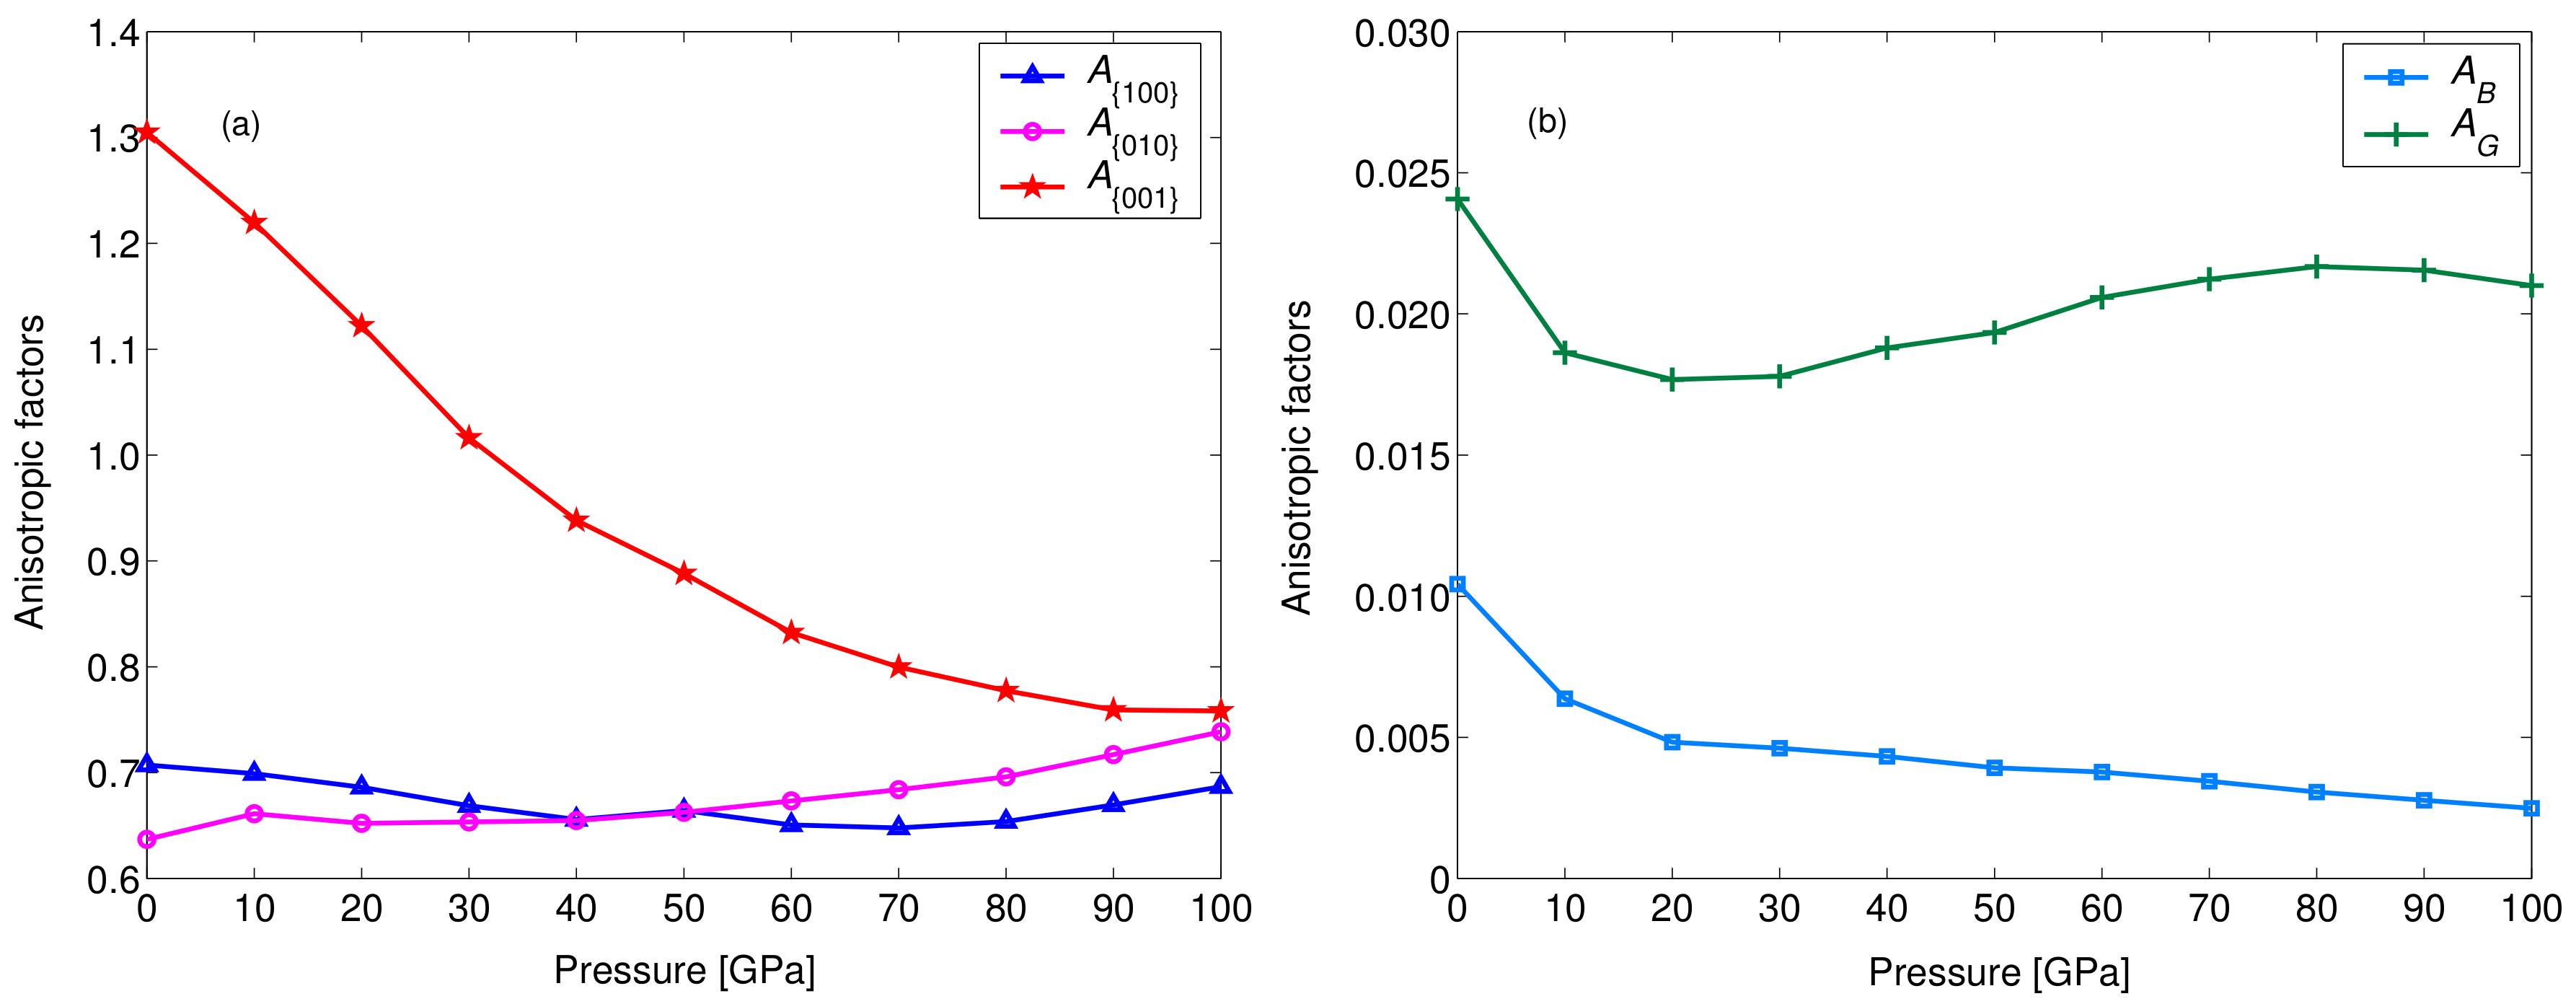
The shear anisotropy factors , , and must be one for an isotropic crystal, while any other value smaller or greater than one measures the degree of elastic anisotropy. All the calculated values of various anisotropy factors under pressure up to 100 GPa for YBaCuO are plotted in Figure 4a. When the applied pressure increased from 0–100 GPa, decreased quickly, but both and had little variation with increasing pressure. firstly decreased from 1.305 to 1.016 and then decreased from 1.016 to 0.758 after 30 GPa, implying that the anisotropy of the shear plane between the 〈110〉 and 〈010〉 directions firstly decreased and then increased with pressure. However, pressure had little influence on the shear anisotropy of the plane between the 〈011〉 and 〈010〉 directions, as well as the plane between the 〈101〉 and 〈001〉 directions. In addition, the percentage elastic anisotropy in compressibility () and shear () can be written as follows [35]:
A value of zero represents elastic isotropy, while a value of one refers to the largest possible anisotropy. The pressure dependence of and for YBaCuO is presented in Figure 4b. It shows that the value of was larger than that of , and the value of was almost close to zero over the whole pressure range investigated, implying that YBaCuO is largely isotropic in bulk and slightly anisotropic in shear.
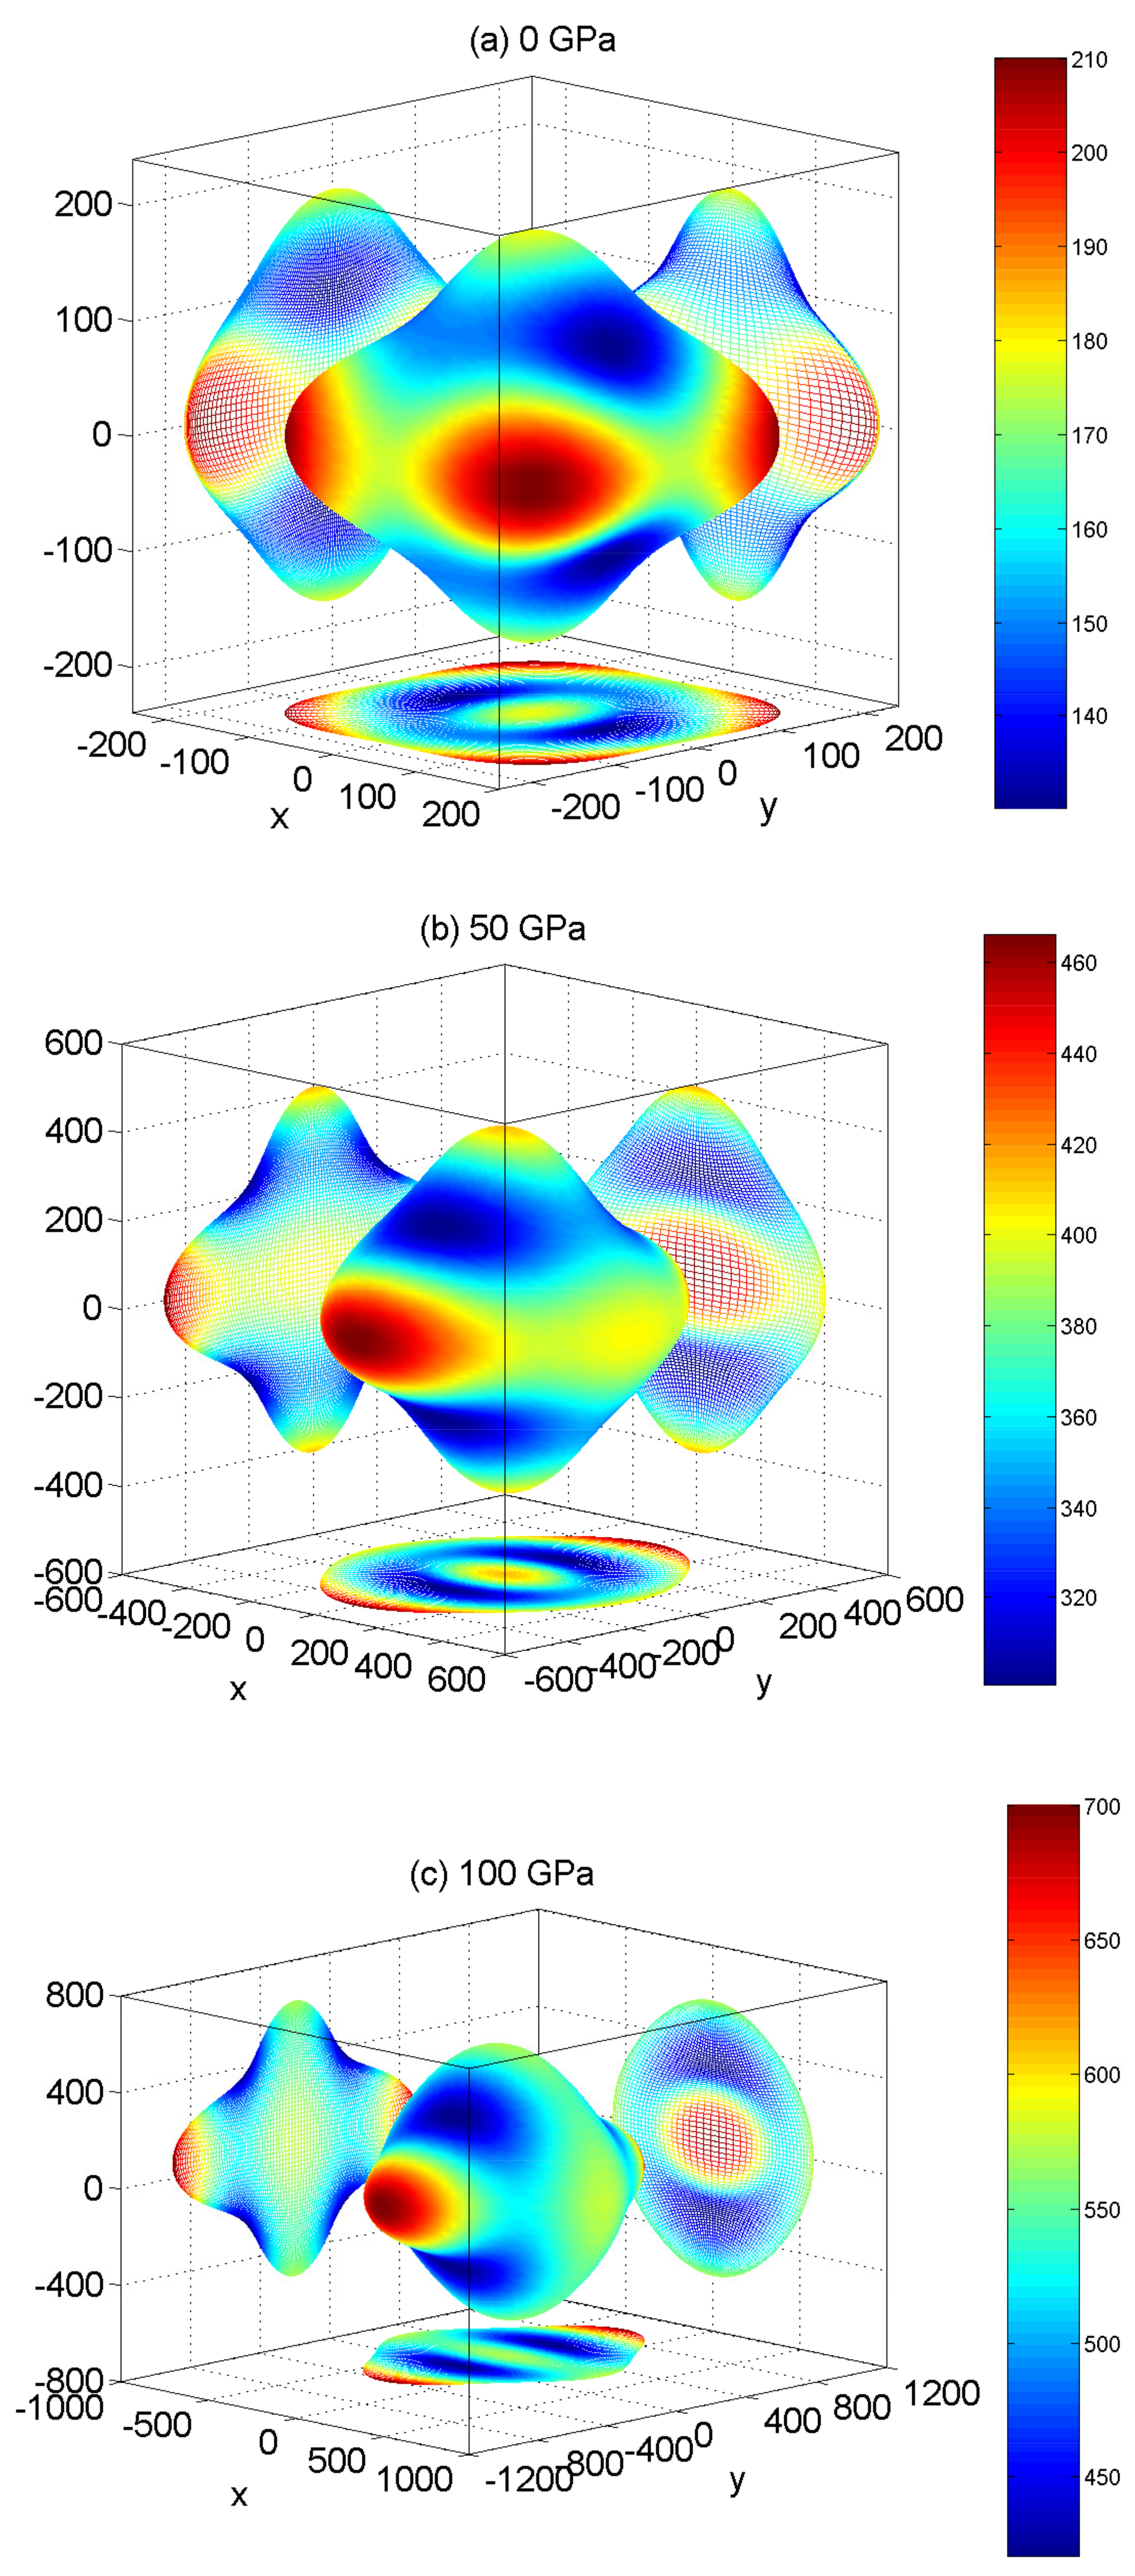
To illustrate the elastic anisotropy in detail, it is necessary to investigate the variation of Young’s modulus (E) with direction. For orthorhombic crystal, the directional independence of E can be expressed as [33,36]:
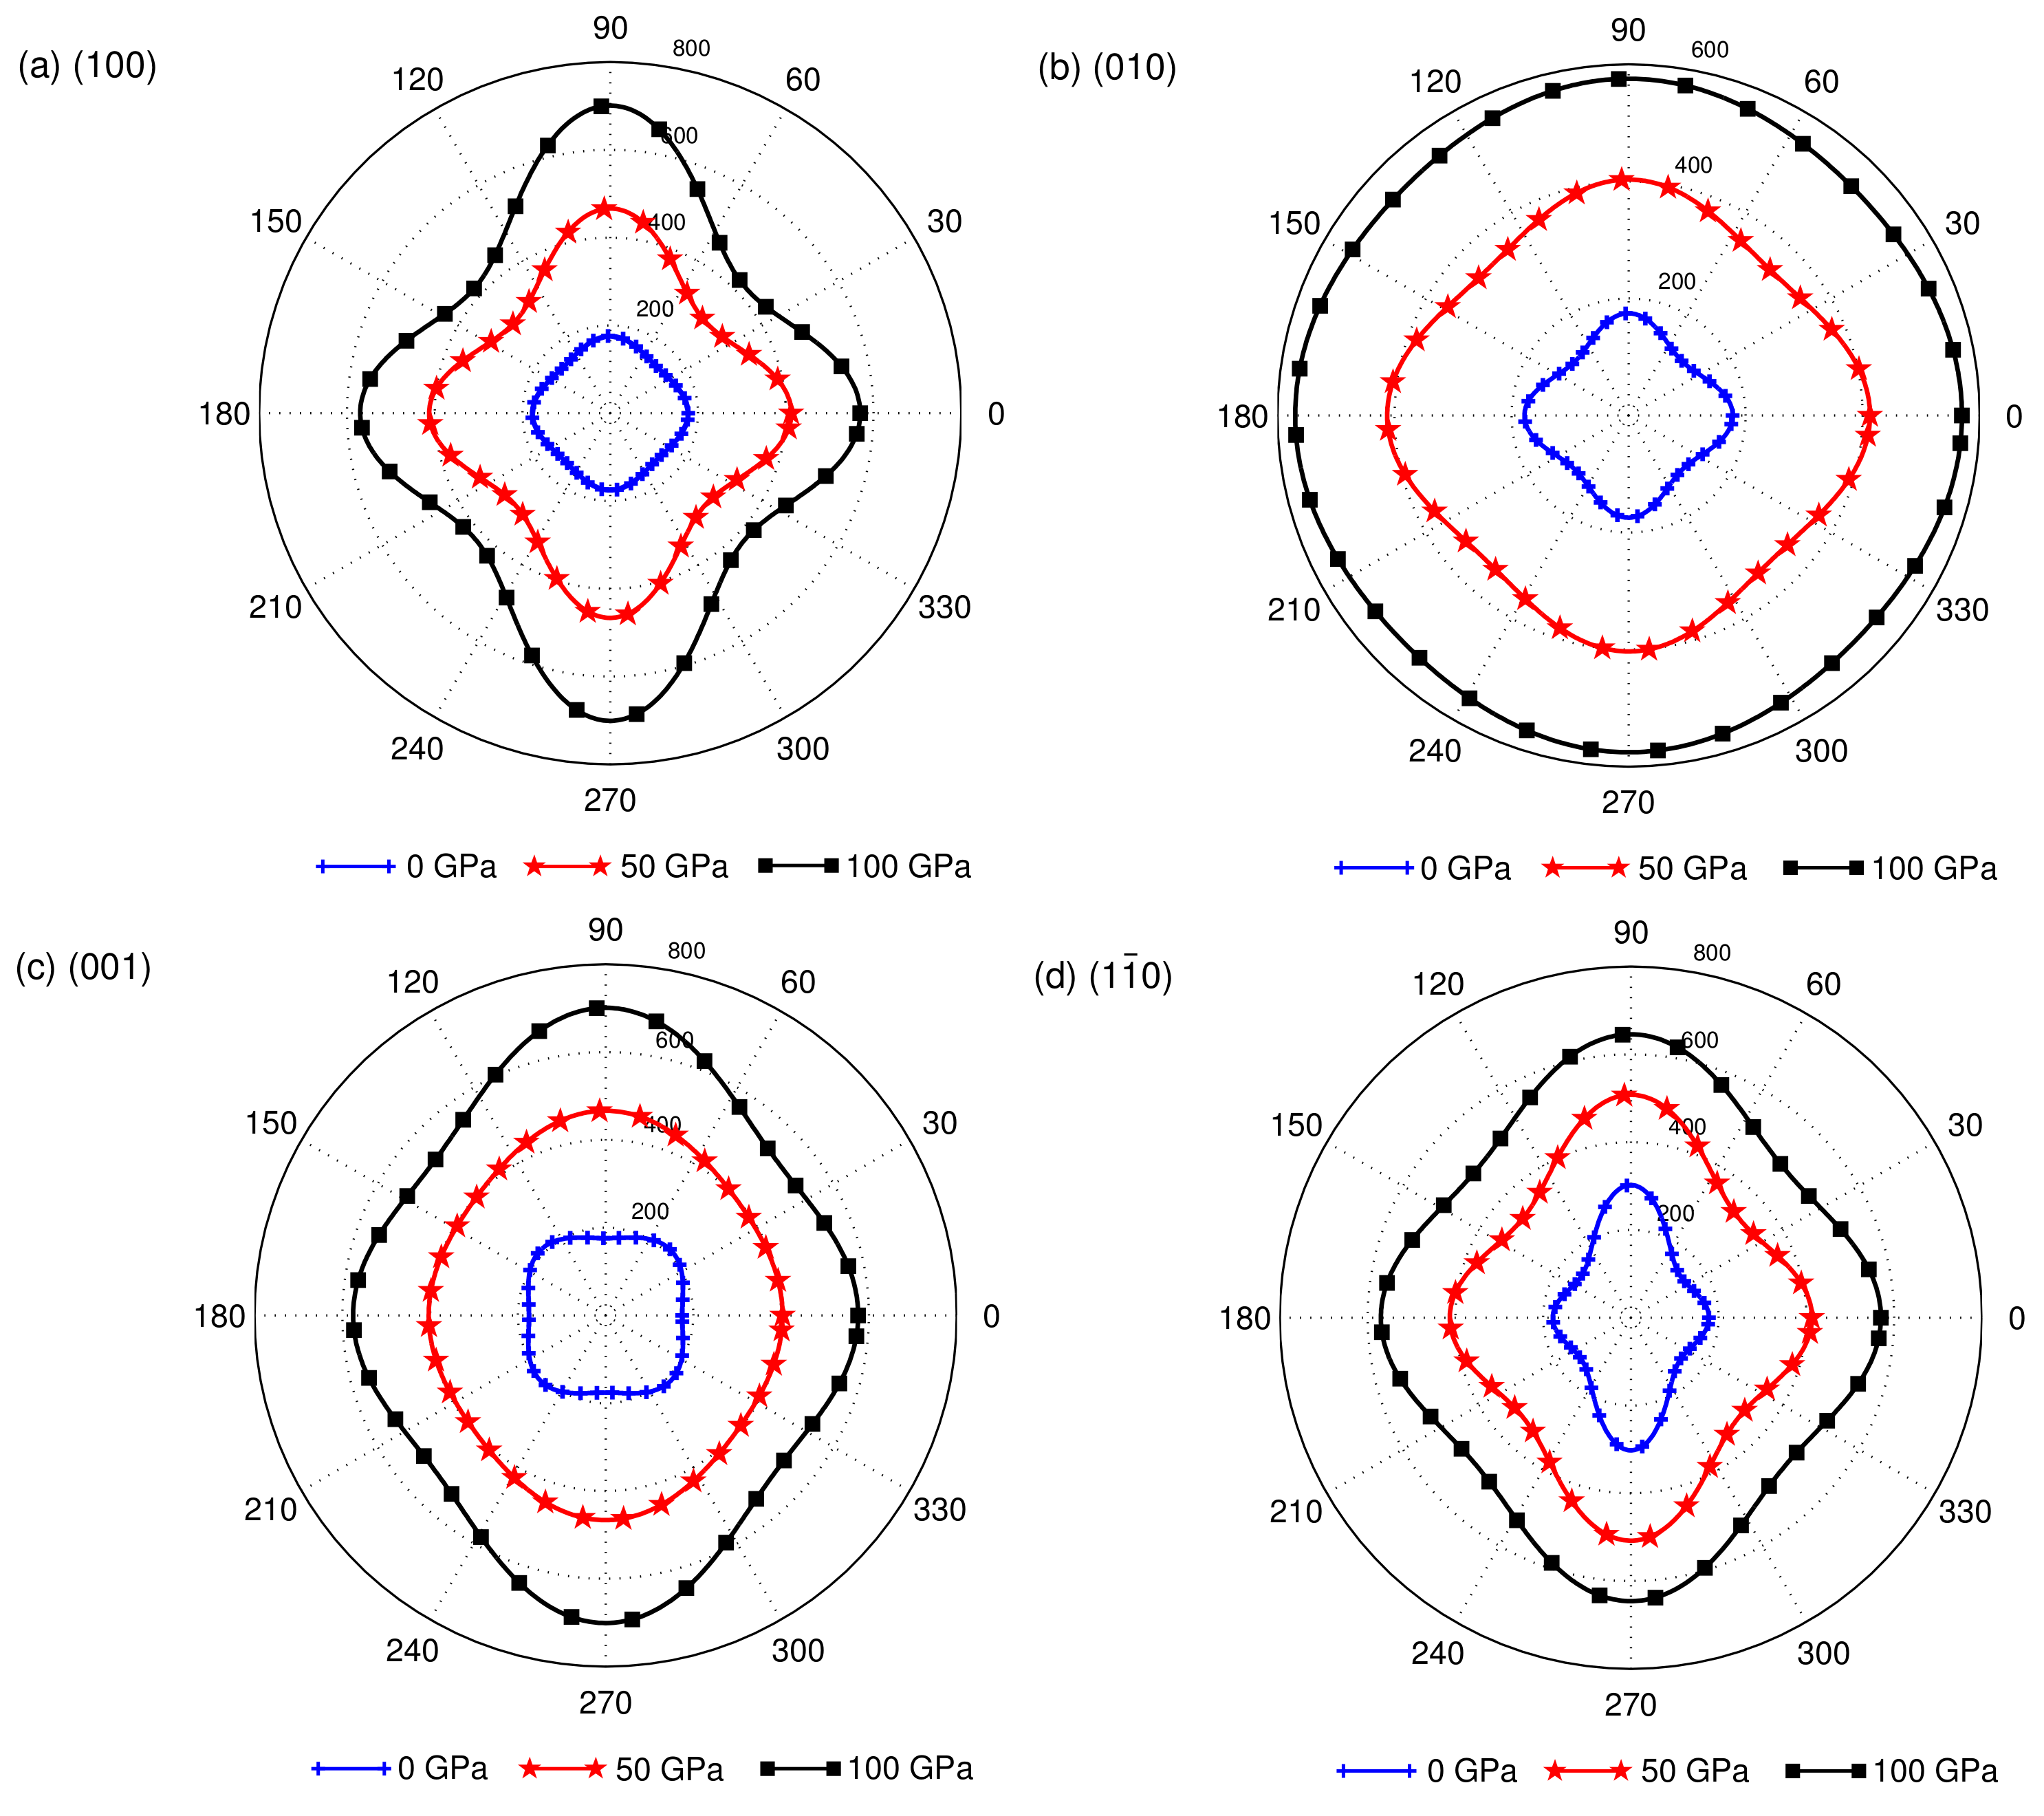
where are the elastic compliance constants given by Ney [37] and , , are the direction cosines under the spherical coordinates. The representation surfaces for Young’s modulus under different pressures are plotted in Figure 5. Obviously, the representation surfaces for Young’s modulus under different pressures deviated in shape from a sphere, and the degree of deviation from the sphere decreased with pressure, indicating that YBaCuO possessed obvious elastic anisotropy and that the anisotropy of the Young’s modulus decreased with pressure. For further comprehensive visualization of the anisotropic features in more detail, the orientation-dependent Young’s modulus in the (100), (010), (001), and (10) planes under different pressures are depicted in Figure 6. For the (100) plane, the direction cosines were , , , and the tensile direction was rotated from [001] to [010]; for the (010) plane, the direction cosines were , , , and the tensile direction was rotated from [001] to [100]; for the (001) plane, the direction cosines were , , , and the tensile direction was rotated from [100] to [010]; for the (10) plane, the direction cosines were , , , and the tensile direction was rotated from [001] to [110]. From Figure 6, we can find that Young’s moduli on the researched planes exhibited anisotropy, and the Young’s modulus of the (100) plane had a stronger anisotropic character in comparison with other planes under different pressures. The degree of anisotropy in the (010) and (10) planes decreased with pressure, and the Young’s modulus of the (010) plane was relatively close to isotropic at 100 GPa. It is clearly visible from Figure 5 and Figure 6 that YBaCuO was anisotropic under different pressures because of the different bonding characteristics between adjacent atomic planes.
3.3. Thermodynamic Properties of under Different Pressures
As a fundamental parameter, the Debye temperature is closely related to the elastic constants, specific heat, and melting point. At a low temperature, the Debye temperature can be deduced from the sound velocities via the following equation [38,39]:
where h is Planck’s constant, n is the number of atoms per unit cell, is Boltzmann’s constant, M is the molecular weight, is Avogadro’s number, is the density, and , , and are the average, longitudinal, and transverse elastic wave velocities, respectively. The calculated sound velocities and Debye temperature as a function of pressure are given in Table 4. The Debye temperature at 0 GPa determined from our elastic constants was 446.34 K, in good agreement with the value 414 K obtained by Lei et al. [29] and the specific heat value 440 K obtained by Inderhees et al. [40]. From Table 4, we can see that all the sound velocities, as well as the Debye temperature increased monotonically with pressure. Since the Debye temperature in a solid can describe its covalent strength, the increase of with pressure indicated that the covalent strength of YBaCuO magnified with the increase of pressure. In general, the higher the , the higher the thermal conductivity. Here, the minimum thermal conductivity of YBaCuO can be evaluated according to Liu’s model [41]:
where E is Young’s modulus. The calculated minimum thermal conductivities of YBCuO under different pressures are also given in Table 4. The value of increased monotonically with pressure, which had the same change trend as . Further, YBaCuO had a very small minimum thermal conductivity ( = 0.863) at 0 GPa, implying that YBaCuO was a very competitive candidate material for both an environmental/thermal barrier and oxygen-resistant coating.
4. Conclusions
In summary, we investigated the structural stability and mechanical properties of YBaCuO under pressure up to 100 GPa by means of first principles. It was found that the equilibrium lattice parameters at 0 GPa agreed well with the available experimental data, and YBaCuO was mechanically stable within 100 GPa. The pressure dependence of Pugh’s modulus ratio, Poisson’s ratio, elastic anisotropy, Debye temperature, and the minimum thermal conductivity were further investigated for the first time. It was shown that the ductility of YBaCuO increased monotonically with pressure from both Pugh’s modulus ratio and Poisson’s ratio. Besides, the Debye temperature and the minimum thermal conductivity increased with pressure, which satisfied the objective rule that the higher the Debye temperature, the higher the minimum thermal conductivity. Due to the relatively lower thermal conductivity of YBaCuO, it is suitable to be used as a thermal insulating material.
Author Contributions
C.C. and L.L. conceived of and designed the theoretical calculations; Y.W. performed the calculations, Y.J. and L.C. analyzed the data; C.C. wrote the paper.
Funding
The work is supported by the Science and Technology Research Program of Chongqing Municipal Education Commission (Grant Nos. KJQN201801211, KJQN201801220), the Natural Science Foundation of China (51661013, 11464020), and the Ph.D. Start-up Fund of the Natural Science Foundation of Jinggangshan University (JZB15007).
Conflicts of Interest
The authors declare no conflict of interest.
References
- Bednorz, J.G.; Muller, K.A. Possible highTc superconductivity in the Ba-La-Cu-O system. Z. Phys. B 1986, 64, 189–193. [Google Scholar] [CrossRef]
- Wu, M.K.; Ashburn, J.R.; Torng, C.J.; Hor, P.H.; Meng, R.L.; Gao, L.; Huang, Z.J.; Wang, Y.Q.; Chu, C.W. Superconductivity at 93 K in a new mixed-phase Y-Ba-Cu-O compound system at ambient pressure. Phys. Rev. Lett. 1987, 58, 908. [Google Scholar] [CrossRef] [PubMed]
- Mook, H.A.; Yethiraj, M.; Aeppli, G.; Mason, T.E.; Armstrong, T. Polarized neutron determination of the magnetic excitations in YBa2Cu3O7. Phys. Rev. Lett. 1993, 70, 3490. [Google Scholar] [CrossRef] [PubMed]
- Ding, F.Z.; Gu, H.W.; Zhang, T.; Wang, H.Y.; Qu, F.; Qiu, Q.Q.; Dai, S.T.; Peng, X.Y.; Cao, J.L. Strong enhancement flux pinning in MOD-YBa2Cu3O7-x films with self-assembled BaTiO3 nanocolumns. Appl. Surf. Sci. 2014, 314, 622–627. [Google Scholar] [CrossRef]
- Gray, B.A.; Middey, S.; Conti, G.; Gray, A.X.; Kuo, C.T.; Kaiser, A.M.; Ueda, S.; Kobayashi, K.; Meyers, D.; Kareev, M.; et al. Superconductor to Mott insulator transition in YBa2Cu3O7/LaCaMnO3 heterostructures. Sci. Rep. 2016, 6, 33184. [Google Scholar] [CrossRef] [PubMed]
- Horide, T.; Matsukida, N.; Ishimaru, M.; Kita, R.; Awaji, S.; Matsumoto, K. Pin potential effect on vortex pinning in YBa2Cu3O7-δ films containing nanorods: Pin size effect and mixed pinning. Appl. Phys. Lett. 2017, 110, 052601. [Google Scholar] [CrossRef]
- Liu, G.; Zhang, G.; Yu, H.; Jing, L.W.; Ai, L.W.; Liu, Q. Experimental and numerical study of frequency-dependent transport loss in YBa2Cu3O7-δ coated conductors with ferromagnetic substrate and copper stabilizer. J. Appl. Phys. 2017, 121, 243902. [Google Scholar] [CrossRef]
- Murakami, M.; Morita, M.; Koyama, N. Magnetization of a YBa2Cu3O7 Crystal Prepared by the Quench and Melt Growth Process. Jpn. J. Appl. Phys. 1989, 28, 1189. [Google Scholar] [CrossRef]
- Fong, H.F.; Keimer, B.; Anderson, P.W.; Reznik, D.; Dogan, F.; Aksay, I.A. Phonon and Magnetic Neutron Scattering at 41 meV in YB2Cu3O7. Phys. Rev. Lett. 1995, 75, 316. [Google Scholar] [CrossRef] [PubMed]
- Sanchez-Vald’es, C.F.; Puig, T.; Obradors, X. In situ study through electrical resistance of growth rate of trifluoroacetate-based solution-derived YBa2Cu3O7 films. Supercond. Sci. Technol. 2015, 28, 024006. [Google Scholar] [CrossRef]
- Dadras, S.; Ghavamipour, M. Investigation of the properties of carbon-base nanostructures doped YBa2Cu3O7-δ high temperature superconductor. Physica B 2016, 484, 13–17. [Google Scholar] [CrossRef]
- Horide, T.; Taguchi, K.; Matsumoto, K.; Matsukida, N.; Ishimaru, M.; Mele, P.; Kita, R. Influence of matching field on critical current density and irreversibility temperature in YBa2Cu3O7 films with BaMO3 (M=Zr, Sn, Hf) nanorods. Appl. Phys. Lett. 2016, 108, 082601. [Google Scholar] [CrossRef]
- Hapipi, N.M.; Shaari, A.H.; Kechik, M.M.A.; Ban, T.K.; Abd-Shukor, R.; Suib, N.R.M.; Kien, C.S. Effect of Heat Treatment Condition on the Phase Formation of YBa2Cu3O7-δ Superconductor. Solid State Phenom. 2017, 268, 305–310. [Google Scholar] [CrossRef]
- Louail, L.; Maouche, D.; Roumili, A.; Sahraoui, F.A. Calculation of elastic constants of 4d transition metals. Mater. Lett. 2004, 58, 2975–2978. [Google Scholar] [CrossRef]
- Blochl, P.E. Projector augmented-wave method. Phys. Rev. B 1994, 50, 17953. [Google Scholar] [CrossRef] [PubMed]
- Kresse, G.; Joubert, D. From ultrasoft pseudopotentials to the projector augmented wave method. Phys. Rev. B 1999, 59, 1758. [Google Scholar] [CrossRef]
- Kresse, G.; Hafner, J. Ab initio molecular dynamics for open-shell transition metals. Phys. Rev. B 1993, 48, 13115. [Google Scholar] [CrossRef]
- Kresse, G.; Furthmller, J. Efficiency of ab-initio total energy calculations for metals and semiconductors using a plane-wave basis set. Comput. Mater. Sci. 1996, 6, 15–50. [Google Scholar] [CrossRef]
- Kresse, G.; Furthmller, J. Efficient iterative schemes for ab initio total-energy calculations using a plane-wave basis set. Phys. Rev. B 1996, 54, 11169. [Google Scholar] [CrossRef]
- Perdew, J.P.; Burke, K.; Ernzerhof, M. Ernzerhof, M. Generalized gradient approximation made simple. Phys. Rev. Lett. 1996, 77, 3865. [Google Scholar] [CrossRef]
- Monkhorst, H.J.; Pack, J.D. Special points for Brillouin-zone integrations. Phys. Rev. B 1976, 13, 5188. [Google Scholar] [CrossRef]
- Liu, L.L.; Xu, G.; Wang, A.R.; Wu, X.Z.; Wang, R. First-principles investigations on structure stability, elastic properties, anisotropy and Debye temperature of tetragonal LiFeAs and NaFeAs under pressure. J. Phys. Chem. Solids 2017, 104, 243–251. [Google Scholar] [CrossRef]
- Voigt, W. Lehrbuch der Kristallphysik; Teubner: Stuttgart, Germany, 1928. [Google Scholar]
- Reuss, A.; Angew, Z. Berechnung del fliessgrenze von mischkritallen auf grund der plastizitatbedingung for einkristalle. Math. Mech. 1929, 9, 49. [Google Scholar]
- Liu, L.L.; Wu, X.Z.; Wang, R.; Nie, X.F.; He, Y.L.; Zou, X. First-Principles Investigations on Structural and Elastic Properties of Orthorhombic TiAl under Pressure. Crystals 2017, 7, 111. [Google Scholar] [CrossRef]
- Hill, R. The elastic behaviour of a crystalline aggregate. Proc. Phys. Soc. A 1953, 65, 349. [Google Scholar] [CrossRef]
- Beno, M.A.; Soderholm, L.; Capone, D.W.; Hinks, D.G.; Jorgensen, J.D.; Grace, J.D.; Schuiler, I.K.; Segre, C.U.; Zhang, K. Structure of the single-phase high-temperature superconductor YBa2Cu3O7-δ. Appl. Phys. Lett. 1987, 51, 57–59. [Google Scholar] [CrossRef]
- Cava, R.J.; Batlogg, B.; vanDover, R.B.; Murphy, D.W.; Sunshine, S.; Siegrist, T.; Remeika, J.P.; Reitman, E.A.; Zahurak, S.; Espinosa, G.P. Bulk Superconductivity at 91 K in Single-Phase Oxygen-Deficient Perovskite Ba2YCu3O9-δ. Phys. Rev. Lett. 1987, 58, 1676. [Google Scholar] [CrossRef]
- Lei, M.; Sarrao, J.L.; Visscher, W.M.; Bell, T.M.; Thompson, J.D.; Migliori, A. Elastic constants of a monocrystal of superconducting YBa2Cu3O7- delta. Phys. Rev. B 1993, 47, 6154. [Google Scholar] [CrossRef]
- Sin’ko, G.V.; Smirnov, N.A. Ab initio calculations of elastic constants and thermodynamic properties of bcc, fcc, and hcp Al crystals under pressure. J. Phys. Condens. Matter 2002, 14, 6989. [Google Scholar]
- Pugh, S.F. Relations between the elastic moduli and the plastic properties of polycrystalline pure metals. Philos. Mag. 1954, 45, 823–843. [Google Scholar] [CrossRef]
- Tvergaard, V.; Hutchinson, J.W. Microcracking in Ceramics Induced by Thermal Expansion or Elastic Anisotropy. J. Am. Ceram. Soc. 1988, 71, 157–166. [Google Scholar] [CrossRef]
- Ravindran, P.; Fast, L.; Korzhavyi, P.A.; Johansson, B.; Wills, J.; Eriksson, O. Density functional theory for calculation of elastic properties of orthorhombic crystals: Application to TiSi2. J. Appl. Phys. 1998, 84, 4891–4904. [Google Scholar] [CrossRef]
- Miao, N.X.; Pu, C.Y.; He, C.Z.; Zhang, F.W.; Lu, C.; Lu, Z.W.; Zhou, D.W. Mechanical and thermodynamic properties of the monoclinic and orthorhombic phases of SiC2N4 under high pressure from first principles. Chin. Phys. B 2014, 23, 127101. [Google Scholar] [CrossRef]
- Chung, D.H.; Buessem, W.R. The elastic anisotropy of crystals. J. Appl. Phys. 1967, 38, 2010–2012. [Google Scholar] [CrossRef]
- Wei, Q.; Zhang, M.G.; Guo, L.X.; Yan, H.Y.; Zhu, X.M.; Lin, Z.Z.; Guo, P. Ab initio studies of novel carbon nitride phase C2N2(CH2). Chem. Phys. 2013, 415, 36–43. [Google Scholar] [CrossRef]
- Nye, J.F. Physical Properties of Crystals: Their Representation by Tensors and Matrices; Oxford University Press: New Youk, NY, USA, 1985. [Google Scholar]
- Anderson, O.L. A simplified method for calculation the debye temperature from elastic constants. J. Phys. Chem. Solids 1963, 24, 909–917. [Google Scholar] [CrossRef]
- Schreiber, E.; Anderson, O.L.; Soga, N. Elastic Constants and Their Measurements; Mc-Graw: New York, NY, USA, 1973. [Google Scholar]
- Inderhees, S.; Salamon, M.; Friedmann, T.; Ginsberg, D.M. Measurement of the specific-heat anomaly at the superconducting transition of YBa2Cu3O7-δ. Phys. Rev. B 1987, 36, 2401. [Google Scholar] [CrossRef]
- Liu, B.; Wang, J.Y.; Li, F.Z.; Zhou, Y.C. Theoretical elastic stiffness, structural stability and thermal conductivity of La2Ta2O7 (T=Ge, Ti, Sn, Zr, Hf) pyrochlore. Acta Mater. 2010, 58, 4369–4377. [Google Scholar] [CrossRef]
Figure 1.
The conventional unit cell of YBaCuO.

Figure 2.
Pressure-dependent normalized parameters , , , and of YBaCuO.

Figure 3.
The pressure dependence of (a) bulk modulus B and shear modulus G and (b) the quotient of shear to bulk modulus and Poisson’s ratio for YBaCuO.
Figure 3.
The pressure dependence of (a) bulk modulus B and shear modulus G and (b) the quotient of shear to bulk modulus and Poisson’s ratio for YBaCuO.

Figure 4.
Anisotropic factors (a) , , and and (b) and of YBaCuO as a function of pressure.

Figure 5.
Directional dependence of Young’s modulus in YBa2Cu3O7 at (a) 0 GPa, (b) 50 GPa and (c) 100 GPa, respectively.
Figure 5.
Directional dependence of Young’s modulus in YBa2Cu3O7 at (a) 0 GPa, (b) 50 GPa and (c) 100 GPa, respectively.

Figure 6.
The projections of Young’s modulus in the (100) (a), (010) (b), (001) (c), and (10) (d) planes under different pressures for YBaCuO.
Figure 6.
The projections of Young’s modulus in the (100) (a), (010) (b), (001) (c), and (10) (d) planes under different pressures for YBaCuO.


Table 1.
The relationship between the Lagrangian strain and the corresponding coefficient.
| Strain Type | |||||
|---|---|---|---|---|---|
| = (, 0, 0, 0, 0, 0) | |||||
| = (0, , 0, 0, 0, 0) | |||||
| = (0, 0, , 0, 0, 0) | |||||
| = (, , 0, 0, 0, 0) | + + 2 | ||||
| = (, 0, , 0, 0, 0) | + + 2 | ||||
| = (0, , , 0, 0, 0) | + + 2 | ||||
| = (, 0, 0, 2, 0, 0) | + 4 | ||||
| = (, 0, 0, 0, 2, 0) | + 4 | ||||
| = (, 0, 0, 0, 0, 2) | + 4 |
Table 2.
Calculated lattice parameters (a, b, c in Å) and primitive cell volume (V in Å) of YBaCuO under pressure up to 100 GPa.
Table 2.
Calculated lattice parameters (a, b, c in Å) and primitive cell volume (V in Å) of YBaCuO under pressure up to 100 GPa.
| P | a | b | c | V |
|---|---|---|---|---|
| 0 | 3.853 | 3.936 | 11.822 | 179.266 |
| 10 | 3.781 | 3.866 | 11.362 | 166.072 |
| 20 | 3.727 | 3.809 | 11.057 | 157.016 |
| 30 | 3.688 | 3.763 | 10.802 | 149.923 |
| 40 | 3.659 | 3.723 | 10.575 | 144.047 |
| 50 | 3.635 | 3.689 | 10.367 | 138.996 |
| 60 | 3.614 | 3.658 | 10.183 | 134.627 |
| 70 | 3.593 | 3.631 | 10.028 | 130.839 |
| 80 | 3.574 | 3.605 | 9.898 | 127.517 |
| 90 | 3.555 | 3.581 | 9.785 | 124.563 |
| 100 | 3.538 | 3.558 | 9.685 | 121.904 |
Table 3.
Calculated elastic constants (GPa) of YBaCuO under pressure up to 100 GPa.
| Pressure | |||||||||
|---|---|---|---|---|---|---|---|---|---|
| 0 | 223.94 | 103.59 | 54.34 | 233.04 | 66.76 | 200.46 | 55.83 | 47.77 | 81.49 |
| 10 | 294.84 | 139.59 | 88.79 | 307.70 | 94.57 | 273.90 | 68.35 | 64.87 | 98.58 |
| 20 | 358.75 | 170.78 | 121.11 | 382.88 | 117.58 | 341.29 | 78.54 | 79.73 | 112.23 |
| 30 | 428.73 | 199.44 | 153.03 | 456.43 | 141.42 | 400.82 | 87.52 | 93.84 | 123.55 |
| 40 | 494.09 | 226.48 | 184.12 | 528.66 | 163.74 | 459.66 | 95.99 | 108.19 | 133.67 |
| 50 | 552.74 | 252.19 | 219.21 | 598.64 | 186.13 | 514.81 | 104.46 | 122.77 | 143.67 |
| 60 | 617.40 | 277.96 | 248.37 | 667.18 | 209.66 | 571.45 | 112.57 | 137.91 | 151.62 |
| 70 | 674.69 | 303.17 | 276.99 | 730.31 | 232.24 | 626.35 | 120.98 | 152.54 | 159.69 |
| 80 | 728.53 | 327.65 | 309.33 | 791.69 | 256.01 | 678.79 | 128.91 | 166.80 | 168.13 |
| 90 | 780.14 | 349.91 | 344.51 | 850.17 | 283.01 | 724.34 | 136.50 | 180.76 | 176.64 |
| 100 | 826.38 | 376.19 | 379.47 | 903.90 | 310.53 | 769.85 | 143.76 | 194.39 | 185.41 |
Table 4.
Calculated shear (), longitudinal (), average () elastic wave velocities (in m/s), Debye temperature ( in K), and minimum thermal conductivities ( in W·m·K) of YBaCuO under pressure up to 100 GPa.
Table 4.
Calculated shear (), longitudinal (), average () elastic wave velocities (in m/s), Debye temperature ( in K), and minimum thermal conductivities ( in W·m·K) of YBaCuO under pressure up to 100 GPa.
| P | |||||
|---|---|---|---|---|---|
| 0 | 3228.44 | 5798.32 | 3595.06 | 446.34 | 0.863 |
| 10 | 3502.94 | 6449.29 | 3908.16 | 497.73 | 0.987 |
| 20 | 3715.82 | 6946.87 | 4150.29 | 538.54 | 1.088 |
| 30 | 3892.51 | 7367.73 | 4351.39 | 573.40 | 1.177 |
| 40 | 4046.44 | 7728.82 | 4526.25 | 604.44 | 1.257 |
| 50 | 4175.20 | 8043.70 | 4672.93 | 631.51 | 1.329 |
| 60 | 4300.36 | 8336.01 | 4814.94 | 657.66 | 1.399 |
| 70 | 4409.75 | 8591.27 | 4939.00 | 681.06 | 1.463 |
| 80 | 4504.43 | 8828.15 | 5046.94 | 701.93 | 1.521 |
| 90 | 4583.45 | 9043.12 | 5137.59 | 720.15 | 1.572 |
| 100 | 4659.65 | 9241.51 | 5214.12 | 736.15 | 1.619 |
© 2019 by the authors. Licensee MDPI, Basel, Switzerland. This article is an open access article distributed under the terms and conditions of the Creative Commons Attribution (CC BY) license (http://creativecommons.org/licenses/by/4.0/).
Share and Cite
MDPI and ACS Style
Chen, C.; Liu, L.; Wen, Y.; Jiang, Y.; Chen, L. Elastic Properties of Orthorhombic YBa2Cu3O7 under Pressure. Crystals 2019, 9, 497. https://doi.org/10.3390/cryst9100497
AMA Style
Chen C, Liu L, Wen Y, Jiang Y, Chen L. Elastic Properties of Orthorhombic YBa2Cu3O7 under Pressure. Crystals. 2019; 9(10):497. https://doi.org/10.3390/cryst9100497
Chicago/Turabian StyleChen, Cai, Lili Liu, Yufeng Wen, Youchang Jiang, and Liwan Chen. 2019. "Elastic Properties of Orthorhombic YBa2Cu3O7 under Pressure" Crystals 9, no. 10: 497. https://doi.org/10.3390/cryst9100497
Note that from the first issue of 2016, this journal uses article numbers instead of page numbers. See further details here.