Thermal Cyclic Properties of Ti-Pd-Pt-Zr High-Temperature Shape Memory Alloys


1
National Institute for Materials Science (NIMS), Tsukuba, Ibaraki 305-0047, Japan
2
Department of Materials Science and Engineering, Shibaura Institute of Technology, Koto, Tokyo 135-8548, Japan
3
Japan Society for the Promotion of Science, Chiyoda, Tokyo 102-0083, Japan
*
Author to whom correspondence should be addressed.
Crystals 2019, 9(11), 595; https://doi.org/10.3390/cryst9110595
Submission received: 22 October 2019
/
Revised: 11 November 2019
/
Accepted: 12 November 2019
/
Published: 14 November 2019
(This article belongs to the Special Issue Advanced High Temperature Shape Memory Alloys)
Abstract
:In this study, the thermal cyclic properties of Ti-(50−x)Pd-xPt-5Zr alloys (x = 5, 15, 25, at%), comprising B2 and B19 structures in austenite and martensite, were investigated by a thermal cyclic compression test under a constant load of between 15 and 200 MPa. The transformation temperature measured using differential scanning calorimetry increased with increasing Pt concentration. The highest austenite finishing (Af) temperature, 648 °C, was obtained in the Ti-25Pd-25Pt-5Zr alloy. Irrecoverable strain due to thermal cyclic testing was observed during each test, even at a stress of 50 MPa. The work output, calculated as the product of the transformation strain and the applied stress from strain–temperature curves, decreased with increasing Pt concentration. This was because of the lower strength of the austenite phase due to Af increasing with an increase in the concentration of Pt. Although irrecoverable strain was observed with the first thermal cycle test, it decreased after several thermal cyclic tests, which are called training.
1. Introduction
Shape memory alloys (SMAs) are useful materials for actuators. Specifically, Ti-Ni-based SMAs are currently used in temperature-sensitive devices [1]. SMAs are expected to be used at high temperatures, i.e., 200–800 °C, in automotive and aerospace applications to increase the thermal efficiency of engines [2]. The operating temperature of an SMA is related to its martensite transformation temperature (MTT). The highest MTT of Ti-Ni is approximately 60 °C [3], which is insufficiently high for applications greater than 200 °C.
Numerous efforts had been made to raise the MTT by adding alloying elements to Ti-Ni, such as Hf, Zr, Pd, Pt, and Au; these are reviewed in [2]. Recently, the high-temperature SMA, Ni50.3Ti29.7Hf20, has received a lot of attention; it is strengthened by nano-sized precipitates called “H phase” [4,5], and a perfect shape recovery was successfully obtained, even under 500–700 MPa. The austenite finishing temperature Af of Ni50.3Ti29.7Hf20 is typically 166 °C under unloading conditions, but this rises to 300 °C under loading conditions. Furthermore, the strength at 250 °C and the work output are approximately 800 MPa and 20 J/cm3 [6,7,8,9,10]. Even so, the MTT of Ni50.3Ti29.7Hf20 remains below 300 °C. To increase the MTT, another attempt is necessary.
Ti-Ta-based β-Ti alloys have also been investigated as potential high-temperature SMAs [11]. A stable shape recovery was obtained between 100 and 200 °C in Ti-32 at% Ta.
Thus, in our previous study, we focused on Ti-Pd, Ti-Au, and Ti-Pt because they exhibit an MT from a B2 to a B19 structure, and their MTT is greater than 500 °C [12,13]. However, one problem of binary compounds is their low strength in the austenite phase, which results in a poor shape memory effect [14,15,16]. To increase the high-temperature strength of Ti-Pd [17,18], Ti-Au [19,20], and Ti-Pt [21,22,23,24,25], the addition of alloying elements has been attempted; this process is reviewed in [26,27,28]. It was found that an alloying element has some effect at improving the strength of the austenite and martensite phases, resulting in improved shape recovery. However, in most cases, the MTT decreases when alloying elements are added.
In our previous study, Zr and Pd were simultaneously added to Ti-Pt to improve shape recovery and control MTT [29]. The concentration of Zr was limited to 5 at%, and Pt was replaced by Pd in a concentration range of between 5 and 15 at%. The MTT, Af, As (austenite start temperature), Ms (martensite start temperature), and Mf (martensite finishing temperature) of Ti-35Pt-15Pd-5Zr decreased to 804, 725, 713, and 590 °C from 1066, 1047, 1025, and 1012 °C for Ti-50Pt, and 985, 939, 897, and 840 °C for Ti-50Pt-5Zr. However, the MTT of Ti-35Pt-15Pd-5Zr remained over 590 °C. The large irrecoverable strain observed in Ti-50Pt and Ti-50Pt-5Zr was drastically decreased by adding 15 at% Pd, but it was not removed completely. In this study, further addition of Pd to TiPt-5Zr. (i.e., the addition of Pt to Ti-50Pd-5Zr) was attempted. The effect of Pt addition to Ti-50Pd-5Zr on the MTT and shape recovery was investigated.
2. Experimental Procedure
Ingots totaling 18 g with nominal compositions of Ti-45Pd-5Pt-5Zr, Ti-35Pd-15Pt-5Zt, and Ti-25Pd-25Pt-5Zr (at%) were prepared by arc melting in an Ar atmosphere. The purity of elements used for the ingots was 99.5% for Ti, 99.99% for Pd and Pt, and 99.7% for Zr. The alloy ingots were sealed in silica tubes with Ar gas and solution-treated at 1000 °C for 3 h, followed by quenching in iced water. An ingot of Ti-50Pd-5Zr was also prepared as a reference using the same solution treatment to investigate the shape recovery behavior described in the following paragraph.
The microstructures of the solution-treated samples were observed using scanning electron microscopy (SEM) (JEOL 7001F, JEOL, Tokyo, Japan) at an accelerating voltage of 20 kV. The samples were etched using nitrohydrochloric acid after being polished for observation. A phase composition analysis was performed using a field emission electron probe microanalyzer (JSM-6500F, JEOL, Tokyo, Japan) at 15 kV and 5 × 10⁻⁸ A. A LIF was used as an analyzing crystal for Ti and Zr, while a PET was for Pt and Pd.
X-ray diffraction (RINT-TTR III, Rigaku Co., Tokyo, Japan) measurements were conducted for solution-treated samples at room temperature and at 700 °C using CuKα radiation at 50 kV and 300 mA.
Specimens of 4 mm in diameter and 1 mm in height were cut for differential scanning calorimetry (DSC) (DSC3200, NETZSH Japan K.K. Yokohama, Japan) to measure the MTT. The heating and cooling rates were both 10 °C/min.
Specimens of 3 × 3 × 5 mm were cut for thermal cyclic compression tests (Shimadzu AG-X, Shimadzu) to evaluate their shape recovery and work output. A thermocouple was welded on the specimen to measure its temperature. Specimens were heated to 30 °C above Af by induction heating, and then cooled to a temperature lower than Mf under a constant load of between 15 and 200 MPa. Five thermal cycles under 15, 50, 100, 150, and 200 MPa were applied for the same samples (in the order given). The heating and cooling rates were both 50 °C/min. The work output (work per volume) was obtained from the product of recovery strain and applied stress.
The strengths of the austenite and martensite phases were investigated through compression tests for the 3 × 3 × 5 mm specimens. The compression tests were performed at Mf − 30 and Af + 30 °C using 3 × 10⁻³/s as a strain rate.
The martensite variants of the solution-treated and thermally-cycled samples were observed using a TSL electron backscattered diffraction (EBSD) detector attached to the SEM (JEOL 7001F, JEOL) at an accelerating voltage of 25 kV. Post-processing data analyses using the B19 structures of Ti-Pd, whose lattice parameters are a = 0.456 nm, b = 0.281 nm, and c = 0.489 nm, respectively, were conducted in the TSL-orientation imaging microscopy V 7.0 software (TSL solutions, Sagamihara, Japan).
3. Results and Discussion
3.1. Martensite Transformation Temperature
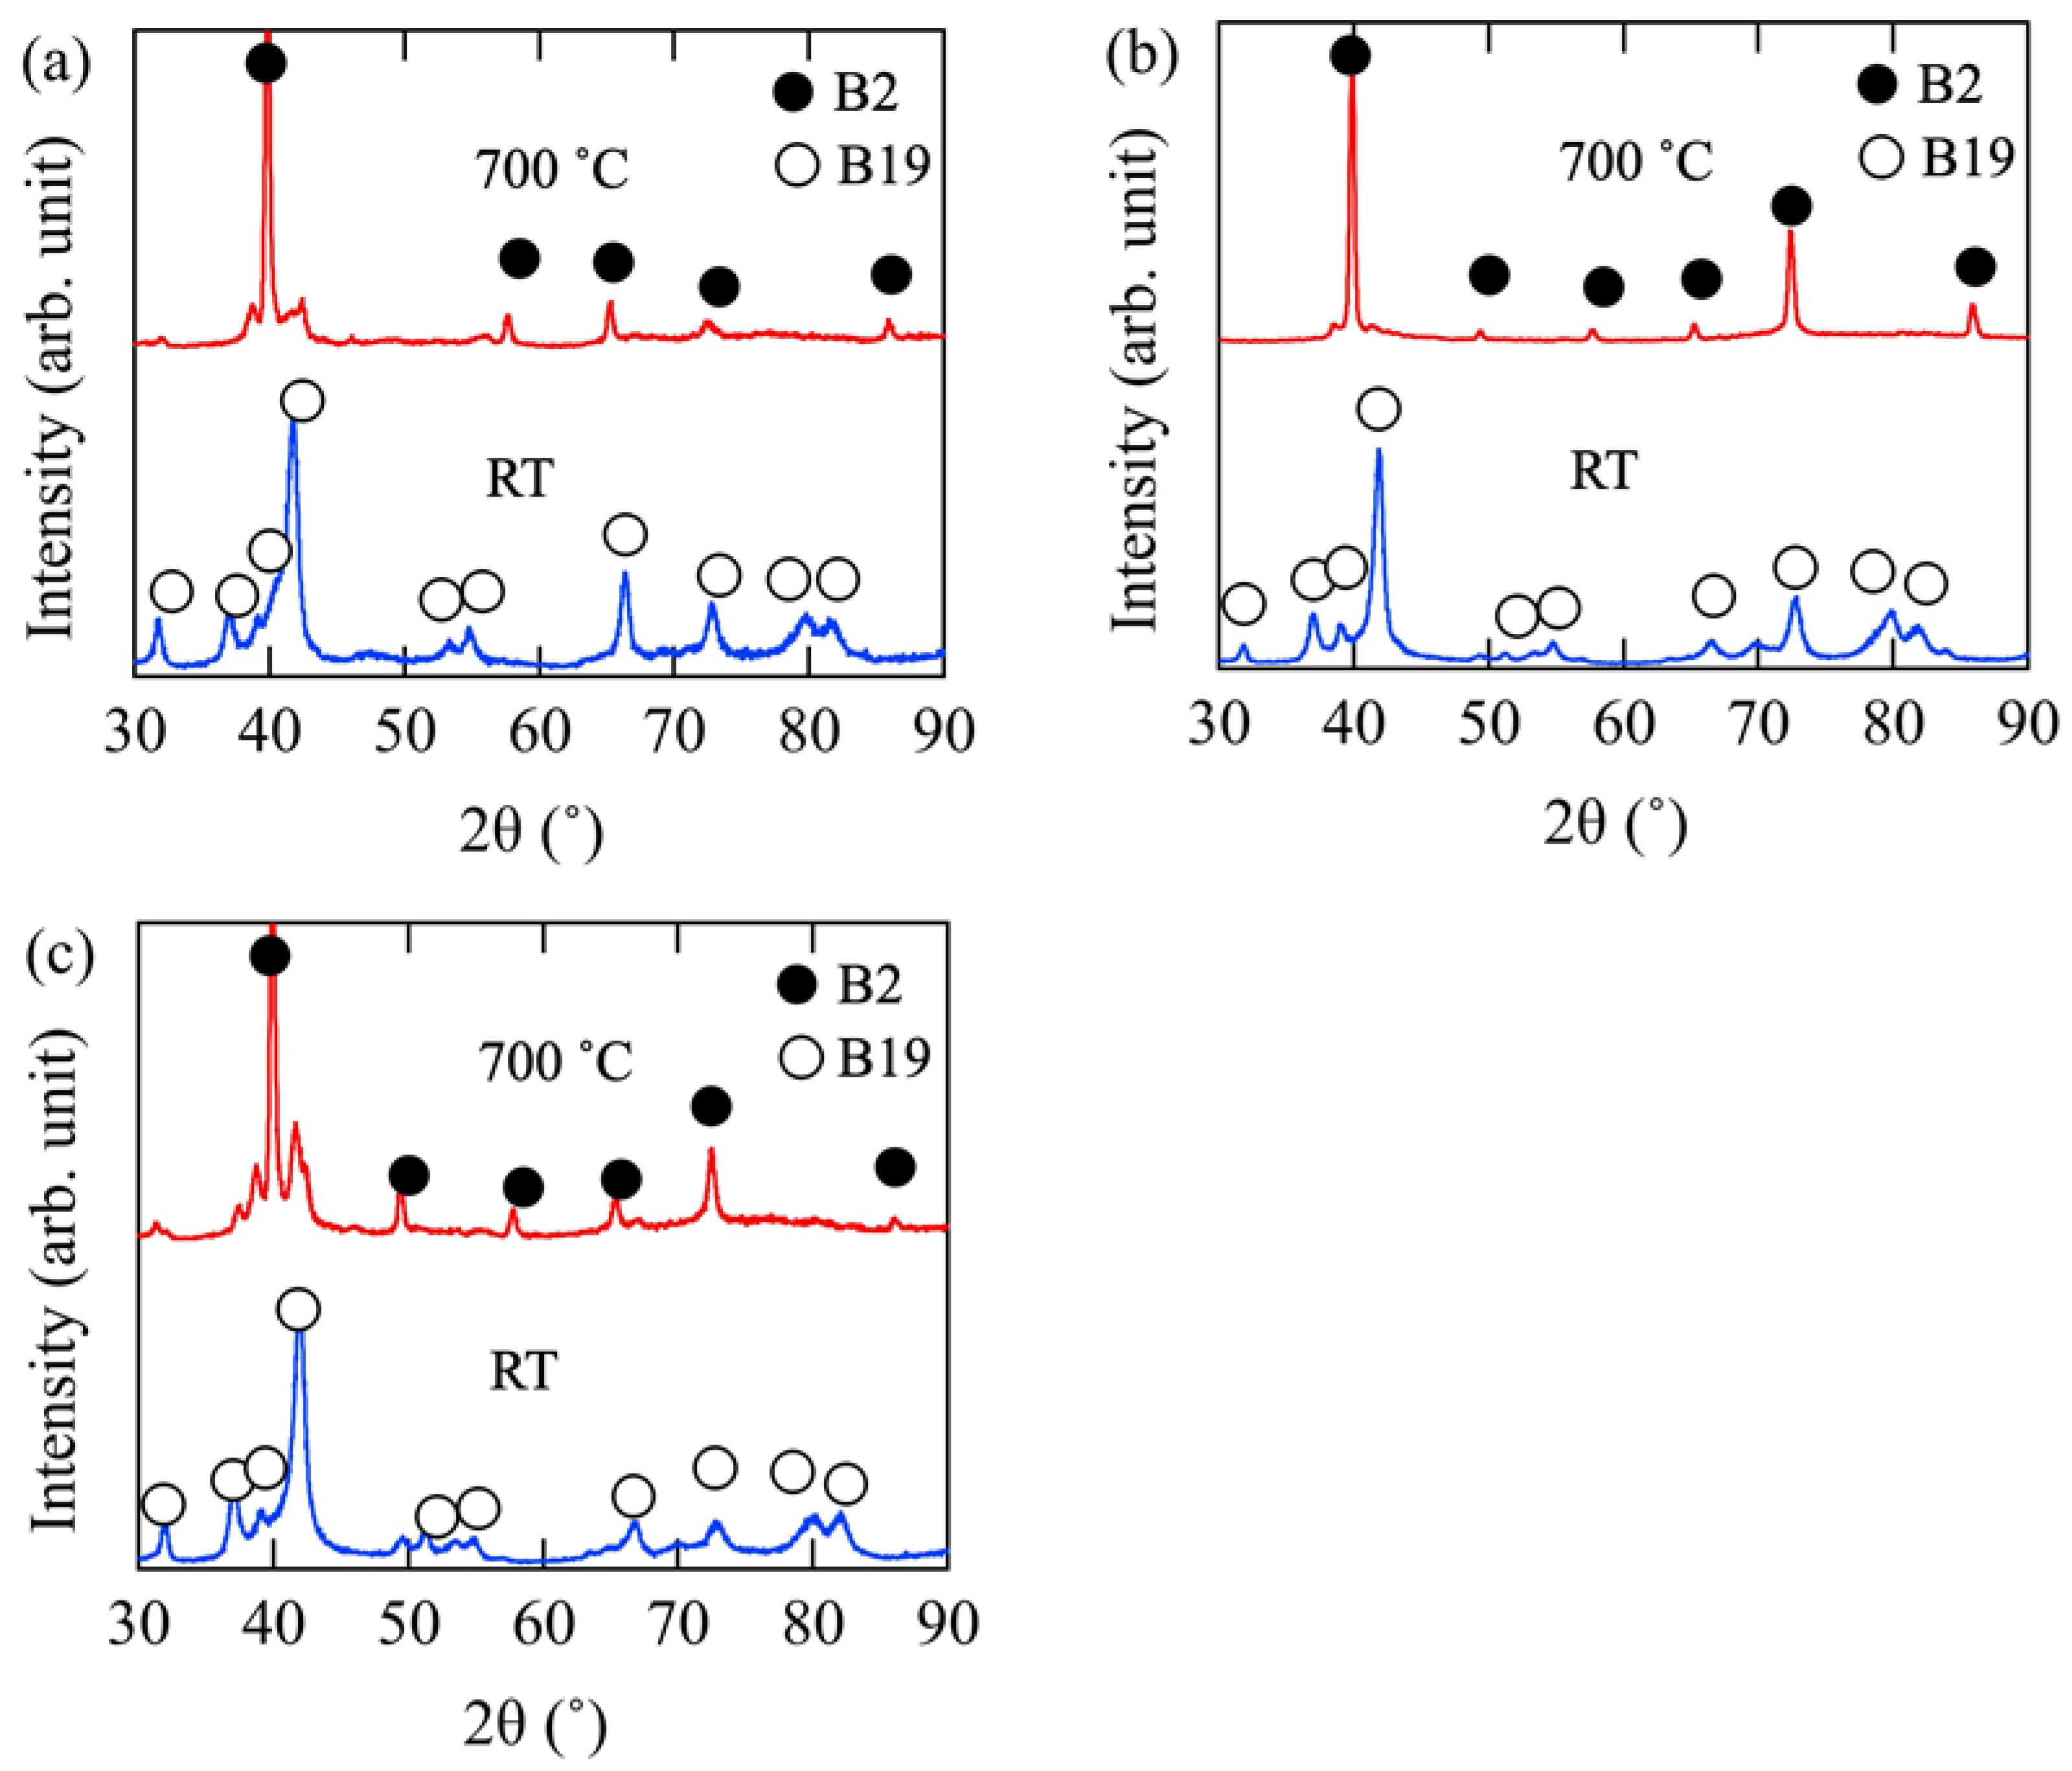
The XRD patterns of Ti-Pd-Pt-Zr at room temperature and at 700 °C are plotted in Figure 1. The B19 and B2 structures were identified for all the tested alloys at room temperature and at 700 °C, respectively, as with Ti-50Pd-5Zr [17], indicating that the MT from the B2 to B19 structures occurred in Ti-Pd-Pt-Zr.
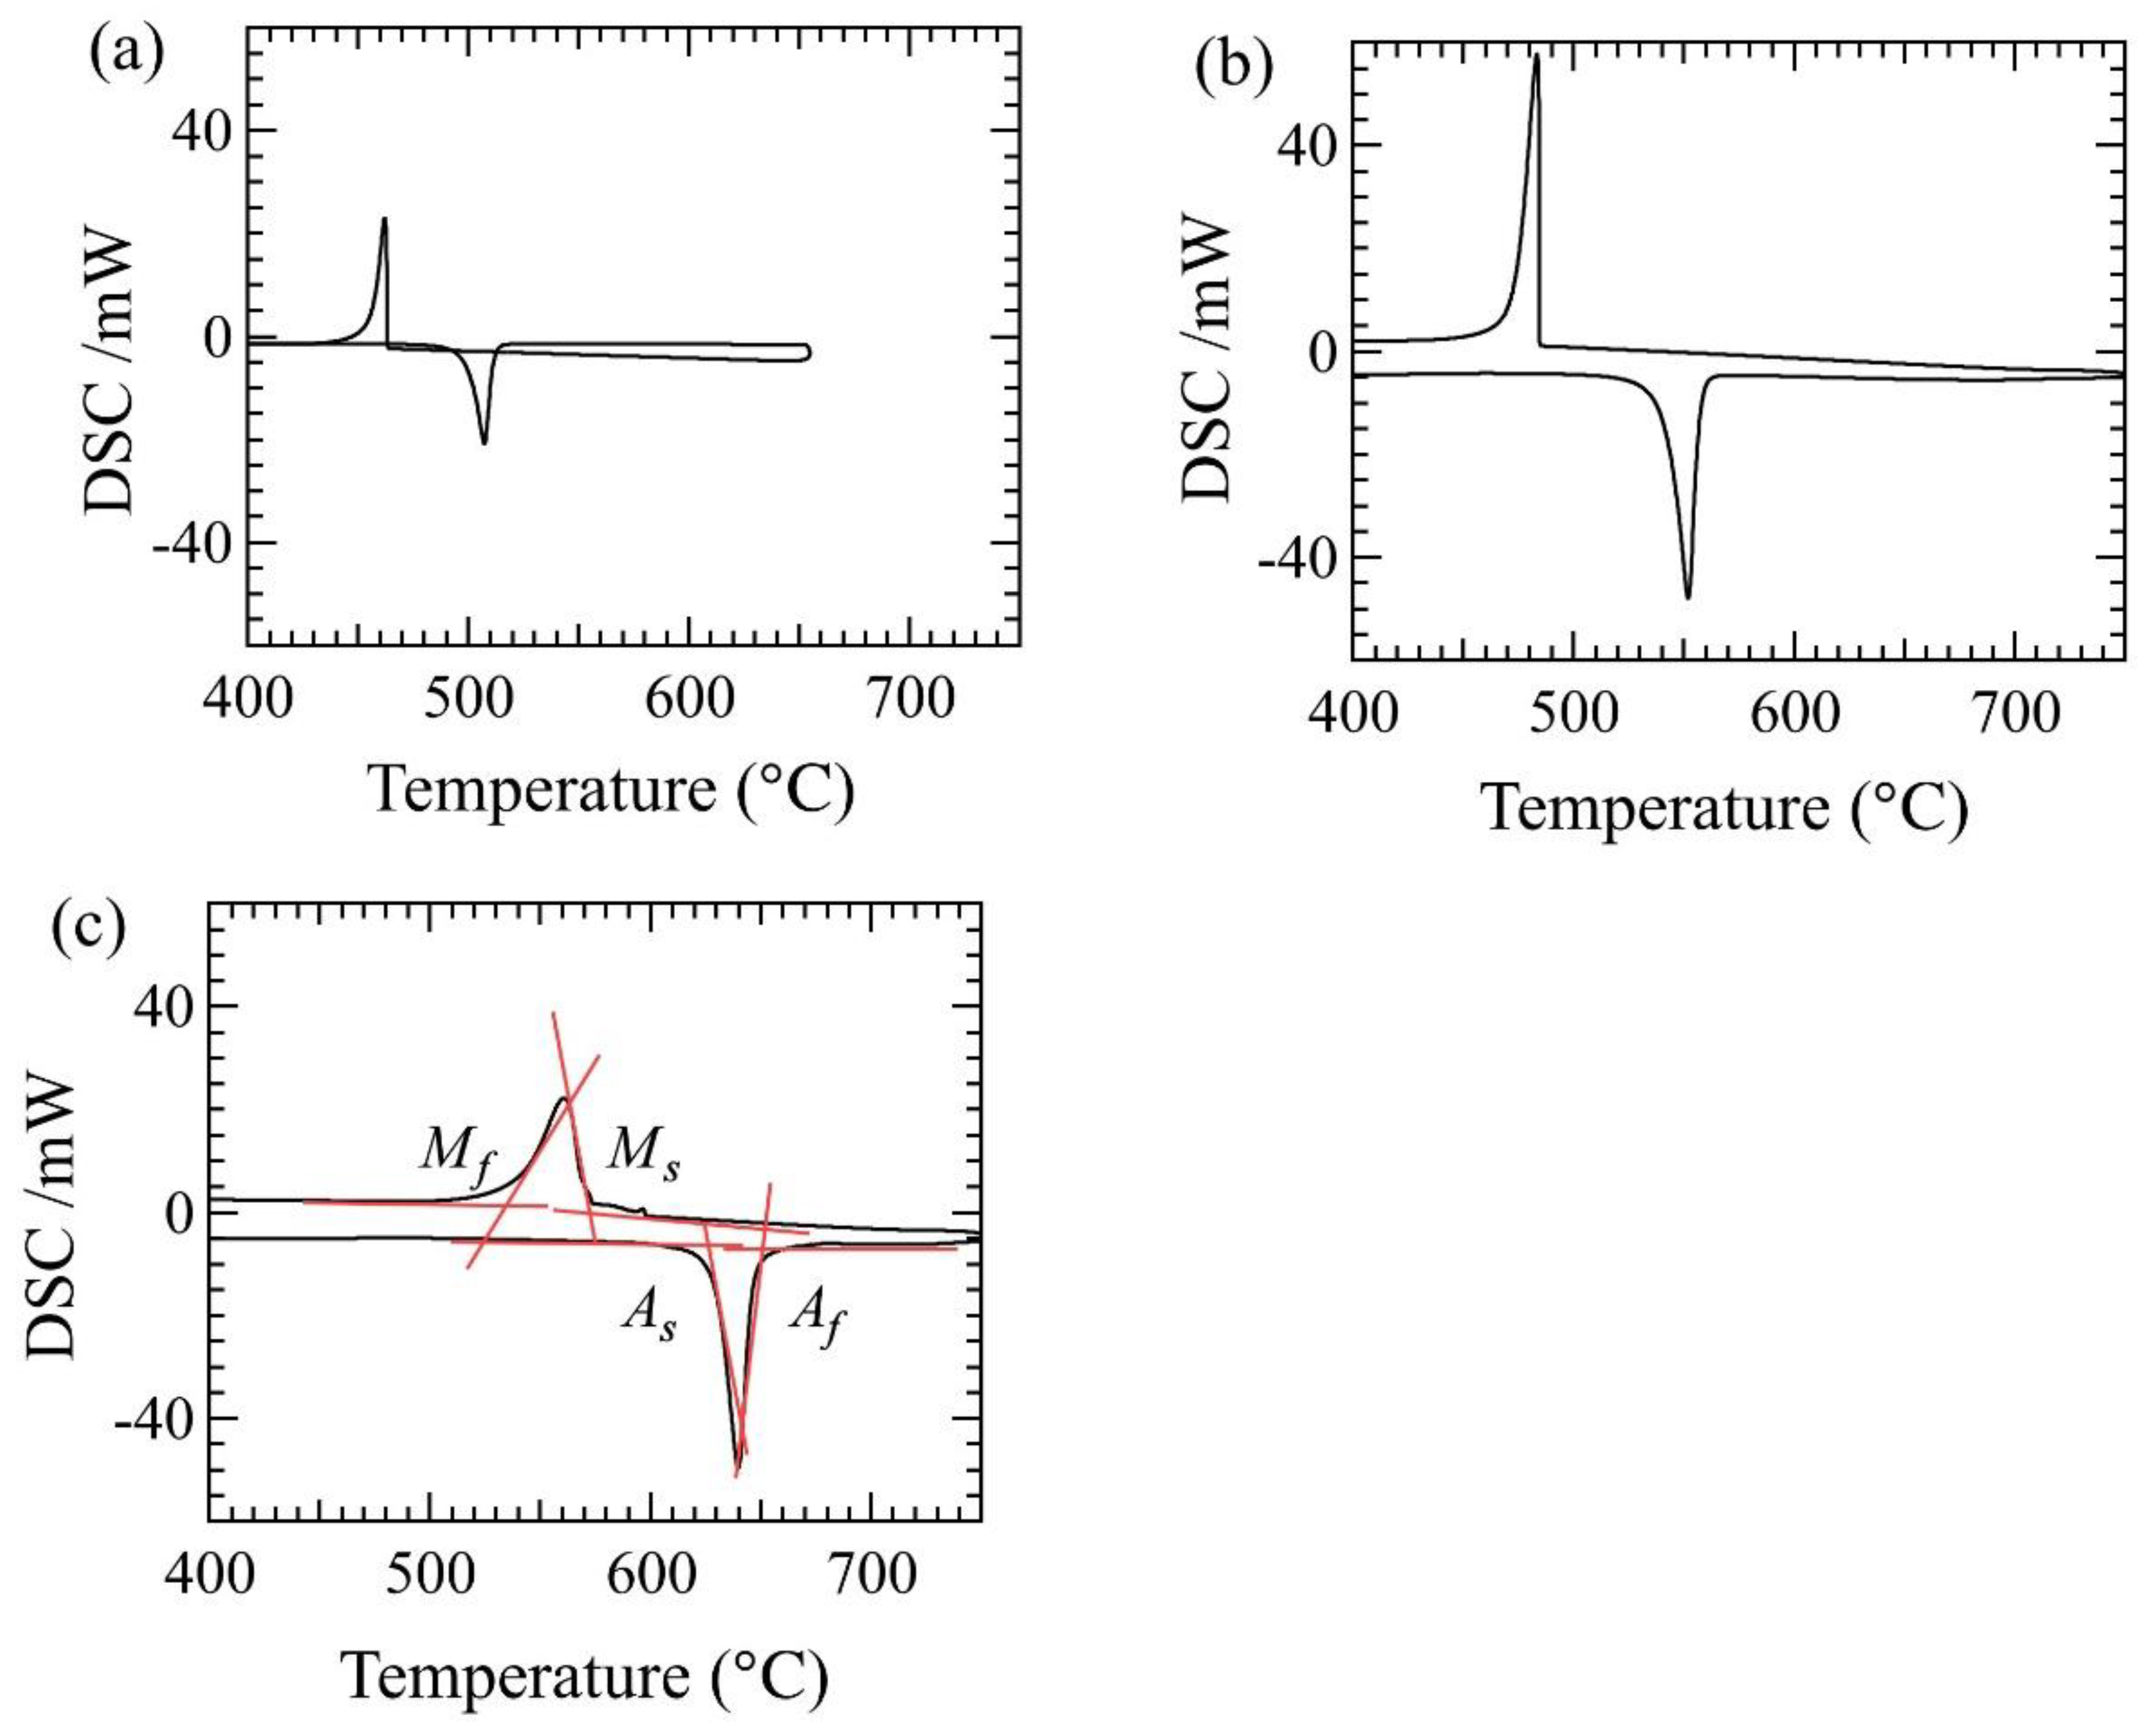
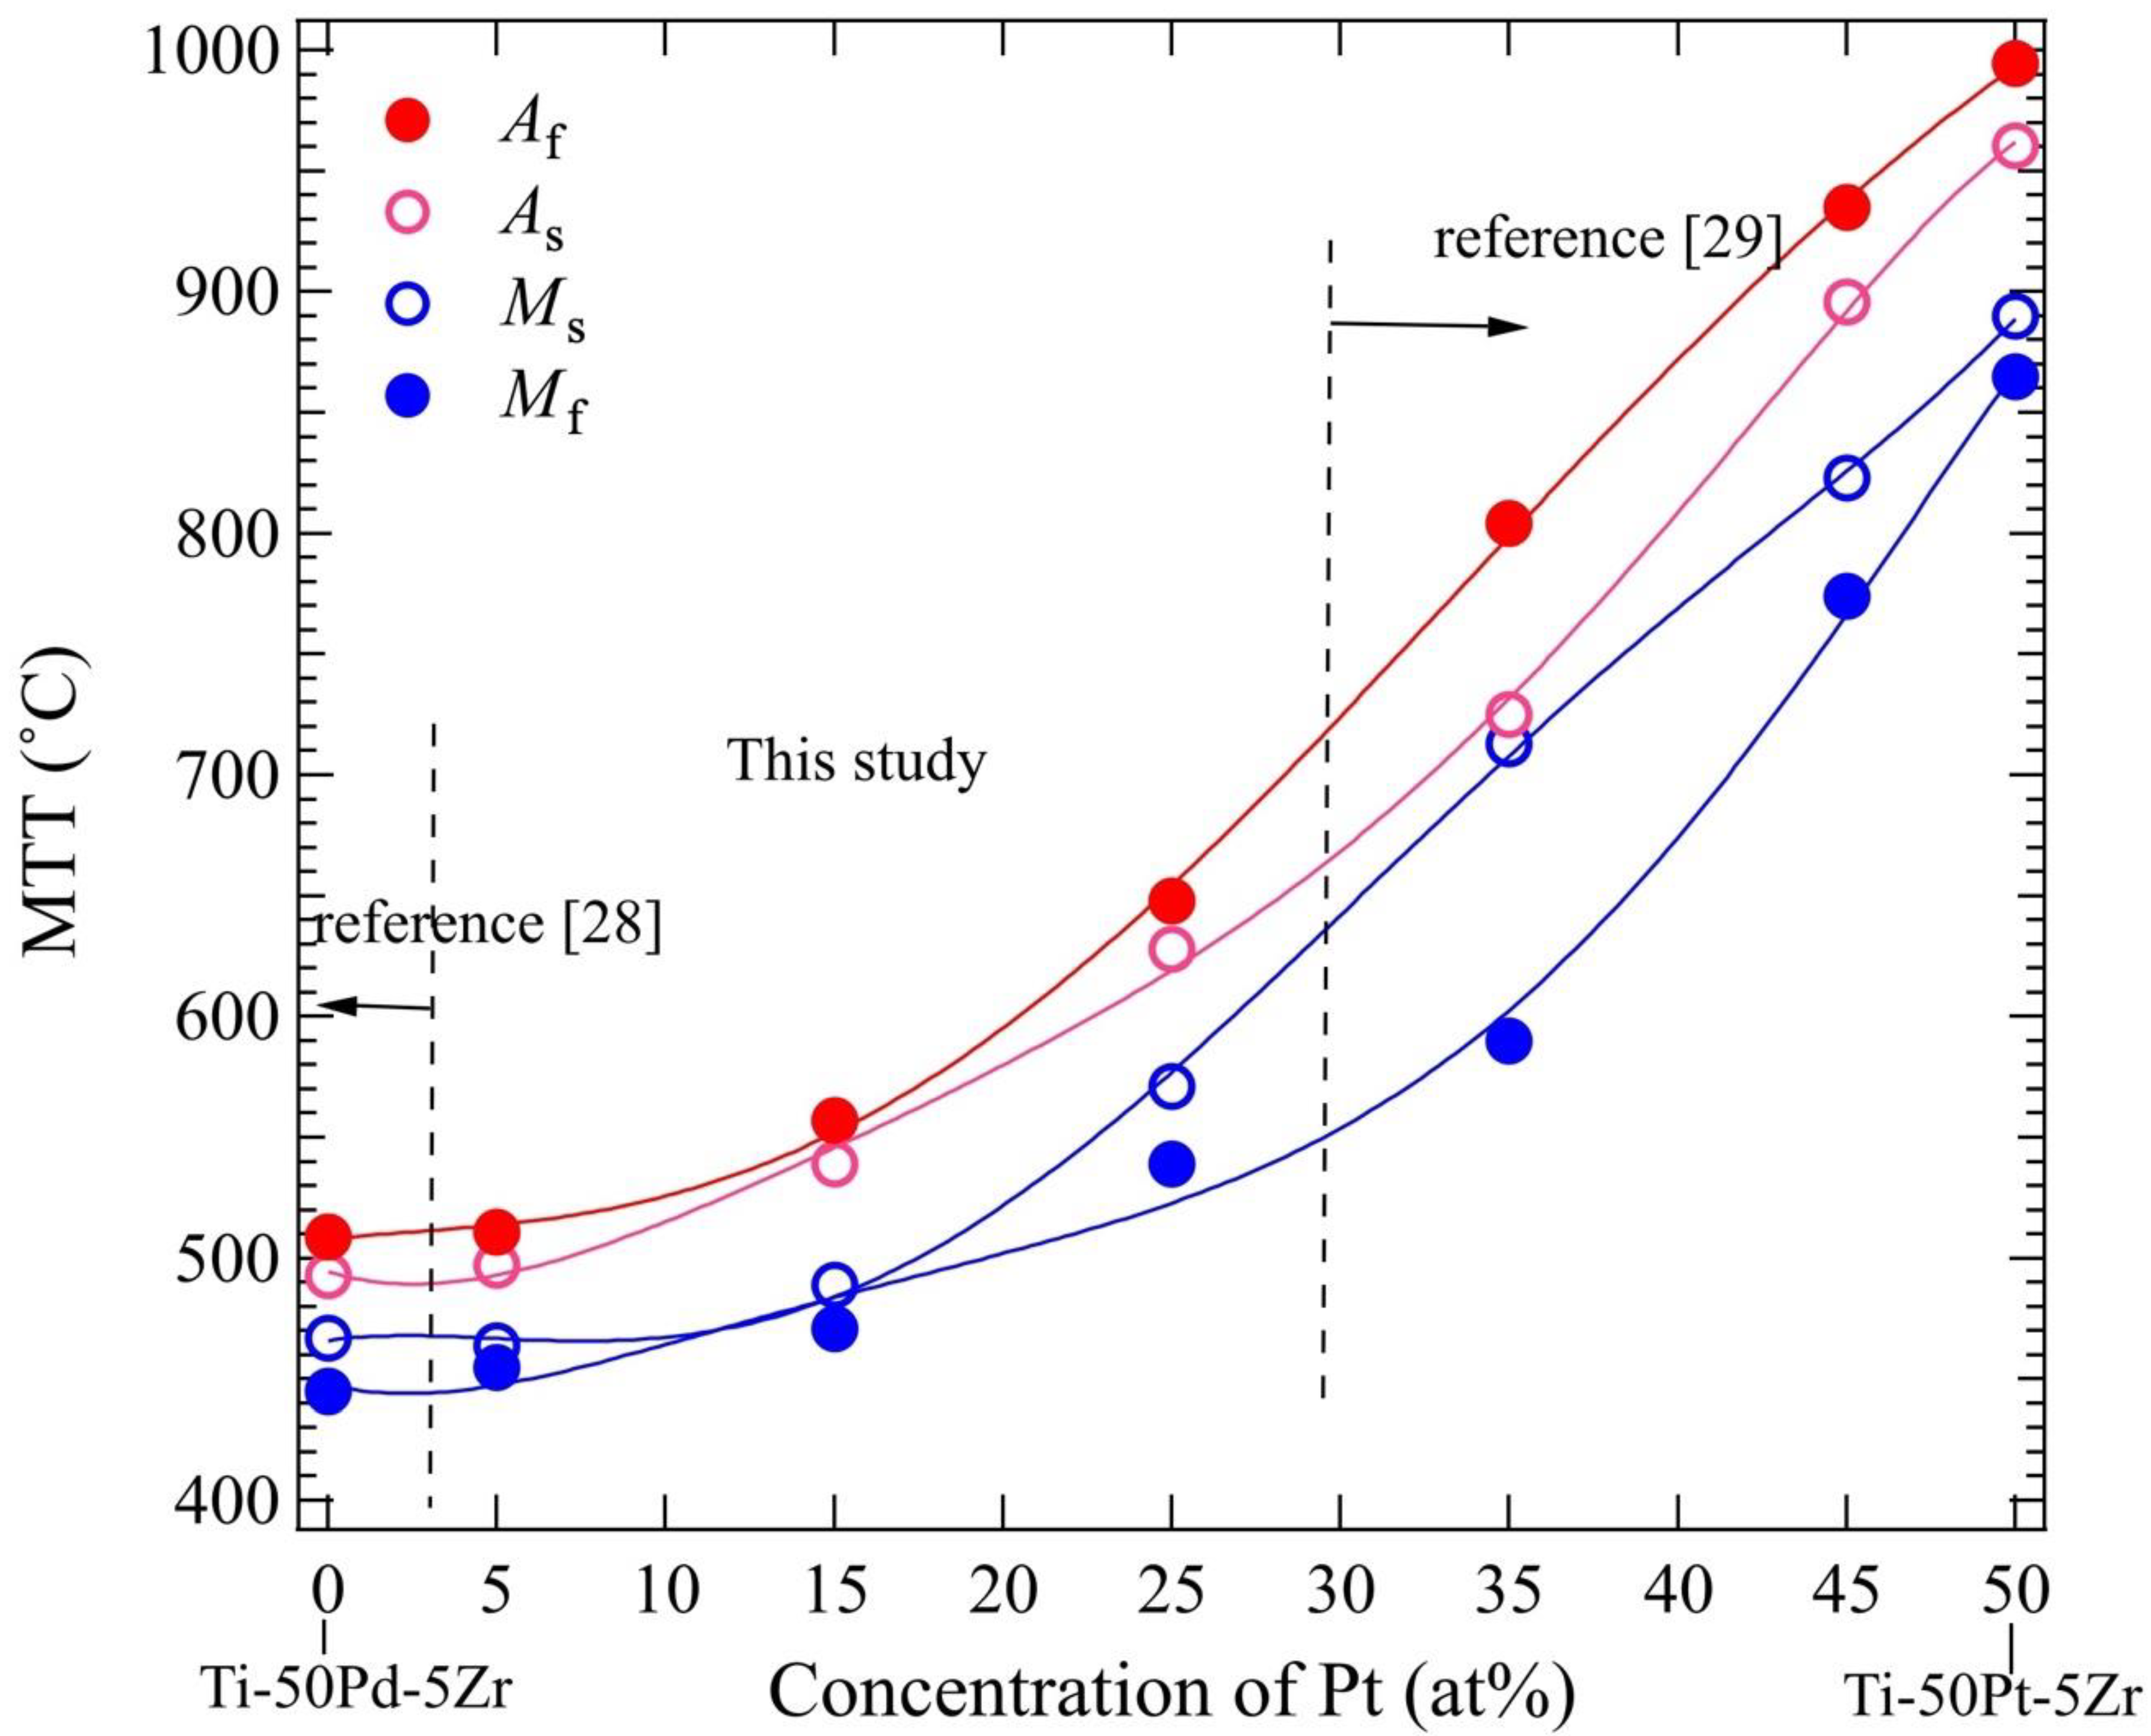
To measure the MTT, a DSC analysis was performed for Ti-Pd-Pt-Zr. Sharp peaks of endothermic and exothermic reactions were clearly observed, as with Ti-50Pd-5Zr [17], indicating the MT as given in Figure 2. The MTT increased with increasing Pt contents. The highest intensity of the DSC peaks was obtained in Ti-35Pd-15Pt-5Zr, and the DSC peaks broadened in Ti-25Pd-25Pt-5Zr. The MTT, As, Af, Ms, and Mf, as measured by DSC, are summarized in Table 1, together with temperature hysteresis between Af and Ms. The MTTs of Ti-50Pd-5Zr are also shown in Table 1 [28]. The changes in MTT with Pt contents are plotted together with those of Ti-50Pd-5Zr [28] and Pt-rich Ti-Pd-Pt-Zr [29] in Figure 3. The MTT gradually increased with increasing the Pt content. The transformation enthalpies of Ti-Pd-Pt-Zr estimated from the DSC curves in Figure 2 were approximately −2800 J/mol, and there was no clear difference among the tested alloys, although there is trend of slightly increasing enthalpy with an increase in the content of Pt. It is reported that the enthalpy of Ti-50.3at%Ni is −1819 J/mol [30]. The enthalpy of Ti-Pd-Pt-Zr was larger than that of Ti-Ni.
The temperature hysteresis between Af and Ms is a critical property for SMAs, because it represents the temperature range that is necessary for shape recovery to occur. A smaller temperature hysteresis induces a faster response of SMAs. The temperature hysteresis of Ti-50Pd-5Zr and Ti-45Pd-5Pt-5Zr was approximately 50 °C, i.e., less than that of TiPd at 56 °C [28]. However, with further addition of Pt, the temperature hysteresis increased to above 70 °C. Because the temperature hysteresis of Ti-Pt was 68 °C [16] and greater than that of Ti-Pd, increasing temperature hysteresis by Pt addition is reasonable.
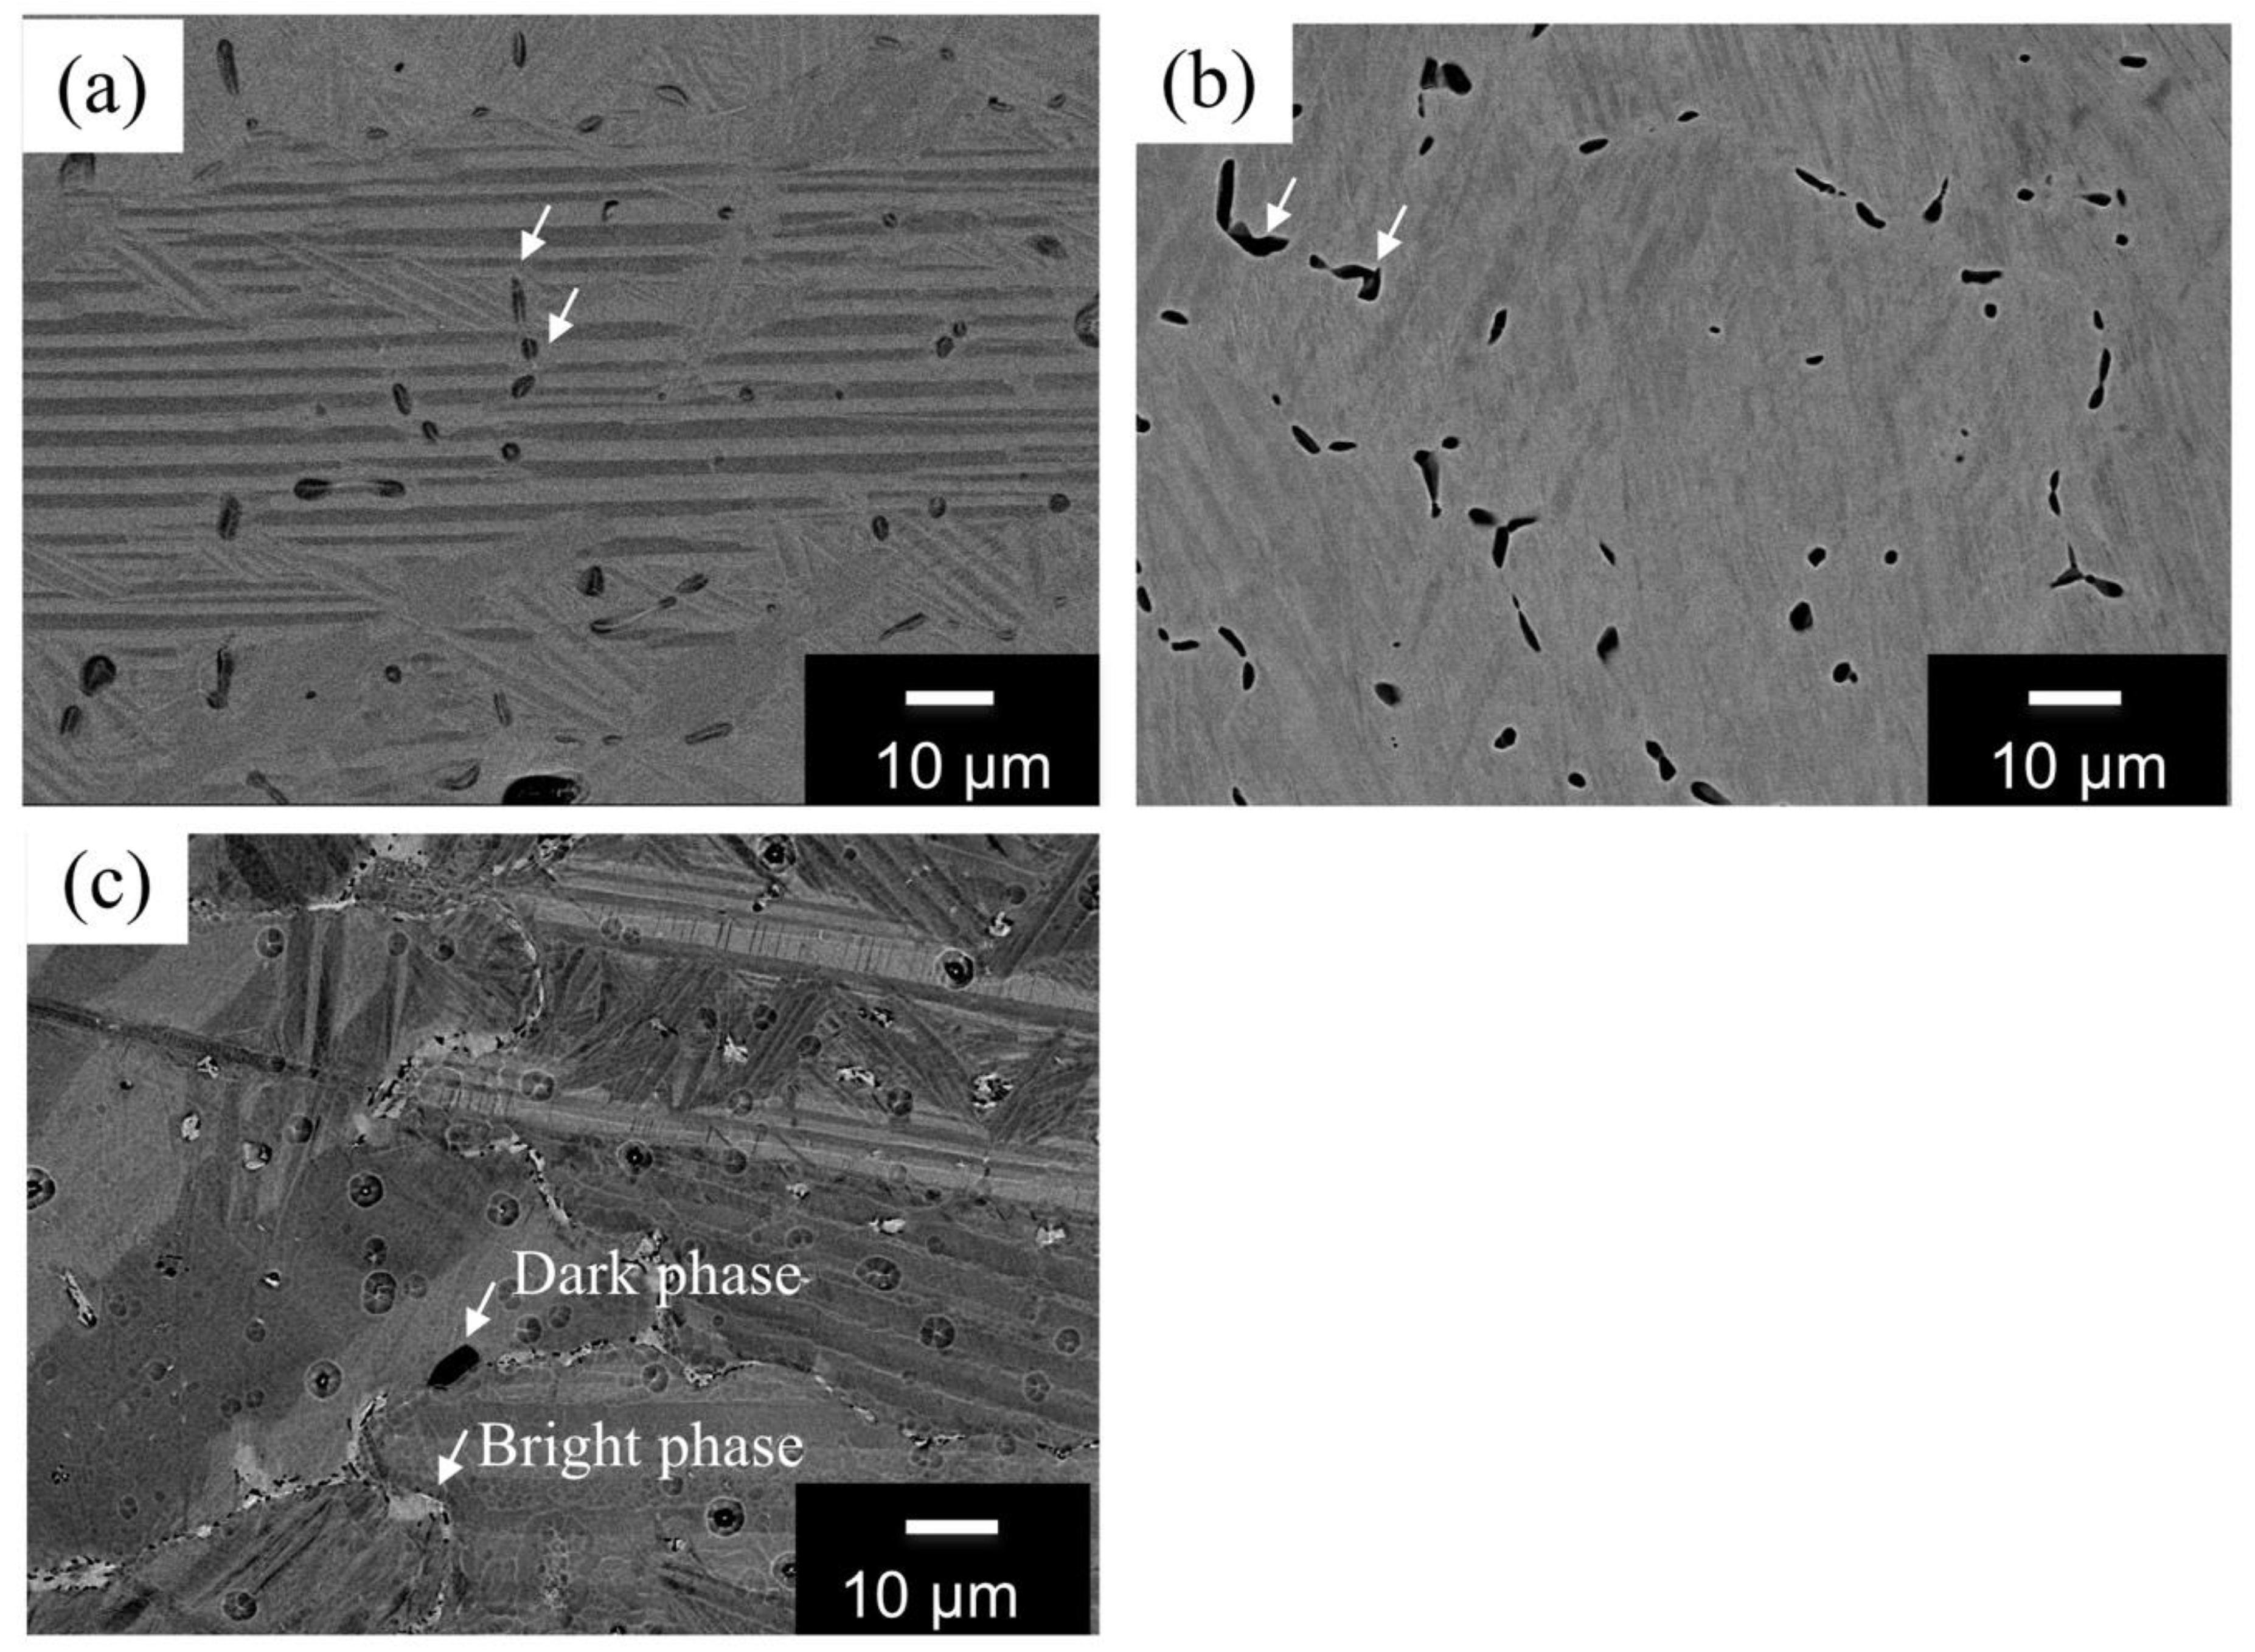
The microstructures of the heat-treated samples at 1000 °C for 168 h followed by ice water quenching were observed by SEM, and are shown in Figure 4. The twin structure obtained by MT was observed in all of the tested Ti-Pd-Pt-Zr, as with Ti-50Pd-5Zr [17]. The results of microstructure observation, DSC measurement, and XRD measurement indicated that MT from the B2 to B19 structures occurred during cooling in Ti-Pd-Pt-Zr. Particles with dark contrast represented by arrows were observed in Ti-45Pd-5Pt-5Zr and Ti-35Pt-15Pt-5Zr, as shown in Figure 4a,b, respectively. The phase composition analysis by EPMA for Ti-Pd-Pt-Zr is presented in Table 2. The dark-contrast phase was identified as Ti2Pd in Ti-45Pd-5Pt-5Zr and Ti-35Pd-15Pt-5Zr because the composition ratio of (Ti + Zr):(Pd + Pt) was approximately 2:1, if we consider that Zr and Pt partitioned to the Ti and Pd sites, respectively. Precipitation of Ti2Pd was also observed in Ti-50Pd-5Zr [17]. In Ti-25Pt-25Pt-5Zr, dark- and bright-contrast phases were observed, as shown in Figure 4c (represented by arrows). The composition ratio of (Ti + Zr):(Pd + Pt) was approximately 3:1 and 5:3 for the dark- and bright-contrast phases, respectively. The dark-contrast phase included a higher amount of Pt compared to that in the dark-contrast phases observed in both Ti-45Pd-5Pt-5Zr and Ti-35Pd-15Pt-5Zr. It was then considered that the dark and bright phases were Ti3Pt and Ti4Pt3, respectively. These second and third phases were not detected in XRD patterns because of the small volume fraction.
3.2. Thermal Cyclic Properties
A thermal cycle test was performed under a constant stress of between 15 and 200 MPa to investigate the shape memory property. First, a sample was placed in the testing machine and 15 MPa was applied in compression mode. Then, the sample was heated to Af + 30 °C and cooled to room temperature or Mf – 30 °C, and again heated to Af + 30 °C. After the first thermal cycle, the applied stress was increased to 50 MPa, and the second cycle test was performed. The applied stress was increased to 100, 150, and 200 MPa. Five thermal cycles were applied in total for the same samples.
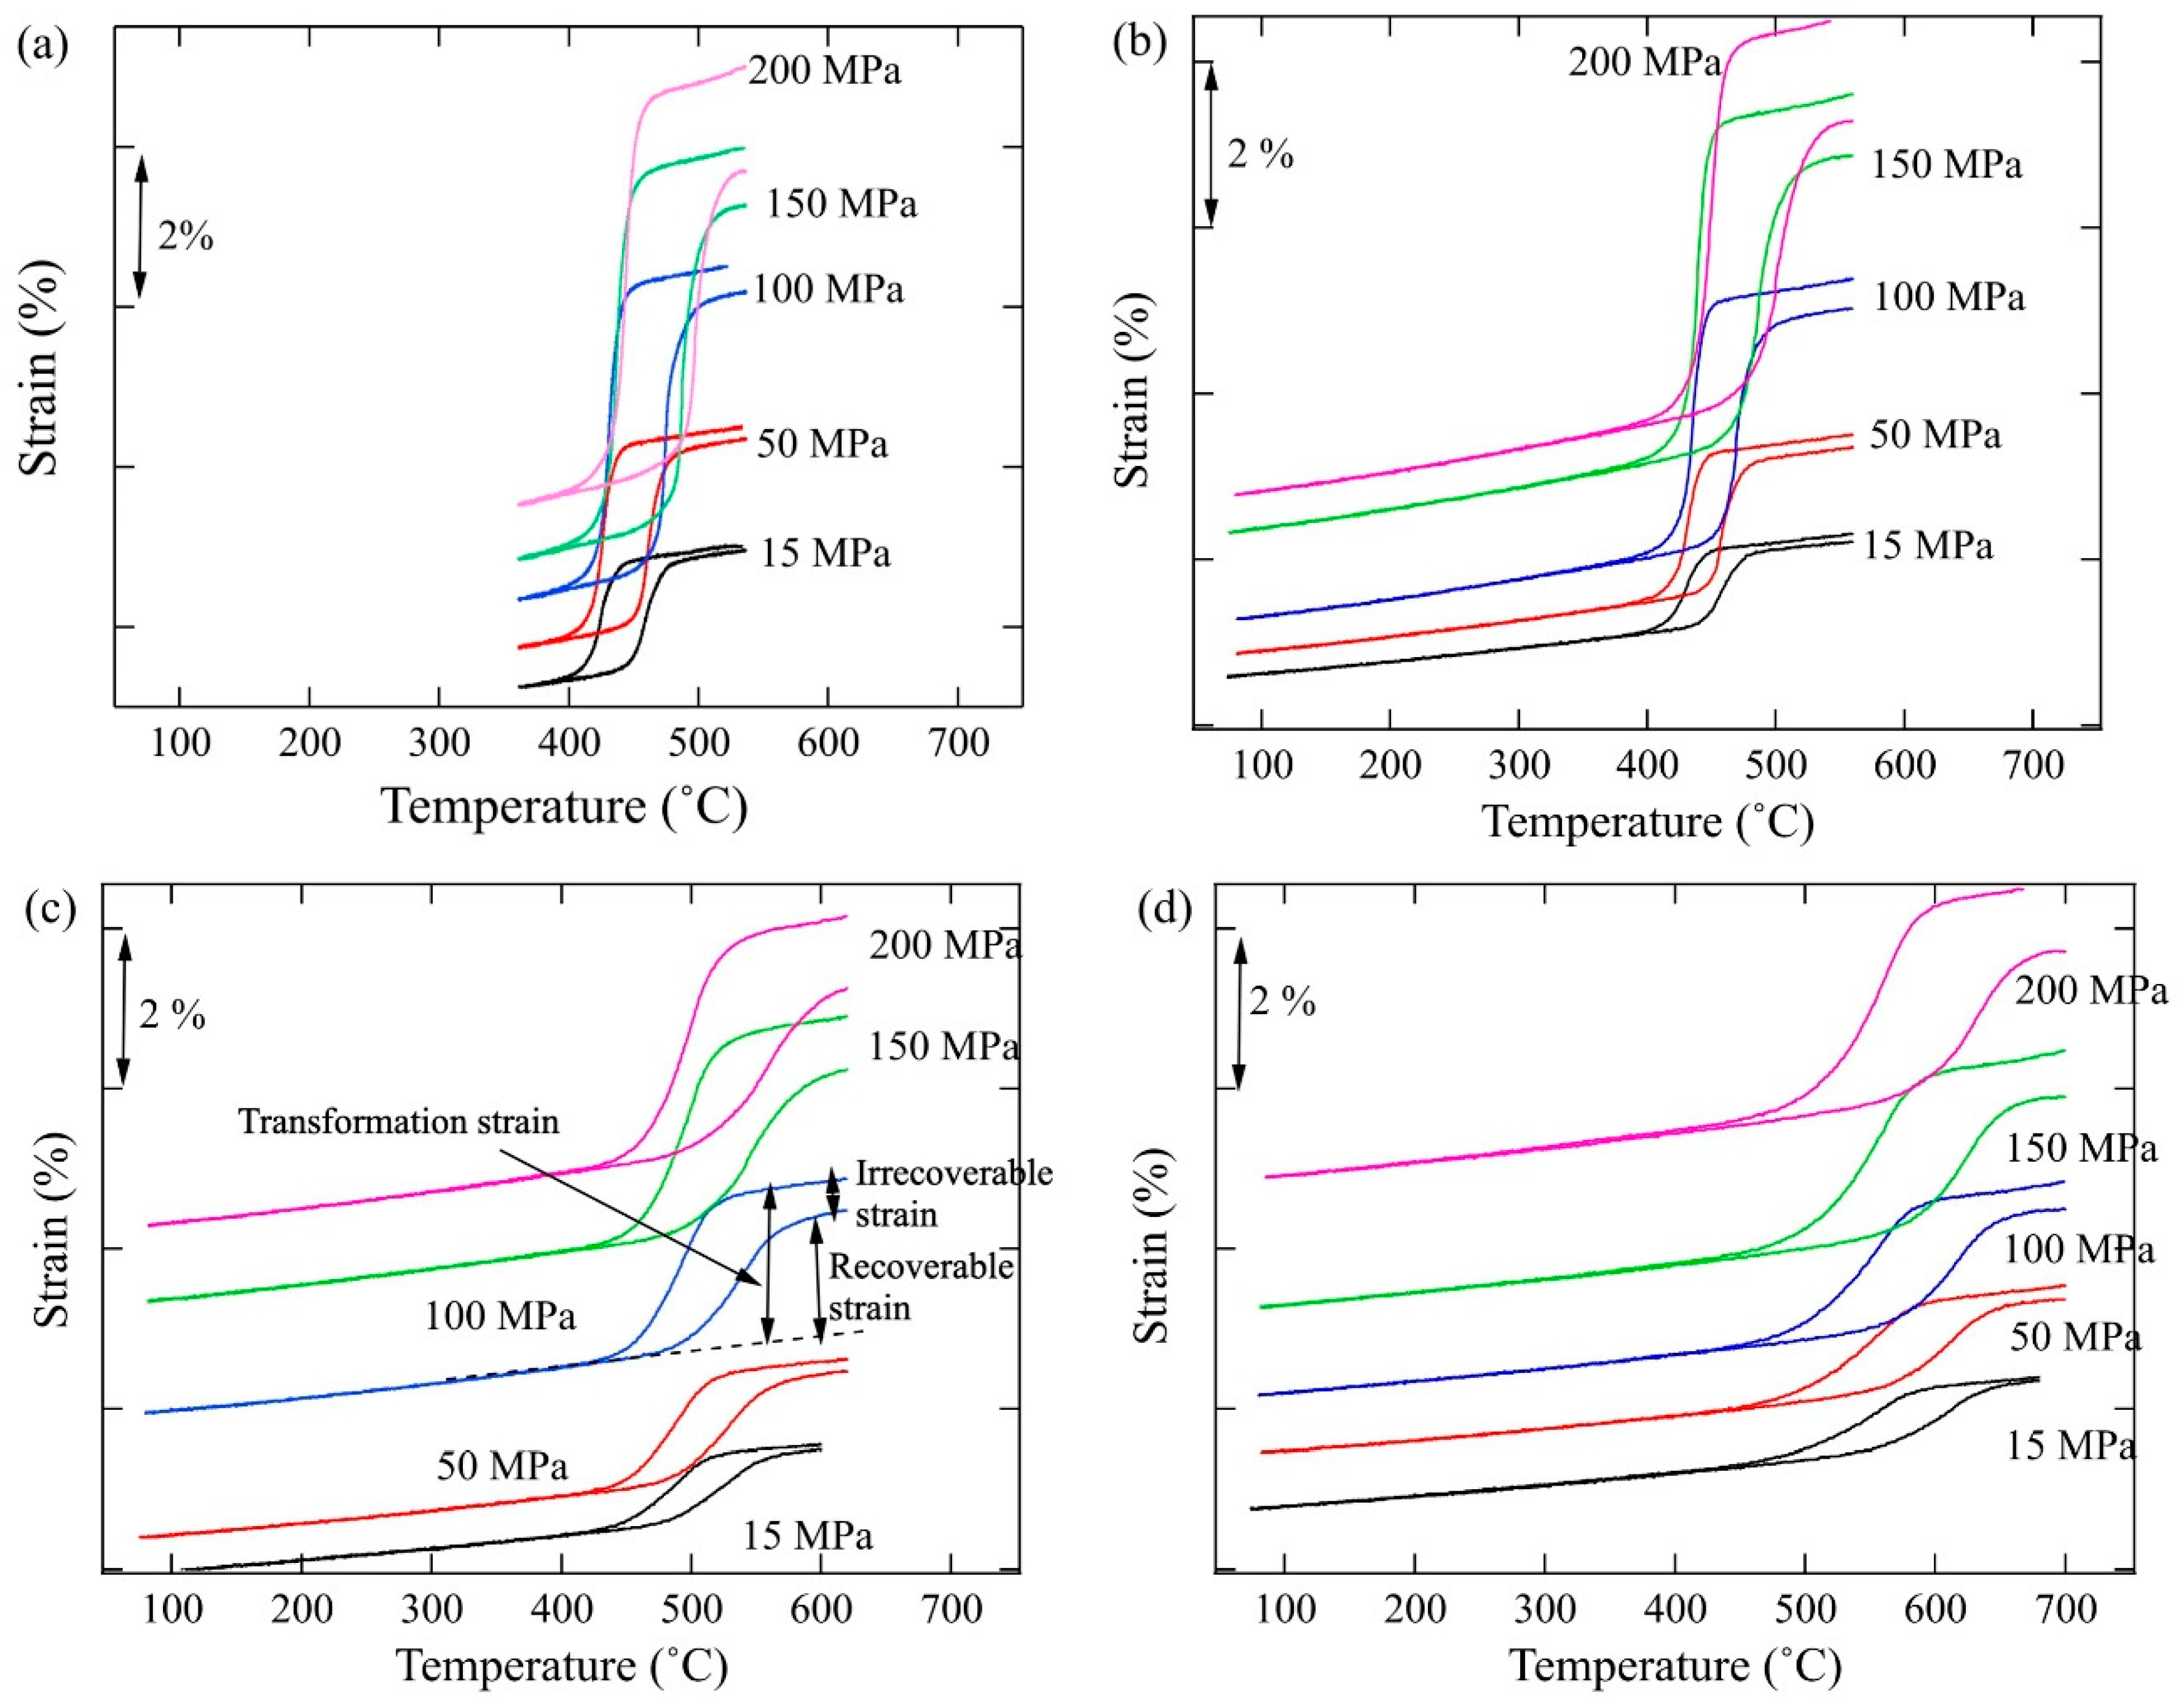
The strain-temperature curves shown in Figure 5 indicate the shape memory properties of the alloys. Shape recovery was obtained approximately above 400 °C, although an irrecoverable strain was also observed. The starting temperature of shape recovery increased with an increase in Pt contents. The shape recovery started at approximately 500 °C in Ti-25Pd-25Pt-5Zr. Irrecoverable strain was not visible under 15 MPa in any alloy. However, when the applied stress was increased to 50 MPa and more, an irrecoverable strain appeared and increased with an increase in the applied stress. The transformation and recovery strains were also increased with an increase in the applied stress. This was because the deformation strain increasing with the increase in applied stress was recovered by reverse phase transformation.
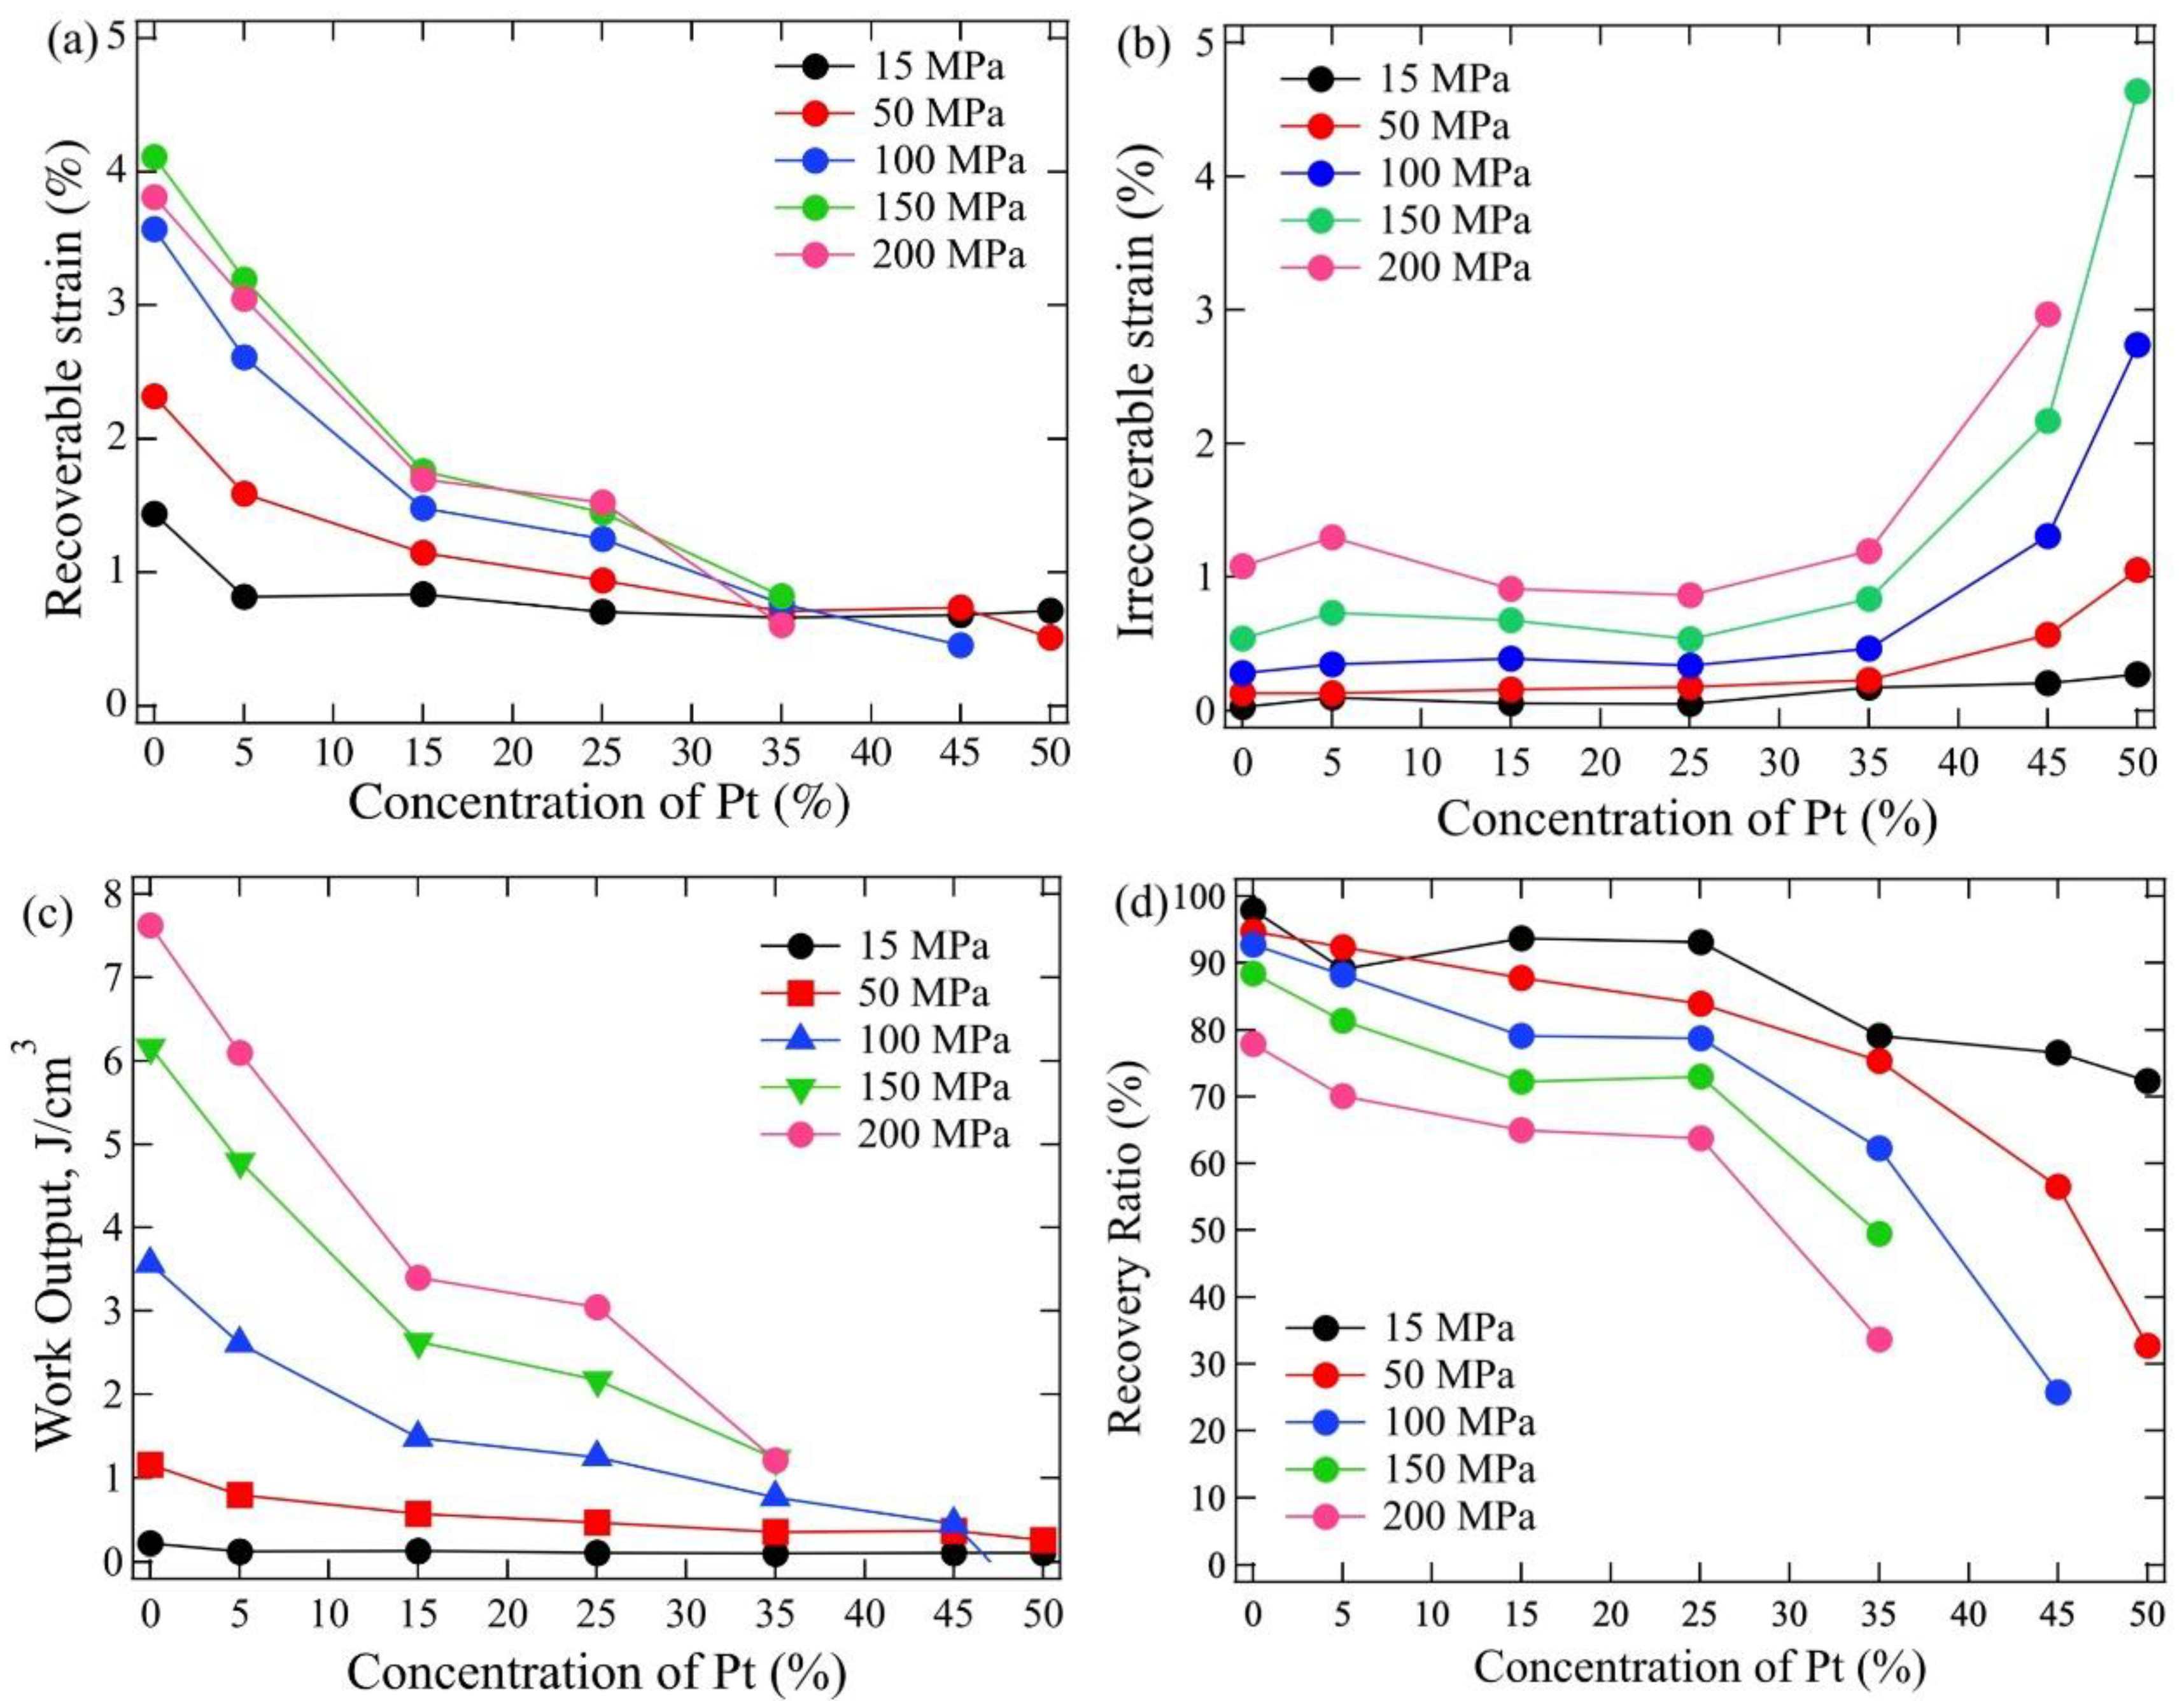
In Figure 6, the recoverable, irrecoverable strain, work output, and recovery ratio obtained from Figure 5 are plotted together with the Pt-rich SMAs studied previously [28]. It is clear that the recoverable strain decreased drastically with an increase in Pt contents and a decrease in the applied stress. Although the irrecoverable strain was constant up to 35 at% Pt, it started to increase when Pt contents were greater than 35 at%. As shown in Figure 5, the irrecoverable strain also increased with an increase in applied stress. It can be reasonably assumed that the large plastic strain was introduced under a large applied stress. The transformation strain is the sum of recoverable and irrecoverable strains. Because the irrecoverable strain was nearly the same value and the recoverable strain decreased with increasing Pt content up to 25 at% Pt, the transformation strain of Ti-Pd-Pt-Zr alloys decreased with an increase in Pt. The work output also decreased with increasing Pt content, but increased with an increase in the applied stress because the work output was obtained by the product of the recoverable strain and applied stress. The recovery ratio decreased with increasing Pt and applied stress. A drastic decrease in the recovery ratio was observed above 25 at% Pt. This indicates that the potential of alloys with Pt contents greater than 25 at% for high-temperature SMAs is very low.
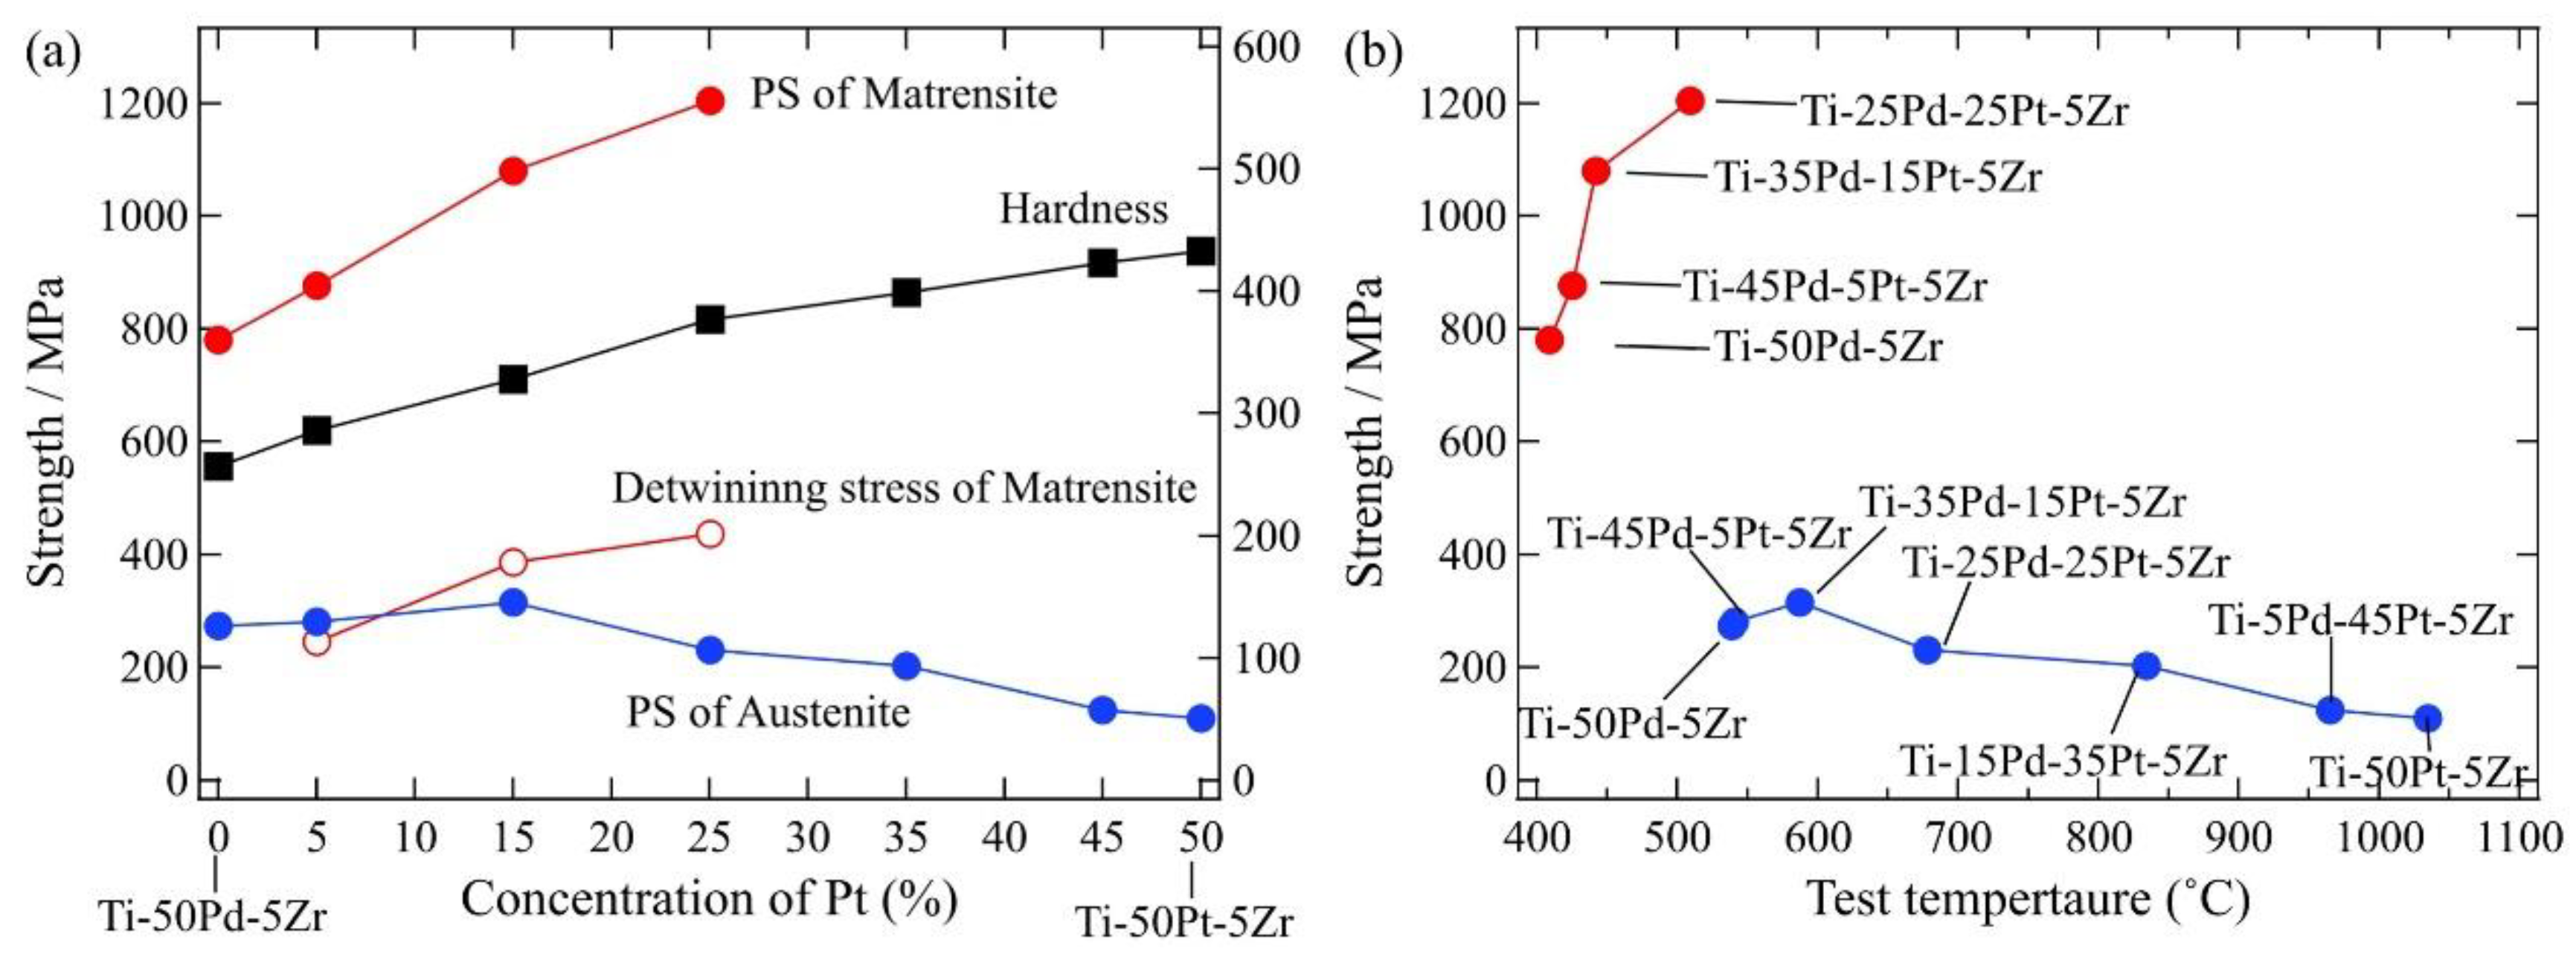
To investigate an effect of the strength on the shape recovery effect, the Vickers hardness and 0.2% proof stress of martensite and austenite phases were measured. Table 3 and Figure 7 show the Vickers hardness of the martensite phase at room temperature and the 0.2% proof stress of the austenite phase together with Pt-rich Ti-Pd-Pt-Zr alloys [28]. The left- and right-side plots shown in Figure 7a represent the hardness and 0.2% proof stress of the martensite and austenite phases of Ti-50Pd-5Zr and Ti-50Pt-5Zr, respectively. The Vickers hardness at room temperature increased with an increase in Pt content because the hardness of Ti-50Pt-5Zr [24,29] was greater than that of Ti-50Pd-5Zr. The 0.2% proof stress and detwinning stress of the martensite phase also increased with increasing Pt content, even though no data for the 0.2% proof stress in Pt-rich Ti-Pd-Pt-Zr were available. However, the 0.2% proof stress of the austenite was nearly the same value at up to 15 at% Pt, but decreased with increasing Pt content above 25 at% Pt. Figure 7b plots the 0.2% proof stress of the martensite and austenite phases as a function of the testing temperature. It can be reasonably assumed that a decrease in the 0.2% proof stress of the austenite phase above 25 at% Pt caused a drastic increase in Af above 600 °C from 557 °C in Ti-35Pd-15Pt-5Zr, as shown in Figure 3. However, the 0.2% proof stress of the martensite increased, even with an increase in Mf. Because the atomic size of Pd and Pt are nearly the same (0.1375 and 0.1387 nm, respectively [31]), the solid-solution strengthening by Pt was considered not to be high. Thus, it is interesting that the proof stress of the martensite phase increased with the addition of Pt, and even with an increase in the testing temperature.
The drastic decrease in the strength of the austenite phase above 25 at% Pt shown in Figure 7 may explain the increase of the irrecoverable strain shown in Figure 6b. Severe plastic deformation was considered to have occurred in the Pt-rich Ti-Pd-Pt-Zr alloys, resulting in a large extent of irrecoverable strain.
3.3. Effects of Training
It is known that repeated thermal cyclic tests, called “training”, decreases irrecoverable strain, and a perfect recovery is finally obtained [32,32]. For example, the irrecoverable strain of Ti-Ni base alloys became almost 0 after 40 cycles under 80 MPa. The training was effective for Ti-Ni alloys strengthened by the addition of Pd or Sc. In addition, precipitation hardened by Ti (C, O) and strengthened by dislocations processed by equal channel angular extrusion when the applied stress was increased.
In this study, two thermal cycle tests were performed for Ti-35Pd-15Pt-5Zr to investigate whether the initial stress or repetitive cycles was more effective at improving the shape memory effect. In the first test, the first cycle was performed at a different initial stress, and subsequent cycles were performed at a constant stress. In the second test, the cycles were performed at a different constant stress.
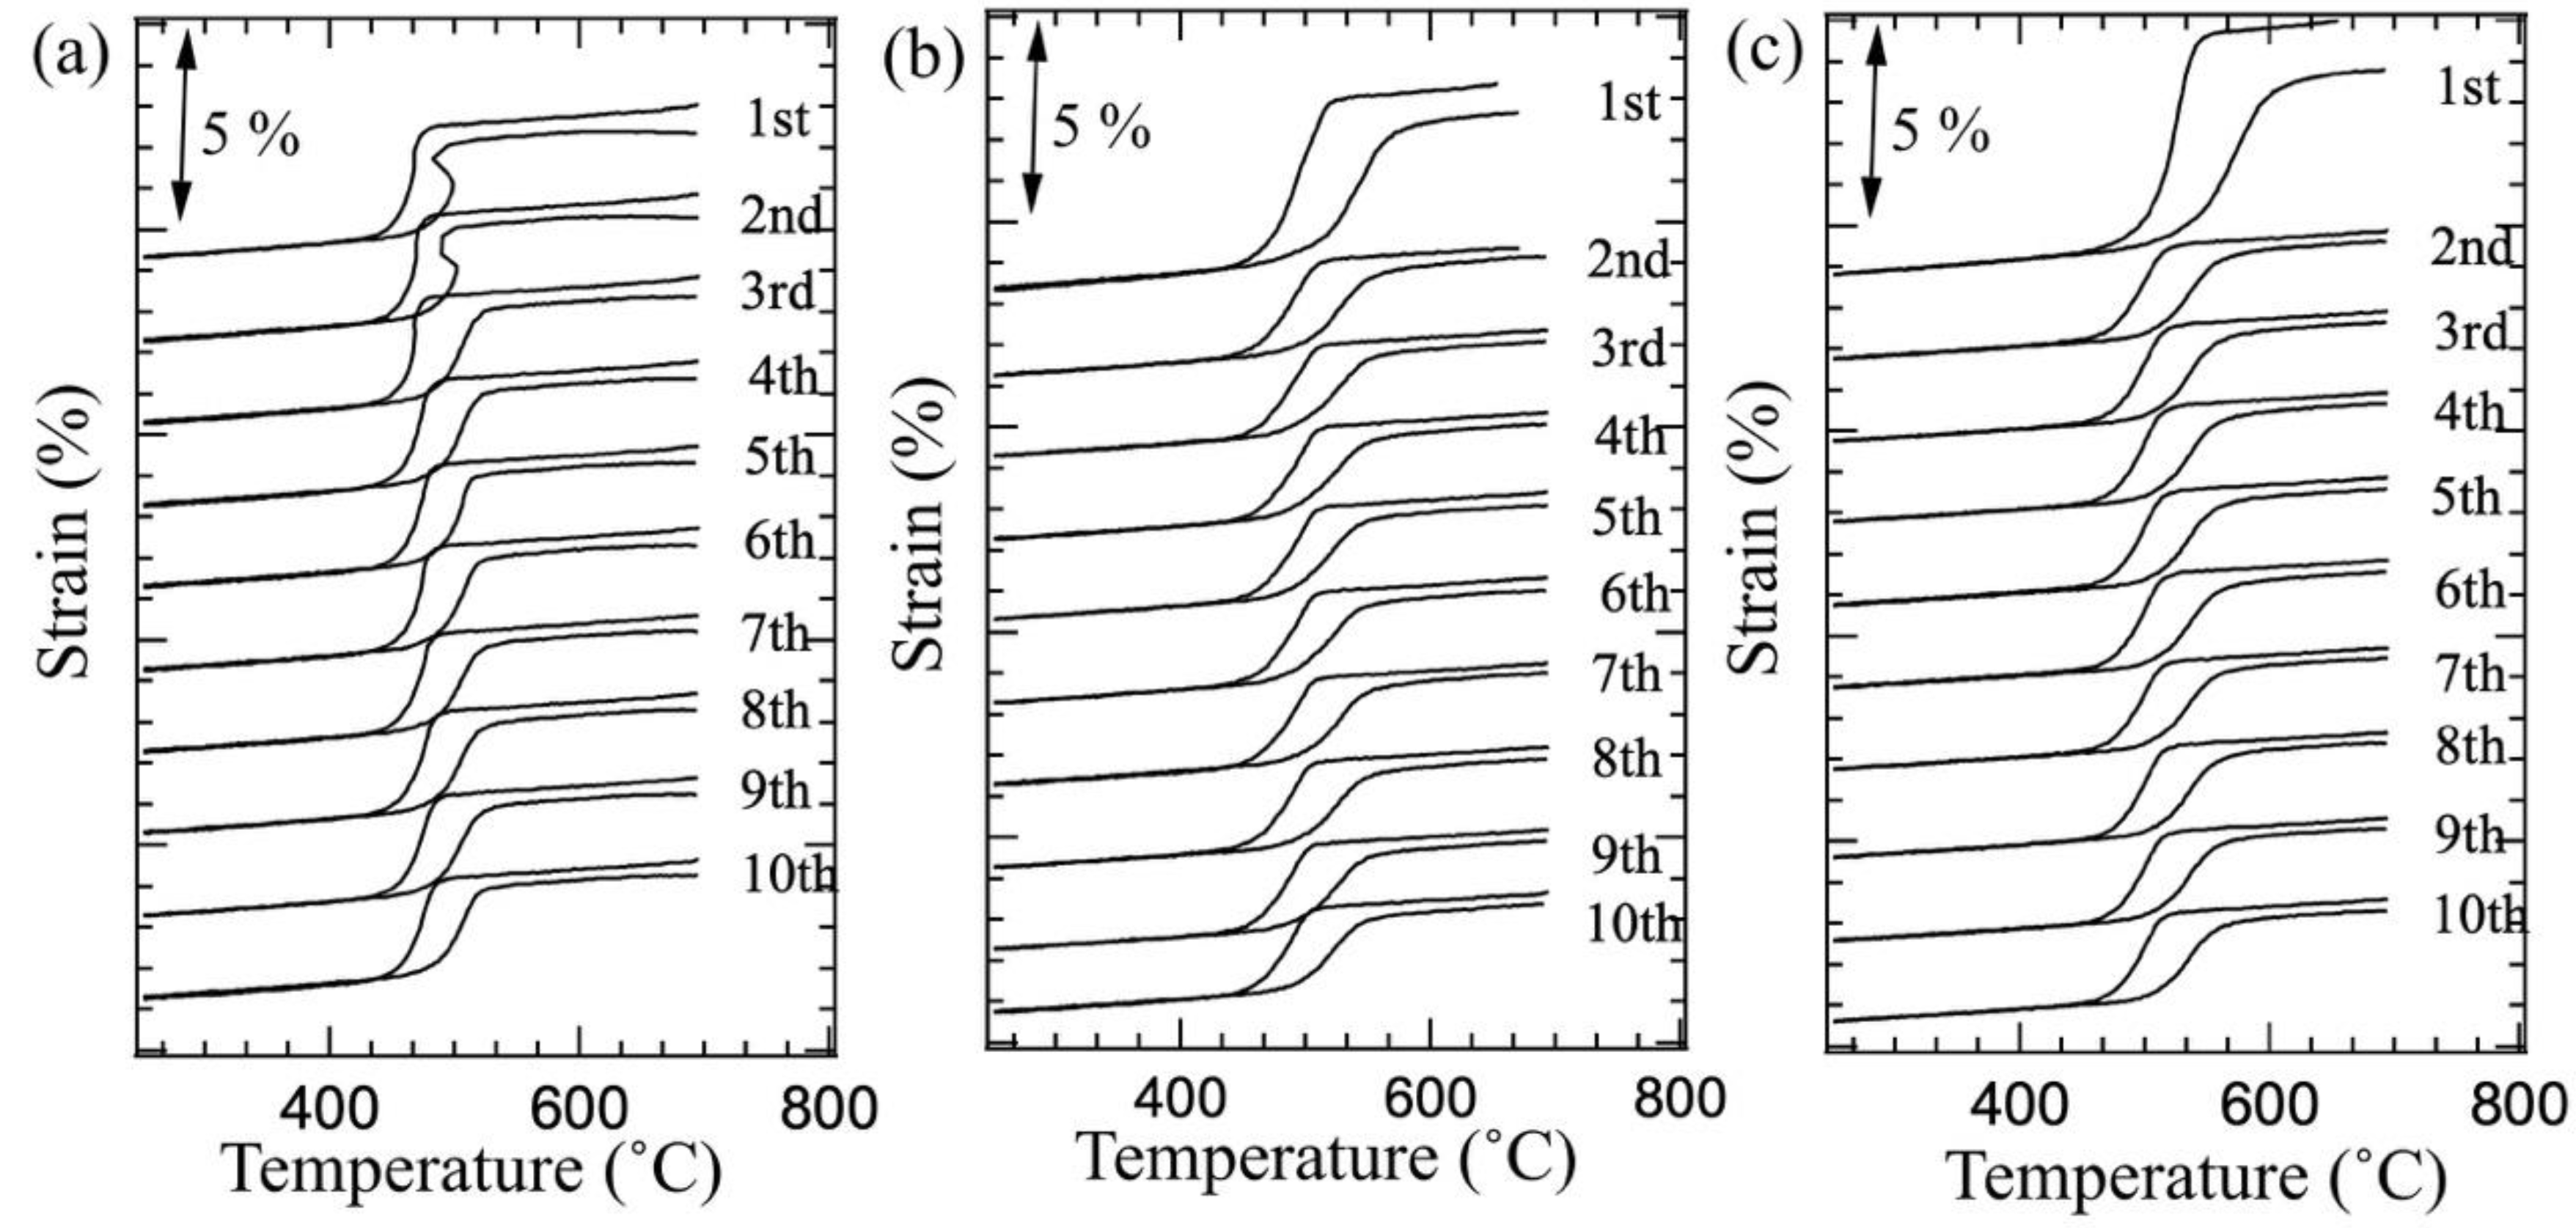
In the first test, the initial stress was changed to 100, 200, and 300 MPa with different samples. The samples were then thermally cycled 10 times at 100 MPa. The strain-temperature curves for 10 cycles under 100 MPa after the initial stress of 100, 200, and 300 MPa are shown separately in Figure 8, where the first cycle is shown at the top. When the initial applied stress was 100 MPa, the following repetitive cycles at 100 MPa were very stable, and the transformation and irrecoverable strains were nearly the same for all curves, as shown in Figure 8a. When the initial stress was 200 and 300 MPa, as shown in Figure 8b,c, the large recoverable and irrecoverable strains were observed in the first cycle. However, both transformation and irrecoverable strains decreased in the second cycles, and were stable in the subsequent cycles.
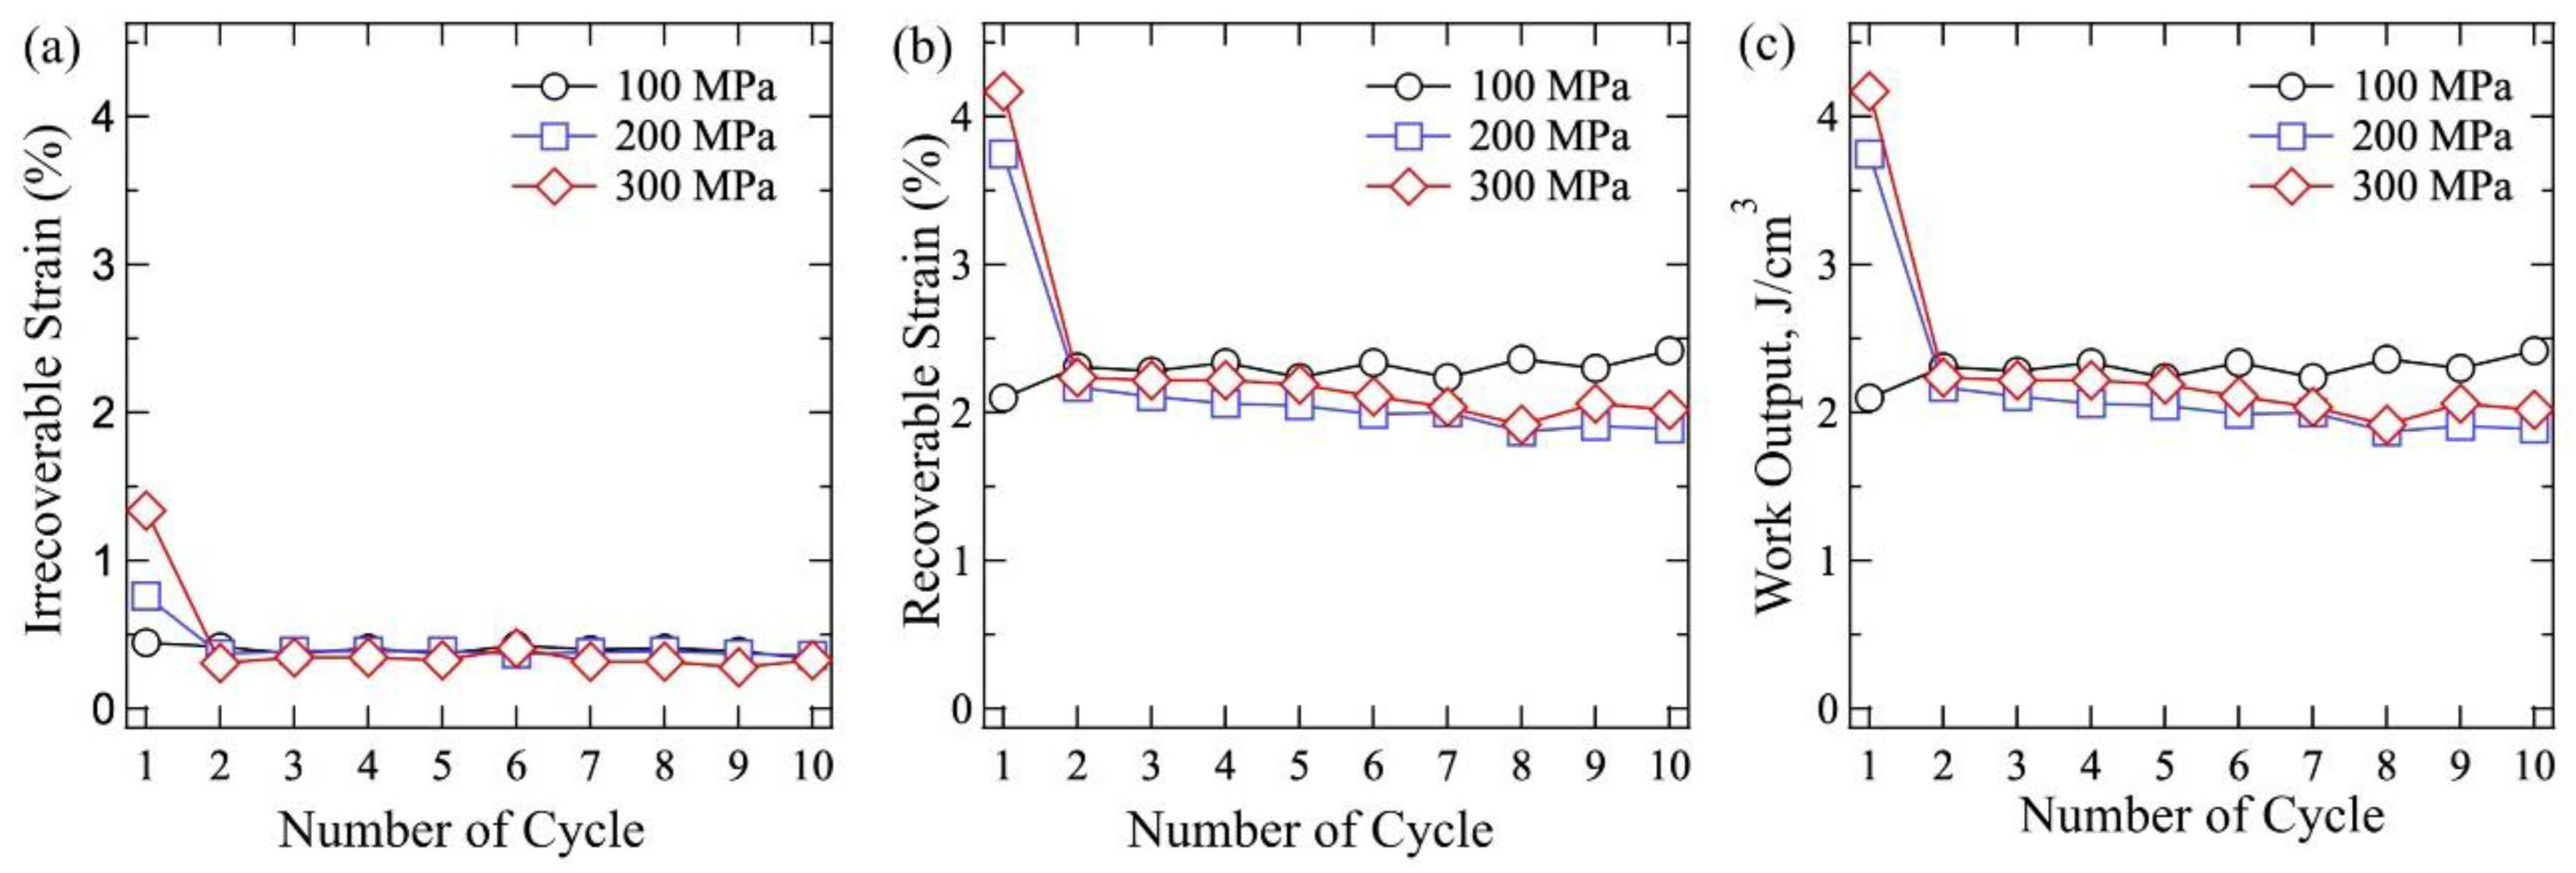
In Figure 9, the irrecoverable and recoverable strains and the work output under 100 MPa obtained from Figure 8 are plotted with the number of cycles. The irrecoverable strain in the first cycle increased with an increase in the initial applied stress, but the strains were nearly the same in the subsequent cycles, as shown in Figure 9a. The recoverable strain under the condition of an initial applied stress of 100 MPa was approximately 2.5%, as shown in Figure 9b. However, the recoverable strain in the first cycle was nearly 4% when initial stresses of 200 and 300 MPa were applied, as shown in Figure 9b. The recoverable strain drastically decreased in the second cycle and was nearly the same for the sample, in which 100 MPa was applied as the initial stress. Then, the recoverable strain gradually decreased with an increase in the number of cycles. This was because the high number of dislocations introduced during deformation under 200 or 300 MPa restricted the MT. Because the recovery strains of the three conditions were nearly the same in the range between 2 and 2.5%, the work output plotted in Figure 9c was also nearly constant, regardless of the initial applied stress. A large work output was obtained in the sample with initial applied stresses of 200 and 300 MPa because of the large recoverable strain, as shown in Figure 9b. Although some dispersion was observed due to dispersion of recoverable strain, the work output was very stable under all tested conditions after the second cycles. These results clarified that the initial applied stress affects the irrecoverable strain only for the first cycle.
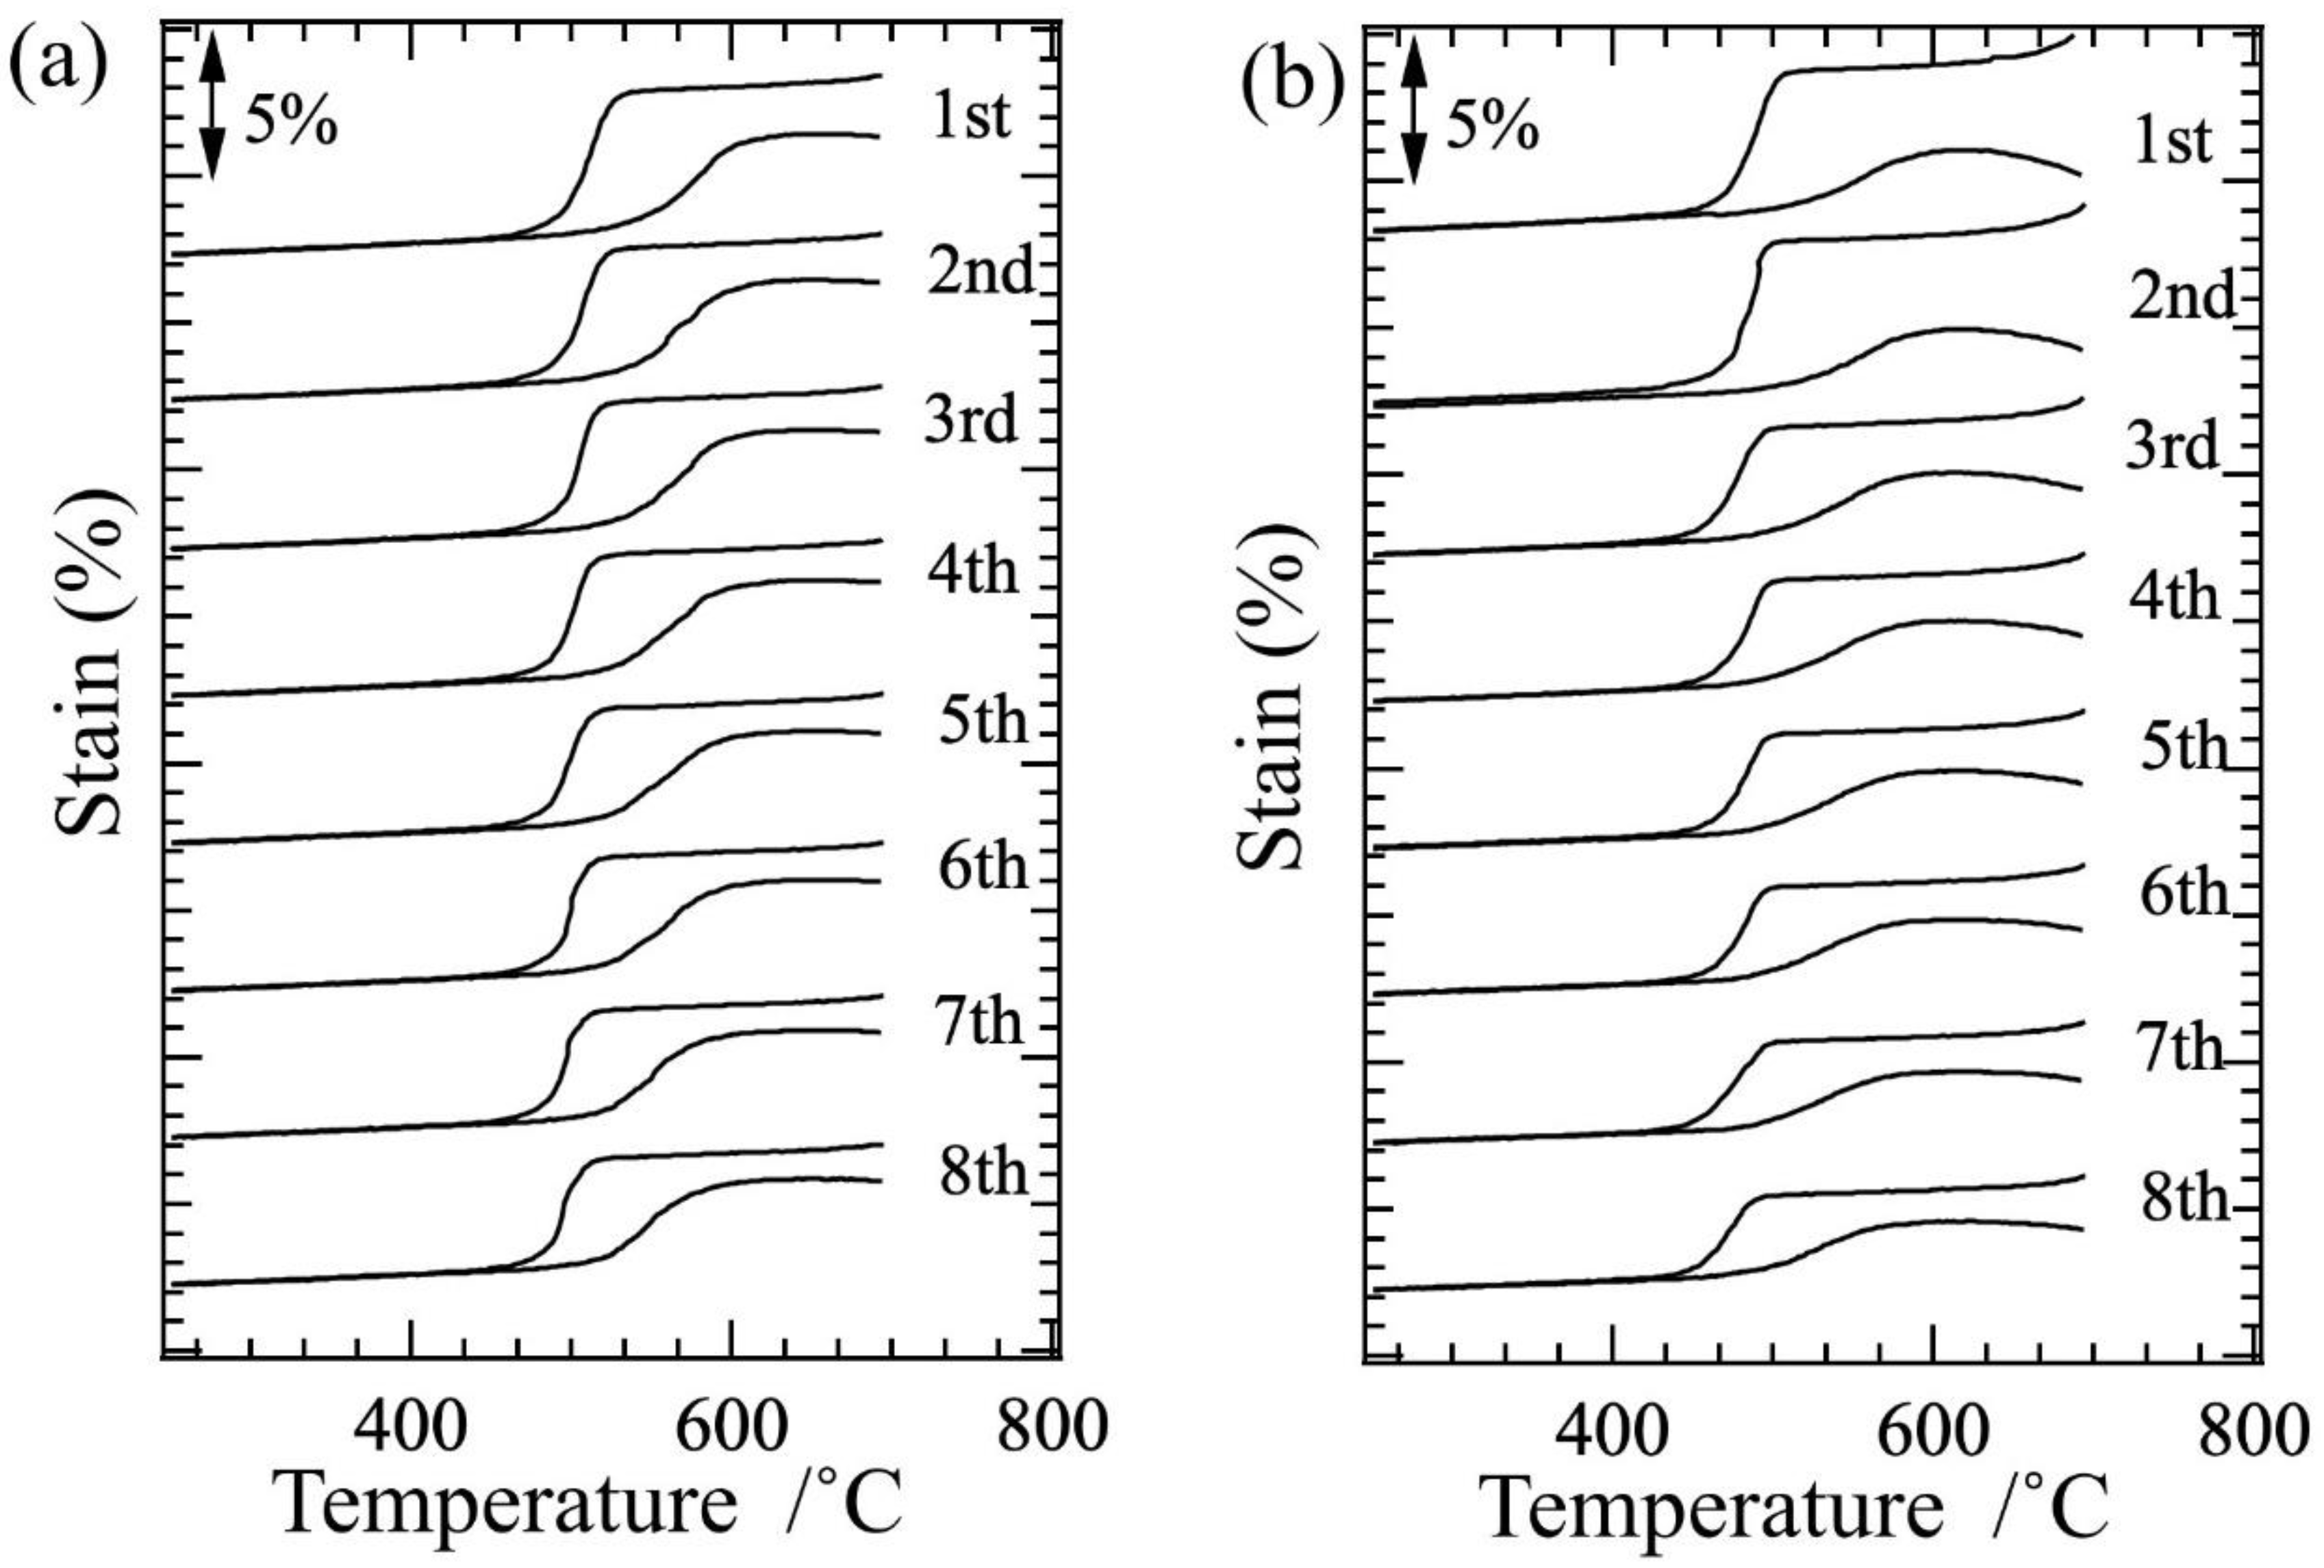
In the second test, the thermal cycle tests at different stresses of 200 and 300 MPa were performed eight times. The strain–temperature curves are shown in Figure 10. The large irrecoverable strain was obtained in the first curve under 200 MPa, but it decreased in the following cycles (Figure 10a). Still, an irrecoverable strain of approximately 1% appeared and was stable during the seven cycles. Under 300 MPa, trumpet-shaped curves were obtained (Figure 10b). A trumpet-shaped curve appears when the compressive deformation by the applied stress is greater than expansion by heating. It can then be said that compressive deformation progressed during heating, particularly at a temperature close to Af. The irrecoverable strain then drastically decreased in the subsequent cycles.
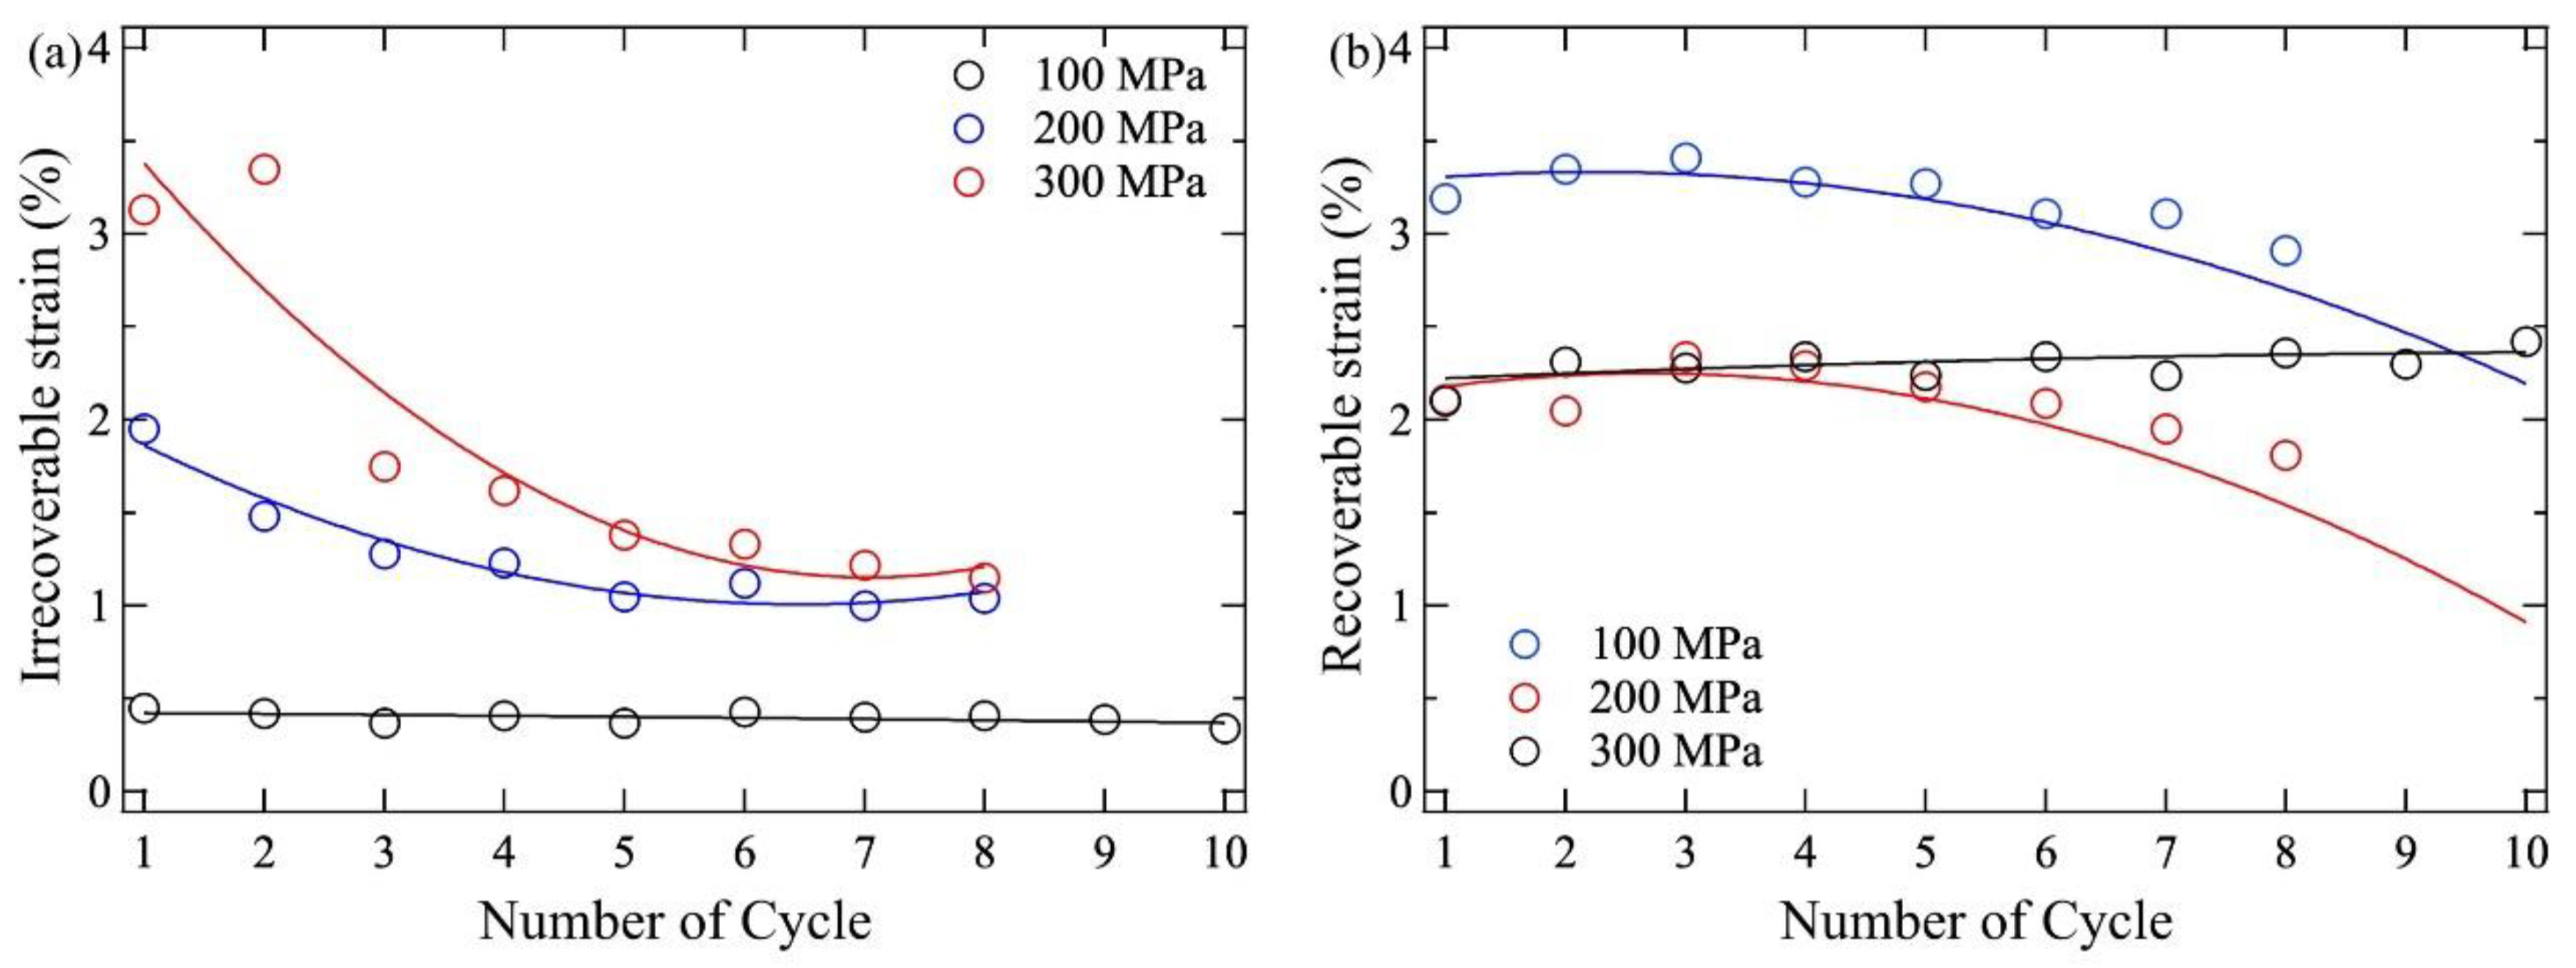
The irrecoverable and recoverable strains derived from Figure 10 are plotted against the number of cycles in Figure 11. The irrecoverable strain obtained at 100 MPa, as shown in Figure 9, was also plotted for comparison (see Figure 11a). Both the irrecoverable strain under 100 MPa and recoverable strain were constant, that is, approximately 0.5% (Figure 11a) and approximately 2% (Figure 11b), respectively. This indicates that the training under 100 MPa was too low to decrease the irrecoverable strain, and did not improve the shape memory effect. However, when the applied stresses were 200 and 300 MPa, the irrecoverable strain drastically decreased for the first five cycles and saturated at approximately 1%, as shown in Figure 11a. The amount of decrease was greater under 300 MPa than under 200 MPa, but the saturated irrecoverable strain was the same as that under 200 MPa and double that under 100 MPa. The recoverable strain under 300 MPa was smaller than that of 200 MPa, and became smaller with an increase in the number of cycles, as shown in Figure 11b. This indicates that the effect of decreasing irrecoverable strain is greater under a large applied stress, but the recoverable strain quickly decreases due to the large number of dislocations introduced during the first cycle.
To obtain small irrecoverable and stable recoverable strains, the thermal cyclic test under 100 MPa is the best method under the different test conditions. Even so, the irrecoverable strain was not eliminated through the thermal cyclic test under 100 MPa.
In our previous study, similar behavior was observed in Ti-15Pd-35Pt-5Zr [29]. The thermal cyclic test was performed under 50 MPa after initial applied stresses of 50, 100, and 200 MPa were applied [29]. The recoverable strain decreased and was saturated after five cycles, but the irrecoverable strain was not perfectly eliminated. The work output then decreased during the cyclic test.
Although training was effective at decreasing and/or eliminating the irrecoverable strain for Ti-Ni alloys [32,33], it was not effective at eliminating the irrecoverable strain in Ti-Pd-Pt-Zr. This is because the strength of the austenite phase is less in Ti-Pd-Pt-Zr, due to a higher MTT than in Ti-Ni.
3.4. Change in Microstructure Before and After Training
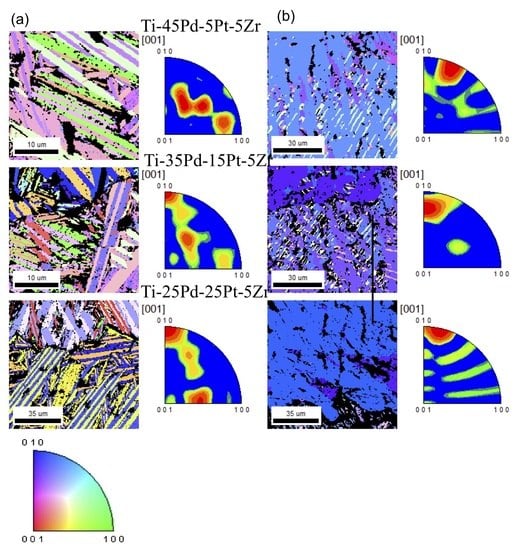
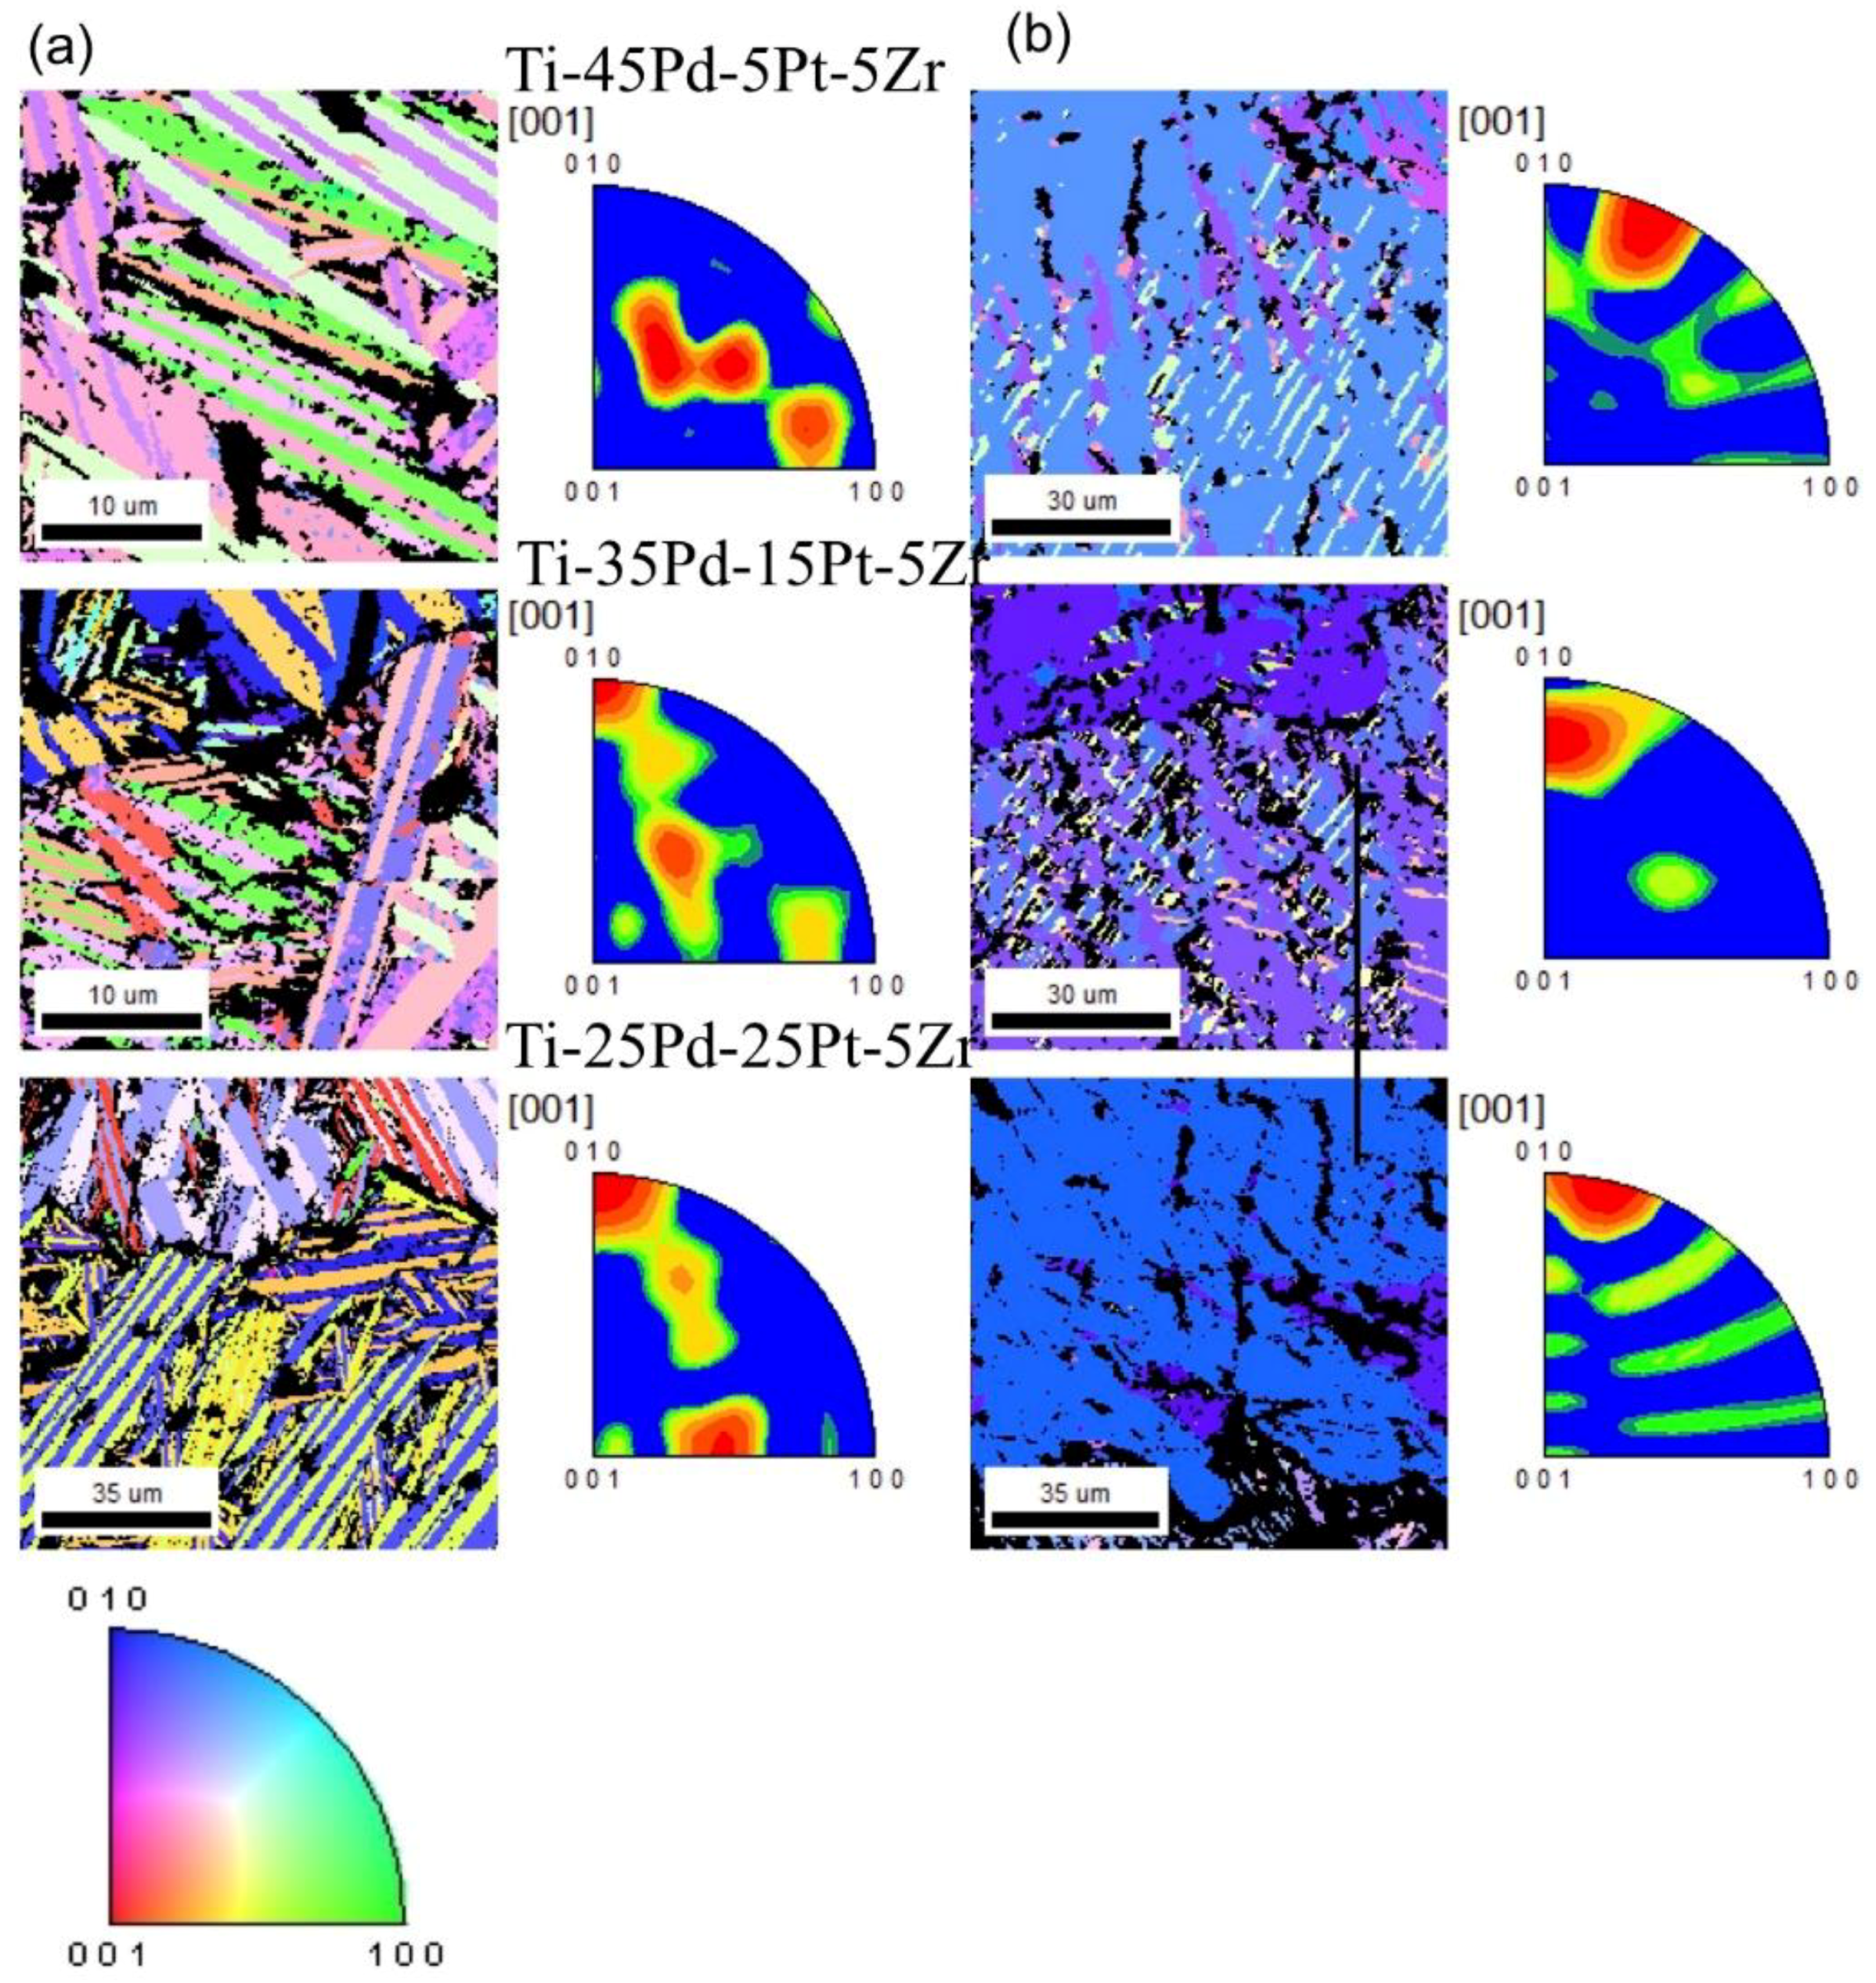
The microstructures of the samples heat-treated at 1000 °C for 3 h followed by quenching in iced water, and tested samples by thermal cycling at 15, 50, 100, 150, and 200 MPa, were observed by SEM equipped with EBSD to investigate microstructural changes during training. The plane normal to the direction of compression was observed for the tested sample. Inverse pole figures of the corresponding microstructures are shown at the right of each orientation map in Figure 12a,b, respectively. A typical twin structure with multiple variants was observed in the heat-treated sample, as shown in Figure 12a. However, in the tested sample, the major variant was predominantly the [010] axis parallel to the compression axis, although a few minor variants were present with the different orientation, as shown in Figure 12b.
A similar texture was observed in Ti-Ni with a B19’ structure after an in situ measurement was performed by synchrotron radiation facility [34,35]. Although Ti-Ni was thermally cycled 20 times at stresses of 50 to 150 MPa, the texture along the [020]B19 was produced in a direction close to the tensile direction [35]. It is suggested that a martensite variant be selected to obtain the largest expansion of the lattice, and thus provide the greatest accommodation to the applied strain during the tensile test. In the Ti-Ni crystal, the lattice parameters of a, b, and c were 0.29, 0.465, and 0.432 nm, respectively. Although the lattice parameter of the austenite phase was 0.302 nm, the largest lattice change during phase transformation was obtained along the [020] direction. This supports the observation that the alignment of the martensite variant in the [020] direction occurs to accommodate the applied strain.
In Ti-Pd, the lattice parameters of the orthorhombic B19 structure were a = 0.459, b = 0.28, and c = 0.484 nm [36]. In the compression test, the martensite variant was selected to obtain the largest compression strain. The lattice parameter of b was the smallest, that is, approximately 60% of the other two axes, and reorientation of the martensite variant along the [010] direction is therefore considered to relax the compressive strain under compressive stress. As a result, a greater recovery strain by deformed strain and reverse transformation was obtained after several thermal cycle tests, as compared with the single cycle test shown in Figure 6.
Similar behavior was also observed in Ti-50Pd-(7,10) Zr and Ti-50Pd-Zr-V [37]. The lattice parameter b remained the smallest, even after adding Zr or V. The transformation strain was calculated using the orientation relationship between martensite and austenite. The maximum compressive strain during MT was obtained along the [010] direction, whereas the maximum expansion strain was obtained during reverse transformation. This calculation indicates that the maximum recovery strain was obtained when the compression axis was parallel to the [010] direction. It was also found that perfect recovery was obtained in the alloy with a strong texture to the [010], whereas imperfect recovery was obtained in the alloy with a weak texture to the [010].
The lattice parameters of the martensite in the studied alloys, obtained from XRD patterns as presented in Figure 1, are shown in Table 4. Changes to lattice parameters were small with the additions of Zr and Pt, and the smallest lattice parameter was obtained in [010]. The martensite variants changed close to [010] to obtain the largest transformation strain during MT.
4. Conclusions
In this study, the effects of Pt on MTT and shape recovery in Ti-50Pd-5Zr were investigated. Ti-(50−x) Pd-xPt-5Zr alloys (x = 5, 15, 25 at%) were prepared. The MTT increased with an increase in Pt contents. For example, Af increased from 511°C for Ti-50Pd-5Zr to 648 °C for Ti-25Pd-25Pt-5Zr. The shape recovery was investigated by thermal cyclic testing. Partial shape recovery was obtained under all test conditions, although irrecoverable strain also appeared. Pt addition decreased the recovery strain. The work output subsequently also decreased with increasing Pt content. To decrease the irrecoverable strain, the repeated thermal cyclic test, which is called training, was performed. The irrecoverable strain decreased as a result of this training, but it was not perfectly eliminated.
A microstructure orientation map indicated reorientation of the martensite variant in the direction of the small lattice axis (i.e., the [010] direction) during training. This was because the texture along [010] was effective in obtaining a large compressive strain.
Author Contributions
Conceptualization, Y.Y.-M.; Data curation, W.T.; Writing-original draft, W.T.; Writing-review and editing, Y.Y.-M.; Supervision, M.S. and Y.Y.-M.
Funding
This research was funded by Precious Metals Research Grant of TANAKA Memorial Foundation.
Acknowledgments
Authors appreciate technical support by Wataru Takebe.
Conflicts of Interest
The authors declare no conflict of interest. The funders had no role in the design of the study; in the collection, analyses, or interpretation of data; in the writing of the manuscript, or in the decision to publish the results.
References
- Effects of Palladium Content, Quaternary Alloying, and Thermomechanical Processing on the Behavior of Ni-Ti-Pd Shape Memory Alloys for Actuator Applications. Available online: https://ntrs.nasa.gov/search.jsp?R=20080034881 (accessed on 13 November 2019).
- Ma, J.; Karaman, I.; Noebe, R.D. High temperature shape memory alloys. Int. Mater. Review 2010, 55, 257–315. [Google Scholar] [CrossRef]
- Bastin, G.F.; Rieck, G.D. Diffusion in the titanium-nickel system: I. occurrence and growth of the various intermetallic compounds. Metall. Trans. 1974, 5, 1817–1826. [Google Scholar] [CrossRef]
- Yang, F.; Coughlin, D.R.; Phillips, P.J.; Yang, L.; Devaraj, A.; Kovarik, L. Structure analysis of a precipitate phase in an Ni-rich high-temperature NiTiHf shape memory alloy. Acta Mater. 2013, 9, 3335–3346. [Google Scholar] [CrossRef]
- Santamarta, R.; Arroyave, R.; Pons, J.; Evrigen, A.; Karaman, I.; Karacka, H.E.; Noebe, R.D. TEM study of structural and microstructural characteristics of a precipitate phase in Ni-rich Ni-Ti-Hf and Ni-Ti-Zr shape memory alloys. Acta Mater. 2013, 61, 6191–6206. [Google Scholar] [CrossRef]
- Bigelow, G.S.; Garg, A.; Padula, S.A., II; Gaydosh, D.J.; Noebe, R.D. Load-biased shape-memory and superelastic properties of a precipitation strengthened high-temperature Ni50.3Ti29.7Hf20 alloy. Scripta Mater. 2011, 64, 725–728. [Google Scholar] [CrossRef]
- Coughlin, D.R.; Phillips, P.J.; Bigelow, G.S.; Garg, A.; Noebe, R.D.; Mills, M.J. Characterization of the microstructure and mechanical properties of a 50.3Ni-29.7Ti-20Hf shape memory alloy. Scripta Mater. 2012, 67, 112–115. [Google Scholar] [CrossRef]
- Benafan, O.; Noebe, R.D.; Padula, S.A., II; Vaidyanathan, R. Microstructural Response During Isothermal and Isobaric Loading of a Precipitation-Strengthened Ni-29.7Ti-20Hf High-Temperature Shape Memory Alloy. Metall. Mater. Trans. A 2012, 43, 4539–4552. [Google Scholar] [CrossRef]
- Karaca, H.E.; Saghaian, S.M.; Ged, G.; Tobe, H.; Basaran, B.; Maier, H.J.; Noebe, R.D.; Chumlyakov, Y.I. Effects of nanoprecipitation on the shape memory and material properties of an Ni-rich NiTiHf high temperature shape memory alloy. Acta Mater. 2013, 61, 7422–7431. [Google Scholar] [CrossRef]
- Benafan, O.; Grag, A.; Noebe, R.D.; Bigelow, G.S.; Padula, S.A., II; Gaydosh, D.J.; Schell, N.; Mabe, J.H.; Vaidyanathan, R. Mechanical and functional behavior of a Ni-rich Ni50.3Ti29.7Hf20 high temperature shape memory alloy. Intermetallics 2014, 50, 94–107. [Google Scholar] [CrossRef]
- Pio, J.S.B.; Hee, Y.K.; Hideki, H.; Shuichi, M. Shape memory behavior of Ti-Ta and its potential as a high-temperature shape memory alloy. Acta Mater. 2009, 57, 1068–1077. [Google Scholar] [CrossRef]
- Joanne, L.M. The Pd-Ti (Palladium-titanium) system. Bull. Alloy Phase Diagr. 1982, 3, 321–329. [Google Scholar]
- Donkersloot, H.C.; Van Vucht, J.H.N. Martensitic transformations in gold-titanium, palladium-titanium and platinum-titanium alloys near the equiatomic composition. J. Less Common Metals 1970, 20, 83–91. [Google Scholar] [CrossRef]
- Otsuka, K.; Oda, K.; Ueno, Y.; Piao, M.; Ueki, T.; Horikawa, H. The shape memory effect in a Ti{sub 50}Pd{sub 50} alloy. Scripta Met. Mater. 1993, 29, 1355–1358. [Google Scholar] [CrossRef]
- Yamabe-Mitarai, Y.; Hara, T.; Miura, S.; Hosoda, H. Potentials of Shape Memory Effect in (Pt, Ir)-50 at%Ti. J. Jpn. Inst. Metals 2005, 69, 634–642. [Google Scholar] [CrossRef]
- Yamabe-Mitarai, Y.; Hara, T.; Miura, S.; Hosoda, H. Mechanical Properties of Ti-50(Pt,Ir) High-Temperature Shape Memory Alloys. Mater. Trans. 2006, 47, 650–657. [Google Scholar] [CrossRef]
- Kawakita, M.; Takahashi, M.; Takahashi, S.; Yamabe-Mitarai, Y. Effect of Zr on phase transformation and high-temperature shape memory effect in TiPd alloys. Mater Lett. 2012, 89, 336–338. [Google Scholar] [CrossRef]
- Arockiakumar, R.; Takahashi, M.; Takahashi, S.; Yamabe-Mitarai, Y. Microstructure, mechanical and shape memory properties of Ti-55Pd-5x (x=Zr, Hf, V, Nb) alloys. Mat. Sci. Eng. A 2013, 585, 85–93. [Google Scholar] [CrossRef]
- Wadood, A.; Hosoda, H.; Yamabe-Mitarai, Y. Phase transformation, oxidation and shape memory properties of Ti-50Au-10Zr alloy for high temperature applications. J. Alloy Comp. 2014, 595, 200–205. [Google Scholar] [CrossRef]
- Wadood, A.; Yamabe-Mitarai, Y. Silver- and Zirconium-added ternary and quaternary TiAu based high temperature shape memory alloys. J. Alloy Comp. 2015, 646, 1172–1177. [Google Scholar] [CrossRef]
- Yamabe-Mitarai, Y.; Hara, T.; Miura, S.; Hosoda, H. Shape memory effect and pseudoelasticity of TiPt. Intermetallics 2010, 18, 2275–2280. [Google Scholar] [CrossRef]
- Yamabe-Mitarai, Y.; Hara, T.; Miura, S.; Hosoda, H. Phase Transformation and Shape Memory Effect of Ti (Pt, Ir). Metall. Mater. Trans. A 2012, 43, 2901–2911. [Google Scholar] [CrossRef]
- Yamabe-Mitarai, Y.; Hara, T.; Kitashima, T.; Miura, T.; Hosoda, H. Composition dependence of phase transformation behavior and shape memory effect of Ti (Pt, Ir). J. Alloy Compd. 2013, 577, S399–S403. [Google Scholar] [CrossRef]
- Wadood, A.; Takahashi, M.; Takahashi, S.; Hosoda, H.; Yamabe-Mitarai, Y. High-temperature mechanical and shape memory properties of TiPt-Zr and TiPt-Ru alloys. Mater. Sci. Eng. A 2013, 564, 34–41. [Google Scholar] [CrossRef]
- Wadood, A.; Yamabe-Mitarai, Y. TiPt-Co and TiPt-Ru high temperature shape memory alloys. Mater. Sci. Eng. A 2014, 610, 106–110. [Google Scholar] [CrossRef]
- Yamabe-Mitarai, Y.; Wadood, A.; Arockiakumar, R.; Takahashi, M.; Takahashi, S.; Hosoda, H. High-temperature shape memory alloys based on Ti-platinum group metals compounds. Mater. Sci. Forum 2014, 783, 2541–2545. [Google Scholar] [CrossRef]
- Yamabe-Mitarai, Y.; Arockiakumar, R.; Wadood, A.; Suresh, K.S.; Kitashima, T.; Hara, T.; Shimojo, M.; Tasaki, W.; Takahashi, M.; Takahashi, S.; et al. Ti (Pt, Pd, Au) based high temperature shape memory alloys. Mater. Today: Proc. 2015, 2, S517–S522. [Google Scholar] [CrossRef]
- Yamabe-Mitarai, Y. Development of High-Temperature Shape Memory Alloys above 673 K. Mater. Sci. Forum. 2017, 879, 107–112. [Google Scholar] [CrossRef]
- Yamabe-Mitarai, Y.; Takebe, W.; Shimojo, M. Phase Transformation and Shape Memory Effect of Ti-Pd-Pt–Zr High-Temperature Shape Memory Alloys. Shape Mem. Superelasticity 2017, 3, 381–391. [Google Scholar] [CrossRef]
- Takei, F.; Miura, T.; Miyazaki, S.; Kimura, S.; Otsuka, K.; Suzuki, Y. Stress-induced martensitic transformation in a Ti-Ni single crystal. Scripta Metall. 1983, 17, 987–992. [Google Scholar] [CrossRef]
- Senkov, O.N.; Miracle, D.B. Effect of the atomic size distribution on glass forming ability of amorphous metallic alloys. Mater. Res. Bull. 2001, 36, 2183–2198. [Google Scholar] [CrossRef]
- Atli, K.C.; Karaman, I.; Noebe, R.D.; Maier, H.J. Comparative analysis of the effects of severe plastic deformation and thermomechanical training on the functional stability of Ti50.5Ni24.5Pd25 high-temperature shape memory alloy. Scr. Mater. 2011, 64, 315–318. [Google Scholar] [CrossRef]
- Atli, K.C.; Franco, B.E.; Karaman, I.; Gaydosh, D.; Noebe, R.D. Influence of crystallographic compatibility on residual strain of TiNi based shape memory alloys during thermo-mechanical cycling. Mater. Sci. Eng. A 2013, 574, 9–16. [Google Scholar] [CrossRef]
- Hasen, M.; Schmahl, W.W.; Hackl, K.; Heinen, R.; Frenzel, J.; Gollerthan, S.; Eggeler, G.; Wagner, M.; Khalil-Allafi, J.; Baruj, A. Hard X-ray studies of stress-induced phase transformations of superelastic NiTi shape memory alloys under uniaxial load. Mat. Sci. Eng. A 2008, 481–482, 414–419. [Google Scholar] [CrossRef]
- Jones, N.G.; Dye, D. Martensite evolution in a NiTi shape memory alloy when thermal cycling under an applied load. Intermetallics 2011, 19, 1348–1358. [Google Scholar] [CrossRef]
- Villars, P.; Cenzual, K. (Eds.) Pearson’s Crystal Data—Crystal Structure Database for Inorganic Compounds; ASM International(OH): Novelty, OH, USA, 2010. [Google Scholar]
- Sato, H.; Kim, Y.H.; Shimojo, M.; Yamabe-Mitarai, Y. Training Effect on Microstructure and Shape Recovery in Ti-Pd-Zr Alloys. Mater. Trans. 2017, 58, 1479–1486. [Google Scholar] [CrossRef] [Green Version]
Figure 1.
XRD patterns of (a) Ti-45Pd-5Pt-5Zr, (b) Ti-35Pd-15Pt-5Zt, and (c) Ti-25Pd-25Pt-5Zr measured at room temperature and 700 °C.
Figure 1.
XRD patterns of (a) Ti-45Pd-5Pt-5Zr, (b) Ti-35Pd-15Pt-5Zt, and (c) Ti-25Pd-25Pt-5Zr measured at room temperature and 700 °C.

Figure 2.
DSC curves of (a) Ti-45Pd-5Pt-5Zr, (b) Ti-35Pd-15Pt-5Zt, and (c) Ti-25Pd-25Pt-5Zr.

Figure 3.
Martensite start (Ms), martensite finishing (Mf), austenite start (As), and austenite finishing (Af) temperatures as a function of the concentration of Pt.
Figure 3.
Martensite start (Ms), martensite finishing (Mf), austenite start (As), and austenite finishing (Af) temperatures as a function of the concentration of Pt.

Figure 4.
Backscattered images of (a) Ti-45Pd-5Pt-5Zr, (b) Ti-35Pd-15Pt-5Zr, and (c) Ti-25Pd-25Pt-5Zr.
Figure 4.
Backscattered images of (a) Ti-45Pd-5Pt-5Zr, (b) Ti-35Pd-15Pt-5Zr, and (c) Ti-25Pd-25Pt-5Zr.

Figure 5.
Strain–temperature curves of thermal cycle tests of between 15 and 200 MPa for (a) Ti-50Pd-5Zr, (b) Ti-45Pd-5Pt-5Zr, (c) Ti-35Pd-15Pt-5Zr, and (d) Ti-25Pd-25Pt-5Zr.
Figure 5.
Strain–temperature curves of thermal cycle tests of between 15 and 200 MPa for (a) Ti-50Pd-5Zr, (b) Ti-45Pd-5Pt-5Zr, (c) Ti-35Pd-15Pt-5Zr, and (d) Ti-25Pd-25Pt-5Zr.

Figure 6.
Changes in (a) recoverable strain, (b) irrecoverable strain, (c) work output, and (d) recovery ratio as a function of the number of cycles derived from the strain-temperature curves shown in Figure 5.
Figure 6.
Changes in (a) recoverable strain, (b) irrecoverable strain, (c) work output, and (d) recovery ratio as a function of the number of cycles derived from the strain-temperature curves shown in Figure 5.

Figure 7.
Vickers hardness at room temperature, 0.2% proof stress of the austenite and martensite phase, and detwinning stress of the martensite phase.
Figure 7.
Vickers hardness at room temperature, 0.2% proof stress of the austenite and martensite phase, and detwinning stress of the martensite phase.

Figure 8.
Strain–temperature curves of Ti-35Pd-15Pt-5Zr at 100 MPa after application of initial stress of (a) 100 MPa, (b) 200 MPa, and (c) 300 MPa.
Figure 8.
Strain–temperature curves of Ti-35Pd-15Pt-5Zr at 100 MPa after application of initial stress of (a) 100 MPa, (b) 200 MPa, and (c) 300 MPa.

Figure 9.
Irrecoverable strain, recoverable strain, and work output of Ti-35Pd-15Pt-5Zr at 100 MPa after application of initial stress of (a) 100 MPa, (b) 200 MPa, and (c) 300 MPa.
Figure 9.
Irrecoverable strain, recoverable strain, and work output of Ti-35Pd-15Pt-5Zr at 100 MPa after application of initial stress of (a) 100 MPa, (b) 200 MPa, and (c) 300 MPa.

Figure 10.
Thermal cycle test of Ti-35Pd-15Pt-5Zr under (a) 200 MPa and (b) 300 MPa.

Figure 11.
(a) Irrecoverable and (b) recoverable strains of Ti-35Pd-15Pt-5Zr during thermal cyclic testing under 100, 200, and 300 MPa.
Figure 11.
(a) Irrecoverable and (b) recoverable strains of Ti-35Pd-15Pt-5Zr during thermal cyclic testing under 100, 200, and 300 MPa.

Figure 12.
Orientation maps (left) and their inverse pole figures (right) of (a) heat-treated and (b) tested samples of Ti-35Pd-15Pt-5Zr. The perpendicular plane for the compression direction was observed in the tested sample.
Figure 12.
Orientation maps (left) and their inverse pole figures (right) of (a) heat-treated and (b) tested samples of Ti-35Pd-15Pt-5Zr. The perpendicular plane for the compression direction was observed in the tested sample.


Table 1.
MT temperatures (°C) and temperature hysteresis between Af and Ms of ternary Ti-Pd-Zr and quaternary Ti-Pd-Pt-Zr.
Table 1.
MT temperatures (°C) and temperature hysteresis between Af and Ms of ternary Ti-Pd-Zr and quaternary Ti-Pd-Pt-Zr.
| Alloy | As | Af | Ms | Mf | Hysteresis (Af – Ms) |
|---|---|---|---|---|---|
| Ti–50Pd–5Zr [28] | 484 | 503 | 457 | 439 | 46 |
| Ti–45Pd–5Pt–5Zr | 497 | 511 | 464 | 455 | 47 |
| Ti–35Pd–15Pt–5Zr | 539 | 557 | 485 | 471 | 72 |
| Ti–25Pd–25Pt–5Zr | 628 | 648 | 571 | 539 | 77 |
Table 2.
Composition of precipitates in Ti-Pd-Pt-Zr.
| Alloy | Ti (at%) | Zr (at%) | Pd (at%) | Pt (at%) |
|---|---|---|---|---|
| Ti-45Pd-5Pt-5Zr: Ti2Pd | 62.2 | 5.3 | 26.3 | 6.2 |
| Ti-35Pd-15Pt-5Zr: Ti2Pd | 60.6 | 7.0 | 21.3 | 11.1 |
| Ti-25Pd-25Pt-5Zr (dark): Ti3Pt | 67.7 | 1.7 | 8.6 | 22.0 |
| Ti-25Pd-25Pt-5Zr (Bright): Ti4Pt3 | 46.9 | 17.0 | 4.5 | 31.6 |
Table 3.
Vickers hardness, 0.2% proof stress of the martensite and austenite phases, and detwinning stress of the martensite phase.
Table 3.
Vickers hardness, 0.2% proof stress of the martensite and austenite phases, and detwinning stress of the martensite phase.
| Alloys | Martensite Phase | Austenite Phase | ||||
|---|---|---|---|---|---|---|
| Hardness at Room Temperature | Test Temperature (°C) | Proof Stress, MPa | Detwinning Stress, MPa | Detwinning Stress, MPa | Proof Stress, MPa | |
| Ti-50Pd-5Zr | 357 | 409 | 780 | - | - | 274 |
| Ti-45Pd-5Pt-5Zr | 286 | 425 | 877 | 246 | 246 | 281 |
| Ti-35Pd-15Pt-5Zr | 328 | 442 | 1080 | 387 | 387 | 315 |
| Ti-25Pd-25Pt-5Zr | 377 | 509 | 1205 | 436 | 436 | 231 |
| Ti-15Pd-35Pt-5Zr [29] | 399 | - | - | - | - | 203 |
| Ti-5Pd-45Pt-5Zr [29] | 423 | - | - | - | - | 125 |
| Ti-50Pt-5Zr [24,29] | 433 | - | - | - | - | 110 |
Table 4.
Lattice parameters of the martensite phase at room temperature (Å).
| Alloys | a | b | c |
|---|---|---|---|
| Ti-45Pd-5Pt-5Zr | 4.56 | 2.85 | 4.83 |
| Ti-35Pd-15Pt-5Zr | 4.6 | 2.83 | 4.85 |
| Ti-25Pd-25Pt-5Zr | 4.59 | 2.82 | 4.84 |
© 2019 by the authors. Licensee MDPI, Basel, Switzerland. This article is an open access article distributed under the terms and conditions of the Creative Commons Attribution (CC BY) license (http://creativecommons.org/licenses/by/4.0/).
Share and Cite
MDPI and ACS Style
Tasaki, W.; Shimojo, M.; Yamabe-Mitarai, Y. Thermal Cyclic Properties of Ti-Pd-Pt-Zr High-Temperature Shape Memory Alloys. Crystals 2019, 9, 595. https://doi.org/10.3390/cryst9110595
AMA Style
Tasaki W, Shimojo M, Yamabe-Mitarai Y. Thermal Cyclic Properties of Ti-Pd-Pt-Zr High-Temperature Shape Memory Alloys. Crystals. 2019; 9(11):595. https://doi.org/10.3390/cryst9110595
Chicago/Turabian StyleTasaki, Wataru, Masayuki Shimojo, and Yoko Yamabe-Mitarai. 2019. "Thermal Cyclic Properties of Ti-Pd-Pt-Zr High-Temperature Shape Memory Alloys" Crystals 9, no. 11: 595. https://doi.org/10.3390/cryst9110595
Note that from the first issue of 2016, this journal uses article numbers instead of page numbers. See further details here.