High Efficient YVPO4 Luminescent Materials Activated by Europium

 , and
, and
Abstract
:1. Introduction
2. Materials and Methods
2.1. Synthesis
2.2. Characterization
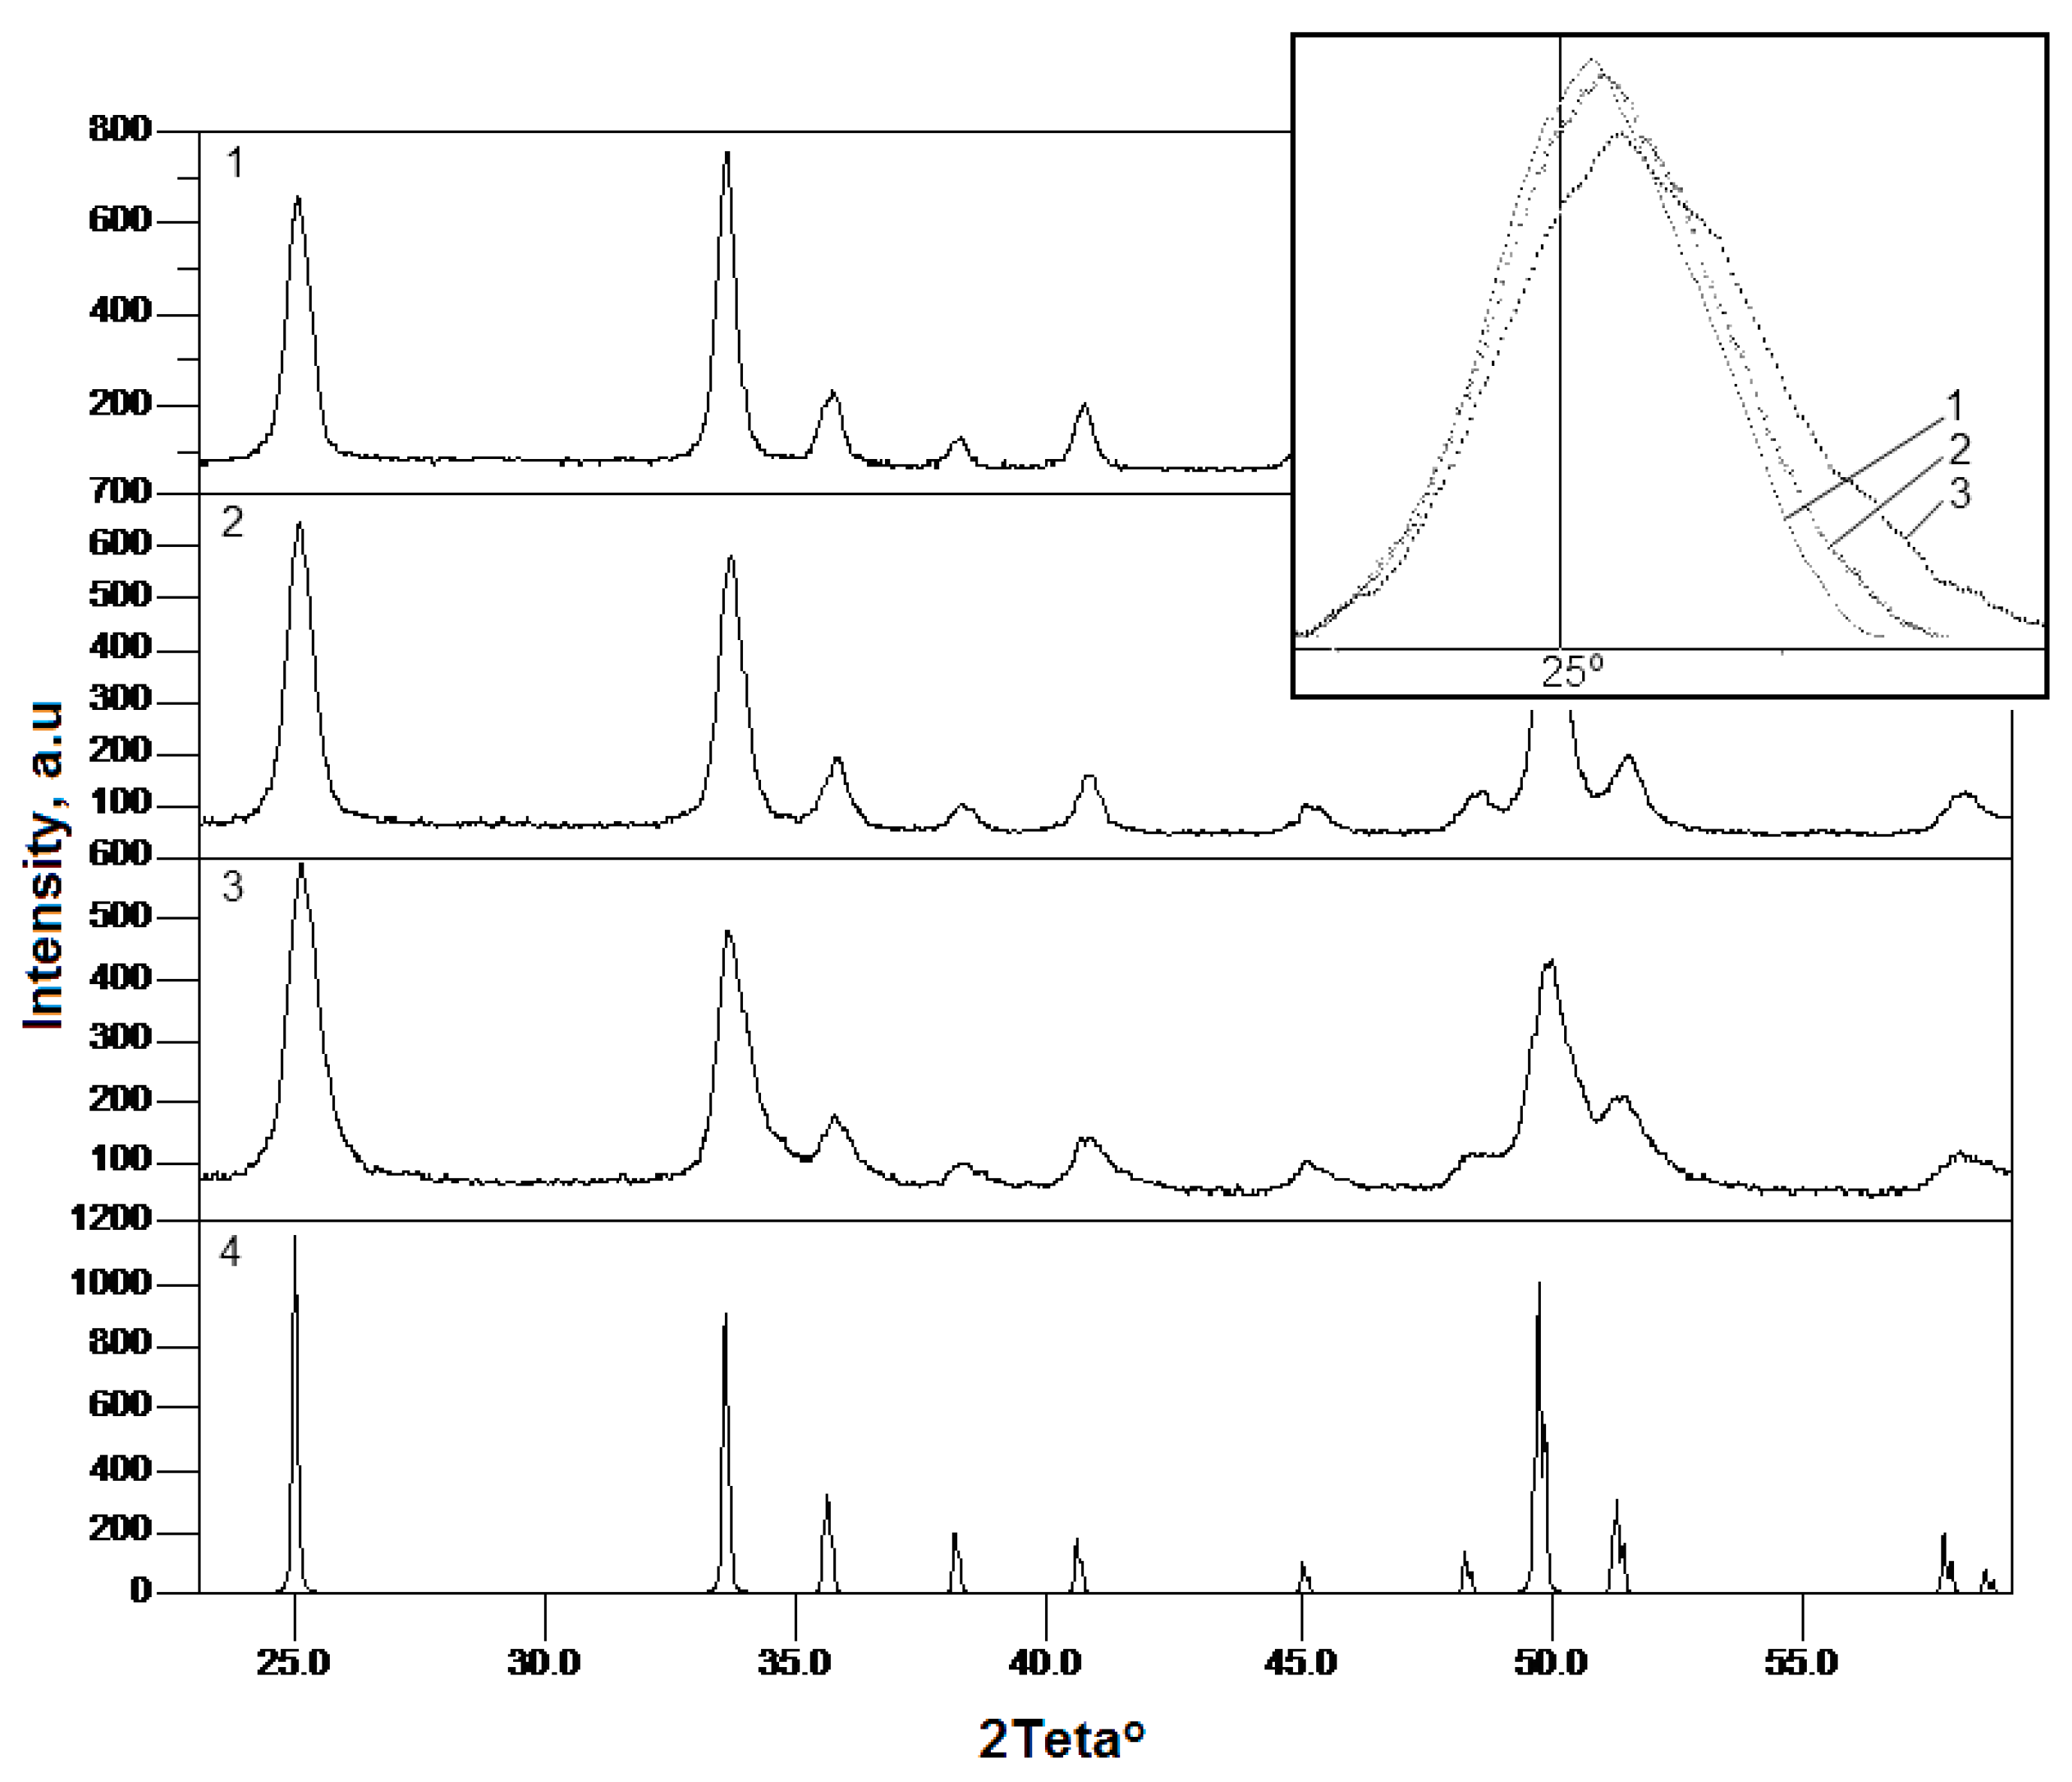
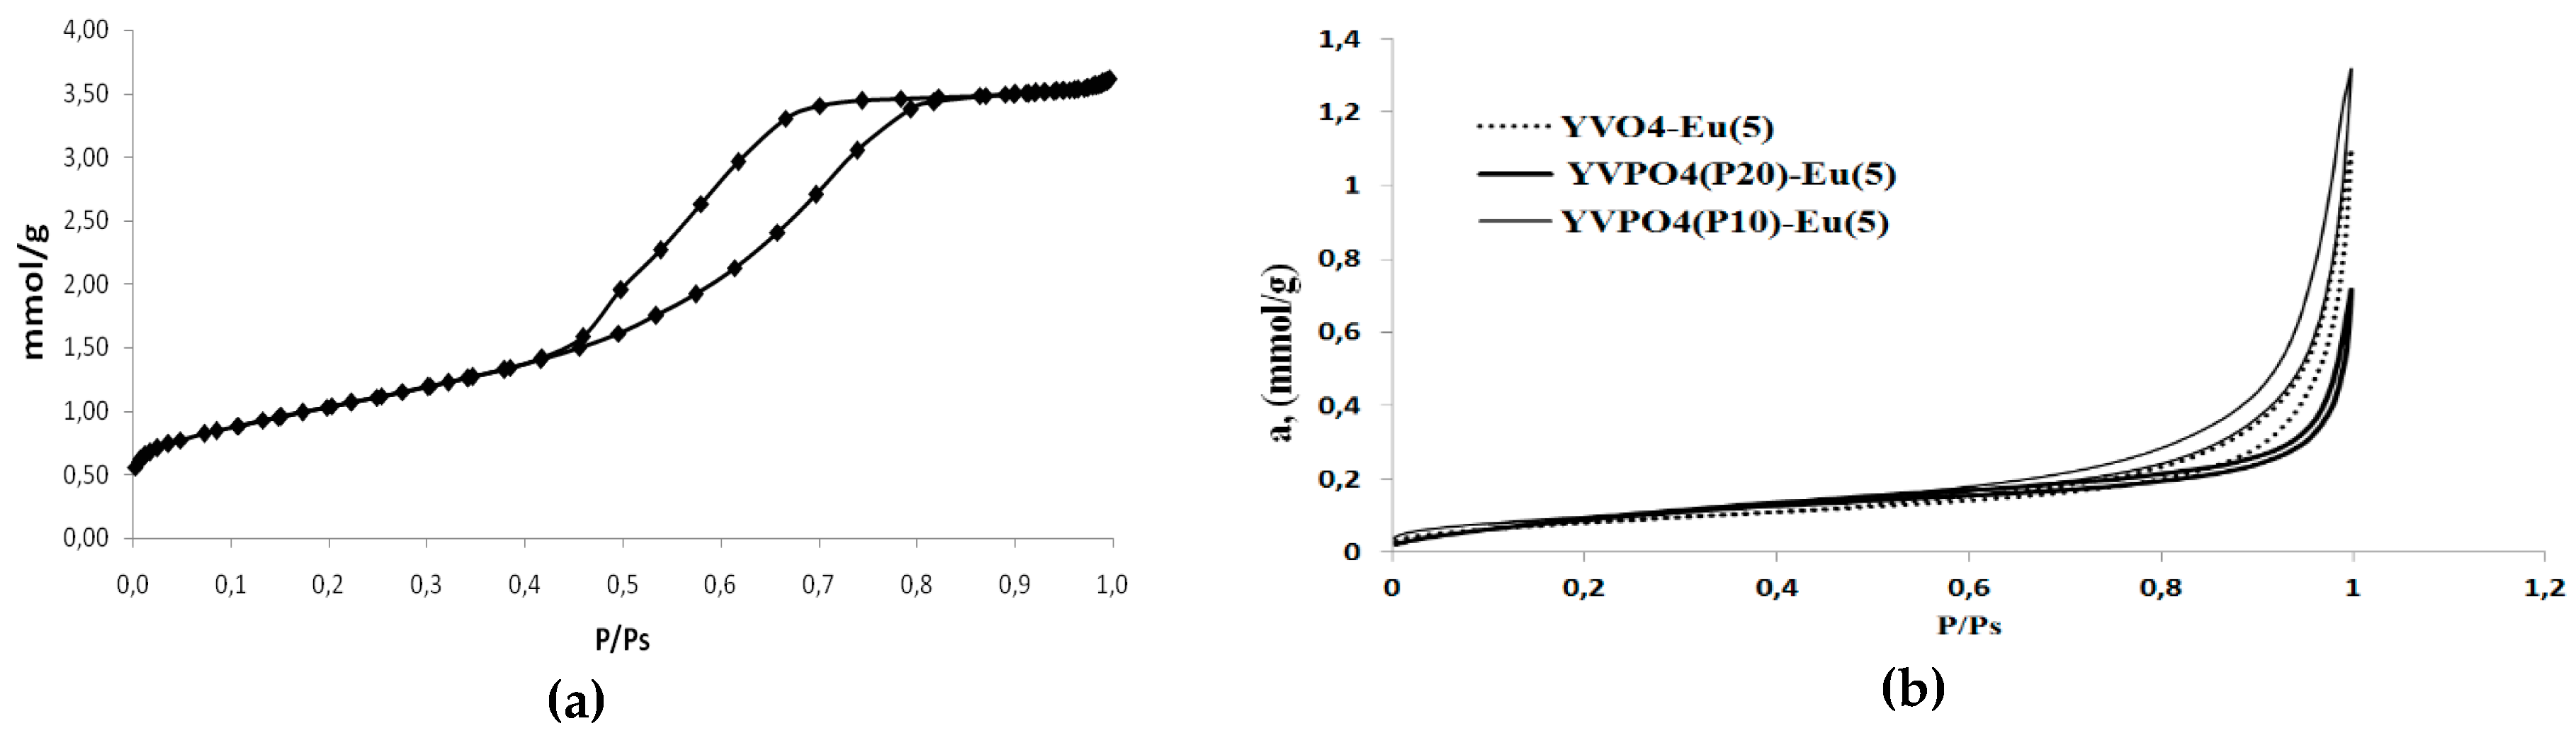
3. Results and Discussion
3.1. Pore Structure
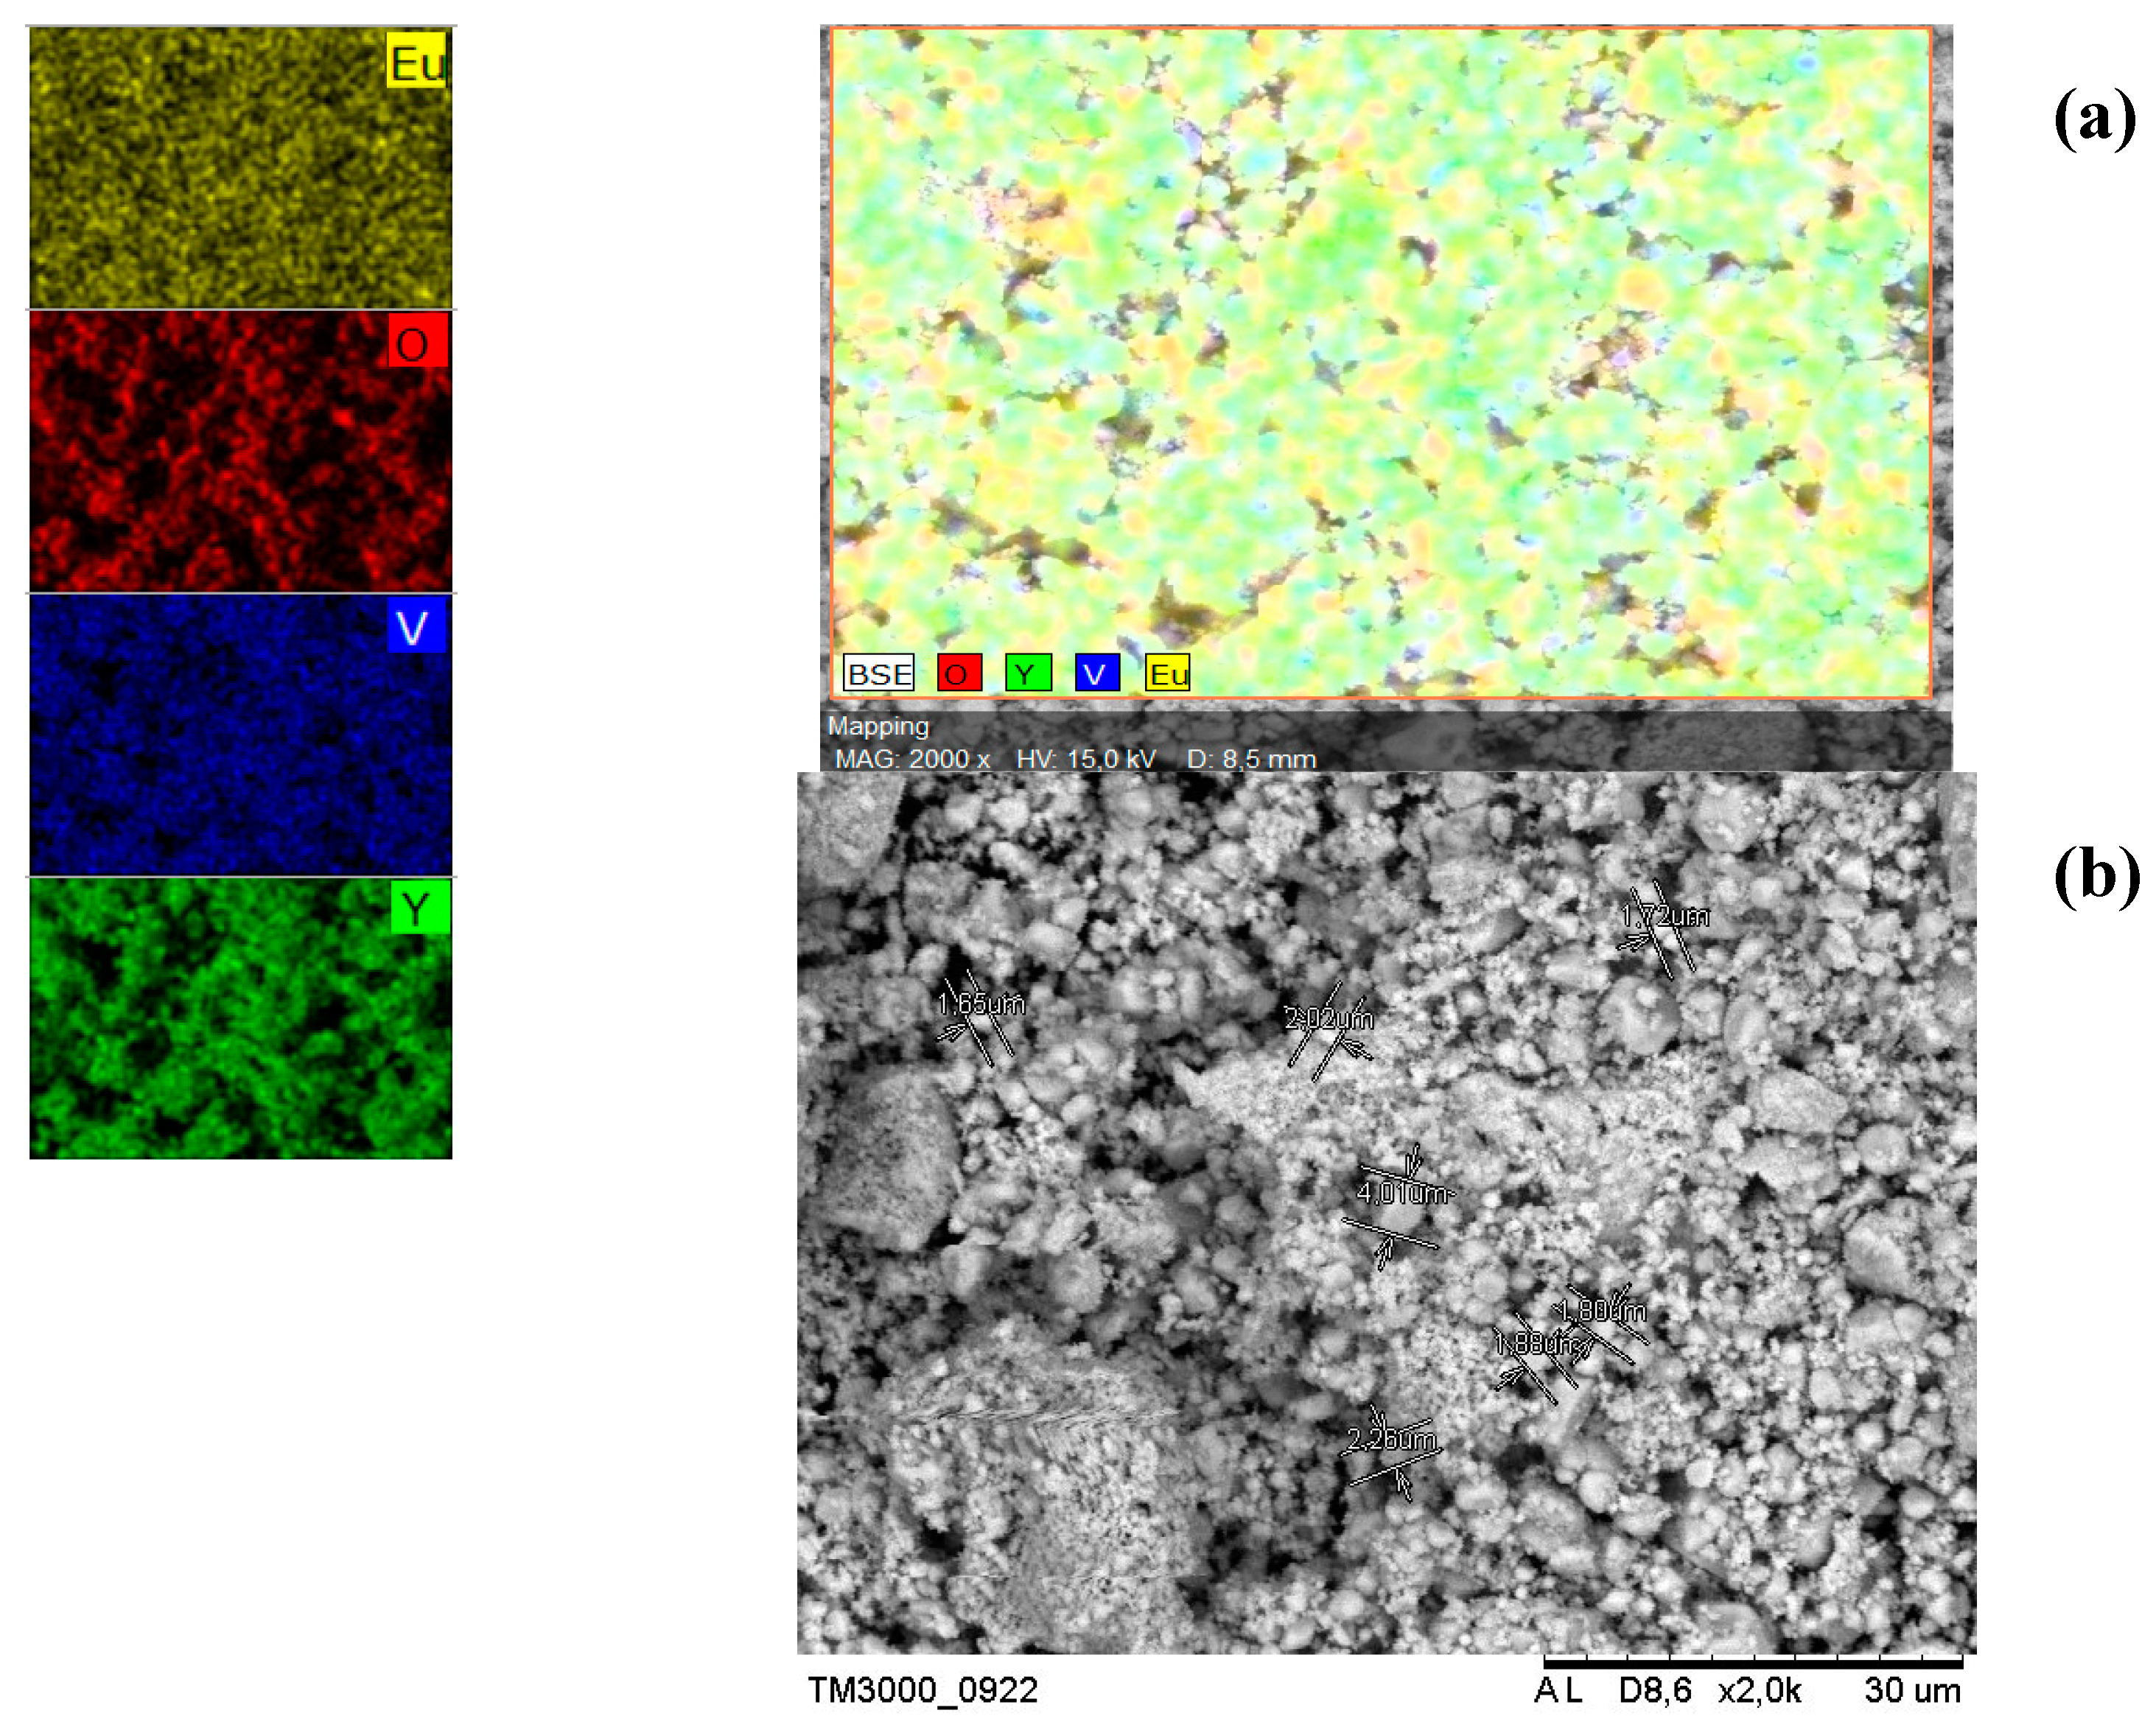
3.2. SEM
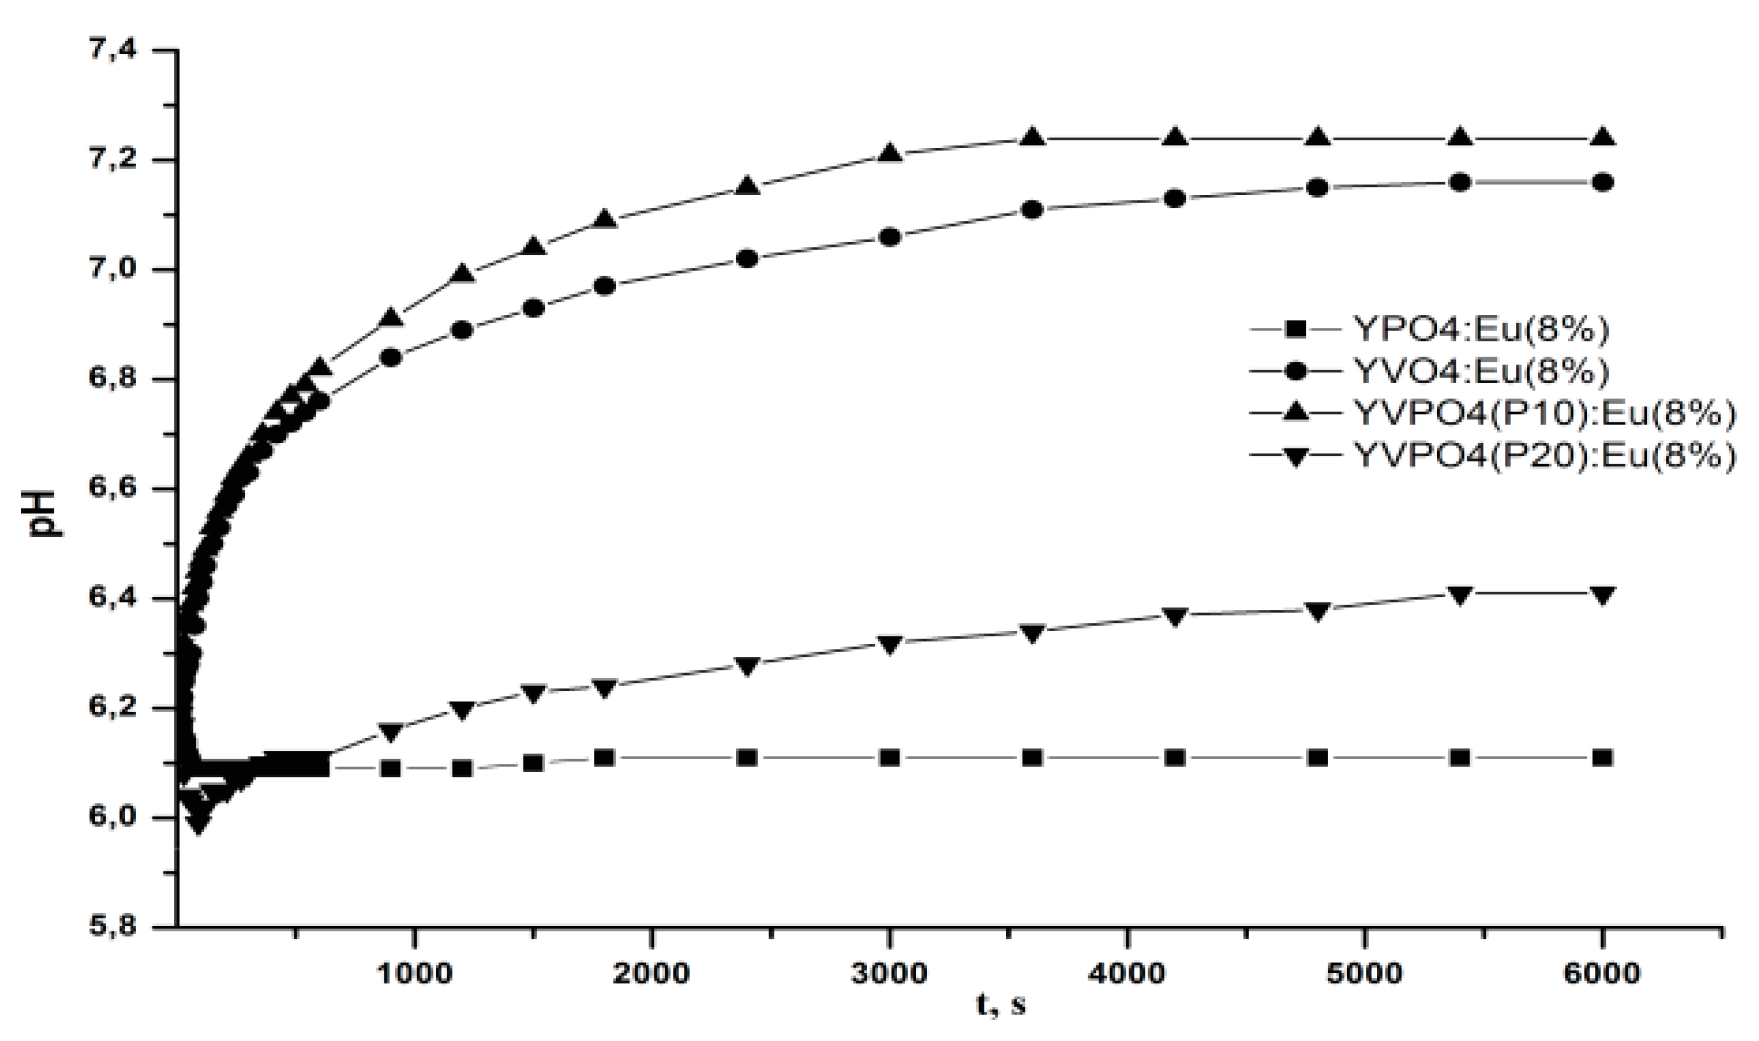
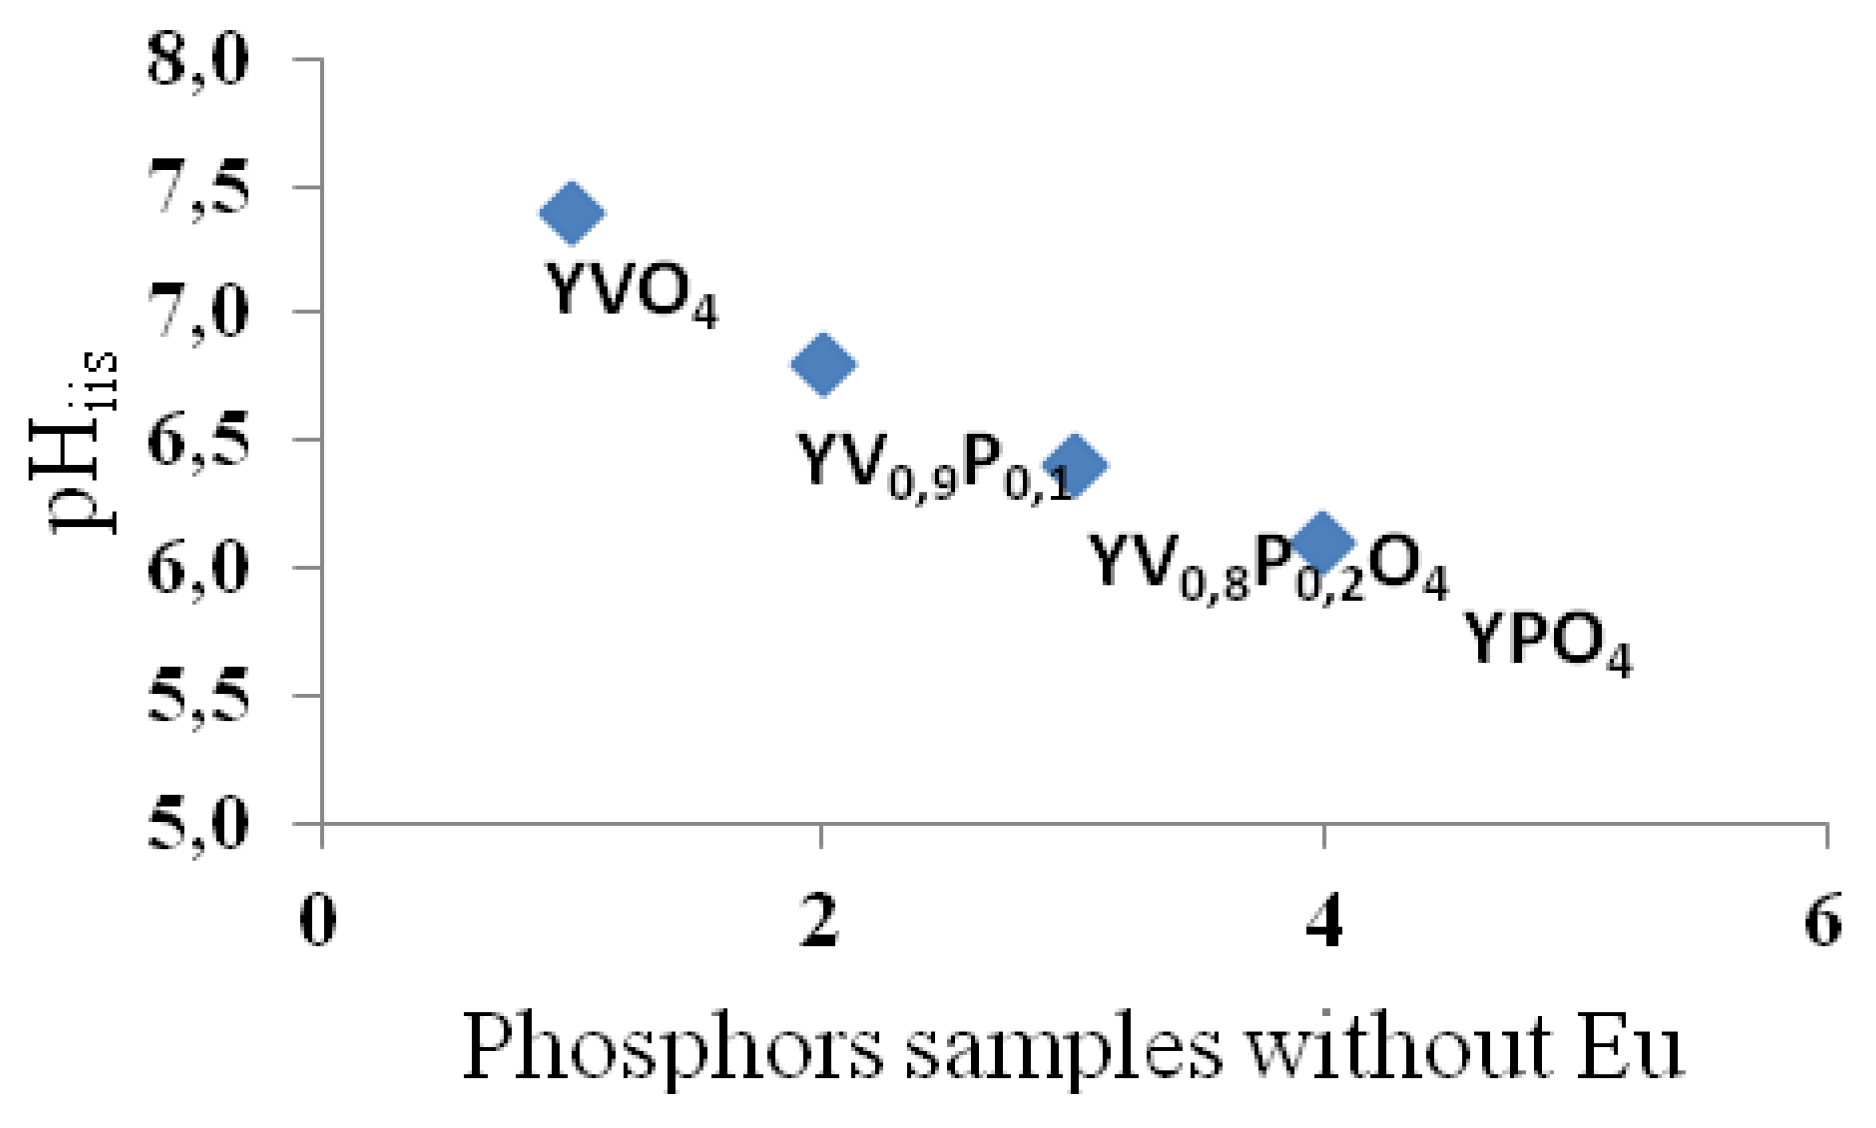
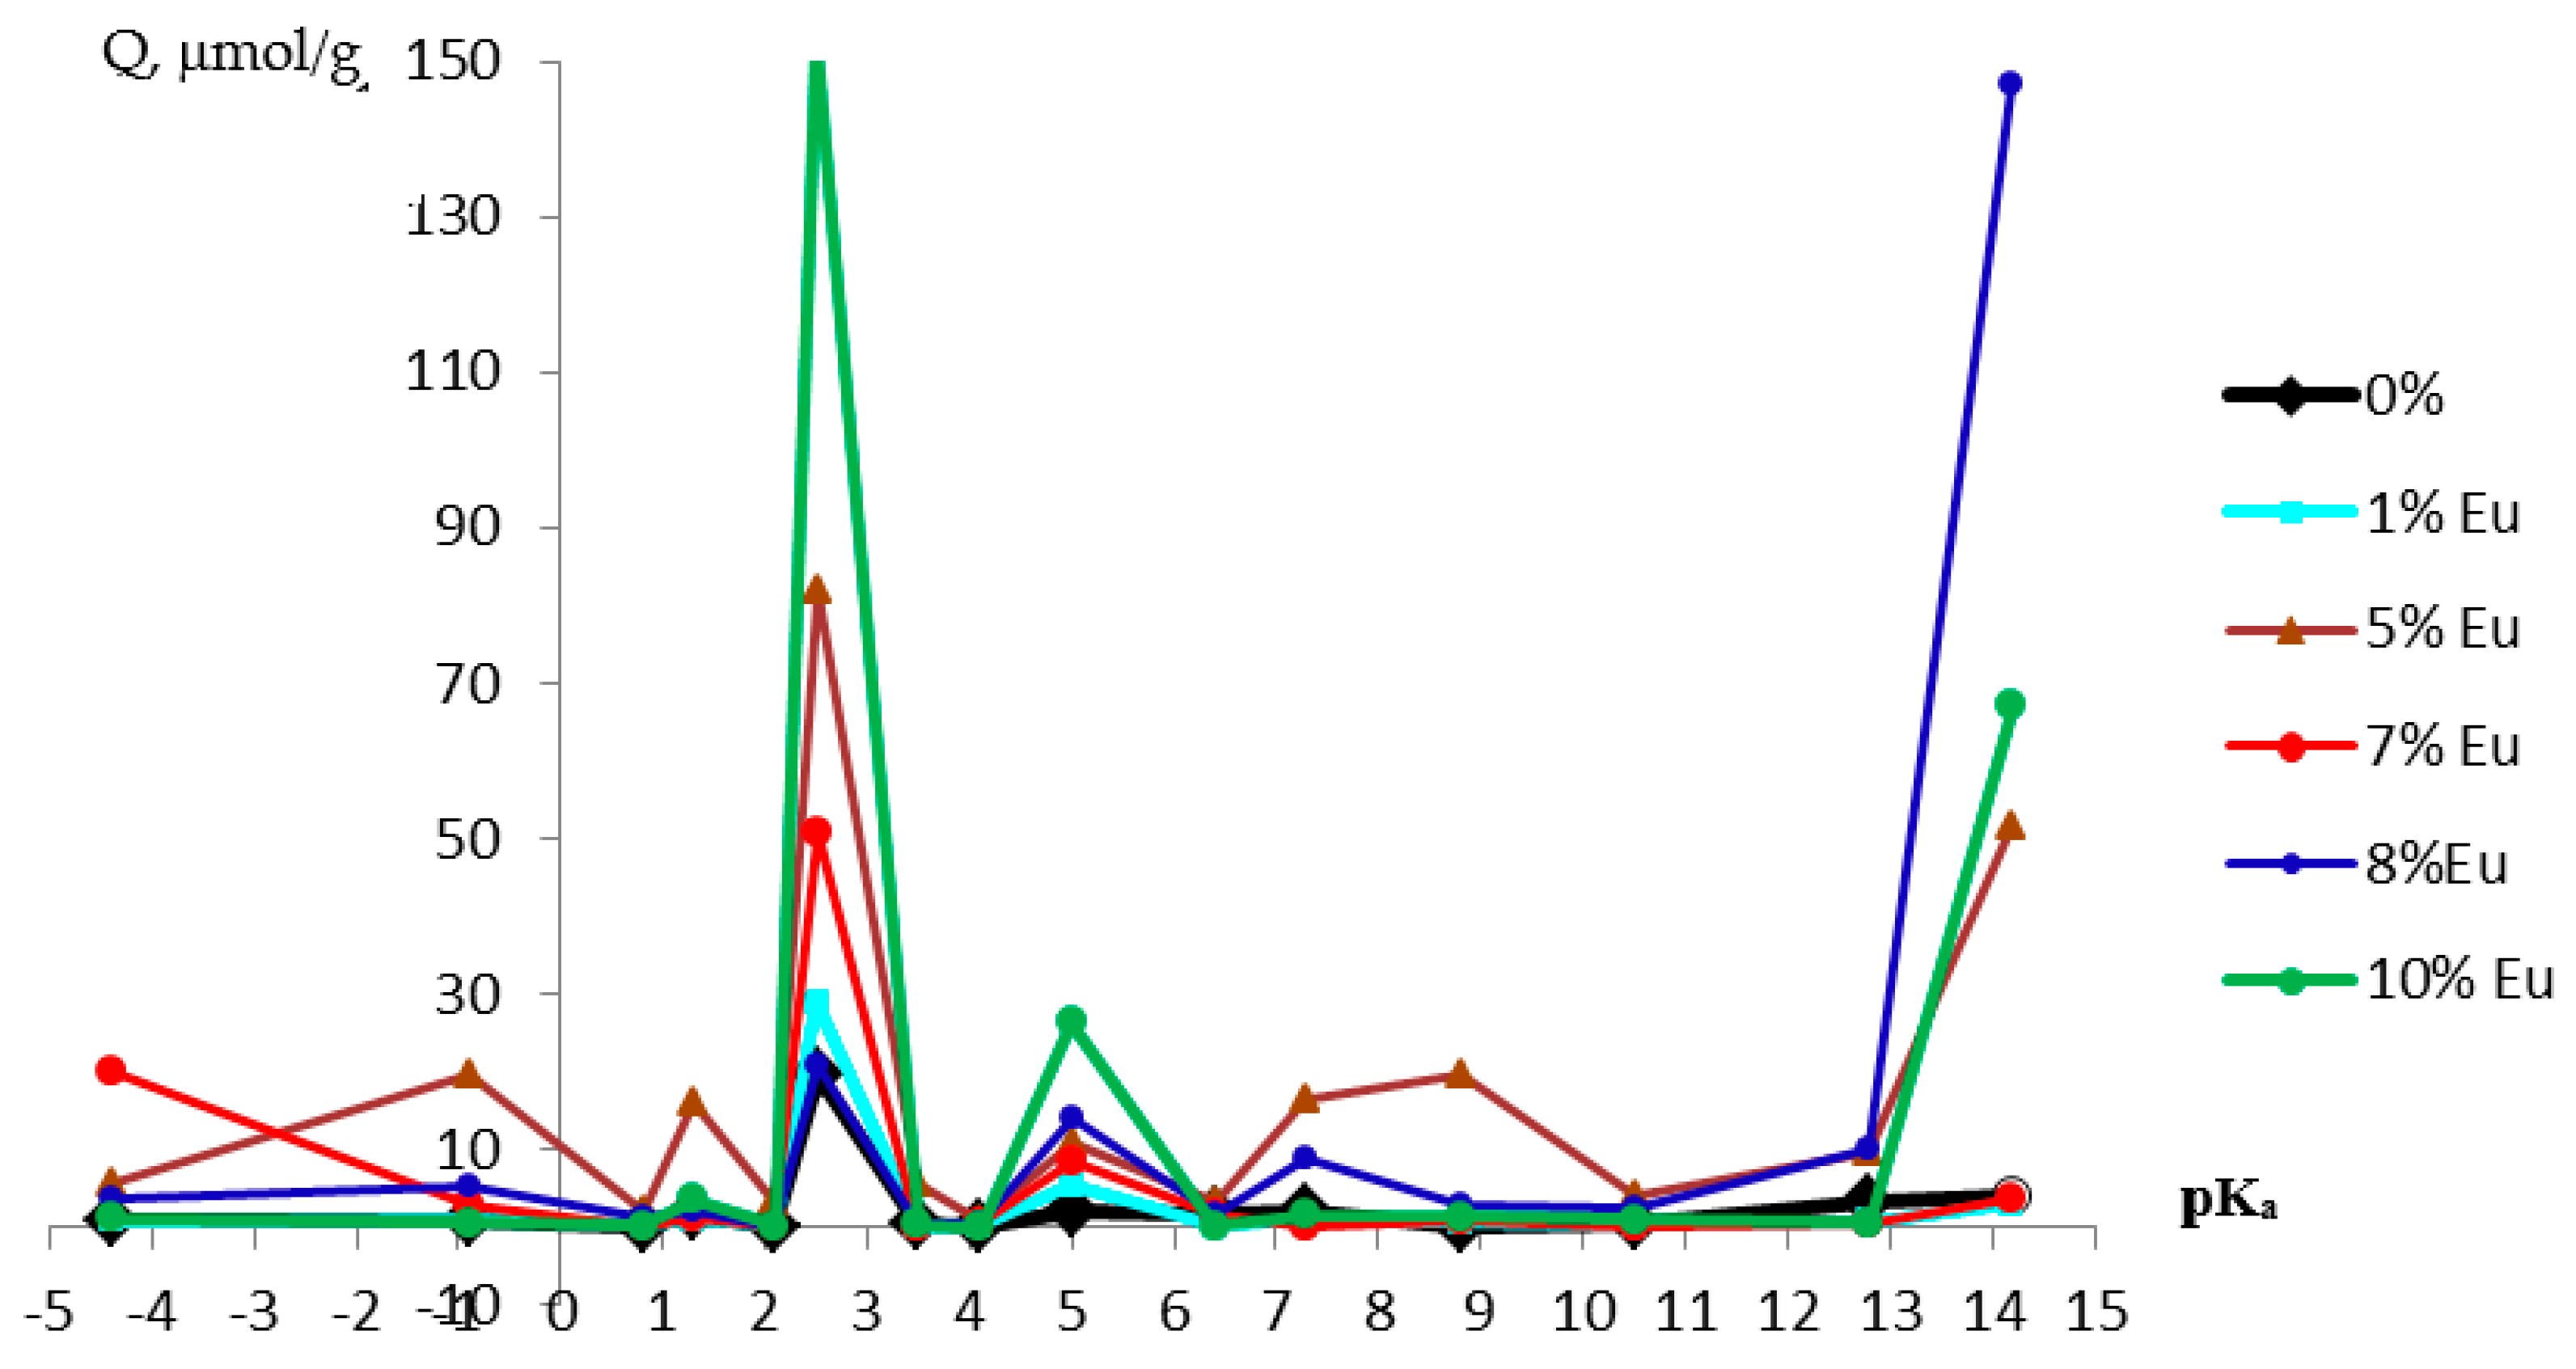
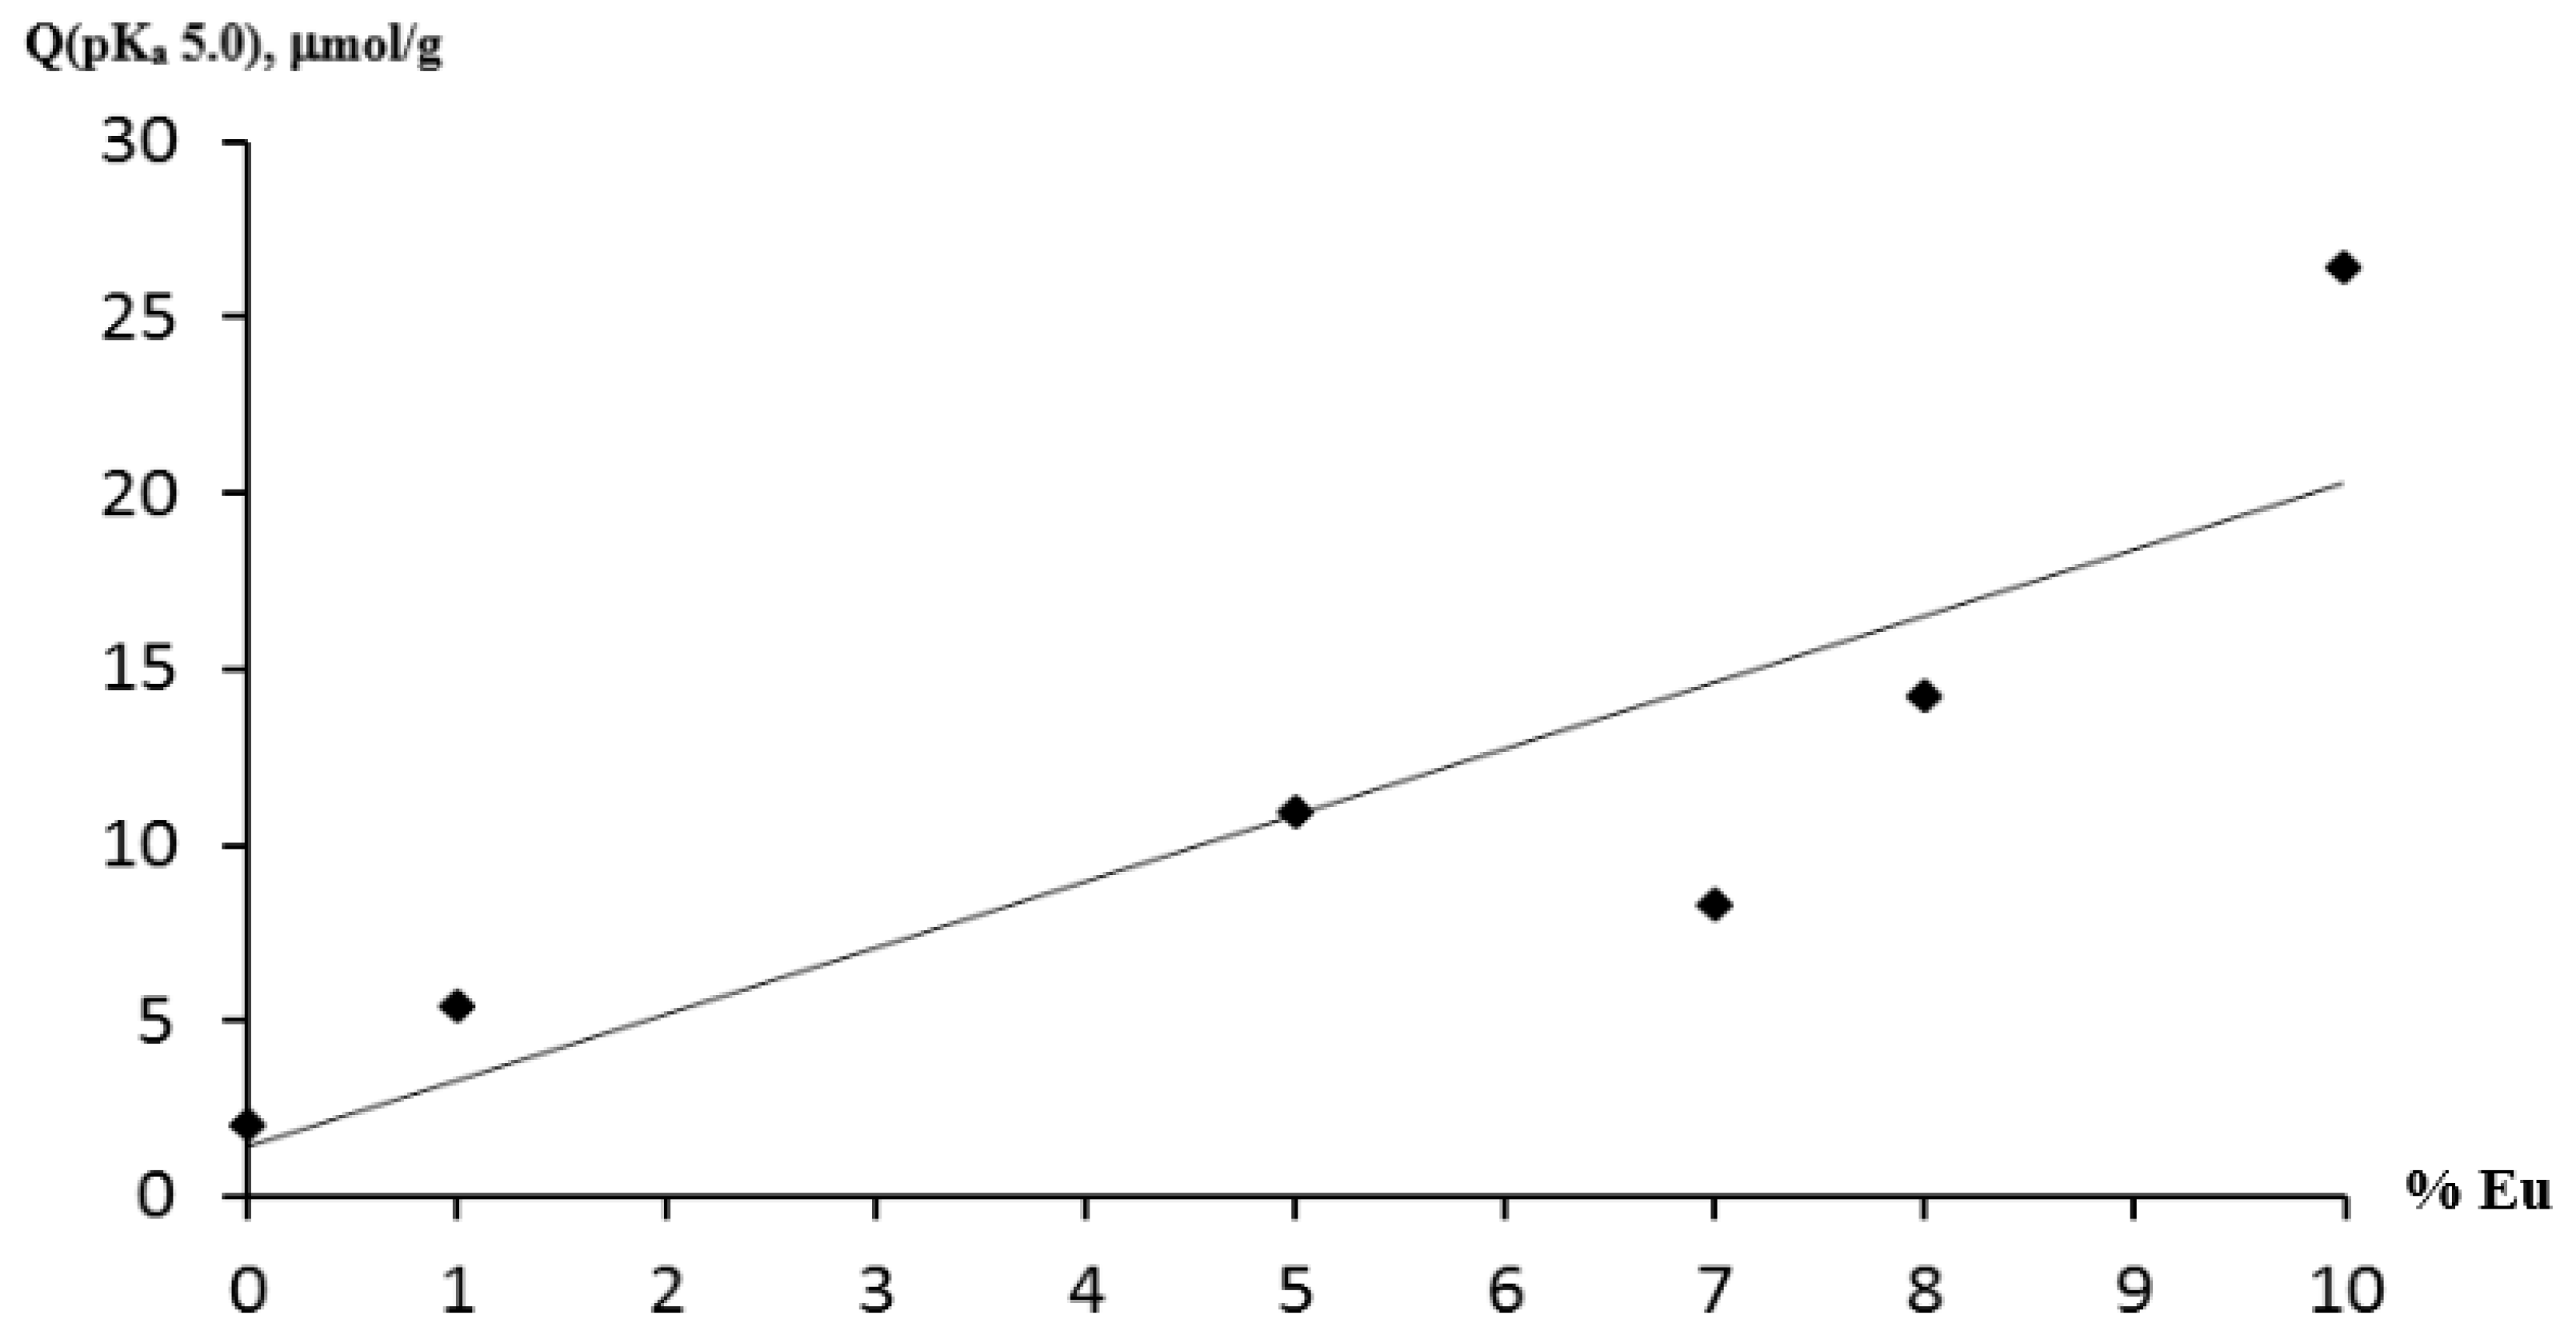
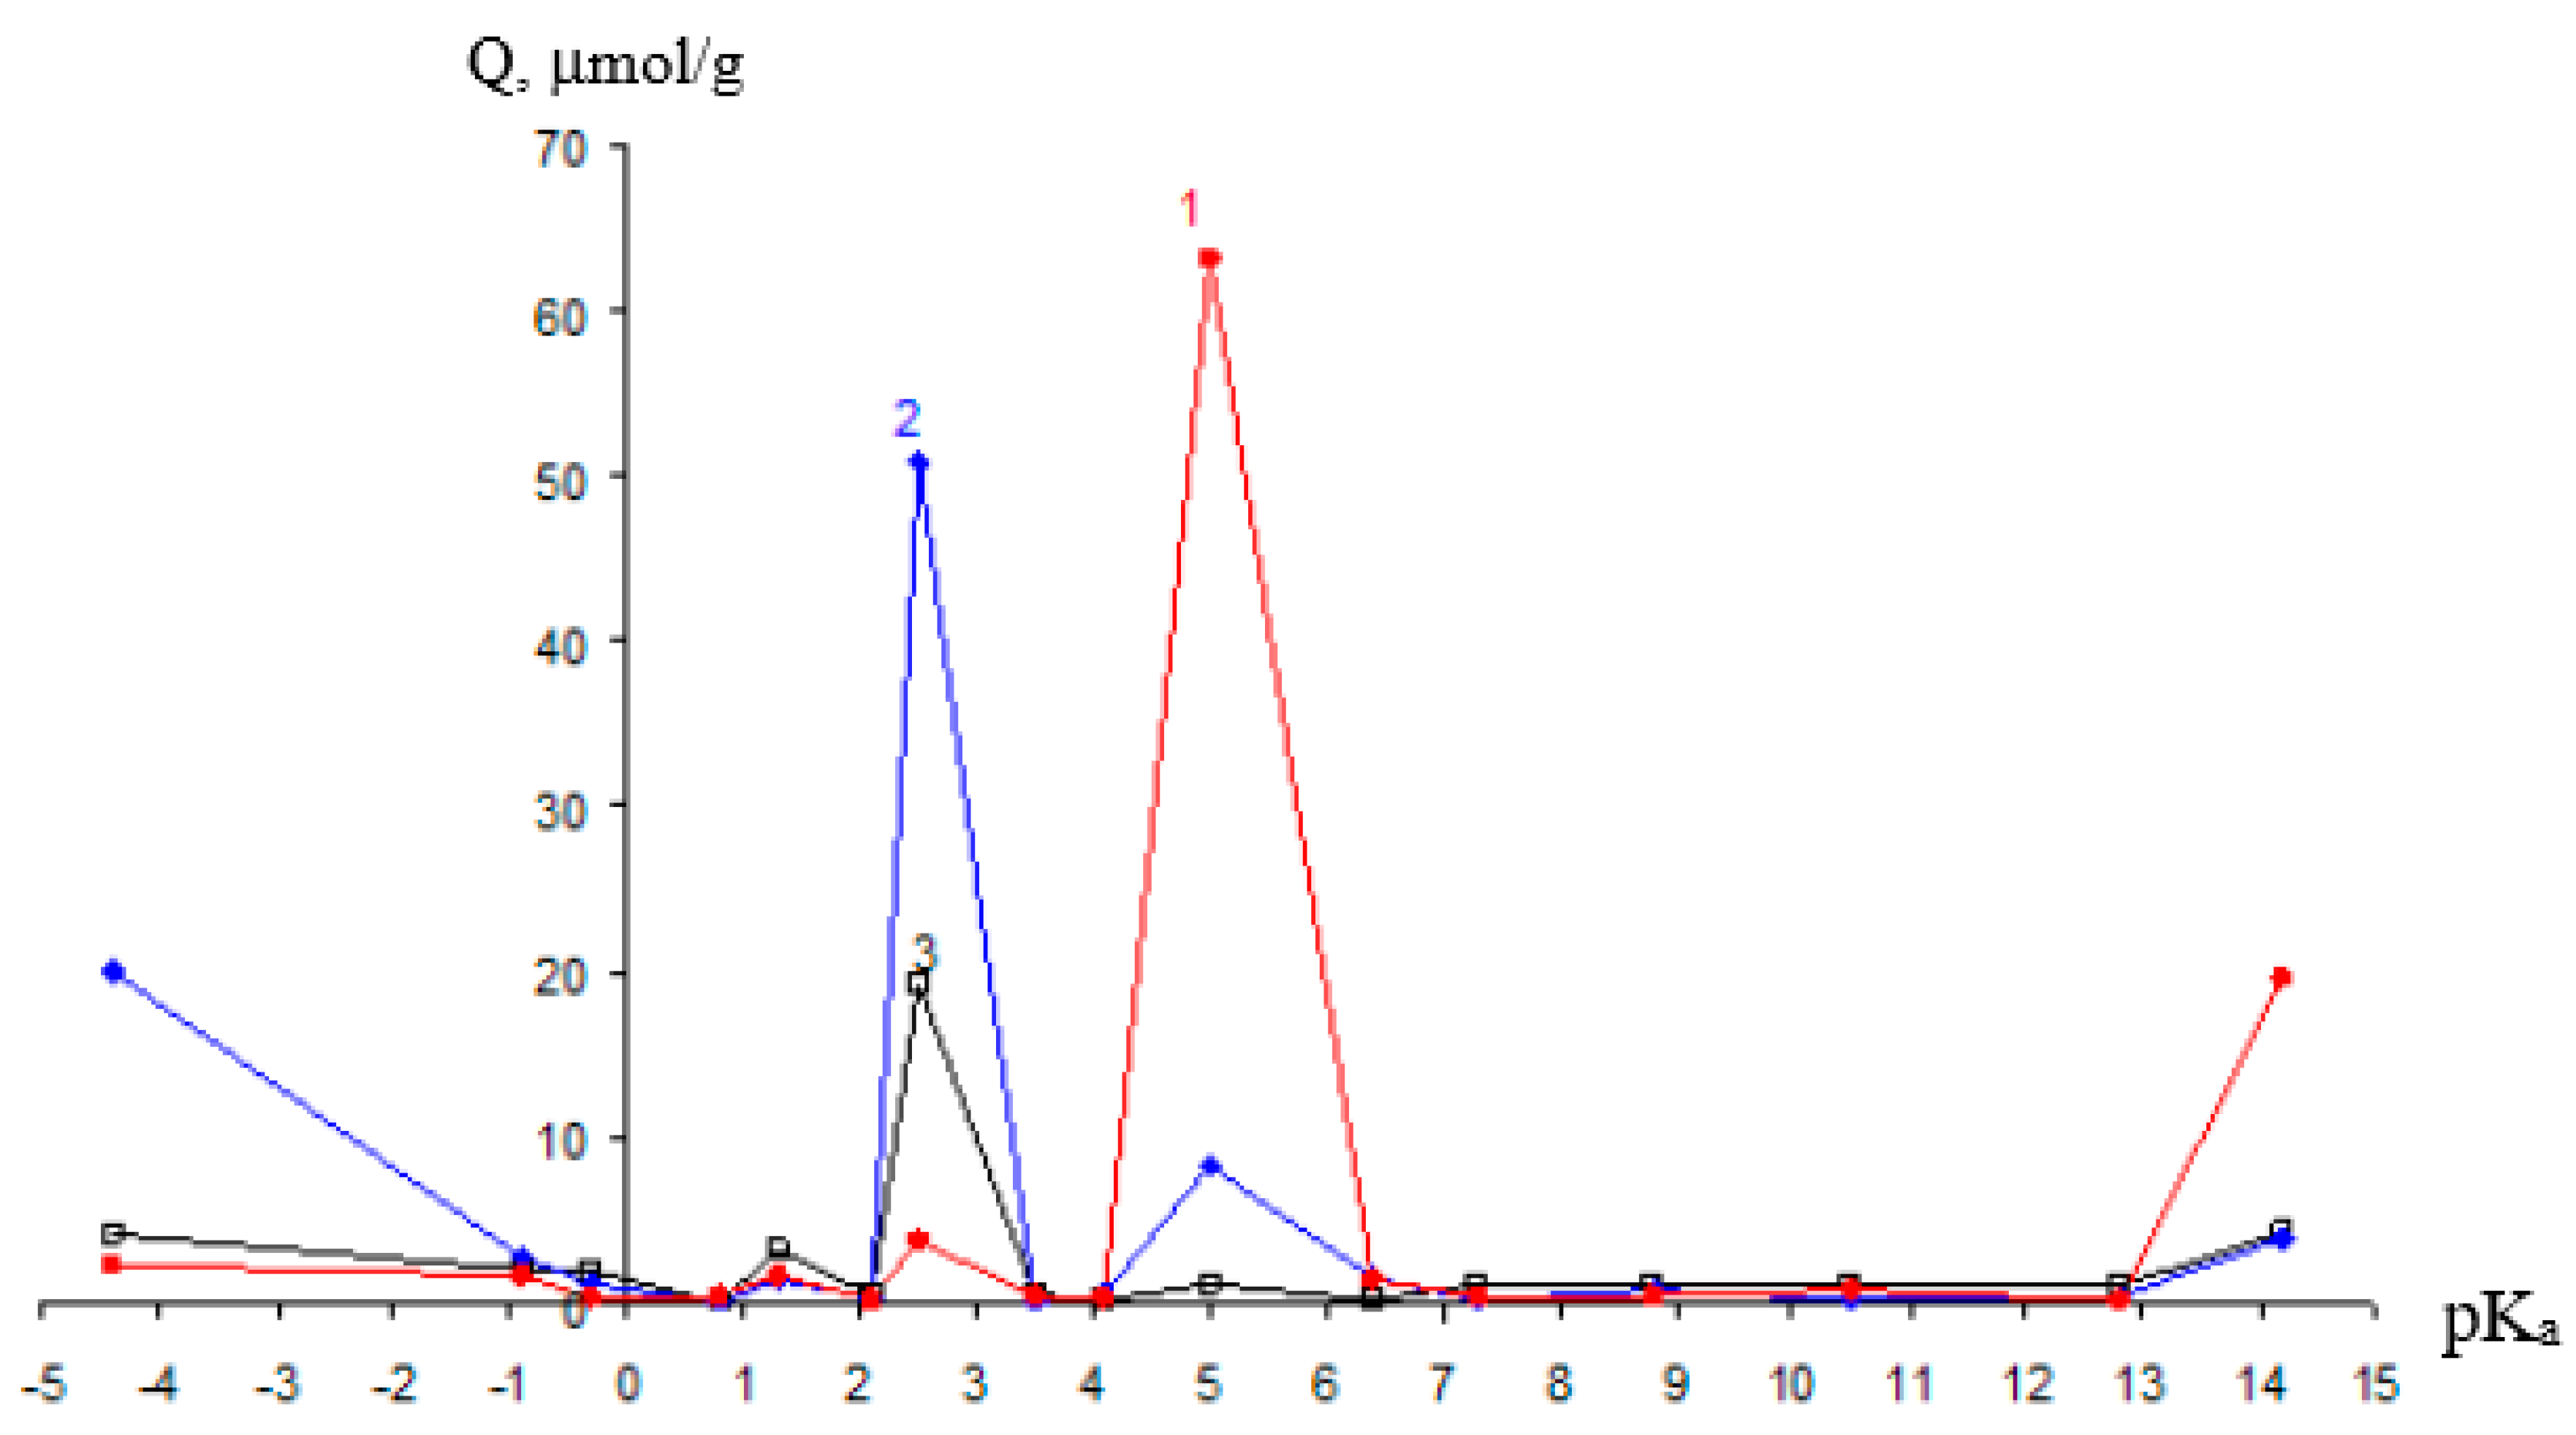
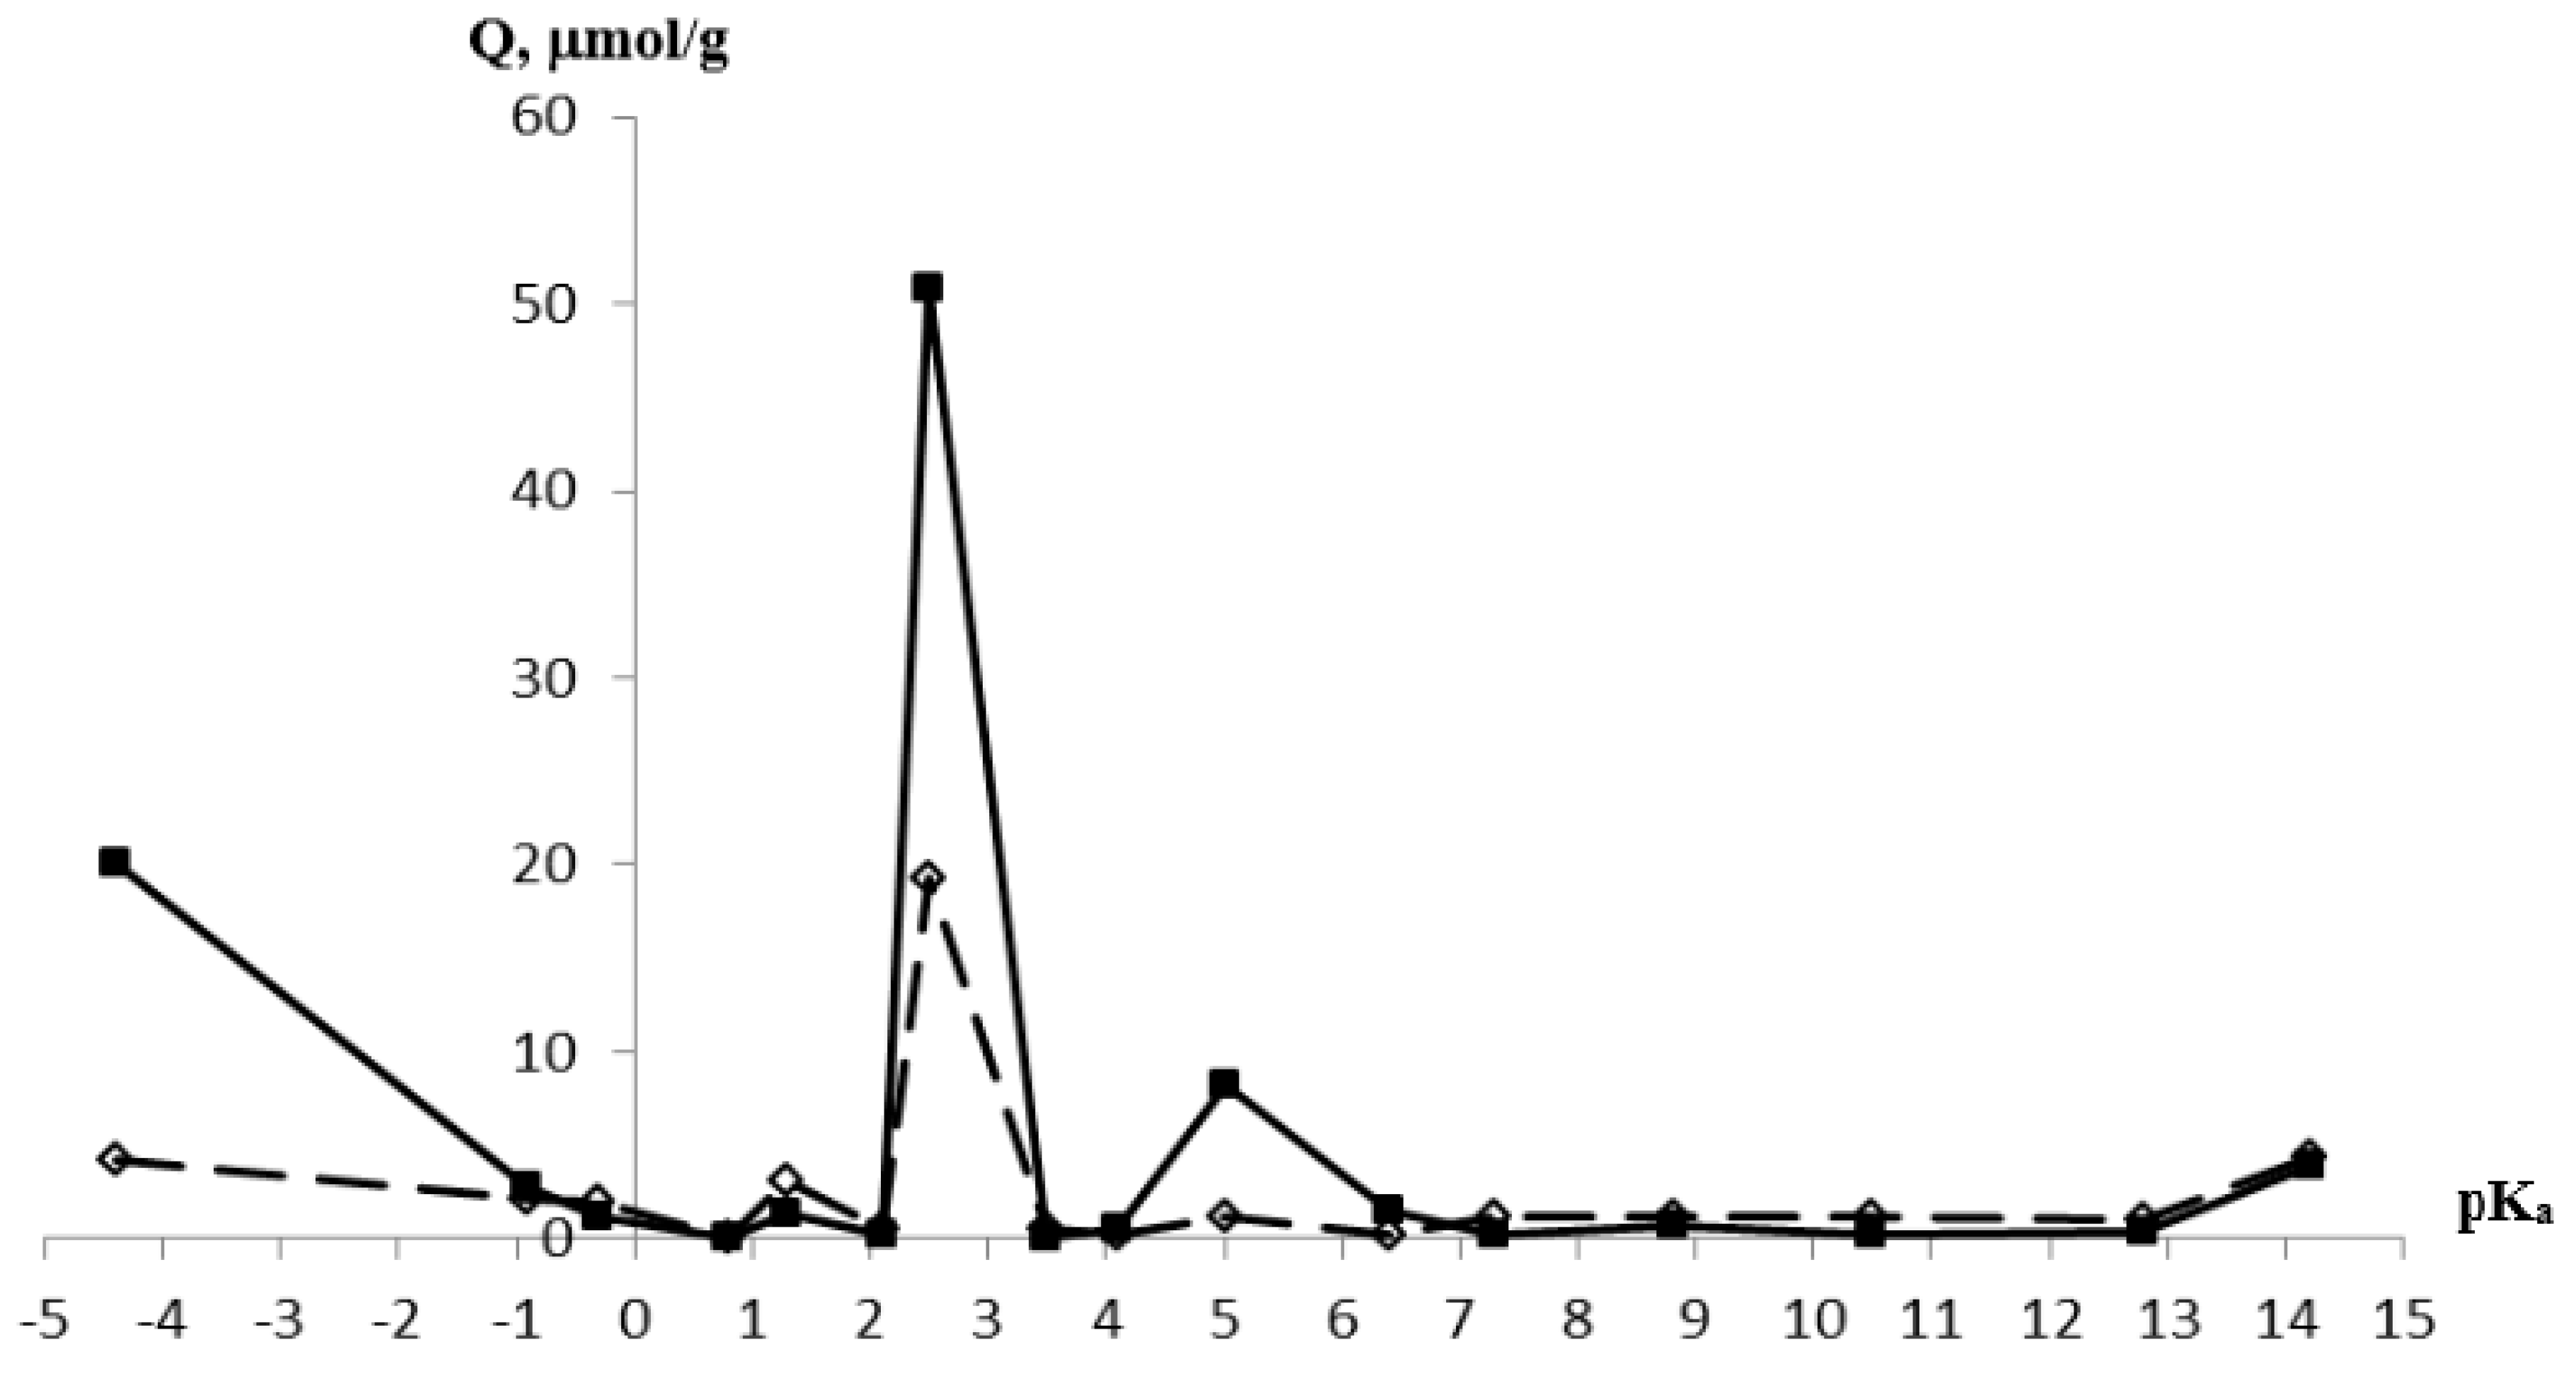
3.3. Acid-Basic Properties of the Samples
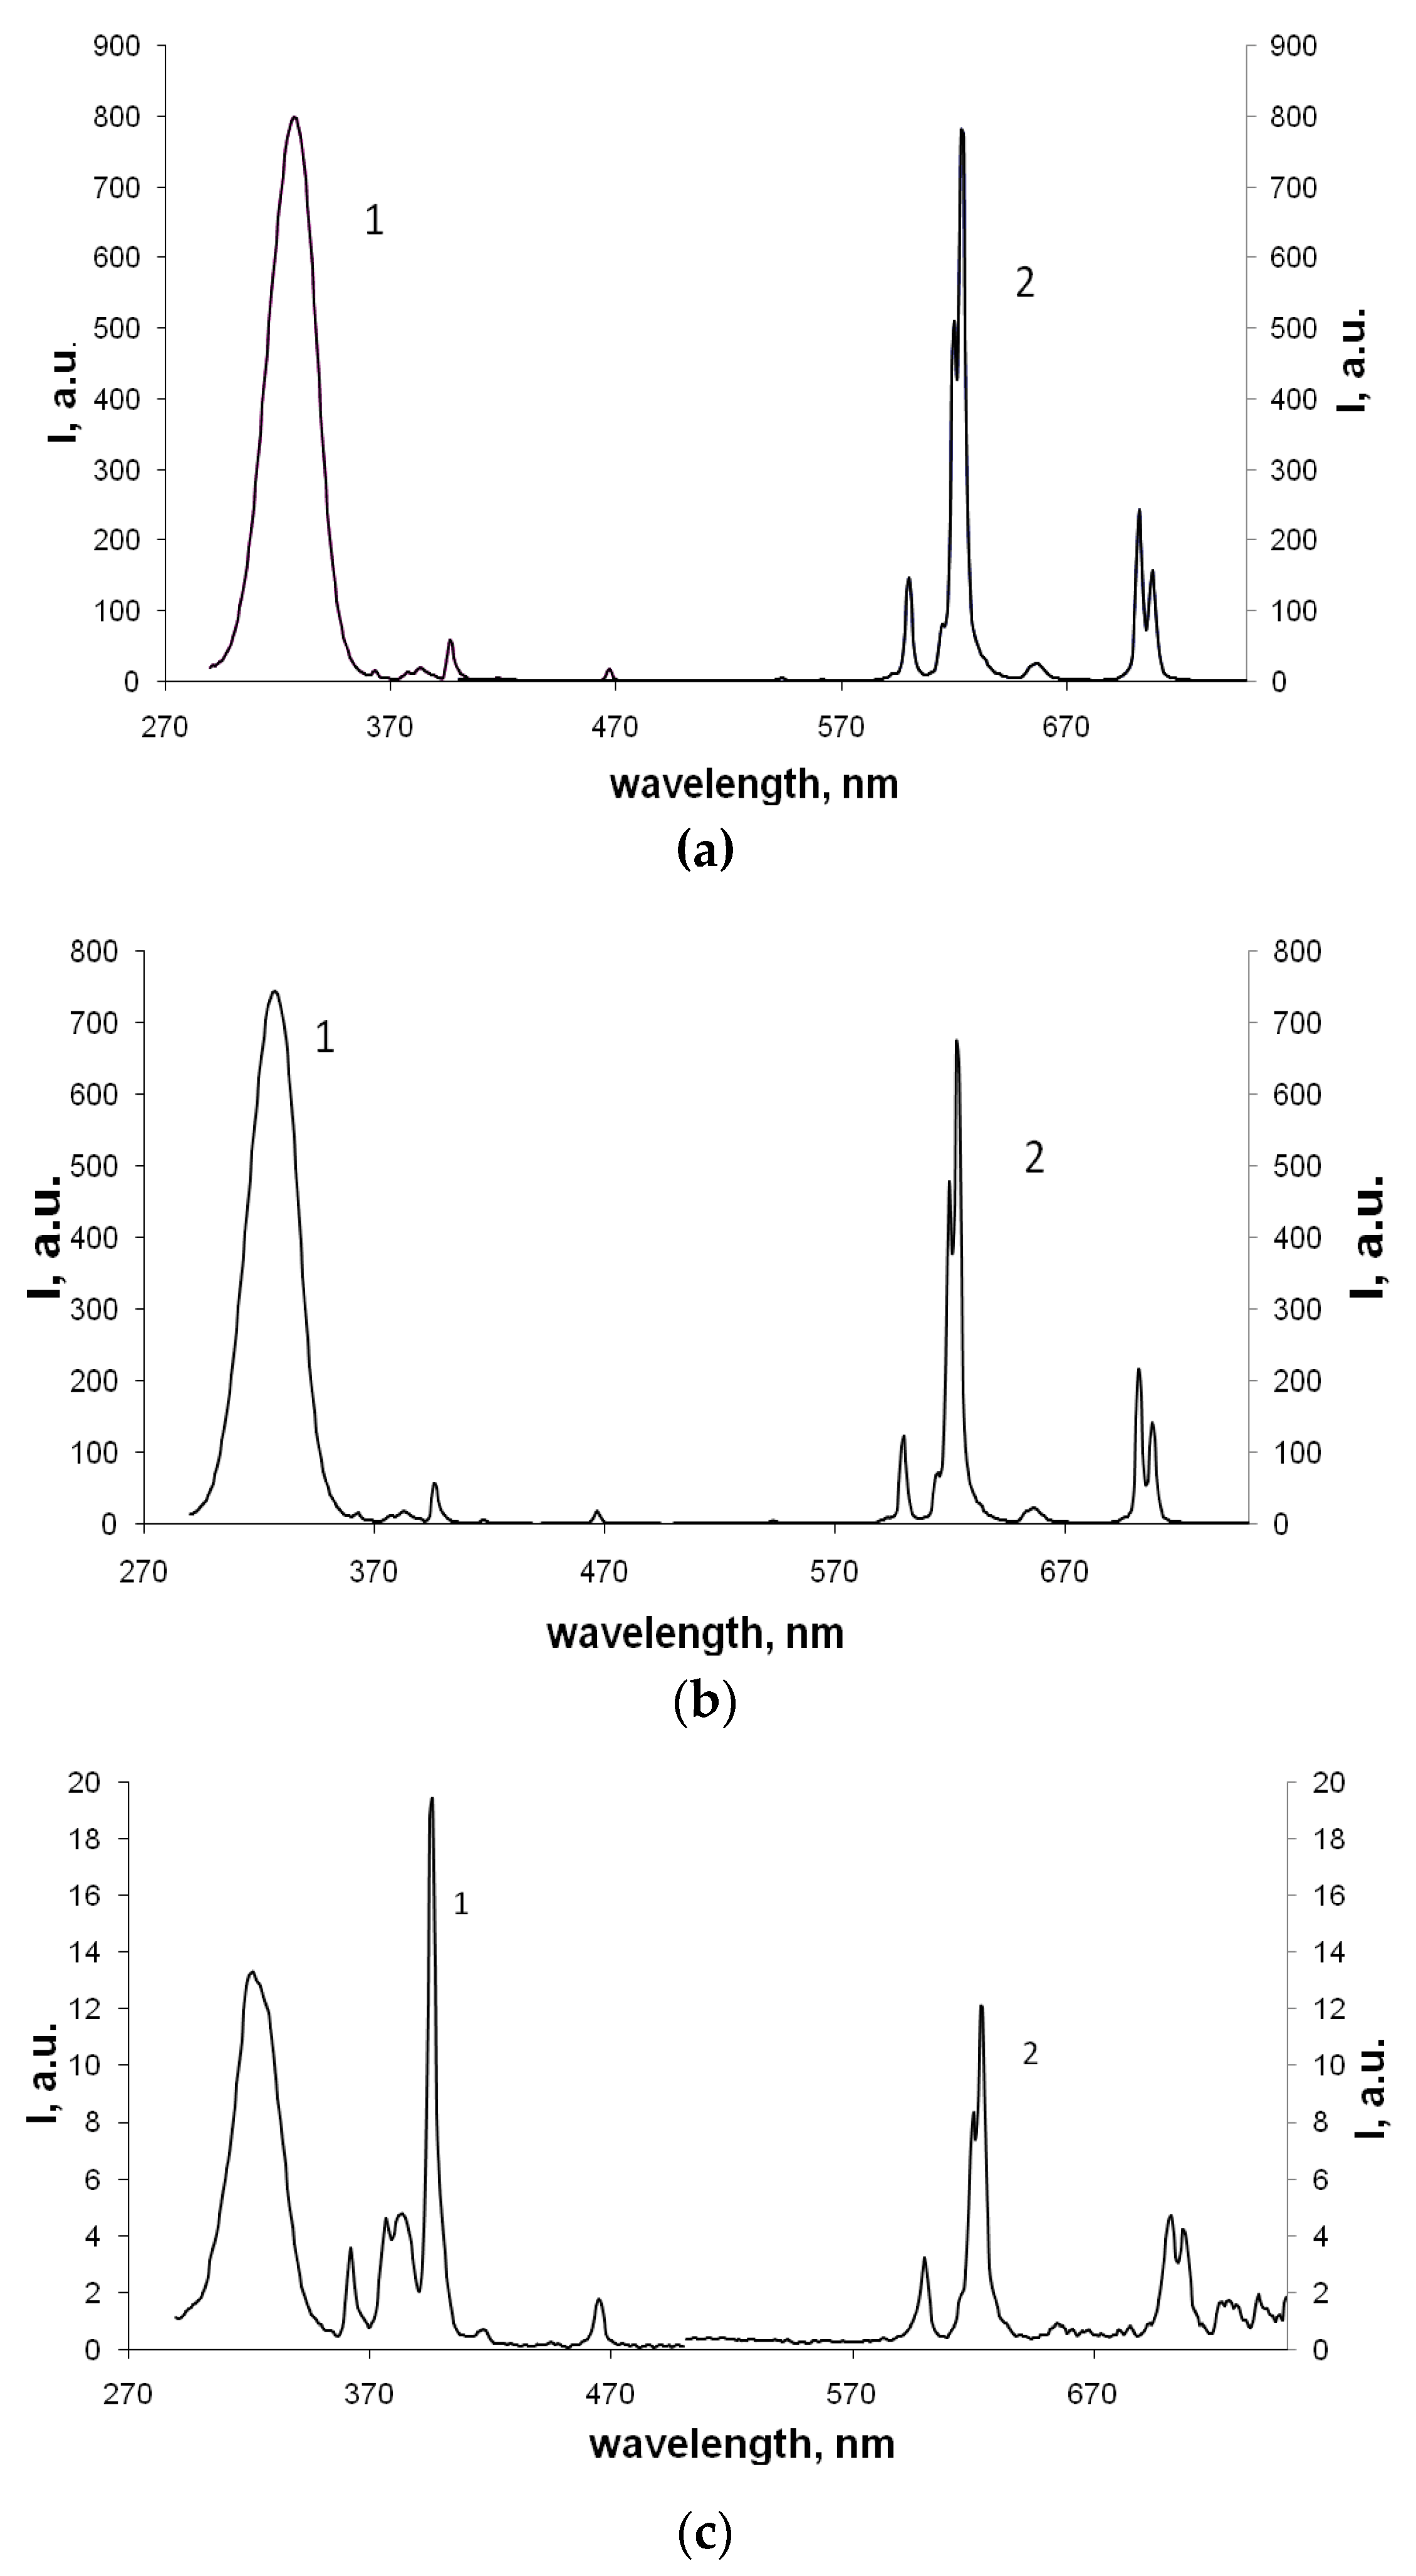
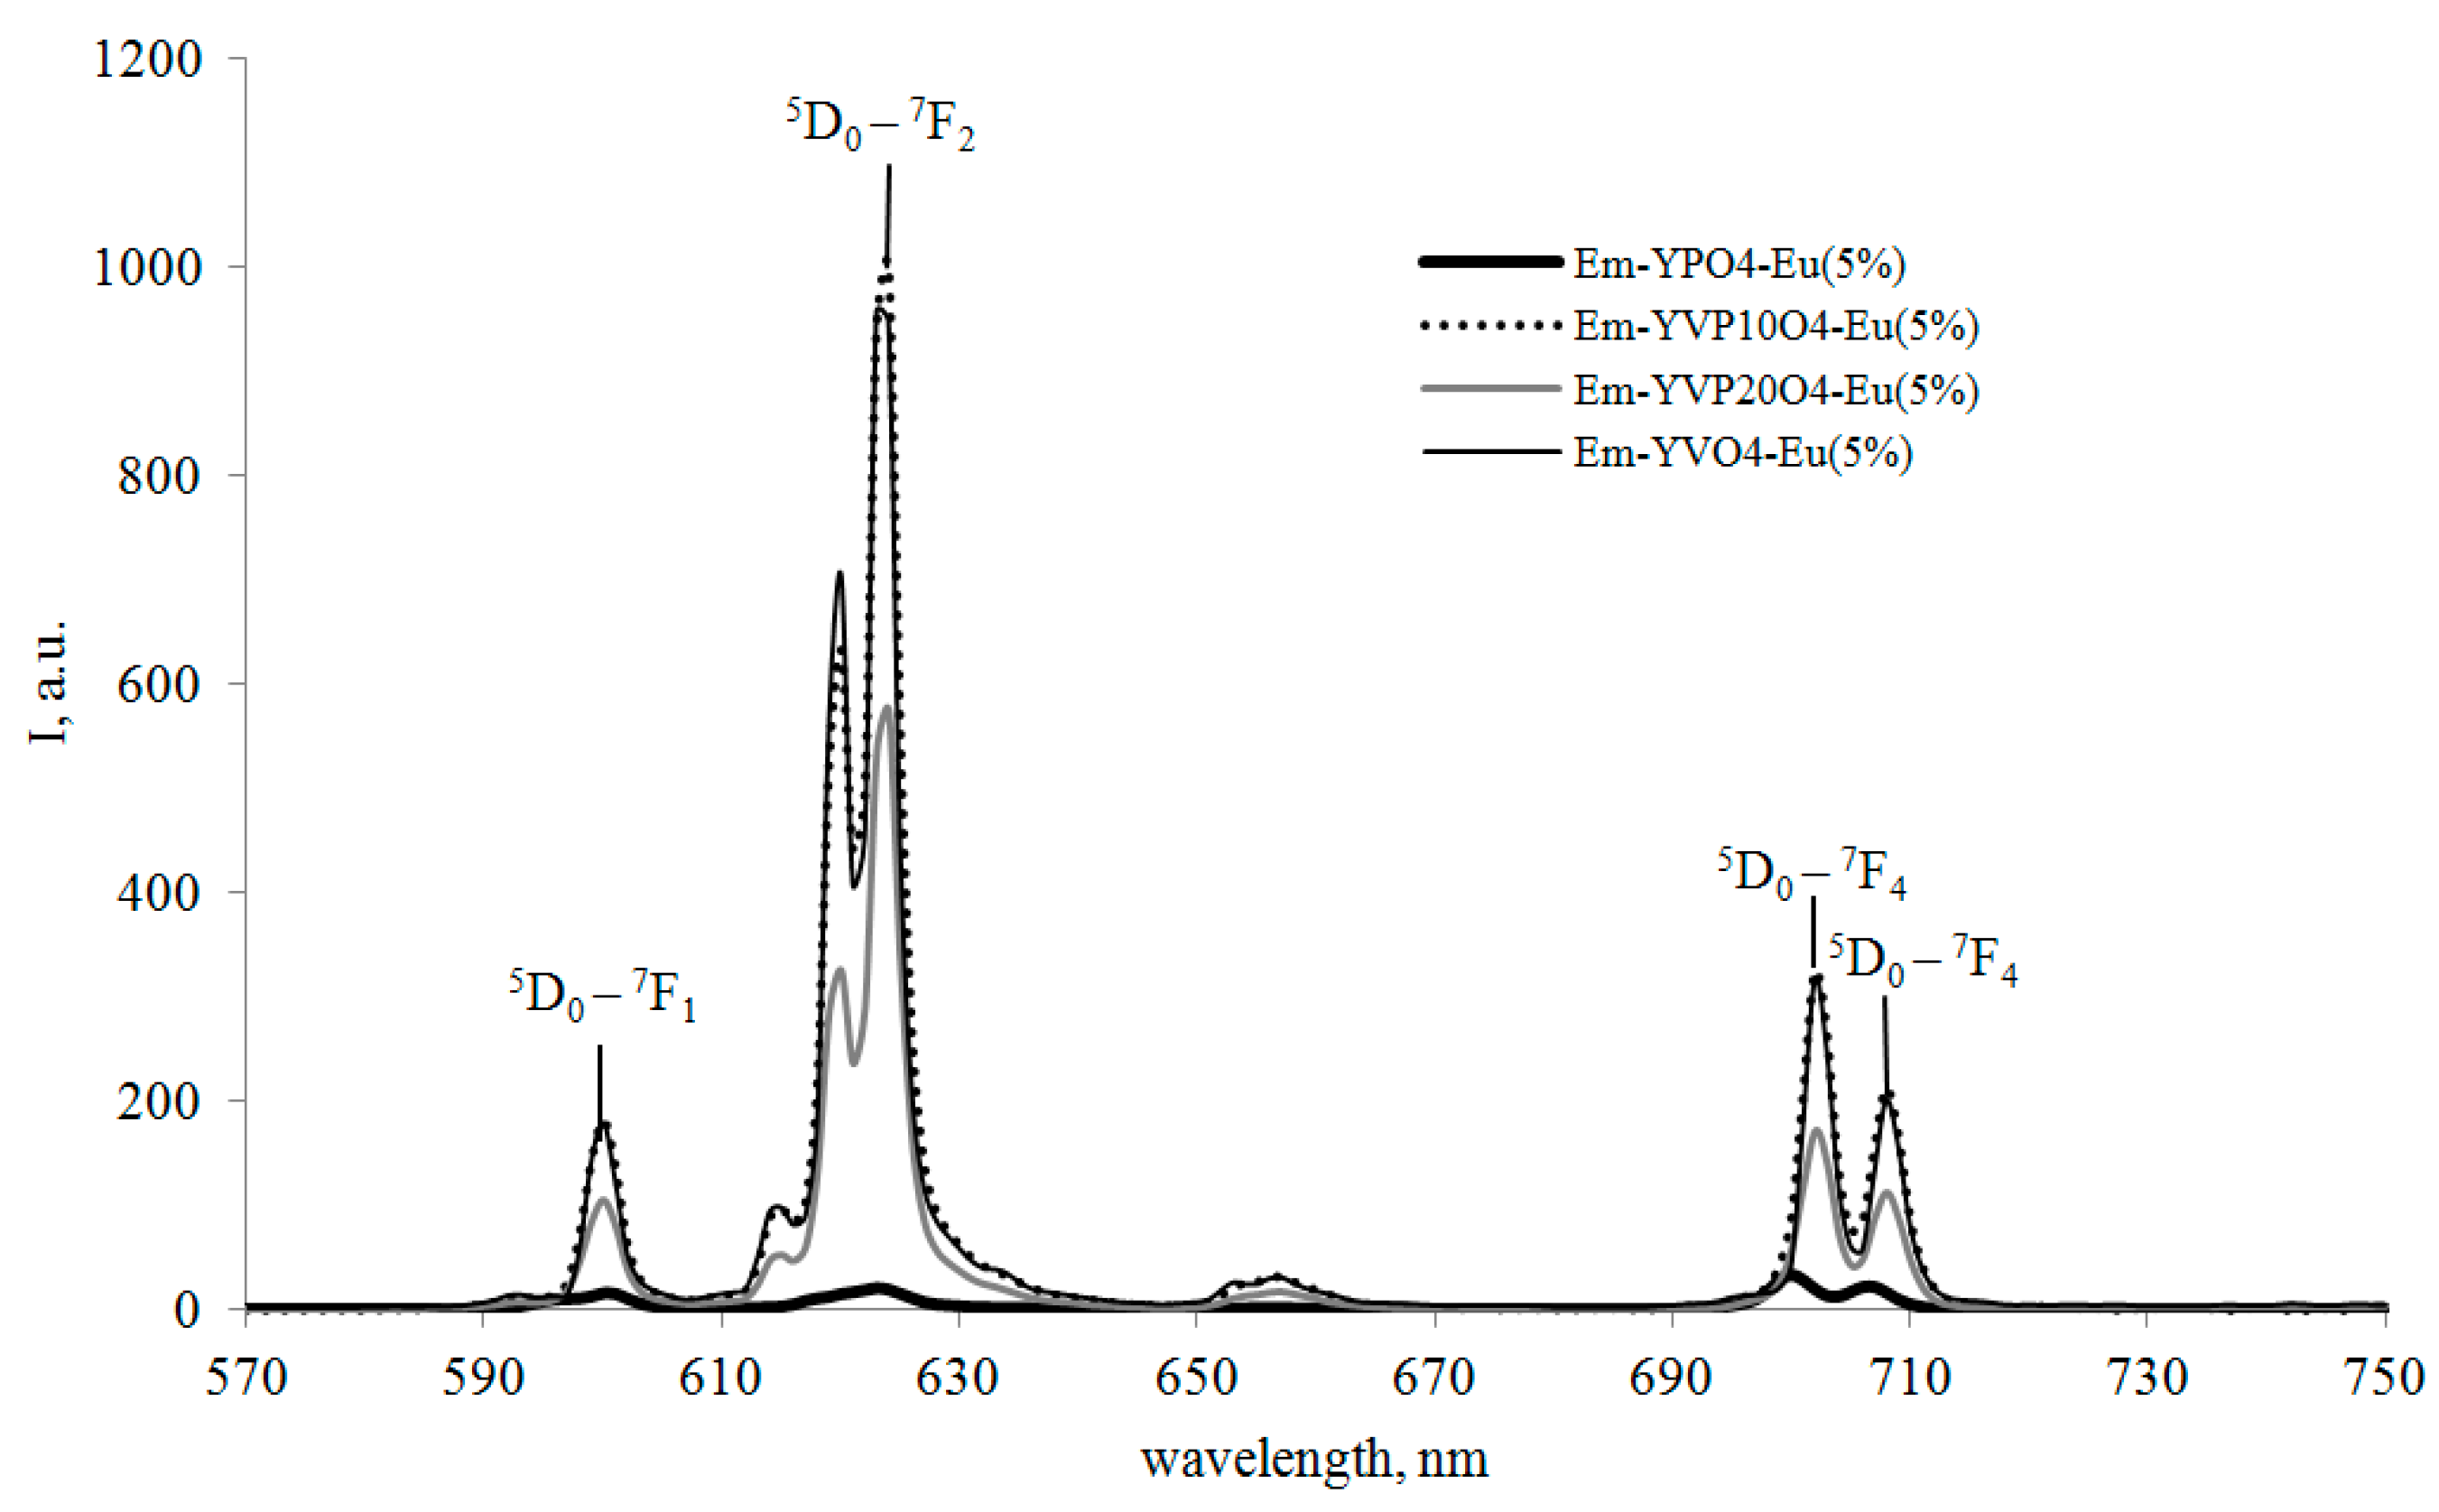
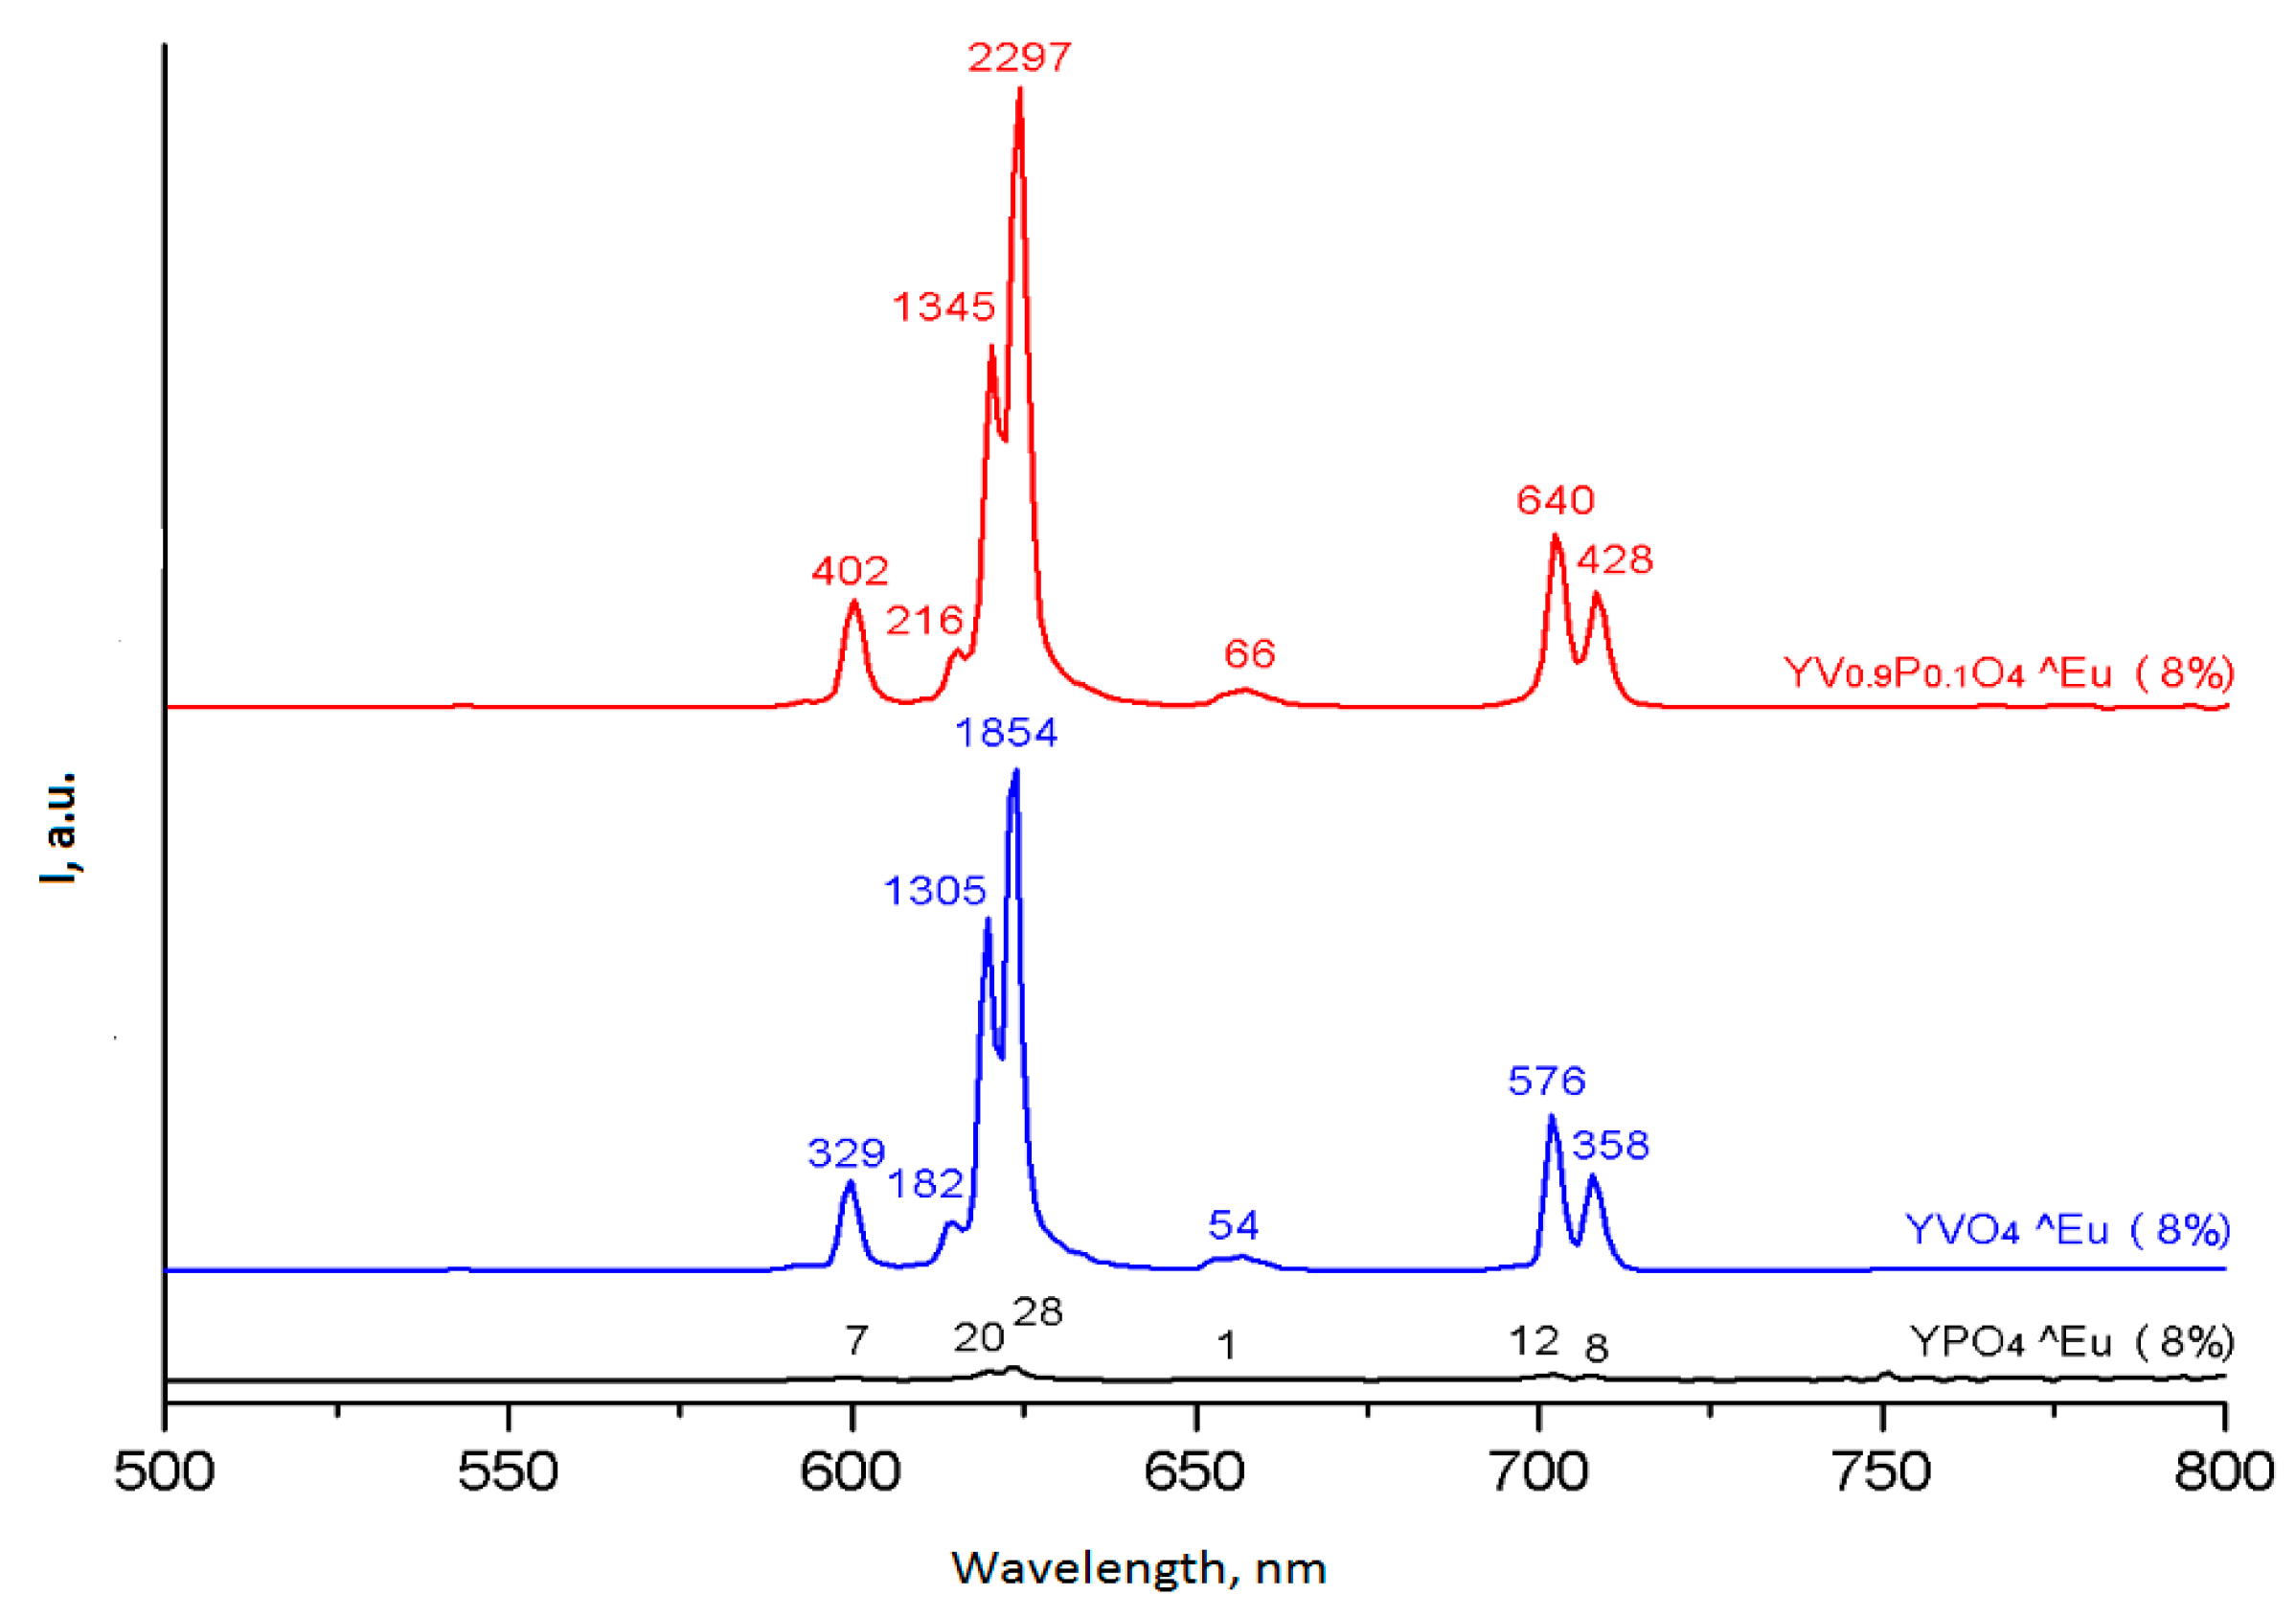
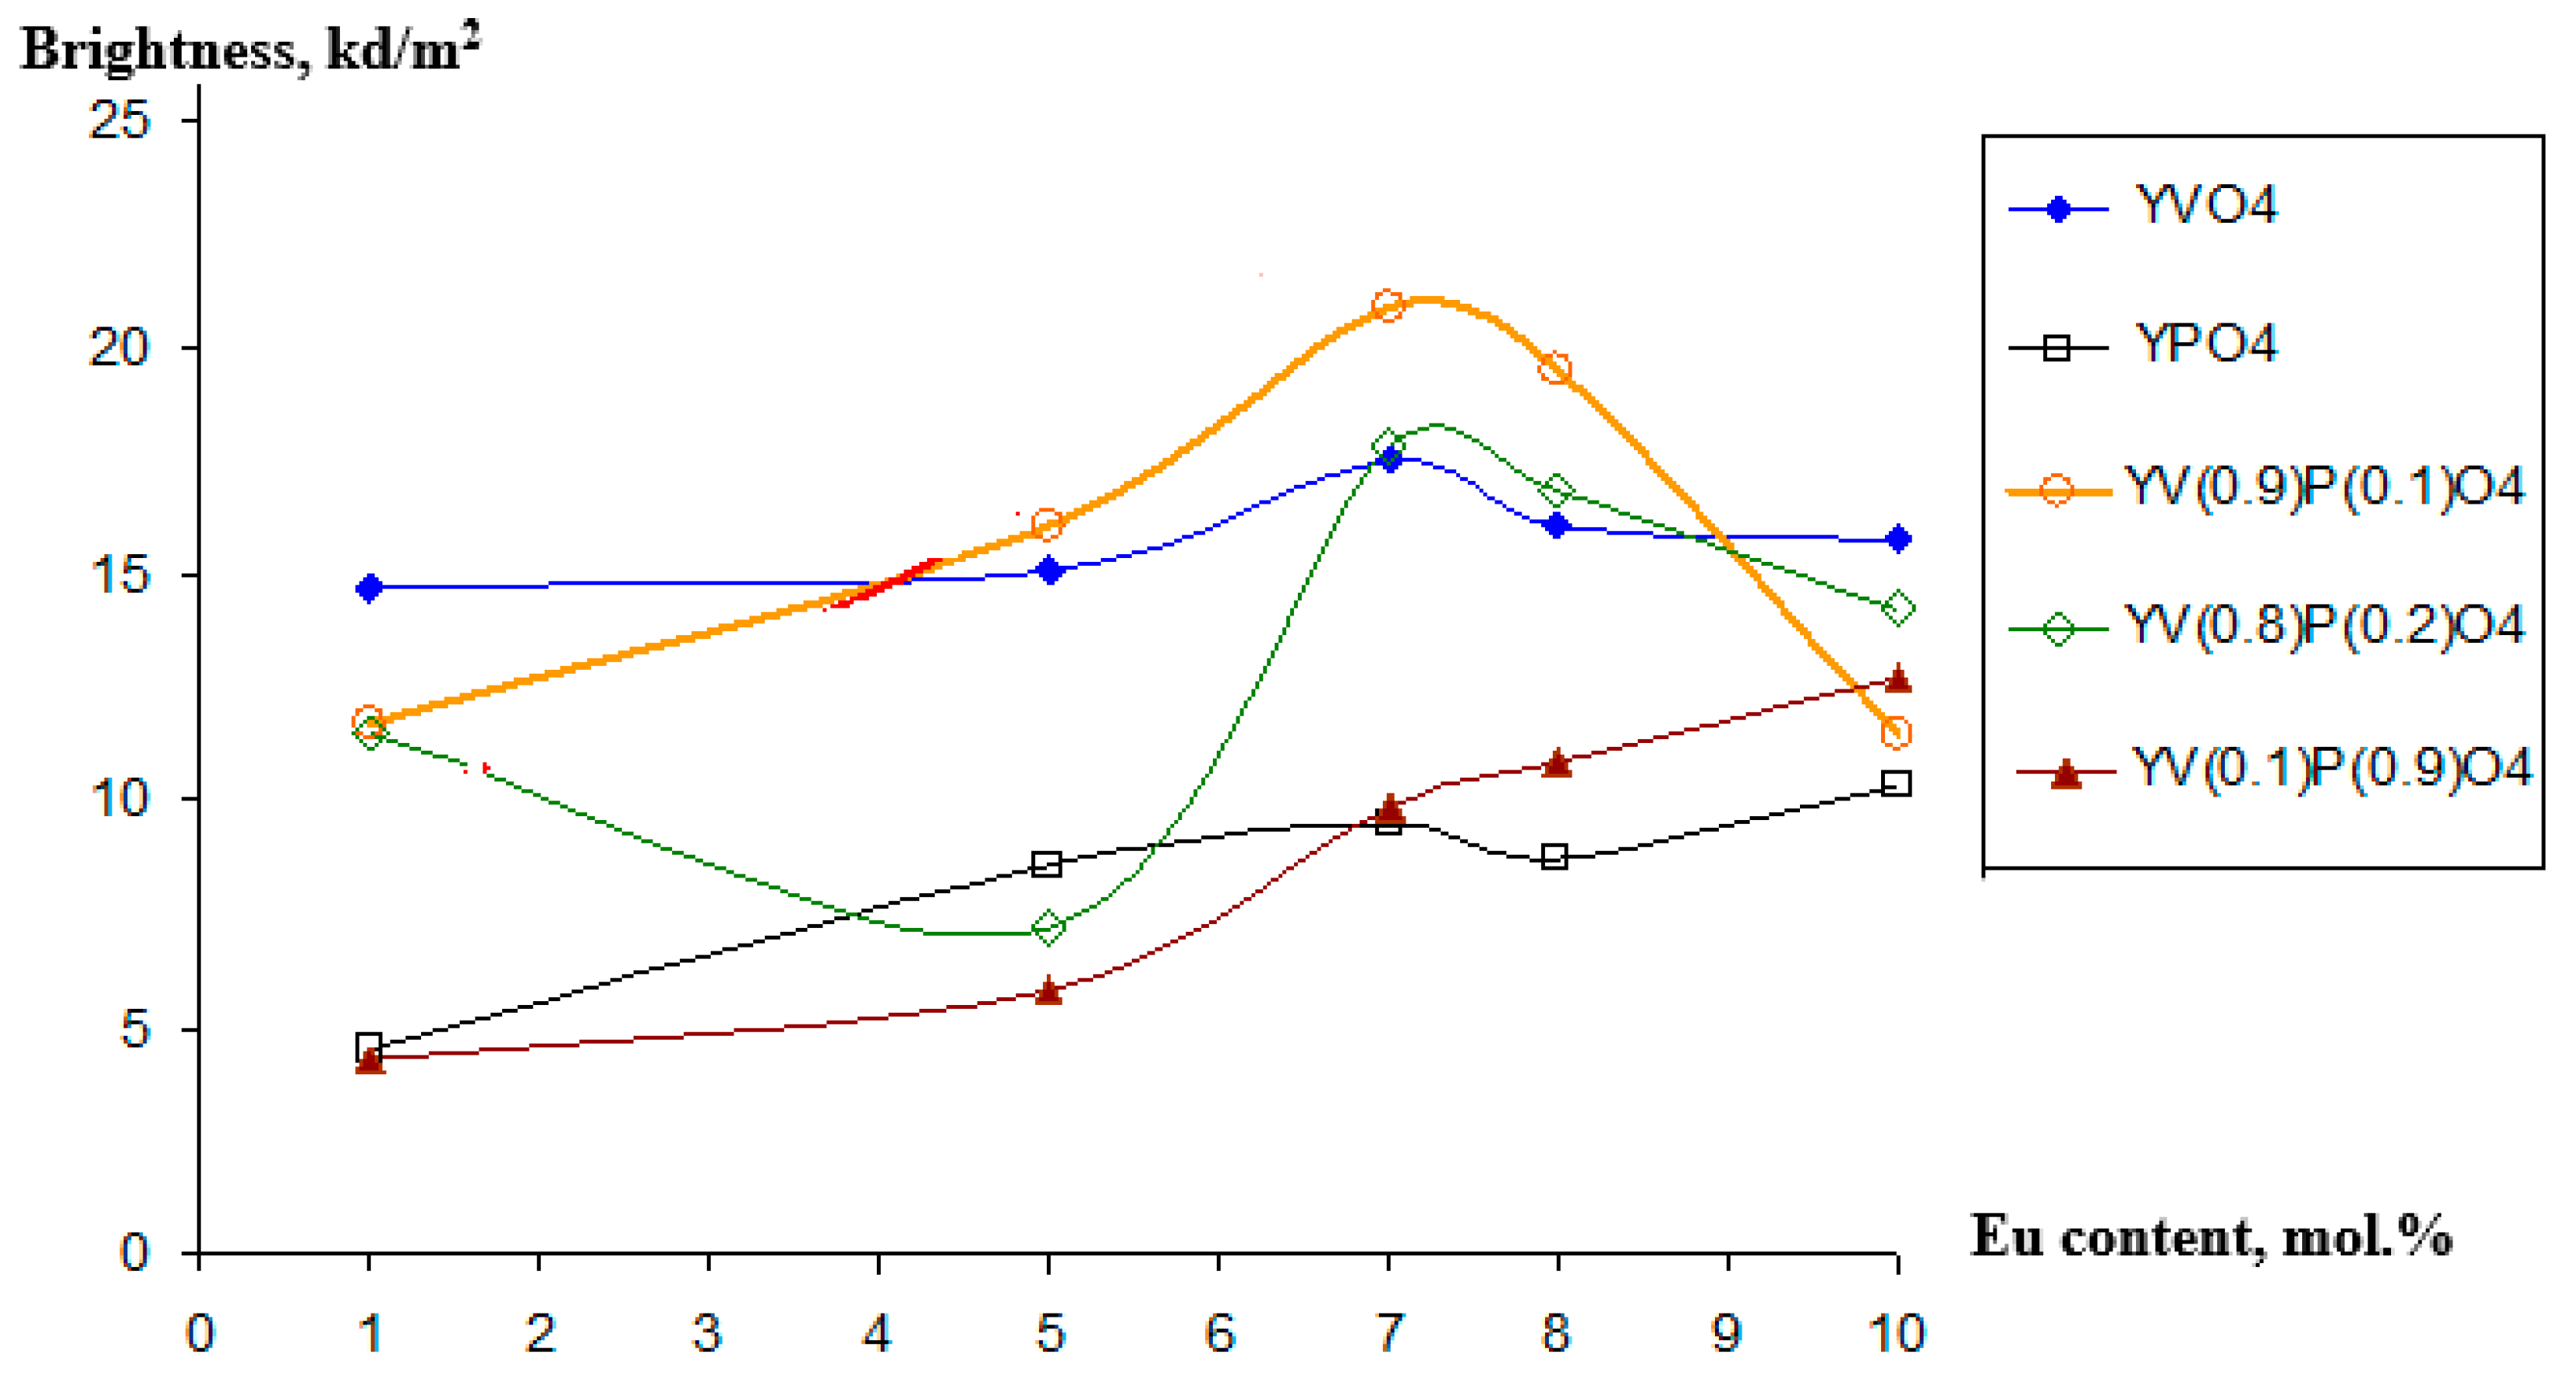
3.4. Excitation and Luminescence
4. Conclusions
Author Contributions
Funding
Conflicts of Interest
References
- Luwang, M.N.; Ningthoujam, R.S.; Srivastava, S.K.; Vatsa, R.K. Preparation of white light emitting YVO4:Ln3+ and silica-coated YVO4:Ln3+ (Ln3+, Eu3+, Dy3+, Tm3+) nanoparticles by CTAB/n-butanol/hexane/water microemulsion route: Energy transfer and site symmetry studies. J. Mater. Chem. R. Soc. Chem. 2011, 21, 5326–5337. [Google Scholar] [CrossRef]
- Muenchausen, R.E.; Jacobsohn, L.G.; Bennett, B.L.; McKigney, E.A.; Smith, J.F.; Valdez, J.A.; Cooke, D.W. Effects of Tb doping on the photoluminescence of Y2O3: Tb nanophosphors. J. Lumin. 2007, 126, 838–842. [Google Scholar] [CrossRef]
- Sun, H.; Peng, D.; Wang, X.; Tang, M.; Zhang, Q.; Yao, X. Strong red emission in Pr doped (Bi0.5Na0.5)TiO3 ferroelectric ceramics. J. Appl. Phys. AIP Publ. 2011, 110, 161–172. [Google Scholar] [CrossRef]
- Kumari, P.; Baitha, P.K.; Manam, J. Structural and photoluminescence properties of red-light emitting YVO4:Eu3+ phosphor synthesized by combustion and solid-state reaction techniques: A comparative study. Indian J. Phys. 2015, 89, 1297–1306. [Google Scholar] [CrossRef]
- Zhang, F.; Zhang, W.; Zhang, Z.; Huang, Y.; Tao, Y. Luminescence characteristics and energy transfer of a red-emitting YVO4:Sm3+, Eu3+ phosphor. J. Lumin. 2014, 152, 160–164. [Google Scholar] [CrossRef]
- Luo, Q.; Shen, S.; Lu, G.; Xiao, X.; Mao, D.; Wang, Y. Synthesis of cubic ordered mesoporous YPO4:Ln3+ and their photoluminescence properties. J. Mater. Chem. 2009, 19, 8079–8085. [Google Scholar] [CrossRef]
- Tymiński, A.; Grzyb, T. Enhancement of the up-conversion luminescence in LaVO4 nanomaterials by doping with M2+, M4+ (M2+ = Sr2+, Ba2+, Mg2+; M4+ = Sn4+) ions. J. Alloys Compd. 2019, 782, 69–80. [Google Scholar] [CrossRef]
- Bhatkar, V.B. Synthesis and luminescent properties of yttrium vanadate based phosphors. Int. J. Eng. Sci. Innov. Technol. 2013, 2, 426–429. [Google Scholar]
- Cavalli, E.; Angiuli, F.; Belletti, A.; Boutinaud, P. Luminescent spectroscopy of YVO4:Ln3+, Bi3+ (Ln3+ = Eu3+, Sm3+, Dy3+) phosphors. Opt. Mater. 2014, 36, 1642–1648. [Google Scholar] [CrossRef]
- Zhiguo, X.; Daimein, C.; Min, Y.; Ting, Y. Synthesis and luminescence properties of YVO4:Eu3+, Bi3+ phosphor with enhanced photoluminescence by Bi3+ doping. J. Phys. Chem. Solids 2010, 71, 175–180. [Google Scholar]
- Su, X.Q.; Yan, B. The synthesis and luminescence of YPxV1−xO4: Dy3+ microcrystalline phosphors by in situ co-precipitation composition of hybrid precursors. Mater. Chem. Phys. 2005, 93, 552–556. [Google Scholar] [CrossRef]
- Minakova, T.; Eremina, N.; Mjakin, S.; Bakhmetyev, V.; Sychov, M.; Svatovskaya, L.; Dolzhenko, D.; Sychova, A. Dispersity and Surface Characterization of Yttrium Vanadate and Phosphate Based Luminescent Phosphors. In Proceedings of the 2018 IEEE International Conference on Electrical Engineering and Photonics (EExPolytech-2018), Saint Petersburg, Russia, 22–23 October 2018. [Google Scholar]
- Karnaukhov, A.P. Adsorption. Texture of Dispersed and Porous Materials; Science: Novosibirsk, Russia, 1999. [Google Scholar]
- Minakova, T.S. Adsorbzionnye Prozessy na Poverhnosti Tverdykh tel (Adsorption Processes on the Surface of Solids); Tomsk University: Tomsk, Russian, 2007. [Google Scholar]
- Sychov, M.M.; Minakova, T.S.; Slizhov, Y.G.; Shilova, O.A. Kislotno-Osnovnye Kharakteristiki Poverhnosti Tverdykh tel I Upravlenie Svoistvami Materialov I Kompozitov (Acid-Base Properties of Solids and Control over the Properties of Materials and Composites); Khimizdat Publishers: St. Petersburg, Russia, 2016. [Google Scholar]
- Nechiporenko, A.P. Donorno-Akzeptornye Svoistva Poverhnosti Tverdofaznyh Sistem. Indikatornyi Metod (Acid-Base Properties of Solid Phase Systems; Indicator method); Lan Publishers: St. Petersburg, Russia, 2017. [Google Scholar]
- Mjakin, S.V.; Sychov, M.M.; Vasiljeva, I.V. Electron Beam Modification of Solids: Mechanisms, Common Features and Promising Applications; Nova Science Publishers, Inc.: Hauppauge, NY, USA, 2009. [Google Scholar]
- Lebedev, L.A.; Mjakin, S.V.; Nikandrova, A.A.; Bakhmetyev, V.V.; Sychov, M.M. Study of luminescence and surface properties of Y1−xEuxV1−yPyO4 phosphors. Smart Nanocomposites 2016, 13, 15–20. [Google Scholar]
- Minakova, T.S.; Sychov, M.M.; Bakhmetyev, V.V.; Eremina, N.S.; Bogdanov, S.P.; Zyatikov, I.A.; Minakova, L.Y. The Influence of Zn3(PO4)2:Mn-Luminophores Synthesis Conditions on their Surface and Luminescent Features. Adv. Mater. Res. 2014, 872, 106–111. [Google Scholar] [CrossRef]
- Ekimova, I.; Minakova, T.; Ogneva, T. Phisicochemistry of Alkaline-Earth Metals Oxides Surface. AIP Conf. Proc. 2016, 1698, 060014. [Google Scholar]
- Bakhmetyev, V.V.; Lebedev, L.A.; Vlasenko, A.B.; Bogdanov, S.P.; Sovestnov, A.E.; Minakova, T.S.; Minakova, L.Y.; Sychov, M.M. Luminescent Materials on the Basis of Yttrium Oxide and Yttrium Aluminum Garnet Used for Photodynamic Therapy. Key Eng. Mater. 2015, 670, 232–238. [Google Scholar] [CrossRef]
- Xiong, H.; Zhang, Y.; Liu, Y.; Gao, T.; Zhang, L.; Qiao, Z.A.; Zhang, L.; Gan, S.; Huo, Q. Self-template construction of honeycomb-like mesoporous YPO4:Ln3+ (Ln = Eu, Tb) phosphors with tuneable luminescent properties. J. Alloys Compd. 2019, 25, 845–851. [Google Scholar] [CrossRef]


| Sample | SBET (m2/g) | Vpore (m3/g) | Monolayer Adsorption am (mmol/m2) | Adsorption Value at P/P0 = 1 (mmol/m2) |
|---|---|---|---|---|
| YPO4:Eu(8) | 83 | 0.13 | 0.85 | 3.7 |
| YPO4:Eu(5) | 90 | 0.15 | 0.92 | 4.3 |
| YVO4:Eu(5) | 6 | 0.04 | 0.07 | 1.1 |
| YV0.9P0.1O4:Eu (5) | 8 | 0.05 | 0.08 | 1.3 |
| YV0.8P0.2O4:Eu (5) | 9 | 0.03 | 0.09 | 0.7 |
| Sample | YVO4:Eu(8) | YPO4:Eu(8) | YV0.9P0.1O4:Eu(8) | |||
|---|---|---|---|---|---|---|
| Elements | [norm. wt.%] | [norm. at.%] | [norm. wt.%] | [norm. at.%] | [norm. wt.%] | [norm. at.%] |
| Oxygen | 17.08 | 48.41 | 17.08 | 48.41 | 18.46 | 49.75 |
| Yttrium | 49.61 | 25.30 | 27.65 | 24.61 | 48.60 | 23.57 |
| Vanadium | 27.65 | 24.70 | 0 | 0 | 24.35 | 20.61 |
| Europium | 5.66 | 1.69 | 5.66 | 1.69 | 5.31 | 1.51 |
| Phosphorous | 0 | 0 | 17.06 | 17.23 | 3.28 | 4.57 |
| Sample | PH0 | pHIIS | Sample | PH0 | pHIIS |
|---|---|---|---|---|---|
| YPO4:Eu(0) | 6.4 | 6.1 | YVPO4(P10):Eu(0) | 6.4 | 6.8 |
| YPO4:Eu(5) | 5.7 | YVPO4(P10):Eu(5) | 6.5 | ||
| YPO4:Eu(8) | 6.1 | YVPO4(P10):Eu(8) | 6.9 | ||
| YVO4:Eu(0) | 7.4 | YVPO4(P20):Eu(0) | 6.4 | ||
| YVO4:Eu(5) | 7.5 | YVPO4(P20):Eu(5) | 6.4 | ||
| YVO4:Eu(8) | 7.2 | YVPO4(P20):Eu(8) | 6.4 |
| Sample | Composition | Excitation Band Peaks, nm | Emission Band Peaks, nm | ||||
|---|---|---|---|---|---|---|---|
| Host Material | Eu Content, mol% | λlum = 623 nm | I, a.u. | I327/I396 | λex = 328 nm | I, a.u. | |
| 1 | YVPO4 P10 | 8 | 327 | 799 | 14 | 623 | 781 |
| 396 | 58 | ||||||
| 2 | YVO4 | 10 | 327 | 744 | 13 | 624 | 673 |
| 396 | 56 | ||||||
| 3 | YPO4 | 10 | 322 | 13 | 0,7 | 623 | 11 |
| 396 | 19 | ||||||
© 2019 by the authors. Licensee MDPI, Basel, Switzerland. This article is an open access article distributed under the terms and conditions of the Creative Commons Attribution (CC BY) license (http://creativecommons.org/licenses/by/4.0/).
Share and Cite
Minakova, T.; Mjakin, S.; Bakhmetyev, V.; Sychov, M.; Zyatikov, I.; Ekimova, I.; Kozik, V.; Chen, Y.-W.; Kurzina, I. High Efficient YVPO4 Luminescent Materials Activated by Europium. Crystals 2019, 9, 658. https://doi.org/10.3390/cryst9120658
Minakova T, Mjakin S, Bakhmetyev V, Sychov M, Zyatikov I, Ekimova I, Kozik V, Chen Y-W, Kurzina I. High Efficient YVPO4 Luminescent Materials Activated by Europium. Crystals. 2019; 9(12):658. https://doi.org/10.3390/cryst9120658
Chicago/Turabian StyleMinakova, Tamara, Sergey Mjakin, Vadim Bakhmetyev, Maxim Sychov, Ilya Zyatikov, Irina Ekimova, Vladimir Kozik, Yu-Wen Chen, and Irina Kurzina. 2019. "High Efficient YVPO4 Luminescent Materials Activated by Europium" Crystals 9, no. 12: 658. https://doi.org/10.3390/cryst9120658