Article

On the Path to Optimizing the Al-Co-Cr-Cu-Fe-Ni-Ti High Entropy Alloy Family for High Temperature Applications

1
Helmholtz-Zentrum Berlin für Materialien und Energie, Hahn-Meitner-Platz 1, D-14109 Berlin, Germany
2
Department of Physics and Nanotechnology, SRM University, Kattankulathur, Kancheepuram Dt 603 203, India
3
Metals and Alloys, University Bayreuth, Ludwig-Thoma-Str. 36b, D - 95447 Bayreuth, Germany
4
PFARR STANZTECHNIK GmbH, Am kleinen Sand 1, 36419 Buttlar, Germany
*
Author to whom correspondence should be addressed.
Entropy 2016, 18(4), 104; https://doi.org/10.3390/e18040104
Submission received: 19 February 2016 / Revised: 14 March 2016 / Accepted: 15 March 2016 / Published: 23 March 2016
(This article belongs to the Special Issue High-Entropy Alloys and High-Entropy-Related Materials)

Abstract

:
The most commonly investigated high entropy alloy, AlCoCrCuFeNi, has been chosen for optimization of its microstructural and mechanical properties by means of compositional changes and heat treatments. Among the different available optimization paths, the decrease of segregating element Cu, the increase of oxidation protective elements Al and Cr and the approach towards a γ-γ′ microstructure like in Ni-based superalloys have been probed and compared. Microscopical observations have been made for every optimization step. Vickers microhardness measurements and/or tensile/compression test have been carried out when the alloy was appropriate. Five derived alloys AlCoCrFeNi, Al23Co15Cr23Cu8Fe15Ni16, Al8Co17Cr17Cu8Fe17Ni33, Al8Co17Cr14Cu8Fe17Ni34.8Mo0.1Ti1W0.1 and Al10Co25Cr8Fe15Ni36Ti6 (all at.%) have been compared to the original AlCoCrCuFeNi and the most promising one has been selected for further investigation.

1. Introduction

The century old concept of alloy creation based on one or two base elements was first broken by the discovery of metallic glasses. Although most of them do have one or two predominant elements there are several that are multi-component materials and thus do not have a base element. Until a decade ago this notion was restricted to amorphous materials. The introduction of high entropy alloys or compositionally complex alloys at the beginning of the 21st century [1,2] allowed the formation of non-amorphous multi-component alloys without a base element but with simple crystalline structures and often one or more solid solutions. This new class of alloys has been subject to intensive investigation all over the world and the family of elements that has been most studied is Al-Co-Cr-Cu-Fe-Ni-Ti in various combinations [3,4,5,6].
A single solid solution has only been obtained in a very limited number of high entropy alloys [7,8,9,10] and is furthermore not the best option for good mechanical properties. Over the last years it has been found that a two phase microstructure like in Ni-based super alloys implies better mechanical properties. From this alloys family, the CMSX-4 alloy has been chosen as an ideal example in terms of morphology, especially concerning the size, shape and distribution of the particles inside the matrix. Several compositions, morphologies and heat treatments have been tried on alloys of the Al-Co-Cr-Cu-Fe-Ni-Ti family until an “optimum” morphology consisting of a disordered fcc matrix and ordered fcc precipitates has been chosen.
Thus, in this work the microstructural evolution and, on a second level some mechanical properties, have been compared, starting from the “classic” equiatomic AlCoCrCuFeNi [11,12,13,14] alloy over AlCoCrFeNi [15,16], Al23Co15Cr23Cu8Fe15Ni16 [17], Al8Co17Cr17Cu8Fe17Ni33 [17,18] and Al8Co17Cr14Cu8Fe17Ni34.8Mo0.1Ti1W0.1 [19] to the optimized Al10Co25Cr8Fe15Ni36Ti6 alloy (all at.%, or, in the case of AlCoCrFeNi and AlCoCrCuFeNi, mole fractions, as will be the case in the rest of the manuscript). For all six alloys the optimum heat treatment, which leads to the morphology closest to the one of CMSX-4, has been retained and the samples have been investigated by optical microscopy, transmission electron microscopy (TEM), three dimensional atom probe (3D-AP), Vickers hardness measurements and tensile or compression tests.

2. Materials and Methods

The equiatomic alloys AlCoCrCuFeNi and AlCoCuFeNi have been melted in a vacuum levitation induction furnace using elements of 99.999% purity. The Al23Co15Cr23Cu8Fe15Ni16, Al8Co17Cr17Cu8Fe17Ni33, Al8Co17Cr14Cu8Fe17Ni33Mo0.1Ti1W0.1 and Al10Co25Cr8Fe15Ni36Ti6 alloys were cast in a vacuum induction furnace from elements of 99.99% purity. All alloys were remelted several times in order to ensure homogeneity. The ingots were cooled inside the furnace. Their weight was about 20 g.
In order to reach the desired morphology of one precipitating phase in another, it was necessary to first homogenize the alloys and then perform a heat treatment in a region where a second phase is predicted. The chosen heat treatments of all six alloys have been summarized in Table 1. Furthermore, in order to simplify reading, the alloys have been numbered and will be called by their name in the rest of the manuscript.
Specimens for investigation by optical microscopy and hardness measurements were ground and polished with a final polishing step consisting of a 50 nm sized silica grains in a colloidal OP-U suspension. Some alloys were etched with an etching solution containing 50 mL H2O, 50 mL HCl, 50 mL HNO3 and 1.5 g H2MoO4.
Specimens for TEM investigations were prepared by punching discs of 3 mm in diameter and 140 μm in thickness. They were then mechanically ground down to a thickness of about 110 μm and then electrochemically polished with a polishing solution of 83% ethanol, 10% perchloric acid and 7% glycerine at −20 °C and a voltage of 30 V. TEM observations were made with a CM30 instrument (Philips/FEI, Eindhoven, The Netherlands) operating at 300 kV. It is equipped with an energy dispersive X-ray (EDX) detector by EDAX (Tilburg, The Netherlands) which is used to analyse the chemical composition of the phases.
3D-AP measurements have been performed on two alloys (Alloys 4 and 5). Specimens for 3D-AP observations were first cut from a foil into rods of 0.25 × 0.25 × 10 mm3 and then thinned down to a tip diameter of about 50 nm in two steps, using a final polishing solution of 98% butoxyethanol and 2% perchloric acid and a final voltage of 3 V. More detailed information can be found in [15,17]. The 3D-AP used in this study is a TAP (tomographic atom probe) by CAMECA (Genevilliers, France). The 3D-AP analyses were performed at about 70 K, with a pulse voltage fraction of 20% to the standing DC voltage and a pulse repetition rate of 1000 Hz. Investigations are performed in a vacuum lower than 10−7 Pa.
Vickers microhardness measurements were carried out on a MHT-10 microhardness tester (Reichert-Jung, Buffalo, NY, USA) with a load of ~0.5 N.
Tensile tests were carried out using a universal testing machine (Z100/TL35, Zwick, Ulm, Germany) at a displacement rate of 5 mm/min. Cylindrical tensile specimens with a gauge length of 25 mm and a diameter of 5 mm have been prepared according to DIN 50 125 [20].

3. Results and Discussion

Figure 1 shows a pseudo-ternary (Ni-Co)-Fe-(Al-Ti) phase diagram which shows the compositional position of some alloys. It is a schematic view, visualizing the fact that commercially used alloys are only situated at the corner positions, i.e., having one (or sometimes two) base element. In this case the compared alloys are Ni- or Co-based, Al- or Ti-based or Fe-based. As Al and Ti shift the alloys’ properties in the same general direction and Ni and Co are also known to have similar behaviours, they have been grouped together.
These five elements have been chosen at the corners of the phase diagram because most commercially used alloys are Co- or Ni- (violet circles), Al- or Ti- (olive green circles) or Fe-based (blue circles). Some have a Fe-Ni binary basis (yellow circles), but rare are the commercial alloys with three or more elements and inexistent those with a composition close to the equiatomic. This is where the high entropy alloys (red discs) of the present study are situated: the regions with (close to) equiatomic composition lie inside the red circle. Based on several well known facts from alloy designing, an optimization path for the Alloy 1 alloy has been chosen and it has taken three ways:
-
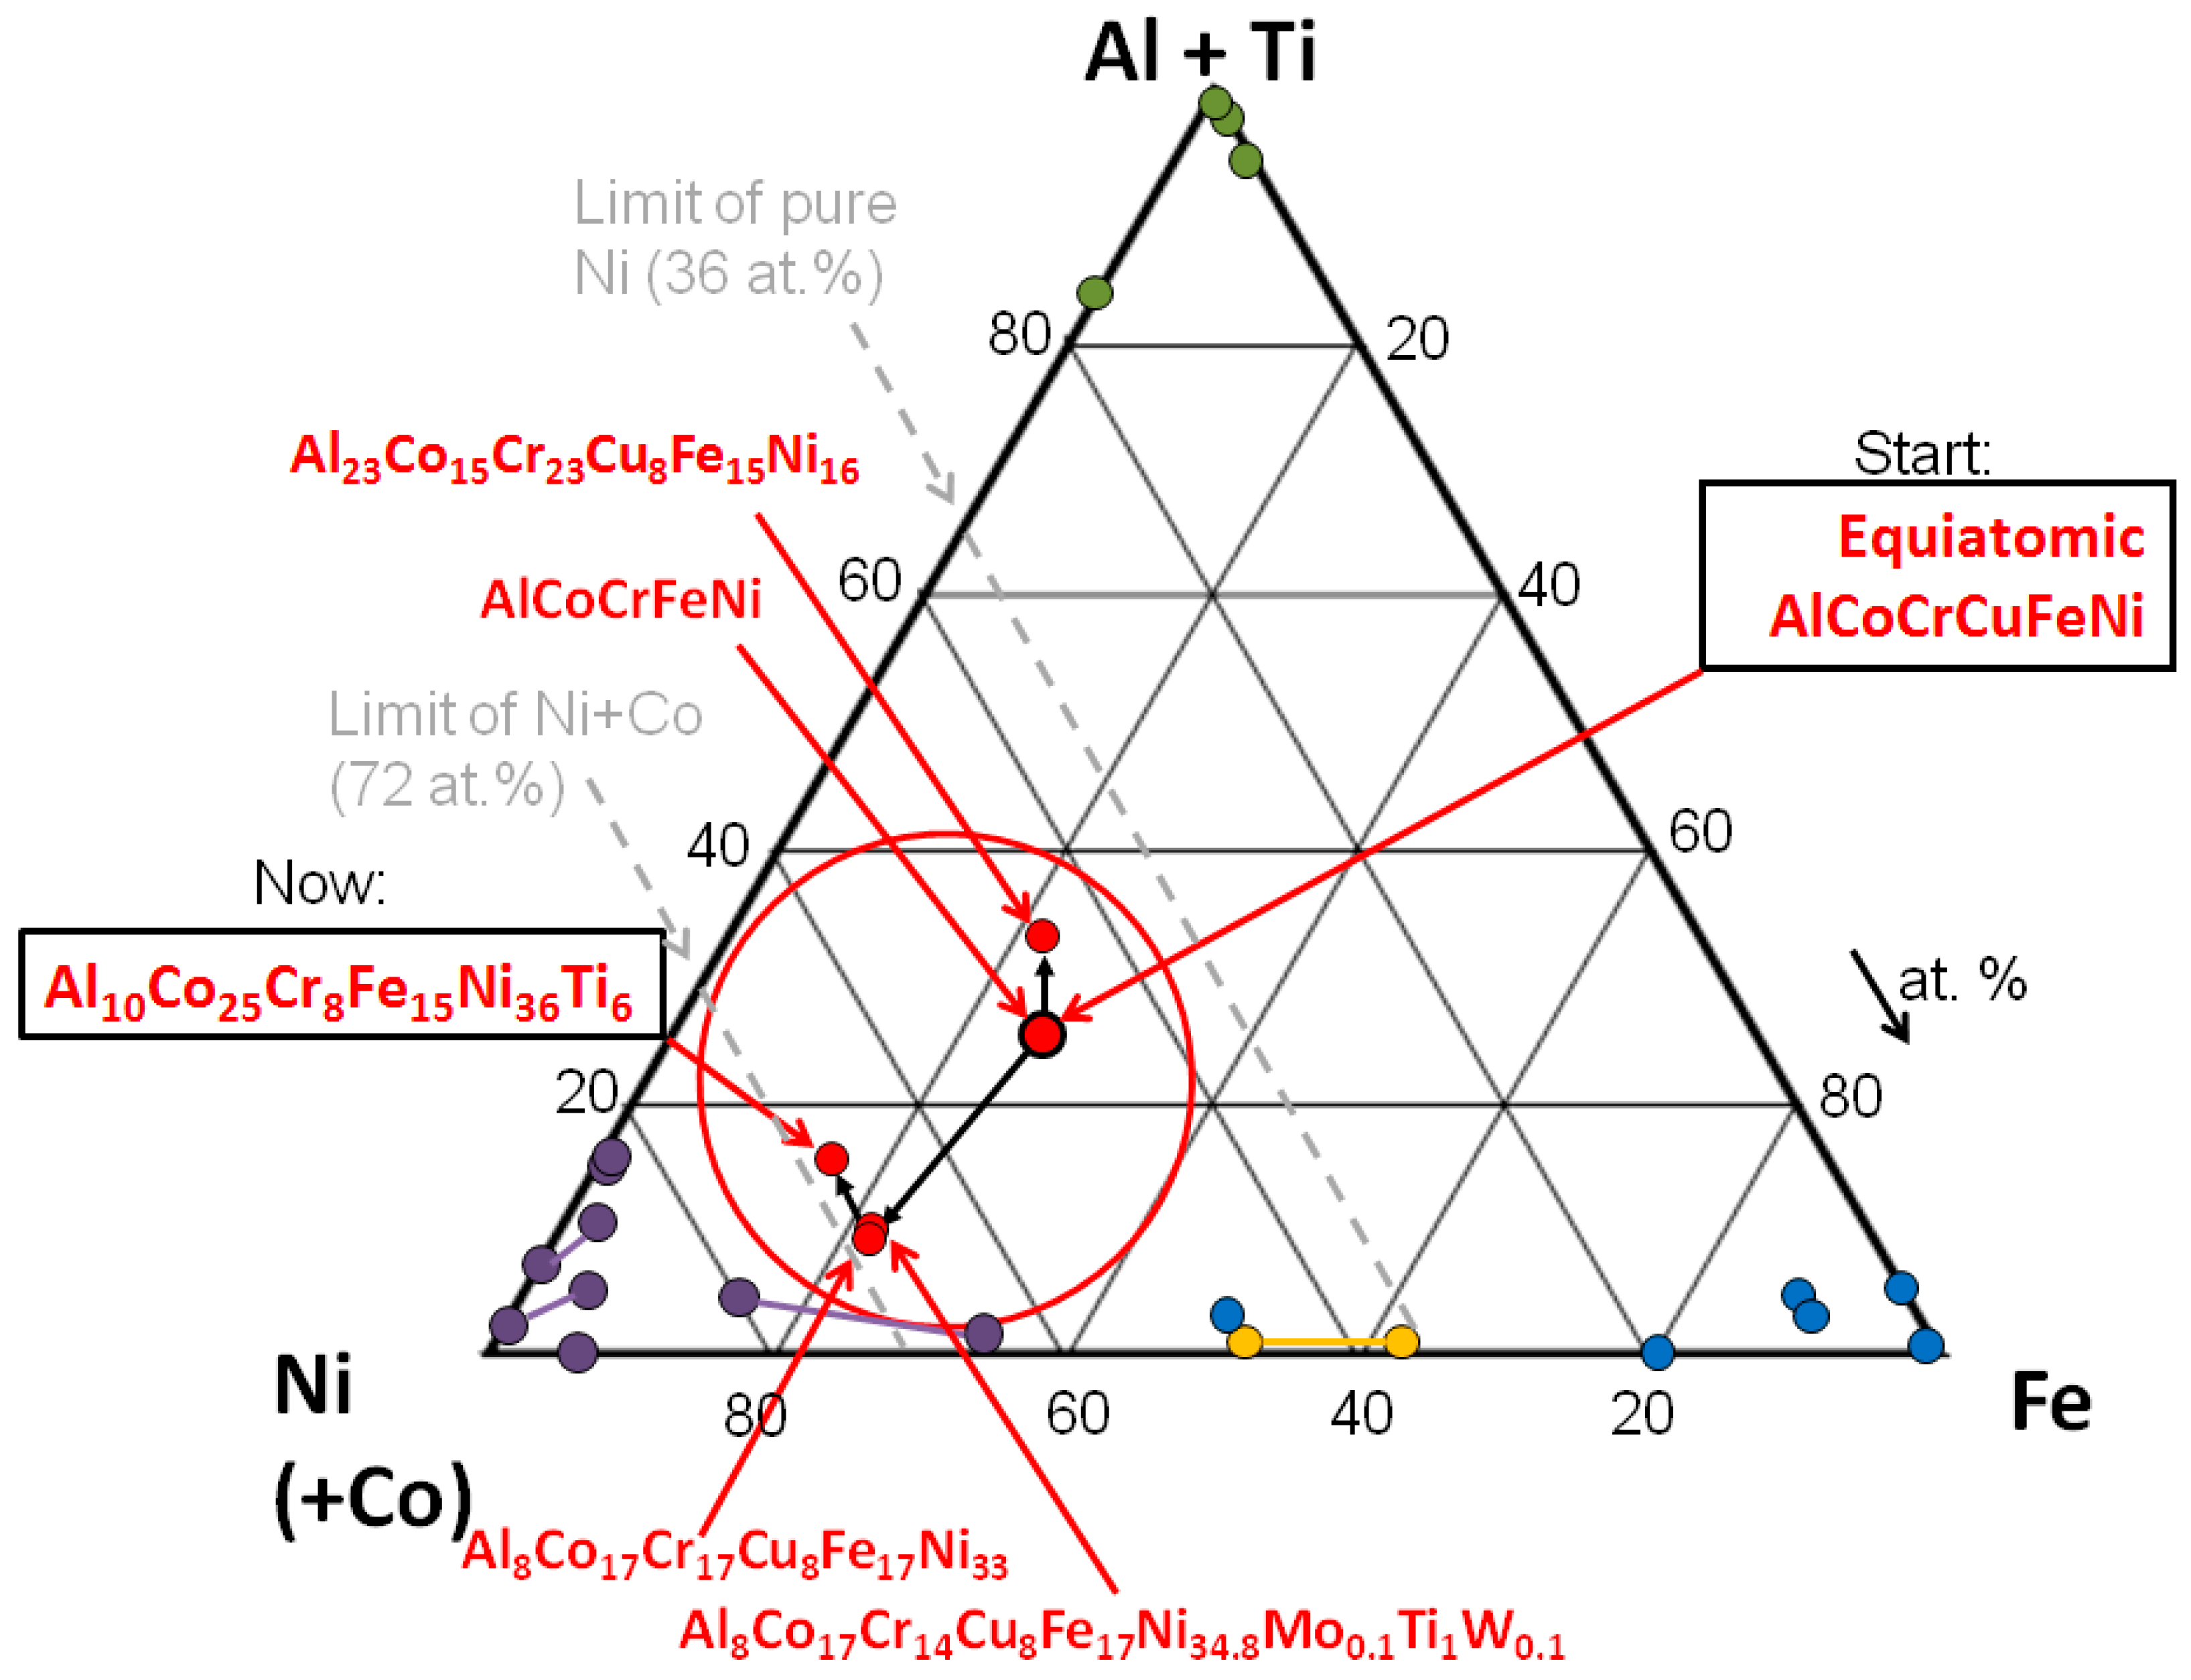
A reduction of segregated phases is essential. Cu-based phases segregate easily and can thus create disturbances inside the grains as well as at the grain boundaries: the amount of Cu will be decreased (Alloy 3, 4 and 5) or annulled completely (Alloys 2 and 6).
-
An optimization of the oxidation properties of the alloy is advantageous: the content of Al and Cr will be increased (Alloy 3).
-
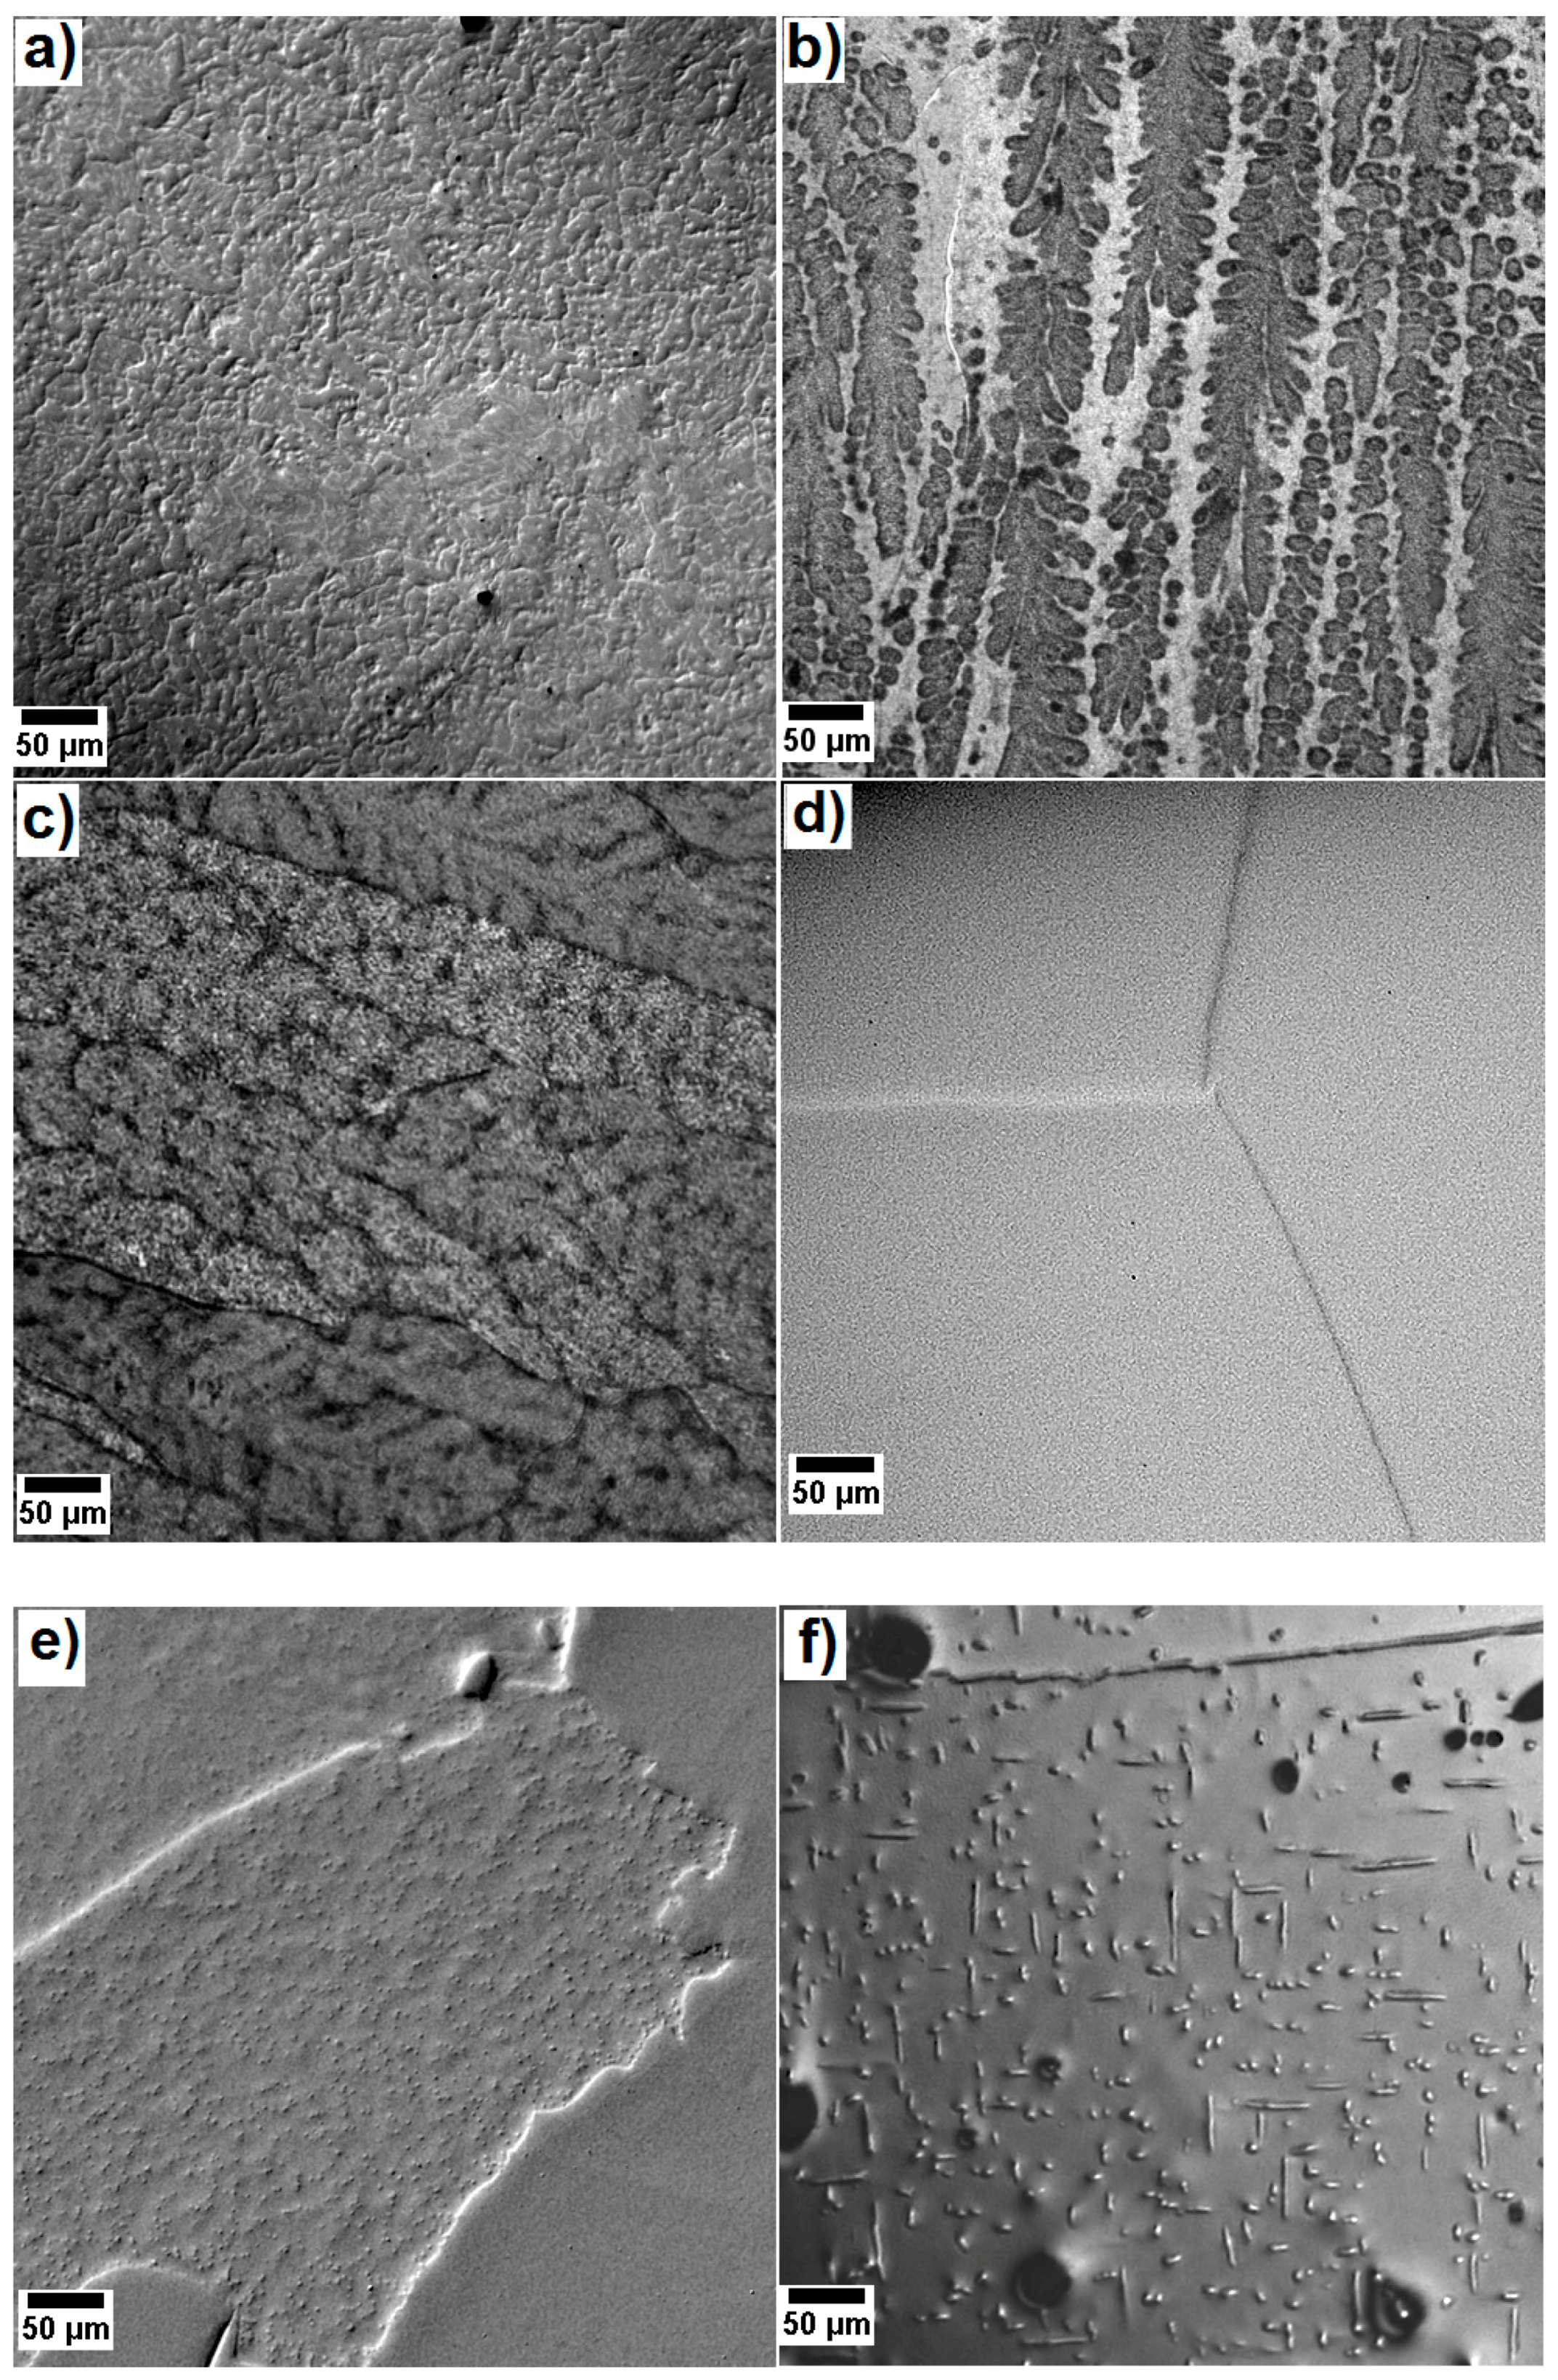
A preferential formation of a two phase microstructure in the alloy is desirable. The microstructure of Alloy 1 shows two main phases (except for the Cu-rich phases) with a tendency towards the well-known cubic microstructure in Ni-based alloys: these features will be increased by first increasing the amount of Ni and then fine-tuning by adjusting or adding other elements (Alloys 4, 5 and 6).
The alloys have been chosen after a calculation of nearly 200 alloys with the ThermoCalc software [21] and the TTNi7 database [22]. The calculated phase diagrams for the selected alloys are shown in Figure 2.
All calculated phase diagrams show a big number of phases, especially at temperatures below 600 °C. Such an amount of phases has never been found experimentally, though. This is due on the one hand that the cooling conditions are not equilibrium condition, as is the case in the calculations, and on the other hand to the fact that the TTNi7 database is optimized for Ni-base alloys and not for multicomponent alloys. Over the years it has been decided that the calculated data below 600 °C will not be taken into account for the casting and possible subsequent optimization of an alloy.
The first three alloys: (a) Alloy 1, (b) Alloy 2 and (c) Alloy 3 have a predominant amount of bcc phases, with NiAl being the most important one. They show at least three phases up to a temperature close to the melting point. This could be proved experimentally with heat treatments at 1000 °C (not shown here), except for the Co-Cr-Fe rich phase with fcc structure which has never been observed. As the same phases could be observed in the as-cast alloys, with a morphology close to the desired one as well, it has been decided that no heat treatment would be applied to these three alloys.
The other three alloys: (d) Alloy 4, (e) Alloy 5 (note that this composition is slightly different from the experimental composition) and (f) Alloy 6 are characterized by an even higher amount of predicted phases at low temperature (below 600 °C) and a region with only one phase at high temperature close to the melting point. The predominant phases are fcc. No bcc phase has been observed in these three alloys after any heat treatment (see Table 1).
It can be concluded from the prediction of the Alloy 4 alloy in Figure 2d that it is difficult to obtain a two phase morphology, because there is no temperature window in the predicted phase diagram in Figure 2d that would allow such a phase formation, except with NiAl which is an undesired phase in an fcc alloy. Thus, in order to increase the existing area of the γ′ phase, Mo, Ti and W were added to the alloy (Figure 2e). In a last step it has been possible to shift the existence of the γ′ phase to even higher temperatures (Figure 2f). For this it was necessary to change the composition more dramatically to Al10Co25Cr8Fe15Ni36Ti6.
Figure 3 shows the optical micrographs of the as-cast alloys Alloy 1, Alloy 2, Alloy 3 and of the alloys after the heat treatments shown in Table 1: Alloy 4, Alloy 5 and Alloy 6. The three as-cast alloys show a dendritic morphology, with Cu segregations at the grain boundaries in case of (a) Alloy 1 and (c) Alloy 2. In the first two fcc alloys (d) Alloy 4 and (e) Alloy 5 a disturbingly large segregation of Cu at the grain boundaries could not be dissolved by the homogenization (not visible here) [19]. Alloy 5 shows small dark shapes, which have been created by a preferential etching in the grain, around the L12 precipitates that will be shown in the TEM observations (Figure 4). Alloy 6 in Figure 3f shows an additional phase in the shape of about 10 µm long needles.
In order to gain information on a smaller scale the alloys have been investigated using TEM. Throughout this part of the investigation, the Al-Ni rich phase of ordered structure will be called phase A, the (Co-)Cr-Fe rich phase of disordered structure will be called B and possible other phases will be called C. Of course they are different from one alloy to the other.
Figure 4 shows bright or dark field images of the six alloys and the corresponding selected area diffraction patterns (SADs) taken along the [100] zone axes. All the SADs show two highlighted diffraction spots. The SAD patterns in Figure 4a–c correspond to a bcc structure with superlattice reflexions of a B2 ordered phase. Meanwhile, the SAD pattern in Figure 4d–f exhibit superlattice spots of the L12 ordered phase in an fcc structure. The dark field (DF) images of the equiatomic alloys Alloy 1 (Figure 4a) and Alloy 2 (Figure 4b) show an Al-Ni rich matrix of B2 structure (phase A). Dark imaged Cr-Fe rich platelets of a disordered bcc A2 phase (phase B) can be distinguished [11,15]. In Alloy 1 dark imaged Cu rich platelets of B2 structure can be spotted as well (phase C) [11]. Figure 4c shows a STEM image of Alloy 3. This microstructure is close to the one in Alloy 1: an Al-Ni rich matrix of B2 structure (A) with 10–200 nm Cu rich precipitates (C) and cuboidal Cr-Fe rich platelets of a disordered bcc structure (B) can be observed [17]. As has been predicted by ThermoCalc in Figure 2, these three alloys are characterized by a global bcc structure.
Figure 4d shows the DF image of Alloy 4. The up to 20 nm sized bright imaged precipitates are Al-Cu-Ni rich and have an ordered L12 structure (A). Figure 4e shows the DF image of Alloy 5: a dark imaged matrix of disordered fcc A1 structure (B) with 80–200 nm sized bright imaged Al-Cu-Ni rich precipitates with a L12 structure (A). The final alloy, Alloy 6, shown in Figure 4f, has a two phase microstructure which is characterized by a matrix of a disordered fcc structure (B). The precipitates are Al-Ni-Ti rich and of L12 structure (A), but much bigger than in the two preceding alloys, namely up to 450 nm. As has been predicted by ThermoCalc in Figure 2d–f, the last three alloys have a global fcc structure. They show a γ-γ′ morphology known from Ni-based alloys. The needle-like precipitates are not shown here because of their low density and large sizes. It is interesting to note that while the ordered phase in the bcc alloys is the matrix it is the precipitates in the fcc alloys.
The microchemical composition of the most important phases is summarized in Table 2. Three observations are very prominent when comparing the evolution of the phases’ compositions in Table 2:
-
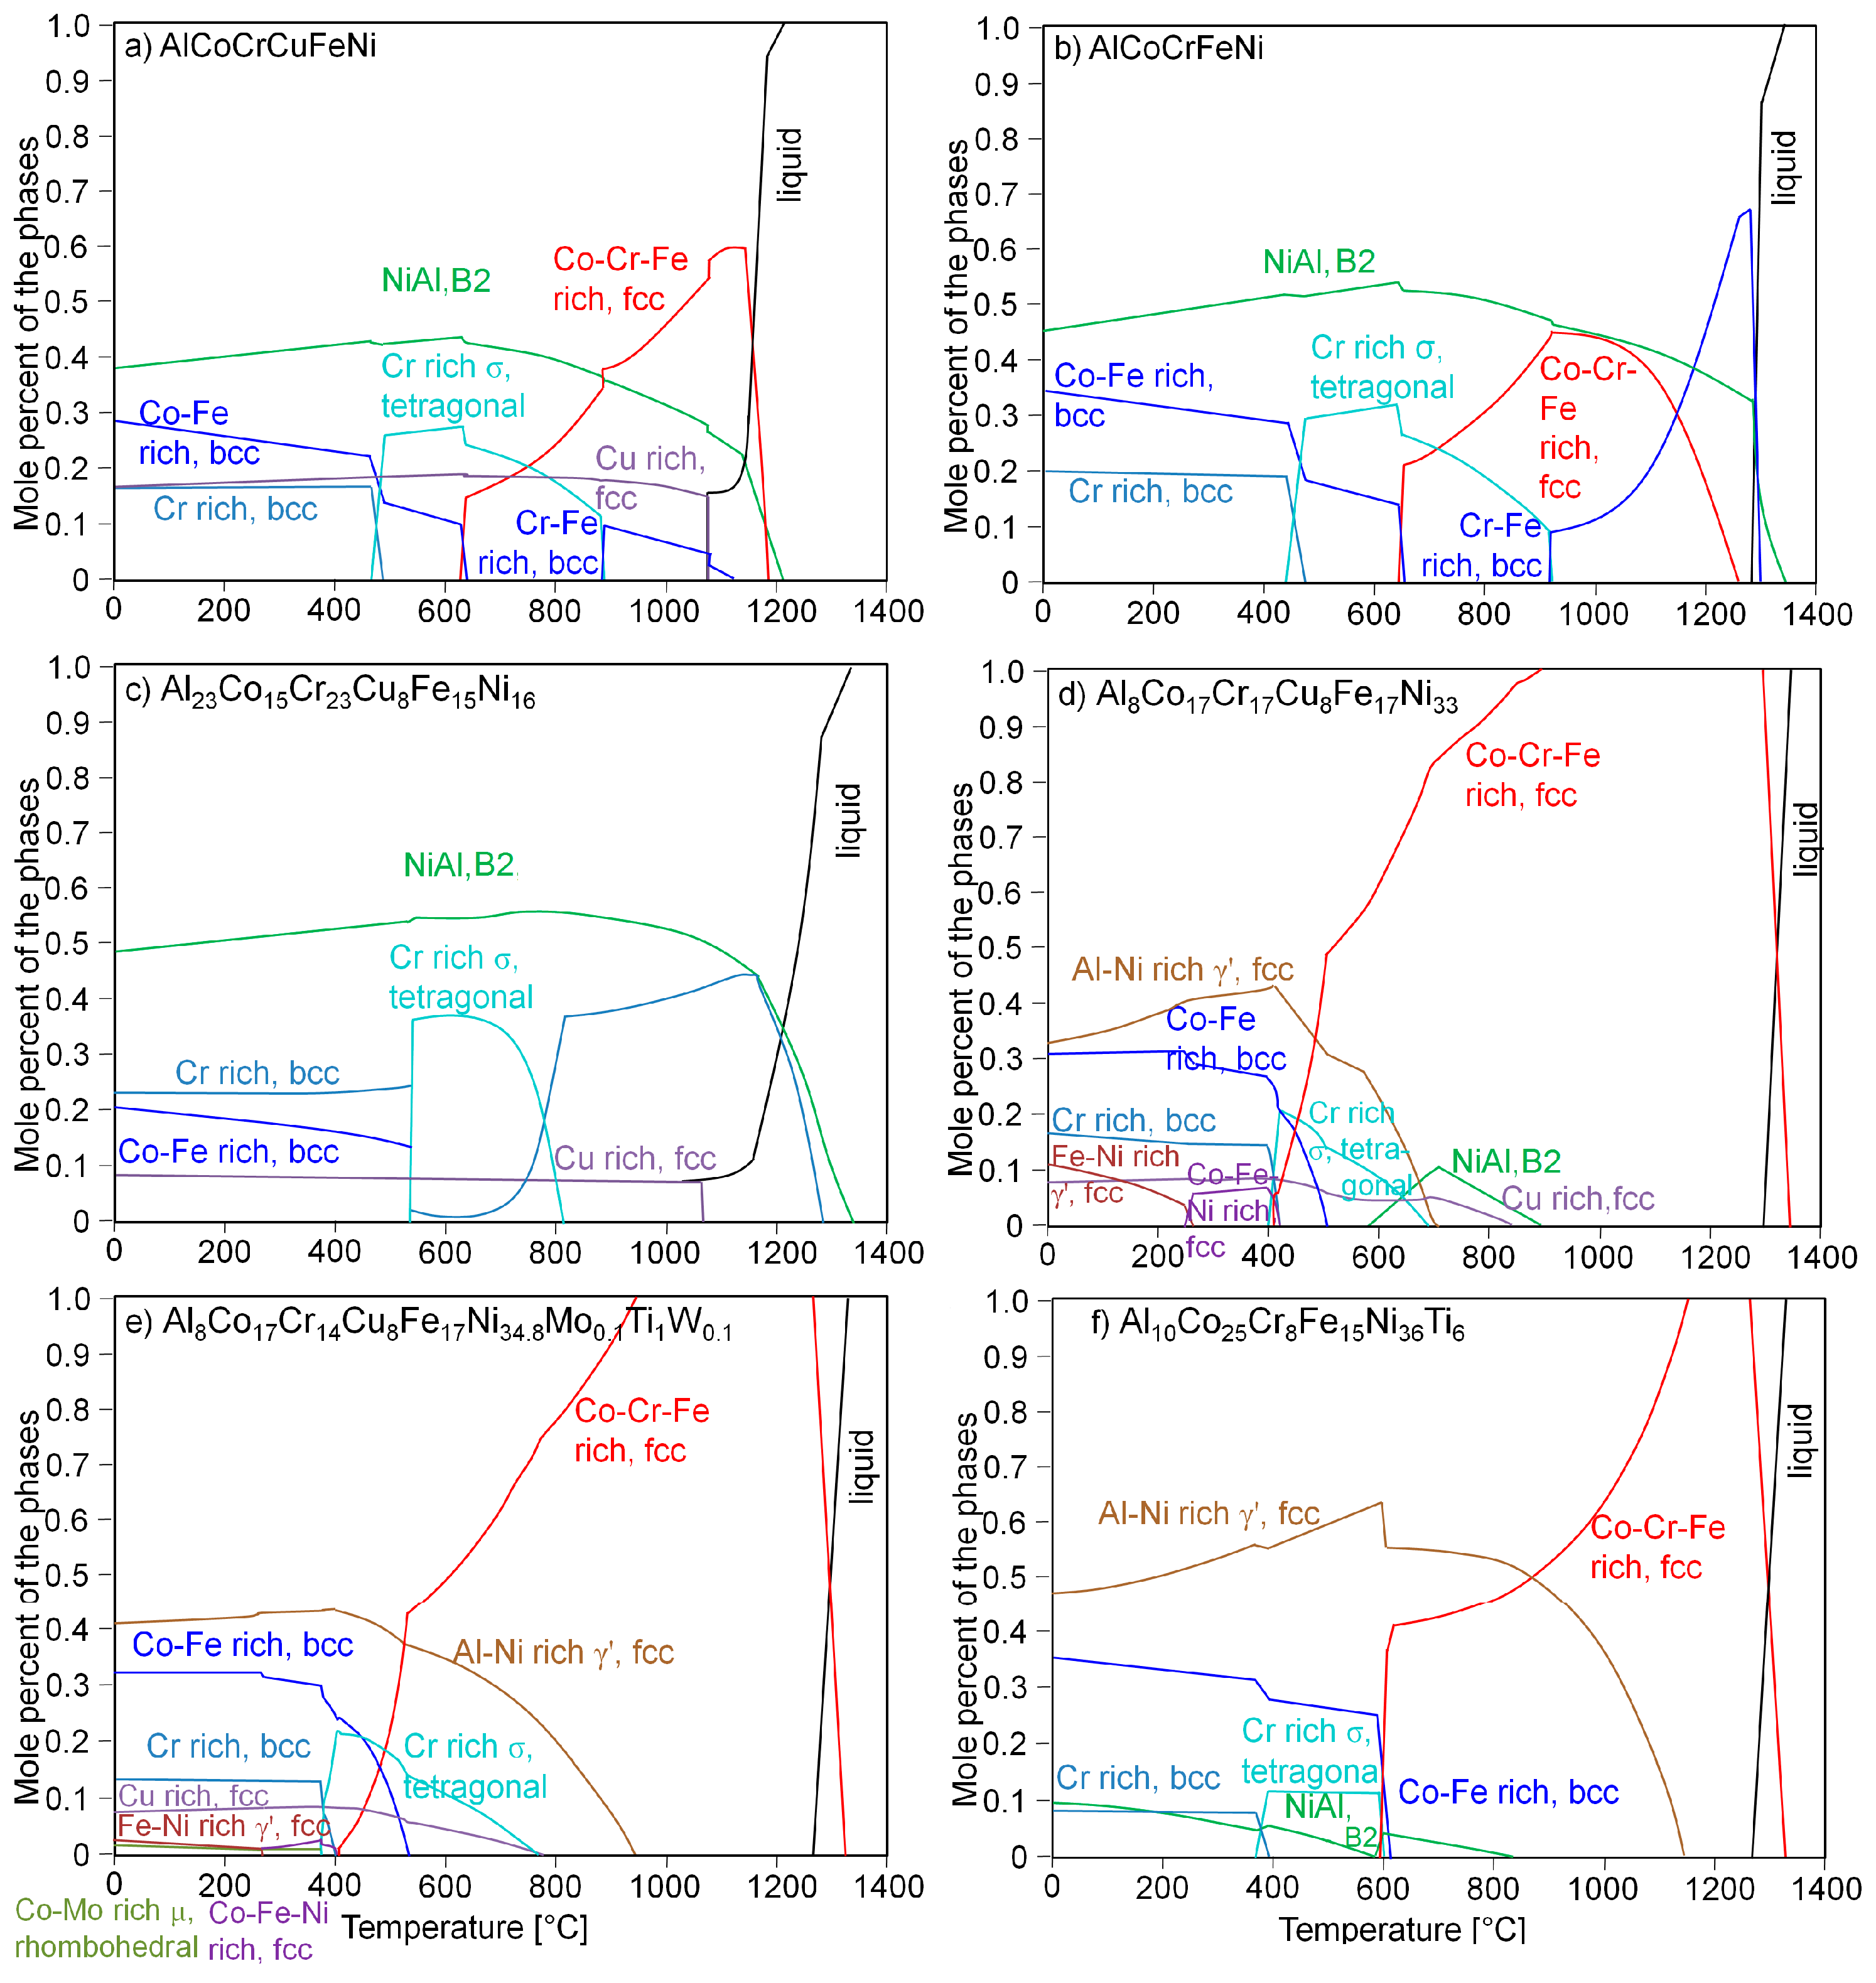
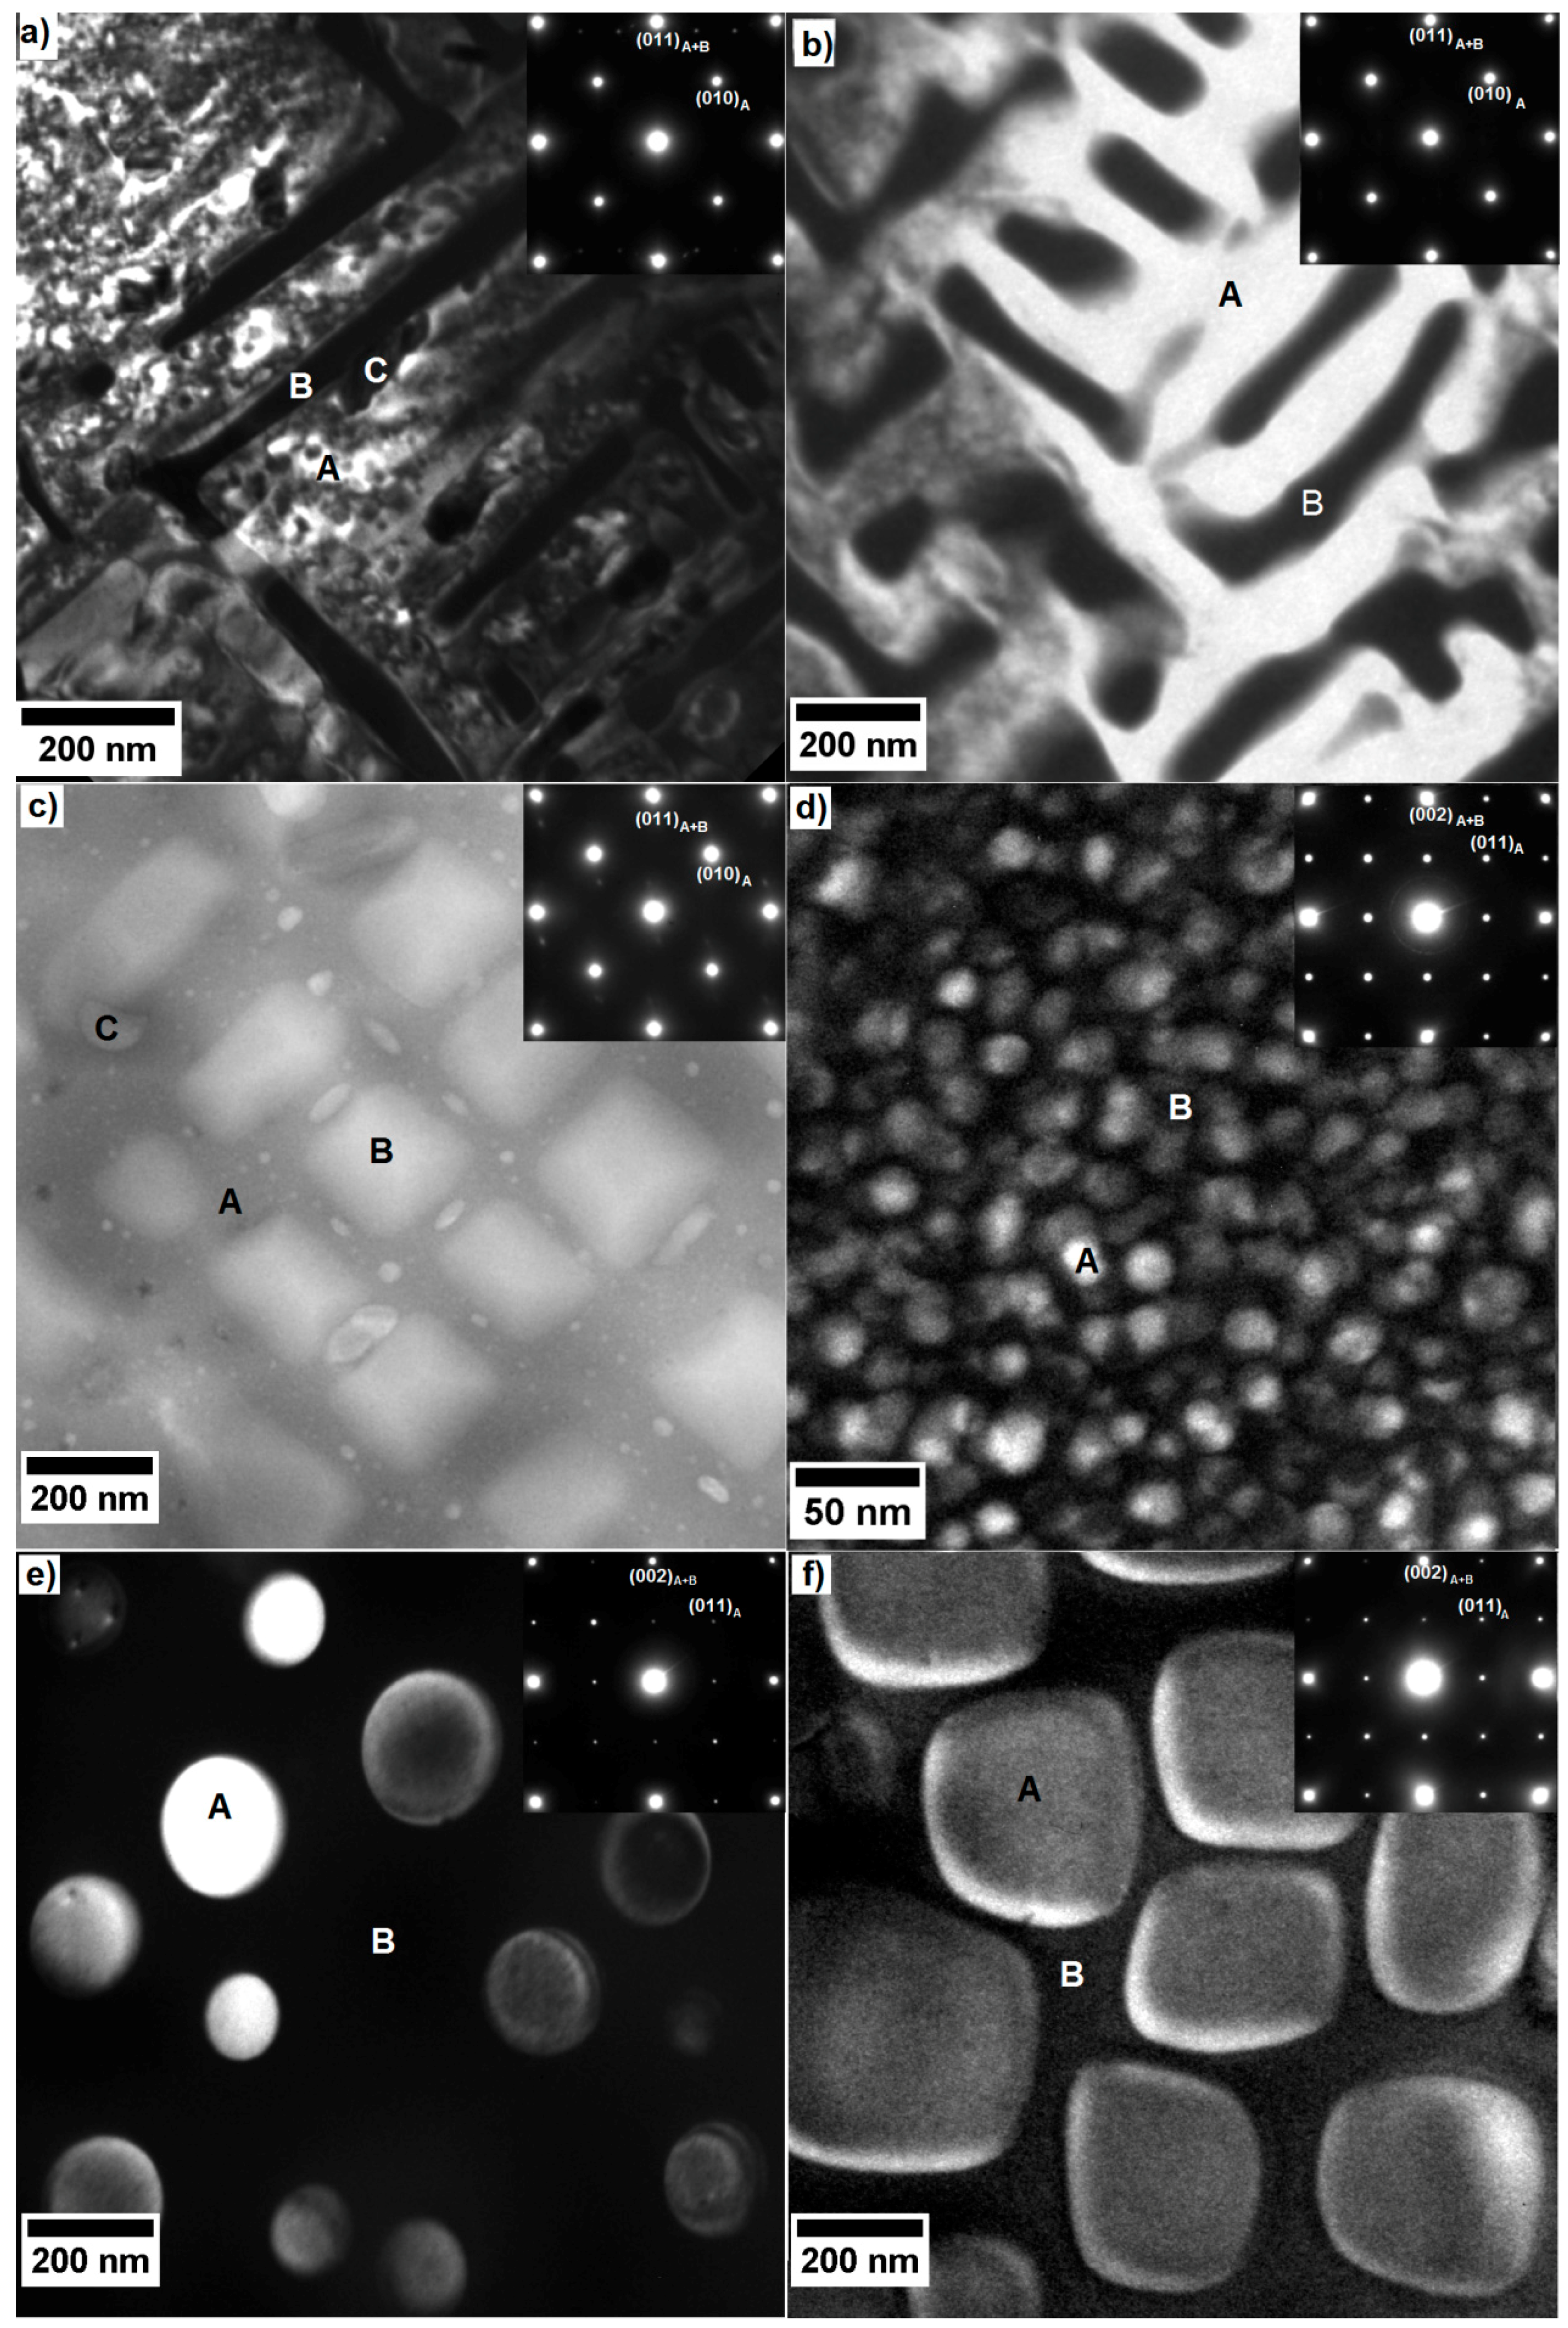
In the bcc alloys, in the Al-Ni rich phase, the amount of Ni and Al is almost the same, in order to form NiAl. In the fcc alloys, there is almost three times as much Ni than Al, which leads to the formation of the γ′ phase.
-
In the (Co-)Cr-Fe rich phase, the bcc alloys show a very high amount of Cr, at least 1,2 times higher than the amount of Fe. This is particularly true when observing the relative composition, compared to the nominal one. In the fcc alloys, the relative amounts of Cr, Fe and also Co is much closer. The Co-Cr-Fe matrix composition in the fcc alloys is quite close to the nominal composition of the whole alloy (except for segregating element Cu).
-
Ti partitions strongly to the γ′ phase, especially in Alloy 5. Even though the total amount of Ti in Alloy 5 is only 1 at.%, there are 4.6 at.% in the γ′ phase. This strong segregation is only possible because of the low volume fraction of the γ′ phase (about 7%).
The structure of the main phases, i.e., the matrix and the most prominent precipitates, sizes of the precipitating phase and their volume fraction as well as the additional phases and some comments on the alloys’ behaviours are summarized in Table 3. In addition to the microstructural investigations microhardness measurements have been carried out on the alloys. Figure 5 shows the Vickers microhardnesses for the six alloys. The bcc alloys are much harder (> 400 HV) than the fcc alloys (< 350 HV). A high hardness is favourable, but unfortunately all three bcc alloys are too brittle for mechanical application. The complete removal of Cu as well as the addition of more Al and Cr do not seem to be a good path to follow for the optimization of Alloy 1.
The hardnesses of Alloy 4 and Alloy 5 are very low, compared to Ni-based alloys (e.g., ~420 HV for CMSX4). However, the last alloy, Alloy 6, has a medium hardness and handling during sample preparations shows good ductility.
Finally, tensile tests on three of the six alloys, namely Alloy 1 [23], Alloy 4 [18], and Alloy 6 [24] give a last tool for comparing the alloys (see Figure 6). Tensile tests have been carried out at different temperatures and the obtained data has been compared with that of commercial alloys like Alloy 800H [25] and Inconel 617 [26]. Alloy 4 shows the lowest strength at the investigated temperatures. Alloy 1 has an intermediate strength. The last alloy, Alloy 6, shows the best tensile properties at all investigated temperatures [24]. This alloy will thus be kept for further optimization.

4. Summary

Equiatomic AlCoCrCuFeNi is characterized by a high number of phases and insufficient mechanical properties, which inhibit the use of this alloy. An optimization of this alloy has been found with the help of ThermoCalc simulations of about 190 alloys from the Al-Co-Cr-Cu-Fe-Ni-Ti family. The optimization has been achieved by the following steps:
-
Reduction of segregated phases → The Cu content was reduced or removed completely.
-
Optimization of the oxidation properties → the content of Al and Cr was increased
-
Preferential formation of a two phase microstructure in the alloy → addition of Ti and/or variation of the composition of the other alloying elements. The final microstructure shows the well-known γ-γ′ microstructure.
The following high entropy alloys have been developed during the pathway of the optimization:
AlCoCrCuFeNi, AlCoCrFeNi, Al23Co15Cr23Cu8Fe15Ni16, Al8Co17Cr17Cu8Fe17Ni33, Al8Co17Cr14Cu8 Fe17Ni34.8Mo0.1Ti1W0.1 and Al10Co25Cr8Fe15Ni36Ti6. The alloys have been heat treated if this has been found useful from the ThermoCalc simulation. The samples have been investigated by optical, scanning electron microscopy and transmission electron microscopy as well as Vickers hardness measurements. AlCoCrCuFeNi, Al8Co17Cr17Cu8Fe17Ni33, and Al10Co25Cr8Fe15Ni36Ti6 have also been tested in tensile tests. The most promising alloy finally was found to be Al10Co25Cr8Fe15Ni36Ti6 because its microstructural and mechanical properties lead to the assumption that it can be a cancidate for application in domains that are now covered by Ni-based superalloys.

Acknowledgments

The authors are grateful to the German Research foundation (DFG) for the financial support by WA 1378/15-2 and GL 181/25-2. The authors would like to thank C. Leistner for help with casting and C. Förster for sample preparation and help with hardness measurements.

Author Contributions

A.M.M wrote the paper and performed most microstructural experiments and some hardness measurements. S.S. investigated the AlCoCrCuFeNi alloy. H.M.D. performed the tensile tests and analyzed the data. R.P. made the ThermoCalc calculations. U.G. and R.V. supervised and combined the mechanical data. N.W. supervised and combined the microstructural data.

Conflicts of Interest

The authors declare no conflict of interest.

References

  1. Yeh, J.W. Nano-structured high-entropy alloys. Knowl. Bridge 2003, 40, 1–2. [Google Scholar]
  2. Ranganathan, S. Alloyed pleasures: Multimetallic cocktails. Curr. Sci. 2003, 85, 1404–1406. [Google Scholar]
  3. Tong, C.J.; Chen, M.R.; Chen, S.K.; Yeh, J.W.; Shun, T.T.; Lin, S.J.; Chang, S.Y. Mechanical performance of the AlxCoCrCuFeNi high-entropy alloy system with multiprincipal elements. Metall. Mater. Trans. A 2005, 36A, 1263–1271. [Google Scholar] [CrossRef]
  4. Jiang, L.; Lu, Y.P.; Dong, Y.; Wang, T.M.; Cao, Z.Q.; Li, T.J. Annealing effects on the microstructure and properties of bulk high-entropy CoCrFeNiTi0.5 alloy casting ingot. Intermetallics 2014, 44, 37–43. [Google Scholar] [CrossRef]
  5. Ng, C.; Guo, S.; Luan, J.; Shi, S.; Liu, C.T. Entropy-driven phase stability and slow diffusion kinetics in an Al0.5CoCrCuFeNi high entropy alloy. Intermetallics 2012, 31, 165–172. [Google Scholar] [CrossRef]
  6. Chen, M.R.; Lin, S.J.; Yeh, J.W.; Chen, S.K.; Huang, Y.S.; Tu, C.P. Microstructure and properties of Al0.5CoCrCuFeNiTix (x=0–2.0) high-entropy alloys. Mater. Trans. 2006, 47, 1395–1401. [Google Scholar] [CrossRef]
  7. Cantor, B.; Chang, I.T.H.; Knight, P.; Vincent, A.J.B. Microstructural development in equiatomic multicomponent alloys. Mater. Sci. Eng. A 2004, 375, 213–218. [Google Scholar] [CrossRef]
  8. Senkov, O.N.; Wilks, G.B.; Miracle, D.B.; Chuang, C.P.; Liaw, P.K. Refractory high-entropy alloys. Intermetallics 2010, 18, 1758–1765. [Google Scholar] [CrossRef]
  9. Shun, T.T.; Hung, C.H.; Lee, C.F. Formation of ordered/disordered nanoparticles in FCC high entropy alloys. J. Alloys Compd. 2010, 493, 105–109. [Google Scholar] [CrossRef]
  10. Zhang, Y.; Zhou, Y.J.; Lin, J.P.; Chen, G.L.; Liaw, P.K. Solid-solution phase formation rules for multi-component alloys. Adv. Eng. Mater. 2008, 10, 534–538. [Google Scholar] [CrossRef]
  11. Singh, S.; Wanderka, N.; Murty, B.S.; Glatzel, U.; Banhart, J. Decomposition in multi-component AlCoCrCuFeNi high-entropy alloy. Acta. Mater. 2011, 59, 182–190. [Google Scholar] [CrossRef]
  12. Chen, H.Y.; Tsai, C.W.; Tung, C.C.; Yeh, J.W.; Shun, T.T.; Yang, C.C.; Chen, S.K. Effect of the substitution of Co by Mn in Al-Cr-Cu-Fe-Co-Ni high-entropy alloys. Ann. Chim.-Sci. Des Materiaux 2006, 31, 685–698. [Google Scholar] [CrossRef]
  13. Zhang, K.B.; Fu, Z.Y.; Zhang, J.Y.; Shi, J.; Wang, W.M.; Wang, H.; Wang, Y.C.; Zhang, Q.J. Annealing on the structure and properties evolution of the CoCrFeNiCuAl high-entropy alloy. J. Alloys Compd. 2010, 502, 295–299. [Google Scholar] [CrossRef]
  14. Tung, C.C.; Yeh, J.W.; Shun, T.T.; Chen, S.K.; Huang, Y.S.; Chen, H.C. On the elemental effect of AlCoCrCuFeNi high-entropy alloy system. Mater. Lett. 2007, 61, 1–5. [Google Scholar] [CrossRef]
  15. Manzoni, A.; Daoud, H.; Völkl, R.; Glatzel, U.; Wanderka, N. Phase separation in equiatomic AlCoCrFeNi high-entropy alloy. Ultramicroscopy 2013, 132, 212–215. [Google Scholar] [CrossRef] [PubMed]
  16. Zhang, Y.; Ma, S.G.; Qiao, J.W. Morphology Transition from Dendrites to Equiaxed Grains for AlCoCrFeNi High-Entropy Alloys by Copper Mold Casting and Bridgman Solidification. Metall. Mater. Trans. A-Phys. Metall. Mater. Sci. 2012, 43A, 2625–2630. [Google Scholar] [CrossRef]
  17. Manzoni, A.; Daoud, H.; Mondal, S.; van Smaalen, S.; Völkl, R.; Glatzel, U.; Wanderka, N. Investigation of phases in Al23Co15Cr23Cu8Fe15Ni16 and Al8Co17Cr17Cu8Fe17Ni33 high entropy alloys and comparison with equilibrium phases predicted by Thermo-Calc. J. Alloys Compd. 2013, 552, 430–436. [Google Scholar] [CrossRef]
  18. Daoud, H.M.; Manzoni, A.; Volkl, R.; Wanderka, N.; Glatzel, U. Microstructure and Tensile Behavior of Al8Co17Cr17Cu8Fe17Ni33 (at.%) High-Entropy Alloy. JOM 2013, 65, 1805–1814. [Google Scholar] [CrossRef]
  19. Manzoni, A.M.; Daoud, H.M.; Voelkl, R.; Glatzel, U.; Wanderka, N. Influence of W, Mo and Ti trace elements on the phase separation in Al8Co17Cr17Cu8Fe17Ni33 based high entropy alloy. Ultramicroscopy 2015, 159, 265–271. [Google Scholar] [CrossRef] [PubMed]
  20. Takeuchi, A.; Inoue, A. Evaluation of glass-forming ability for metallic glasses from time-reduced temperature-transformation diagram. Mater. Trans. 2001, 42, 2374–2381. [Google Scholar] [CrossRef]
  21. The Version TCCR, ThermoCalc Software AB. Available online: http://www.thermocalc.com (accessed on 17 March 2016).
  22. Thermotech Ni-Based Superalloys Database, TTNI7, Version 7.0; ThermoCalc Software AB: Stockholm, Sweden, 2006.
  23. Kuznetsov, A.V.; Shaysultanov, D.G.; Stepanov, N.D.; Salishchev, G.A.; Senkov, O.N. Tensile properties of an AlCrCuNiFeCo high-entropy alloy in as-cast and wrought conditions. Mater. Sci. Eng. A-Struct. Mater. Prop. Microstruct. Process. 2012, 533, 107–118. [Google Scholar] [CrossRef]
  24. Daoud, H.M.; Manzoni, A.M.; Wanderka, N.; Glatzel, U. High-Temperature Tensile Strength of Al10Co25Cr8Fe15Ni36Ti6 Compositionally Complex Alloy (High-Entropy Alloy). JOM 2015, 67, 2271–2277. [Google Scholar] [CrossRef]
  25. Specification Sheet: Alloy 800, 800H, and 800AT. Available online: http://www.sandmeyersteel.com/images/Alloy-800-Spec-Sheet.pdf (accessed on 17 March 2016).
  26. Special Metals. Available online: http://www.specialmetals.com/documents/Inconel%20alloy%20617.pdf (accessed on 17 March 2016).
Figure 1. A pseudo-ternary phase diagram (Al-Ti)-(Ni-Co)-Fe. Olive green dots represent commercially used Al- or Ti-based alloys (e.g., the Al 4XXX series, the Al 8XXX series, Ti-B11007 or Ti-1Al-8V-5Fe)); blue dots represent commercially used Fe-based alloys (e.g., PH-13-8, X10 CrAlSi 24, the TRIP steels, 1RK91, X6 CrNi 22-13 or X10 NiCrAlTi 32-20); violet dots represent commercially used Ni-based alloys (e.g., CMSX-4, CMSX-10, Waspaloy, Inconel 617, Stellite or Inconel 718) and yellow dots Fe-Ni binary alloys (e.g., the Alloy 800). The investigated high entropy alloys are represented in red. The black arrows point the way of the alloy evolution.
Entropy 18 00104 g001
Figure 2. The calculated phase diagrams of the six alloys (a) Alloy 1 (AlCoCrCuFeNi); (b) Alloy 2 (AlCoCrFeNi); (c) Alloy 3 (Al23Co15Cr23Cu8Fe15Ni16); (d) Alloy 4 (Al8Co17Cr17Cu8Fe17Ni33); (e) Alloy 5 (Al8Co17Cr14Cu8Fe17Ni34.8Mo0.1Ti1W0.1) and (f) Alloy 6 (Al10Co25Cr8Fe15Ni36Ti6) using the ThermoCalc software [21] and the TTNi7 database [22].
Entropy 18 00104 g002
Figure 3. Optical micrographs of as-cast: (a) Alloy 1, AlCoCrCuFeNi (polished); (b) Alloy 2, AlCoCrFeNi (etched); (c) Alloy 3, Al23Co15Cr23Cu8Fe15Ni16 (etched); and after heat treatment: (d) 1250 °C/1 h + 750 °C/24 h for Alloy 4, Al8Co17Cr17Cu8Fe17Ni33 (polished), (e) 1250 °C/80 min + 875 °C/100 h for Alloy 5, Al8Co17Cr14Cu8Fe17Ni34.8Mo0.1Ti1W0.1 (polished) and (f) 1220 °C/20 h + 900 °C/50 h for Alloy 6, Al10Co25Cr8Fe15Ni36Ti6 (electropolished).
Entropy 18 00104 g003
Figure 4. TEM images and the corresponding SAD taken along the [100] zone axis: (a) DF image of AlCoCrCuFeNi, at a random orientation; (b) DF of Alloy 1, AlCoCrFeNi; (c) STEM image of Alloy 2, Al23Co15Cr23Cu8Fe15Ni16; (d) DF of Alloy 3, Al8Co17Cr17Cu8Fe17Ni33; (e) DF of Alloy 4, Al8Co17Cr14Cu8Fe17Ni34.8Mo0.1Ti1W0.1; (f) DF of Alloy 6, Al10Co25Cr8Fe15Ni36Ti6. A stands for the Al-Ni rich phase, B for the (Co-)Cr-Fe rich phase and C for the Cu-rich phase.
Entropy 18 00104 g004
Figure 5. Vickers hardness data for the six alloys Alloy 1 (AlCoCrCuFeNi), Alloy 2 (AlCoCrFeNi), Alloy 3 (Al23Co15Cr23Cu8Fe15Ni16), Alloy 4 (Al8Co17Cr17Cu8Fe17Ni33), Alloy 5 (Al8Co17Cr14Cu8Fe17Ni34.8Mo0.1Ti1W0.1) and Alloy 6 (Al10Co25Cr8Fe15Ni36Ti6).
Entropy 18 00104 g005
Figure 6. Results of tensile tests at different temperatures, carried out on Alloy 1 (AlCoCrCuFeNi), Alloy 4 (Al8Co17Cr17Cu8Fe17Ni33), and Alloy 6 (Al10Co25Cr8Fe15Ni36Ti6), compared with commercial alloys Alloy 800H and Inconel 617 [18,23,24,25,26].
Entropy 18 00104 g006
Table 1. The chosen optimum heat treatments for all six alloys AlCoCrCuFeNi (Alloy 1), AlCoCrFeNi (Alloy 2), Al23Co15Cr23Cu8Fe15Ni16 (Alloy 3), Al8Co17Cr17Cu8Fe17Ni33 (Alloy 4), Al8Co17Cr14Cu8Fe17Ni34.8Mo0.1Ti1W0.1 (Alloy 5) and Al10Co25Cr8Fe15Ni36Ti6 (Alloy 6).
AlloyDenominationOptimum Heat Treatment
AlCoCrCuFeNiAlloy 1As-cast
AlCoCrFeNiAlloy 2As-cast
Al23Co15Cr23Cu8Fe15Ni16Alloy 3As-cast
Al8Co17Cr17Cu8Fe17Ni33Alloy 41250 °C/1 h—quenching in water
700 °C/24 h—quenching in water
Al8Co17Cr14Cu8Fe17Ni34.8Mo0.1Ti1W0.1Alloy 51250 °C/80 min—quenching in water
875 °C/100 h—quenching in water
Al10Co25Cr8Fe15Ni36Ti6Alloy 61220 °C/20 h—cooling in furnace under Ar
900 °C/50 h—cooling in furnace under Ar
Table 2. Chemical composition of the main phases in the six investigated alloys Alloy 1 (AlCoCrCuFeNi), Alloy 2 (AlCoCrFeNi), Alloy 3 (Al23Co15Cr23Cu8Fe15Ni16), Alloy 4 (Al8Co17Cr17Cu8Fe17Ni33), Alloy 5 (Al8Co17Cr14Cu8Fe17Ni34.8Mo0.1Ti1W0.1) and Alloy 6 (Al10Co25Cr8Fe15Ni36Ti6). Data have been taken from the references given in the Ref. column. The error bar is given by the standard deviation 2 σ.
PhaseConcentration [at.%]Measuring methodRef.
AlCoCrCuFeNiWMoTi
Alloy 1 (AlCoCrCuFeNi)
Al-Ni rich matrix29.7 ± 1.518.4 ± 1.32.5 ± 0.58.6 ± 0.912.7 ± 1.128.1 ± 1.5 3D-AP[11]
Cr-Fe rich platelets2.8 ± 0.618.8 ± 1.239.6 ± 1.41.3 ± 0.431.3 ± 1.46.2 ± 0.5 3D-AP[11]
Cu rich platelet7.8 ± 0.71.9 ± 0.40.5 ± 0.183.5 ± 1.01.1 ± 0.25.2 ± 0.6 3D-AP[11]
Alloy 2 (AlCoCrFeNi)
Al-Ni rich matrix31.5 ± 3.519.6 ± 1.93.7 ± 0.7 13.1 ± 1.632.0 ± 2.1 3D-AP[15]
Cr-Fe rich precipitates8.5 ± 1.419.2 ± 1.535.7 ± 5.3 27.0 ± 0.49.4 ± 1.9 3D-AP[15]
Alloy 3 (Al23Co15Cr23Cu8Fe15Ni16)
Al-Ni rich matrix34.9 ± 3.619.3 ± 0.82.5 ± 1.55.7 ± 2.49.9 ± 1.127.5 ± 2.3 3D-AP[17]
Cr-Fe rich platelets10.1 ± 3.07.1 ± 2.253.5 ± 6.11.6 ± 1.221.7 ± 2.05.2 ± 1.8 3D-AP[17]
Cu rich phase13.2 ± 3.31.8 ± 0.10.3 ± 0.179.6 ± 6.41.1 ± 0.34.0 ± 3.0 3D-AP[17]
Alloy 4 (Al8Co17Cr17Cu8Fe17Ni33) (heat treatment 700°C 5 h)
Al-Ni rich precipitate22.4 ± 1.79.5 ± 0.95.5 ± 1.111.2 ± 1.46.9 ± 71.444.5 ± 1.6 3D-AP[19]
Matrix5.1 ± 0.319.3 ± 0.519.2 ± 0.24.0 ± 0.819.9 ± 0.832.5 ± 0.3 3D-AP[19]
Alloy 5 (Al8Co17Cr14Cu8Fe17Ni34.8Mo0.1Ti1W0.1)
Al-Ni rich precipitate20.8 ± 0.08.8 ± 0.12.6 ± 0.47.4 ± 0.39.5 ± 0.245.3 ± 0.90.3 ± 0.00.8 ± 0.94.6 ± 0.13D-AP[19]
Matrix7.8 ± 0.419.5 ± 0.314.7 ± 0.64.9 ± 0.217.9 ± 0.233.9 ± 0.40.1 ± 0.10.1 ± 0.10.9 ± 0.03D-AP[19]
Alloy 6 (Al10Co25Cr8Fe15Ni36Ti6)
Al-Ni rich precipitate11.4 ± 0.622.5 ± 0.63.5 ± 0.4 8.8 ± 0.745.0 ± 1.5 8.7 ± 0.5TEM/EDXThis work
Matrix6.9 ± 0.629.5 ± 0.59.3 ± 0.4 20.4 ± 0.630.4 ± 1.0 3.5 ± 0.4TEM/EDXThis work
Needle precipitate24.4 ± 1.321.9 ± 1.73.6 ± 0.2 10.7 ± 0.433.9 ± 0.6 5.6 ± 0.2TEM/EDXThis work
Table 3. Summary of the main phases and the additional phases as well as some comments on the six investigated alloys Alloy 1 (AlCoCrCuFeNi), Alloy 2 (AlCoCrFeNi), Alloy 3 (Al23Co15Cr23Cu8Fe15Ni16), Alloy 4 (Al8Co17Cr17Cu8Fe17Ni33), Alloy 5 (Al8Co17Cr14Cu8Fe17Ni34.8Mo0.1Ti1W0.1) and Alloy 6 (Al10Co25Cr8Fe15Ni36Ti6).
AlloyMatrixMain Precipitating PhaseAverage Size of the Main PrecipitatesVol.% of the Precipitating PhaseAdditional Phase (s)CommentsRef.
Alloy 1
AlCoCrCuFeNi
Al-Ni rich, B2 structureCr-Fe rich, A2 structurePlatelets, 100–400 nm~40Cu rich phases B2; L12Too brittle for mechanical application[11]
Alloy 2
AlCoCrFeNi
Al-Ni rich, B2 structureCr-Fe rich, A2 structureCuboids, 50–100 nm~30-Too brittle for mechanical application[15]
Alloy 3
Al23Co15Cr23Cu8Fe15Ni16
Al-Ni rich, B2 structureCr-Fe rich, A2 structureCuboids, 100–300 nm~46Cu rich plateletsToo brittle for mechanical application[17]
Alloy 4
Al8Co17Cr17Cu8Fe17Ni33
Cr-Co-Fe rich, A1 structureAl-Cu-Ni rich, L12 structureSpheres, 10–20 nm20-Too soft for mechanical application[17,18,19]
Alloy 5
Al8Co17Cr14Cu8Fe17Ni34.8Mo0.1Ti1W0.1
Cr-Co-Fe rich, A1 structureAl-Cu-Ni rich, L12 structureSpheres, 80–200 nm~7-Too soft for mechanical application[19]
Alloy 6
Al10Co25Cr8Fe15Ni36Ti6
Cr-Co-Fe rich, A1 structureAl-Ni-Ti rich, L12 structureCuboids, 160–400 nm~40Needle precipitate, CaF2 structureTo be investigatedThis work

