Article

The Use of Denoising and Analysis of the Acoustic Signal Entropy in Diagnosing Engine Valve Clearance

1
Faculty of Transport, The Silesian University of Technology, 8 Krasinskiego Street, Katowice 40-019, Poland
2
Faculty of Operation and Economics of Transport and Communications, University of Žilina, 1 Univerzitna Street, Žilina 010-26, Slovakia
3
Faculty of Transport and Computer Science, University of Economics and Innovation in Lublin, 4 Projektowa Street, Lublin 20-209, Poland
*
Author to whom correspondence should be addressed.
Entropy 2016, 18(7), 253; https://doi.org/10.3390/e18070253
Submission received: 18 April 2016 / Revised: 7 June 2016 / Accepted: 29 June 2016 / Published: 12 July 2016

Abstract

:
The paper presents a method for processing acoustic signals which allows the extraction, from a very noisy signal, of components which contain diagnostically useful information on the increased valve clearance of a combustion engine. This method used two-stage denoising of the acoustic signal performed by means of a discrete wavelet transform. Afterwards, based on the signal cleaned-up in this manner, its entropy was calculated as a quantitative measure of qualitative changes caused by the excessive clearance. The testing and processing of the actual acoustic signal of a combustion engine enabled clear extraction of components which contain information on the valve clearance being diagnosed.

Graphical Abstract

1. Introduction

Combustion engines are very important components of means of transport and their reliable operation during service is vital. Early and fast diagnosis of any change in the technical condition of an engine makes it possible to anticipate in advance repairs and downtimes of vehicles. Changes in the technical condition of combustion engines may be caused by various types of wear and damage, which may be classified in the basic breakdown as either damage to mechatronic or mechanical elements. The former are diagnosed primarily by using various generations of On Board Diagnostics (OBD) systems in order to evaluate mainly changes in current values generated by numerous measurement sensors and control units. Diagnostic problems are significantly greater in the latter case because the wear of mechanical elements or damage thereto may not cause any changes in electrical values in other measurement devices. Another problem present in this case is the phenomenon of the so-called masking of mechanical damage caused by the adaptation of the control unit to the momentarily changing values being measured. This may lead to a situation where engine vibration and noise changes are recognised by mechanics and vehicle users, but are not observable during measurements using OBD system diagnoscopes [1,2,3,4].
This necessitates the development of new methods for recording and evaluating signals generated by the engine. The main items to consider here are vibration and noise signals as well as the analysis of the momentary change in the technical condition of mechanical components of combustion engines, i.e., wear or damage, carried out based on these signals.
Research using measurements and analyses of vibroacoustic signals have been conducted for years in numerous scientific centres. Papers [5,6,7,8,9] present the application of the measurements of combustion engine noise and vibration in the analysis of damage to the injection system. This type of research was also conducted by the authors of [10], which analysed various types of damage to fuel injectors as well as damage to one or two injectors. In [11,12] damage to the hydraulic tensioner of the timing chain system was studied and in [13,14,15,16,17,18] the excessive valve clearance of the combustion engine. Vibroacoustic signals were also used in [19,20], where excessive clearance between the piston and the cylinder sleeve of the engine was detected. Another interesting study was described in [21,22,23,24,25,26], where vibroacoustic signals were used for analyzing the influence of the type of fuel supplied to the engine on its work characteristics. Another issue analysed during this research was the impact of various types of mixtures, such as gasoline, LPG (Liquefied Petroleum Gas) and mixtures with the addition of hydrogen, on the generated vibroacoustic signals. Works on the impact of fuel type on the change of vibroacoustic signals were also carried out in [23,24], which, among others, analysed the effects of the change of the fuel type in a (bi-fuel) engine on the temporary change of vibroacoustic signals.
The authors of [27] suggested the use of signal processing by means of a linear superposition method and cross-correlation analysis to diagnose combustion engines. In [28,29,30,31], the authors used EEMD (Ensemble Empirical Mode Decomposition), coherent power spectrum analysis and improved AHP (Analytic Hierarchy Process) methods for identification of the noise and evaluating different engine damage. An interesting application of vibration signal processing methods was presented in [19], where the use of the continuous wavelet decomposition made it possible to separate signals caused by the combustion process and those caused by the excessive clearance of the piston in the cylinder sleeve. The authors of [13,14,15,16,17,18] presented the possibility of using signal filtration in order to separate components related to the increased valve clearance from components resulting from the combustion process. On the other hand, in [15,16] discrete and continuous wavelet transforms were used for diagnosing the valve clearance based on recorded acoustic signals. These methods enabled the separation of components which contain noise and to leave for further analyses low-energy components which contain information on the change in the value of the valve clearance. Advanced processing of vibroacoustic signals using the continuous wavelet transform was also presented in [12], where damage to the timing gear tensioner was diagnosed by detecting local resonance in the 2–20 scale range. In [32] the authors addressed the use of a continuous wavelet transformation into diesel engine air-born acoustics. In [33,34,35,36,37] the authors proposed the application of time and frequency domain signal processing methods for, inter alia, detecting combustion knocking. Methods of signal recording and processing are also used in studies which deal with pressure identification in the engine cylinder, and in the engine’s noise assessment, which is discussed in [38,39,40,41]. In [10,42,43,44] a broad master base scope, among others of point characteristics, was used for teaching artificial neural networks, which consequently enabled the diagnostics of damage to engine injection and other systems. An interesting application of independent component analysis and the continuous wavelet transform is discussed in [37], where the engine acoustic signals was applied to identify the engine noise sources.
The presented description of the applications of vibration and noise measurements as well as advanced signal vibration to date shows that vibroacoustic methods may prove to be a useful alternative to combustion engine testing methods used thus far. In view of dynamically developing signal recording means and methods new vibroacoustic signal processing methods should be developed in order to diagnose mechanical damage to combustion engines.
In the timing gear systems of combustion engines, there are the so-called “valve clearances” present, which are used (inter alia) to compensate for the thermal expansion of engines. The clearance values are adjusted manually or automatically, by means of hydraulic valve clearance compensators. The value of clearance changes as result of wear of the engine components, as well as wear or damage to the hydraulic valve clearance compensator. This may cause disturbance and worsening of the engine operation dynamics, and in threshold conditions, a considerable increase in vibration and noise of the engine. Damage to the hydraulic valve clearance compensator is also hard to diagnose by means of the methods applied so far. Research on this issue were already presented by the authors in [16].
As part of the research presented in the paper the authors propose the use of a new complex acoustic signal processing method developed in order to diagnose excessive valve clearance. This method used denoising [45,46,47] of the acoustic signal realized in two-stage performed by means of a discrete wavelet transform [48,49,50,51]. Afterwards, based on the signal cleaned-up in this manner, its entropy [52,53,54] was calculated as a quantitative measure of qualitative changes in the acoustic signal caused by the excessive clearance. The testing and processing of the actual acoustic signal of a combustion engine enabled the clear exposition of its significant components which contain information on the diagnosed valve clearance.

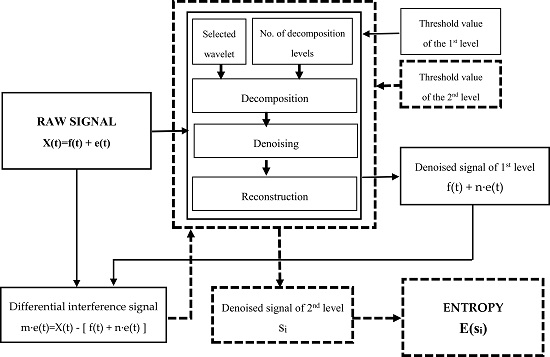
2. Signal Processing Method

The denoising procedure calculated using a discrete wavelet transform [45,46,47,48,49,50,51], and the entropy calculation [52,53,54] were used to extract acoustic signal components which contain information on the increased valve clearance.
This method assumes that the noisy (raw) signal:
X(t) = f(t) + e(t),
may be separated during the denoising procedure into the primary (target) signal f(t) and interference e(t). The calculation procedure takes into account:
  • decomposition of the signal;
  • assumption of the threshold coefficient and of the number of decomposition levels;
  • cutting off the noise at each decomposition level;
  • signal reconstruction.
After the procedure the denoised signal of the 1st level is obtained, which consists of:
f(t) + n·e(t),
while the remaining signal is treated as the differential interference signal m·e(t), and is calculated from the dependence:
m·e(t) = X(t) − [f(t) + n·e(t)],
where:
n + m = 1 and n << m.
The idea behind this type of signal processing and examples of its application can be found among others in research presented in [45,46,47,48,49,50,51,52,53,54].
It was concluded based on the tests that the denoising procedure performed and giving the result as a f(t) + n·e(t) signal in the manner described above did not yield satisfactory results in the case of an acoustic signal X(t) emitted by a combustion engine. This was caused by the fact that the acoustic pressure level signal X(t) recorded in the vicinity of a combustion engine has a constant which cannot be removed using the traditional denoising method described above.
The differential interference signal m·e(t) was selected for further analyses. That signal was denoised once more at the 2nd level. As a result of these calculations a selective denoised acoustic signal si which contained information on the increased valve clearance was obtained. Interference present in this signal is minor and irrelevant from the point of view of further analyses.
After a two-stage procedure of denoising of acoustic signal X(ti), the entropy of obtained signal si is determined from the basic dependence:
E(si) = −∑si2log(si2).
The complete algorithm of the calculations is shown in Figure 1.

3. Test Stand

The study were conducted using two four-cylinder spark-ignition (SI) engines of passenger cars. These engines was characterised by:
  • Engine I—capacity of 1.2 L, a mileage of 130,000 kilometres, eight-valve heads.
  • Engine II—capacity of 1.6 L, a mileage of 160,000 kilometres, eight-valve heads, and an older generation engine.
The study included modelling of double enlargement of a nominal timing system valve clearance. Such a valve clearance enlargement may occur in a number of cases, including a defect of the valve clearance compensators in hydraulic tappets. In engine I, valve clearance for the second engine cylinder was enlarged, whereas in engine II, the same was done for the first cylinder valves. The phases of valve timing of the tested engines were presented in Figure 2 and in Table 1.
The measuring system used to diagnose defects of valves consisted of the following elements:
  • norsonic signal analysers along with a condenser microphone (Norsonic AS, Tranby, Norway) used to measure the acoustic pressure over the engine valve cover with distance 0.5 m (Figure 3);
  • an optic sensor used to record the reference signal of the crankshaft positioning;
  • a DSPT SigLab signal analyser (DSP Technologies Inc., Santa Barbara, CA, USA);
  • a computer used for signal recording.
The signals were being recorded at the sampling frequency of 25.6 kHz. They were subsequently processed using the Matlab-Simulink software (Version 2016a).
The detailed scope of the method of conducting measurements on laboratory stands is in line with the description provided in [16] of the authors.

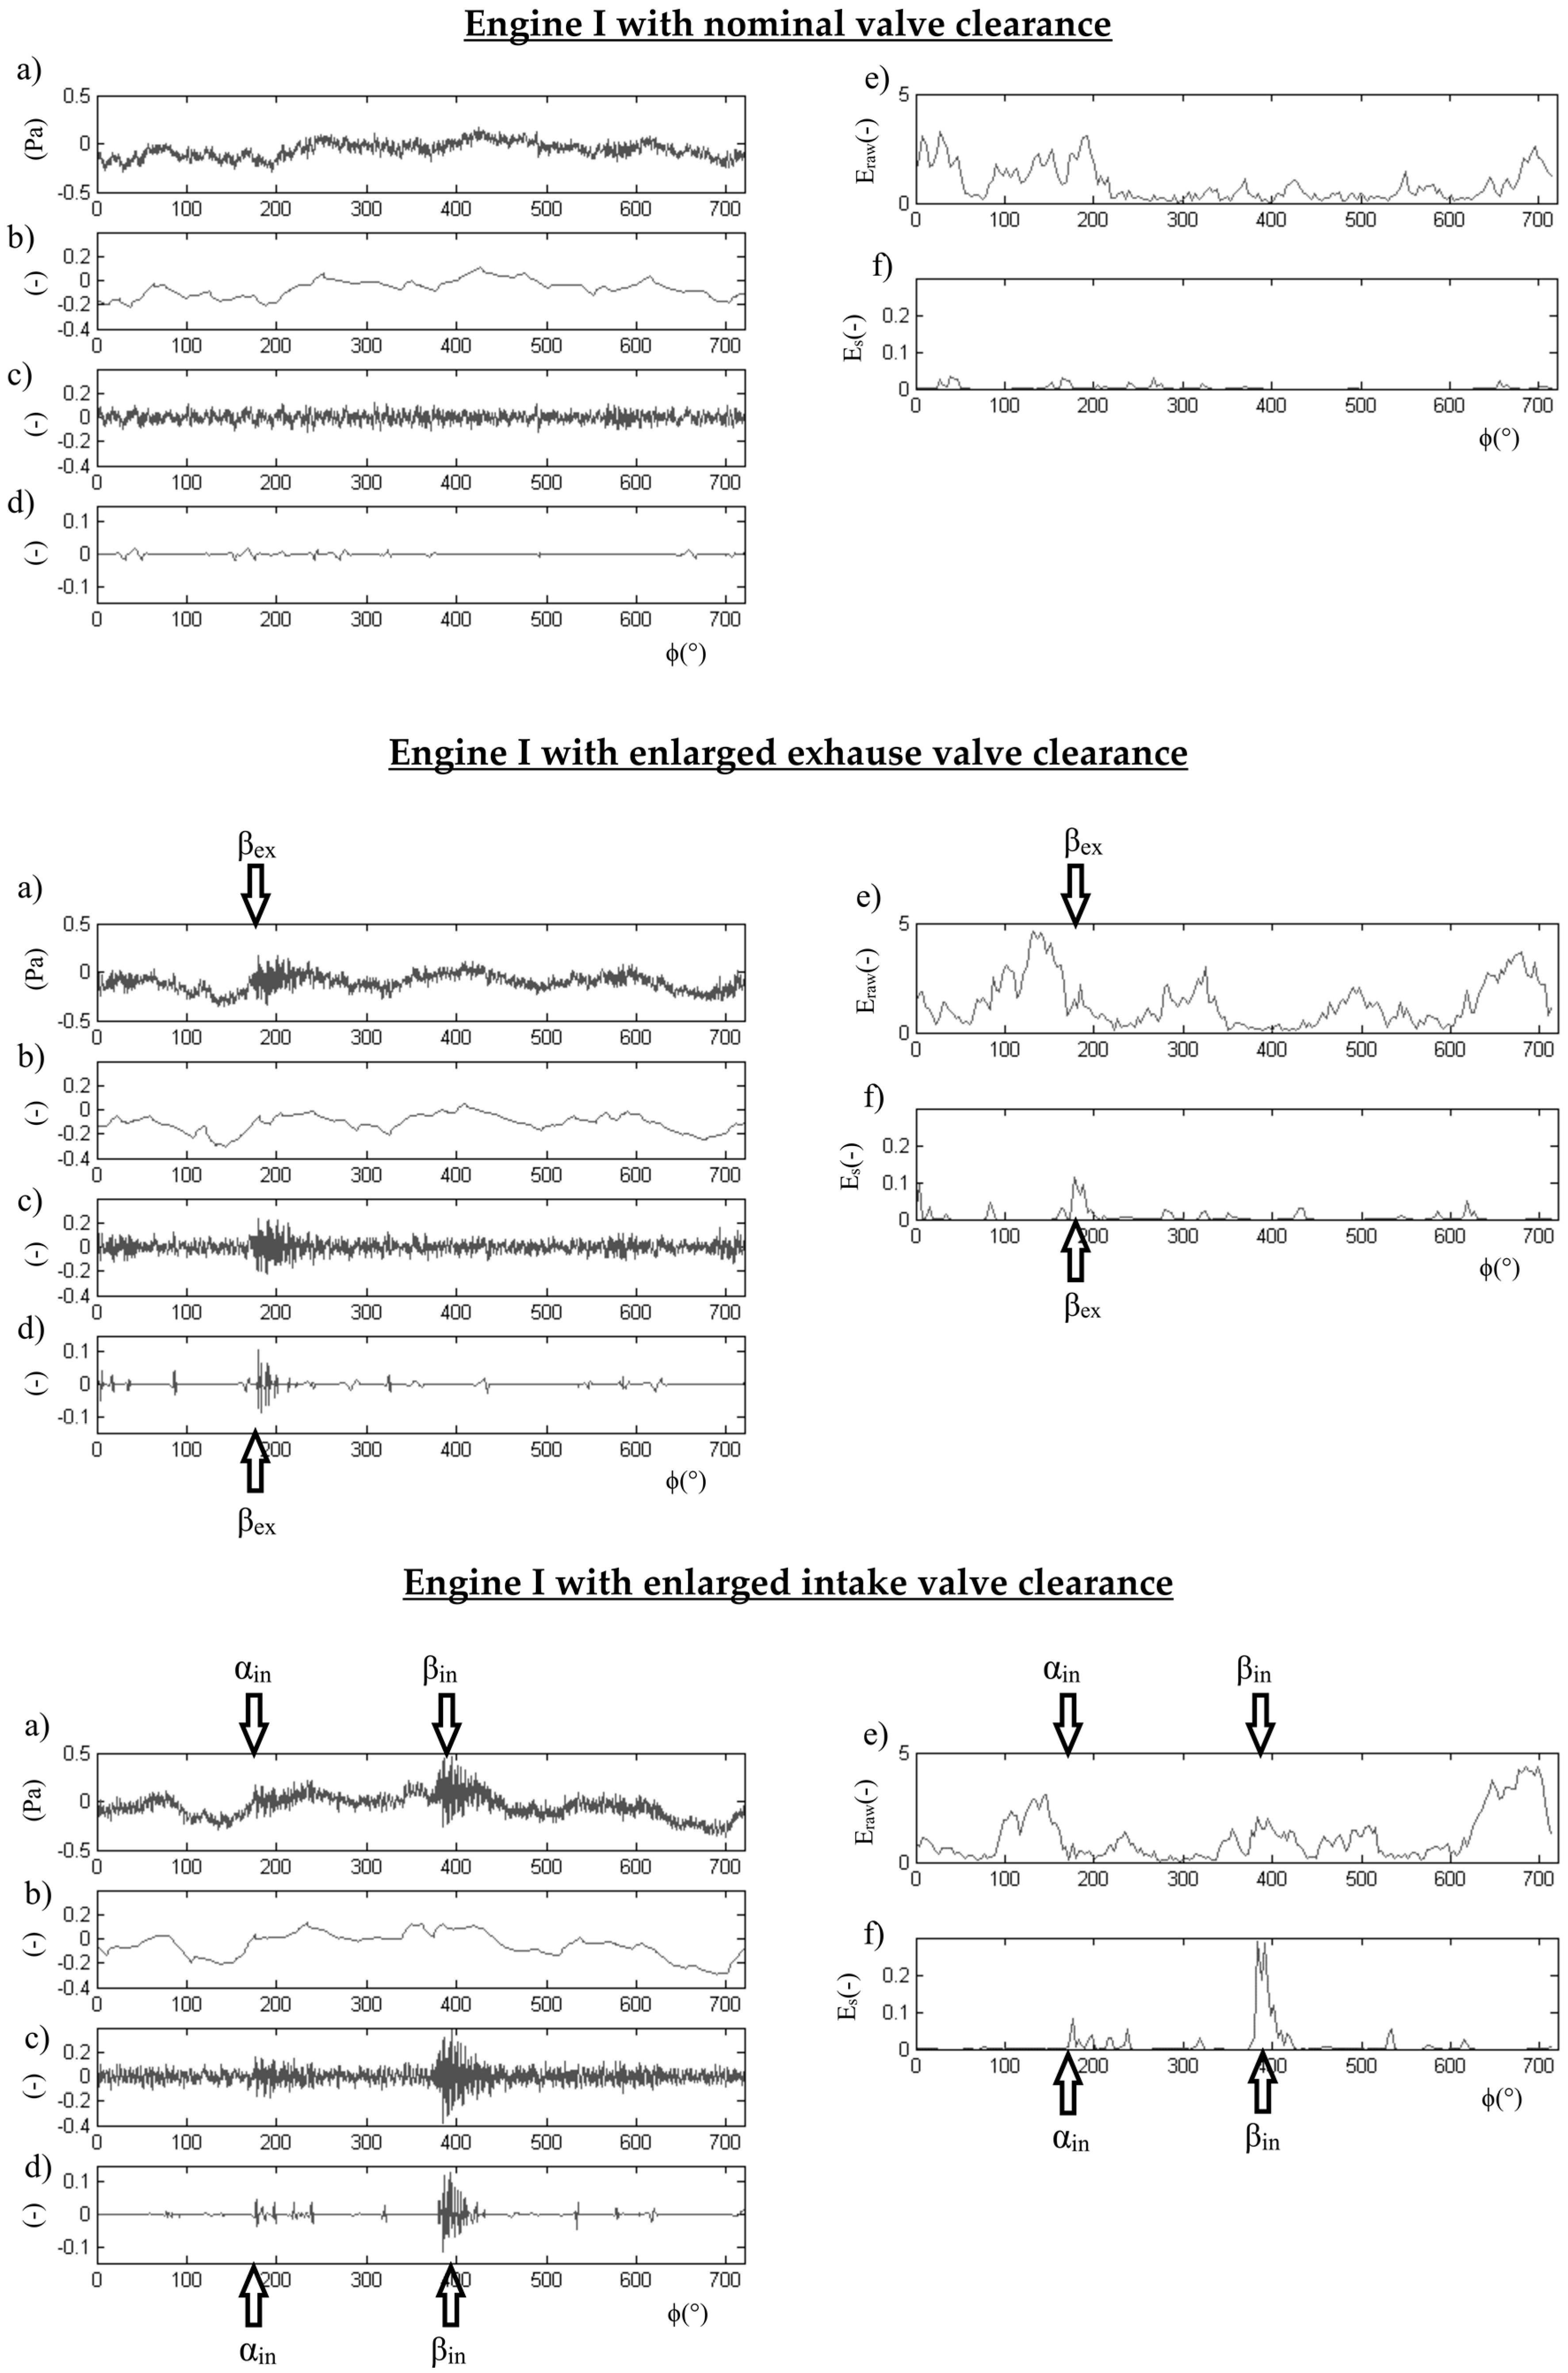
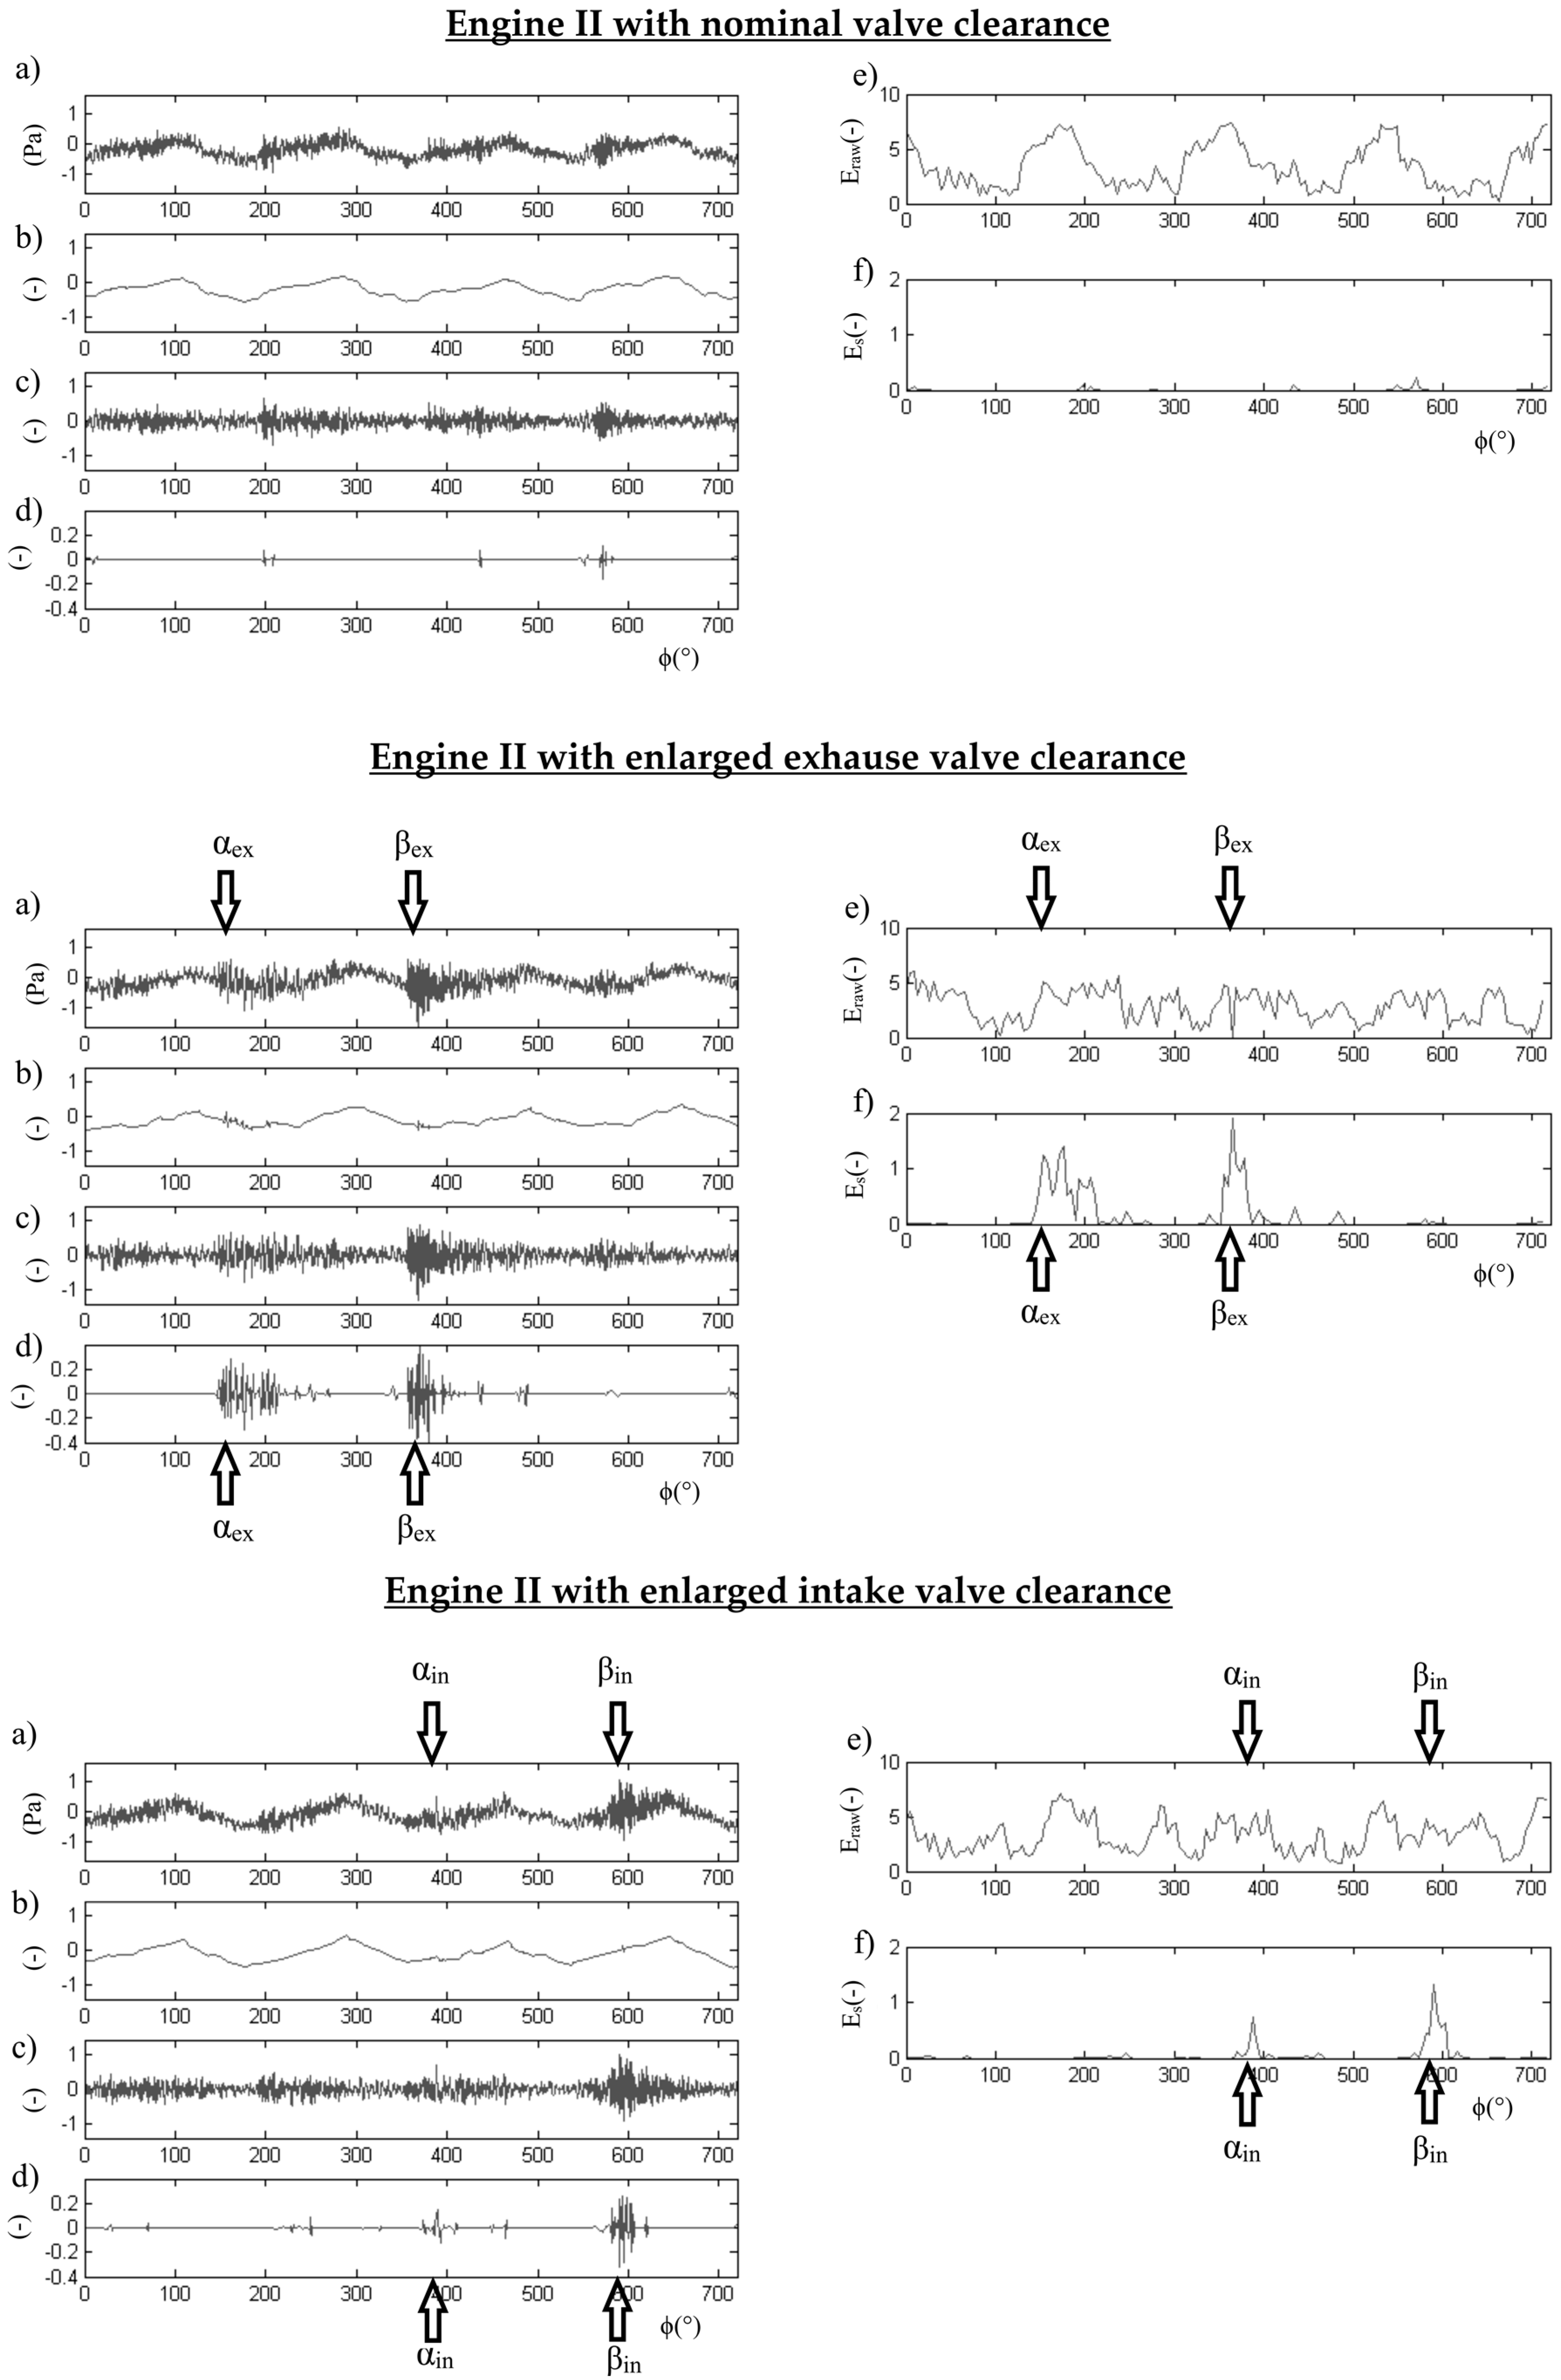
4. Results and Discussion

In a further part of the study, based on the signal processing method presented in Section 2 and the recorded acoustic signals (Section 3), the following calculation assumptions were adopted for the processing of the recorded acoustic signals in the denoising procedure:
  • the length of the analysed signal corresponded to a 720° crankshaft rotation of the tested combustion engines, recorded at the rotational speed of idling;
  • Daubechies 2 wavelet;
  • number of decomposition levels = 6;
  • threshold value of the 1st level of denoising = 0.5 (engine I) or 1.1 (engine II);
  • threshold value of the 2nd level of denoising = 0.17 (engine I) or 0.6 (engine II);
  • soft thresholding;
  • window length during calculation of entropy = 20 samples.
The assumptions adopted in the research concerning signal processing resulted from the experience and results of preliminary studies conducted by the authors. They took into account, among others, assumptions such as:
  • the length of the analysed signal should correspond to a complete working cycle of a four-stroke engine, i.e., 720° of crankshaft rotation;
  • the selected wavelet should approximate well the analysed signals;
  • the decomposition levels and the threshold type and values should allow for maximum (in terms of quality) clearing of the signal of interference, without causing any substantial reduction in the contents in the information included in the signal; on the other hand, the dynamics of sensitivity of quantitative and qualitative changes in entropy to the detected valve clearance should be high.
Figure 4a–d and Figure 5a–d show the recorded acoustic pressure signals and the results of the subsequent stages of their filtration performed in accordance with the procedure presented in Section 2 of the paper.
According to the presented results of tests of both engines it is possible to filter out from the acoustic signal any information not relevant to the process of detecting excessive valve clearance values. Two-stage denoising along with the calculation of the differential interference signal enable the identification of a local change in the amplitude of denoised signal si, caused by the mechanical excitation resulting from the increased valve clearance of the tested combustion engines.
The calculated values of entropy Eraw for raw acoustic signal Es are shown in Figure 4e,f and Figure 5e,f. A comparison of local changes in entropy Eraw for the raw acoustic signal and denoised signal Es leads to a clear conclusion that entropy calculated in this research for the raw acoustic signal does not enable the identification of qualitative and quantitative changes which could be unambiguously classified as corresponding to the increased valve clearances of the tested engines. Based on the courses of the momentary entropy of denoised signal Es it may be concluded that qualitative changes correspond to points in time when valves with increased clearances are being opened or closed. It can be noticed, however, that quantitative changes in the entropy value are different and depend on the acoustic pressure level recorded in the vicinity of each engine, the general technical condition of the tested engines and on whether the valve is being opened or closed.
A comparison of the obtained test results for example with the method suggested by authors in [16], where signal filtration by means of a packet wavelet transform was used, leads to a conclusion that the denoising method proposed in the paper enabled much better filtration of the acoustic signal. According to the conducted research the need to adopt various levels of threshold value for different engines poses a major hindrance in the use of the developed denoising method. However, the threshold values may be selected in such a manner that only useful diagnostic information will remain, as shown in Figure 4 and Figure 5.
Based on the results presented in Figure 4 and Figure 5 it may be concluded that a clear increase in the value of the entropy of the processed acoustic signal is observed always when valves with increased clearances are being closed. An analysis of changes in entropy present during the opening of these valves leads to a conclusion that qualitative changes occur in the majority of the tested engines, but their quantitative increase is much smaller than during the closing of the valves.

5. Conclusions

The paper presents a new method for processing vibroacoustic signals which enables diagnosing excessive combustion engine valve clearance by using two-stage signal denoising and entropy calculation. The developed method made it possible to remove irrelevant components of the acoustic signal of the engine and to leave only these components which are responsible for carrying information on the diagnosed clearance. The calculated entropy of the raw signal and the denoising signal made it possible to demonstrate that a properly processed acoustic signal contains useful diagnostic components which are heavily masked by noise. The extraction of these signals requires, however, extensive processing of the raw acoustic signal, which was developed by the authors and described in Section 2 of the paper. Naturally, like any other method, it also requires further fine-tuning. One of the important elements of signal processing authors are currently working on is the development of a method for the automatic selection of the denoising level in order to extract very diagnostically useful, but heavily masked, components.

Acknowledgments

Part of the research presented in this study is the result of the project Centre of excellence for systems and services of intelligent transport, ITMS 26220120028 supported by the Research Agency, Research and Development Operational Programme funded by the ERDF (European Regional Development Fund). “Podporujeme výskumné aktivity na Slovensku/Projekt je spolufinancovaný zo zdrojov EÚ”. Part of the research presented in this study has been financed by Silesian University of Technology within the scope of the statutory project BK-216/RT2/2016.

Author Contributions

Tomasz Figlus conceived, designed and performed the experiments, developed the signal processing method; Tomasz Figlus, Jozef Gnap, Tomáš Skrúcaný, Branislav Šarkan and Jozef Stoklosa analyzed the data and wrote the paper. All authors have read and approved the final manuscript.

Conflicts of Interest

The authors declare no conflict of interest.

References

  1. Dąbrowski, Z.; Zawisza, M. The choice of vibroacoustic signal measures, in mechanical fault diagnosis of diesel engines. Solid State Phenom. 2015, 236, 220–227. [Google Scholar] [CrossRef]
  2. Puchalski, A.; Komorska, I. Online fault diagnosis of automotive powernets by kalman filtering. Key Eng. Mater. 2014, 588, 209–213. [Google Scholar] [CrossRef]
  3. Puchalski, A. A technique for the vibration signal analysis in vehicle diagnostics. Mech. Syst. Signal Process. 2015, 56, 173–180. [Google Scholar] [CrossRef]
  4. Szczurowski, K.; Radkowski, S.; Walczak, D.; Trojgo, M.; Zieliński, Ł. Applying methods of acquisition of information from vehicle electronic components to improve work parameters of dual fuel engine. Diagnostyka 2015, 16, 37–42. [Google Scholar]
  5. Czech, P.; Wojnar, G.; Folęga, P. Wibroakustyczna diagnostyka niesprawności układu zapłonowego samochodu z wykorzystaniem estymat amplitudowych. Sci. J. Silesian Univ. Technol. Ser. Transp. 2014, 83, 59–64. (In Polish) [Google Scholar]
  6. Sun, Y.-Q.; Wang, B.; Zhang, Y.-T.; Li, Z.-N.; Zhang, G. Study of fault diagnosis of diesel engine fuel injection based on adaptive parallel factor. Acta Armamentarii 2013, 34, 519–526. [Google Scholar]
  7. Konieczny, L.; Adamczyk, B.; Adamczyk, G. Diagnostyka i regeneracja wtryskiwaczy CR. Sci. J. Silesian Univ. Technol. Ser. Transp. 2015, 86, 65–73. (In Polish) [Google Scholar]
  8. Sebok, M.; Ostrica, L.; Gutten, M.; Korenciak, D.; Makyda, M. Diagnostics of ignition systems. J. Electr. Eng. 2013, 13, 181–186. [Google Scholar]
  9. Albarbar, A.; Gu, F.; Ball, A.D. Diesel engine fuel injection monitoring using acoustic measurements and independent component analysis. Measurement 2010, 43, 1376–1386. [Google Scholar] [CrossRef]
  10. Czech, P.; Ba̧kowski, H. Diagnosing of car engine fuel injectors damage using dwt analysis and PNN neural networks. Trans. Probl. 2013, 8, 85–91. [Google Scholar]
  11. Xi, J.; Feng, Z.; Wang, G.; Wang, F. Vibration and noise source identification methods for a diesel engine. J. Mech. Sci. Technol. 2015, 29, 181–189. [Google Scholar] [CrossRef]
  12. Figlus, T. The application of a continuous wavelet transform for diagnosing damage to the timing chain tensioner in a motorcycle engine. J. Vibroeng. 2015, 17, 1266–1294. [Google Scholar]
  13. Jedlinski, L.; Caban, J.; Krzywonos, L.; Wierzbicki, S.; Brumercik, F. Application of vibration signal in the diagnosis of IC engine valve clearance. J. Vibroeng. 2015, 17, 175–187. [Google Scholar]
  14. Zawisza, M. Energy loss and the choice of damper of torsional vibration combustion engines. Solid State Phenom. 2015, 236, 188–195. [Google Scholar] [CrossRef]
  15. Figlus, T.; Wilk, A. Application of a continuous wavelet transform for the diagnosing of excessive valve clearance of the combustion engine. Solid State Phenom. 2015, 236, 153–160. [Google Scholar] [CrossRef]
  16. Figlus, T.; Liščák, Š.; Wilk, A.; Łazarz, B. Condition monitoring of engine timing system by using wavelet packet decomposition of a acoustic signal. J. Mech. Sci. Technol. 2014, 28, 1663–1671. [Google Scholar] [CrossRef]
  17. Górnicka, D. Vibroacoustic symptom of the exhaust valve damage of the internal combustion engine. J. Vibroeng. 2014, 16, 1925–1933. [Google Scholar]
  18. Szymański, G.M.; Tomaszewski, F. Diagnostics of automatic compensators of valve clearance in combustion engine with the use of vibration signal. Mech. Syst. Signal Process. 2016, 68–69, 479–490. [Google Scholar] [CrossRef]
  19. Fabis, P.; Flekiewicz, M.; Madej, H.; Wojnar, G. Influence of piston slap on engine block vibration; SAE Technical Paper 2007-01-2163; SAE International: Warrendale, PA, USA, May 2007. [Google Scholar]
  20. Geng, Z.; Chen, J. Investigation into piston-slap-induced vibration for engine condition simulation and monitoring. J. Sound Vib. 2005, 282, 735–775. [Google Scholar] [CrossRef]
  21. Postrzednik, S.; Przybyla, G.; Zmudka, Z. Main conditions and effectiveness of gas fuel use for powering of dual fuel IC self-ignition engine. Trans. Probl. 2015, 10, 99–111. [Google Scholar]
  22. Flekiewicz, M.; Szymonik, M. Sterowanie paliwa gazowego w układzie “master-slave”. Sci. J. Silesian Univ. Technol. Ser. Transp. 2015, 86, 13–20. (In Polish) [Google Scholar]
  23. Szczurowski, K.; Radkowski, S.; Walczak, D.; Zieliński, L. The effect of addition of LPG and Camelina oil esters on noise and vibration in a dual fuel CI engine. Diagnostyka 2014, 15, 53–57. [Google Scholar]
  24. Uludamar, E.; Tosun, E.; Aydin, K. Experimental and regression analysis of noise and vibration of a compression ignition engine fuelled with various biodiesels. Fuel 2016, 177, 326–333. [Google Scholar] [CrossRef]
  25. Gaurav, V.; Kumar, P.R.; Rashmi, A.A.; Jain, S.; Agarwal, A.K. Experimental investigations of combustion, performance and emission characteristics of a hydrogen enriched natural gas fuelled prototype spark ignition engine. Fuel 2016, 178, 209–217. [Google Scholar]
  26. Nguyen, T.A.; Masato, M. Effect of hydrogen addition to intake air on combustion noise from a diesel engine. Int. J. Hydrog. Energy 2013, 38, 4153–4162. [Google Scholar] [CrossRef]
  27. Ning, D.; Gong, Y. Shocking fault component of abnormal sound signal in the fault engine extract method based on linear superposition method and cross-correlation analysis. Adv. Mech. Eng. 2015, 7, 1–9. [Google Scholar] [CrossRef]
  28. Bi, F.; Li, L.; Zhang, J.; Ma, T. Source identification of gasoline engine noise based on continuous wavelet transform and EEMD-RobustICA. Appl. Acoust. 2015, 100, 34–42. [Google Scholar] [CrossRef]
  29. Zhang, J.; Wang, J.; Lin, J.; Bi, F.; Guo, Q.; Chen, K.; Ma, L. Diesel engine noise source identification based on EEMD, coherent power spectrum analysis and improved AHP. Meas. Sci. Technol. 2015, 26, 095010. [Google Scholar] [CrossRef]
  30. Pan, H.X.; Guo, G.X.; Ren, H.F. Engine fault diagnosis based on EEMD difference energy spectrum. Appl. Mech. Mater. 2014, 598, 210–214. [Google Scholar] [CrossRef]
  31. Dayong, N.; Changle, S.; Yongjun, G.; Zengmeng, Z.; Jiaoyi, H. Extraction of fault component from abnormal sound in diesel engines using acoustic signals. Mech. Syst. Signal Process. 2016, 75, 544–555. [Google Scholar] [CrossRef]
  32. Albarbar, A. An investigation into diesel engine air-borne acoustics using continuous wavelet transform. J. Mech. Sci. Technol. 2013, 27, 2599–2604. [Google Scholar] [CrossRef]
  33. Yao, Z.T.; Pan, H.X. The engine fault diagnosis based on time domain and frequency domain. Adv. Mater. Res. 2014, 936, 2243–2246. [Google Scholar] [CrossRef]
  34. Antoni, J.; Ducleaux, N.; Nghiem, G.; Wang, S. Separation of combustion noise in IC engines under cyclo-non-stationary regime. Mech. Syst. Signal Process. 2013, 38, 223–236. [Google Scholar] [CrossRef]
  35. Li, N.; Yang, J.; Zhou, R.; Liang, C. Determination of knock characteristics in spark ignition engines: An approach based on ensemble empirical mode decomposition. Meas. Sci. Technol. 2016, 27, 045109. [Google Scholar] [CrossRef]
  36. Zhang, P.Z.; Mao, J.G.; Wang, H.Q.; Liang, X.; Wang, S.F.; Wei, T.T. Knock detection and evaluation of kerosene piston engine. Appl. Mech. Mater. 2014, 568–570, 126–130. [Google Scholar] [CrossRef]
  37. Li., W.; Gu, F.; Ball, A.D.; Leung, A.Y.; Phipps, C.E. A study of the noise from diesel engines using the independent component analysis. Mech. Syst. Signal Process. 2001, 15, 1165–1184. [Google Scholar] [CrossRef]
  38. Liu, J.-M.; Li, H.-Y.; Qiao, X.-Y.; Li, X.-L.; Shi, Y.-P. Engine cylinder pressure identification method based on cylinder head vibration signals. Chin. Int. Combust. Engine Eng. 2013, 34, 32–37. [Google Scholar]
  39. Narayan, S. A review of diesel engine acoustics. FME Trans. 2014, 42, 150–154. [Google Scholar] [CrossRef]
  40. Yan, L.Q.; Ge, H.J. Study on the combustion noise characteristic of low speed diesel engine. Adv. Mater. Res. 2014, 945–949, 750–753. [Google Scholar] [CrossRef]
  41. Deuszkiewicz, P.; Pankiewicz, J.; Dziurdź, J.; Zawisza, M. Modeling of powertrain system dynamic behavior with torsional vibration damper. Adv. Mater. Res. 2014, 1036, 586–591. [Google Scholar] [CrossRef]
  42. Yao, Z.T.; Pan, H.X. Engine fault diagnosis based on improved BP neural network with conjugate gradient. Appl. Mech. Mater. 2014, 536–537, 296–299. [Google Scholar] [CrossRef]
  43. Wang, Y.S.; Ma, Q.H.; Zhu, Q.; Liu, X.T.; Zhao, L.H. An intelligent approach for engine fault diagnosis based on Hilbert–Huang transform and support vector machine. Appl. Acoust. 2014, 75, 1–9. [Google Scholar] [CrossRef]
  44. Jia, L.; Naber, J.; Blough, J.; Zekavat, S.A. Accelerometer-based combustion metrics reconstruction with radial basis function neural network for a 9 L diesel engine. J. Eng. Gas Turbines Power 2014, 136, 031507. [Google Scholar] [CrossRef]
  45. Donoho, D.L.; Johnstone, I.M. Ideal de-noising in an orthonormal basis chosen from a library of bases. Comptes Rendus de l’Academie des Sciences 1994, 319, 1317–1322. [Google Scholar]
  46. Donoho, D.L. De-noising by soft-thresholding. IEEE Trans. Inf. Theory 1995, 41, 613–627. [Google Scholar] [CrossRef]
  47. Jedlinski, L. Multi-channel registered data denoising using wavelet transform. Maint. Reliab. 2012, 14, 145–149. [Google Scholar]
  48. Donoho, D.L. Progress in wavelet analysis and WVD: A ten minute tour. In Progress in Wavelet Analysis and Applications; Meyer, Y., Roques, S., Eds.; Editions Frontières: Paris, France, 1993; pp. 109–128. [Google Scholar]
  49. Donoho, D.L.; Johnstone, I.M. Ideal spatial adaptation by wavelet shrinkage. Biometrika 1994, 81, 425–455. [Google Scholar] [CrossRef]
  50. Donoho, D.L.; Johnstone, I.M.; Kerkyacharian, G.; Picard, D. Wavelet shrinkage: Asymptopia. J. R. Stat. Soc. 1995, 57, 301–369. [Google Scholar]
  51. Antoniadis, A.; Oppenheim, G. (Eds.) Wavelets and statistics. In Lecture Notes in Statistics; Springer: New York, NY, USA, 1995; p. 103.
  52. Coifman, R.R.; Wickerhauser, M.V. Entropy-based Algorithms for best basis selection. IEEE Trans. Inf. Theory 1992, 38, 713–718. [Google Scholar] [CrossRef]
  53. An, X.; Yang, J. Denoising of hydropower unit vibration signal based on variational mode decomposition and approximate entropy. Trans. Inst. Meas. Control 2016, 38, 282–292. [Google Scholar] [CrossRef]
  54. Li, Y.-B.; Xu, M.-Q.; Zhao, H.-Y.; Huang, W.-H. A study on rolling bearing fault diagnosis method based on hierarchical fuzzy entropy and ISVM-BT. J. Vib. Eng. 2016, 29, 184–192. [Google Scholar]
Figure 1. The procedure for signal processing: solid line—first denoising level, broken line—second denoising level.
Entropy 18 00253 g001
Figure 2. The phases of valve timing, where: αin: the angle of lead opening of the intake valve; βin: the angle of lag closing of the intake valve; αex: the angle of lead opening of the exhaust valve; βex: the angle of lag closing of the exhaust valve; OWK: the direction of the engine rotation; TDC: Top Dead Centre; BDC: Bottom Dead Centre.
Entropy 18 00253 g002
Figure 3. Measuring system diagram.
Entropy 18 00253 g003
Figure 4. Results of the processing of the acoustic signal of engine I: (a) recorded acoustic signal; (b) denoised signal (1st level) f(t) + n·e(t); (c) differential signal m·e(t); (d) denoised signal (2nd level) si; (e) entropy of the recorded acoustic signal Eraw; (f) entropy of the denoised signal in 2nd level Es.
Entropy 18 00253 g004
Figure 5. Results of the processing of the acoustic signal of engine II: (a) recorded acoustic signal; (b) denoised signal (1st level) f(t) + n·e(t); (c) differential signal m·e(t); (d) denoised signal (2nd level) si; (e) entropy of the recorded acoustic signal Eraw; (f) entropy of the denoised signal in 2nd level Es.
Entropy 18 00253 g005
Table 1. The phases of valve timing tested engines.
Engine Iαinαex41°
βin43°βex
Engine IIαinαex48°
βin44°βex

