
ECG Classification Using Wavelet Packet Entropy and Random Forests


1
School of Economic Information Engineering, Southwestern University of Finance and Economics, 55 Guanghuacun Street, Chengdu 610074, China
2
Institute of Chinese Payment System, Southwestern University of Finance and Economics, 55 Guanghuacun Street, Chengdu 610074, China
3
School of Computer Science, Civil Aviation Flight University of China, Guanghan 618307, China
*
Author to whom correspondence should be addressed.
Entropy 2016, 18(8), 285; https://doi.org/10.3390/e18080285
Submission received: 20 June 2016
/
Revised: 25 July 2016
/
Accepted: 2 August 2016
/
Published: 5 August 2016
(This article belongs to the Special Issue Entropy on Biosignals and Intelligent Systems)
Abstract
:The electrocardiogram (ECG) is one of the most important techniques for heart disease diagnosis. Many traditional methodologies of feature extraction and classification have been widely applied to ECG analysis. However, the effectiveness and efficiency of such methodologies remain to be improved, and much existing research did not consider the separation of training and testing samples from the same set of patients (so called inter-patient scheme). To cope with these issues, in this paper, we propose a method to classify ECG signals using wavelet packet entropy (WPE) and random forests (RF) following the Association for the Advancement of Medical Instrumentation (AAMI) recommendations and the inter-patient scheme. Specifically, we firstly decompose the ECG signals by wavelet packet decomposition (WPD), and then calculate entropy from the decomposed coefficients as representative features, and finally use RF to build an ECG classification model. To the best of our knowledge, it is the first time that WPE and RF are used to classify ECG following the AAMI recommendations and the inter-patient scheme. Extensive experiments are conducted on the publicly available MIT–BIH Arrhythmia database and influence of mother wavelets and level of decomposition for WPD, type of entropy and the number of base learners in RF on the performance are also discussed. The experimental results are superior to those by several state-of-the-art competing methods, showing that WPE and RF is promising for ECG classification.
1. Introduction
The electrocardiogram (ECG) records the tiny electrical activity produced by the heart over a period of time by placing electrodes on a patient’s body, which has become the most widely used non-invasive technique for heart disease diagnoses in the clinics. Due to the high mortality rate of heart diseases, since the last decades, ECG classification has drawn lots of researchers’ attention.
Typically, the classification of ECG signals has four phases: preprocessing, segmentation, feature extraction and classification. The preprocessing phase is mainly aimed at detecting and attenuating frequencies of the ECG signal related to artifacts, which also usually performs signal normalization and enhancement. After preprocessing, segmentation divides the signal into smaller segments, which can better express the electrical activity of the heart [1]. Nowadays, the researchers can get good results from preprocessing and segmentation by some popular techniques or tools [2]. Therefore, most of the literature focuses upon the last two phases.
Feature extraction plays an important role in pattern classification, especially in signal or image classification. Features can be extracted from the raw data or the transformed domain of segmented ECG signals. The simplest method of feature extraction is to extract sampled points at some frequency from an ECG signal curve [3]. However, such a method has two drawbacks: (1) the amount of the extracted features is so huge that the efficiency of classifiers will be affected; and (2) the extracted features usually cannot reflect the intrinsic characters of the signals. Features can also be extracted using morphological and/or statistical methods from the raw signals. For example, the time between the R peaks of two heartbeats, known as the RR interval, is one of the most commonly used features. The authors used four features from the RR interval: the RR interval between the current and its predecessor heartbeats, the RR interval between the current and its successor heartbeats, the average of all the RR intervals among a full record and the average of the several neighbors’ RR intervals of the current heartbeat [1,4]. Independent component analysis (ICA) is another statistical method to extract ECG features. Yu et al. used ICA-based features and the RR interval to compose the feature vector. To get the ICA-based features, the authors randomly selected two sample segments and then whitened and arranged the segments into a data matrix. After that, the independent components (ICs) were calculated from the data matrix, and the original ECG signals were projected onto the bases, and the features were calculated [5]. Later, the authors further proposed a novel IC arrangement strategy to improve the effectiveness and efficiency of ECG classification [6]. Afkhami et al. used morphological and statistical features to train an ECG classifier [7].
Other major feature extraction methods are to extract features from the transformed domain. Discrete cosine transform (DCT), continuous wavelet transform (CWT) and discrete wavelet transform (DWT) are commonly used transform methods. DCT expresses a finite sequence of data points in terms of a sum of cosine functions oscillating at different frequencies, which has the ability to compress signals. Khorrami et al. extracted DCT coefficients as features in ECG classification [8]. In that paper, the authors also applied CWT and DWT to extract features for ECG classification, and compared the classification performance among DCT, CWT and DWT. Owing to its significant effectiveness for extracting discriminative features for ECG classification, wavelets were widely studied by lots of researchers. Song et al. used wavelet transform to extract 17 original input features from preprocessed signals and then reduced these to four by linear discriminant analysis (LDA), and the performance with the reduced features is better than that by principal component analysis (PCA) and even with original features [9]. Yu and Chen used two-level DWT to decompose the signals into components in different sub-bands, and then selected three sets of statistical features of the decomposed signals, alternating current (AC) power and the instantaneous RR interval of the original signals as features [10]. Ye et al. analysed ECG signals using morphological features (extracted by DWT and ICA) and dynamic features (RR), the feature dimensionality of the morphological ones was reduced to 26 by PCA before classification [11]. Since the coefficients of DWT in different levels have different discrimination power, it is significant to select those that can best represent the ECG signals for classification. Daamounche et al. proposed a novel algorithm for generating the wavelet that best represents the ECG beats in terms of discrimination ability using a particle swarm optimization framework [12]. Wavelet packet decomposition (WPD) is an extension version of DWT. Instead of decomposing approximations only in DWT, WPD decomposes both the approximations and details of the signal and hence it keeps the important information in higher-frequency components. WPD has also been applied to ECG classification. For example, the authors applied WPD to classify sleep apnea types [13]. In another piece of literature, the authors proposed a feature extraction method based on wavelet packet of R wave window along with a strategy to select nodes in the packet tree [14].
As for the classifiers of ECG, in theory, any multi-class classifier can be used in ECG classification. In practice, the most commonly used classifiers include support vector machine (SVM) [15], artificial neural network (ANN), K-nearest neighbours (KNN) and decision tree (DT) [2].
SVM is one of the most popular ECG classifiers. [16] used a multiclass SVM with the error output codes to build a ECG classifier based on the features calculated from the wavelet coefficients. Osowski et al. [17] presented a new approach for ECG classification by combining SVM with the features extracted by two preprocessing methods, and the results on recognizing the 13 heart rhythm types showed that the proposed method was reliable and advantageous. Mohammadzadeh et al. used SVM and the generalized discriminant analysis (GDA) feature reduction scheme to classify cardiac arrhythmia from the heart rate variability (HRV) signal [18]. Some variations of SVM have also been applied in ECG classification, such as least square SVM [19,20,21], hierarchical SVM [22], weighted SVM [23] and SVM combined with particle swarm optimization(PSO) [24]. Multi-layer perception (MLP) and probabilistic neural network (PNN) are the most popular ECG classifiers associated with ANN. The authors in [25] used the sequential forward floating search to get a feature subset and then MLP was applied to do the classification. The experimental results showed that the proposed methods exceed some previous work under the same constraints. Luz et al. compared MLP with some other classifiers on different feature sets [1]. Alickovic and Subasi used autoregressive modeling to extract features from the de-noised signals by multiscale PCA [26], and several classifiers including MLP were used to train models. Yu et al. used PNN to build classifiers on the combined features of RR-interval and the features by Wavelet [10] and ICA [5,6], respectively. Wang and Chiang et al. pointed out that the integration of PNN with the proposed PCA and LDA feature reduction can achieve satisfactory results [27]. Some other researchers investigated the performance of fuzzy NN [28] and combined NN [29] on ECG classification [2]. Owing to the simplicity, KNN and DT were also widely applied to ECG classification. Besides the above-mentioned classifiers, some scholars also use Linear Discriminants [4,30,31], Extreme Leaning Machine [32], Optimum-path forest [1], Active Learning [33], and so on to build classification models.
Although so much work exists on ECG classification, it is still necessary to further explore this field. For one reason, the performance needs to be improved for modern diagnosis of heart disease. For another reason, some existing research used samples from the same patients to construct training and testing set (intra-patient scheme), which was not reasonable for practical situations because in a realistic scenario, the training samples should be from some patients and the testing should be from other patients (inter-patient scheme) [2]. In addition, the types of cardiac arrhythmias and evaluation methods in existing research are much different, making it hard for reproducing and comparing the experiments. This can be resolved by introducing the Association for the Advancement of Medical Instrumentation (AAMI) recommendations [34].
Entropies from WPD have been demonstrated to have a powerful ability to represent the intrinsic characteristics of electroencephalogram (EEG) signals [35,36]. As a robust classifier, Random Forests (RF) have been applied in many aspects, e.g., remote sensing [37], microarray data [38] and Alzheimer’s disease [39]. To improve the performance of ECG classification and make the results comparable by other scholars, in this paper, we propose a new method for ECG classification using entropy on WPD and RF following the AAMI recommendations [34] and the inter-patient scheme. The main contributions of this work are four-fold: (1) we built an ECG classification expert system with entropy on the coefficients of WPD as features and RF as a classifier; (2) we followed the AAMI recommendations and the inter-patient scheme, which made the proposed method reproducible and more practical; (3) the experimental results on the publicly accessed the MIT–BIH Arrhythmia dataset [40] show that the proposed method is promising for ECG classification; and (4) types of entropy, mother wavelets of WPD, decomposed levels for WPD and the tree numbers of RF were discussed and the suggestions on these settings were given.
Note that the proposed method is different from the previous work [41,42]. Firstly, we used WPD and entropy instead of DWT coefficients to extract features. Secondly, we adopted inter-patient scheme instead of intra-patient scheme to conduct the experiments. To the best of our knowledge, it is the first time that WPE and RF are used to classify ECG following the AAMI recommendations and the inter-patient scheme.
The remainder of this paper is organized as follows. Section 2 provides the materials and methods used, including the database, WPD, entropy, feature extraction based on WPD and entropy and the classifier RF. Experimental results are reported in Section 3. We discuss the proposed method in Section 4. Finally, Section 5 concludes this paper.
2. Materials and Methods
2.1. Overview
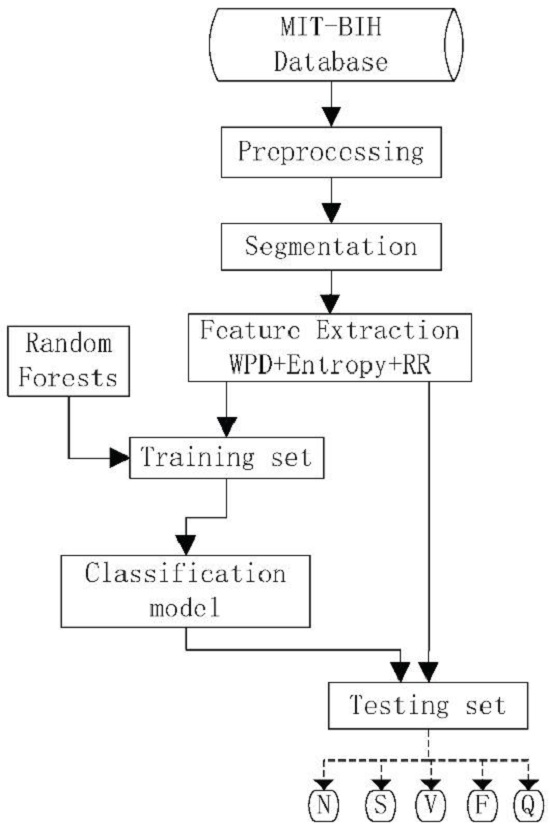
In this study, we used the well-known MIT–BIH Arrhythmia database to evaluate the proposed method. After preprocessing and segmentation, we decomposed the ECG data using WPD and then calculated entropy of each terminal node in the wavelet packet tree as the features. The database was split into a training set and testing set following the AAMI recommendations and the inter-patient scheme. The classification model was built on the training set by RF and finally the performances were evaluated on the testing set by the model. The flowchart of the proposed framework is given in Figure 1. Since this study focuses mainly on feature extraction and classification, we applied simply a 12-tap, low-pass finite impulse response (FIR) filter with 3-dB point at 35 Hz to the data in the preprocessing phase, and we took the 71 points preceding and succeeding the R peak, respectively (143 points, including the R point in total), to compose one segmented sample in the segmentation phase.
2.2. Database and AAMI Recommendations
In this study, the MIT–BIH Arrhythmia database was employed as the data source for the experiments [40], and it is freely available at [43]. The database contains 48, 30-minute recordings, sampled at 360 Hz, from 47 different subjects (25 men aged 32 to 89 and 22 women aged 23 to 89). Eighteen types of heartbeats were labeled in total. The recordings numbered 201 and 202 are from the same subject. Among the recordings, 4 with paced beats are excluded according to AAMI recommendations [34]. The recommendations divide the 18 types of heartbeats into five groups: normal beat (N), supraventricular ectopic beat (S), ventricular ectopic beat (V), fusion of a V and an N (F), and unknown beat type (Q), as shown in details in Table 1. The AAMI recommendations also define the evaluation measures for ECG classification that will be discussed in Section 3.2. However, the separation of the training set and the testing set was not defined by the recommendations. It was demonstrated in [44] that the use of heartbeat samples from the same patient for both training and setting results in biases for the evaluation process. In such a scheme (intra-patient scheme), many models can achieve the accuracy of classification close to 100% in testing because the particularities of the patient’s heartbeat are learned in the training phase [2]. To avoid this from happening in this work, following the work in [44], we adopted the inter-patient scheme to divide the recordings into the training set (DS1) and the testing set (DS2) and each has 22 recordings, as shown in Table 2. The amount of each heartbeat type in each set can be seen in Table 3.
2.3. Feature Extraction
In machine learning, signal processing and pattern recognition, feature extraction is one of the crucial steps and is aimed at extracting informative and non-redundant values (features) from raw signals. The extracted features facilitate the subsequent learning and generalization steps, and, in some cases, lead to better human interpretations. This step is also related to dimensionality reduction. The features are expected to contain the relevant information from the input data, so that the desired task can be performed by using this reduced representation instead of the complete initial data [45,46].
2.3.1. Wavelet Packet Decomposition
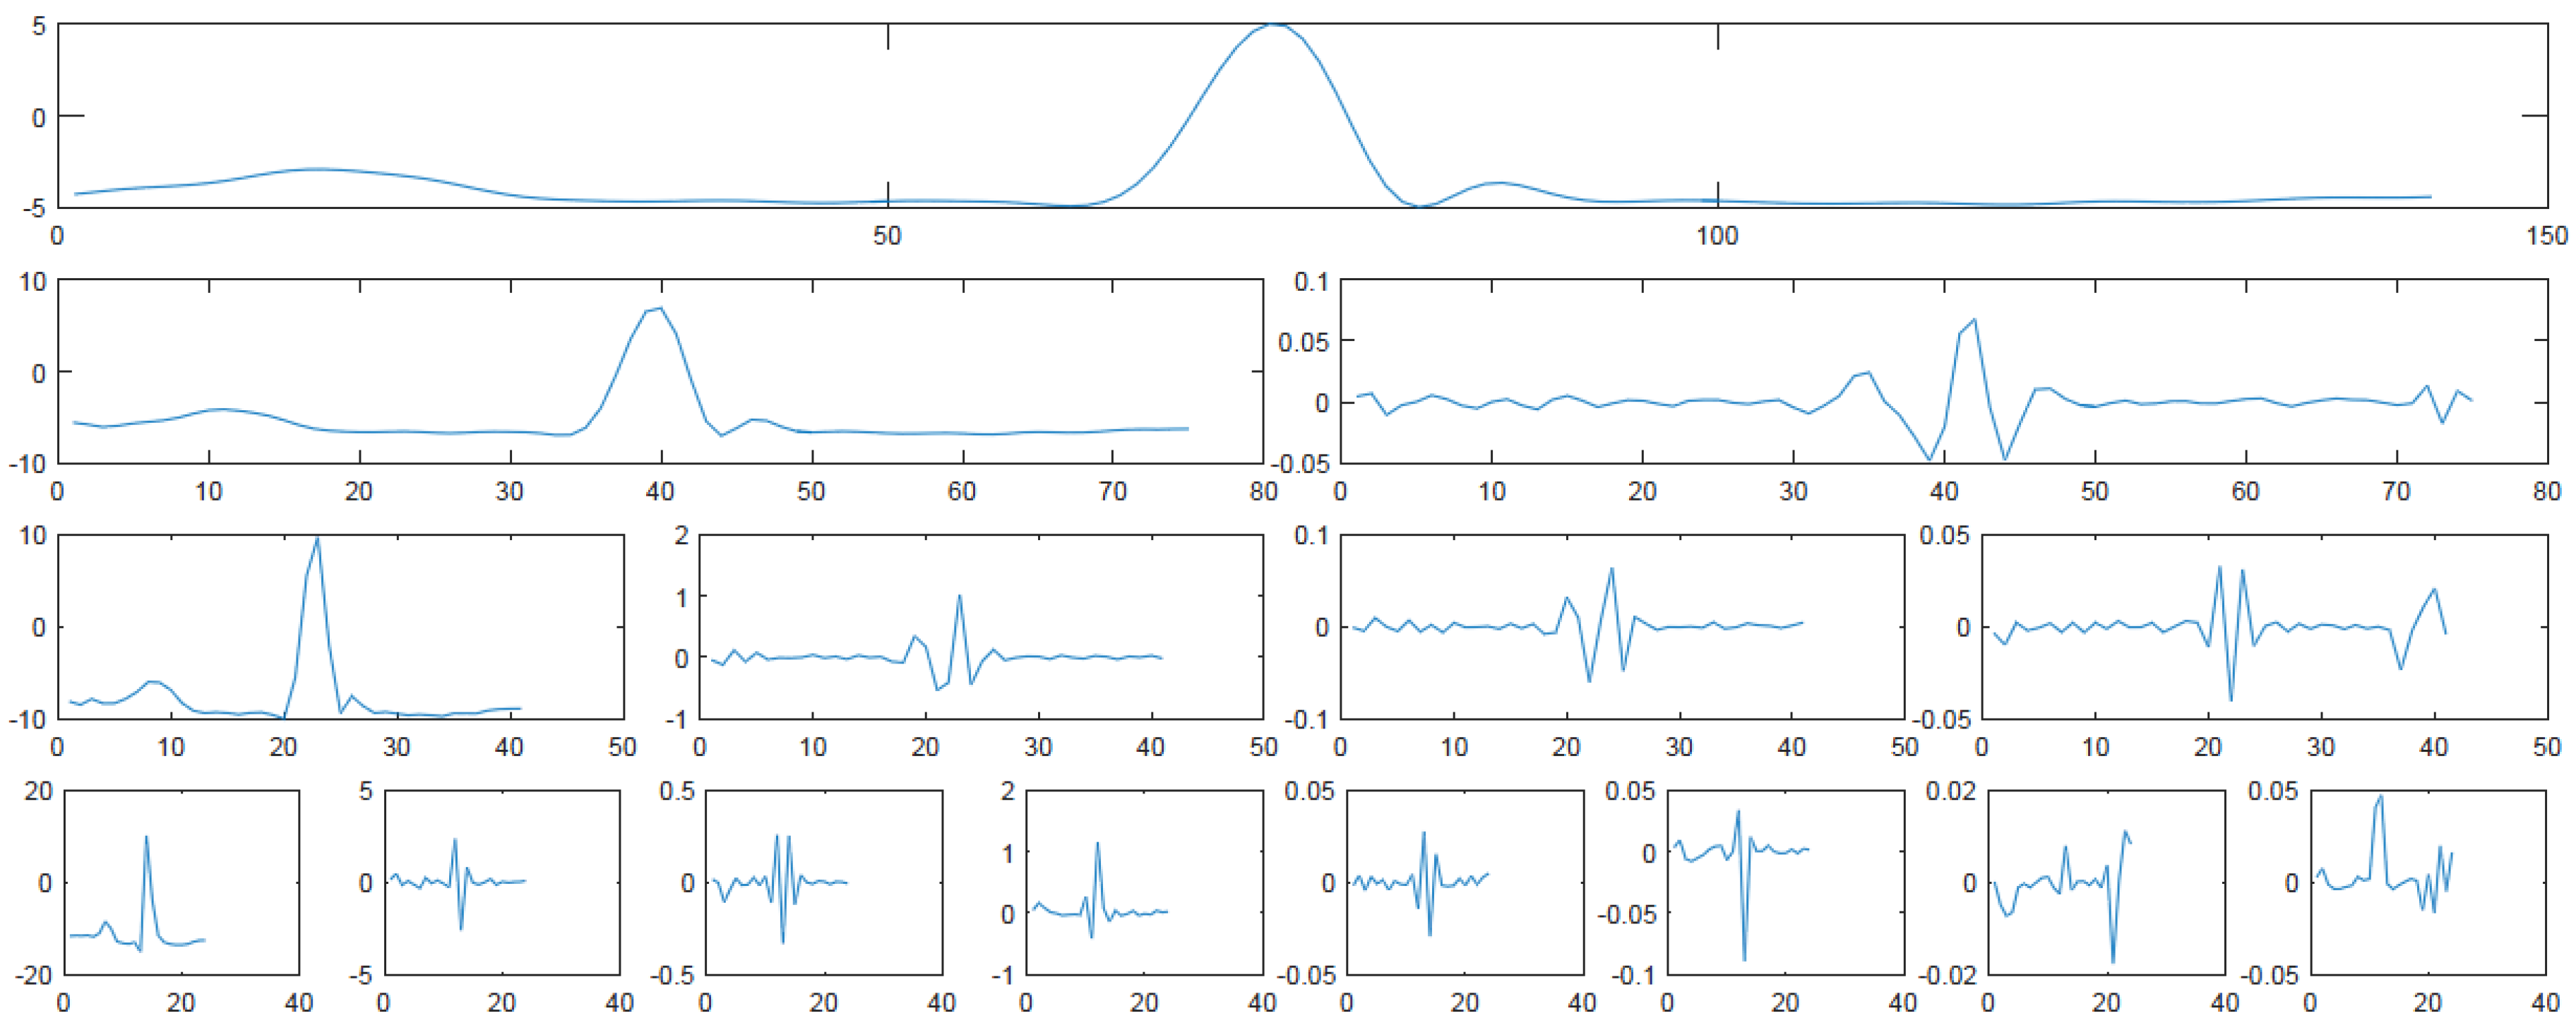
DWT is one of the popular methods in the wavelet transformation family which is a more powerful time-frequency-transformation than the traditional ones such as discrete cosine transform (DCT) and discrete Fourier transform (DFT). DWT is a linear operator that decomposes the initial signal into two components: detail coefficients (DCs, which capture the high frequency, low scale information in the original signal) and approximation coefficients (ACs, which are the low frequency, high scale information of the original signal), and then the DCs remain unchanged while the ACs are decomposed into new DCs and ACs. This process repeats until the decomposition level reaches. DWT has been widely used in ECG signal processing, especially in denoising, compression and classification. For classification, DWT is usually used for extracting features. Owing to its great time and frequency localization ability, DWT can reveal the local characteristics of the input ECG signal. In addition, the multi-level decomposition of an ECG signal into different scales by DWT generates multi-scale features, each of which represents particular characteristics of the signal. Since DWT decomposes ACs only in each level, it is hard to extract distinctive information from DCs. The WPD is an extension of DWT, and the main difference between WPD and DWT is that the former decomposes not only the DCs but also the ACs simultaneously. Therefore, the WPD has the same frequency bandwidths in each resolution while DWT does not. This property makes WPD not increase and lose information compared to original signals, resulting in the features from WPD having more discrimination power than those from DWT. A three-level WPD tree for a normal heartbeat is shown in Figure 2. From this figure, we can see that the tree is a typical binary tree, where each node has DCs (right sub-node) and ACs (left sub-node). Therefore, features can be extracted from both DCs and ACs at different levels to obtain more information.
Mathematically, for the original signal , the WPD can be recursively defined as Equation (1).
where and are high-pass and low-pass filter respectively, and is the reconstruction signals (coefficients) of WPD at the i-th level for the j-th node.
2.3.2. Wavelet Packet Entropy
Although the coefficients by DWT or WPD can reveal the local characteristics of an ECG signal, the number of such coefficients is usually so huge that it is hard to use them as features for classification directly. Therefore, some high-level features may derive from these coefficients for better classification. Entropy is a tool to measure the uncertainty of the information content in given systems, and it is widely applied in signal processing, information theory, pattern recognition, and so on. Shannon entropy (SE), log energy entropy (LEE), Renyi Entropy (RE) and Tsallis entropy (TE) are some of the typical types of entropy. In this paper, entropy is used to extract features from the WPT. Entropy can be computed based on energy.
The information of the k-th coefficient of the j-th node at i-th level can be measured by wavelet energy which is defined as Equation (2):
Then, the total energy for the j-th node at i-th level can be calculated by Equation (3):
where N is the number of the corresponding coefficients in the node. The probability of the k-th coefficient at its corresponding node can be calculated by Equation (4):
where the sum of equals 1.
SE is a measure of uncertainty associated with random variables in information theory, and it can be calculated as Equation (5) based on the probability distribution of energy [47]:
Similarly, LEE is defined as Equation (6):
2.3.3. The Procedure of Feature Extraction
Given the ECG signals, the features based on WPE are obtained by performing the following steps:
- (a)
- Select a mother wavelet function W and the decomposition level L;
- (b)
- Decompose the original signals according to the specified W and L;
- (c)
- Calculate the energy of each coefficient in each node in the last level L (terminal node);
- (d)
- Calculate the energy probability distribution of each coefficient in each terminal node;
- (e)
- Calculate entropy of each terminal node;
- (f)
- Concatenate entropies of all terminal nodes to compose a feature vector.
In practical application, some other important features may be added to the feature vector for better classification results. In this study, two RR-intervals (the interval between the current R peak and its predecessor R peak (RR-predecessor), and the interval between the current R peak and successor one) are appended to the feature vector.
2.4. Random Forests
Random forests (RF), first proposed by Breiman [50], is one of the excellent ensemble machine learning techniques widely used in classification. The main idea of RF is to build many classification trees based on some randomly selected features from randomly selected samples with bagging strategy and then to use the trees to vote for a given input vector to get a class label. RF is constructed by many base learners and each base learner is an independent binary tree adopting recursive partitioning. To build a binary tree, a bootstrap sample with N objects is firstly drawn from the training data (the left objects in the training data are called out-of-bag objects), and then the tree fits to the bootstrap samples by recursively selecting feature subset and splitting each terminal node into two child nodes with the best selected feature. The Gini index is used to decide which feature is the best. The built tree was validated by the out-of-bag objects. RF has many advantages as follows:
- (a)
- It achieves higher accuracy than other state-of-the-art methods;
- (b)
- It is efficient on large scale data;
- (c)
- It does not overfit;
- (d)
- It can handle both numeric and categorical variables;
- (e)
- It can be applied in classification, regression and clustering;
- (f)
- It can be easily applied in multi-class problems;
- (g)
- It has methods for balancing error in class population unbalanced data sets;
- (h)
- It has less parameters than some other state-of-the-art classifiers;
- (i)
- Normalization of variables is not necessary.
RF has shown its superior performance in classification since it was proposed. The number of base learners is usually the only setting parameter.
3. Experiments and Results
3.1. Experimental Settings
In order to evaluate the performance of the proposed work, we compared it with some state-of-the-art methods of feature extraction and classification. The competing methods of feature extraction include statistical features, ICA and DWT, while the competing classifiers include KNN, DT, PNN and SVM. All of the experiments were conducted by Matlab 8.6 (Mathworks, Natick, MA, USA) on a 64-bit Windows 7 (Microsoft, Redmond, WA, USA) with 32 GB memory and 3.4 GHz I7 CPU. For NB, DT and PNN, we used the default parameters in Matlab toolbox. We used k = 5 for KNN. As for SVM, we used 10-fold cross validation and grid-search to optimize the parameter γ in radial basis function (RBF) kernel and the penalty factor C in SVM in the training data set with the LIBSVM 3.21 software package [51], which is available at [52].
To demonstrate the performance of the proposed work, we performed the experiments following the AAMI recommendations and the inter-patient scheme. We adopted six-level bd4 wavelet packet decomposition and SE to extract features, and 400 sub-trees in RF for the comparison. Here, we chose SE to extract features because of its simple form, characteristic of no parameters as well as extensive applications in signal processing. These parameters will be discussed in detail in Section 4.
Although normalization is not necessary for RF, to set up the stage for a fair comparison, we applied the Min-Max Normalization (as shown in Equation (9)) for the data input to all classifiers:
where and are the minimal and maximal values for one variable, respectively, and x is the normalized and the original value respectively. It is clear that the normalization maps the original values to the range of .
3.2. Performance Measures
To evaluate the performance of the classification, four standard statistical indices of sensitivity (SE, a.k.a. recall), positive predictivity (+P, a.k.a. precision), false positive rate (FPR) and accuracy (ACC) derived from true positive (TP), false negative (FN), true negative (TN) and false positive (FP) were used following the AAMI recommendations. In the ECG classification, TP and FN stand for the number of heartbeats of a given class correctly and incorrectly classified, respectively, while TN stands for the number of the heartbeats not belonging to a given class classified as not belonging to the considered class, and FP stands for the number of the heartbeats incorrectly classified as belonging to a given class [1].
SE is defined as the proportion of correctly classified beats of one class and the total beats classified as that class, including the missed classification beats:
+P is defined as the ratio of correctly classified beats of one class among the total beats belonging to that class:
For a given class, FPR can be defined as the ratio of incorrectly classified beats in that class to the total beats that not classified as that class:
ACC can be defined as the percentage of total beats correctly classified over the number of total beats:
The four evaluating measures were recommended by the AAMI. The five classes of heartbeat types are very imbalanced in the MIT–BIH Arrhythmia database and the ACC could be strongly distorted by the majority class (type N). Therefore, the first three measures are also widely used for performance evaluation of ECG classification. An ideal ECG classifier should achieve high SE, high +P, high ACC as well as low FPR.
3.3. Experimental Results
Firstly, we compared the proposed method with some previous work and the results are shown in Table 4. It can be seen from this table that the proposed method achieves the highest ACC of 94.61%, followed by Song’s 94.22% and Ye’s 92.17%, while Yu’s method (ICA + RR and PNN) achieves the lowest ACC of 88.87%. All of the methods have good discrimination power on N and V. The proposed method can recognize only some of S and F, while the methods with SVM do not recognize anyone. Regarding Q, all methods cannot recognize any one correctly because it has only seven out of 49,690 samples in DS2. In practical diagnosis, low FPR in the N class and high SE in all other classes are required. The proposed method achieves the lowest FPR of 3.92% for N among all methods, and it achieves the highest SE in N, S and F at the same time. It is worth noting that, although the methods with SVM achieve similar but still slightly lower ACCs when compared with the proposed method, they totally fail on classifying S, F and Q because SVM tends to misclassify a new unknown sample to the classes with many samples, N and V, in this experiment. In other words, SVM labels each heart beat either N or V, and none of the heart beats from S, F, Q are classified correctly. The FPR of N by Song’s is 13.66%, which shows that Song’s method tends to classify non-N heart beats as N ones. This is highly risky for heart-disease diagnosis. Yu’s method has a worse result in terms of FPR of N. The results show that the proposed method outperforms the compared methods.
Secondly, to further validate the performance of feature extraction of the proposed method, we compared RF with several classical classifiers using the fixed features of WPE and RR. The results are illustrated in Table 5. Once again, RF achieves the highest ACC (94.61%), the highest SEs on V and F (94.67% and 94.20%, respectively). It also achieves the lowest FPR (0.71%), the second-lowest FPR (3.92%) on V and N, respectively. Note that, although the ACCs of KNN and DT are not very high, they both recognized some samples correctly in F and Q, which is hard for the other classifier, especially for PNN and SVM. The WPE + RR also improves the performance of PNN, especially in terms of ACC and FPR of the class N. The latter significantly decreases from 92.55% to 8.73%. This experiment demonstrates that the extracted features are discriminative for ECG classification, and RF is the best classifier when compared with the competing ones.
Finally, Table 6 shows the results obtained by RF with different features. Here, WPD refers to using the coefficients of wavelet packet decomposition as the input features directly. RR-intervals have been proven to be very discriminative for ECG classification. We use three combinations related to WPD (i.e., WPE, WPE + RR and WPD + RR) to validate the performance of RF. With the features, RF achieves high ACCs, ranging from 91.95% to 94.61%, which improves the performance of Yu and Ye. Except for Yu not being able to recognize any samples in F, all of the remaining methods can recognize some samples in N, S, F and V, which shows that RF improves the recognition power. Note that RF also significantly improves the FPR of N. Although WPD + RR and WPE have significant discrimination power, the power of these two types of features are not as good as that of WPE + RR. The experimental results confirm that RR can improve the classification performance, as shown in [1]. The results also showed that RF is a promising classifier for ECG classification and the features by WPE + RR have the most discrimination power when compared with the other features.
All of the above experiments were conducted on the MIT–BIH database with well-known feature extraction methods and classifiers following the AAMI recommendation and the inter-patient scheme. It can be seen from the experimental results that the proposed method is superior to the competing ones, not only in feature extraction but also in classification.
4. Discussion
With the advantages of WPE and RF, we have some important issues warranting further investigation including how to choose the mother wavelet and the decomposition level for WPD, and the influence of the type of entropy and that of the number of base learners in RF. Moreover, we evaluated the efficiency of the proposed method.
To choose the best mother wavelet and the best decomposition level for WPD, we conducted experiments on six Daubechies wavelets (db1 (haar), db2, db4, db6, db8 and db10), three Coiflets wavelets (coif1, coif3 and coif5), one discrete Meyer wavelet (dmey) as well as four Biorthogonal wavelets (bior1.1, bior2.4, bior4.4 and bior6.8) with the decomposition levels ranging from 2 to 8 with an interval of 2. Here, we use Shannon entropy to extract features and 400 base learners in RF. We report the representative results in each wavelet family in Table 7. The db4 from Daubechies wavelets family with six-level decomposition achieves the top ACC of 94.61%, slightly better than that of eight-level coif1 and six-level bioer4.4 decomposition. On average, the wavelets from the Daubechies family are the best ones for ECG classification. As far as decomposition level is concerned, a very small level can not express the signal well, while a very large one results in high-dimensional data along with many coefficients close to zero. For all the mother wavelets, the decomposition level 6 usually achieves satisfactory results.
The type of entropy is another issue in the proposed method. We adopt SE, LEE, RE as well as TE to extract features from WPT. We use real values ranging from 0.1 to 5.1 with an interval of 0.2 as the parameter q for both RE and TE. A few typical results are shown in Table 8. For simplicity, Table 8 does not include the results that are very close to their neighboring ones in terms of q. The results of LEE are slightly worse than those of others. When q varies from 0.1 to 5.1, the performance of RE is relatively stable, with ACC varying in a narrow range of 94.28%–94.70%, indicating that RE is not sensitive to the parameter q. The performance of TE is similar to RE with a wider range in terms of ACC. The ACC of TE reaches a minimum value of 93.8% and a maximum value of 94.64% for , , respectively. For RE and TE, the experimental results also vary slightly with q in terms of SE, +P and FPR, except SE on S and F.
The number of base learners (subtrees) is also discussed here. Fixing SE and six-level db4 decomposition, we used several different numbers of base learners to validate the performance of RF. The results are shown in Table 9. When such a number is small, e.g., 10, the performance is low. The performance increases with the increasing number to some extent. However, when the number reaches some value, e.g., 400, the performance reaches the peak. If the number continues to increase, the performance does not improve any more. We can see from Table 9 that 400 is a good choice for the proposed methods.
We also analysed the efficiency in terms of the training and testing times with the WPE + RR features and different classifiers. For RF, we used 20, 100 and 400 as the numbers of base learners, respectively. For SVM, the time of optimizing the parameters was excluded. The results are shown in Table 10. Since RF builds many trees in training and also votes for samples by these trees in testing, it takes more time than DT and KNN. The training and testing times increase linearly with the number of base learners. As a lazy classifier, KNN consumes the least time in training, followed by PNN and DT. The training time of PNN is only a little larger than the time to read data owing to its “one-step” training attribute. For DT, since it only needs to build a single tree, the training time is also small. The testing time of RF, DT and SVM is far less than their training time. However, for KNN and PNN, the testing time is almost 50 times and 130 times greater than the training time, respectively. In practice, the testing time plays a more important role than the training time because the training phase is usually completed with off-line data. Therefore, the time consumed by RF is acceptable.
In this approach, we calculated the entropy from the coefficients of the sixth level nodes by WPD to extract features, and the total dimension of the features is 66 including the two RR-intervals. The dimension is relatively large when compared to many existing research. We may apply PCA or best basis selection to reduce the dimension and to improve performance in future work. Since DS1 and DS2 have only eight and seven samples of class Q, respectively, showing the amounts of such classes is not representative, and none of the mentioned models can classify the samples in Q correctly, class Q should be excluded or be fused into another class in further research.
5. Conclusions
This work focused on the feature extraction and classification in ECG signal analysis. In the phase of feature extraction, we used the entropy from the coefficients of the terminal nodes by WPD (such entropy is called WPE) and two RR intervals as features, while in the classification phase, we utilized RF as a classifier. All of the analyses are conducted on the publicly available MIT–BIH database following the AAMI recommendation and the inter-patient scheme, making it easy to reproduce and compare the experiments. To the best of our knowledge, it is the first time that WPE and RF are applied to ECG classification following the AAMI recommendation and the inter-patient scheme. From the extensive experimental results, it can be concluded that: (1) the discrimination ability of WPE + RR is more powerful than that of ICA + RR, DWT + RR or WPD + RR for feature extraction of ECG signal; (2) RF is a stronger classifier than some state-of-the-art classifiers, such as KNN, DT, PNN and SVM for ECG classification; and (3) the combination of WPE + RR and RF significantly improves the ability of ECG classification with great effectiveness and comparable efficiency, indicating that the proposed method is promising for ECG classification.
In the future, the work could be extended in two aspects: (1) studying feature selection for the WPT to reduce dimension and/or to further improve the discrimination power of WPE; and (2) applying the proposed method to other biosignals, such as electromyogram (EMG) and EEG.
Acknowledgments
This work was supported in part by the Major Research Plan of the National Natural Science Foundation of China (Grant No. 91218301), the Humanities and Social Sciences Foundation of the Ministry of Education in China (Grant No. 11YJCZH084), the Fundamental Research Funds for the Central Universities (Grant No. JBK140125 and No. JBK130503) and the Natural Science Foundation of China (Grant No. 71473201).
Author Contributions
Taiyong Li and Min Zhou conceived and designed the experiments; Taiyong Li performed the experiments and analyzed the data; Taiyong Li wrote the paper and Min Zhou revised the paper. Both authors have read and approved the final manuscript.
Conflicts of Interest
The authors declare no conflict of interest.
References
- Luz, E.J.S.; Nunes, T.M.; de Albuquerque, V.H.C.; Papa, J.P.; Menotti, D. ECG arrhythmia classification based on optimum-path forest. Expert Syst. Appl. 2013, 40, 3561–3573. [Google Scholar] [CrossRef]
- Luz, E.J.S.; Schwartz, W.R.; Cámara-Chávez, G.; Menotti, D. ECG-based heartbeat classification for arrhythmia detection: A survey. Comput. Methods Programs Biomed. 2016, 127, 144–164. [Google Scholar] [CrossRef] [PubMed]
- Wen, C.; Lin, T.C.; Chang, K.C.; Huang, C.H. Classification of ECG complexes using self-organizing CMAC. Measurement 2009, 42, 399–407. [Google Scholar] [CrossRef]
- De Chazal, P.; Dwyer, M.O.; Reilly, R.B. Automatic classification of heartbeats using ECG morphology and heartbeat interval features. IEEE Trans. Biomed. Eng. 2004, 51, 1196–1206. [Google Scholar] [CrossRef] [PubMed]
- Yu, S.N.; Chou, K.T. Integration of independent component analysis and neural networks for ECG beat classification. Expert Syst. Appl. 2008, 34, 2841–2846. [Google Scholar] [CrossRef]
- Yu, S.N.; Chou, K.T. Selection of significant independent components for ECG beat classification. Expert Syst. Appl. 2009, 36, 2088–2096. [Google Scholar] [CrossRef]
- Afkhami, R.G.; Azarnia, G.; Tinati, M.A. Cardiac arrhythmia classification using statistical and mixture modeling features of ECG signals. Pattern Recognit. Lett. 2016, 70, 45–51. [Google Scholar] [CrossRef]
- Khorrami, H.; Moavenian, M. A comparative study of DWT, CWT and DCT transformations in ECG arrhythmias classification. Expert Syst. Appl. 2010, 37, 5751–5757. [Google Scholar] [CrossRef]
- Song, M.H.; Lee, J.; Cho, S.P.; Lee, K.J.; Yoo, S.K. Support vector machine based arrhythmia classification using reduced features. Int. J. Control. Autom. Syst. 2005, 3, 571–579. [Google Scholar]
- Yu, S.N.; Chen, Y.H. Electrocardiogram beat classification based on wavelet transformation and probabilistic neural network. Pattern Recognit. Lett. 2007, 28, 1142–1150. [Google Scholar] [CrossRef]
- Ye, C.; Coimbra, M.T.; Kumar, B. Arrhythmia detection and classification using morphological and dynamic features of ECG signals. In Proceedings of the Annual International Conference of the IEEE Engineering in Medicine and Biology Society, Buenos Aires, Argentina, 1 August–4 September 2010; pp. 1918–1921.
- Daamouche, A.; Hamami, L.; Alajlan, N.; Melgani, F. A wavelet optimization approach for ECG signal classification. Biomed. Signal Process. Control 2012, 7, 342–349. [Google Scholar] [CrossRef]
- Gubbi, J.; Khandoker, A.; Palaniswami, M. Classification of sleep apnea types using wavelet packet analysis of short-term ECG signals. J. Clin. Monit. Comput. 2012, 26, 1–11. [Google Scholar] [CrossRef] [PubMed]
- Huptych, M.; Lhotská, L. Proposal of feature extraction from wavelet packets decomposition of QRS complex for normal and ventricular ECG beats classification. In Proceedings of the 4th European Conference of the International Federation for Medical and Biological Engineering, Antwerp, Belgium, 23–27 November 2008; Springer: Berlin/Heidelberg, Germany, 2009; pp. 402–405. [Google Scholar]
- Vapnik, V.N. Statistical Learning Theory; Wiley: New York, NY, USA, 1998; Volume 1. [Google Scholar]
- Übeyli, E.D. ECG beats classification using multiclass support vector machines with error correcting output codes. Digital Signal Process. 2007, 17, 675–684. [Google Scholar] [CrossRef]
- Osowski, S.; Hoai, L.T.; Markiewicz, T. Support vector machine-based expert system for reliable heartbeat recognition. IEEE Trans. Biomed. Eng. 2004, 51, 582–589. [Google Scholar] [CrossRef] [PubMed]
- Asl, B.M.; Setarehdan, S.K.; Mohebbi, M. Support vector machine-based arrhythmia classification using reduced features of heart rate variability signal. Artif. Intell. Med. 2008, 44, 51–64. [Google Scholar] [CrossRef] [PubMed]
- Acır, N. Classification of ECG beats by using a fast least square support vector machines with a dynamic programming feature selection algorithm. Neural Comput. Appl. 2005, 14, 299–309. [Google Scholar] [CrossRef]
- Polat, K.; Güneş, S. Detection of ECG Arrhythmia using a differential expert system approach based on principal component analysis and least square support vector machine. Appl. Math. Comput. 2007, 186, 898–906. [Google Scholar] [CrossRef]
- Polat, K.; Akdemir, B.; Güneş, S. Computer aided diagnosis of ECG data on the least square support vector machine. Digital Signal Process. 2008, 18, 25–32. [Google Scholar] [CrossRef]
- Park, K.; Cho, B.; Lee, D.; Song, S.; Lee, J.; Chee, Y.; Kim, I.; Kim, S. Hierarchical support vector machine based heartbeat classification using higher order statistics and hermite basis function. In Proceedings of the Computers in Cardiology, Bologna, Italy, 14–17 September 2008; pp. 229–232.
- de Lannoy, G.; François, D.; Delbeke, J.; Verleysen, M. Weighted SVMs and feature relevance assessment in supervised heart beat classification. In Biomedical Engineering Systems and Technologies; Springer: Berlin/Heidelberg, Germany, 2010; pp. 212–223. [Google Scholar]
- Khazaee, A. Heart beat classification using particle swarm optimization. Int. J. Intell. Syst. Appl. 2013, 5, 25–33. [Google Scholar] [CrossRef]
- Mar, T.; Zaunseder, S.; Martínez, J.P.; Llamedo, M.; Poll, R. Optimization of ECG classification by means of feature selection. IEEE Trans. Biomed. Eng. 2011, 58, 2168–2177. [Google Scholar] [CrossRef] [PubMed]
- Alickovic, E.; Subasi, A. Effect of multiscale PCA de-noising in ECG beat classification for diagnosis of cardiovascular diseases. Circuits Syst. Signal Process. 2015, 34, 513–533. [Google Scholar] [CrossRef]
- Wang, J.S.; Chiang, W.C.; Hsu, Y.L.; Yang, Y.T.C. ECG arrhythmia classification using a probabilistic neural network with a feature reduction method. Neurocomputing 2013, 116, 38–45. [Google Scholar] [CrossRef]
- Osowski, S.; Linh, T.H. ECG beat recognition using fuzzy hybrid neural network. IEEE Trans. Biomed. Eng. 2001, 48, 1265–1271. [Google Scholar] [CrossRef] [PubMed]
- Güler, İ.; Übeylı, E.D. ECG beat classifier designed by combined neural network model. Pattern Recognit. 2005, 38, 199–208. [Google Scholar] [CrossRef]
- Willems, J.L.; Lesaffre, E. Comparison of multigroup logistic and linear discriminant ECG and VCG classification. J. Electrocardiol. 1987, 20, 83–92. [Google Scholar] [CrossRef]
- Yeh, Y.C.; Wang, W.J.; Chiou, C.W. Cardiac arrhythmia diagnosis method using linear discriminant analysis on ECG signals. Measurement 2009, 42, 778–789. [Google Scholar] [CrossRef]
- Kim, J.; Shin, H.S.; Shin, K.; Lee, M. Robust algorithm for arrhythmia classification in ECG using extreme learning machine. Biomed. Eng. Online 2009, 8, 31. [Google Scholar] [CrossRef] [PubMed]
- Al Rahhal, M.; Bazi, Y.; AlHichri, H.; Alajlan, N.; Melgani, F.; Yager, R. Deep learning approach for active classification of electrocardiogram signals. Inf. Sci. 2016, 345, 340–354. [Google Scholar] [CrossRef]
- Testing and Reporting Performance Results of Cardiac Rhythm and ST Segment Measurement Algorithms; Association for the Advancement of Medical Instrumentation: Arlington, VA, USA, 1998.
- Ting, W.; Guo-zheng, Y.; Bang-hua, Y.; Hong, S. EEG feature extraction based on wavelet packet decomposition for brain computer interface. Measurement 2008, 41, 618–625. [Google Scholar] [CrossRef]
- Wang, D.; Miao, D.; Xie, C. Best basis-based wavelet packet entropy feature extraction and hierarchical EEG classification for epileptic detection. Expert Syst. Appl. 2011, 38, 14314–14320. [Google Scholar] [CrossRef]
- Pal, M. Random forest classifier for remote sensing classification. Int. J. Remote Sens. 2005, 26, 217–222. [Google Scholar] [CrossRef]
- Díaz-Uriarte, R.; de Andres, S.A. Gene selection and classification of microarray data using random forest. BMC Bioinf. 2006, 7, 3. [Google Scholar] [CrossRef] [PubMed]
- Gray, K.R.; Aljabar, P.; Heckemann, R.A.; Hammers, A.; Rueckert, D. Random forest-based similarity measures for multi-modal classification of Alzheimer’s disease. Neuroimage 2013, 65, 167–175. [Google Scholar] [CrossRef] [PubMed]
- Moody, G.B.; Mark, R.G. The impact of the MIT-BIH arrhythmia database. IEEE Eng. Med. Biol. Mag. 2001, 20, 45–50. [Google Scholar] [CrossRef] [PubMed]
- Emanet, N. ECG beat classification by using discrete wavelet transform and Random Forest algorithm. In Proceedings of the Fifth International Conference on Computing, Computing with Words and Perceptions in System Analysis, Decision and Control (ICSCCW), Famagusta, Cyprus, 2–4 September 2009; pp. 1–4.
- Alickovic, E.; Subasi, A. Medical decision support system for diagnosis of heart arrhythmia using dwt and random forests classifier. J. Med. Syst. 2016, 40, 1–12. [Google Scholar] [CrossRef] [PubMed]
- PhysioBank. Available online: www.physionet.org/physiobank/ (accessed on 3 August 2016).
- De Chazal, P.; Dwyer, M.O.; Reilly, R.B. Automatic classification of heartbeats using ECG morphology and heartbeat interval features. IEEE Trans. Biomed. Eng. 2004, 51, 1196–1206. [Google Scholar] [CrossRef] [PubMed]
- Guyon, I.; Elisseeff, A. An introduction to feature extraction. In Feature Extraction; Springer: Berlin/Heidelberg, Germany, 2006; pp. 1–25. [Google Scholar]
- Guyon, I.; Gunn, S.; Nikravesh, M.; Zadeh, L.A. Feature Extraction, Foundations and Applications; Springer: Berlin/Heidelberg, Germany, 2006; Volume 207. [Google Scholar]
- Shannon, C.E. A mathematical theory of communication. Available online: http://worrydream.com/refs/Shannon - A Mathematical Theory of Communication.pdf (accessed on 3 August 2016).
- Rényi, A. On Measures of Entropy and Information. In Proceedings of the 4th Berkeley Symposium on Mathematical Statistics and Probability, Berkeley, CA, USA, 20 June–30 July 1960; University of California Press: Oakland, CA, USA, 1961; pp. 547–561. [Google Scholar]
- Tsallis, C. Nonadditive entropy: The concept and its use. Eur. Phys. J. A 2009, 40, 257–266. [Google Scholar] [CrossRef]
- Breiman, L. Random forests. Mach. Learn. 2001, 45, 5–32. [Google Scholar] [CrossRef]
- Chang, C.C.; Lin, C.J. LIBSVM: A library for support vector machines. ACM Trans. Intell. Syst. Technol. 2011, 2, 27. [Google Scholar] [CrossRef]
- LIBSVM. Available online: https://www.csie.ntu.edu.tw/~cjlin/libsvm/ (accessed on 3 August 2016).
Figure 1.
Flowchart for the proposed method.

Figure 2.
Wavelet packet decomposition (WPD) tree for a normal heartbeat with three-level wavelet packet decomposition.
Figure 2.
Wavelet packet decomposition (WPD) tree for a normal heartbeat with three-level wavelet packet decomposition.


| Group Symbol | Group Description | Original Symbol | Original Description |
|---|---|---|---|
| N | Any heartbeat not categorized as SVEB, VEB or Q | L | Left bundle branch block beat |
| N | Normal beat | ||
| R | Right bundle branch block beat | ||
| e | Atrial escape beat | ||
| j | Nodal (junctional) escape beat | ||
| S | Supraventricular ectopic beat (SVEB) | A | Atrial premature beat |
| J | Nodal (junctional) premature beat | ||
| S | Supraventricular premature beat | ||
| a | Aberrated atrial premature beat | ||
| V | Ventricular ectopic beat (VEB) | E | Ventricular escape beat |
| V | Premature ventricular contraction | ||
| F | Fusion beat | F | Fusion of ventricular and normal beat |
| Q | Unknown beat | P | Paced beat |
| U | Unclassifiable beat | ||
| f | Fusion of paced and normal beat |
| Dataset Name | Recording No. |
|---|---|
| DS1 | 101 106 108 109 112 114 115 116 118 119 122 124 201 203 205 207 208 209 215 220 223 230 |
| DS2 | 100 103 105 111 113 117 121 123 200 202 210 212 213 214 219 221 222 228 231 232 233 234 |
| Dataset Name | N | S | V | F | Q | Number of Beats | Number of Recordings |
|---|---|---|---|---|---|---|---|
| DS1 | 45,844 | 943 | 3788 | 415 | 8 | 50,998 | 22 |
| DS2 | 44,238 | 1836 | 3221 | 388 | 7 | 49,690 | 22 |
| Total | 90,082 | 2779 | 7009 | 803 | 15 | 100,688 | 44 |
Table 4.
Results (in %) obtained by the proposed method and some previous work following the AAMI recommendations and the inter-patient scheme.
| Method | Features | Classifier | ACC | N | S | V | F | Q |
|---|---|---|---|---|---|---|---|---|
| SE/+P/FPR | SE/+P/FPR | SE/+P/FPR | SE/+P/FPR | SE/+P/FPR | ||||
| Yu [5] | ICA + RR | PNN | 88.87 | 89.02/99.80/92.55 | 13.64/0.16/3.69 | 100.00/0.12/6.47 | 0.00/0.00/0.78 | 0.00/0.00/0.01 |
| Song [9] | DWT + LDA + RR | SVM | 94.22 | 95.79/98.73/13.66 | 0.00/0.00/3.70 | 79.03/97.55/0.17 | 0.00/0.00/0.78 | 0.00/0.00/0.01 |
| Ye [11] | DWT + ICA + PCA + RR | SVM | 92.17 | 92.18/99.71/7.01 | 0.00/0.00/3.69 | 91.90/52.50/3.20 | 0.00/0.00/0.78 | 0.00/0.00/0.01 |
| The Proposed | WPE + RR | RF | 94.61 | 94.67/99.73/3.92 | 20.00/0.16/3.69 | 94.20/89.78/0.71 | 50.00/0.52/0.78 | 0.00/0.00/0.01 |
ACC: Accuracy; S: Supraventricular ectopic beat (SVEB); V: Ventricular ectopic beat (VEB); F: Fusion beat; Q: Unknown beat; N: Any heartbeat not categorized as SVEB, VEB or Q; SE: Sensitivity; +P: positive predictivity; FPR: False positive rate; ICA: Independent component analysis; RR: the time between the R peaks of two heartbeats; PNN: Probabilistic neural network; DWT: Discrete wavelet transform; LDA: Linear discriminant analysis; PCA: Principal component analysis; SVM: Support vector machine; WPE: Wavelet packet entropy; RF: Random forests.
Table 5.
Results (in %) obtained by wavelet packet entropy (WPE) and different classifiers following the AAMI recommendations and the inter-patient scheme.
| Features | Classifier | ACC | N | S | V | F | Q |
|---|---|---|---|---|---|---|---|
| SE/+P/FPR | SE/+P/FPR | SE/+P/FPR | SE/+P/FPR | SE/+P/FPR | |||
| WPE + RR | KNN (k = 5) | 90.94 | 94.12/96.48/35.88 | 25.66/19.66/3.05 | 76.05/67.17/2.29 | 0.87/0.26/0.78 | 100.00/0/0.01 |
| DT | 85.50 | 94.53/90.35/57.64 | 6.39/4.36/3.63 | 53.26/76.64/1.74 | 0.19/0.77/0.80 | 75.00/0.00/0.01 | |
| PNN | 92.50 | 92.60/99.58/8.73 | 15.38/0.44/3.68 | 92.38/59.11/2.77 | 0.00/0.00/0.78 | 0.00/0.00/0.01 | |
| SVM | 89.03 | 89.03/100.00/0.00 | 0.00/0.00/3.69 | 0.00/0.00/6.48 | 0.00/0.00/0.78 | 0.00/0.00/0.01 | |
| RF | 94.61 | 94.67/99.73/3.92 | 20.00/0.16/3.69 | 94.20/89.78/0.71 | 50.00/0.52/0.78 | 0.00/0.00/0.01 |
ACC: Accuracy; S: Supraventricular ectopic beat (SVEB); V: Ventricular ectopic beat (VEB); F: Fusion beat; Q: Unknown beat; N: Any heartbeat not categorized as SVEB, VEB or Q; SE: Sensitivity; +P: positive predictivity; FPR: False positive rate; WPE: Wavelet packet entropy; RR: the time between the R peaks of two heartbeats; KNN: K-nearest neighbours; DT: Decision tree; PNN: Probabilistic neural network; SVM: Support vector machine; RF: Random forests.
Table 6.
Results (in %) obtained by random forests (RF) and different features following the AAMI recommendations and the inter-patient scheme.
| Method | Features | ACC | N | S | V | F | Q |
|---|---|---|---|---|---|---|---|
| SE/+P/FPR | SE/+P/FPR | SE/+P/FPR | SE/+P/FPR | SE/+P/FPR | |||
| Yu [5] | ICA + RR | 94.42 | 95.01/99.67/ 4.51 | 40.41/9.64/3.37 | 93.80/82.73/1.22 | 0.00/0.00/.78 | 0.00/0.00/0.01 |
| Song [9] | DWT + LDA + RR | 91.95 | 94.96/96.87/30.36 | 72.97/2.94/3.59 | 63.81/85.10/1.12 | 31.15/19.59/.63 | 0.00/0.00/0.01 |
| Ye [11] | DWT + ICA + PCA + RR | 93.62 | 95.35/98.38/17.73 | 28.17/1.09/3.66 | 75.27/92.42/0.53 | 12.50/ 0.77/.78 | 0.00/0.00/0.01 |
| The Proposed | WPD + RR | 93.08 | 94.09/98.47/19.99 | 15.09/0.44/3.68 | 80.32/83.36/1.16 | 100.00/0.26/0.78 | 0.00/0.00/0.01 |
| WPE | 92.84 | 93.48/98.91/16.75 | 33.33/0.05/3.69 | 85.26/73.82/1.80 | 1.08/0.26/0.78 | 0.00/0.00/ 0.01 | |
| WPE + RR | 94.61 | 94.67/99.73/3.92 | 20.00/0.16/3.69 | 94.20/89.78/0.71 | 50.00/0.52/0.78 | 0.00/0.00/0.01 |
ACC: Accuracy; S: Supraventricular ectopic beat (SVEB); V: Ventricular ectopic beat (VEB); F: Fusion beat; Q: Unknown beat; N: Any heartbeat not categorized as SVEB, VEB or Q; SE: Sensitivity; +P: positive predictivity; FPR: False positive rate; RR: the time between the R peaks of two heartbeats; ICA: Independent component analysis; DWT: Discrete wavelet transform; LDA: Linear discriminant analysis; PCA: Principal component analysis; SVM: Support vector machine; WPD: Wavelet packet decomposition; WPE: Wavelet packet entropy.
| Mother Wavelet | Decomposition Level | ACC | N | S | V | F | Q |
|---|---|---|---|---|---|---|---|
| SE/+P/FPR | SE/+P/FPR | SE/+P/FPR | SE/+P/FPR | SE/+P/FPR | |||
| db4 | 2 | 90.43 | 94.67/95.47/39.45 | 20.64/5.61/3.52 | 65.02/80.38/1.39 | 2.48/3.87/0.76 | 0.00/0.00/0.01 |
| 4 | 93.93 | 94.93/99.17/10.56 | 41.49/2.12/3.62 | 82.28/85.78/0.99 | 0.00/0.00/0.78 | 0.00/0.00/0.01 | |
| 6 | 94.61 | 94.67/99.73/3.92 | 20.00/0.16/3.69 | 94.20/89.78/0.71 | 50.00/0.52/0.78 | 0.00/0.00/0.01 | |
| 8 | 94.33 | 94.27/99.79/ 3.21 | 0.00/0.00/3.69 | 95.28/84.69/1.05 | 0.00/0.00/0.78 | 0.00/0.00/0.01 | |
| coif1 | 2 | 93.17 | 95.13/98.13/20.37 | 15.67/ 3.43/3.60 | 82.00/86.84/0.95 | 15.15/10.31/0.70 | 0.00/0.00/0.01 |
| 4 | 94.20 | 94.80/99.24/10.00 | 33.70/ 1.69/3.64 | 88.20/89.58/0.74 | 0.00 /0.00 /0.78 | 0.00/0.00/0.01 | |
| 6 | 94.51 | 94.75/99.46/7.32 | 15.00 /0.33 /3.69 | 92.20/91.77/0.57 | 0.00 /0.00 /0.78 | 0.00/0.00/0.01 | |
| 8 | 94.57 | 94.53/99.78/3.30 | 50.00 /0.11 /3.69 | 95.42/88.57/0.79 | 0.00 /0.00 /0.78 | 0.00/0.00/0.01 | |
| dmey | 2 | 88.00 | 94.45/93.19/49.85 | 20.00/ 2.89/3.61 | 44.49/75.08/1.86 | 13.27/13.40/0.68 | 0.00/0.00/0.01 |
| 4 | 92.83 | 95.08/97.91/22.32 | 14.29/ 0.71/3.68 | 70.05/87.36/0.94 | 12.07/1.80 /0.77 | 0.00/0.00/0.01 | |
| 6 | 93.91 | 94.53/99.13/11.69 | 27.59/ 0.44/3.68 | 85.94/87.25/0.91 | 14.29/0.52 /0.78 | 0.00/0.00/0.01 | |
| 8 | 94.30 | 94.52/99.56/6.34 | 16.67 /0.05 /3.69 | 91.42/87.61/0.88 | 0.00 /0.00 /0.78 | 0.00/0.00/0.01 | |
| bior4.4 | 2 | 90.03 | 94.37/95.41/40.91 | 20.65/3.10/3.60 | 61.18/76.00/1.70 | 4.02/7.22/0.73 | 0.00/0.00/0.01 |
| 4 | 93.35 | 94.36/98.85/15.20 | 32.05/2.72/3.61 | 88.77/81.04/1.31 | 0.00/0.00/0.78 | 0.00/0.00/0.01 | |
| 6 | 94.57 | 94.58/99.75/ 3.63 | 47.06/0.44/3.68 | 94.79/88.73/0.78 | 0.00/0.00/0.78 | 0.00/0.00/0.01 | |
| 8 | 94.50 | 94.45/99.83/ 2.56 | 100.00/0.05/3.69 | 95.36/86.74/0.91 | 0.00/0.00/0.78 | 0.00/0.00/0.01 |
ACC: Accuracy; S: Supraventricular ectopic beat (SVEB); V: Ventricular ectopic beat (VEB); F: Fusion beat; Q: Unknown beat; N: Any heartbeat not categorized as SVEB, VEB or Q; SE: Sensitivity; +P: positive predictivity; FPR: False positive rate.
| Type of Entropies | ACC | N | S | V | F | Q | |
|---|---|---|---|---|---|---|---|
| SE/+P/FPR | SE/+P/FPR | SE/+P/FPR | SE/+P/FPR | SE/+P/FPR | |||
| SE | 94.61 | 94.67/99.73/3.92 | 20.00/0.16/3.69 | 94.20/89.78/0.71 | 50.00/0.52/0.78 | 0.00/0.00/0.01 | |
| LEE | 93.98 | 94.23/99.86/2.24 | 50.00/0.16/3.69 | 90.00/78.23/1.50 | 0.00/0.00/0.78 | 0.00/0.00/0.01 | |
| RE | 94.36 | 94.59/99.52/6.75 | 5.36/0.16/3.70 | 92.60/88.73/0.78 | 33.33/0.26/0.78 | 0.00/0.00/0.01 | |
| 94.44 | 94.67/99.52/6.66 | 5.36/0.16/3.70 | 92.70/89.98/0.69 | 33.33/0.26/0.78 | 0.00/0.00/0.01 | ||
| 94.63 | 94.71/99.70/4.20 | 25.00/0.22/3.68 | 93.99/90.40/0.67 | 50.00/0.52/0.78 | 0.00/0.00/0.01 | ||
| 94.53 | 94.67/99.63/5.20 | 21.05/0.22/3.69 | 92.89/89.72/0.71 | 66.67/0.52/0.78 | 0.00/0.00/0.01 | ||
| 94.36 | 94.66/99.50/6.97 | 23.21/0.71/3.67 | 91.38/88.78/0.77 | 25.00/0.26/0.78 | 0.00/0.00/0.01 | ||
| 94.28 | 94.59/99.46/7.50 | 13.64/0.16/3.69 | 90.50/88.47/0.80 | 50.00/0.26/0.78 | 0.00/0.00/0.01 | ||
| 94.39 | 94.59/99.55/6.38 | 10.81/0.22/3.69 | 92.44/88.85/0.77 | 0.00/0.00/0.78 | 0.00/0.00/0.01 | ||
| 94.47 | 94.69/99.53/6.58 | 7.14/0.22/3.69 | 92.75/90.29/0.67 | 50.00/0.26/0.78 | 0.00/0.00/0.01 | ||
| 94.58 | 94.68/99.68/4.58 | 20.00/0.22/3.69 | 93.54/90.00/0.69 | 0.00/0.00/0.78 | 0.00/0.00/0.01 | ||
| 94.70 | 94.76/99.73/3.83 | 35.29/0.33/3.68 | 94.24/91.02/0.62 | 50.00/0.52/0.78 | 0.00/0.00/0.01 | ||
| 94.56 | 94.71/99.62/5.32 | 27.27/0.33/3.68 | 92.82/90.37/0.67 | 0.00/0.00/0.78 | 0.00/0.00/0.01 | ||
| TE | 93.90 | 94.05/99.74/4.21 | 80.00/0.44/3.68 | 91.30/78.48/1.48 | 0.00/0.00/0.78 | 0.00/0.00/0.01 | |
| 94.19 | 94.43/99.65/5.59 | 62.50/0.54/3.69 | 90.37/83.58/1.06 | 50.00/0.26/0.78 | 0.00/0.00/0.01 | ||
| 94.26 | 95.04/99.71/3.90 | 50.73/5.66/3.50 | 85.38/81.46/1.28 | 66.67/0.51/0.78 | 0.00/0.00/0.01 | ||
| 94.16 | 94.28/99.79/3.28 | 50.00/0.33/3.68 | 92.43/81.93/1.24 | 0.00/0.00/0.78 | 0.00/0.00/0.01 | ||
| 94.27 | 94.55/99.54/4.48 | 84.68/5.12/3.51 | 90.31/84.23/1.09 | 100.00/0.26/0.78 | 0.00/0.00/0.01 | ||
| 94.34 | 94.56/99.62/4.45 | 86.24/5.12/3.51 | 91.29/84.28/1.09 | 33.33/0.26/0.78 | 0.00/0.00/0.01 | ||
| 94.64 | 94.87/99.62/4.26 | 73.12/11.36/3.22 | 93.17/84.28/1.09 | 20.00/0.26/0.78 | 0.00/0.00/0.01 | ||
| 94.48 | 94.76/99.55/5.23 | 67.53/8.69/3.32 | 92.22/84.28/1.08 | 33.33/0.26/0.78 | 0.00/0.00/0.01 | ||
| 94.40 | 94.76/99.49/5.08 | 64.47/8.19/3.33 | 91.03/84.16/1.09 | 0.00/0.00/0.78 | 0.00/0.00/0.01 | ||
ACC: Accuracy; S: Supraventricular ectopic beat (SVEB); V: Ventricular ectopic beat (VEB); F: Fusion beat; Q: Unknown beat; N: Any heartbeat not categorized as SVEB, VEB or Q; SE: Sensitivity; +P: positive predictivity; FPR: False positive rate. SE: Shannon entropy; LEE: log energy entropy; RE: Renyi Entropy; TE: Tsallis entropy.
| Number of Base Learners | ACC | N | S | V | F | Q |
|---|---|---|---|---|---|---|
| SE/+P/FPR | SE/+P/FPR | SE/+P/FPR | SE/+P/FPR | SE/+P/FPR | ||
| 5 | 92.56 | 94.36/97.86/24.82 | 21.95/2.45/3.62 | 75.43/82.55/1.22 | 0.00/0.00/0.78 | 0.00/0.00/0.01 |
| 10 | 93.62 | 94.45/98.85/15.01 | 18.44/1.42/3.65 | 85.97/85.95/0.98 | 2.78/0.26/0.78 | 0.00/0.00/0.01 |
| 20 | 94.35 | 94.58/99.50/7.02 | 36.11/0.71/3.67 | 92.33/88.57/0.79 | 4.17/0.26/0.78 | 0.00/0.00/0.01 |
| 50 | 94.33 | 94.63/99.48/7.28 | 30.43/0.38/3.68 | 90.53/88.82/0.78 | 14.29/0.26/0.78 | 0.00/0.00/0.01 |
| 100 | 94.56 | 94.61/99.68/4.61 | 25.00/0.22/3.69 | 94.28/89.63/0.72 | 33.33/0.26/0.78 | 0.00/0.00/0.01 |
| 200 | 94.59 | 94.68/99.69/4.37 | 28.57/0.22/3.69 | 93.59/89.84/0.70 | 25.00/0.26/0.78 | 0.00/0.00/0.01 |
| 400 | 94.61 | 94.67/99.73/3.92 | 20.00/0.16/3.69 | 94.20/89.78/0.71 | 50.00/0.52/0.78 | 0.00/0.00/0.01 |
| 800 | 94.61 | 94.69/99.70/4.30 | 27.27/0.16/3.69 | 93.74/90.18/0.68 | 20.00/0.26/0.78 | 0.00/0.00/0.01 |
ACC: Accuracy; S: Supraventricular ectopic beat (SVEB); V: Ventricular ectopic beat (VEB); F: Fusion beat; Q: Unknown beat; N: Any heartbeat not categorized as SVEB, VEB or Q; SE: Sensitivity; +P: positive predictivity; FPR: False positive rate.
| Classifier | Training Time | Testing Time | Total Time | |
|---|---|---|---|---|
| RF | 20 | 6.483 | 0.740 | 7.223 |
| 100 | 30.695 | 3.200 | 33.895 | |
| 400 | 120.946 | 12.637 | 133.583 | |
| KNN (k = 5) | 0.705 | 38.931 | 39.636 | |
| DT | 2.593 | 0.030 | 2.623 | |
| SVM | 70.315 | 43.185 | 113.5 | |
| PNN | 2.359 | 303.845 | 306.205 | |
RF: Random forests; KNN: K-nearest neighbours; DT: Decision tree; SVM: Support vector machine; PNN: Probabilistic neural network.
© 2016 by the authors; licensee MDPI, Basel, Switzerland. This article is an open access article distributed under the terms and conditions of the Creative Commons Attribution (CC-BY) license (http://creativecommons.org/licenses/by/4.0/).
Share and Cite
MDPI and ACS Style
Li, T.; Zhou, M. ECG Classification Using Wavelet Packet Entropy and Random Forests. Entropy 2016, 18, 285. https://doi.org/10.3390/e18080285
AMA Style
Li T, Zhou M. ECG Classification Using Wavelet Packet Entropy and Random Forests. Entropy. 2016; 18(8):285. https://doi.org/10.3390/e18080285
Chicago/Turabian StyleLi, Taiyong, and Min Zhou. 2016. "ECG Classification Using Wavelet Packet Entropy and Random Forests" Entropy 18, no. 8: 285. https://doi.org/10.3390/e18080285
Note that from the first issue of 2016, this journal uses article numbers instead of page numbers. See further details here.