Article

A Novel Deep Learning Model for Detection of Severity Level of the Disease in Citrus Fruits

1
Chitkara University Institute of Engineering and Technology, Chitkara University, Punjab 140601, India
2
Division of Information and Computing Technology, College of Science and Engineering, Hamad Bin Khalifa University, Qatar Foundation, Doha 582500, Qatar
3
Department of Computer Science, College of Computers and Information Science, Jouf University, Al-Jouf 85846, Saudi Arabia
4
Department of Computer Science, Hekma School of Engineering, Computing, and Informatics, Dar Al-Hekma University, Jeddah 22246, Saudi Arabia
5
Department of Computing, University of Finland, 20100 Turku, Finland
6
Department of Technology, Higher Institute of Computer Sciences and Mathematics, University of Monastir, Monastir 5000, Tunisia
7
School of Creative Technologies, University of Bolton, Bolton BL3 5AB, UK
*
Authors to whom correspondence should be addressed.
Electronics 2022, 11(3), 495; https://doi.org/10.3390/electronics11030495
Submission received: 29 December 2021 / Revised: 29 January 2022 / Accepted: 4 February 2022 / Published: 8 February 2022

Abstract

:
Citrus fruit diseases have an egregious impact on both the quality and quantity of the citrus fruit production and market. Automatic detection of severity is essential for the high-quality production of fruit. In the current work, a citrus fruit dataset is preprocessed by rescaling and establishing bounding boxes with labeled image software. Then, a selective search, which combines the capabilities of both an extensive search and graph-based segmentation, is applied. The proposed deep neural network (DNN) model is trained to detect targeted areas of the disease with its severity level using citrus fruits that have been labeled with the help of a domain expert with four severity levels (high, medium, low and healthy) as ground truth. Transfer learning using VGGNet is applied to implement a multi-classification framework for each class of severity. The model predicts the low severity level with 99% accuracy, and the high severity level with 98% accuracy. The model demonstrates 96% accuracy in detecting healthy conditions and 97% accuracy in detecting medium severity levels. The result of the work shows that the proposed approach is valid, and it is efficient for detecting citrus fruit disease at four levels of severity.

1. Introduction

According to the FAO (FAOSTAT 2019) [1], world citrus fruit production is estimated to be at 157.98 million of tons, with oranges accounting for more than half of the total. Producers seek to produce superior fruits at a cheaper cost that are free of any disease insects and pathogens; this task can be accomplished through the use of appropriate mechanized standards and predictive maintenance techniques [2]. Fruit diseases create a substantial danger to modern farming production of citrus. The citrus sector needs early and automatic identification of diseases during post-harvesting since a few contaminated fruits might disseminate the disease to the entire sequence during processing or shipment. The severity of the disease is a crucial parameter for determining the extent of the disease and affects yield production. The ability to diagnose disease severity quickly and accurately would help to prevent production deficits; disease severity has been previously determined by trained professionals by visually inspecting plant tissues. The high cost and limited efficiency of human disease assessment stymies modernized agriculture’s rapid progress [3]. This paper presents deep learning models for the image-based automatic diagnosis of citrus fruit disease severity levels. We address the issues of determining the severity of disease in citrus fruits in a multi-classification framework using a deep learning model in this paper. Section 1 presents the introduction and contributions of the paper. The rest of the paper is organized as follows: Section 2 provides the literature review. Section 3 presents the proposed algorithm for the disease and severity detection of the citrus fruits and detailed description of the materials and methodology used by the model. Further, results evaluation is presented in Section 4. Finally, the paper is concluded in Section 5.

Contributions of the Paper

The objective of this paper is to develop a deep learning model that classifies the disease according to the severity level and to identify the disease-affected area of the citrus fruit. The proposed model has the ability to recognize and classify the infected areas of citrus fruits. It is a powerful approach for automatically identifying the citrus fruit disease severity and can be further extended to reinforce a unified citrus disease identification system for real-world applications. The current study helps to mitigate and prevent the fruit disease at the initial stages and can be able to control the cost of the disease when safeguarding the surroundings globally.

2. Literature Review

Effective surveillance and diagnosis of resistant cultivars is critical for disease control and prevention for healthy yields. Using watershed segmentation, a novel machine vision system for the automatic identification of diseases was proposed. Two kinds of diseases, i.e., yellow rust and Septoria, were accurately detected using the proposed approach [4]. The severity of leaf rust disease can result in a reduction in sugar production. As a result, illness signs must be discovered as soon as possible, and appropriate actions should be implemented to prevent the disease from spreading or progressing. A faster region-based convolutional neural network framework was constructed by altering the parameters of the model and a faster R-CNN framework was developed for the detection of leaf spot infestation in sugar. The technique provided for severity detection of disease with image-based systems was trained on 155 images, and classification accuracy of 95.48% was obtained [5]. The citrus industry is still working on developing technologies for automatically identifying deterioration in citrus fruit throughout quality control. Using three distinct manifold learning approaches, the viability of reflectance spectroscopy in the visible and near-infrared regions was tested for the early identification of the root cause of rot by Penicillium digitatum in citrus fruit [6]. Controlling the spread of disease requires its diagnosis and then destroying the cause, particularly for citrus huanglongbing (HLB)-infected trees. Ground investigation is an arduous and time-consuming task. It is rare to find a large-area analysis tool for citrus orchards with excellent efficiency. The possibility of large-area monitoring of citrus HLB using low-altitude remote sensing was explored [7]. Nowadays, citrus fruit exports to international markets are significantly hampered by fruit disorders such as citrus canker, black spot and scab. As a result, thorough procedures must be performed prior to the transportation of fruits to mitigate the presence of citrus damaged by them. A model based on a feature selection method with a classifier trained on quarantine disease for disease detection is being deployed [8]. Among the most significant components used for enhancing agricultural products, scalability and waste reduction are considered to be criteria for evaluating quality. An optimized convolutional neural network system was developed to identify visible flaws in sour lemon, evaluate them and devise a better solution. To detect and characterize abnormalities, lemon images were taken and divided into two categories, i.e., healthy and impaired. Following preprocessing, the images were classified using an improved CNN model. To improve the outcomes, a stochastic pooling mechanism with augmentation techniques was implemented [9]. A machine vision system to detect irregularities in citrus peel and evaluate the nature of the defect was designed. The image is segmented into defective zones using the Sobel gradient. Following this, color and texture features are retrieved, some of which are associated with high-order statistics [10]. Disease detection is currently conducted manually by domain experts using harmful ultraviolet rays on fruits. The utilization of hyperspectral imaging technologies allows for the advancement of systems for the automatic detection of disease. A methodology was proposed to develop a multi-classification system using the receiver operating characteristic curve to detect fungal infections in citrus fruits. The developed system helped in reducing the set of features and achieved an accuracy rate of 89% [11].

3. Materials and Methods

The proposed model for detecting affected areas and the severity levels of the citrus fruit disease comprises five modules, as shown in Figure 1. The first module targets the collection of citrus fruit images.The second module is used to label the healthy and infected images by using expert knowledge. For labeling the images, an open-source tool is used [12]. Labeling is the process of providing annotation to the graphical images and labeling the bounding box for object detection. Annotations of the images are stored as XML files in Pascal VOC form; the process of annotating the images is further explained in Section 3.2. The third module is the combination of graph-based segmentation and object detection to produce regions of proposal that are independent of the class. The most similar regions are grouped together and the similarity is calculated between the regions, which is further explained in Section 3.4. A CNN network using transfer learning extracts a fixed-length feature map for each region in the fourth module. The last module represents the implementation of multi-class sequential CNN models that determine the severity level of the citrus fruit disease using a softmax function, as explained in Section 3.6.

3.1. Dataset

Fruit diseases severely affect the product quality, market segment and revenue. Citrus is an important source of vitamins A and C. Citrus illnesses, on the other hand, have a negative impact on citrus fruit output and quality [11]. Citrus plants such as lemons, oranges, grapefruit and limes are susceptible to a variety of citrus diseases, such as anthracnose, HLB, scab, black spot and other fungal infections [13]. Adequate datasets are necessary for object detection and the classification process using deep learning. All the images collected for the dataset were downloaded from online datasets and collected from the sources, i.e., PlantVillage and Kaggle [14,15]. After taking the images from the publicly available source, the images were prepared for obtaining the severity of the disease with the help of a domain expert.

3.2. Annotation

Before training a model, image annotation is an essential image preprocessing step. During the training phase, a model can learn the labeled features. As a result, the quality of the training model is strongly influenced by the precision of the feature labeling. As several types of disease appear to be relatively similar, knowledge of the different types of fruit diseases could aid the machine in learning traits important to different fruit diseases. A scientist of horticulture helped with the data annotation. The expert considered the diameter, color features, shape and the surface area of the affected portion of the disease present in the image in order to determine the extent of damage in the fruit. The labeling only included the exterior features of the image, while interior damage was not considered. The outcome of the annotated image was coordinates and bounding boxes, and the practice of image annotation required the labeling of disease locations in the image. Labeling is a free graphical image annotation tool that locates and categorizes the disease severity in an image and stores it as an XML file with the matching xmin, xmax, ymin and ymax data for each bounding box [16,17]. There is an XML file in the Annotation folder for a single JPEG file in the JPEG Images folder. Each object’s bounding box is saved in an XML file. It is difficult to work with annotation data for each image in a separate file. Therefore, we used Panda modules to combine each of these XML files into one CSV file. Annotations were first made in a Panda data framework called “df anno”, which was then saved as a CSV file. Then, after the CSV file was segregated, containing the annotated data of citrus fruits, into four disease severity categories: healthy, medium, high and low. We then built an object for each class of severity. Next, we iterated each row of an object to extract the image name and URL from the object file and read it. Then, on each category’s object, the accuracy of object detection was measured. Table 1 represents the total number of citrus samples taken for training and testing.

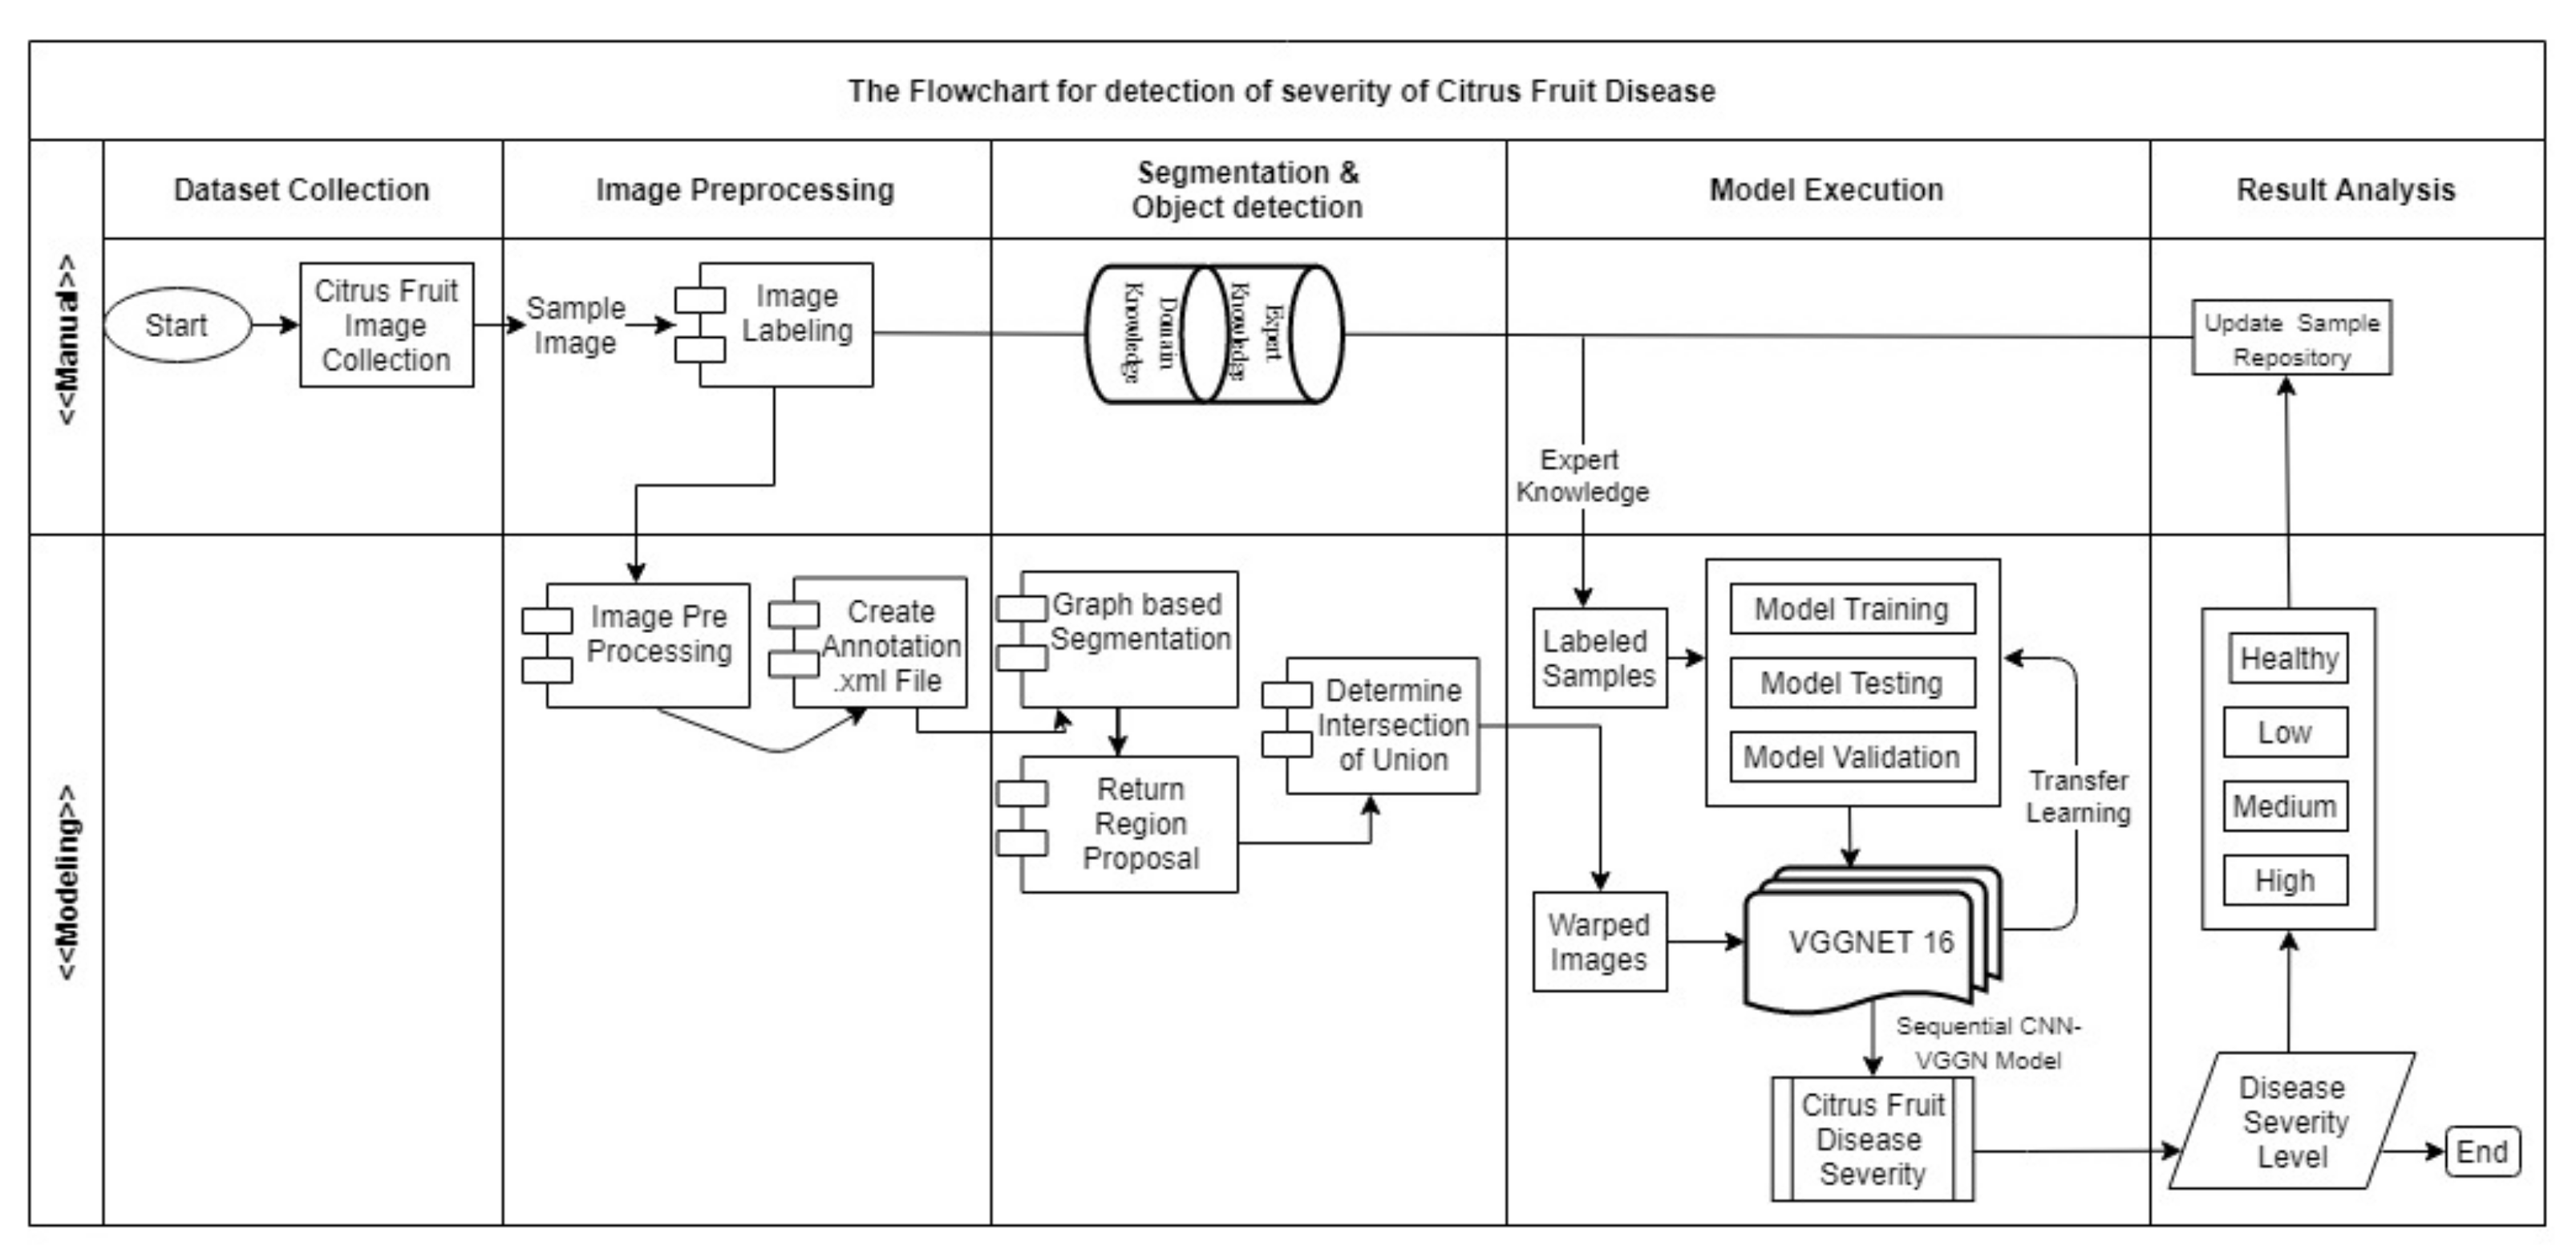
3.3. Proposed Algorithm for Detecting Severity Regions of the Citrus Diseases

Input the colored image(Img)
(1)
Perform BoundingBox(Img) and annotate the image, i.e., Annotate(Img), where BoundingBox(Img) is used to create boundary coordinates on affected areas of the image and the Annotate(Img) function is used to create and extract the annotated image as an XML file for each image.
(2)
Create object for each category (i.e., healthy, low, medium and high).
(3)
Repeat step 5 for each object.
(4)
Repeat step 6 for each row of single object.
(5)
Extract Img_name and Img_url from object and perform preprocessing.
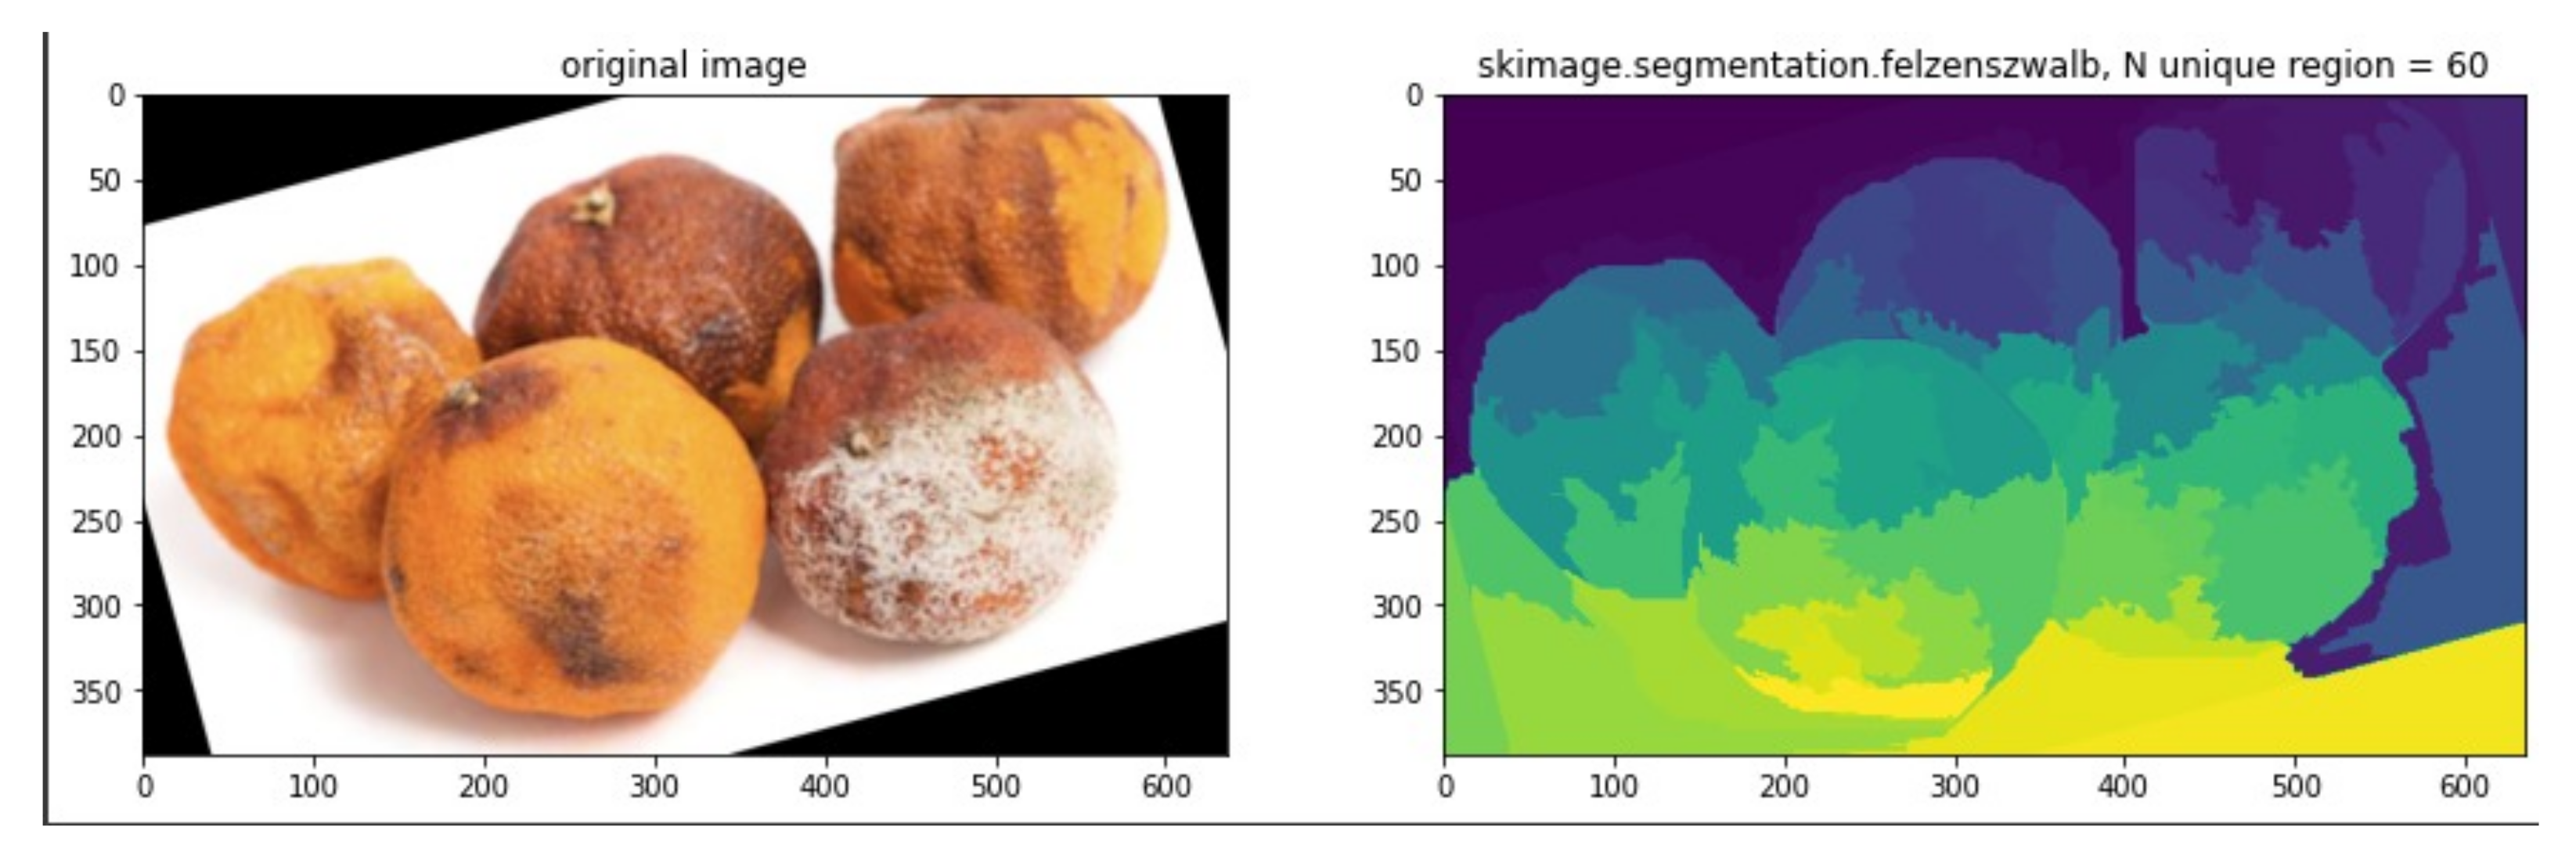
(6)
Extract region using graph-based segmentation to determine the region proposal.
(7)
Repeat step 9-11 for each extracted segment region.
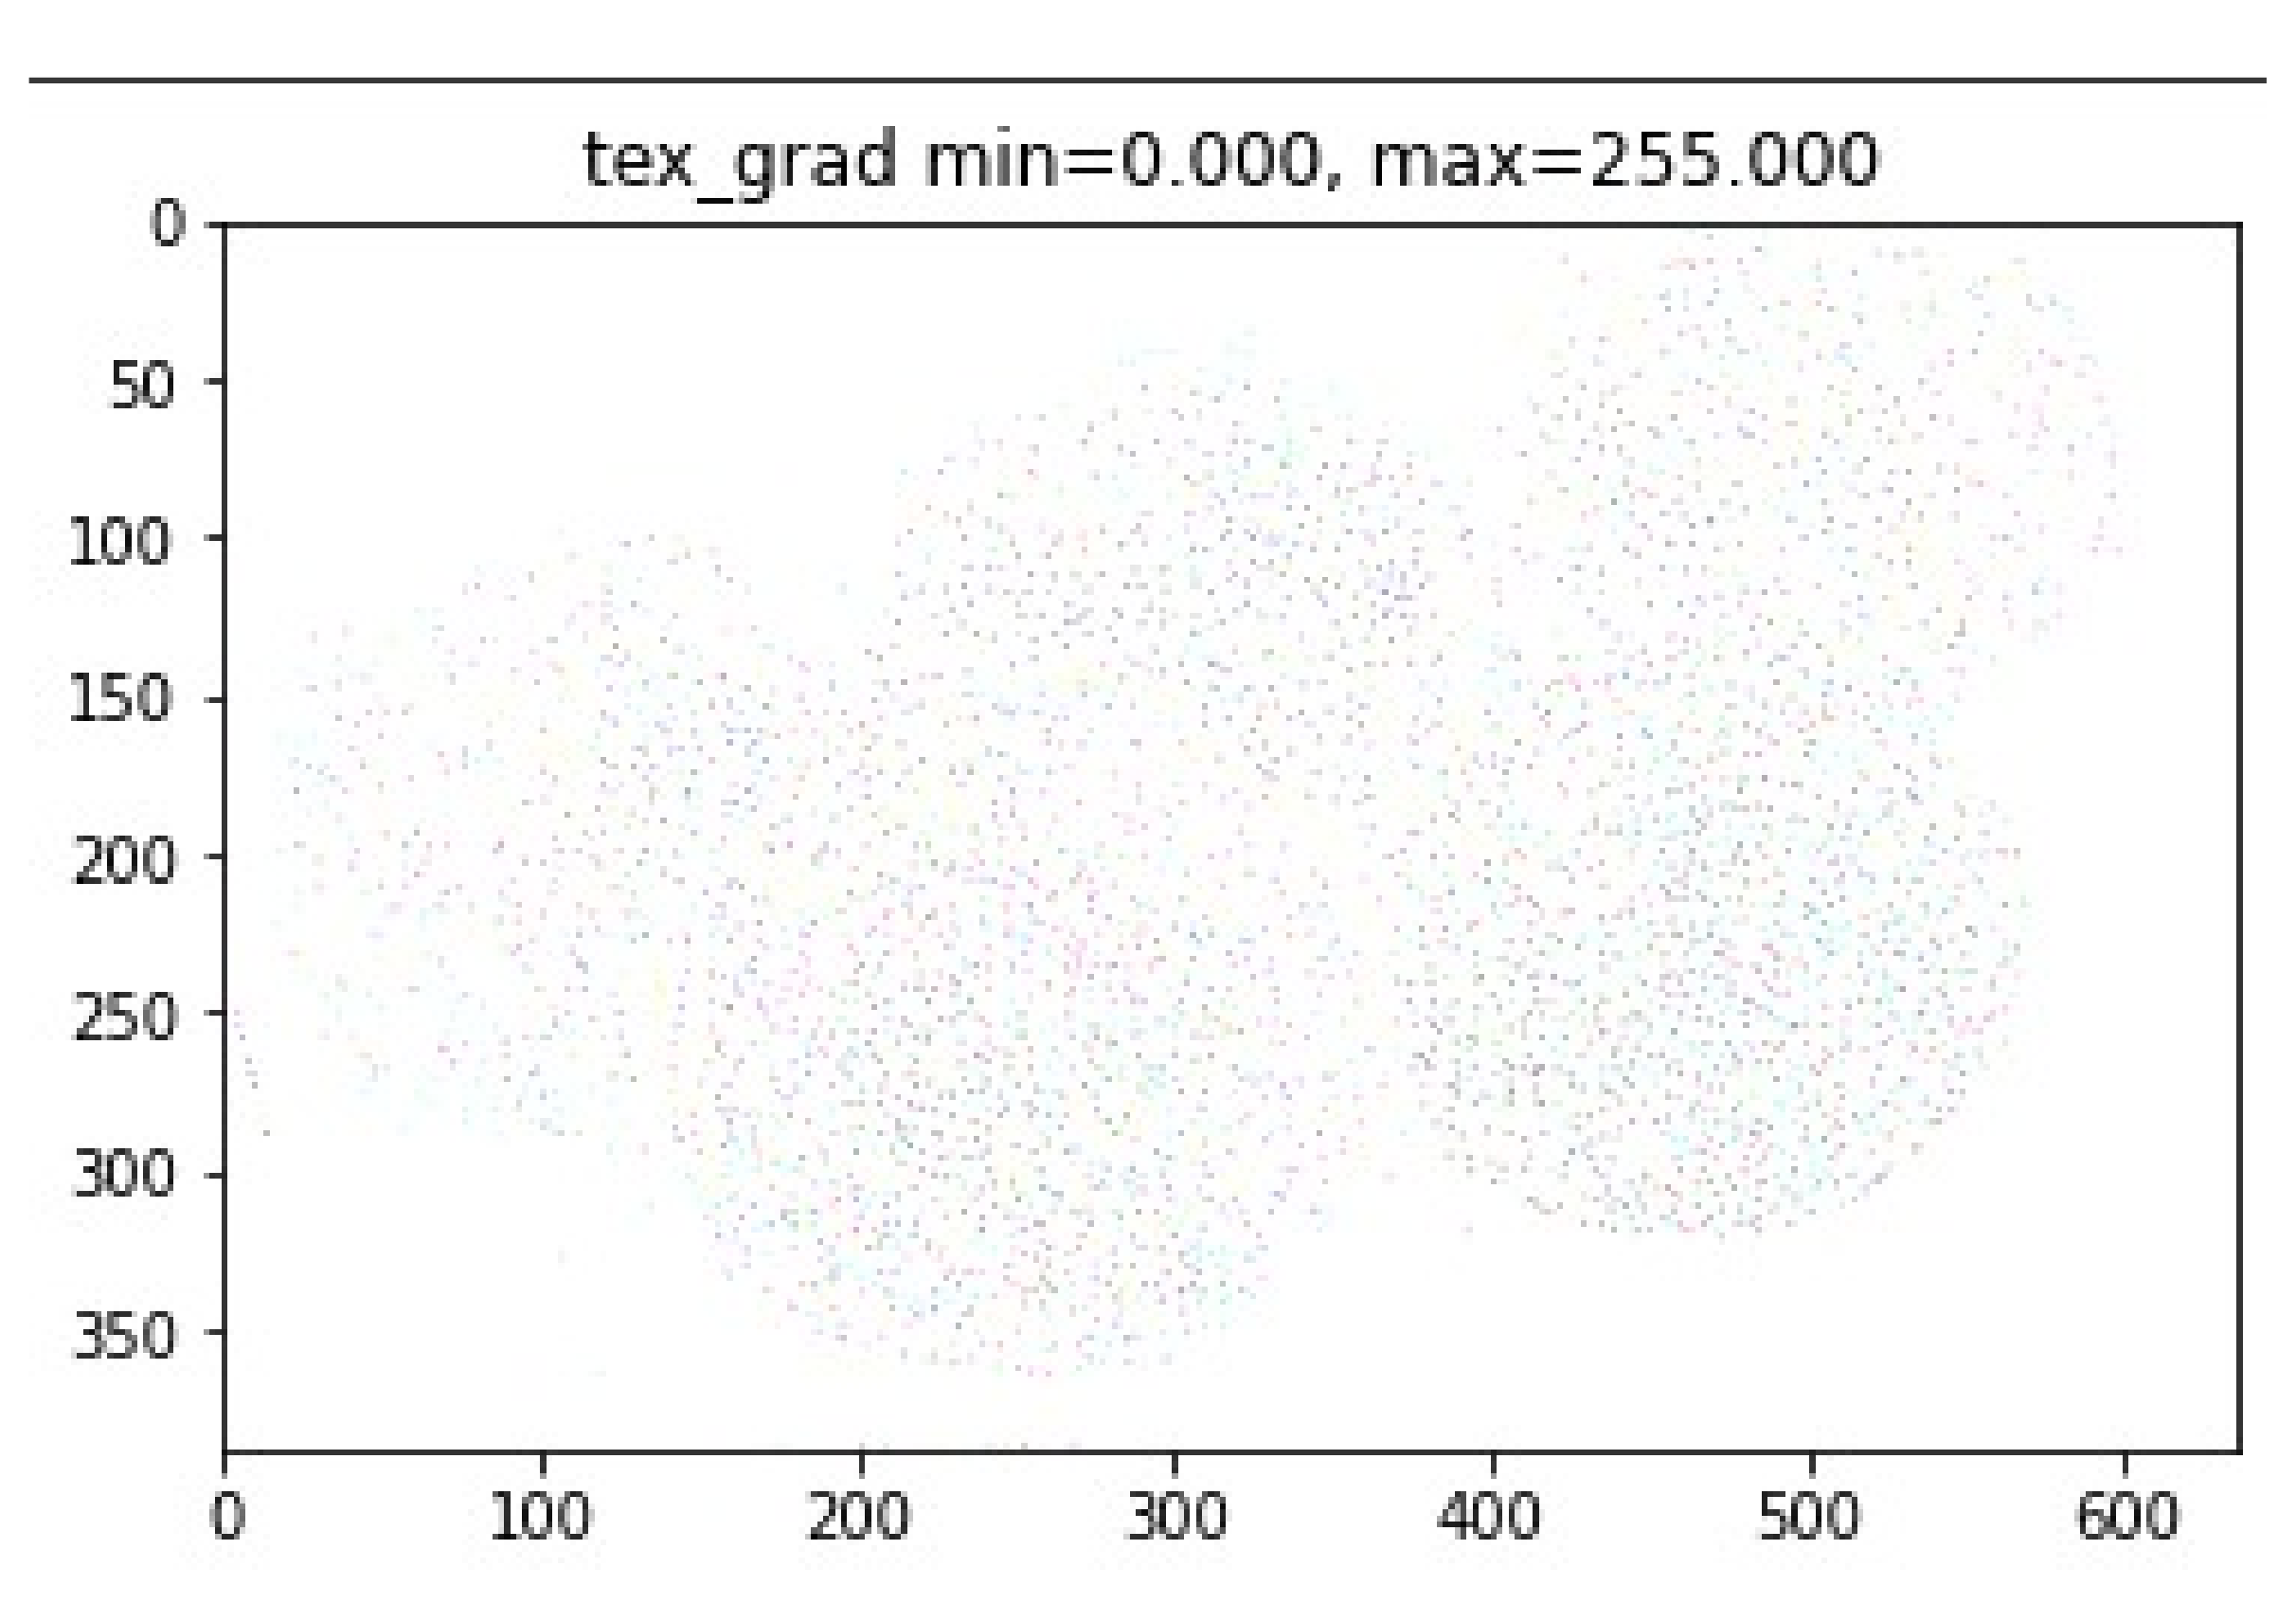
(8)
Compute texture gradient of the image (using LBP).
(9)
Extract HSV for entire image using color histogram having COLOUR_CHANNELS (3)* bins with a total of 25 bins.
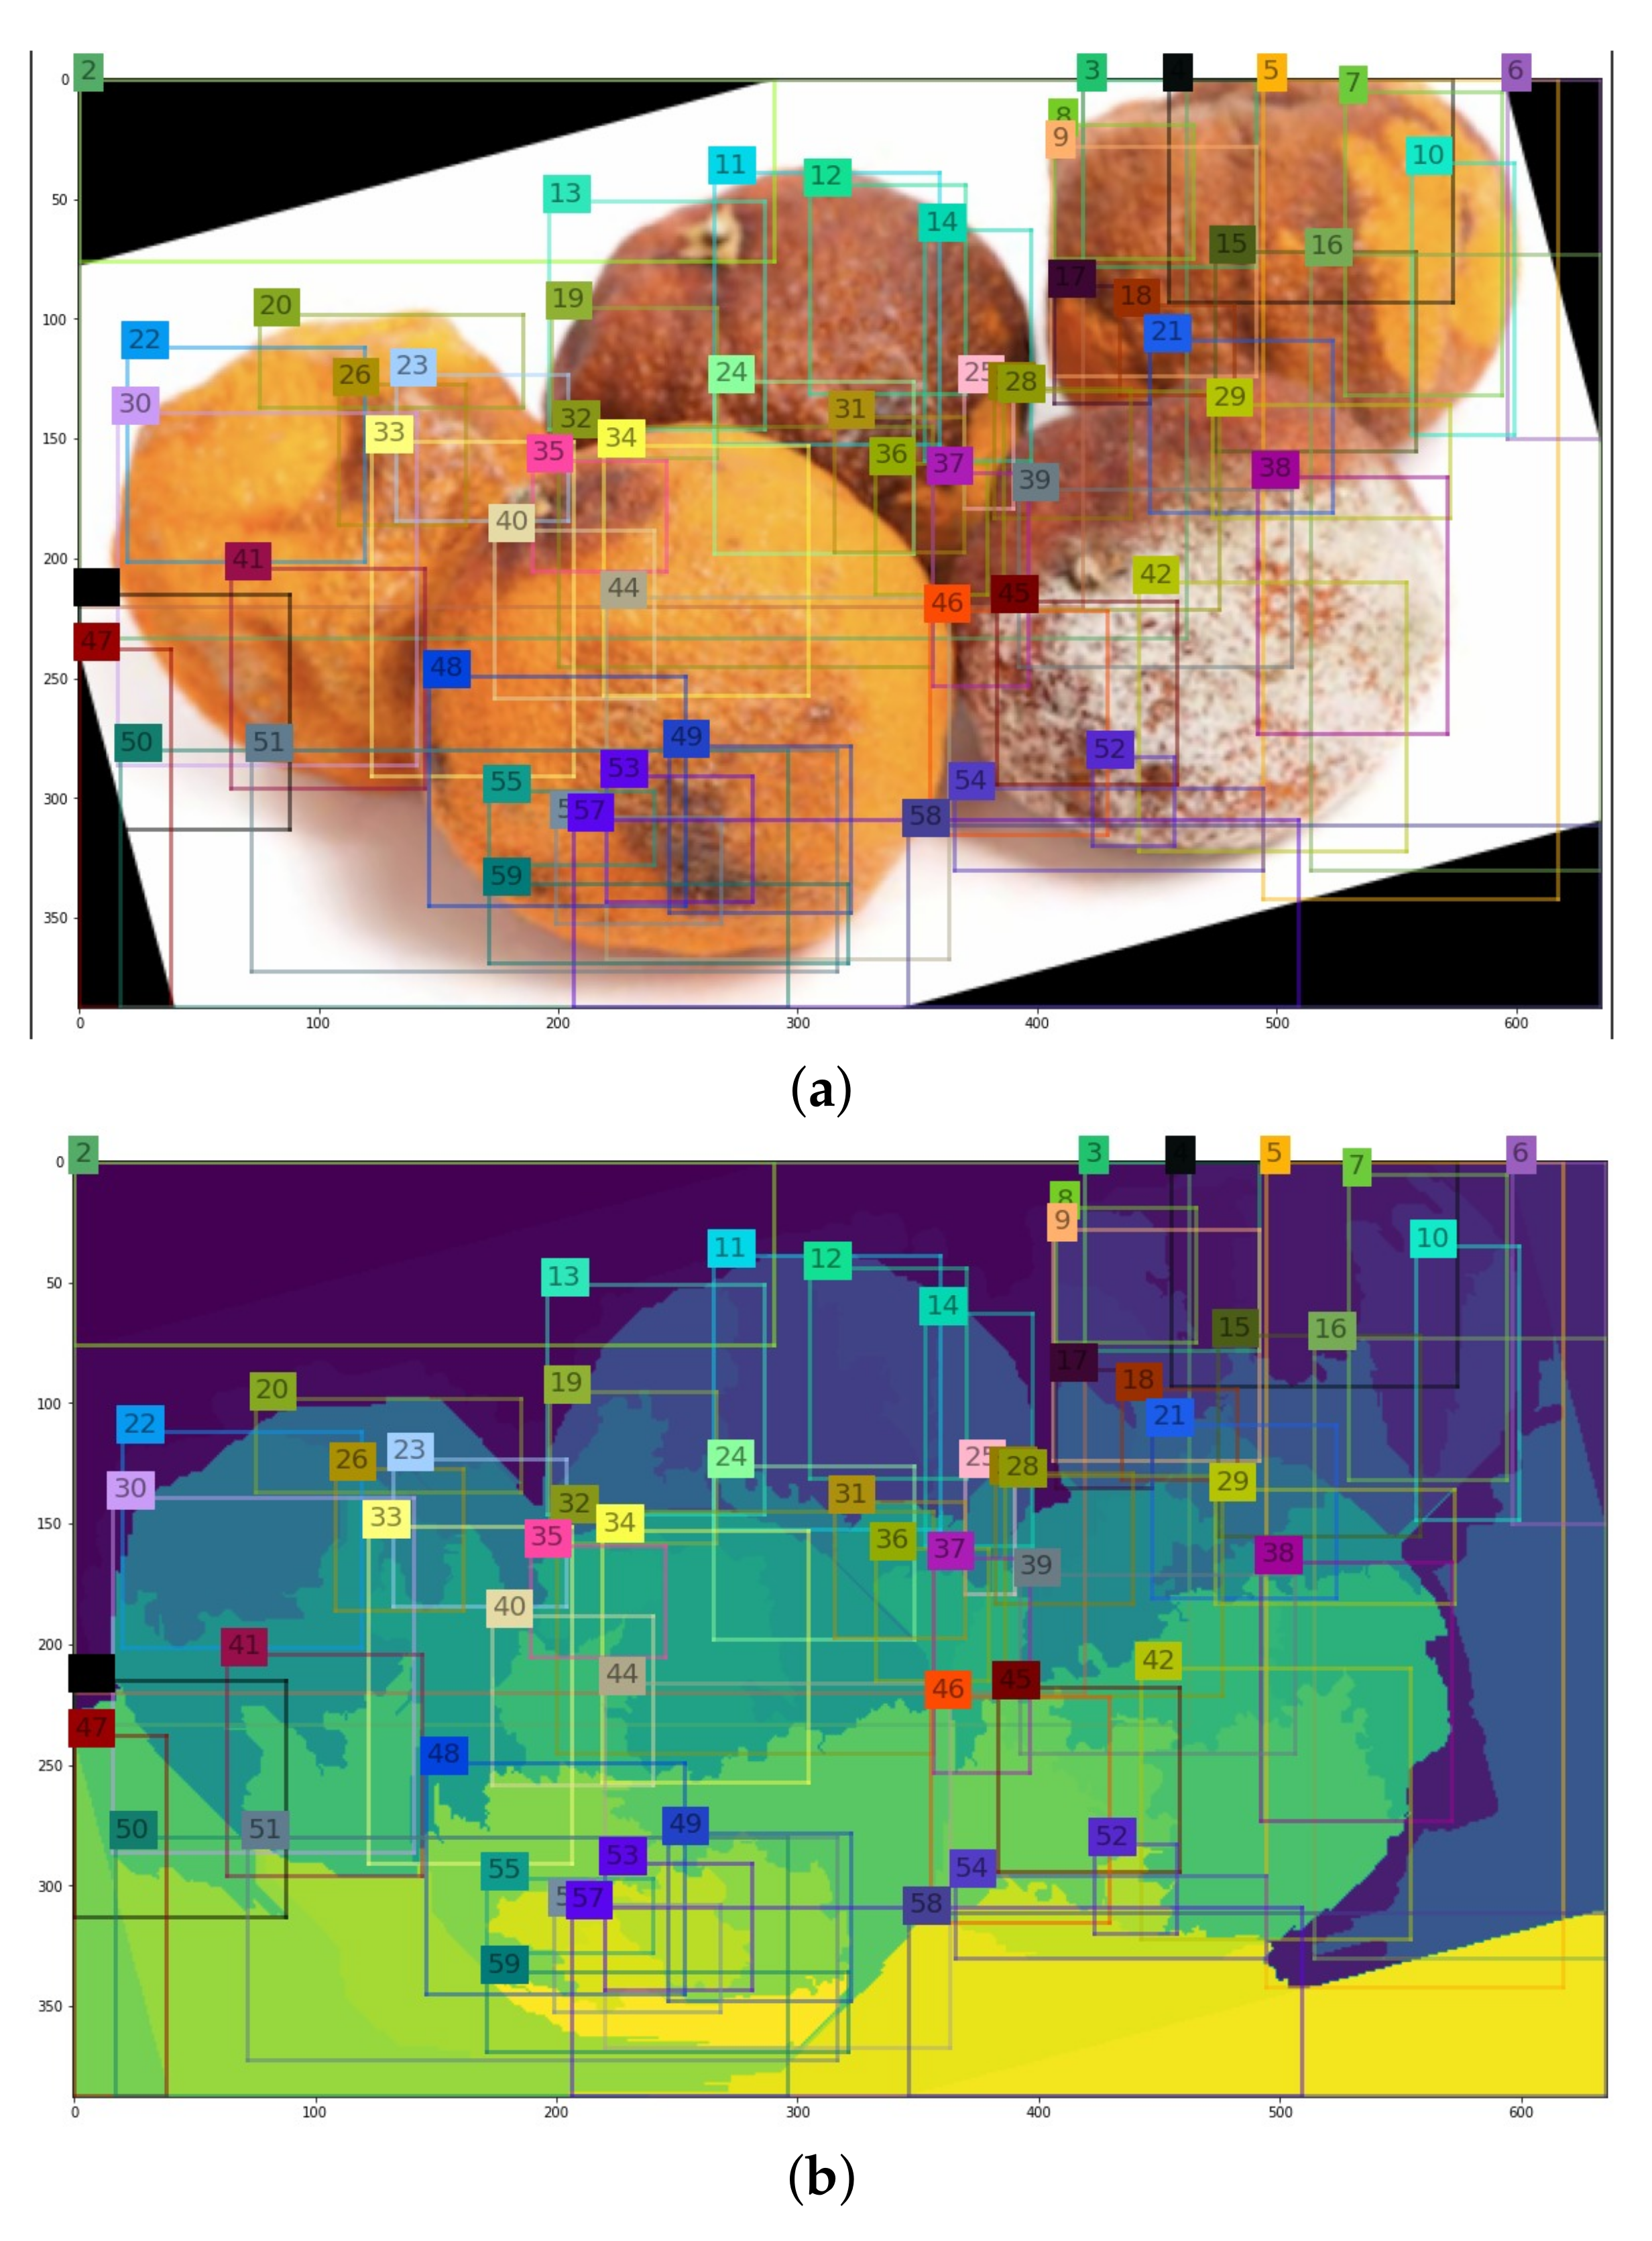
(10)
Augment regions with histogram parameters and return region proposal.
(11)
Repeat step 13 and 14 for neighboring pair of regions r α , r β .
(12)
(Compute similarity Sim r α , r β = colour similarity Sim color r α , r β + texture similarity Sim texture r α , r β + size similarity Sim size r α , r β + fill similarity Sim f i l l r α , r β .
(13)
Merge regions, in order ( S i m r α , r β , R).
(14)
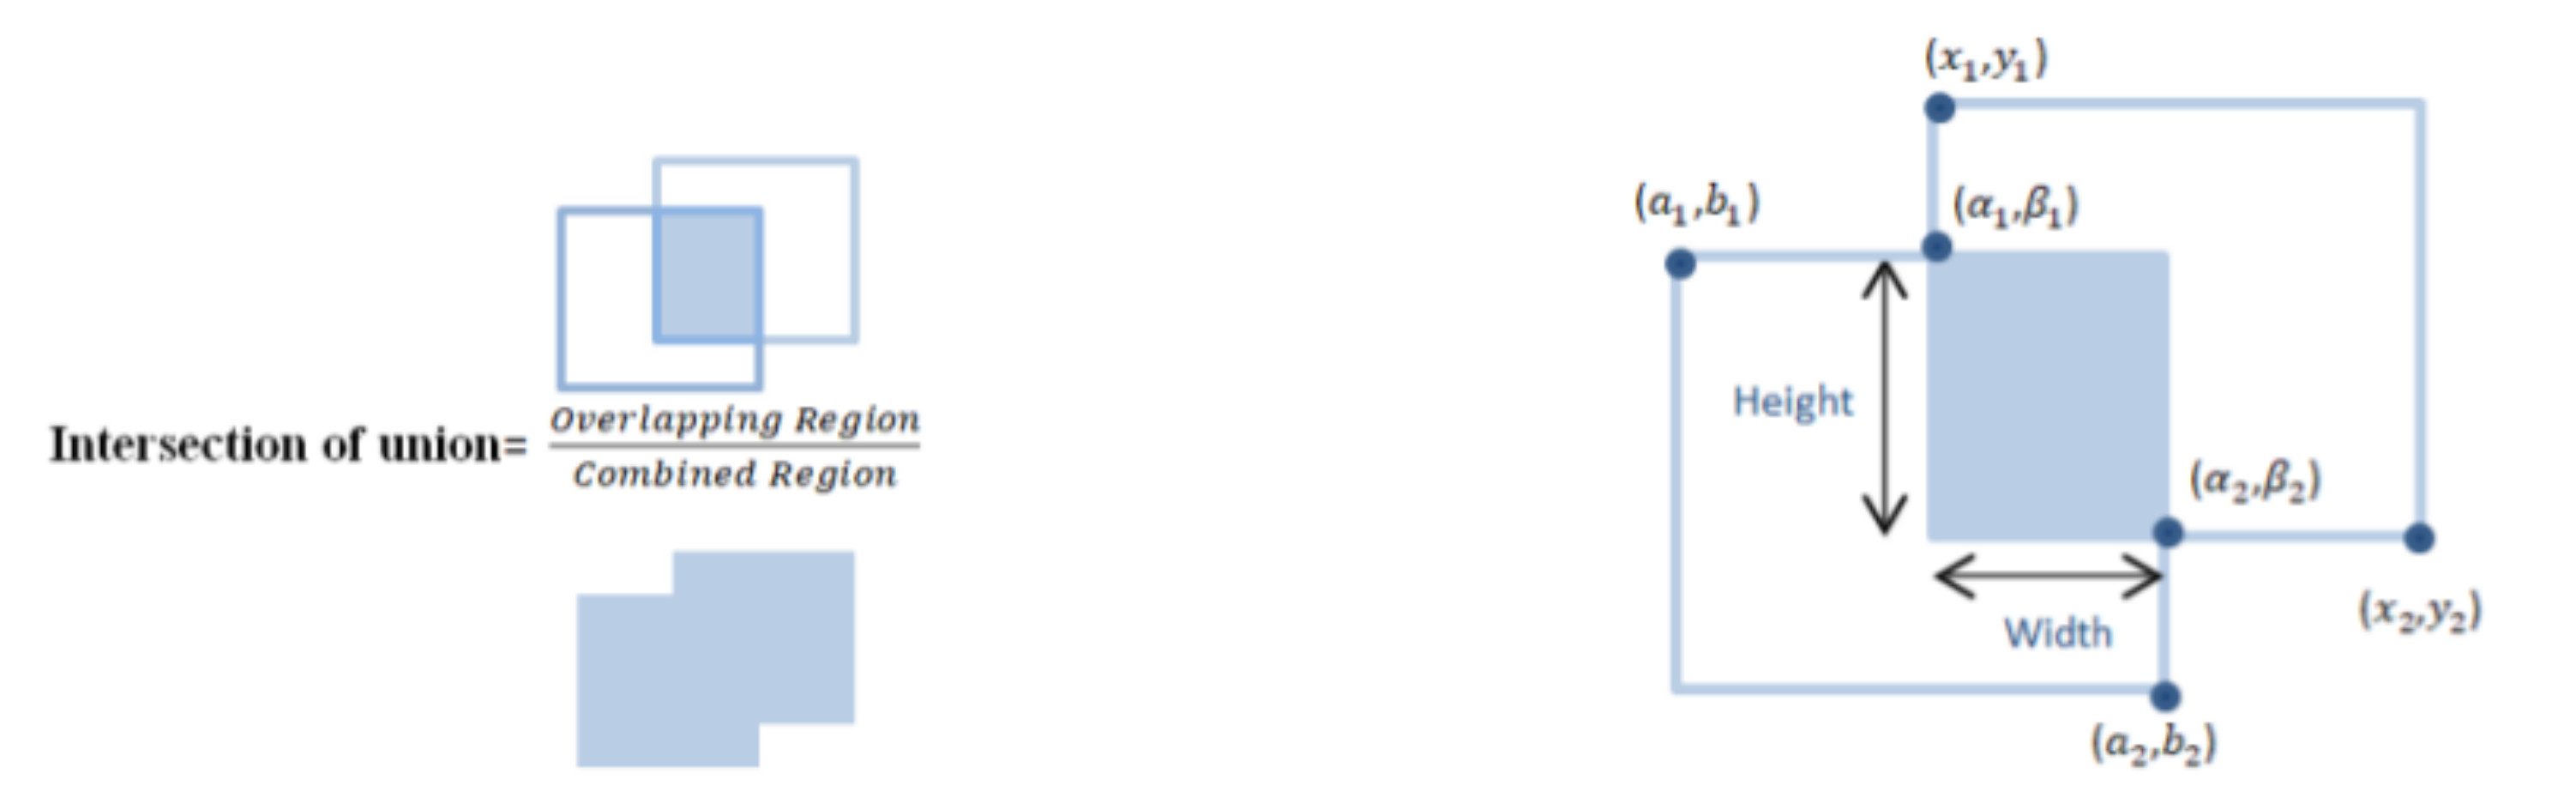
Calculate IOU for regions.
The precision of object detection highly affects the disease and severity recognition accuracy so a robust automatic detection system is proposed using image processing techniques. This algorithm was used to perform the preprocessing and object identification task for different disease locations and severity of disease present in citrus fruits. Graph-based segmentation was implemented to obtain the region proposal of each image. The above steps of the algorithm were implemented to obtain the region proposal and object detection was performed.

3.4. Steps of Selective Search to Obtain the Region Proposal

Initial regions were generated using Felzenszwalb’s graph-based segmentation approach. The results after implementation are represented in Figure 2.
The next step was to add labels to the segmented regions of the image [18]. Visualization of labels output after Felzenszwalb segmentation is shown in Figure 3.
After segmentation, a great deal of useless labels or labels are generated belonging to one object. The next step is to group labels that belong to one object based on the most similar regions. For this grouping, Local Binary Pattern (LBP) was implemented [19]. To capture the texture similarities of the initial regions, for each initial region, LBP features were calculated. The calculated texture gradient for an entire image was computed and the results are shown in Figure 4.
Next, we collected the RGB values on a scale of 0 to 1, the highest and lowest RGB values, as well as the point of difference, by following Equations (1) to (6).
R = r 255 , G = g 255 , B = b 255 .
V max = MAX ( R , G , B ) .
V min = MIN ( R , G , B ) .
δ = V m a x V m i n .
H hue = 60 G B δ mod 6 , Vmax = R 60 B R δ + 2 , Vmax = G 60 R G δ + 4 , Vmax = B
S saturation = 0 , δ = 0 δ V max , δ 0 V = V max
The Hue Saturation Value (HSV) format symbolizes how paints of multiple colors blend altogether, with the saturation component also representing different intensities of vibrantly colored paints and the value component representing the combination of each of these paints with different ratios of black or white paints [20]. Figure 5 represents an HSV image with calculated min–max values.
The sum of the histogram intersection of color S i m c o l o r r α , r β was calculated to measure the color similarity. One-dimensional color histograms were derived for individual color channels for each region using 25 bins, which was found to be effective. Three RGB color channels resulted in a color histogram with dimensions d = 75 for each region. The L1 norm was used to normalize the color histograms. The histogram intersection was used to determine the similarity using Equation (7).
S i m c o l o r r α , r β = l = 1 d = 75 m i n ( c h i s t α l , c h i s t β l ) .
The color histograms can be efficiently propagated through the hierarchy by using the following Equation (8).
c h i s t = s i z e r α     c α + s i z e ( r β ) c β s i z e r α + s i z e ( r β ) .
The sum of the histogram intersection of texture S i m t e x t u r e r α , r β was calculated to measure the texture similarity. The L1 norm was adopted to normalize the texture histograms. In Equation (9), the histogram intersection is used to determine similarity:
S i m t e x t u r e r α , r β = l = 1 d m i n ( t h i s t α l , t h i s t β l ) .
Next, we calculated the image’s size similarity S i m s i z e r α , r β , which promotes the rapid fusion of tiny regions. This constrains the size of regions in S, i.e., regions that have not yet been merged, throughout the procedure. This is also advantageous since it enables the generation of object locations at all scales throughout the image. For instance, it inhibits an individual region from devouring most other regions one after the other, giving all scales exclusively at the location of this developing region. S i m s i z e r α , r β is defined as the percentage of the image that r α and r β collectively inhabit, whereas s i z e i m g specifies the image’s pixel size in Equation (10):
S i m s i z e r α , r β = s i z e r α + s i z e ( r β ) s i z e i m g .
Following this, we computed the fill similarity throughout the image. S i m f i l l r α , r β determines how effectively the regions r α and r β fit together. The goal is to fill up the gaps: if r α is included in r β , it is reasonable to merge them first to prevent any gaps. If r α and r β are barely touching one another, they would most certainly form an odd region and should not be combined. Only the sizes of the regions and the enclosed boxes are incorporated in order to ensure a quick evaluation. In particular, we defined B B o x α β as the compact bounding box encompassing r α and r β . S i m f i l l r α , r β therefore represents the proportion of the image in B B o x α β that is not covered by the regions of r α and r β in Equation (11).
S i m f i l l r α , r β = s i z e B B o x α β s i z e r α s i z e ( r β ) s i z e i m g .
Then, we retrieve a list of regions that intersect. We calculate the similarities between each pair of neighboring regions and then produce the sum of the regions’ similarities using Equation (12). We obtain the total of two regions’ similarity, which is a composite of the four types of similarity mentioned previously.
S i m r α , r β = S i m c o l o r r α , r β + S i m t e x t u r e r α , r β + S i m s i z e r α , r β + S i m f i l l r α , r β .
We next calculate the similarity of all regions using Equation (13).
S i m o v e r a l l = i j = n N S i m r α , r β .
Next, we merge the regions and then remove already merged regions and calculate a new similarity value. The following steps should be followed in order to merge the regions.
Merge regions in order s (ri, r j, R)
(1)
Retrieve the pair of regions with the highest degree of similarity from the similarity dictionary.
(2)
Merge the region pairs and add them to the dictionary of regions.
(3)
Eliminate all pairs of regions from the similarity dictionary in which one of the regions is defined in step 1.
(4)
Determine the degree of similarity between the newly combined region and the regions and their intersecting regions (intersecting region is the region that is to be deleted).
return (regions)

3.5. Intersection of Union on Overlapped Region

To train a classifier using CNN features as input, we require ground truth labels for each candidate region. However, there is a quandary over how to identify a region that partially overlaps when a portion of the fruit is included. To address this issue, an overlap threshold value will be used below which regions will be regarded as negatives. Intersect over Union (IoU) is a frequently used metric for determining the similarity of the projected bounding box to the ground truth bounding box using Equations (14)–(16). The aim is to examine the area of overlap between two boxes to the cumulative area of the two boxes [21,22]. Figure 6 shows the region of Intersection over Union.
α 1 , β 1 = max a 1 , max x 1 .
α 2 , β 2 = min b 2 , min x 2 .
Overlapping region = width height Else Overlapping region = 0
Combined region = Area of ( Box 1 ) + Area of ( Box 2 ) Overlapping Region .
Training features are created and ground truth is divided into 4 pickled objects that contain candidate regions with an IoU > 0.75. The same object can have a large number of small candidate regions that hardly provide new information, so, for each object, only the candidate region will be chosen. Other pickled objects correspond to the particular object captured in the first object. The remaining two picked objects contain all the candidate regions that do not contain a citrus fruit object, i.e., IoU < 0.4, and information regarding the particular object that was not captured in the first object.

3.6. Warp the Regions Proposed by the Selective Search

To calculate features for a region proposal, the transformation of image samples in the region into a form that is compatible with the CNN is required [23]. All pixels in a tight bounding box around the candidate region are warped to the desired size irrespective of its size or aspect ratio. We elongate the tight bounding box before to warping so that there are exactly p pixels of warped image across the original box (we use p = 16). VGG16 specifies that the image must have the dimensions (height, width, Nchannel) = (224, 224, 3). The region proposal given by the selective search often does not correspond to the image with the dimensions 224 in height and width. Thus, all pixels in the region proposal need to be warped to the CNN’s input size.

3.6.1. Feature Extraction

Using VGGNet16, a 4096-feature map is extracted from each region proposal. VGGNet is the current state of the art, with advanced and efficient identification capabilities, and it is frequently used for transfer learning due to its portability. Only 3 × 3 convolutions are used by VGGNet. VGGNet, on the other hand, contains many extra filters [24]. It has 16 layers, each with its own set of trainable weights. It is now the most popular method for obtaining features from images. VGGNet’s weight composition is open to the public. VGGNet is only used for feature extraction and not for classification purposes. For classification, the last three layers were removed from the network. Forward propagation of a mean-subtracted RGB 227 × 227 image through 5 convolution layers and 2 fully connected dense layers is used to compute features.

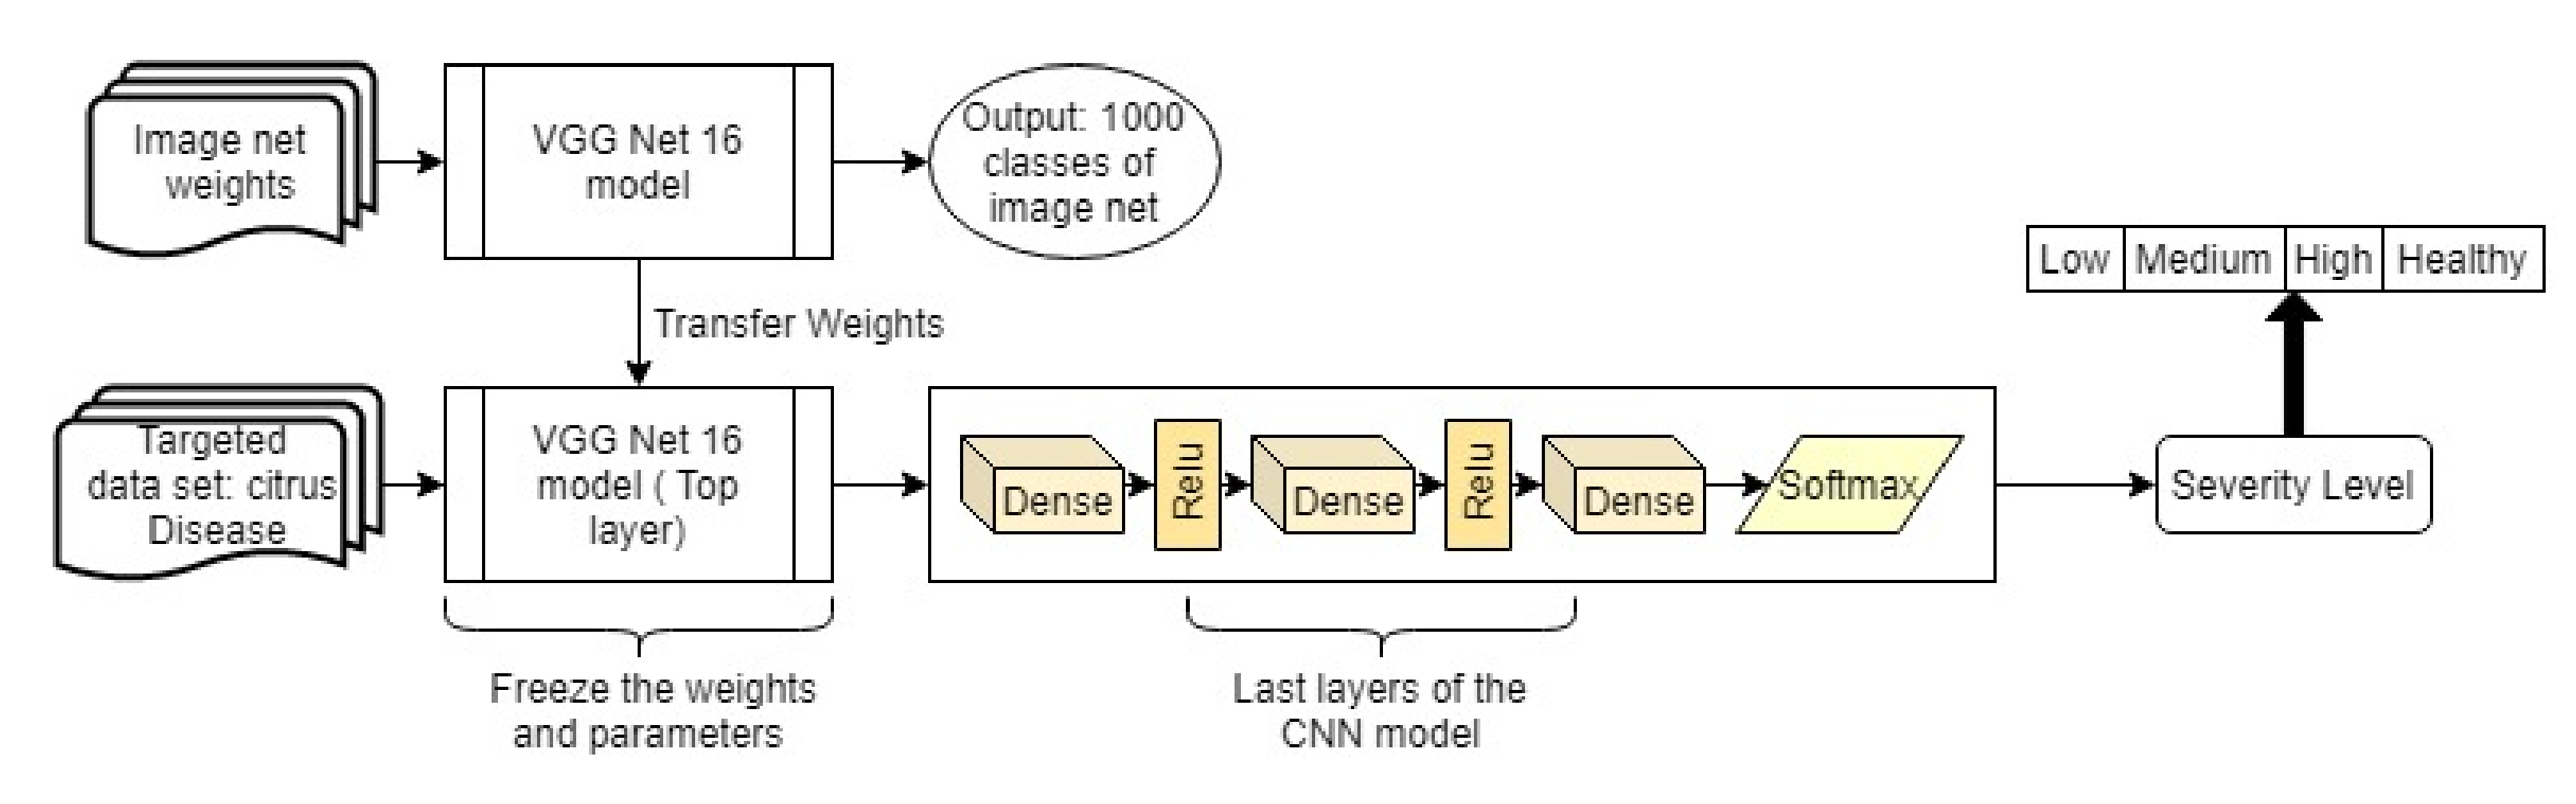
3.6.2. Transfer Learning
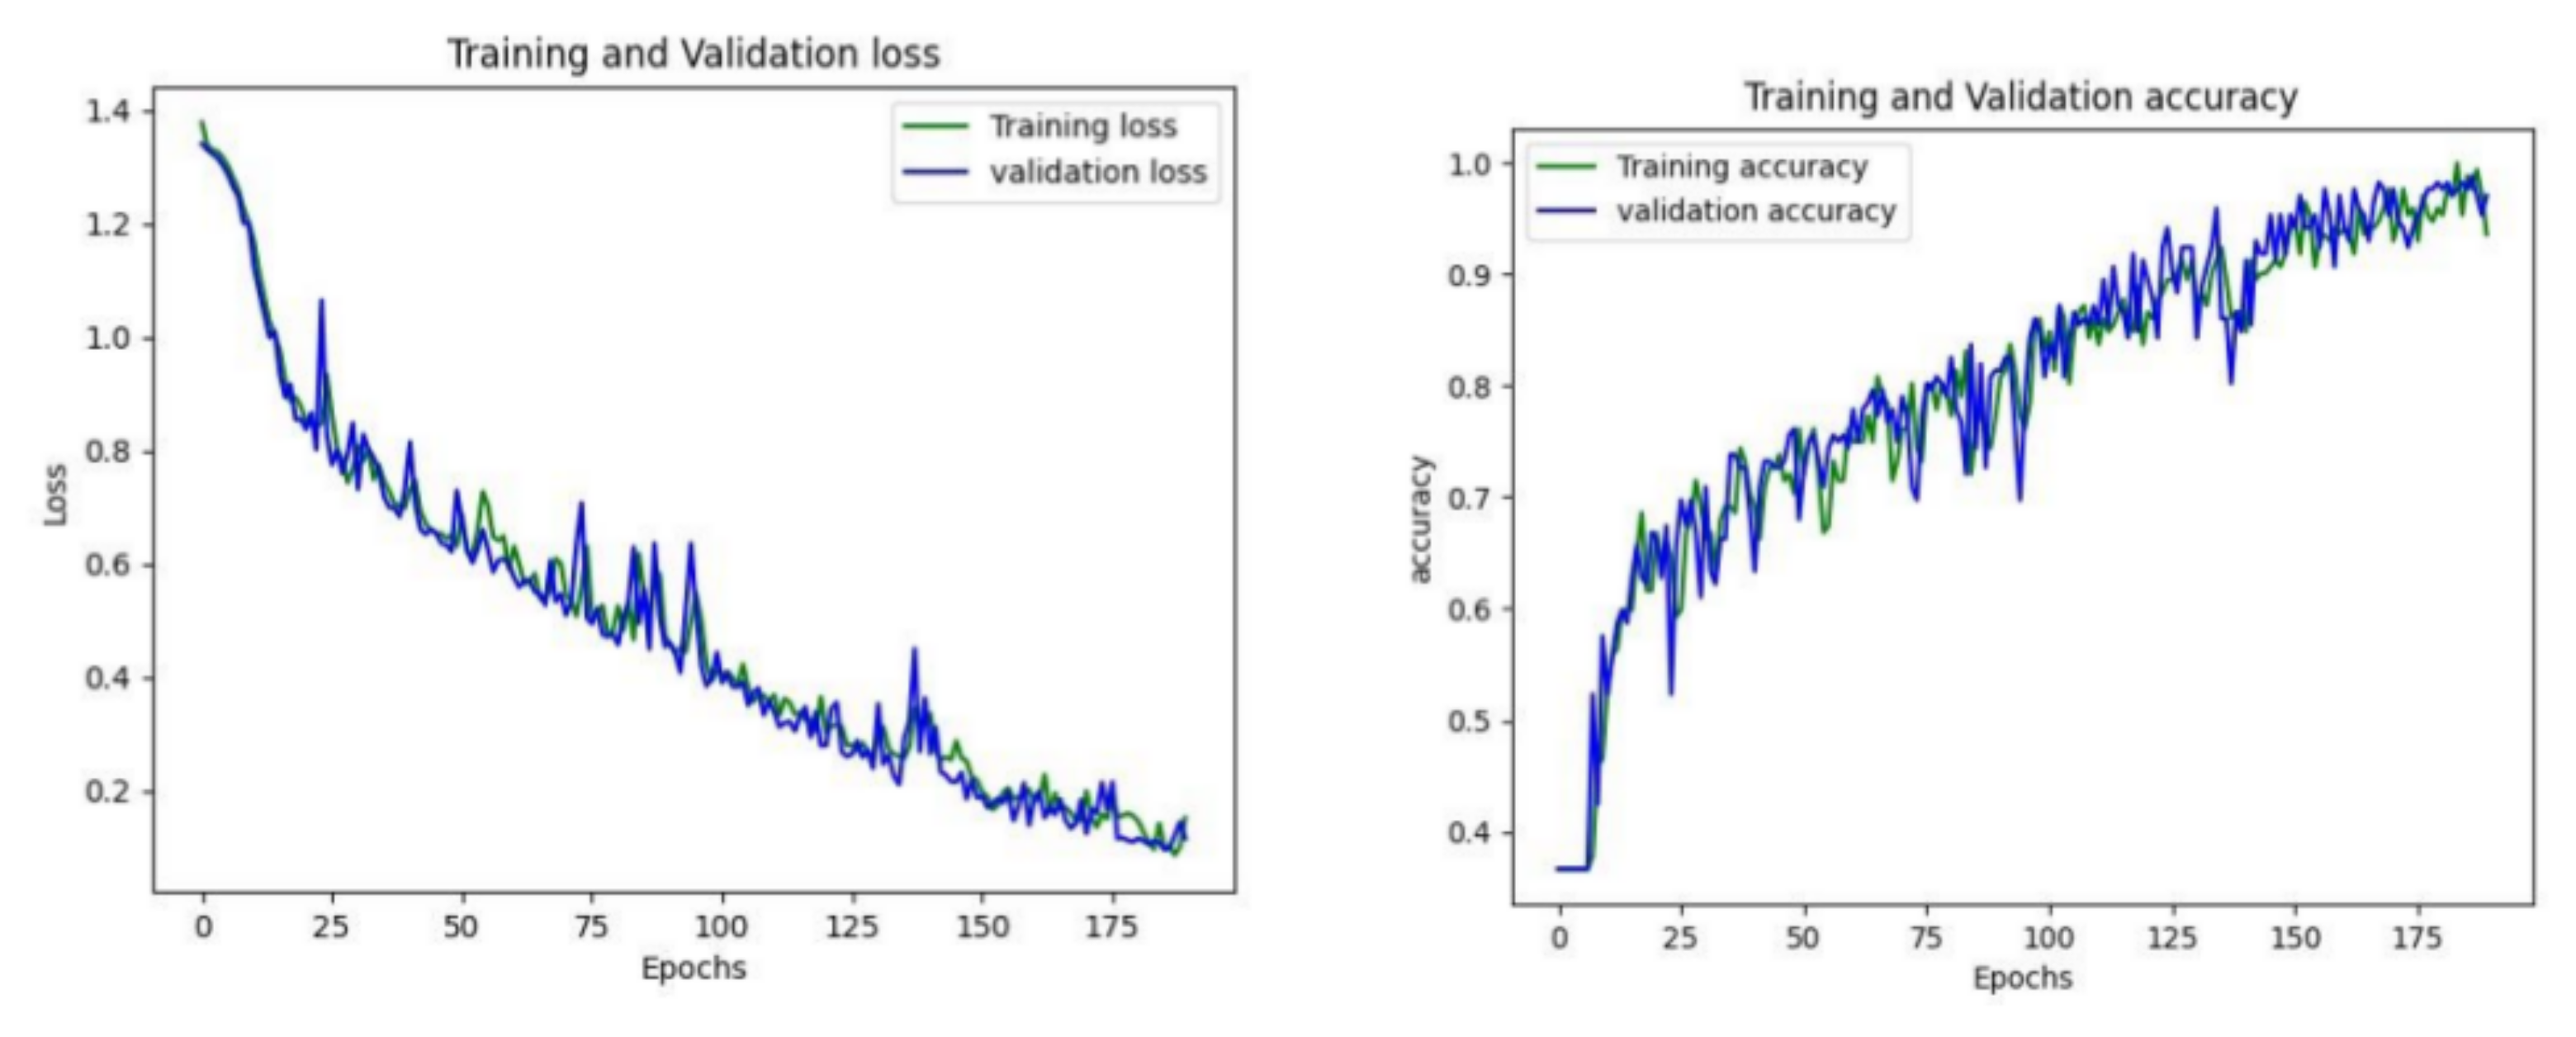
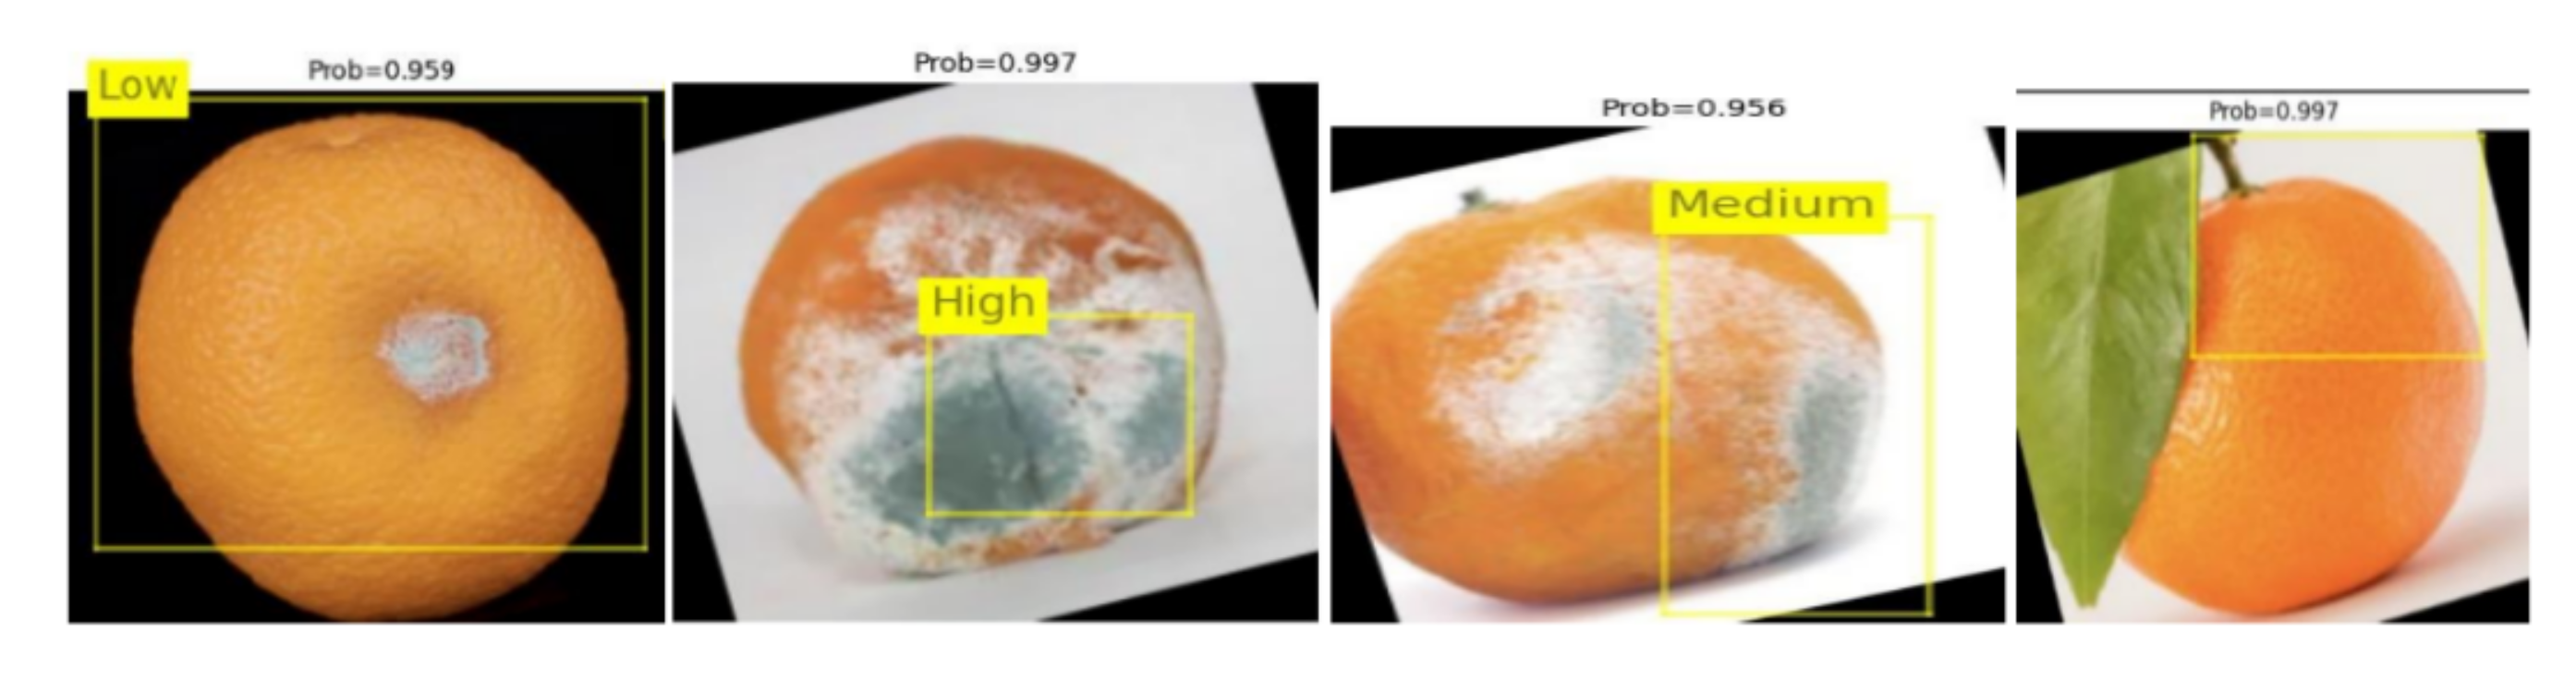
Transfer learning is a powerful approach to machine learning that makes CNNs to learn for one goal and they are repurposed as the foundation for a model on a different task. Despite initiating the training from scratch by arbitrarily instantiating the weights, a pre-trained network can be used to initialize the weights on large labeled datasets such as public datasets [25]. The ImageNet project is a massive visual database designed for use in the development of visual object recognition [26]. In this article, leveraging a pre-trained model is investigated from the enormous ImageNet dataset, which is then used to a obtain the severity trained on the citrus fruit dataset. The following are the key processes of the transfer learning technique. The proposed model using transfer learning is shown in Figure 7.
The first step is to determine the base networks of the transfer learning and assign the network’s weights by using the pre-trained CNN model. These weights are available for download from an online source. Then, we reconstruct the network structure by manipulating the bottom layers of the network. A new modified network structure can be obtained using this approach. The newly constructed networks can then be fine-tuned in order to minimize the loss function using the dataset and associated labels. Specifically, the Adaptive Moment Estimation (Adam) algorithm is used to determine the optimized weights with control of the loss function using sparse categorical cross-entropy as a loss function. Thus, for transfer learning, a VGGNet pre-trained model was used on ImageNet, and a sequential CNN model was used to train the newly updated neural networks using the citrus fruit datasets. The method offers the features of VGGNet with a sequential CNN. From the initial layers, i.e., b l o c k 1 _ c o v 1 to FC1(Dense) are from the VGGNet.Dense, D e n s e _ 1 , D e n s e _ 2 is substituted with the sequential CNN model. Lastly, a softmax classifier is used for multi-classification of the severity classes of citrus disease. Thus, the new model generally consists of two sections, in which the first section is the pre-trained model and the other section contains the perpetuated layers employed on a multi-scale feature vector for multi-classification. Table 2 lists the parameters of the implemented deep learning model.

4. Result Analysis

The training accuracy is the percentage of the correctly defined data samples in the training set. Similarly, the validation accuracy refers to the percentage of the correctly elucidated data samples from some of the other samples. The dataset is divided into two sets, one set comprising images for training and other for validation. The 80–20 cross-validation process is used to train and validate the model. For validation, multiple investigations are carried out with shuffled images [26]. New, randomly selected images are used to test the efficiency of the model. Sparse categorical cross-entropy for the loss function was used to determine the classification model’s performance. The overall training accuracy achieved by the model is 95%. The Adam optimizer is selected for the model to optimize the cross-entropy function [27]. The result of the implemented convolution neural network model on randomly selected test images was analyzed and represented as a confusion matrix, as shown in Table 3. Figure 8 depicts the classification accuracy and loss gained after the training and validation process of the model.
Out of the four levels of disease severity of the citrus fruits, the model is able to predict the low severity level with accuracy of 99%, precision of 100%, recall 84% and an F1 score of 91%. For high severity levels of the disease, our model recorded accuracy of 98% when compared to other classes. For the detection of healthy conditions, the model displays 96% accuracy, and it shows 97% accuracy in the case of the medium severity level. The accuracy, precision, recall and F1 score calculated for each severity level of the citrus fruit disease are listed in Table 4.
Figure 9 depicts some of the graphical outcomes of the proposed automatic disease recognition system. The results demonstrate that the accuracy of the disease severity level of citrus fruits was assessed as low severity (95.9%), high severity (99.7%), medium severity (95.6%) and healthy (99.7%). As demonstrated in Figure 9, our system can efficiently diagnose the image dataset with four severity levels of disease, and has been compared to expert manual evaluation. The results reveal that disease severity identification is quite accurate and falls within the domain experts’ acceptable range.

5. Conclusions

Fruit diseases are the most serious threats to global agricultural progress, and they have a strong influence on food safety. As a result, automatic diagnosis of citrus fruit diseases is increasingly desirable in analytics. Deep learning approaches, specifically CNNs, have demonstrated an encouraging ability to resolve the majority of the difficult classification problems. Transfer learning for deep CNNs is investigated in this research with the goal of improving the learning ability of obtaining the severity level, and a sequential VGGNet16 architecture is developed for the diagnosis of four severity levels of the disease present in citrus fruit. The pre-trained VGGNet16 is updated by substituting its bottom layers with an extended convolutional layer that includes a dense layer with ReLu activation and sparse categorical cross-entropy for the loss function used to determine the classification model’s performance. The Adam optimizer is selected for the model to optimize the cross-entropy function. Lastly, a fully connected softmax layer was inserted as the classification layer in order to obtain the four severity levels of the disease. Test accuracy achieved on randomly selected images for healthy, low level, high level and medium levels of disease was 96%, 99%, 98% and 97%.

Author Contributions

Conceptualization, P.D. and V.K.; methodology, A.K. and M.M.K.; software, I.B.D. and C.I.; validation, P.D. and V.K.; formal analysis, P.D. and V.K.; investigation, I.B.D. and C.I.; data curation, I.B.D. and C.I.; writing—original draft preparation, P.D. and V.K.; writing—review and editing, P.D. and V.K.; funding acquisition, P.M. All authors have read and agreed to the published version of the manuscript.

Funding

This research received no external funding.

Institutional Review Board Statement

Not applicable.

Informed Consent Statement

Not applicable.

Data Availability Statement

Not applicable.

Acknowledgments

The authors would like to thank Deanship of Scientific Research at Jouf University for partly supporting this project under grant No (DSR 2021 02 0339).

Conflicts of Interest

The authors declare no conflict of interest.

References

  1. Food and Agriculture Organisation of the United States. Food and Agriculture Data. Available online: http://www.fao.org/faostat/en/#home (accessed on 15 July 2021).
  2. Cubero, S.; Lee, W.S.; Aleixos, N.; Albert, F.; Blasco, J. Automated Systems Based on Machine Vision for Inspecting Citrus Fruits from the Field to Postharvest-a Review. Food Bioprocess Technol. 2016, 9, 1623–1639. [Google Scholar] [CrossRef] [Green Version]
  3. Taylor, P. Critical Reviews in Plant Sciences Plant Disease Severity Estimated Visually, by Digital Photography and Image Analysis, and by Hyperspectral Imaging Plant Disease Severity Estimated Visually, by Digital Photography and Image Analysis, and by Hyperspe. CRC Crit. Rev. Plant Sci. 2010, 29, 37–41. [Google Scholar]
  4. Han, L.; Haleem, M.S.; Taylor, M. A Novel Computer Vision-based Approach to Automatic Detection and Severity Assessment of Crop Diseases. 2015. Available online: https://ieeexplore.ieee.org/document/7237209/ (accessed on 20 December 2021).
  5. Metin, M.; Adem, K. Automatic detection and classification of leaf spot disease in sugar beet using deep learning algorithms. Physica A 2019, 535, 122537. [Google Scholar]
  6. Lorente, D.; Escandell-Montero, P.; Cubero, S.; Gómez-Sanchis, J.; Blasco, J. Visible-NIR reflectance spectroscopy and manifold learning methods applied to the detection of fungal infections on citrus fruit. J. Food Eng. 2015, 163, 17–24. [Google Scholar] [CrossRef]
  7. Lan, Y. Comparison of machine learning methods for citrus greening detection on UAV multispectral images. Comput. Electron. Agric. 2020, 171, 105234. [Google Scholar] [CrossRef]
  8. Stegmayer, G.; Milone, D.H.; Garran, S.; Burdyn, L. Automatic recognition of quarantine citrus diseases. Expert Syst. Appl. 2013, 40, 3512–3517. [Google Scholar] [CrossRef] [Green Version]
  9. Jahanbakhshi, A.; Momeny, M.; Mahmoudi, M.; Zhang, Y.D. Classification of sour lemons based on apparent defects using stochastic pooling mechanism in deep convolutional neural networks. Sci. Hortic. 2020, 263, 109133. [Google Scholar] [CrossRef]
  10. Lopez, J.J.; Aguilera, E.; Cobos, M. Defect detection and classification in citrus using computer vision. In Proceedings of the International Conference on Neural Information Processing, Bangkok, Thailand, 1–5 December 2009; pp. 11–18. [Google Scholar]
  11. Lorente, D.; Aleixos, N.; Gómez-Sanchis, J.; Cubero, S.; Blasco, J. Selection of Optimal Wavelength Features for Decay Detection in Citrus Fruit Using the ROC Curve and Neural Networks. Food Bioprocess Technol. 2011, 6, 530–541. [Google Scholar] [CrossRef] [Green Version]
  12. Binary v1.8.1. Available online: https://github.com/tzutalin/labelImg/releases/tag/v1.8.1 (accessed on 20 December 2021).
  13. Behera, S.K.; Jena, L.; Rath, A.K.; Sethy, P.K. Disease Classification and Grading of Orange Using Machine Learning and Fuzzy Logic. In Proceedings of the IEEE International Conference on Communication and Signal Processing, Singapore, 28–30 September 2018; pp. 678–682. [Google Scholar] [CrossRef]
  14. Hafiz, T.R.; Basharat, A.S.; Ullah Lali, M.I.; Khan, A.; Sharif, M.; Chan Bukhari, S.A. A Citrus Fruits and Leaves Dataset for Detection and Classification of Citrus Diseases through Machine Learning. Available online: https://data.mendeley.com/datasets/3f83gxmv57/2 (accessed on 20 December 2021).
  15. Available online: https://www.kaggle.com/sriramr/fruits-fresh-and-rotten-for-classification (accessed on 20 December 2021).
  16. Yang, H.; Zhou, J.T.; Zhang, Y.; Gao, B.; Wu, J.; Cai, J. Exploit bounding box annotations for multi-label object recognition. In Proceedings of the IEEE Computer Society Conference on Computer Vision and Pattern Recognition, Las Vegas, NV, USA, 27–30 June 2016; pp. 280–288. [Google Scholar]
  17. Garfinkel, S.L. Automating disk forensic processing with SleuthKit, XML and python. In Proceedings of the 2009 Fourth International IEEE Workshop on Systematic Approaches to Digital Forensic Engineering, Berkeley, CA, USA, 21 May 2009; pp. 73–84. [Google Scholar]
  18. Uijlings, A.W.; Sande, J.R.V.D.; Gevers, K.E.; Smeulders, T. Selective Search for Object Recognition. Int. J. Comput. Vis. 2012, 104, 154–171. [Google Scholar] [CrossRef] [Green Version]
  19. Ojala, T.; Pietikainen, M.; Maenpaa, T. Multiresolution Gray-Scale and Rotation Invariant Texture Classification with Local Binary Patterns. IEEE Trans. Pattern Anal. Mach. Intell. 2002, 24, 971–987. [Google Scholar] [CrossRef]
  20. Saravanan, G.; Yamuna, G.; Nandhini, S. Real time implementation of RGB to HSV/HSI/HSL and its reverse color space models. In Proceedings of the 2016 International Conference on Communication and Signal Processing (ICCSP), Melmaruvathur, India, 24 November 2016; pp. 462–466. [Google Scholar]
  21. Chen, J.W.; Lin, W.J.; Cheng, H.J.; Hung, C.L.; Lin, C.Y.; Chen, S.P. A smartphone-based application for scale pest detection using multiple-object detection methods. Electron 2021, 10, 1. [Google Scholar] [CrossRef]
  22. Jiang, B.; Luo, R.; Mao, J.; Xiao, T.; Jiang, Y. Acquisition of localization confidence for accurate object detection. In Proceedings of the European Conference on Computer Vision (ECCV), Munich, Germany, 8–14 September 2018; pp. 784–799. [Google Scholar]
  23. Girshick, R.; Donahue, J.; Darrell, T.; Malik, J.; Berkeley, U.C.; Malik, J. Rich feature hierarchies for accurate object detection and semantic segmentation. In Proceedings of the IEEE Conference on Computer Vision and Pattern Recognition, Columbus, OH, USA, 23–28 June 2014; pp. 580–587. [Google Scholar]
  24. Wang, Q.; Qi, F.; Sun, M.; Qu, J.; Xue, J. Identification of Tomato Disease Types and Detection of Infected Areas Based on Deep Convolutional Neural Networks and Object Detection Techniques. Comput. Intell. Neurosci. 2019, 2019, 9142753. [Google Scholar] [CrossRef] [PubMed]
  25. Wimmer, G.; Vécsei, A.; Uhl, A. CNN transfer learning for the automated diagnosis of celiac disease. In Proceedings of the 2016 Sixth International Conference on Image Processing Theory, Tools and Applications (IPTA), Oulu, Finland, 12–15 December 2016. [Google Scholar] [CrossRef]
  26. Chen, J.; Chen, J.; Zhang, D.; Sun, Y.; Nanehkaran, Y.A. Using deep transfer learning for image-based plant disease identification. Comput. Electron. Agric 2020, 173, 105393. [Google Scholar] [CrossRef]
  27. Bock, S.; Weis, M. A Proof of Local Convergence for the Adam Optimizer. In Proceedings of the 2019 International Joint Conference on Neural Networks (IJCNN), Budapest, Hungary, 14–19 July 2019. [Google Scholar]
Figure 1. The overall process of detection of the citrus fruit disease severity levels.
Electronics 11 00495 g001
Figure 2. Original image and segmented image sample of citrus fruit.
Electronics 11 00495 g002
Figure 3. (a) Labels on original image and on Felzenszwalb-segmentated image; (b) Felzenszwalb-segmented image.
Electronics 11 00495 g003
Figure 4. Texture gradient for LBP feature.
Electronics 11 00495 g004
Figure 5. HSV image with min–max values.
Electronics 11 00495 g005
Figure 6. Intersection of Union on overlapped region.
Electronics 11 00495 g006
Figure 7. Proposed CNN model with transfer learning.
Electronics 11 00495 g007
Figure 8. Loss and accuracy curves of the implemented model.
Electronics 11 00495 g008
Figure 9. Result showing four levels of severity in image samples.
Electronics 11 00495 g009
Table 1. Citrus sample counts in training and testing.
ClassesSample Count for
Training
Sample Count for
Testing
Healthy1173293
Low Severity737184
Middle Severity774194
High Severity625156
Table 2. The related parameters of the implemented model.
LayerLayer TypeKernel
Size
StrideNeuron
Size
MapsParam #
Block1_conv1Convolutional
layer
3 × 31224 × 22431792
Block1_conv2Convolutional
layer
3 × 31224 × 2246436,928
Block1_poolPooling layer P12 × 22112 × 112640
Block2_conv1Convolutional
layer
3 × 31112 × 1126473,856
Block2_conv2Convolutional
layer C4
3 × 31112 × 112128147,584
Block2_poolPooling layer P22 × 2256 × 561280
Block3_conv1Convolutional
layer
3 × 3156 × 56128295,168
Block3_conv2Convolutional
layer
3 × 3156 × 56256590,080
Block3_conv3Convolutional
layer
3 × 3156 × 56256590,080
Block3_poolPooling layer P32 × 2228 × 282560
Block4_conv1Convolutional
layer
3 × 3128 × 282561,180,160
Block4_conv2Convolutional
layer
3 × 3128 × 2851223,598,038
Block4_conv3Convolutional
layer
3 × 3128 × 2851223,598,038
Block4_poolPooling layer P42 × 2214 × 145120
Block5_conv1Convolutional
layer
3 × 3114 × 1451223,598,038
Block5_conv2Convolutional
layer
3 × 3114 × 1451223598038
Block5_conv3Convolutional
layer
3 × 3114 × 1451223,598,038
Block5_poolPooling layer P52 × 227 × 75120
FlattenFlatten—–—–——25,0880
Fc1 (Dense)——–—–—–——4096102,764,544
Dense (Dense)Sequential CNN—–—–——32131,104
Dense_1 (Dense)Sequential CNN———–——-321056
Dense_2 (Dense)Sequential CNN———–——4132
OutputSoftmax——-——Classifier4—-
Table 3. Confusion matrices for all levels of severity of disease present in citrus fruits.
ClassHealthyLowMediumHigh
Healthy21000
Low02501
Medium30250
High10024
Table 4. Accuracy, precision, recall and F1 score of the model.
ClassAccuracyPrecisionRecallF1 Score
Healthy96%100%84%91%
Low99%96%100%98%
Medium97%89%100%94%
High98%96%96%96%
Publisher’s Note: MDPI stays neutral with regard to jurisdictional claims in published maps and institutional affiliations.

