Using Wearable ECG/PPG Sensors for Driver Drowsiness Detection Based on Distinguishable Pattern of Recurrence Plots


Bio-Intelligence & Data Mining Laboratory, School of Electronics Engineering, Kyungpook National University, Daegu 41566, Korea
*
Author to whom correspondence should be addressed.
Electronics 2019, 8(2), 192; https://doi.org/10.3390/electronics8020192
Submission received: 30 December 2018
/
Revised: 27 January 2019
/
Accepted: 1 February 2019
/
Published: 7 February 2019
(This article belongs to the Special Issue Machine Learning and Embedded Computing in Advanced Driver Assistance Systems (ADAS))
Abstract
:This paper aims to investigate the robust and distinguishable pattern of heart rate variability (HRV) signals, acquired from wearable electrocardiogram (ECG) or photoplethysmogram (PPG) sensors, for driver drowsiness detection. As wearable sensors are so vulnerable to slight movement, they often produce more noise in signals. Thus, from noisy HRV signals, we need to find good traits that differentiate well between drowsy and awake states. To this end, we explored three types of recurrence plots (RPs) generated from the R–R intervals (RRIs) of heartbeats: Bin-RP, Cont-RP, and ReLU-RP. Here Bin-RP is a binary recurrence plot, Cont-RP is a continuous recurrence plot, and ReLU-RP is a thresholded recurrence plot obtained by filtering Cont-RP with a modified rectified linear unit (ReLU) function. By utilizing each of these RPs as input features to a convolutional neural network (CNN), we examined their usefulness for drowsy/awake classification. For experiments, we collected RRIs at drowsy and awake conditions with an ECG sensor of the Polar H7 strap and a PPG sensor of the Microsoft (MS) band 2 in a virtual driving environment. The results showed that ReLU-RP is the most distinct and reliable pattern for drowsiness detection, regardless of sensor types (i.e., ECG or PPG). In particular, the ReLU-RP based CNN models showed their superiority to other conventional models, providing approximately 6–17% better accuracy for ECG and 4–14% for PPG in drowsy/awake classification.
1. Introduction
Driver drowsiness or fatigue is one of main causal factors to many road accidents. Accordingly, as a car safety technology to reduce such accidents, the driver drowsiness detection problem is widely examined [1,2,3], in which various measures are obtainable. The types of measures used in existing studies for driver drowsiness detection include vehicle-based measures, behavioral measures, and physiological measures.
The vehicle-based measures contain wheel position, handle movement, velocity, acceleration, etc. These measures have the advantage of being non-invasive and relatively accurate, but are highly dependent on driver’s driving skills, road conditions, and vehicle characteristics. Moreover, they have some potential risks of taking time in detecting the motion of a vehicle to avoid accidents in real driving situations [4,5,6]. On the other hand, the behavioral measures include driver’s eye state, eye blinking rate, yawning, head movement, and so on. Recently, these measures were widely used with deep learning technology [6,7,8]. These measures are also non-invasive and easy to use, but there are some drawbacks that they are sensitive to camera movement, lighting conditions, and the surrounding environment [1,6,9].
As an alternative or complement to vehicle-based or behavioral measures, physiological measures are currently actively used [2,10], and they contain various biometrical signals (such as heart rate, brain activity, respiration, etc.) acquired from different types of sensors (such as electrocardiogram (ECG), electroencephalogram (EEG), photoplethysmogram (PPG), etc.). In particular, many studies [11,12,13,14,15,16,17] were conducted to analyze heart rate variability (HRV) alone, collected with ECG or PPG sensors, which are relatively simple to measure. For example, Vicente et al. [18] implemented HRV-derived features extracted from ECG signals for drowsiness detection. Kim et al. [16] used various features obtained from PPG and respiration sensors to classify driver drowsiness and awake states. Malik et al. [17] applied a series of instantaneous heart rate (IHR) obtained from ECG and PPG sensors to determine whether a subject is awake or asleep.
Conventional HRV-derived features used in many earlier studies usually focused on spectral changes. Such traits are simple and easy to calculate, but are not good enough to capture nonlinear dynamics of complex systems. To handle nonlinear characteristics of physiological signals like ECG that tend to be nonstationary in nature [10,12,19,20], recurrence plots (RPs) were investigated in several studies [21,22,23]. The RPs were originally introduced by Eckmann et al. [21], and represent the phase-space trajectory of a dynamical system. Since then, they were often used for various studies. Furthermore, recurrence quantification analysis (RQA) measures were derived in References [22,23] to quantify the structures of RPs, and were used for sleep stage classification and obstructive sleep apnea problems [23,24,25]. The RQA features, however, have limited expressiveness for the characteristics of RP. That is, they do not fully represent various changes over time or trends shown in the RP. In light of these drawbacks, it seems worthwhile to identify robust and reliable patterns from RP that are distinguishable between drowsy and awake states. Moreover, people are generally reluctant to using ECG sensors in real driving situations owing to their intrusiveness (i.e., they disturb drivers by attaching many sensors on the body). On the other hand, PPG sensors in band types represent a small, simple, and low-cost device that can monitor the pulse rate in a non-invasive manner [26,27], even if PPG signals are more susceptible to noise than ECG signals. As many PPG wearable sensors are available that are portable and relatively inexpensive, it will be interesting to use them to detect driver fatigue or drowsiness, if possible, in an actual driving environment.
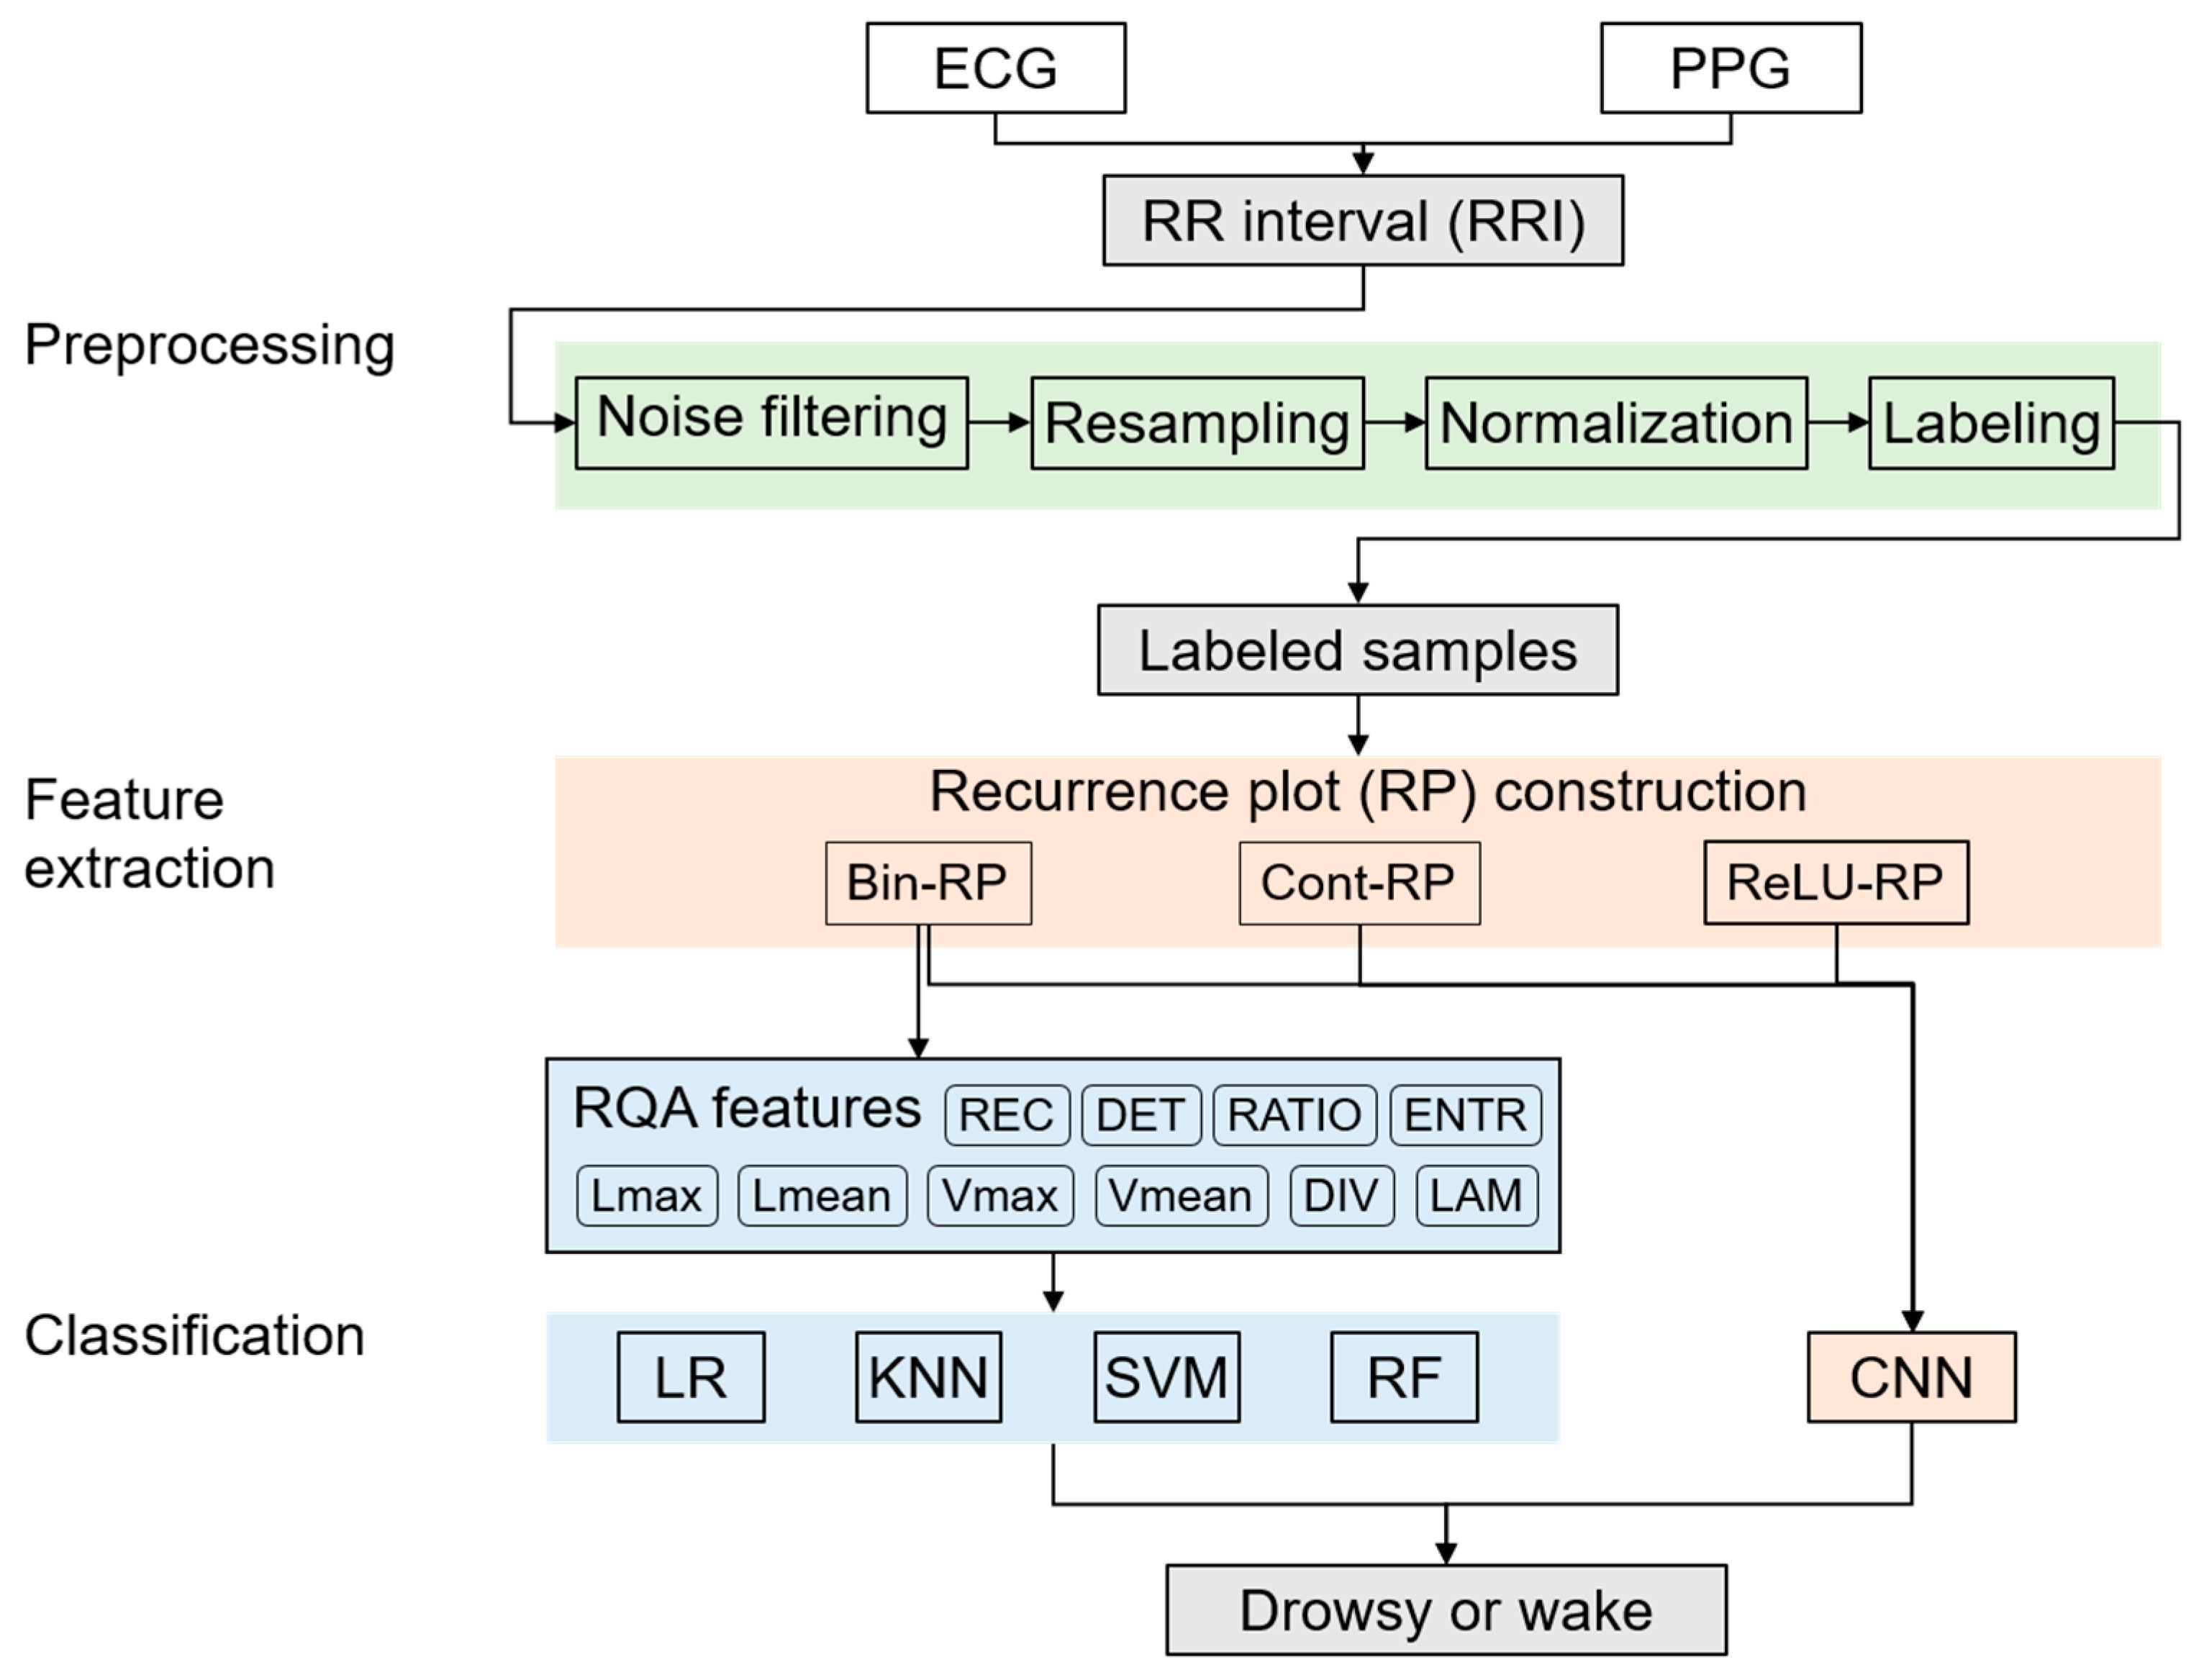
This study aims to investigate the robust and distinguishable pattern of HRV signals for driver drowsiness detection that can provide reliable results, regardless of which sensors (ECG or PPG) being used. For this, we explored three types of RPs (including Bin-RP, Cont-RP, and ReLU-RP) produced from R–R intervals (RRIs) of ECG (or PPG) sensors. Specifically, we utilized each of these RPs as input features to a convolutional neural network (CNN) for drowsy/awake classification (see Figure 1). For experiments, we collected RRIs at drowsy and awake conditions with an ECG sensor of the Polar H7 strap and a PPG sensor of the Microsoft (MS) band 2, in a virtual driving environment.
The organization of the paper is as follows: Section 2 explains the driver drowsiness dataset used in this study, and the preprocessing process for our analyses. Also, drowsy and awake states are characterized based on three types of RPs, followed by the drowsiness detection model development with CNN and others. Section 3 evaluates the drowsy/awake classification performance of the proposed model and compares it with other existing approaches. Finally, Section 4 discusses the results and concludes our study.
2. Materials and Methods
2.1. Driver Drowsiness Dataset
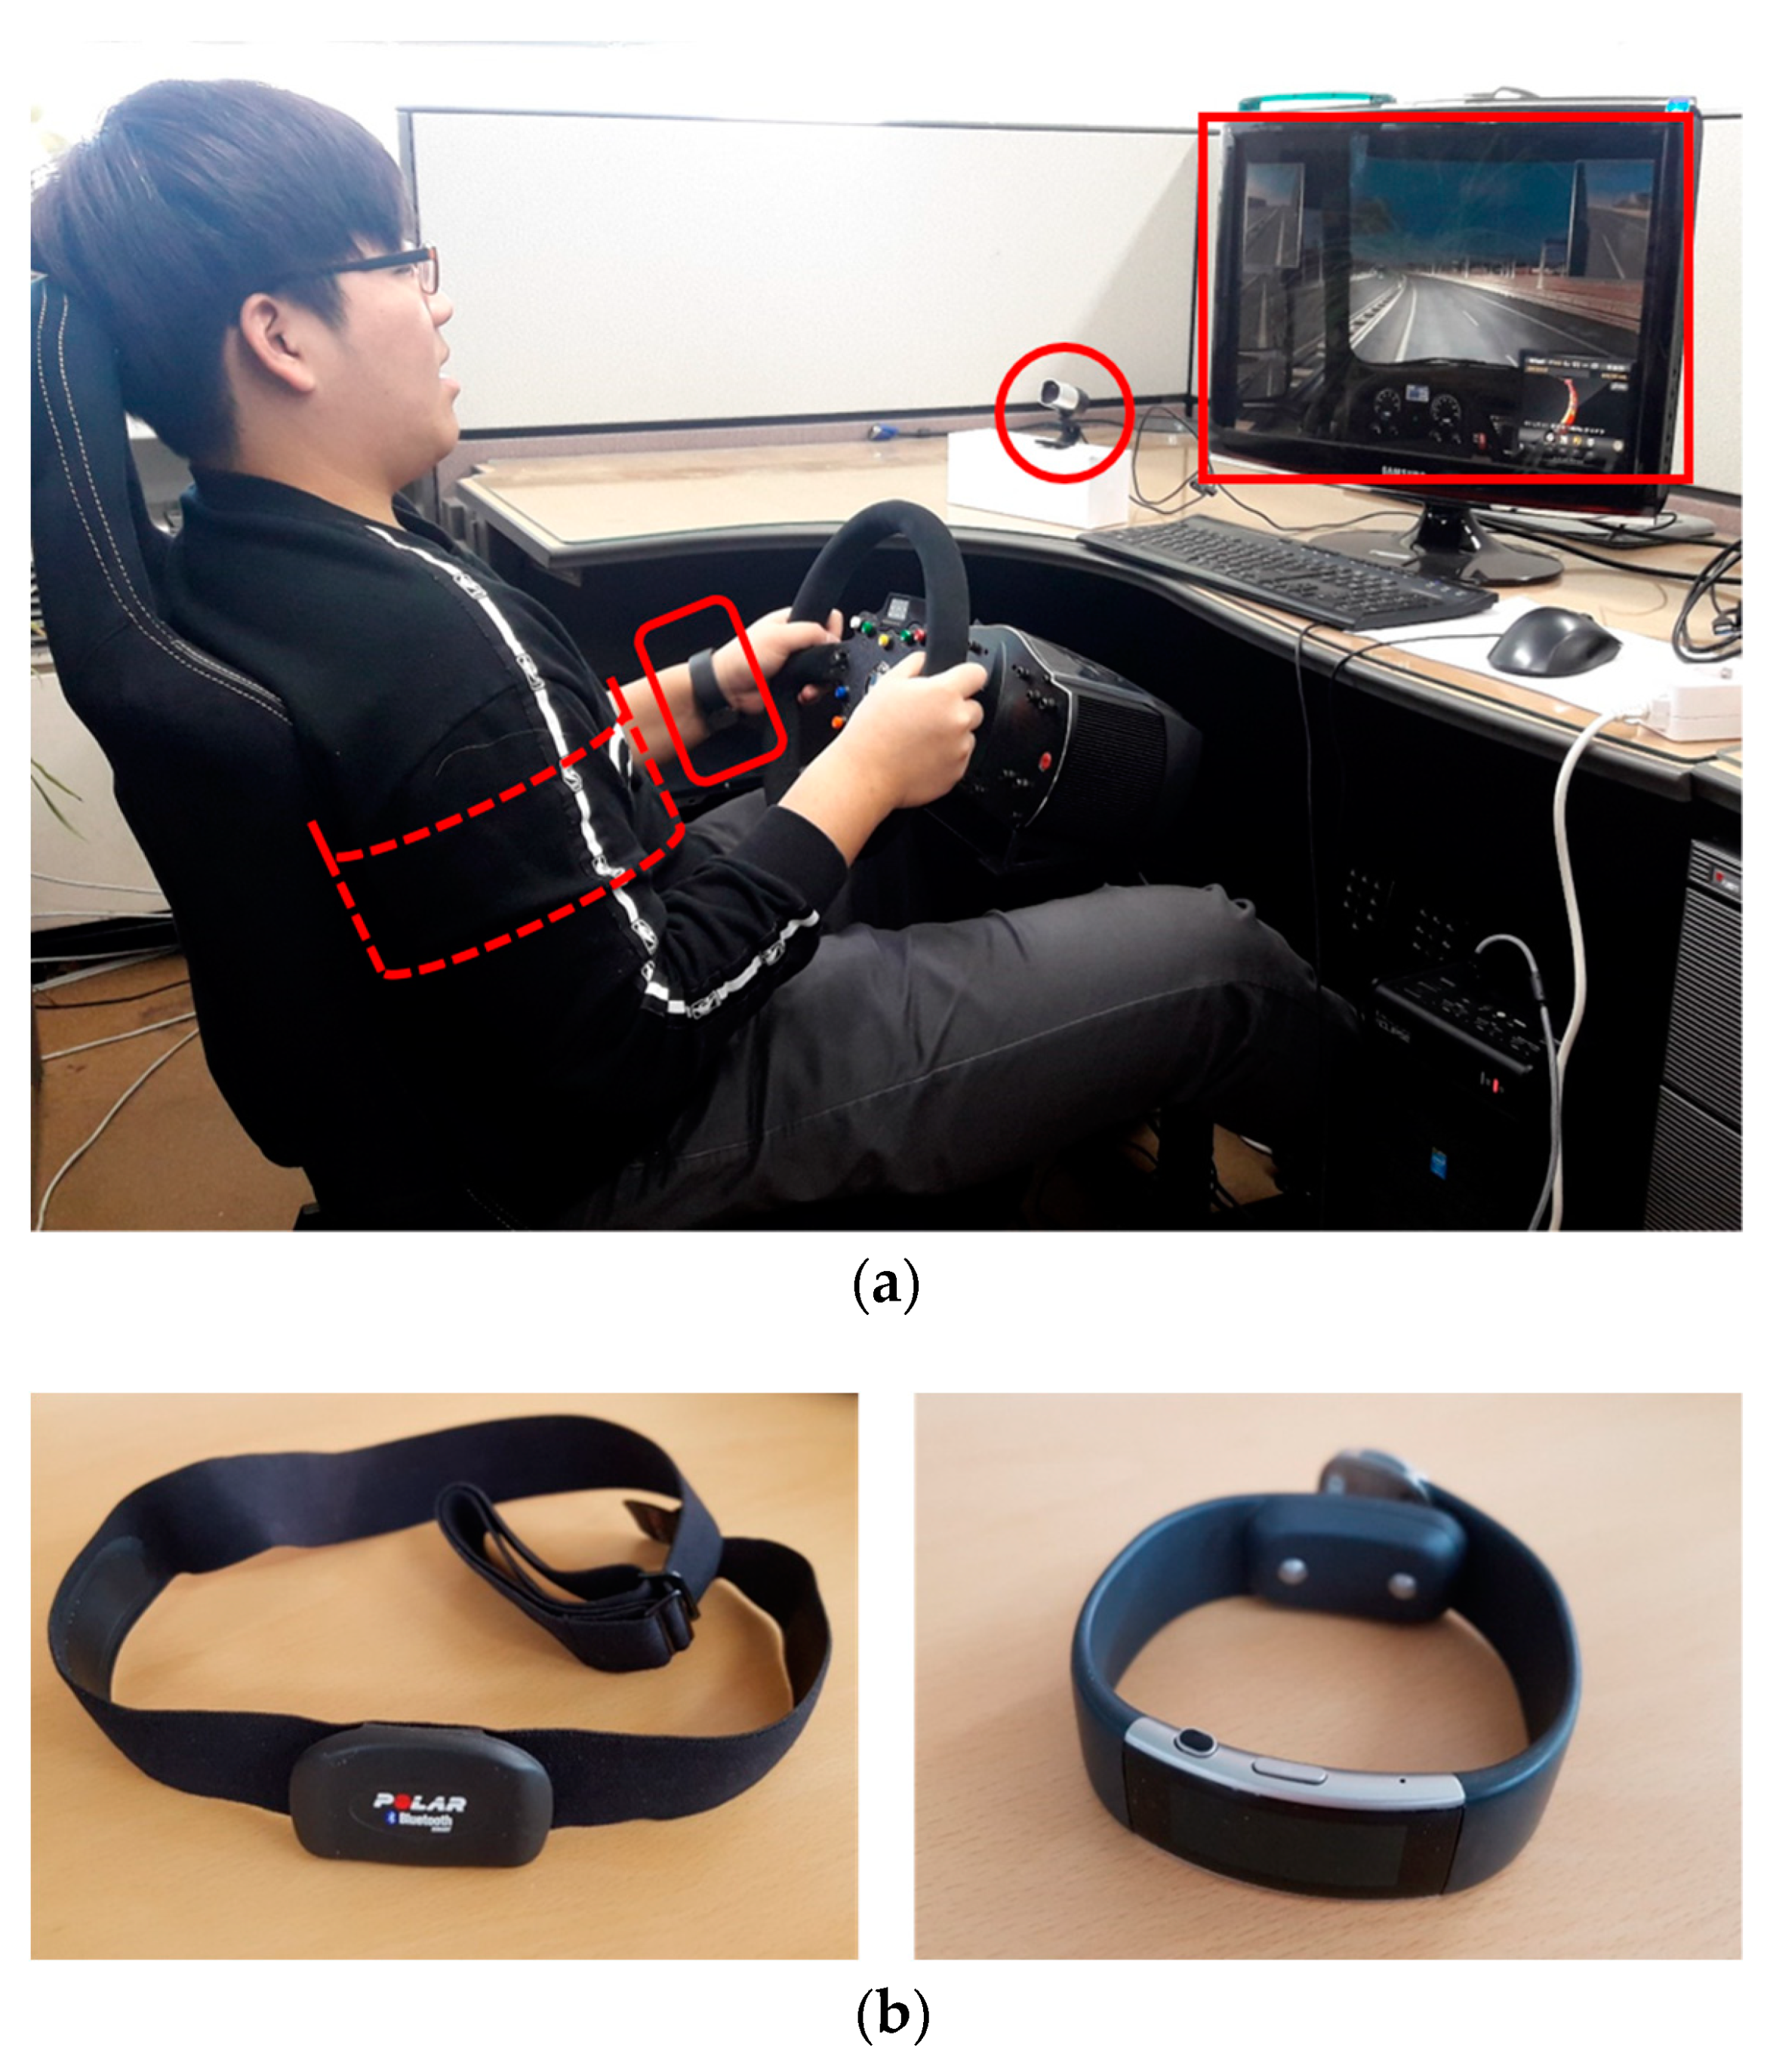
In this study, we used our in-house driver drowsiness dataset for experiments. This dataset was collected under a virtual driving simulation environment (Figure 2a) where RRIs of each subject were obtained with two body-worn sensors: a Polar H7 strap ECG sensor and an MS Band2 PPG sensor, as shown in Figure 2b. The Polar H7 strap was worn on the chest to measure cardiac data, and MS Band 2 was worn on the left wrist. The strap measured RRIs approximately every second while the band measured RRIs approximately one to two times every second at its own sampling rate. For the measurement, all the subjects received instructions to drive on the virtual road provided by Euro Truck Simulator 2 program [28], allowing a maximum speed of 90 km/h. In addition, the subjects were advised not to drink caffeine beverages within three hours of measurement.
Under this controlled environment, for each subject, we recorded two kinds of RRIs acquired from ECG and PPG sensors, and also two different videos, one for the face recording and the other for driving behavior recording. Here, the two videos would be used later for labeling of the RRI data. Each recording time was approximately one to two hours. Currently, the dataset includes 22 recordings of six subjects (men and women, 20–35 years) in total. Among these, six recordings were collected in the morning when the subject was usually clearly awake, and 16 recordings were recorded after lunch or dinner when the subject was usually feel fatigued or sleepy. To keep better quality of data, in this study, we utilized awake state data taken from morning recordings and drowsy state data taken from after-lunch or after-dinner recordings. Each recording was labeled by assigning a drowsy or awake state to every 1-min length of RRIs with reference to the videos of a subject’s face and driving behaviors.
2.2. Data Preparation
For the development of the driver drowsiness detection model, the dataset was preprocessed as follows: firstly, we filtered out noise effects in such a way that if an RRI was not within 20% SD from the mean of its 10 neighbors (including five preceding RRIs and five following RRIs), it was considered to have a noise effect and was replaced with the mean of its neighbors (see our earlier work in Reference [29] for details).
Also, we adjusted the two RRI measurements acquired from the ECG and PPG sensors to the same sampling rate. To do this, for both of the measurements, we interpolated the two adjacent RRIs in each recording with linear functions and resampled them to have a 1-Hz sampling rate. With these resampled RRIs of each recording, we generated 2-min RRI samples without overlapping, and labeled them using only the samples with the same state in a 2-min epoch. That is, we excluded the 2-min RRI samples that had a different state between the first minute and the second minute (e.g., the first minute was drowsy and the second minute was awake). This was intended to have a better classification model with clearly differentiated samples between drowsy and awake states. Then, for further analyses, these 2-min RRI samples were standardized to have a mean of 0 and an SD of 1.
Finally, we obtained the collection of 684 2-min samples, which included 234 drowsy and 450 awake samples, from each type of sensors (i.e., ECG or PPG). Among these, for each sensor, we only used 203 drowsy samples measured after lunch or dinner and 138 awake samples measured in the morning. Thus, for experiments, we eventually used total 341 samples acquired from ECG strap and PPG band, respectively, which include 203 samples at drowsy state and 138 samples at awake state.
2.3. Characterization of Drowsy and Awake States Based on Recurrence Plots
For driver drowsiness detection, it is necessary to characterize the difference between drowsy and awake states. To this end, we investigated the RPs produced from RRIs of ECG and PPG. As a plot of visualizing the pattern of recurrence [21], it shows the repetitiveness of state evolution in the phase space of a dynamic system. That is, if the distance between two states in the phase space is very close (i.e., if the distance is less than a threshold), it is considered that recurrence occurs between two states in the topology space over time. By looking into this plot, it is possible to find the repetitive occurrence of similar sequences of states in the system dynamics.
In this study, we examined three types of RPs: Bin-RP, Cont-RP, and ReLU-RP. The Bin-RP is a binarized recurrence plot where the cells having smaller values than a pre-specified threshold are marked as 1s and others are marked as 0s. The Cont-RP is the non-threshold recurrence plot where each cell indicates the actual distance between two states in the phase space. The ReLU-RP is our newly suggested recurrence plot that can be obtained by filtering Cont-RP with a modified ReLU (rectified linear unit) function. Specifically, each cell Ri,j of the ReLU-RP was determined using the following formula:
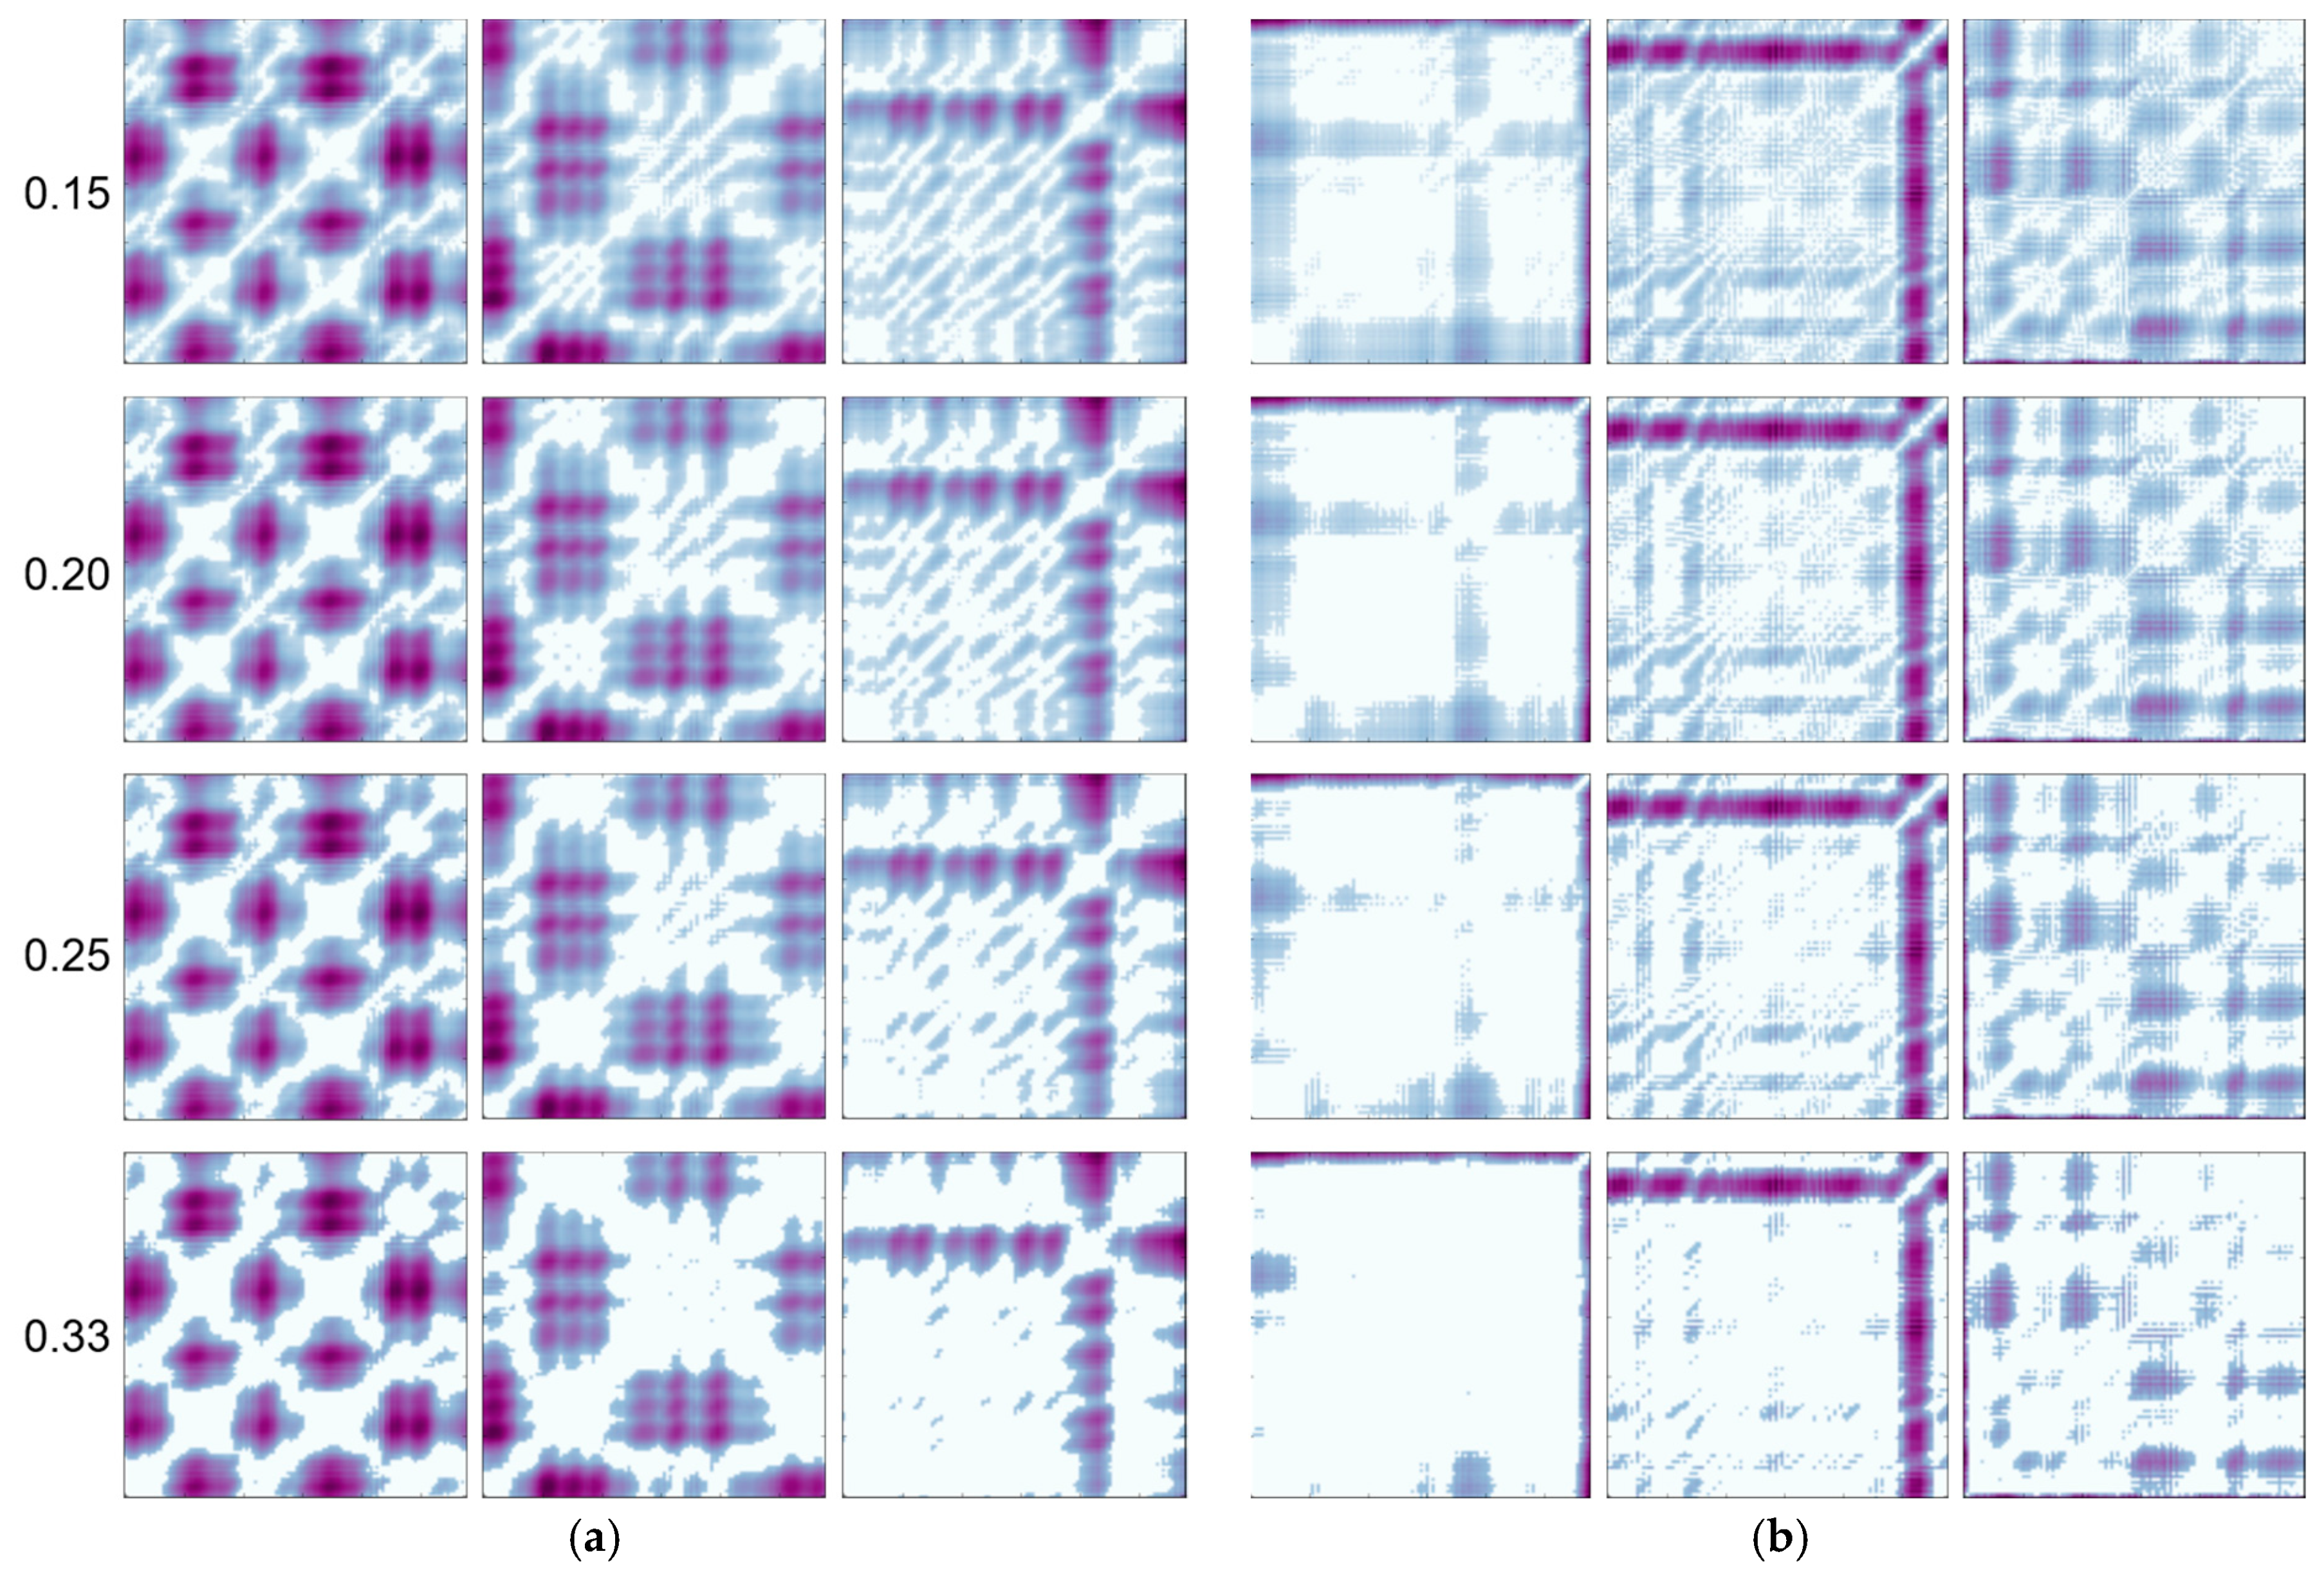
where D is the distance between two embedded states si and sj in the phase space, and ε is a pre-specified threshold. The choice of the threshold may vary depending on the experimental dataset. If the threshold is too large, most cells in the ReLU-RP will be converted to zero, resulting in the loss of a lot of information from Cont-RP. On the other hand, if the threshold is too small, the resulting ReLU-RP would become similar to Cont-RP. Herein, the threshold was empirically chosen as ε = 0.1, which gave the best performance between 0.075 and 0.33.
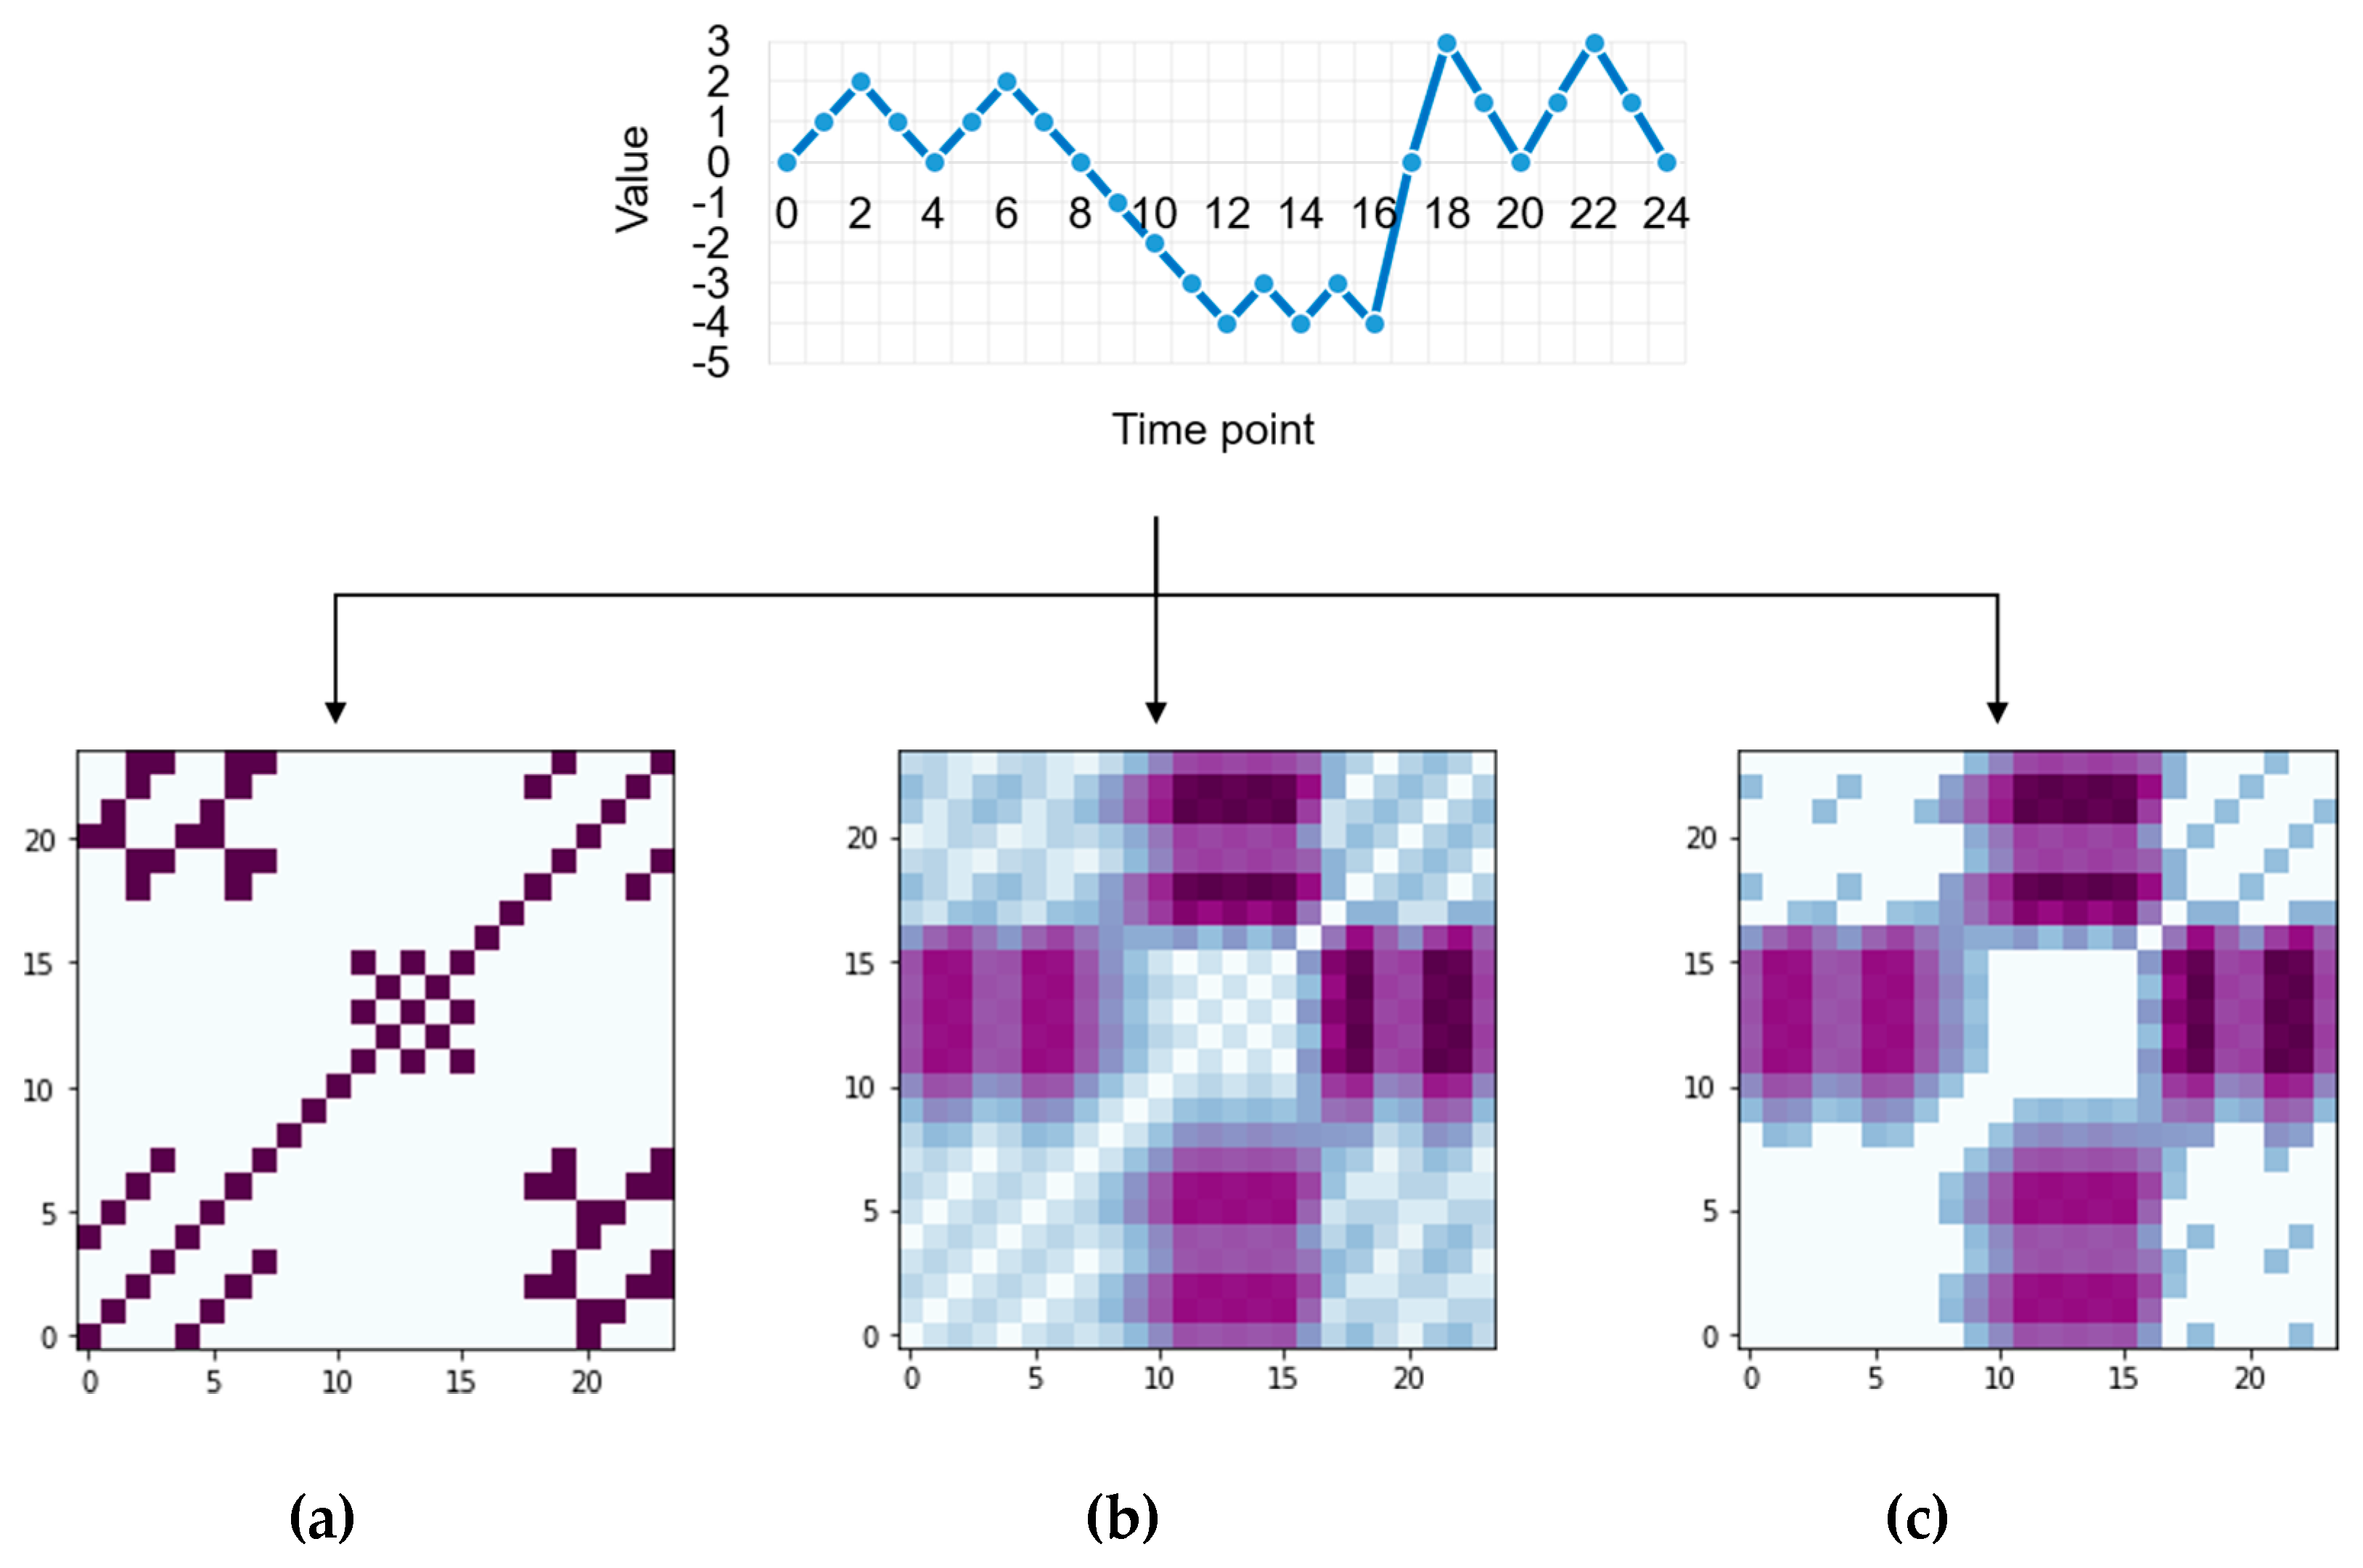
For the explanation of these RPs, we used an illustrative example to produce the three types of RPs given in Figure 3. Here, the time series data of 25 points were used and the RPs were constructed with an embedding dimension of 2 and a time delay of 1. Figure 3a shows the Bin-RP consisting of only 0s and 1s with thresholding, and Figure 3b shows the Cont-RP in which each cell has actual values of distance without thresholding. Due to the binarization of cell values in the Bin-RP, the two states having a small distance between them are denoted by 1s and the others are denoted by 0s. Thus, as a result, Bin-RP focuses more on the recurrence patterns, mostly represented by diagonal lines in Cont-RP. On the other hand, the ReLU-RP shown in Figure 3c visualizes the de-emphasized recurrence patterns from Cont-RP. By doing so, the ReLU-RP focuses more on non-recurrence patterns, mostly represented by single dots or vertical (or horizontal) lines in Cont-RP.
According to earlier works [30], a diagonal line shown in RP indicates that the evolution of states in the phase space is similar at different times. On the other hand, a vertical (or horizontal) line in RP indicates that a state does not change or changes very slowly during a certain time. Thus, the Bin-RP focusing on the pattern of diagonal lines results in emphasizing the repetitiveness of a similar state evolution in system dynamics. On the other hand, the ReLU-RP focuses on the pattern of vertical (or horizontal) lines emphasizing the time length in which a state is not significantly changed over time.
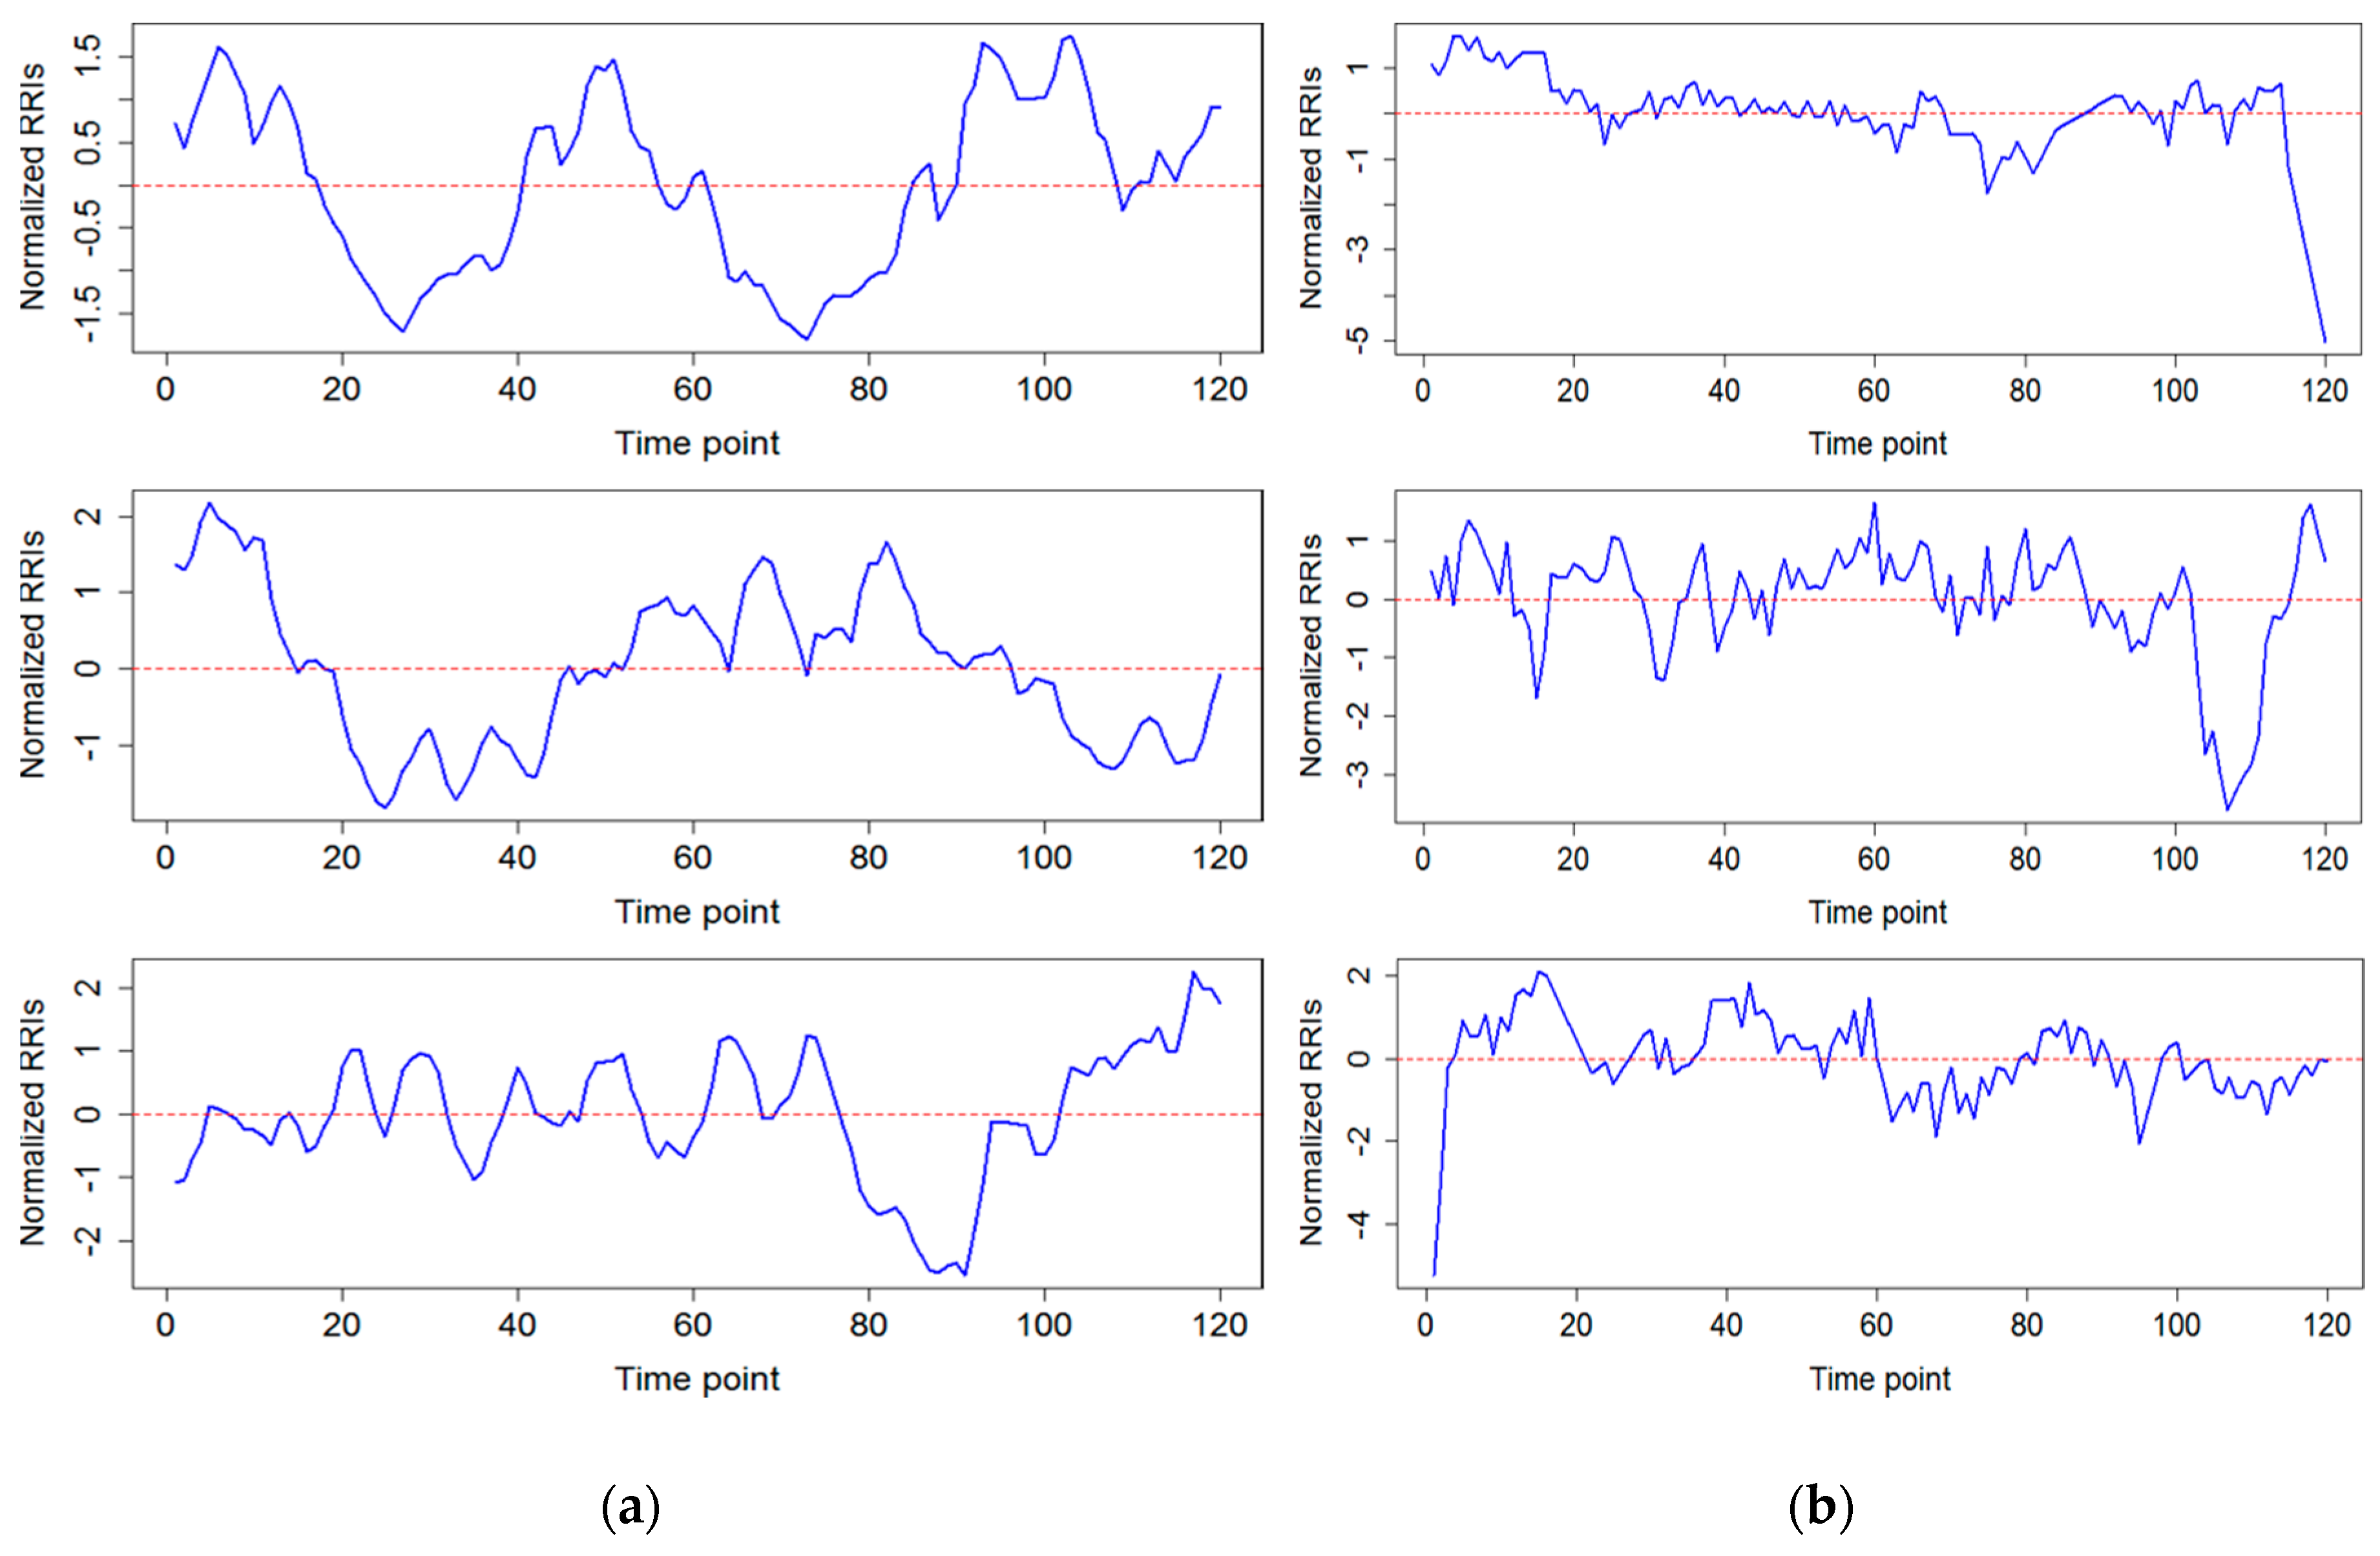
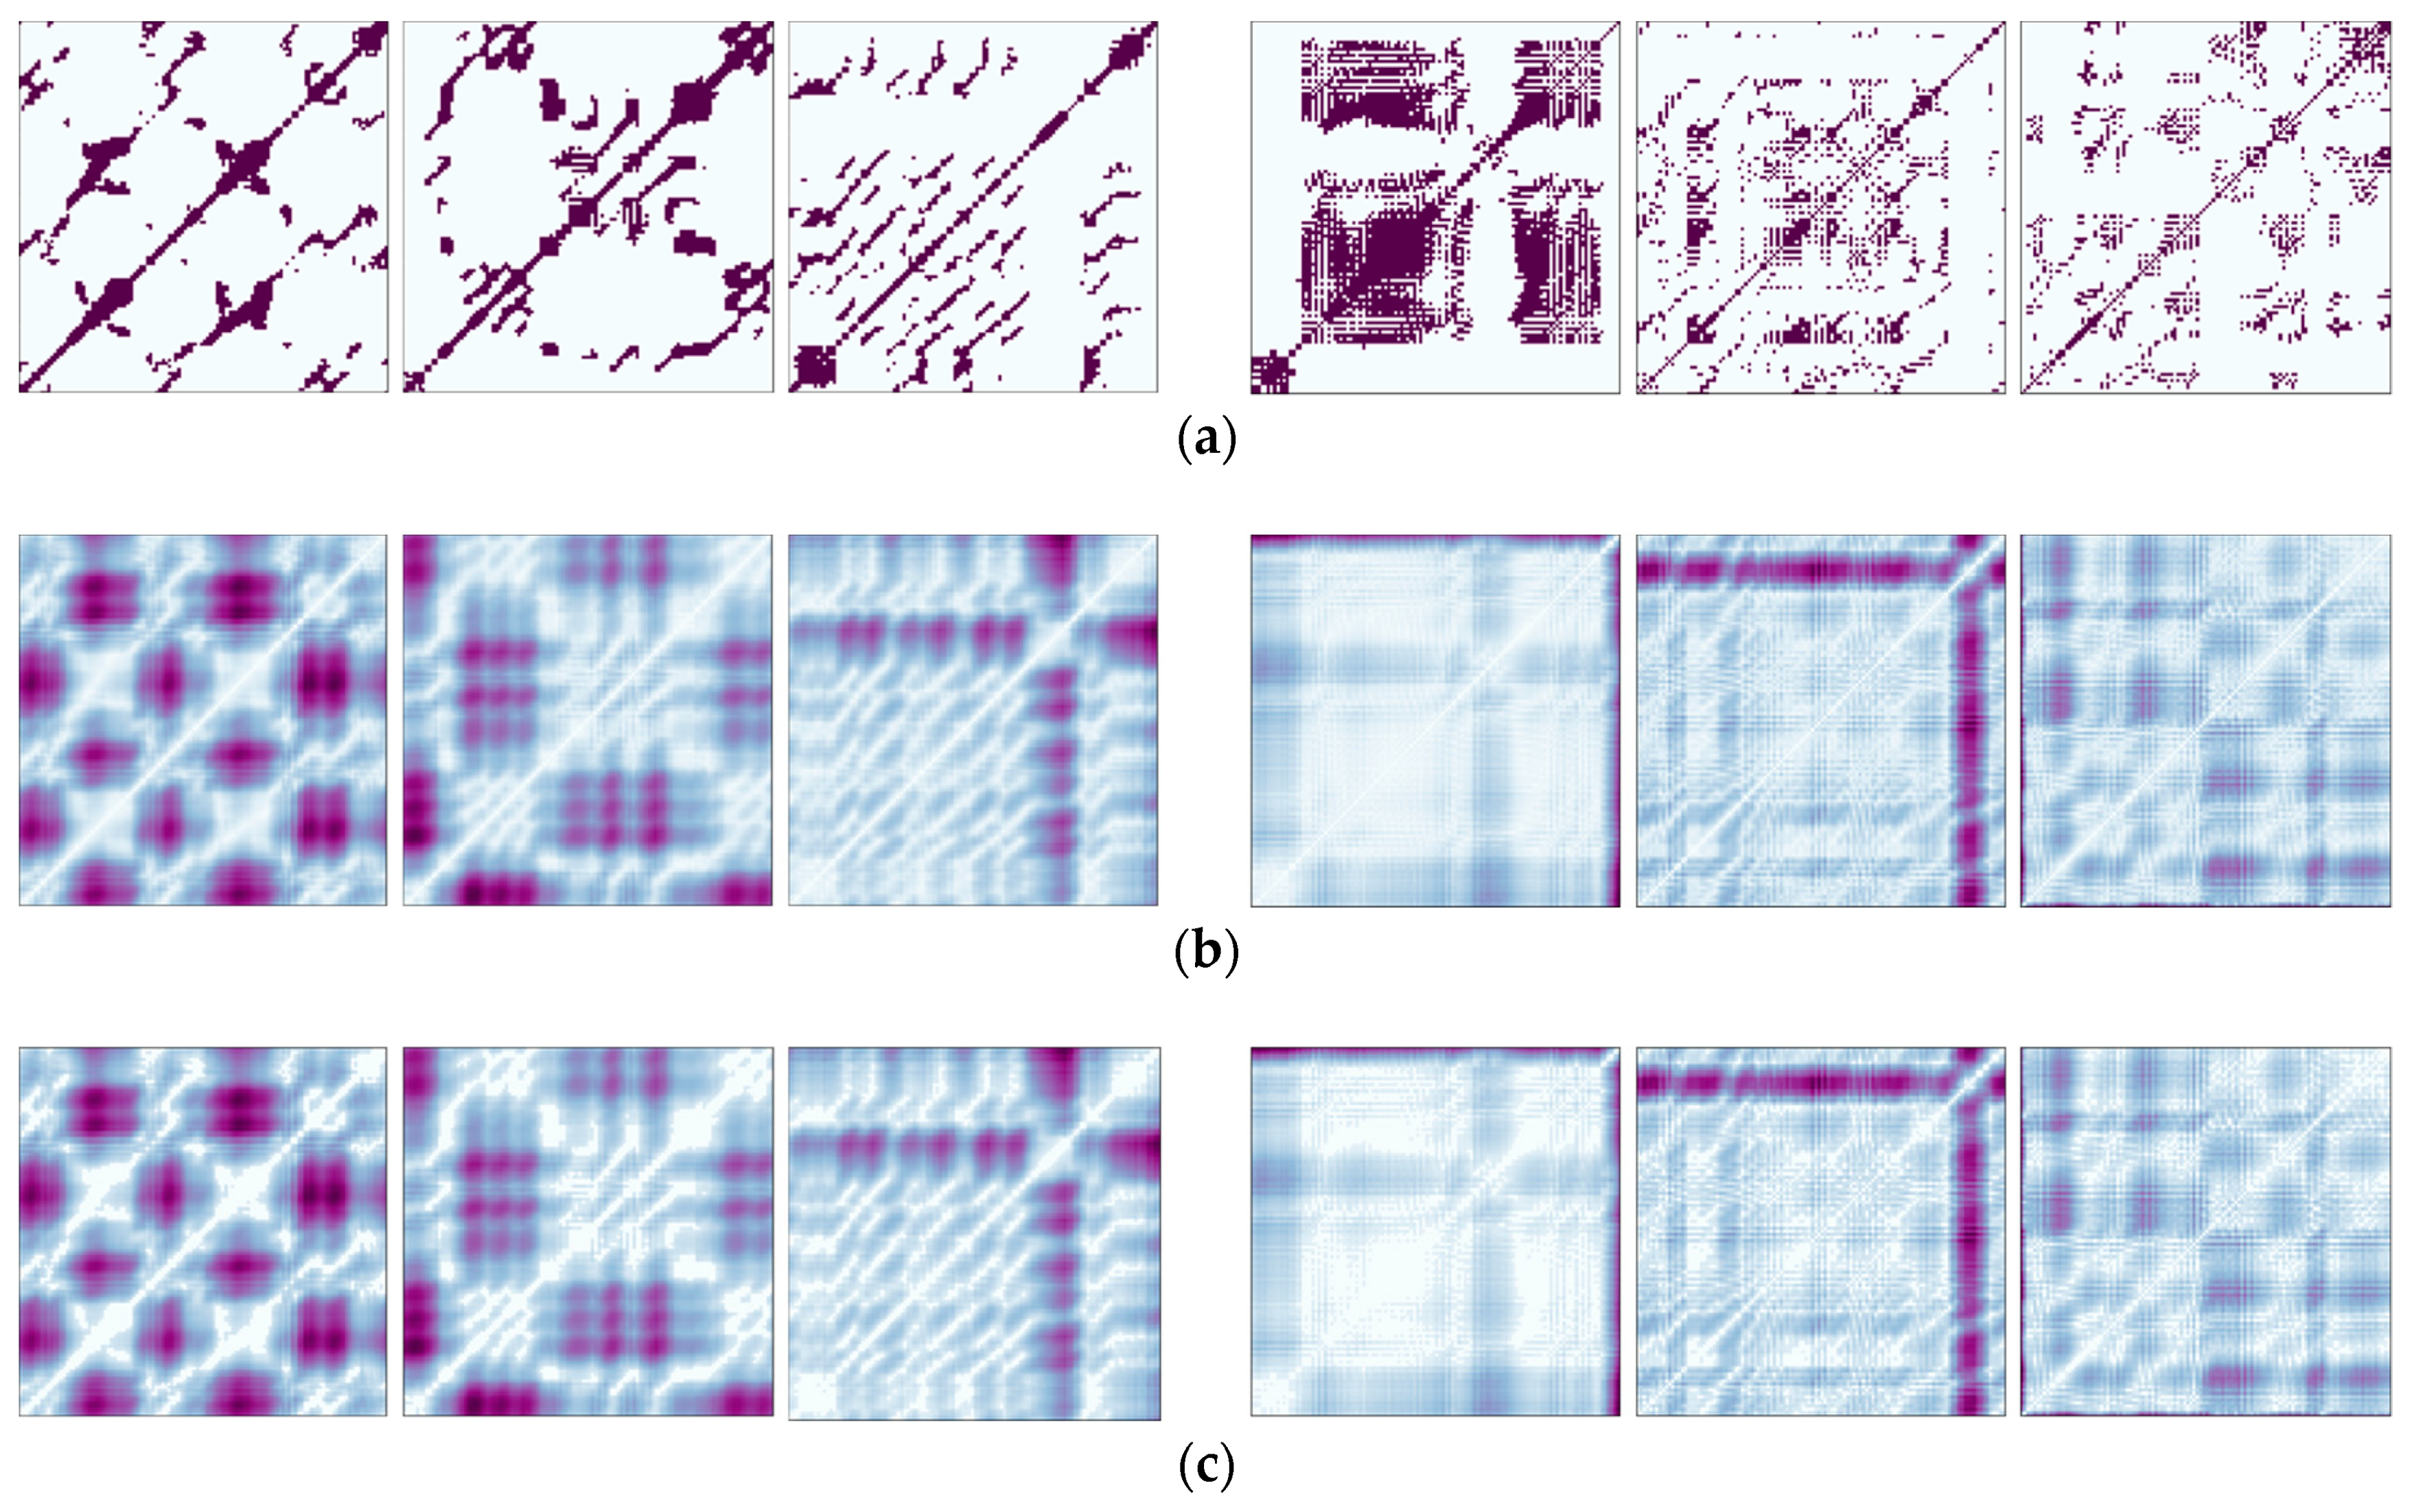
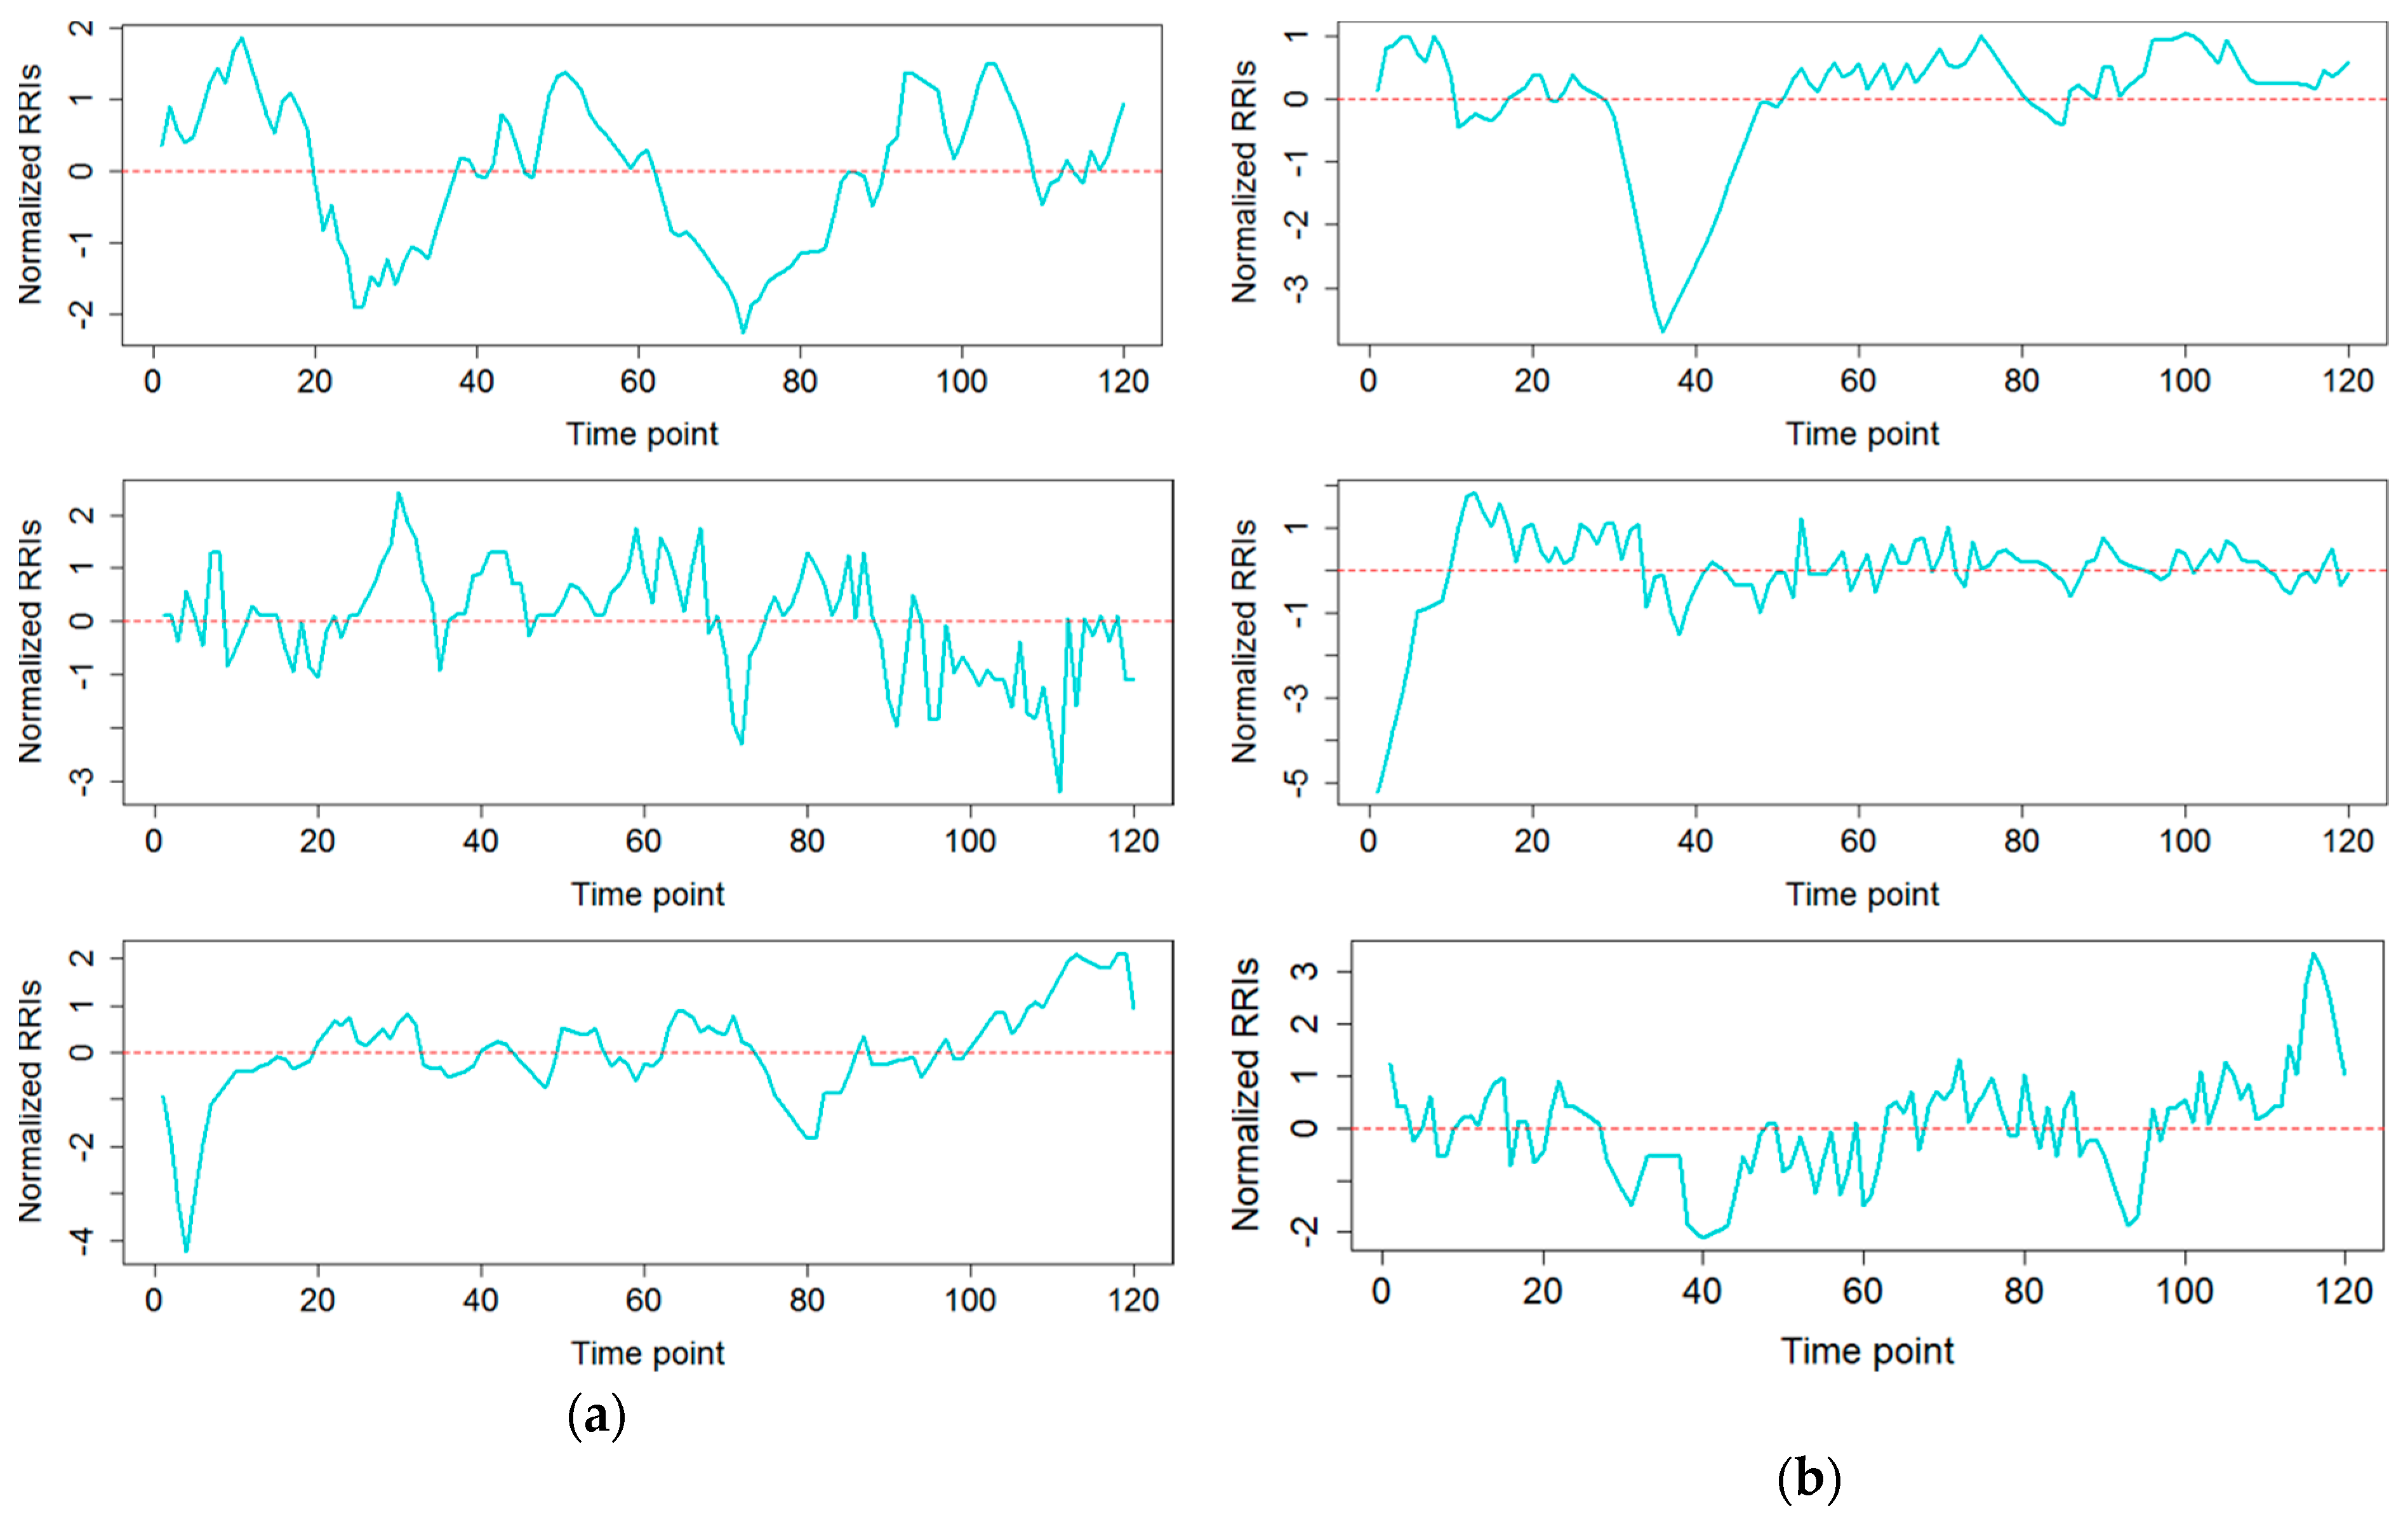
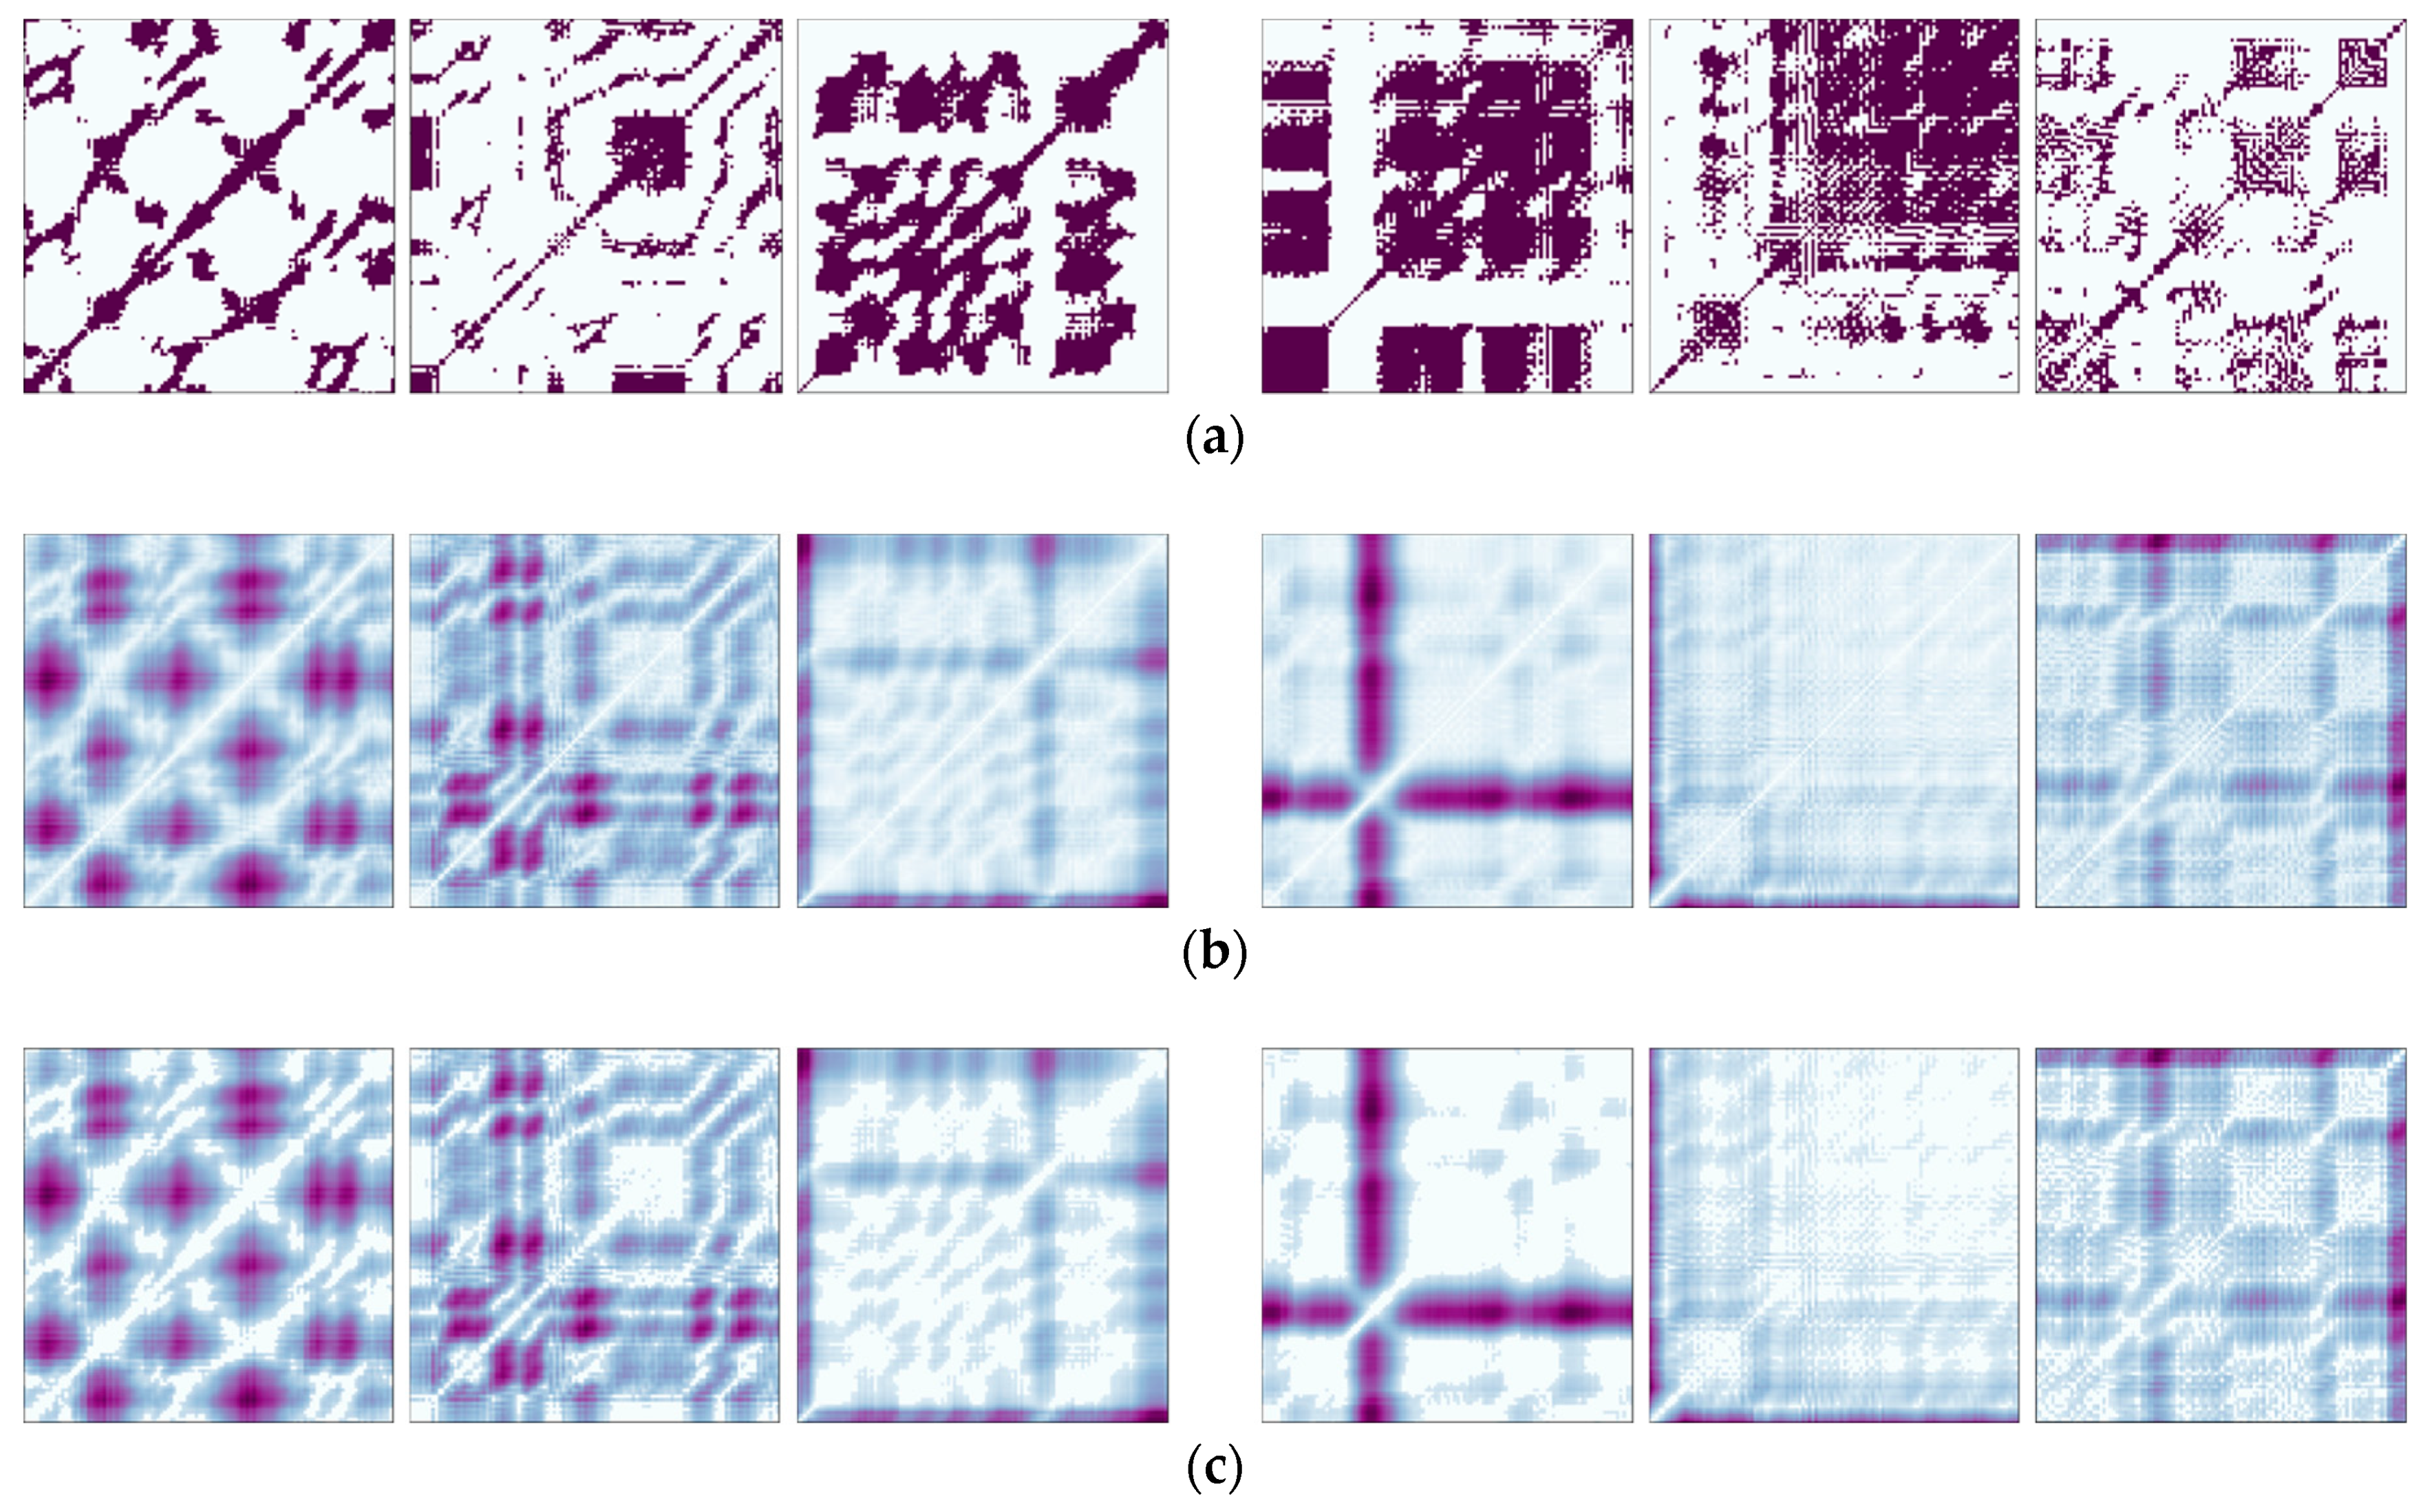
For drowsiness detection, we constructed the three types of RPs from ECG and PPG data, with an embedding dimension of 3 and a time delay of 2. The size of RPs that we produced from the normalized 2-min RRI sample (with 120 intervals) was 116 × 116. Figure 5 shows the Bin-RP, Cont-RP, and ReLU-RP for drowsy and awake states obtained from ECG data given in Figure 4, while Figure 7 shows the Bin-RP, Cont-RP, and ReLU-RP for drowsy and awake states obtained from PPG data given in Figure 6. From these figures, we can observe that the overall pattern of recurrence presented by diagonal lines shows a clearly distinction between drowsy and awake states in Bin-RPs (Figure 5a and Figure 7a). Moreover, drowsy states seem to have more diagonal lines than awake states, which indicates that the normalized RRIs at drowsy states have a more similar state evolution at different times than those at awake states. Presumably, this is because the normalized RRIs in drowsy samples (Figure 4a and Figure 6a) varied significantly over time with large-scaled repetitiveness, while they rarely changed the overall trend with small-scaled repetitiveness, except for showing a sudden valley at times in awake states (Figure 4b and Figure 6b).
Such characteristics of drowsy and awake samples were also well captured in the ReLU-RPs, shown in Figure 5c and Figure 7c. The ReLU-RPs emphasize the pattern of vertical (or horizontal) lines from Cont-RP, which indicates that a state does not change or changes very slowly during a certain time. In fact, this indication appears more clearly in the ReLU-RPs of awake samples than in those of drowsy samples, which matches our observation that the normalized RRIs rarely changed the overall trend in awake samples but varied significantly over time in drowsy samples. In Figure 5c and Figure 7c, the ReLU-RPs at drowsy states show a short length of vertical (or horizontal) lines while the ReLU-RPs at awake states show a long length of vertical (or horizontal) lines. This results in showing better distinguishability between the two states than Bin-RPs. Particularly, as the threshold value of the ReLU function is larger, the effects of diagonal lines are more eliminated from Cont-RP (Figure 8).
For completeness, we also explored the Cont-RP that includes all the information about actual distance between any states in the phase space. As seen in Figure 5b and Figure 7b, even if Cont-RPs has more information than ReLU-RPs, it seems that they are not so helpful in distinguishing between drowsy and awake states. In most cases, Cont-RPs were quite similar to ReLU-RPs, except that, in some cases, Cont-RPs obscured the difference between the two states by keeping more information than ReLU-RPs.
2.4. RP-Based Drowsiness Detection Modeling
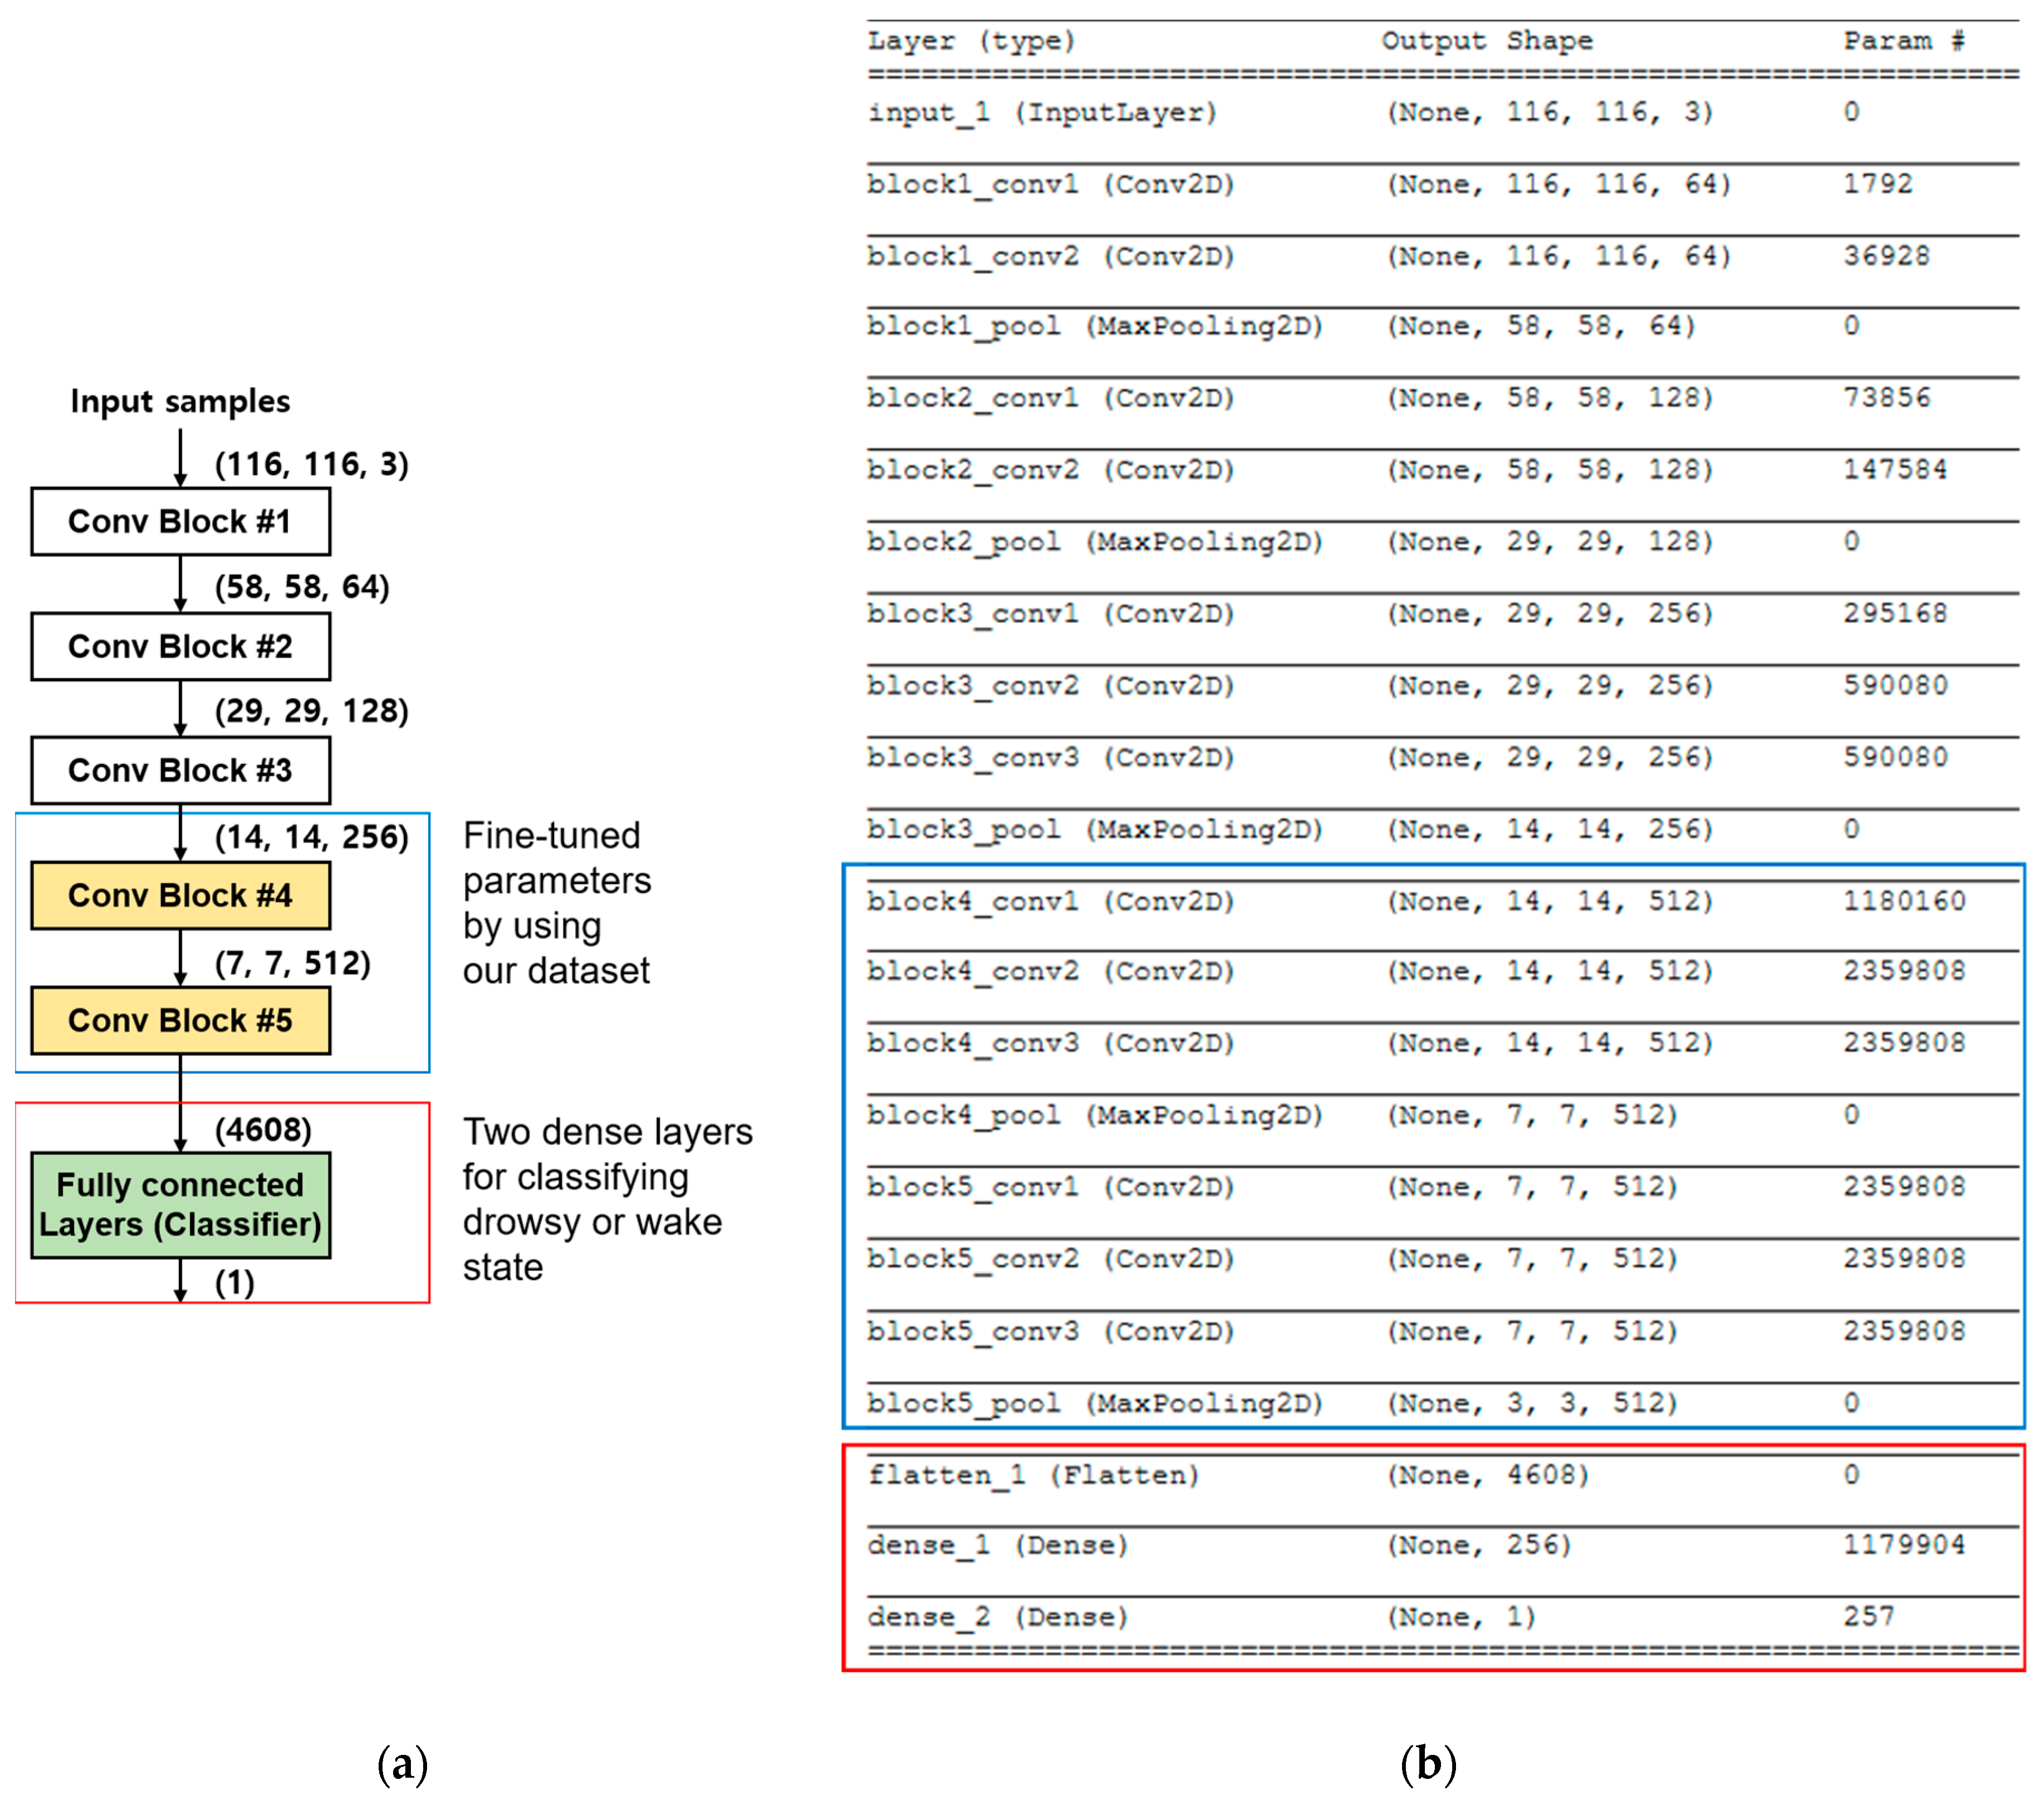
For drowsiness detection modeling, each type of RP (i.e., Bin-RP, Cont-RP, and ReLU-RP) was considered as the input to a convolutional neural network (CNN). Unlike conventional approaches using manually extracted and limited features, the CNN allows us to systematically extract distinctive features from the given RP that can help classify between drowsy and awake states. For the CNN model, we fine-tuned the parameters of the VGG16 model [31] using Python. Specifically, the parameters of the initial three convolution blocks were frozen to use the pre-trained filters of the VGG16. The last two convolution blocks were trained to fit our drowsiness dataset. The feature maps learned through convolution layers were then used in two fully connected layers to classify the input into drowsy or awake state (see Figure 9 for details).
2.5. Other Model Development for Performance Comparison
For a comparative study of our suggested model using RPs, we built four different classification models using recurrence quantification analysis (RQA) features. Here, the RQA features included recurrence (REC), determinism (DET), ratio, longest diagonal size (Lmax), average diagonal length (Lmean), divergence (DIV), maximum vertical line length (Vmax), average vertical line length (Vmean), laminarity (LAM), and entropy (ENTR), which were commonly used in many related studies. Each of these features was statically analyzed to find whether there was a significant difference between drowsy and awake states (Table 1 and Table 2). Here, each feature is given with its sample mean and SD, along with a p-value from the Student’s t-test. As for the four classification models, they include logistic regression (LR), K-nearest neighbor (KNN), support vector machine (SVM), and random forest (RF). All these models were implemented with Python, and the parameters in each model were set with default values. For model evaluation, we conducted 10-fold cross-validation and then analyzed the classification performance with the averaged prediction accuracy, precision, recall, and F-measure.
3. Results and Discussion
3.1. Evaluation of RP-Based CNN Models for Drowsiness Detection
To evaluate the usefulness of each type of RP for drowsiness detection, we developed three different CNN models, which employed Bin-RP, Cont-RP, and ReLU-RP as input features. Also, for comparison, we developed four classification models (i.e., LR, KNN, SVM, RF) using six significant RQA features (with a p-value <0.05), and four classification models (i.e., LR, KNN, SVM, RF) using all RQA features.
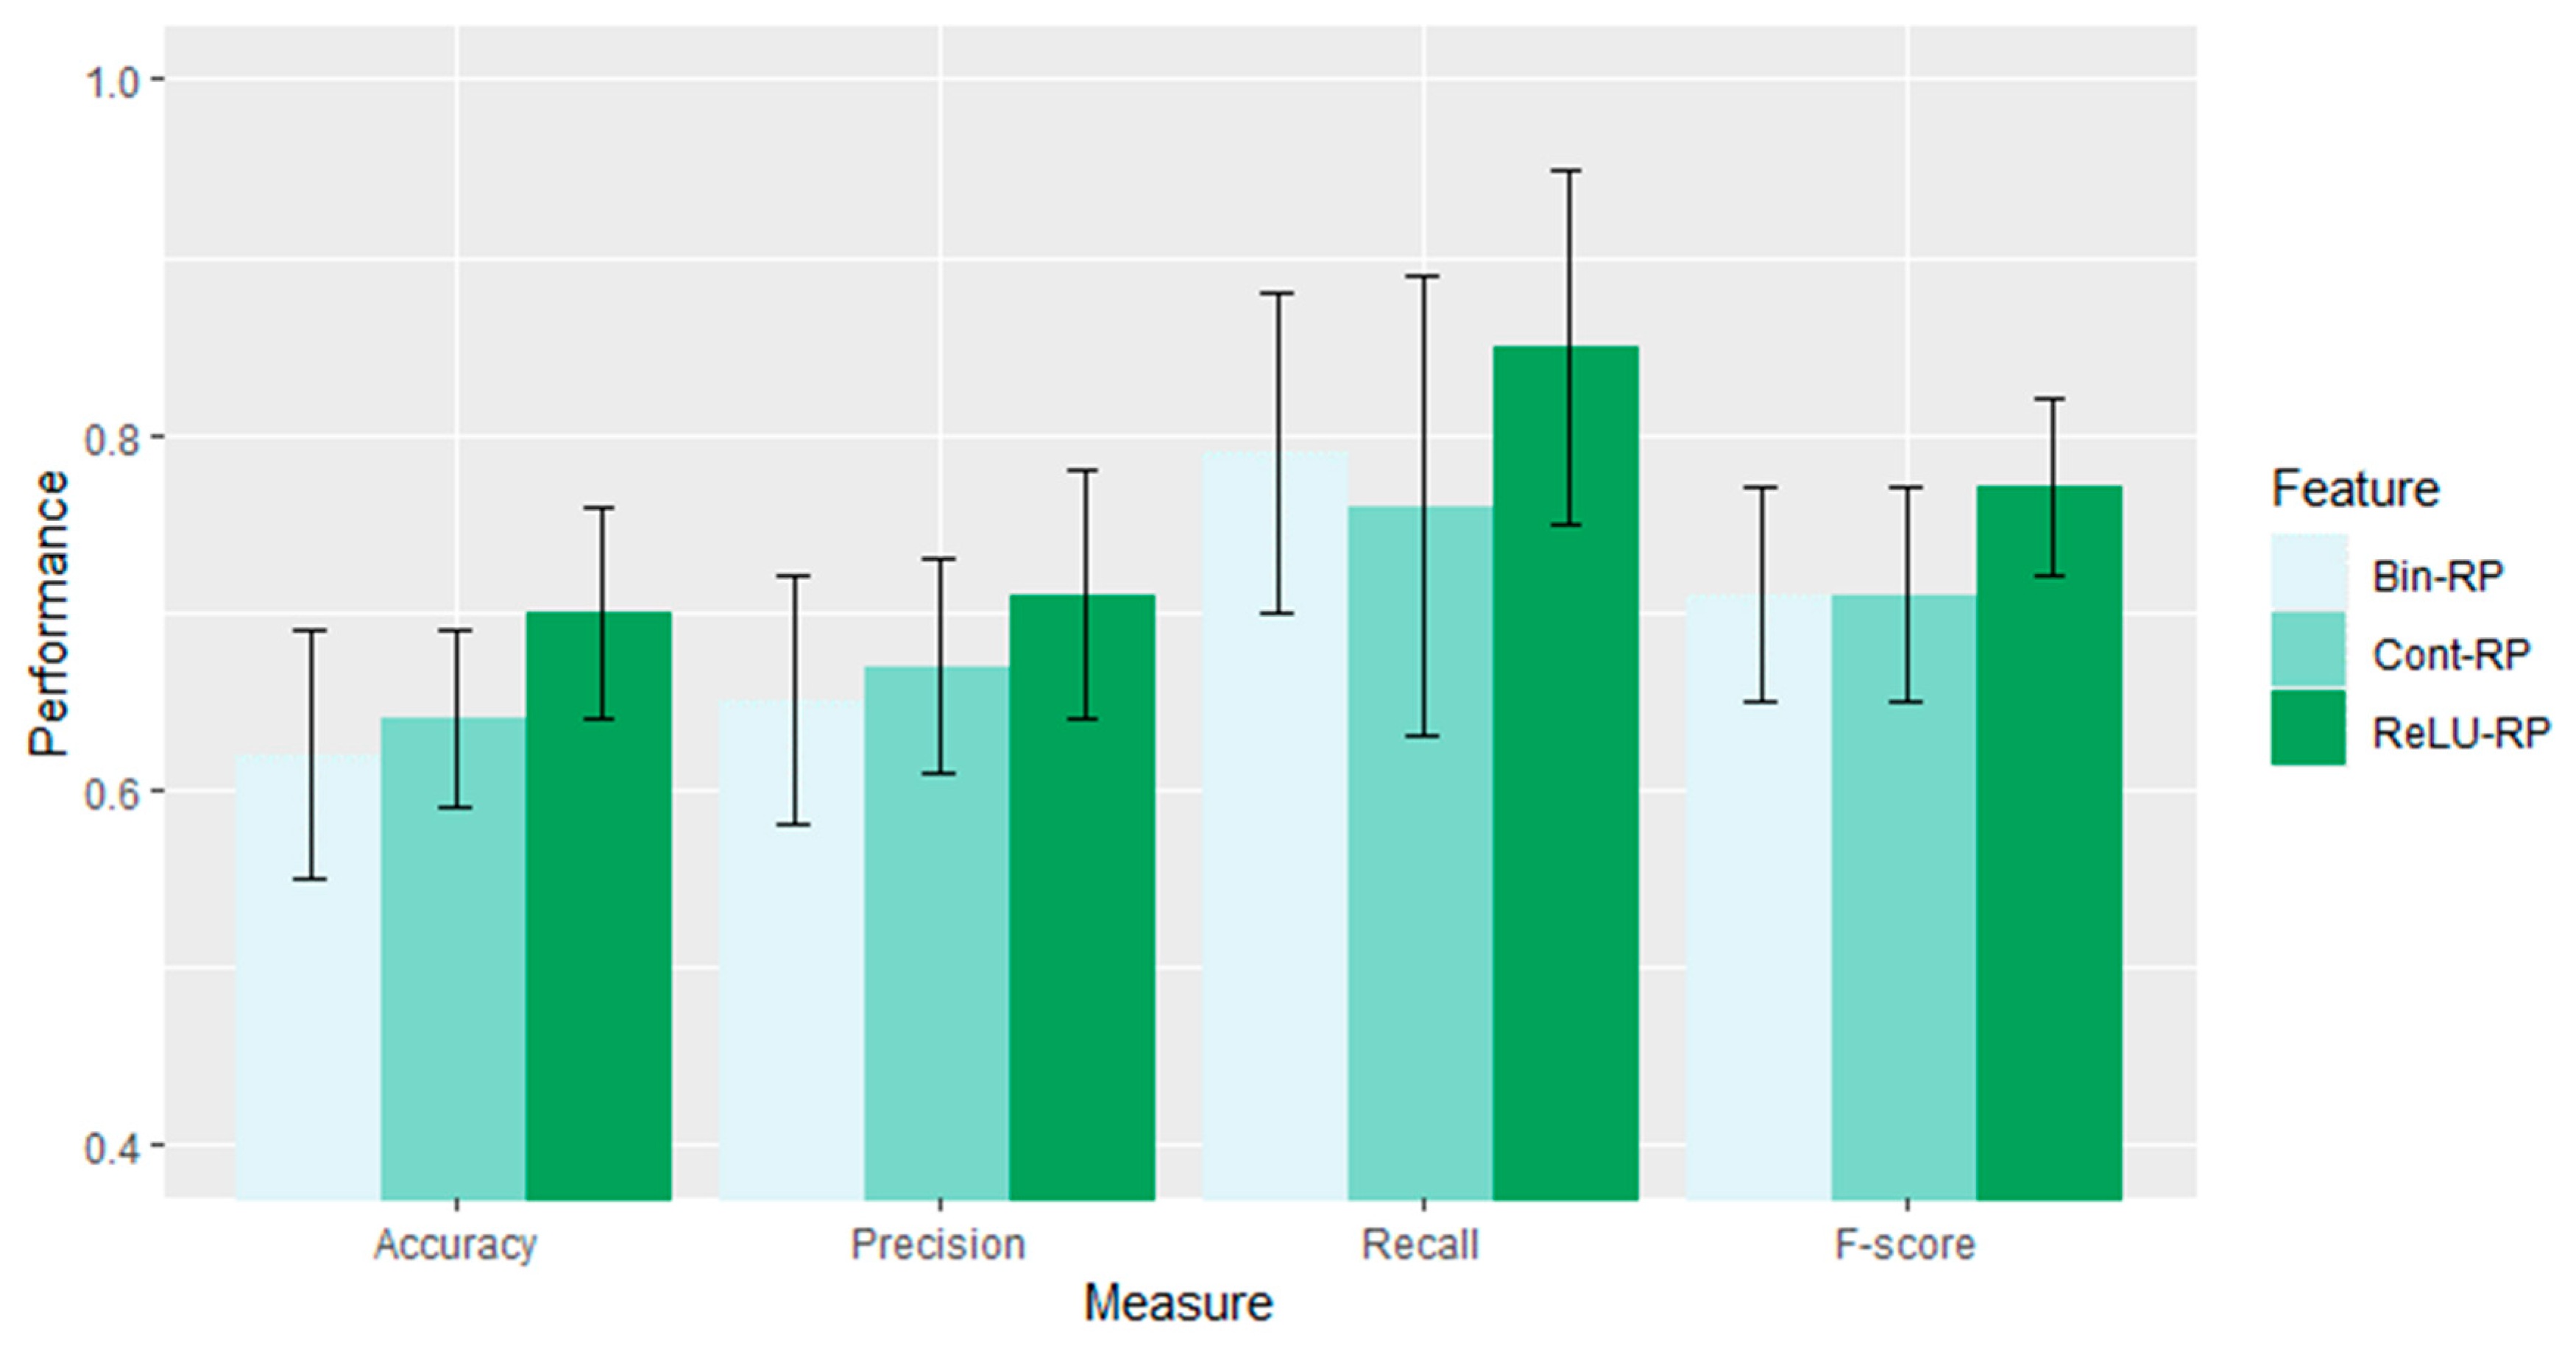
Figure 10 shows the drowsy/awake classification performance of Bin-RP, Cont-RP, and ReLU-RP used for the CNN-based models using ECG data. Here, it was found that ReLU-RP has better classification ability than Bin-RP and Cont-RP in differentiating between drowsy and awake states. Specifically, it has the best performance in all aspects of prediction accuracy, precision and recall, and F-measure.
In addition, as shown in Table 3, the CNN models using Bin-RP, Cont-RP, and ReLU-RP showed much higher performance with 62% to 70% accuracy than other existing models using RQA features with 53% to 63% accuracy. Particularly, among the three types of RPs, the proposed ReLU-RP-based CNN model is 70% accurate and superior to other RPs with 62% to 64% accuracy.
3.2. Comparative Analysis of ECG and PPG Sensors for Drowsiness Detection
Previously, we looked primarily at ECG-related results. This section compares them with PPG-related results for drowsiness detection in various aspects.
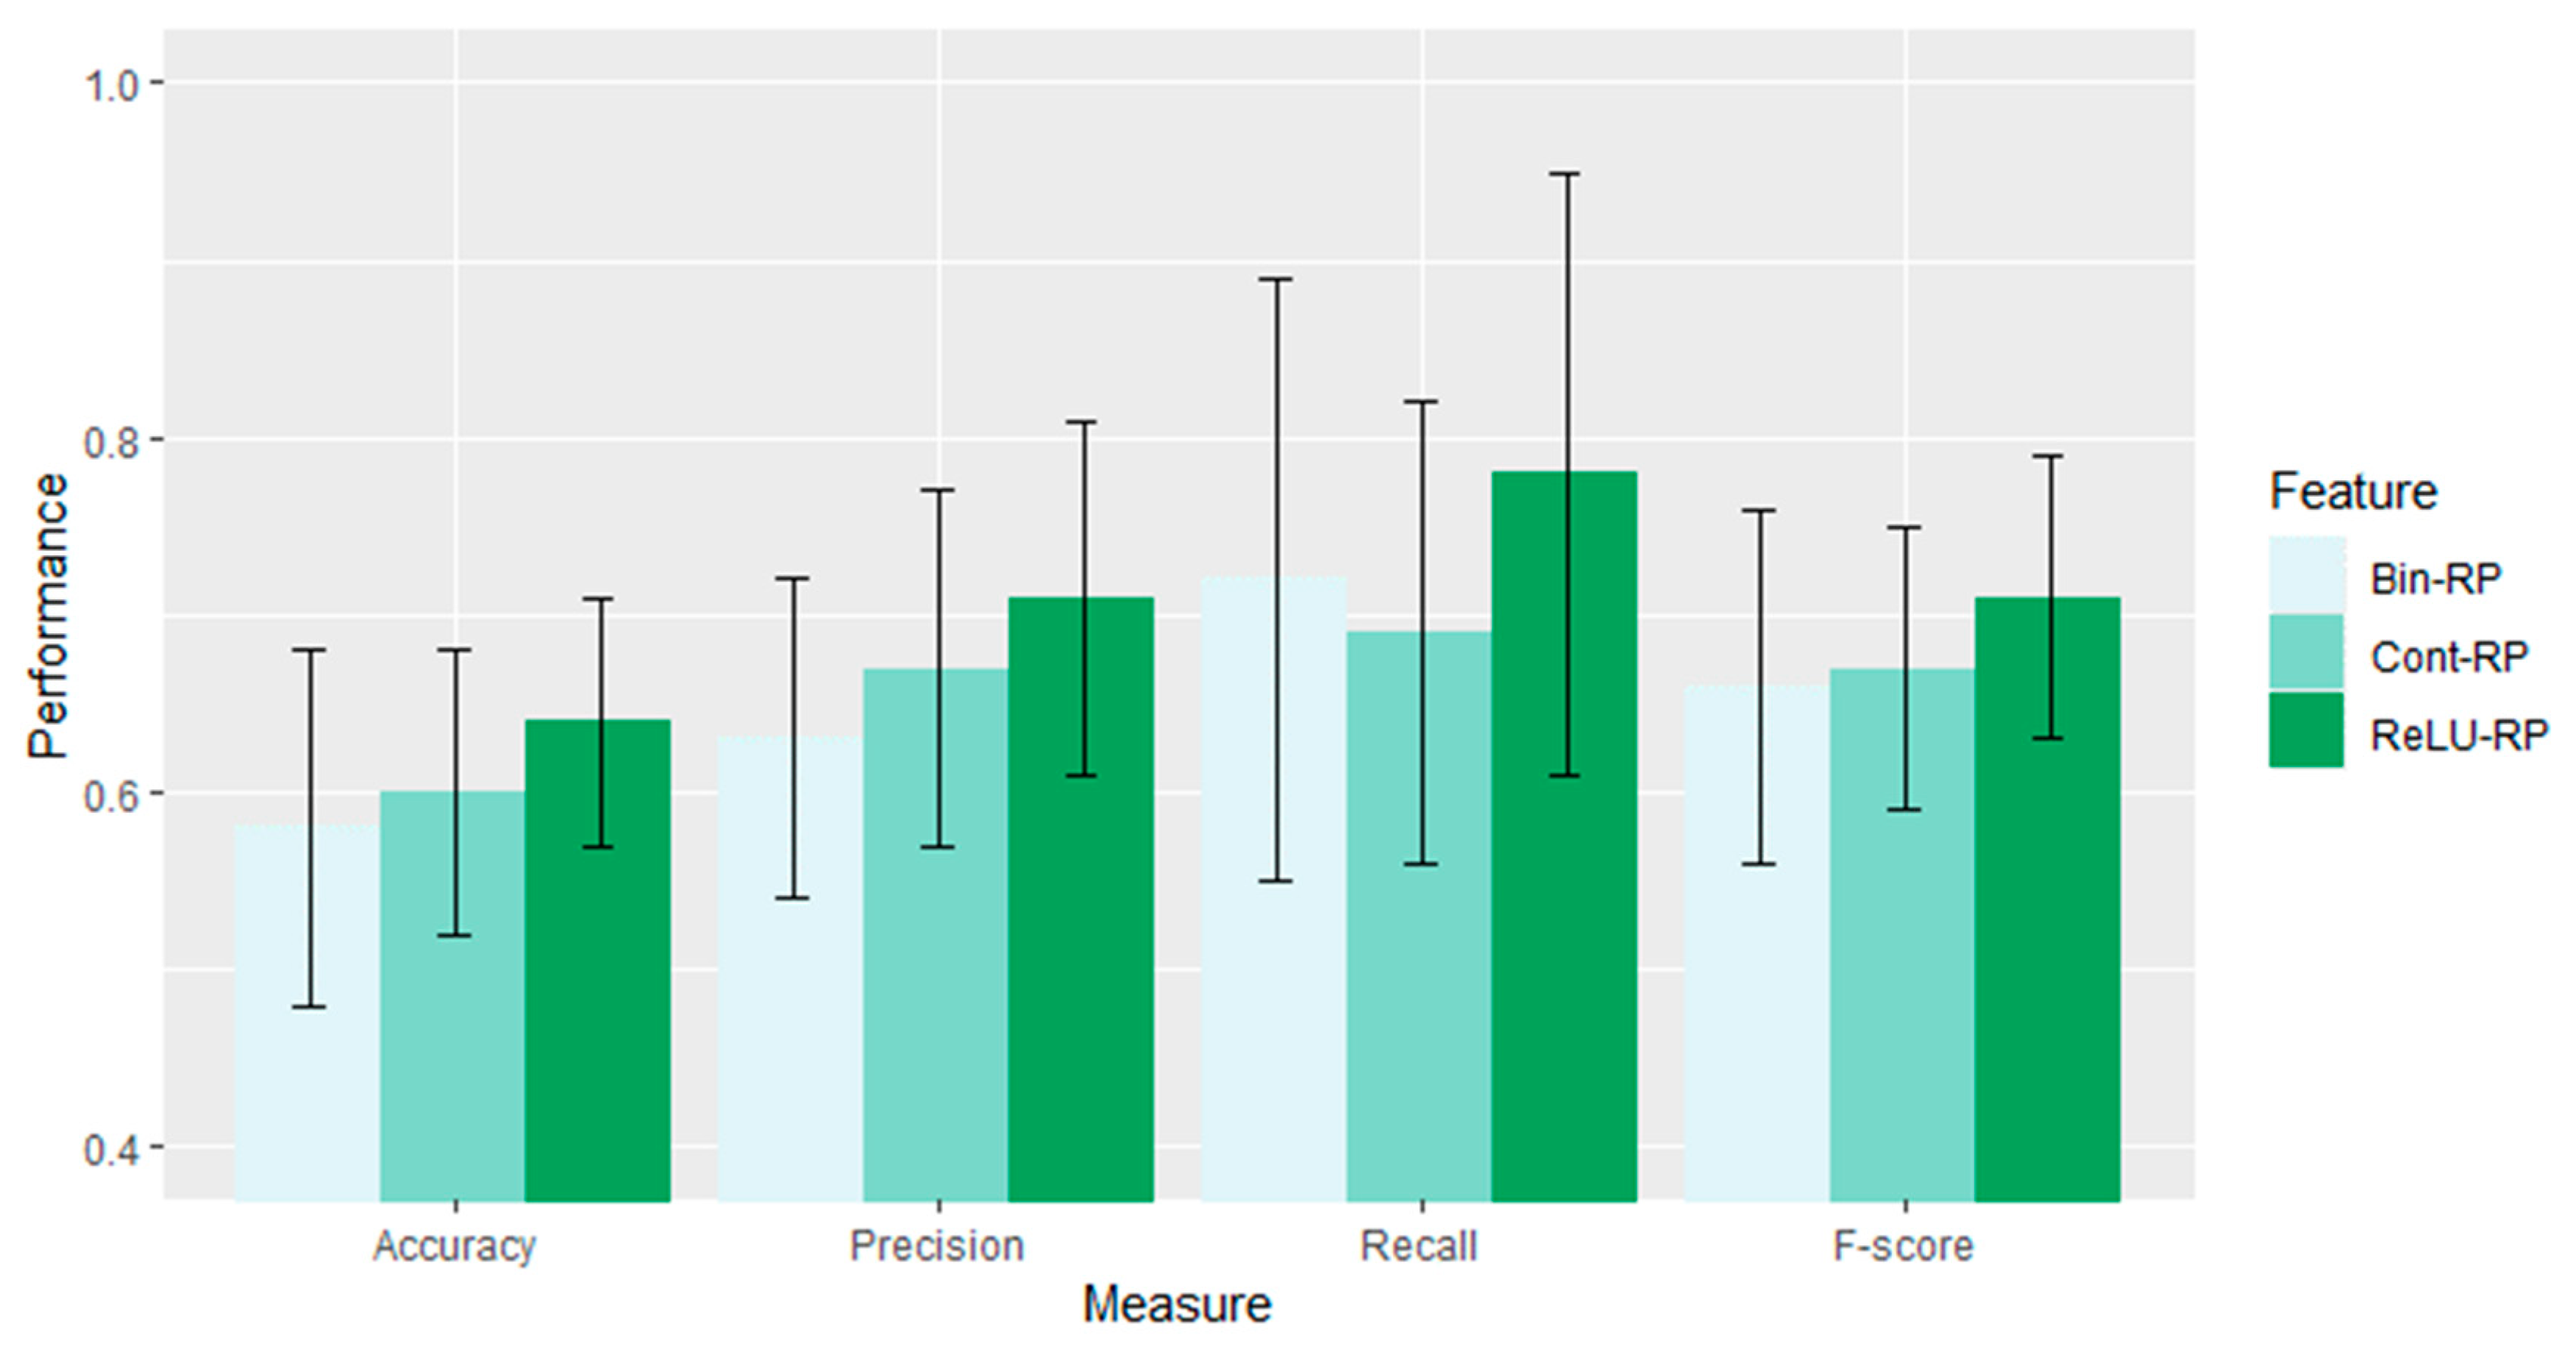
Firstly, we compared the classification performance between Bin-RP, Cont-RP, and ReLU-RP using CNN models for PPG data (see Figure 11). As in the ECG, ReLU-RP was generally superior to Bin-RP or Cont-RP overall in classifying drowsy and awake states. In addition, the overall classification performance was slightly lower and the standard deviation was greater than that of the ECG, but still maintained 58% to 64% accuracy. In particular, in PPG, ReLU-RP was 64% accurate, demonstrating much higher performance than Bin-RP and Cont-RP with 58% to 60% accuracy. Similar results were also observed with other measures such as precision and recall, and F-measure.
Also, as shown in Table 4, the CNN models using Bin-RP, Cont-RP, and ReLU-RP performed better with 58% to 64% accuracy than previous models using RQA features with 50% to 59% accuracy. Overall, the PPG band data were usually far more sensitive and unstable than the ECG strap data, and overall model performance was degraded. However, if the RP (especially, ReLU-RP) was used with the CNN model, the result seemed to be reasonably good, and was comparable to that of ECG using RQA features. Above all, models using ReLU-RP were still the best in terms of prediction accuracy, precision and recall, and F-measure.
In fact, the significance of our proposed method is in employing wearable ECG (or PPG) sensors (i.e., strap-type ECG sensor or band-type PPG sensor), which are easy to wear while driving, for HRV measurement. As these wearable sensors are convenient to use but very susceptible to noise, it is hard to expect that we can achieve as good a performance as with other specialized equipment. Moreover, a considerable number of samples, acquired from wearable ECG/PPG sensors, had mixed characteristics between drowsy and awake states. Despite such difficulties, our suggested ReLU-RP-based CNN model showed good and stable performance in both cases (70% classification accuracy for ECG and 64% for PPG). In particular, it showed superiority to other conventional models, providing approximately 6–17% better accuracy for ECG and 4–14% for PPG in drowsy/awake classification. From a practical point of view, band-type PPG sensors are much more attractive to use because of easiness to wear and less intrusiveness. Taking into consideration the proposed method, PPG might be a good alternative to ECG for various applications.
4. Conclusions
In this study, we suggested a robust driver drowsiness detection method that employs HRV measurements acquired from wearable ECG/PPG sensors. Particularly, we examined three types of RPs including Bin-RP, Cont-RP, and ReLU-RP. When ReLU-RP was used as the input to CNN, it could distinguish very well between drowsy and awake states by extracting and learning drowsiness characteristics with the pattern of vertical (or horizontal) lines from RRIs of heartbeats.
To assess the usefulness of the proposed models for realistic drowsiness detection, we did experiments with our in-house dataset that was collected with two body-worn sensors of ECG and PPG in a virtual driving simulation environment. Although this dataset is very limited and controlled, the results of the proposed methods seem to be quite promising. Furthermore, the CNN model using ReLU-RP was superior to previous models for both of ECG and PPG data. Thus, this method is expected to be highly utilizable for detecting driver sleepiness in actual driving situations. Furthermore, our model might be used to classify 2-min RRI samples that include epochs with different states between the first minute and second minute (i.e., awake–drowsy, drowsy–awake samples), by considering them as drowsy states, because they are not in a good condition for safe driving.
In future studies, we plan to investigate other types of physiological measures available in smart bands, such as skin temperature and galvanic skin response, for more robustness of drowsiness detection models. It would also be interesting to use the models with other vehicle-based or behavior-based measures.
Author Contributions
Conceptualization, H.L., J.L., and M.S.; methodology, H.L. and J.L.; software, H.L. and J.L.; validation, H.L.; writing, H.L., J.L., and M.S.; visualization, H.L; supervision, M.S.
Funding
This research was supported by the MSIT (Ministry of Science, ICT), Korea, under the ITRC (Information Technology Research Center) support program (IITP-2018-2016-0-00313) supervised by the IITP (Institute for Information & communications Technology Promotion).
Acknowledgments
We would like to thank colleagues from the Bio-Intelligence and Data Mining Laboratory of Kyungpook National University, Republic of Korea for assistance in accumulating experimental data. We also would like to thank the reviewers for their valuable comments on the manuscript.
Conflicts of Interest
The authors declare no conflicts of interest.
Abbreviations
The following abbreviations are used in this manuscript:
| HRV | Heart rate variability |
| RRI | R–R interval |
| ECG | Electrocardiogram |
| PPG | Photoplethysmogram |
| RP | Recurrence plot |
| RQA | Recurrence quantification analysis |
| ReLU | Rectified linear unit |
| CNN | Convolutional neural network |
References
- Sigari, M.H.; Fathy, M.; Soryani, M. A driver face monitoring system for fatigue and distraction detection. Int. J. Veh. Technol. 2013, 2013, 1–11. [Google Scholar] [CrossRef]
- Sun, Y.; Yu, X.B. An innovative nonintrusive driver assistance system for vital signal monitoring. IEEE J. Biomed. Health Inform. 2014, 18, 1932–1939. [Google Scholar] [CrossRef]
- Murata, A. Proposal of a method to predict subjective rating on drowsiness using physiological and behavioral measures. IIE Trans. Occup. 2016, 4, 128–140. [Google Scholar] [CrossRef]
- Li, Z.; Li, S.E.; Li, R.; Cheng, B.; Shi, J. Online detection of driver fatigue using steering wheel angles for real driving conditions. Sensors 2017, 17, 495. [Google Scholar] [CrossRef] [PubMed]
- Lim, S.; Yang, J.H. Driver state estimation by convolutional neural network using multimodal sensor data. Electron. Lett. 2016, 52, 1495–1497. [Google Scholar] [CrossRef]
- Reddy, B.; Kim, Y.H.; Yun, S.; Seo, C.; Jang, J. Real-time Driver Drowsiness Detection for Embedded System Using Model Compression of Deep Neural Networks. In Proceedings of the 2017 IEEE Conference on Computer Vision and Pattern Recognition Workshops (CVPRW), Honolulu, HI, USA, 21–26 July 2017; pp. 438–445. [Google Scholar] [CrossRef]
- Park, S.; Pan, F.; Kang, S.; Yoo, C.D. Driver drowsiness detection system based on feature representation learning using various deep networks. In Asian Conference on Computer Vision; Springer: Cham, Switzerland, 2016; pp. 154–164. ISBN 978-3-319-54525-7. [Google Scholar]
- Lyu, J.; Yuan, Z.; Chen, D. Long-term multi-granularity deep framework for driver drowsiness detection. arXiv, 2018; arXiv:1801.02325. [Google Scholar]
- Ngxande, M.; Tapamo, J.R.; Burke, M. Driver drowsiness detection using behavioral measures and machine learning techniques: A review of state-of-art techniques. In Proceedings of the 2017 Pattern Recognition Association of South Africa and Robotics and Mechatronics (PRASA-RobMech), Bloemfontein, South Africa, 30 November–1 December 2017; pp. 156–161. [Google Scholar] [CrossRef]
- Shabani, H.; Mikaili, M.; Noori, S.M.R. Assessment of recurrence quantification analysis (RQA) of EEG for development of a novel drowsiness detection system. Biomed. Eng. Lett. 2016, 6, 196–204. [Google Scholar] [CrossRef]
- Li, G.; Chung, W.Y. Detection of driver drowsiness using wavelet analysis of heart rate variability and a support vector machine classifier. Sensors 2013, 13, 16494–16511. [Google Scholar] [CrossRef] [PubMed]
- Nayak, S.K.; Bit, A.; Dey, A.; Mohapatra, B.; Pal, K. A Review on the Nonlinear Dynamical System Analysis of Electrocardiogram Signal. J. Healthc. Eng. 2018, 2018, 1–19. [Google Scholar] [CrossRef]
- Patel, M.; Lal, K.L.; Kavanagh, D.; Rossiter, P. Applying neural network analysis on heart rate variability data to assess driver fatigue. Expert Syst. Appl. 2011, 38, 7235–7242. [Google Scholar] [CrossRef]
- Jung, S.J.; Shin, H.S.; Chung, W.Y. Driver fatigue and drowsiness monitoring system with embedded electrocardiogram sensor on steering wheel. IET Intell. Transp. Syst. 2014, 8, 43–50. [Google Scholar] [CrossRef]
- Chui, K.T.; Tsang, K.F.; Chi, H.R.; Wu, C.K.; Ling, B.W.K. Electrocardiogram based classifier for driver drowsiness detection. In Proceedings of the 2015 IEEE International Conference in Industrial Informatics (INDIN), Cambridge, UK, 22–24 July 2015; Institute of Electrical and Electronics Engineers Inc.: Piscataway, NJ, USA, 2015; pp. 600–603. [Google Scholar] [CrossRef]
- Kim, S.; Choi, B.; Cho, T.; Lee, Y.; Koo, H.; Kim, D. Development of a Classification Model for Driver” s Drowsiness and Waking Status Using Heart Rate Variability and Respiratory Features. J. Ergon. Soc. Korea 2016, 35, 371–381. [Google Scholar] [CrossRef]
- Malik, J.; Lo, Y.L.; Wu, H.T. Sleep-wake classification via quantifying heart rate variability by convolutional neural network. Physiol. Meas. 2018, 39, 085004. [Google Scholar] [CrossRef] [PubMed]
- Vicente, J.; Laguna, P.; Bartra, A.; Bailón, R. Drowsiness detection using heart rate variability. Med. Biol. Eng. Comput. 2016, 54, 927–937. [Google Scholar] [CrossRef] [PubMed]
- Subramaniyam, N.P.; Hyttinen, J. Analysis of nonlinear dynamics of healthy and epileptic EEG signals using recurrence based complex network approach. In Proceedings of the 2013 International IEEE/EMBS Conference on Neural Engineering (NER), San Diego, CA, USA, 6–8 November 2013; pp. 605–608. [Google Scholar] [CrossRef]
- Al-Fahoum, A.S.; Qasaimeh, A.M. A practical reconstructed phase space approach for ECG arrhythmias classification. J. Med. Eng. Technol. 2013, 37, 401–408. [Google Scholar] [CrossRef] [PubMed]
- Eckmann, J.P.; Kamphorst, S.O.; Ruelle, D. Recurrence plots of dynamical systems. Europhys. Lett. 1987, 4, 973–977. [Google Scholar] [CrossRef]
- Marwan, N.; Wessel, N.; Meyerfeldt, U.; Schirdewan, A.; Kurths, J. Recurrence-plot-based measures of complexity and their application to heart-rate-variability data. Phys. Rev. E 2002, 66, 026702. [Google Scholar] [CrossRef] [PubMed]
- Nguyen, H.D.; Wilkins, B.A.; Cheng, Q.; Benjamin, B.A. An online sleep apnea detection method based on recurrence quantification analysis. IEEE J. Biomed. Health Inform. 2014, 18, 1285–1293. [Google Scholar] [CrossRef]
- Smietanowski, M.; Szelenberger, W.; Trzebski, A. Nonlinear dynamics of the cardiovascular parameters in sleep and sleep apnea. In memory of Alberto Malliani (1935–2006)—A brave heart and beautiful mind. J. Physiol. Pharmacol. 2006, 57, 55–68. [Google Scholar]
- Acharya, U.R.; Bhat, S.; Faust, O.; Adeli, H.; Chua, E.C.P.; Lim, W.J.E.; Koh, J.E.W. Nonlinear dynamics measures for automated EEG-based sleep stage detection. Eur. Neurol. 2015, 74, 268–287. [Google Scholar] [CrossRef]
- McDuff, D.; Gontarek, S.; Picard, R.W. Improvements in remote cardiopulmonary measurement using a five band digital camera. IEEE Trans. Biomed. Eng. 2014, 61, 2593–2601. [Google Scholar] [CrossRef]
- Tamura, T.; Maeda, Y.; Sekine, M.; Yoshida, M. Wearable photoplethysmographic sensors—Past and present. Electronics 2014, 3, 282–302. [Google Scholar] [CrossRef]
- Euro Truck Simulator 2. Available online: https://steamspy.com/app/227300 (accessed on 30 December 2018).
- Lee, J.; Kim, J.; Shin, M. Correlation Analysis between Electrocardiography (ECG) and Photoplethysmogram (PPG) Data for Driver’s Drowsiness Detection Using Noise Replacement Method. Procedia Comput. Sci. 2017, 116, 421–426. [Google Scholar] [CrossRef]
- RECURRENCE PLOTS. Available online: http://www.recurrence-plot.tk/ (accessed on 30 December 2018).
- Simonyan, K.; Zisserman, A. Very deep convolutional networks for large-scale image recognition. arXiv, 2014; arXiv:1409.1556. [Google Scholar]
Figure 1.
Overall workflow.

Figure 2.
Data collection instruments and environment: (a) Driving simulation environment; (b) physiological devices used for heart rate variability (HRV) collection: POLAR H7 Strap (left) and Microsoft BAND 2 (right).
Figure 2.
Data collection instruments and environment: (a) Driving simulation environment; (b) physiological devices used for heart rate variability (HRV) collection: POLAR H7 Strap (left) and Microsoft BAND 2 (right).

Figure 3.
An illustrative example of recurrence patterns (RP): (a) Bin-RP; (b) Cont-RP; (c) ReLU-RP.
Figure 3.
An illustrative example of recurrence patterns (RP): (a) Bin-RP; (b) Cont-RP; (c) ReLU-RP.

Figure 4.
Some examples of 2-min R–R interval (RRI) samples obtained from an electrocardiogram (ECG) (strap) sensor: (a) drowsy state; (b) awake state.
Figure 4.
Some examples of 2-min R–R interval (RRI) samples obtained from an electrocardiogram (ECG) (strap) sensor: (a) drowsy state; (b) awake state.

Figure 5.
Three types of RPs produced from ECG signals (shown in Figure 4) at drowsy (left) and awake (right) states: (a) Bin-RP; (b) Cont-RP; (c) ReLU-RP.
Figure 5.
Three types of RPs produced from ECG signals (shown in Figure 4) at drowsy (left) and awake (right) states: (a) Bin-RP; (b) Cont-RP; (c) ReLU-RP.

Figure 6.
Some examples of 2-min RRI samples obtained from a photoplethysmogram (PPG) (band) sensor: (a) drowsy state; (b) awake state.
Figure 6.
Some examples of 2-min RRI samples obtained from a photoplethysmogram (PPG) (band) sensor: (a) drowsy state; (b) awake state.

Figure 7.
Three types of RPs produced from PPG signals (shown in Figure 6) at drowsy (left) and awake (right) states: (a) Bin-RP; (b) Cont-RP; (c) ReLU-RP.
Figure 7.
Three types of RPs produced from PPG signals (shown in Figure 6) at drowsy (left) and awake (right) states: (a) Bin-RP; (b) Cont-RP; (c) ReLU-RP.

Figure 8.
A variety of ReLU-RPs from ECG (strap) signals with different thresholds (i.e., 0.15, 0.20, 0.25, and 0.33) at (a) drowsy and (b) awake states.
Figure 8.
A variety of ReLU-RPs from ECG (strap) signals with different thresholds (i.e., 0.15, 0.20, 0.25, and 0.33) at (a) drowsy and (b) awake states.

Figure 9.
Architecture of our fine-tuned VGG16 convolutional neural network (CNN). Here, we used five convolution blocks and two fully connected layers for classification.
Figure 9.
Architecture of our fine-tuned VGG16 convolutional neural network (CNN). Here, we used five convolution blocks and two fully connected layers for classification.

Figure 10.
Comparison of the drowsiness detection performance of Bin-RP vs. Cont-RP vs. ReLU-RP using ECG.
Figure 10.
Comparison of the drowsiness detection performance of Bin-RP vs. Cont-RP vs. ReLU-RP using ECG.

Figure 11.
Comparison of the drowsiness detection performance of Bin-RP vs. Cont-RP vs. ReLU-RP in PPG.
Figure 11.
Comparison of the drowsiness detection performance of Bin-RP vs. Cont-RP vs. ReLU-RP in PPG.


Table 1.
Statistical significance of recurrence quantification analysis (RQA) features for awake/drowsy differentiation from electrocardiogram (ECG) signals. Recurrence (REC), determinism (DET), ratio, longest diagonal size (Lmax), average diagonal length (Lmean), divergence (DIV), maximum vertical line length (Vmax), average vertical line length (Vmean), laminarity (LAM), and entropy (ENTR) features were measured.
| RQA Feature | Drowsy | Awake | p-Value |
|---|---|---|---|
| REC | 0.14 ± 0.04 | 0.14 ± 0.08 | 0.0473 |
| DET | 0.58 ± 0.16 | 0.53 ± 0.18 | 0.0075 |
| Ratio | 4.41 ± 0.90 | 4.05 ± 0.81 | 0.0002 |
| Lmax | 24.69 ± 21.03 | 23.08 ± 25.11 | 0.5337 |
| Lmean | 5.06 ± 0.90 | 6.21 ± 5.77 | 0.0201 |
| DIV | 0.06 ± 0.04 | 0.07 ± 0.04 | 0.013 |
| Vmax | 3.4 ± 7.51 | 4.88 ± 15.32 | 0.0305 |
| Vmean | 14.45 ± 1.10 | 15.24 ± 7.92 | 0.5727 |
| LAM | 1.91 ± 0.18 | 1.92 ± 0.20 | 0.9066 |
| ENTR | 0.7 ± 0.32 | 0.62 ± 0.49 | 0.0002 |
Table 2.
Statistical significance of RQA features for awake/drowsy differentiation from photoplethysmogram (PPG) signals.
Table 2.
Statistical significance of RQA features for awake/drowsy differentiation from photoplethysmogram (PPG) signals.
| RQA Feature | Drowsy | Awake | p-Value |
|---|---|---|---|
| REC | 0.27 ± 0.07 | 0.26 ± 0.07 | 0.4597 |
| DET | 0.69 ± 0.15 | 0.65 ± 0.13 | 0.0127 |
| Ratio | 2.57 ± 0.38 | 2.5 ± 0.34 | 0.0663 |
| Lmax | 42.57 ± 30.08 | 35.43 ± 25.45 | 0.0189 |
| Lmean | 5.94 ± 1.81 | 5.67 ± 1.89 | 0.1965 |
| DIV | 0.04 ± 0.02 | 0.04 ± 0.02 | 0.0234 |
| Vmax | 24.22 ± 10.35 | 23.61 ± 12.25 | 0.6299 |
| Vmean | 5.04 ± 2.18 | 4.67 ± 2.18 | 0.1276 |
| LAM | 0.82 ± 0.11 | 0.8 ± 0.1 | 0.0709 |
| ENTR | 2.26 ± 0.34 | 2.2 ± 0.34 | 0.0974 |
Table 3.
Drowsy/awake classification performance using ECG strap signals; performance measures were calculated based on 10-fold cross-validation. LR—logistic regression; KNN—K-nearest neighbor; SVM—support vector machine; and RF—random forest.
Table 3.
Drowsy/awake classification performance using ECG strap signals; performance measures were calculated based on 10-fold cross-validation. LR—logistic regression; KNN—K-nearest neighbor; SVM—support vector machine; and RF—random forest.
| Feature | Model | Accuracy | Precision | Recall | F-Score | |
|---|---|---|---|---|---|---|
| RQA features | 6 significant features | LR | 0.62 ± 0.07 | 0.64 ± 0.07 | 0.85 ± 0.07 | 0.73 ± 0.06 |
| KNN | 0.61 ± 0.08 | 0.66 ± 0.10 | 0.71 ± 0.10 | 0.68 ± 0.08 | ||
| SVM | 0.57 ± 0.05 | 0.67 ± 0.10 | 0.53 ± 0.12 | 0.59 ± 0.09 | ||
| RF | 0.61 ± 0.07 | 0.65 ± 0.07 | 0.77 ± 0.12 | 0.70 ± 0.07 | ||
| All 10 features | LR | 0.63 ± 0.10 | 0.65 ± 0.10 | 0.81 ± 0.09 | 0.72 ± 0.09 | |
| KNN | 0.54 ± 0.05 | 0.61 ± 0.08 | 0.68 ± 0.06 | 0.64 ± 0.05 | ||
| SVM | 0.53 ± 0.04 | 0.62 ± 0.08 | 0.52 ± 0.11 | 0.56 ± 0.08 | ||
| RF | 0.60 ± 0.07 | 0.63 ± 0.08 | 0.78 ± 0.09 | 0.69 ± 0.06 | ||
| Recurrence plot (RP) | Bin-RP | CNN | 0.62 ± 0.07 | 0.65 ± 0.07 | 0.79 ± 0.09 | 0.71 ± 0.06 |
| Cont-RP | 0.64 ± 0.05 | 0.67 ± 0.06 | 0.76 ± 0.13 | 0.71 ± 0.06 | ||
| ReLU-RP | 0.70 ± 0.06 | 0.71 ± 0.07 | 0.85 ± 0.10 | 0.77 ± 0.05 | ||
Table 4.
Drowsy/awake classification performance using PPG band signals; performance measures were calculated based on 10-fold cross-validation.
Table 4.
Drowsy/awake classification performance using PPG band signals; performance measures were calculated based on 10-fold cross-validation.
| Feature | Model | Accuracy | Precision | Recall | F-Score | |
|---|---|---|---|---|---|---|
| RQA features | 3 significant features | LR | 0.54 ± 0.07 | 0.67 ± 0.10 | 0.46 ± 0.10 | 0.54 ± 0.09 |
| KNN | 0.59 ± 0.07 | 0.64 ± 0.08 | 0.72 ± 0.09 | 0.67 ± 0.08 | ||
| SVM | 0.57 ± 0.06 | 0.68 ± 0.10 | 0.54 ± 0.11 | 0.59 ± 0.08 | ||
| RF | 0.56 ± 0.10 | 0.62 ± 0.10 | 0.67 ± 0.10 | 0.64 ± 0.09 | ||
| All 10 features | LR | 0.58 ± 0.07 | 0.66 ± 0.07 | 0.61 ± 0.09 | 0.63 ± 0.07 | |
| KNN | 0.50 ± 0.10 | 0.56 ± 0.09 | 0.67 ± 0.12 | 0.61 ± 0.10 | ||
| SVM | 0.56 ± 0.06 | 0.67 ± 0.09 | 0.55 ± 0.08 | 0.60 ± 0.06 | ||
| RF | 0.55 ± 0.07 | 0.61 ± 0.07 | 0.69 ± 0.07 | 0.65 ± 0.06 | ||
| Recurrence plot (RP) | Bin-RP | CNN | 0.58 ± 0.10 | 0.63 ± 0.09 | 0.72 ± 0.17 | 0.66 ± 0.10 |
| Cont-RP | 0.60 ± 0.08 | 0.67 ± 0.10 | 0.69 ± 0.13 | 0.67 ± 0.08 | ||
| ReLU-RP | 0.64 ± 0.07 | 0.71 ± 0.10 | 0.78 ±0.17 | 0.71 ±0.08 | ||
© 2019 by the authors. Licensee MDPI, Basel, Switzerland. This article is an open access article distributed under the terms and conditions of the Creative Commons Attribution (CC BY) license (http://creativecommons.org/licenses/by/4.0/).
Share and Cite
MDPI and ACS Style
Lee, H.; Lee, J.; Shin, M. Using Wearable ECG/PPG Sensors for Driver Drowsiness Detection Based on Distinguishable Pattern of Recurrence Plots. Electronics 2019, 8, 192. https://doi.org/10.3390/electronics8020192
AMA Style
Lee H, Lee J, Shin M. Using Wearable ECG/PPG Sensors for Driver Drowsiness Detection Based on Distinguishable Pattern of Recurrence Plots. Electronics. 2019; 8(2):192. https://doi.org/10.3390/electronics8020192
Chicago/Turabian StyleLee, Hyeonjeong, Jaewon Lee, and Miyoung Shin. 2019. "Using Wearable ECG/PPG Sensors for Driver Drowsiness Detection Based on Distinguishable Pattern of Recurrence Plots" Electronics 8, no. 2: 192. https://doi.org/10.3390/electronics8020192
Note that from the first issue of 2016, this journal uses article numbers instead of page numbers. See further details here.