Investigation of Future 5G-IoT Millimeter-Wave Network Performance at 38 GHz for Urban Microcell Outdoor Environment

 , , ,
, , ,
Abstract
:1. Introduction
2. Related Work
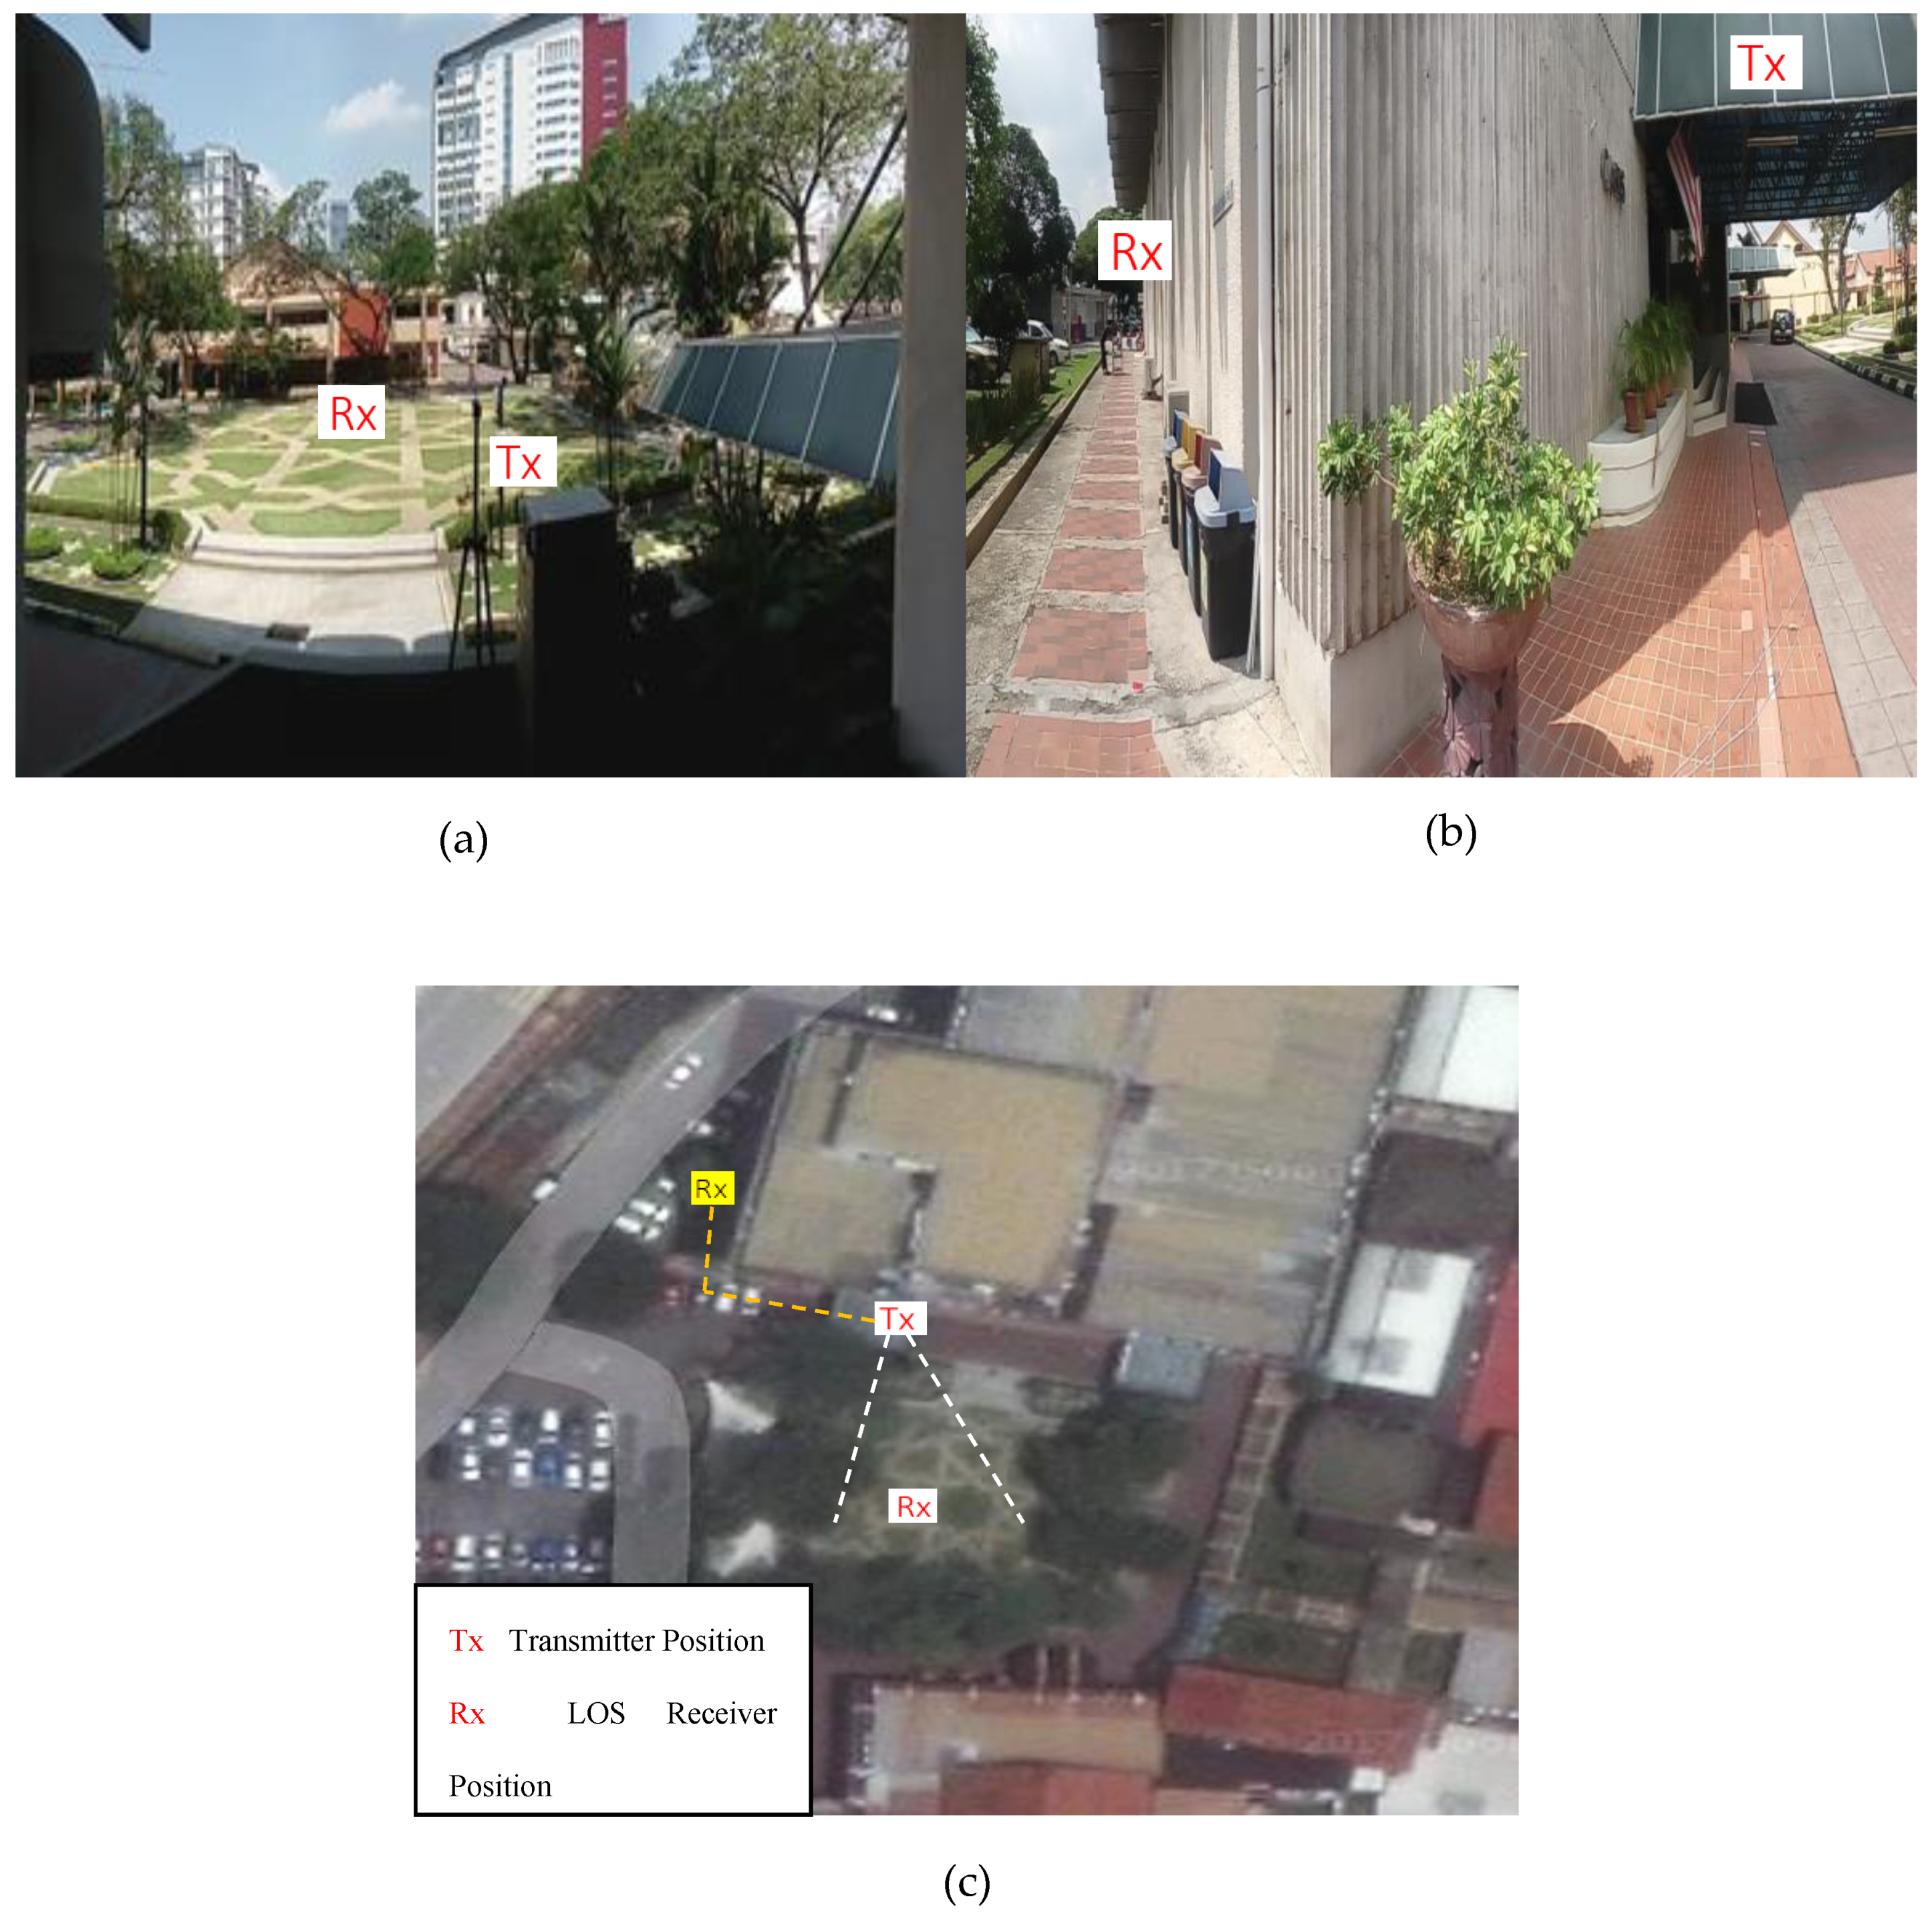
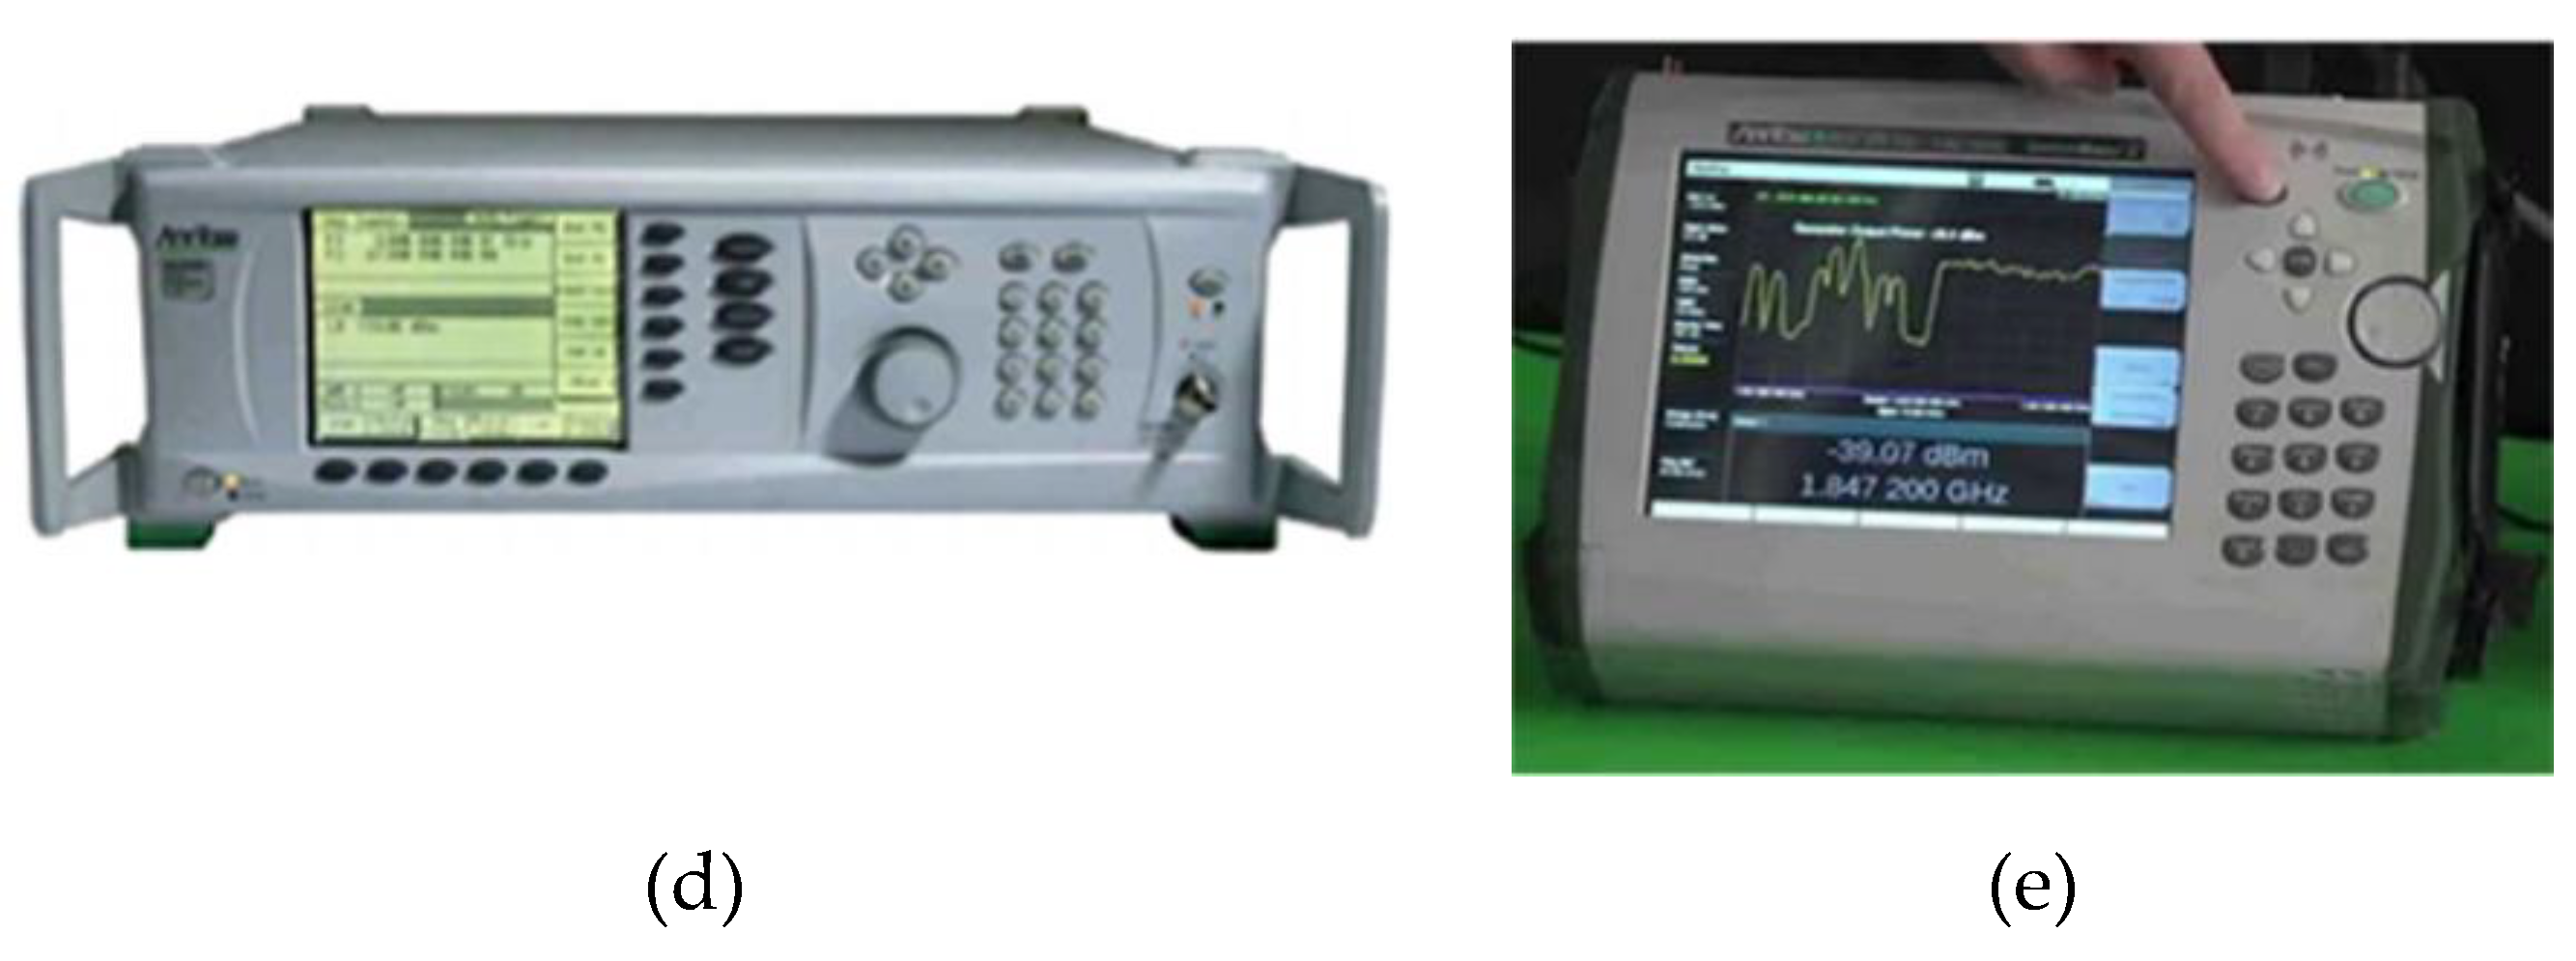
3. Measurement Setup
3.1. Hardware Description
3.2. The Experimental Procedures
4. Large-Scale Path Loss Models
5. Experimental Results
6. Simulation Setup
7. Simulation Results
8. Conclusions
Data Availability
Author Contributions
Funding
Acknowledgments
Conflicts of Interest
References
- Huang, S.; Cai, J.; Chen, H.; Zhang, H. Transmit power optimization for amplify-and-forward relay networks with reduced overheads. IEEE Trans. Veh. Technol. 2016, 65, 5033–5044. [Google Scholar] [CrossRef]
- Liang, Q.; Durrani, T.S.; Liang, J.; Wang, X. Enabling Technologies for 5G Mobile Systems. Mob. Inf. Syst. 2016, 2016, 1945783. [Google Scholar] [CrossRef]
- Hossain, E.; Hasan, M. 5G cellular: Key enabling technologies and research challenges. IEEE Instrum. Meas. Mag. 2015, 18, 11–21. [Google Scholar] [CrossRef]
- Akyildiz, I.F.; Nie, S.; Lin, S.-C.; Chandrasekaran, M. 5G roadmap: 10 Key enabling technologies. Comput. Netw. 2016, 106, 17–48. [Google Scholar] [CrossRef]
- Khawam, K.; Lahoud, S.; Ibrahim, M.; Yassin, M.; Martin, S.; El Helou, M.; Moety, F. Radio access technology selection in heterogeneous networks. Phys. Commun. 2016, 18, 125–139. [Google Scholar] [CrossRef]
- Gachhadar, A.; Hindia, M.N.; Qamar, F.; Siddiqui, M.H.S.; Noordin, K.A.; Amiri, I.S. Modified genetic algorithm based power allocation scheme for amplify-and-forward cooperative relay network. Comput. Electr. Eng. 2018, 69, 628–641. [Google Scholar] [CrossRef]
- Noordin, K.A.B.; Hindia, M.N.; Qamar, F.; Dimyati, K. Power Allocation Scheme Using PSO for Amplify and Forward Cooperative Relaying Network. In Science and Information Conference; Springer: Cham, Switzerland, 2018; Volume 857, pp. 636–647. [Google Scholar]
- Rappaport, T.S.; Sun, S.; Mayzus, R.; Zhao, H.; Azar, Y.; Wang, K.; Wong, G.N.; Schulz, J.K.; Samimi, M.; Gutierrez, F. Millimeter wave mobile communications for 5G cellular: It will work! IEEE Access 2013, 1, 335–349. [Google Scholar] [CrossRef]
- Rappaport, T.S.; Sun, S.; Shafi, M. 5G Channel model with improved accuracy and efficiency in mmWave bands. IEEE 5G Tech. Focus 2017, 1, 1–6. [Google Scholar]
- Rappaport, T.S.; Sun, S.; Shafi, M. Investigation and comparison of 3GPP and NYUSIM channel models for 5G wireless communications. arXiv 2017, arXiv:1707.00291. [Google Scholar]
- Sun, S.; Rappaport, T.S.; Shafi, M. Hybrid beamforming for 5G millimeter-wave multi-cell networks. arXiv 2018, arXiv:1803.03986. [Google Scholar]
- Mogensen, P.; Pajukoski, K.; Tiirola, E.; Vihriala, J.; Lahetkangas, E.; Berardinelli, G.; Tavares, F.M.; Mahmood, N.H.; Lauridsen, M.; Catania, D.; et al. Centimeter-wave concept for 5G ultra-dense small cells. In Proceedings of the 2014 IEEE 79th Vehicular Technology Conference (VTC Spring), Seoul, South Korea, 18–21 May 2014; pp. 1–6. [Google Scholar]
- Rappaport, T.S. 5G Millimeter Wave Wireless: Trials, Testimonies, and Target Rollouts. In Proceedings of the IEEE International Conference on Computer Communications, Honolulu, HI, USA, 15–19 April 2018. [Google Scholar]
- Wang, T.; Li, G.; Huang, B.; Miao, Q.; Fang, J.; Li, P.; Tan, H.; Li, W.; Ding, J.; Li, J. Spectrum Analysis and Regulations for 5G. In 5G Mobile Communications; Springer: Cham, Switzerland, 2017; pp. 27–50. [Google Scholar]
- Udeshi, D.; Qamar, F. Quality Analysis of Epon Network for Uplink and Downlink Design. Asian J. Eng. Sci. Technol. 2014, 4, 78–83. [Google Scholar]
- Hindia, M.N.; Qamar, F.; Rahman, T.A.; Amiri, I.S. A stochastic geometrical approach for full-duplex MIMO relaying model of high-density network. Ad Hoc Netw. 2018, 74, 34–46. [Google Scholar] [CrossRef]
- Niu, Y.; Li, Y.; Jin, D.; Su, L.; Vasilakos, A.V. A survey of millimeter wave communications (mmWave) for 5G: Opportunities and challenges. Wirel. Netw. 2015, 21, 2657–2676. [Google Scholar] [CrossRef]
- Panwar, N.; Sharma, S.; Singh, A.K. A survey on 5G: The next generation of mobile communication. Phys. Commun. 2016, 18, 64–84. [Google Scholar] [CrossRef]
- Abbas, T.; Qamar, F.; Ahmed, I.; Dimyati, K.; Majed, M.B. Propagation channel characterization for 28 and 73 GHz millimeter-wave 5G frequency band. In Proceedings of the 2017 IEEE 15th Student Conference on Research and Development (SCOReD), Putrajaya, Malaysia, 13–14 December 2017; pp. 297–302. [Google Scholar]
- Hong, W.; Baek, K.; Lee, Y. Quantitative analysis of the effects of polarization and pattern reconfiguration for mmWave 5G mobile antenna prototypes. In Proceedings of the 2017 IEEE Radio and Wireless Symposium (RWS), Phoenix, AZ, USA, 15–18 January 2017; pp. 68–71. [Google Scholar]
- Hong, W. Solving the 5G Mobile Antenna Puzzle: Assessing Future Directions for the 5G Mobile Antenna Paradigm Shift. IEEE Microw. Mag. 2017, 18, 86–102. [Google Scholar] [CrossRef]
- McClean, B. Worldwide Cellphone Subscriptions Forecast to Exceed Worldwide Population in 2015; IC Insights, INC.: Scottsdale, AZ, USA, 2014. [Google Scholar]
- Qamar, F.; Dimyati, K.B.; Hindia, M.N.; Noordin, K.A.B.; Al-Samman, A.M. A Comprehensive Review on Coordinated Multi-Point Operation for LTE-A. Comput. Netw. 2017, 123, 19–37. [Google Scholar] [CrossRef]
- Gupta, A.; Jha, R.K. A survey of 5G network: Architecture and emerging technologies. IEEE Access 2015, 3, 1206–1232. [Google Scholar] [CrossRef]
- Andrews, J.G.; Buzzi, S.; Choi, W.; Hanly, S.V.; Lozano, A.; Soong, A.C.; Zhang, J.C. What will 5G be? IEEE J. Sel. Areas Commun. 2014, 32, 1065–1082. [Google Scholar] [CrossRef]
- Gohil, A.; Modi, H.; Patel, S.K. 5G technology of mobile communication: A survey. In Proceedings of the 2013 International Conference on Intelligent Systems and Signal Processing (ISSP), Gujarat, India, 1–2 March 2013; pp. 288–292. [Google Scholar]
- The Start of Something, 3rd Generation Partnership Project (3GPP). Phoenix, Arizona, USA, 19 September 2015. Available online: https://www.3gpp.org/news-events/1734-ran_5g (accessed on 1 April 2019).
- Adler, R.F.; Charles, M. Preparing for a 5G World. The Aspen Institute: Washington, DC, USA, 2016; Available online: http://csreports.aspeninstitute.org/documents/PreparingFor5G.pdf (accessed on 1 April 2019).
- Mittal, K.; Pathania, S.; Reddy, P.; Rawal, D. Channel State Information feedback overhead reduction using Arithmetic coding in massive MIMO systems. In Proceedings of the 2016 3rd International Conference on Signal Processing and Integrated Networks (SPIN), Noida, India, 11–12 February 2016; pp. 328–331. [Google Scholar]
- Navabi, S.; Wang, C.; Bursalioglu, O.Y.; Papadopoulos, H. Predicting wireless channel features using neural networks. In Proceedings of the 2018 IEEE International Conference on Communications (ICC), Kansas City, MO, USA, 20–24 May 2018; pp. 1–6. [Google Scholar]
- Chen, H.; Liu, L.; Matyjas, J.D.; Medley, M.J. Optimal resource allocation for sensing-based spectrum sharing D2D networks. Comput. Electr. Eng. 2015, 44, 107–121. [Google Scholar] [CrossRef]
- Qamar, F.; Abbas, T.; Hindia, M.N.; Dimyati, K.B.; Noordin, K.A.B.; Ahmed, I. Characterization of MIMO propagation channel at 15 GHz for the 5G spectrum. In Proceedings of the 2017 IEEE 13th Malaysia International Conference on Communications (MICC), Johor Bahru, Malaysia, 28–30 November 2017; pp. 265–270. [Google Scholar]
- Rappaport, T.S. Wireless Communications: Principles and Practice; Prentice Hall: Upper Saddle River, NJ, USA, 1996. [Google Scholar]
- Qamar, F.; Siddiqui, M.H.S.; Dimyati, K.; Noordin, K.A.B.; Majed, M.B. Channel characterization of 28 and 38 GHz MM-wave frequency band spectrum for the future 5G network. In Proceedings of the 2017 IEEE 15th Student Conference on Research and Development (SCOReD), Putrajaya, Malaysia, 13–14 December 2017; pp. 291–296. [Google Scholar]
- Ahamed, M.M.; Faruque, S. Propagation factors affecting the performance of 5G millimeter wave radio channel. In Proceedings of the 2016 IEEE International Conference on Electro Information Technology (EIT), Grand Forks, ND, USA, 19–21 May 2016; pp. 728–733. [Google Scholar]
- Hindia, M.N.; Qamar, F.; Majed, M.B.; Rahman, T.A.; Amiri, I.S. Enabling remote-control for the power sub-stations over LTE-A networks. Telecommun. Syst. 2019, 70, 37–53. [Google Scholar] [CrossRef]
- Rappaport, T.S.; MacCartney, G.R.; Samimi, M.K.; Sun, S. Wideband millimeter-wave propagation measurements and channel models for future wireless communication system design. IEEE Trans. Commun. 2015, 63, 3029–3056. [Google Scholar] [CrossRef]
- Al-Samman, A.; Rahman, T.; Hindia, M.; Daho, A.; Hanafi, E.J.S. Path Loss Model for Outdoor Parking Environments at 28 GHz and 38 GHz for 5G Wireless. Networks 2018, 10, 672. [Google Scholar] [CrossRef]
- Hossain, F.; Geok, T.K.; Rahman, T.A.; Hindia, M.N.; Dimyati, K.; Ahmed, S.; Tso, C.P.; Rahman, A.; Ziela, N. An Efficient 3-D Ray Tracing Method: Prediction of Indoor Radio Propagation at 28 GHz in 5G Network. Electronics 2019, 8, 286. [Google Scholar] [CrossRef]
- Sun, S.; Rappaport, T.S.; Rangan, S.; Thomas, T.A.; Ghosh, A.; Kovacs, I.Z.; Rodriguez, I.; Koymen, O.; Partyka, A.; Jarvelainen, J. Propagation path loss models for 5G urban micro-and macro-cellular scenarios. In Proceedings of the 2016 IEEE 83rd Vehicular Technology Conference (VTC Spring), Nanjing, China, 15–18 May 2016; pp. 1–6. [Google Scholar]
- Phillips, C.; Sicker, D.; Grunwald, D. A survey of wireless path loss prediction and coverage mapping methods. IEEE Commun. Surv. Tutor. 2013, 15, 255–270. [Google Scholar] [CrossRef]
- Maccartney, G.R.; Rappaport, T.S.; Sun, S.; Deng, S. Indoor office wideband millimeter-wave propagation measurements and channel models at 28 and 73 GHz for ultra-dense 5G wireless networks. IEEE Access 2015, 3, 2388–2424. [Google Scholar] [CrossRef]
- MacCartney, G.R.; Rappaport, T.S.; Samimi, M.K.; Sun, S. Millimeter-wave omnidirectional path loss data for small cell 5G channel modeling. IEEE Access 2015, 3, 1573–1580. [Google Scholar] [CrossRef]
- Hur, S. Millimeter-wave channel modeling on 28 GHz. In Proceedings of the 9th IC1004 MC and Scientific Meeting, Ferrara, Italy, 5–7 February 2014; Available online: http://www.ic1004.org/index4f22.html?page=ferrara-italy---2014 (accessed on 1 April 2019).
- Hur, S.; Cho, Y.J.; Kim, T.; Park, J. Millimeter-wave channel modeling based on measurements in in-building campus and urban environments at 28 GHz. In Proceedings of the 11th IC1004 MC and Scientific Meeting, Krakow, Poland, 24–26 September 2014; Available online: http://www.ic1004.org/indexb26f.html?page=krakow-poland---2014 (accessed on 1 April 2019).
- Al-Samman, A.; Rahman, T.; Azmi, M.; Hindia, M.; Khan, I.; Hanafi, E. Statistical modelling and characterization of experimental mm-wave indoor channels for future 5G wireless communication networks. PLoS ONE 2016, 11, e0163034. [Google Scholar] [CrossRef]
- Samimi, M.K.; Rappaport, T.S.; MacCartney, G.R. Probabilistic omnidirectional path loss models for millimeter-wave outdoor communications. IEEE Wirel. Commun. Lett. 2015, 4, 357–360. [Google Scholar] [CrossRef]
- MacCartney, G.R.; Rappaport, T.S. 73 GHz millimeter wave propagation measurements for outdoor urban mobile and backhaul communications in New York City. In Proceedings of the 2014 IEEE International Conference on Communications (ICC), Sydney, NSW, Australia, 10–14 June 2014; pp. 4862–4867. [Google Scholar]
- Rappaport, T.S.; Ben-Dor, E.; Murdock, J.N.; Qiao, Y. 38 GHz and 60 GHz angle-dependent propagation for cellular & peer-to-peer wireless communications. In Proceedings of the 2012 IEEE International Conference on Communications (ICC), Ottawa, ON, Canada, 10–15 June 2012; pp. 4568–4573. [Google Scholar]
- Sulyman, A.I.; Nassar, A.T.; Samimi, M.K.; MacCartney, G.R.; Rappaport, T.S.; Alsanie, A. Radio propagation path loss models for 5G cellular networks in the 28 GHz and 38 GHz millimeter-wave bands. IEEE Commun. Mag. 2014, 52, 78–86. [Google Scholar] [CrossRef]
- Zhong, Z.; Li, C.; Zhao, J.; Zhang, X. Height-dependent path loss model and large-scale characteristics analysis of 28 GHz and 38.6 GHz in urban micro scenarios. In Proceedings of the 2017 11th European Conference on Antennas and Propagation (EUCAP), Paris, France, 19–24 March 2017; pp. 1818–1822. [Google Scholar]
- Al-Samman, A.; Hindia, M.; Rahman, T. Path loss model in outdoor environment at 32 GHz for 5G system. In Proceedings of the 2016 IEEE 3rd International Symposium on Telecommunication Technologies (ISTT), Kuala Lumpur, Malaysia, 28–30 November 2016; pp. 9–13. [Google Scholar]
- Hur, S.; Cho, Y.J.; Kim, T.; Park, J.; Molisch, A.F.; Haneda, K.; Peter, M. Wideband spatial channel model in an urban cellular environments at 28 GHz. In Proceedings of the 2015 9th European Conference on Antennas and Propagation (EuCAP), Lisbon, Portugal, 13–17 April 2015; pp. 1–5. [Google Scholar]
- Sayeed, A.; Brady, J.; Cheng, P.; Tayyab, U. Indoor channel measurements using a 28GHz multi-beam MIMO prototype. In Proceedings of the 2016 IEEE 84th Vehicular Technology Conference (VTC-Fall), Montreal, QC, Canada, 18–21 September 2016; pp. 1–5. [Google Scholar]
- Larsson, C.; Olsson, B.-E.; Medbo, J. Angular Resolved Pathloss Measurements in Urban Macrocell Scenarios at 28 GHz. In Proceedings of the 2016 IEEE 84th Vehicular Technology Conference (VTC-Fall), Montreal, QC, Canada, 18–21 September 2016; pp. 1–5. [Google Scholar]
- Huang, J.; Wang, C.-X.; Feng, R.; Sun, J.; Zhang, W.; Yang, Y. Multi-frequency mmWave massive MIMO channel measurements and characterization for 5G wireless communication systems. IEEE J. Sel. Areas Commun. 2017, 35, 1591–1605. [Google Scholar] [CrossRef]
- Huang, J.; Feng, R.; Sun, J.; Wang, C.-X.; Zhang, W.; Yang, Y. Multi-frequency millimeter wave massive MIMO channel measurements and analysis. In Proceedings of the 2017 IEEE International Conference on Communications (ICC), Paris, France, 21–25 May 2017; pp. 1–6. [Google Scholar]
- Sulyman, A.I.; Alwarafy, A.; MacCartney, G.R.; Rappaport, T.S.; Alsanie, A. Directional radio propagation path loss models for millimeter-wave wireless networks in the 28-, 60-, and 73-GHz bands. IEEE Trans. Wirel. Commun. 2016, 15, 6939–6947. [Google Scholar]
- Park, J.-J.; Liang, J.; Lee, J.; Kwon, H.-K.; Kim, M.-D.; Park, B. Millimeter-wave channel model parameters for urban microcellular environment based on 28 and 38 GHz measurements. In Proceedings of the 2016 IEEE 27th Annual International Symposium on Personal, Indoor, and Mobile Radio Communications (PIMRC), Montreal, QC, Canada, 8–13 October 2017; pp. 1–5. [Google Scholar]
- Chen, J.; Bin, F.; Ge, X.; Li, Q.; Wang, C.-X. A dual-directional path-loss model in 5G wireless fractal small cell networks. In Proceedings of the 2017 IEEE International Conference on Communications (ICC), Paris, France, 21–25 May 2017; pp. 1–6. [Google Scholar]
- Sulyman, A.I.; Seleem, H.; Alwarafy, A.; Humadi, K.; Alsanie, A. Effects of Solar Radio Emissions on Outdoor Propagation Path Loss Models at 60 GHz bands for Access/backhaul links and D2D communications. IEEE Trans. Antennas Propag. 2017, 65, 6624–6635. [Google Scholar] [CrossRef]
- Sasaki, M.; Nakamura, M.; Inomata, M.; Takatori, Y.; Kitao, K.; Imai, T. Path loss frequency dependence at 2–26 GHz in an urban macro cell environment. In Proceedings of the 2017 IEEE International Symposium on Antennas and Propagation and USNC/URSI National Radio Science Meeting, San Diego, CA, USA, 9–14 July 2017; pp. 601–602. [Google Scholar]
- Karttunen, A.; Molisch, A.F.; Hur, S.; Park, J.; Zhang, C.J. Spatially Consistent Street-by-Street Path Loss Model for 28-GHz Channels in Micro Cell Urban Environments. IEEE Trans. Wirel. Commun. 2017, 16, 7538–7550. [Google Scholar] [CrossRef]
- Hossain, F.; Geok, T.; Rahman, T.; Hindia, M.; Dimyati, K.; Abdaziz, A.J.S. Indoor Millimeter-Wave Propagation Prediction by Measurement and Ray Tracing Simulation at 38 GHz. Symmetry 2018, 10, 464. [Google Scholar] [CrossRef]
- Hindia, M.N.; Al-Samman, A.M.; Rahman, T.A.; Yazdani, T. Outdoor large-scale path loss characterization in an urban environment at 26, 28, 36, and 38 GHz. Phys. Commun. 2018, 27, 150–160. [Google Scholar] [CrossRef]
- Hindia, M.N.; Al-Samman, A.M.; Rahman, T.B.A. Investigation of large-scale propagation for outdoor-parking lot environment for 5G wireless communications. In Proceedings of the2016 IEEE 3rd International Symposium on Telecommunication Technologies (ISTT), Kuala Lumpur, Malaysia, 28–30 November 2016; pp. 14–18. [Google Scholar]
- Sun, S.; MacCartney, G.R.; Rappaport, T.S. Millimeter-wave distance-dependent large-scale propagation measurements and path loss models for outdoor and indoor 5G systems. In Proceedings of the 2016 10th European Conference on Antennas and Propagation (EuCAP), Davos, Switzerland, 10–15 April 2016; pp. 1–5. [Google Scholar]
- Sun, S.; Rappaport, T.S.; Thomas, T.A.; Ghosh, A.; Nguyen, H.C.; Kovács, I.Z.; Rodriguez, I.; Koymen, O.; Partyka, A. Investigation of prediction accuracy, sensitivity, and parameter stability of large-scale propagation path loss models for 5G wireless communications. IEEE Trans. Veh. Technol. 2016, 65, 2843–2860. [Google Scholar] [CrossRef]
- Zheng, Y.; Blostein, S.D. Cooperative uplink cellular systems with multi-antenna relays and heterogeneous users. In Proceedings of the 2013 IEEE Global Communications Conference (GLOBECOM), Atlanta, GA, USA, 9–13 December 2013; pp. 3896–3901. [Google Scholar]
- Sun, S.; Rappaport, T.; Shafi, M.; Tang, P.; Zhang, J.; Smith, P.J. Propagation models and performance evaluation for 5G millimeter-wave bands. IEEE Trans. Veh. Technol. 2018, 67, 8422–8439. [Google Scholar] [CrossRef]
- MacCartney, G.R.; Zhang, J.; Nie, S.; Rappaport, T.S. Path loss models for 5G millimeter wave propagation channels in urban microcells. In Proceedings of the 2013 IEEE Global Communications Conference (GLOBECOM), Atlanta, GA, USA, 9–13 December 2013; pp. 3948–3953. [Google Scholar]
- Evolved Universal Terrestrial Radio Access (E-UTRA); Radio Frequency (RF) system scenarios ‘TR 36.942’. 3rd Generation Partnership Project (3GPP), Arizona, USA, January 2015. Available online: https://portal.3gpp.org/desktopmodules/Specifications/SpecificationDetails.aspx?specificationId=2592 (accessed on 1 April 2019).
- Universal Mobile Telecommunications System (UMTS); RF System Scenarios; TR 25.942 version 14.0.0 Release 14. 3rd Generation Partnership Project (3GPP). Nice, France, April 2017. Available online: https://www.etsi.org/deliver/etsi_tr/125900_125999/125942/14.00.00_60/tr_125942v140000p.pdf (accessed on 1 April 2019).
- Technical Specification Group RAN, E-UTRA; Physical Channels and Modulation TS 36.211’. 3rd Generation Partnership Project (3GPP). Arizona, USA, July 2012. Available online: https://portal.3gpp.org/desktopmodules/Specifications/SpecificationDetails.aspx?specificationId=2592 (accessed on 1 April 2019).
- Arnau, J.; Atzeni, I.; Kountouris, M. Impact of LOS/NLOS propagation and path loss in ultra-dense cellular networks. In Proceedings of the 2016 IEEE International Conference on Communications (ICC), Kuala Lumpur, Malaysia, 22–27 May 2016; pp. 1–6. [Google Scholar]
- Osseiran, A.; Monserrat, J.F.; Marsch, P. 5G Mobile and Wireless Communications Technology; Cambridge University Press: Cambridge, UK, 2016. [Google Scholar]
- Tsiropoulou, E.E.; Kastrinogiannis, T.; Papavassiliou, S. Uplink power control in qos-aware multi-service cdma wireless networks. J. Commun. 2009, 4, 654–668. [Google Scholar] [CrossRef]
- Kastrinogiannis, T.; Tsiropoulou, E.-E.; Papavassiliou, S. Utility-based uplink power control in CDMA wireless networks with real-time services. In Proceedings of the International Conference on Ad-Hoc Networks and Wireless; Springer: Berlin, German, 2008; pp. 307–320. [Google Scholar]
- Lee, P.; Lee, T.; Jeong, J.; Shin, J. Interference management in LTE femtocell systems using fractional frequency reuse. In Proceedings of the 2010 the 12th International Conference on Advanced Communication Technology (ICACT), Phoenix Park, South Korea, 7–10 February 2010; Volume 2, pp. 1047–1051. [Google Scholar]
- Muhammad, S.S.; Kohldorfer, P.; Leitgeb, E. Channel modeling for terrestrial free space optical links. In Proceedings of the 2005 7th International Conference Transparent Optical Networks, Barcelona, Catalonia, Spain, 7 July 2005; Volume 1, pp. 407–410. [Google Scholar]
- Qamar, F.; Hindia, M.N.; Abbas, T.; Dimyati, K.B.; Amiri, I.S. Investigation of QoS Performance Evaluation over 5G Network for Indoor Environment at millimeter wave Bands. Int. J. Electron. Telecommun. 2019, 65, 95–101. [Google Scholar]
- Chayon, H.R.; Dimyati, K.; Ramiah, H.; Reza, A.W. An Improved Radio Resource Management with Carrier Aggregation in LTE Advanced. Appl. Sci. 2017, 7, 394. [Google Scholar] [CrossRef]
- Kim, H.; Kim, K.; Han, Y.; Yun, S. A proportional fair scheduling for multicarrier transmission systems. In Proceedings of the 2004 IEEE 60th Vehicular Technology Conference (VTC2004-Fall), Los Angeles, CA, USA, 26–29 September 2004; Volume 1, pp. 409–413. [Google Scholar]
- Djouama, A.; Lim, M.-S. Reduction of the feedback delay effect on a proportional fair scheduler in LTE downlink using nonlinear support vector machine prediction. AEU Int. J. Electron. Commun. 2015, 69, 1393–1402. [Google Scholar] [CrossRef]
- Ge, X.; Cheng, H.; Guizani, M.; Han, T. 5G wireless backhaul networks: Challenges and research advances. IEEE Netw. 2014, 28, 6–11. [Google Scholar] [CrossRef]
- Marinello, J.C.; Abrão, T. Pilot distribution optimization in multi-cellular large scale MIMO systems. AEU Int. J. Electron. Commun. 2016, 70, 1094–1103. [Google Scholar] [CrossRef]
- Jungnickel, V.; Manolakis, K.; Zirwas, W.; Panzner, B.; Braun, V.; Lossow, M.; Sternad, M.; Apelfrojd, R.; Svensson, T. The role of small cells, coordinated multipoint, and massive MIMO in 5G. IEEE Commun. Mag. 2014, 52, 44–51. [Google Scholar] [CrossRef]


| Models/Scenarios | Methodologies | Advantages | Important Results | References |
|---|---|---|---|---|
| Large-scale high-density path loss model for ultra-dense indoor environment | Omnidirectional path loss model with directional antenna are utilizes for 28 and 73 GHz frequency band channel measurement | Utilizing of antenna pointing angles deceases the mean square delay spread | Accurate large-scale path loss model (CI free space) for distance and frequency as compared to existing 3GPP and FI model | [42] |
| Omnidirectional propagation large-scale path loss for high-density urban scenarios | Utilizing 3D ray-tracing simulators to conduct the experiment at 28, 38, and 73 GHz frequency band for LOS and NLOS scenario | Proposed model already widely been used by known companies (Nokia and Samsung) | Large-scale pathloss models using CI 1 meter free-space reference distance measurements are presented at 28, 38, and 73 GHz | [43] |
| Probabilistic omnidirectional propagation model for outdoor scenario | Uses CI and FI path loss model at 28 and 73 GHz | Proposes the probabilistic weighting function which is useful for LOS and NLOS determination | Proposed model is useful to estimated coverage, interference and outage | [47] |
| 73 GHz mmWave Propagation measurements for outdoor Urban scenario | E-band propagation measurement for both backhaul and mobile scenario by using directional antennas | Use of beam combining and beam forming lower the path losses | Achieved PLEs values are comparable with current microwave cellular PLEs values | [48] |
| Angle-dependent peer-to-peer RF wideband channel measurements | Utilizes narrow beam antennas at mmWave carrier frequencies at 38 and 60 GHz for both LOS and NLOS | Higher SNR and low root-mean-square delay is achieved by shaping optimum antenna pointing angle | Tx-Rx distance has an inverse relation on Path loss values | [49] |
| Modification of industry-standard path loss models | Beam forming at 28 and 38 GHz based on arbitrary pointing angles of directional antennas | Coverage range increases which reduces the required number of the 5G BSs | 20 times higher capacity gains as compared to current LTE network | [50] |
| Height dependent path loss model at 28 and 38.6 GHz | Utilized Omnidirectional antennas and high-power gain amplifier for NLOS urban micro outdoor scenario | The achieved result is better as compared to 3GPP path loss models at 3.5 GHz | Investigates the effect of shadowing and penetration losses caused by the human body and herbage environment | [51] |
| Large-scale path loss model at the 32 GHz frequency band | Co and cross antenna polarizations for the directional Tx and Rx antenna for CI and FI model | Suggested PLE values for horn-to-horn and horn-to-omnidirectional outlined | CI path loss model shows lower performance as compared to FI path loss models in NLOS scenario | [52] |
| Wideband spatial Channel propagation analysis at 28 GHz | Investigates the spatiotemporal channel characteristics such as multipath delay, angular statistics and pathloss | Useful for the high-density urban environment | Performed clustering analysis for its power distribution | [53] |
| New measurement methodology for indoor channel at 28 GHz | Multibeam forming using continuous aperture phased MIMO (CAP-MIMO) | It achieved spatial resolution, freedom to simultaneous multibeam and improved network performance | Four electronically selectable beams can simultaneously measure four spatial channels | [54] |
| Highly directional path loss measurement for urban microcell scenario at 28 GHz frequency band | Angularly resolution path loss measurement for both azimuth and elevation polarization | Provide better signal quality as received for LOS path | Small and specular objects reflecting causing more energy loss | [55] |
| Propagation characteristics at 11, 16, 28, and 38 GHz mmWave frequency band | The space-alternating generalized expectation (SAGE)- maximization algorithm is applied to obtain multipath component | Validated to use of large antenna array system for mmWave channel modelling | It investigates the spherical wavefront, cluster birth-death and non-stationarity property over the antenna array | [56,57] |
| Standard theoretical free space (FS) and Stanford University Interim (SUI) path loss model at 28, 60 and 73 GHz | Number of beams (or discrete angles) combined at the Rx, can result in strong received signal power | Strong achieved power signal in adaptive array systems | It provides generalized beam combining model for mmWave path loss prediction | [58] |
| Urban microcell wideband at 28 and 38 GHz | Using channel sounder equipped with omnidirectional and steerable directional antenna | Characterizes path loss, shadow fading, delay spread, angular spread and clustering parameters | PLE for LOS case in 2 and for NLOS case in 3 and similar large- and small-scale parameters achieved at 28 and 38 GHz | [59] |
| Blockage effect causes low coverage for small cell networks | Dual-directional path loss model incorporates for both LOS and NLOS transmissions | Higher Coverage probability and better average achievable rate | Higher BSs and lower blockages intensity cause lower average achievable rate | [60] |
| Outdoor propagation path loss models at 60 GHz bands | Investigates the effects of solar radio emissions for access/backhaul links and D2D communications | This study helps to prepare appropriate link budgets for deploying 60 GHz for hot and sunny weather | Results shows 9 to 15.6% higher PLE values in hot sunny weather (41–42°) as compared to cool night weather (20–38°) | [61] |
| Measurement at 2 to 26 GHz in an urban macro cell environment | Path loss frequency dependence is investigated | Dependence is similar in LOS areas | Larger frequency dependence is found for NLOS environment | [62] |
| Spatially consistent street-by-street path loss model for the 28 GHz microcell scenario | Model is based on large calibrated raytracing (RT) simulation dataset of 11 BS locations and over 60,000 PL data points | Achieve better spatial consistency | Different shadow fading, PL slope, variance, correlation distance, offset for each street | [63] |
| Env. | Pol. | PLE | |XPF| | ||
|---|---|---|---|---|---|
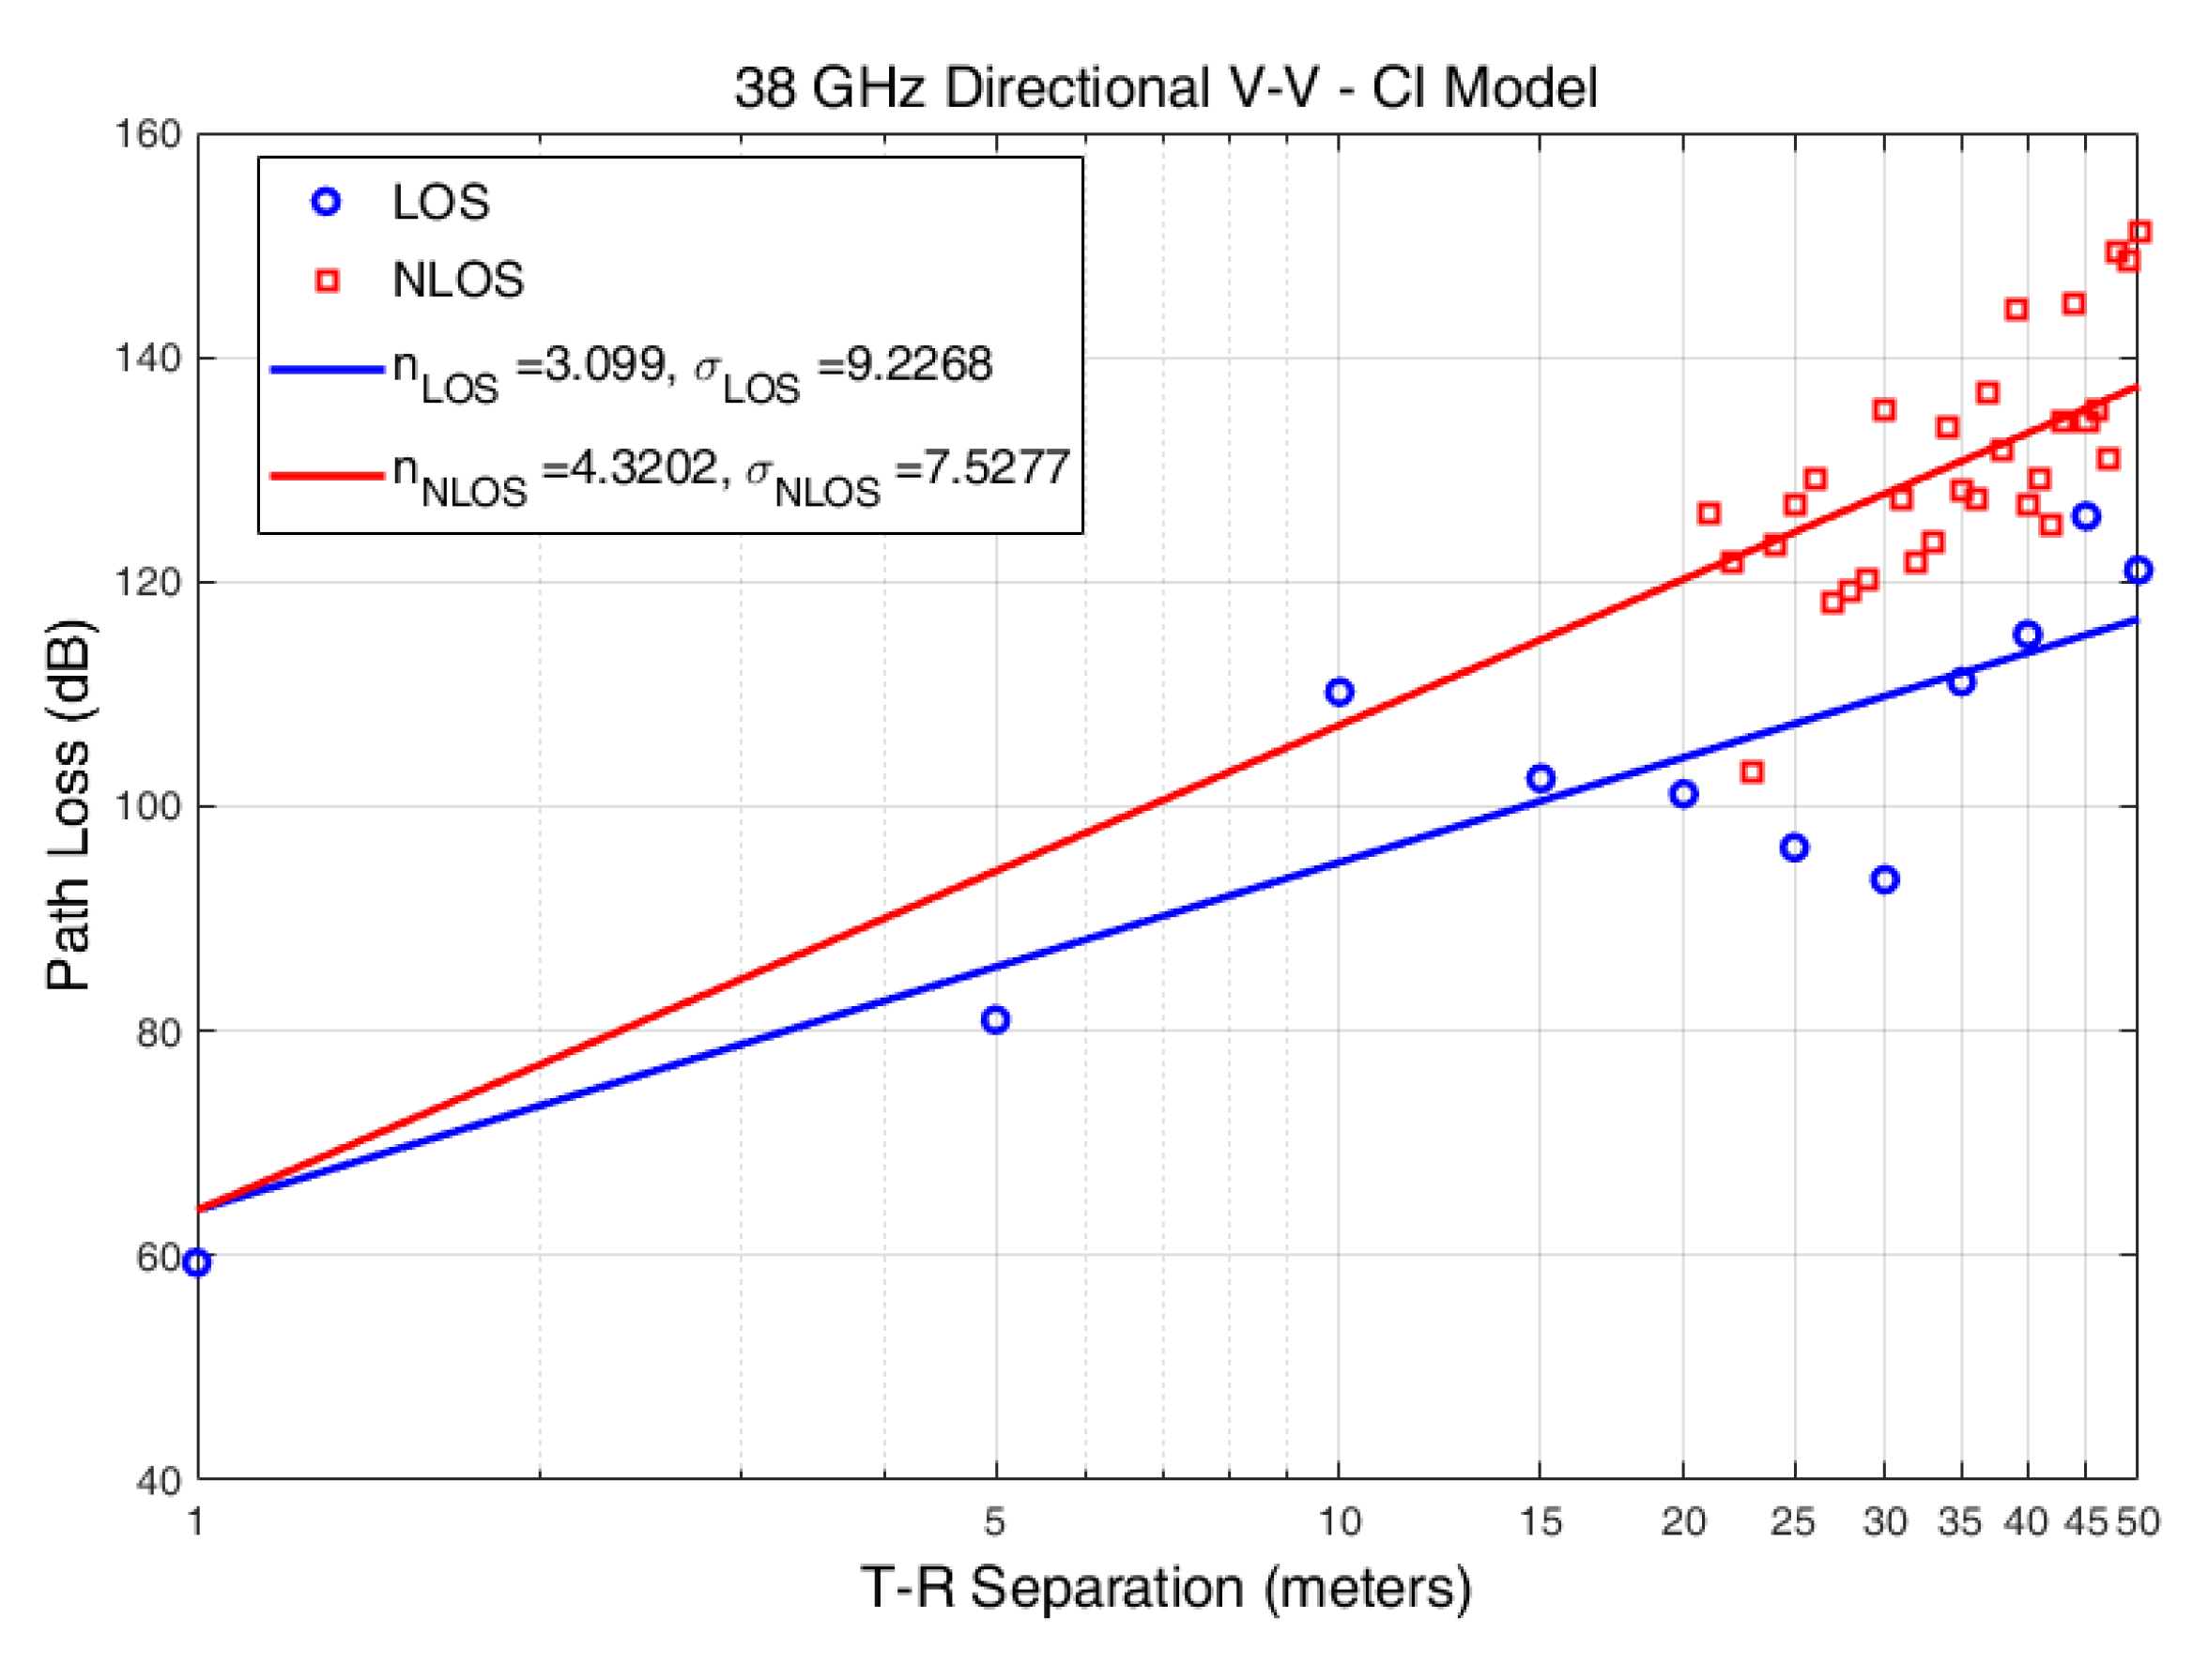
| LOS | V-V | 3.0990 | 1 | 9.2268 | 0.9227 |
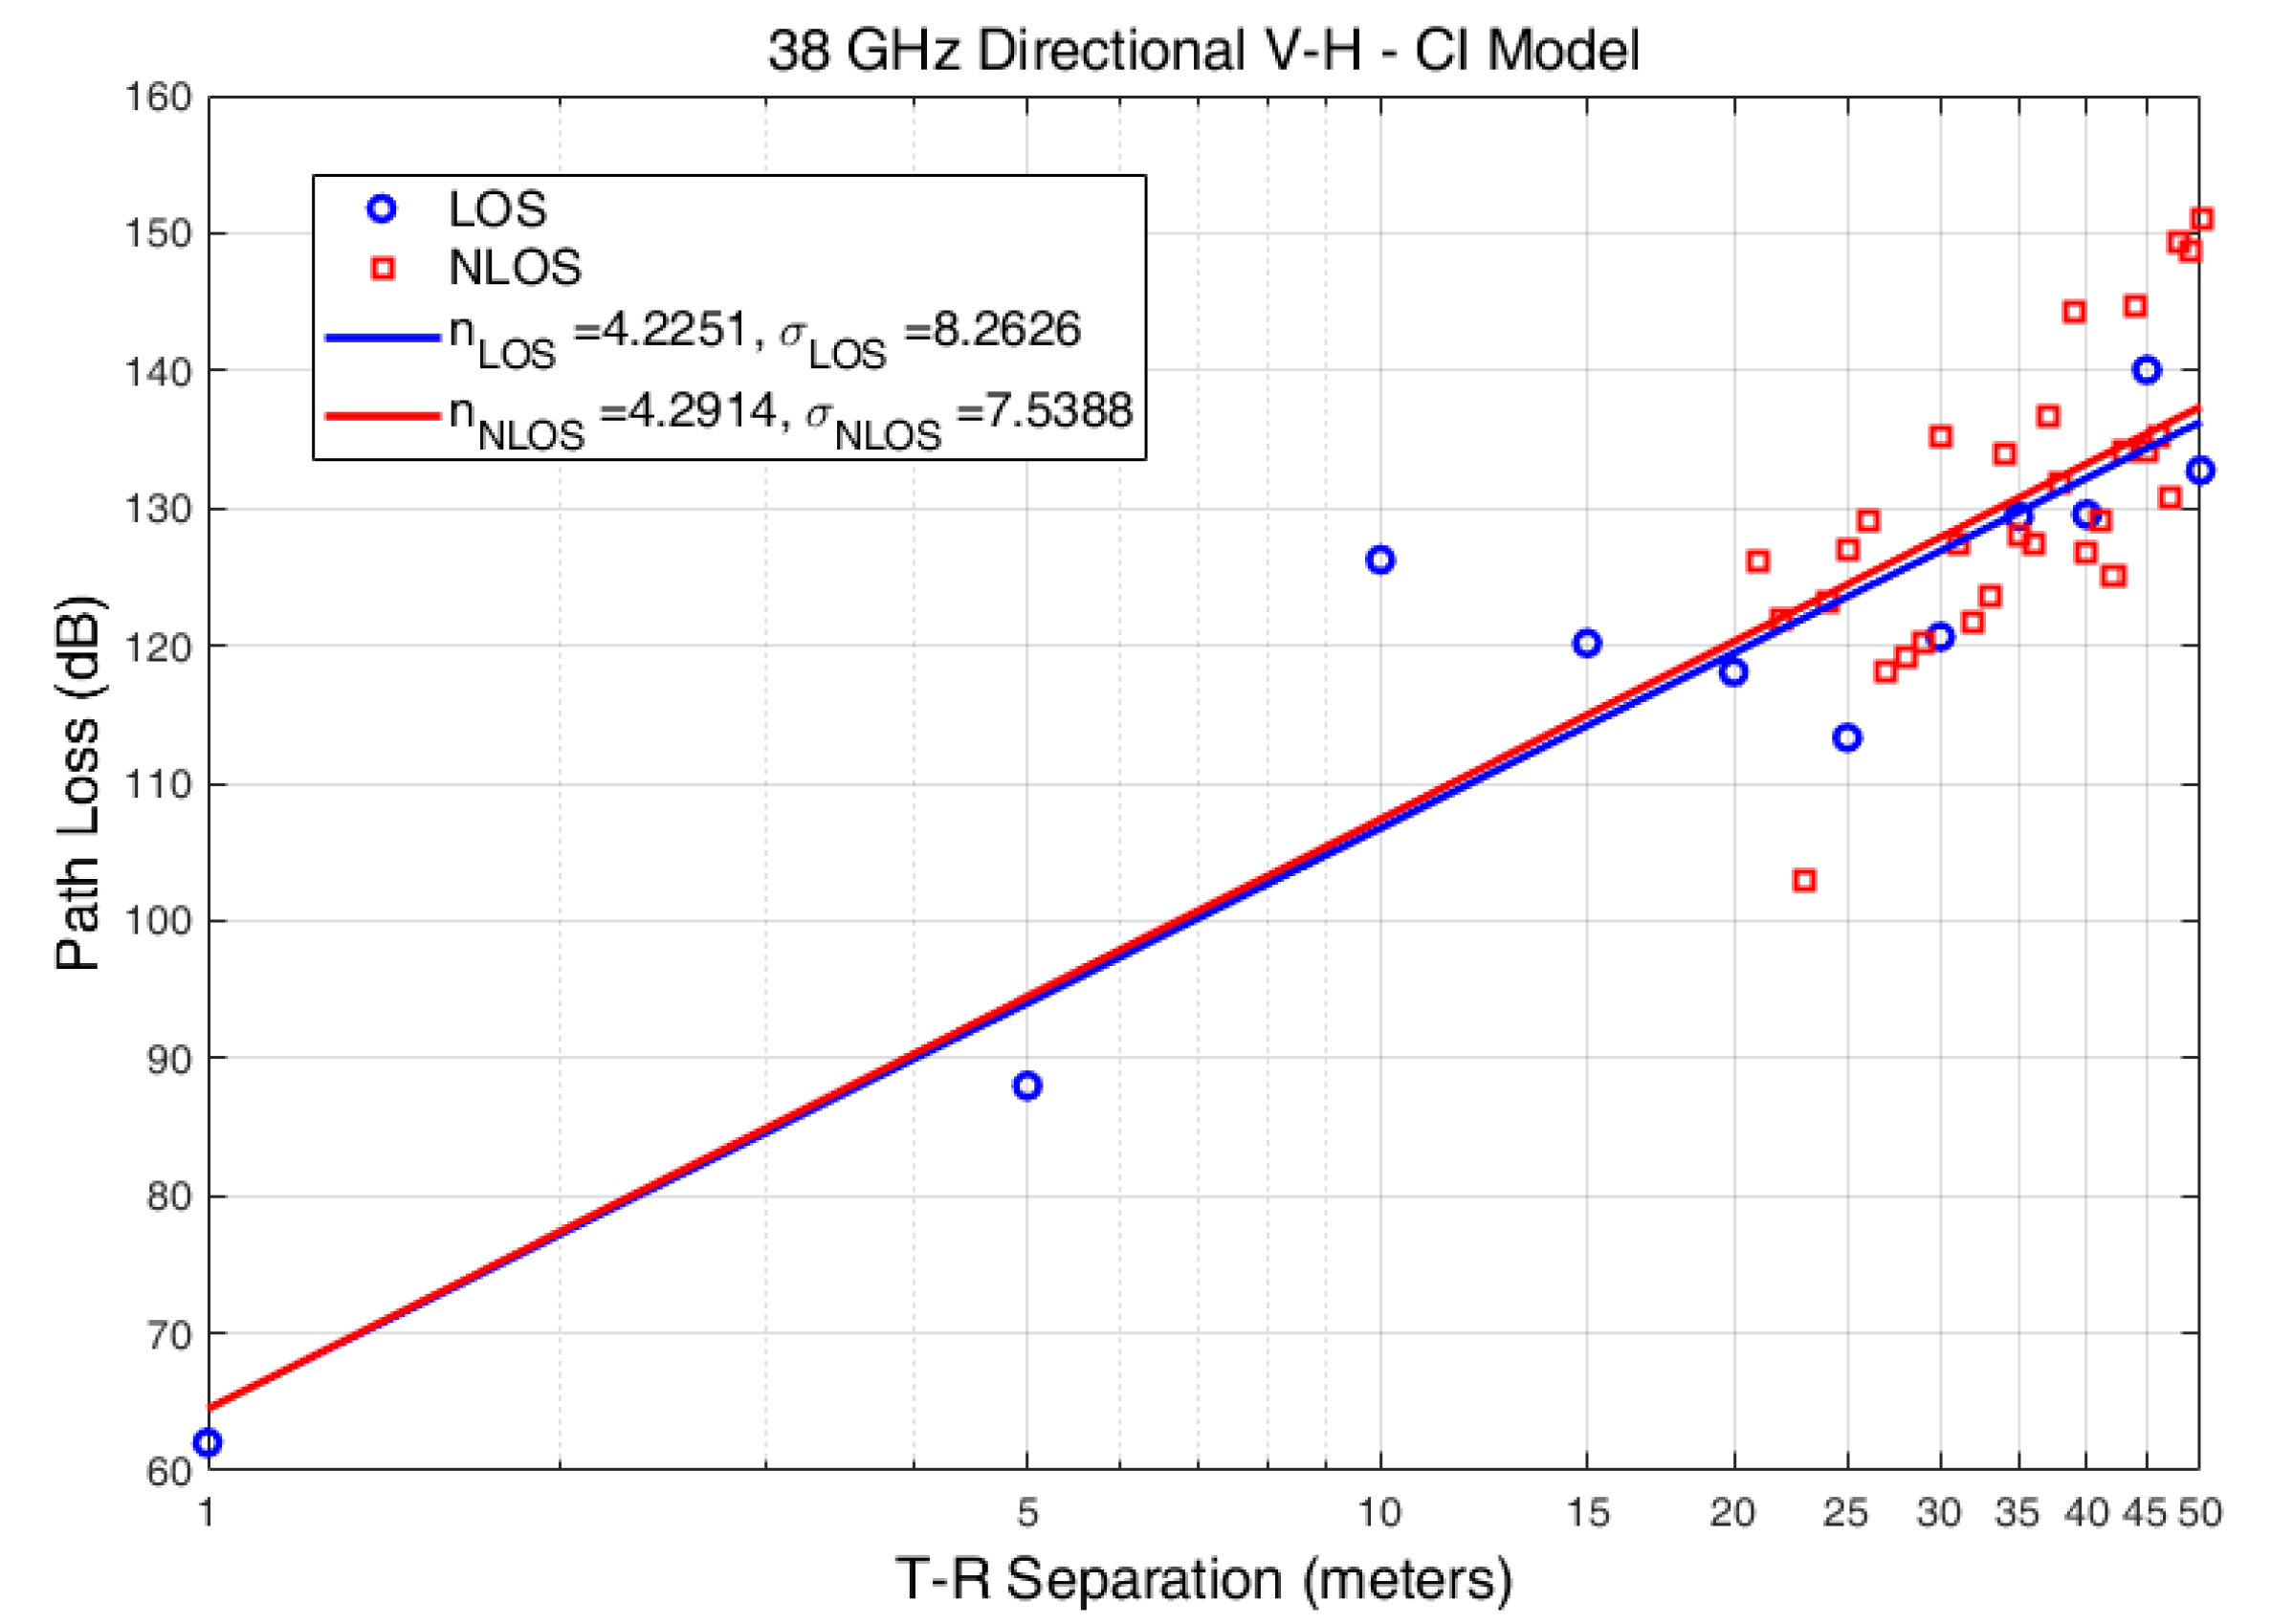
| V-H | 4.2556 | 1 | 8.3041 | ||
| NLOS | V-V | 4.3202 | 1 | 7.5277 | 0.0111 |
| V-H | 4.2914 | 1 | 7.5388 |
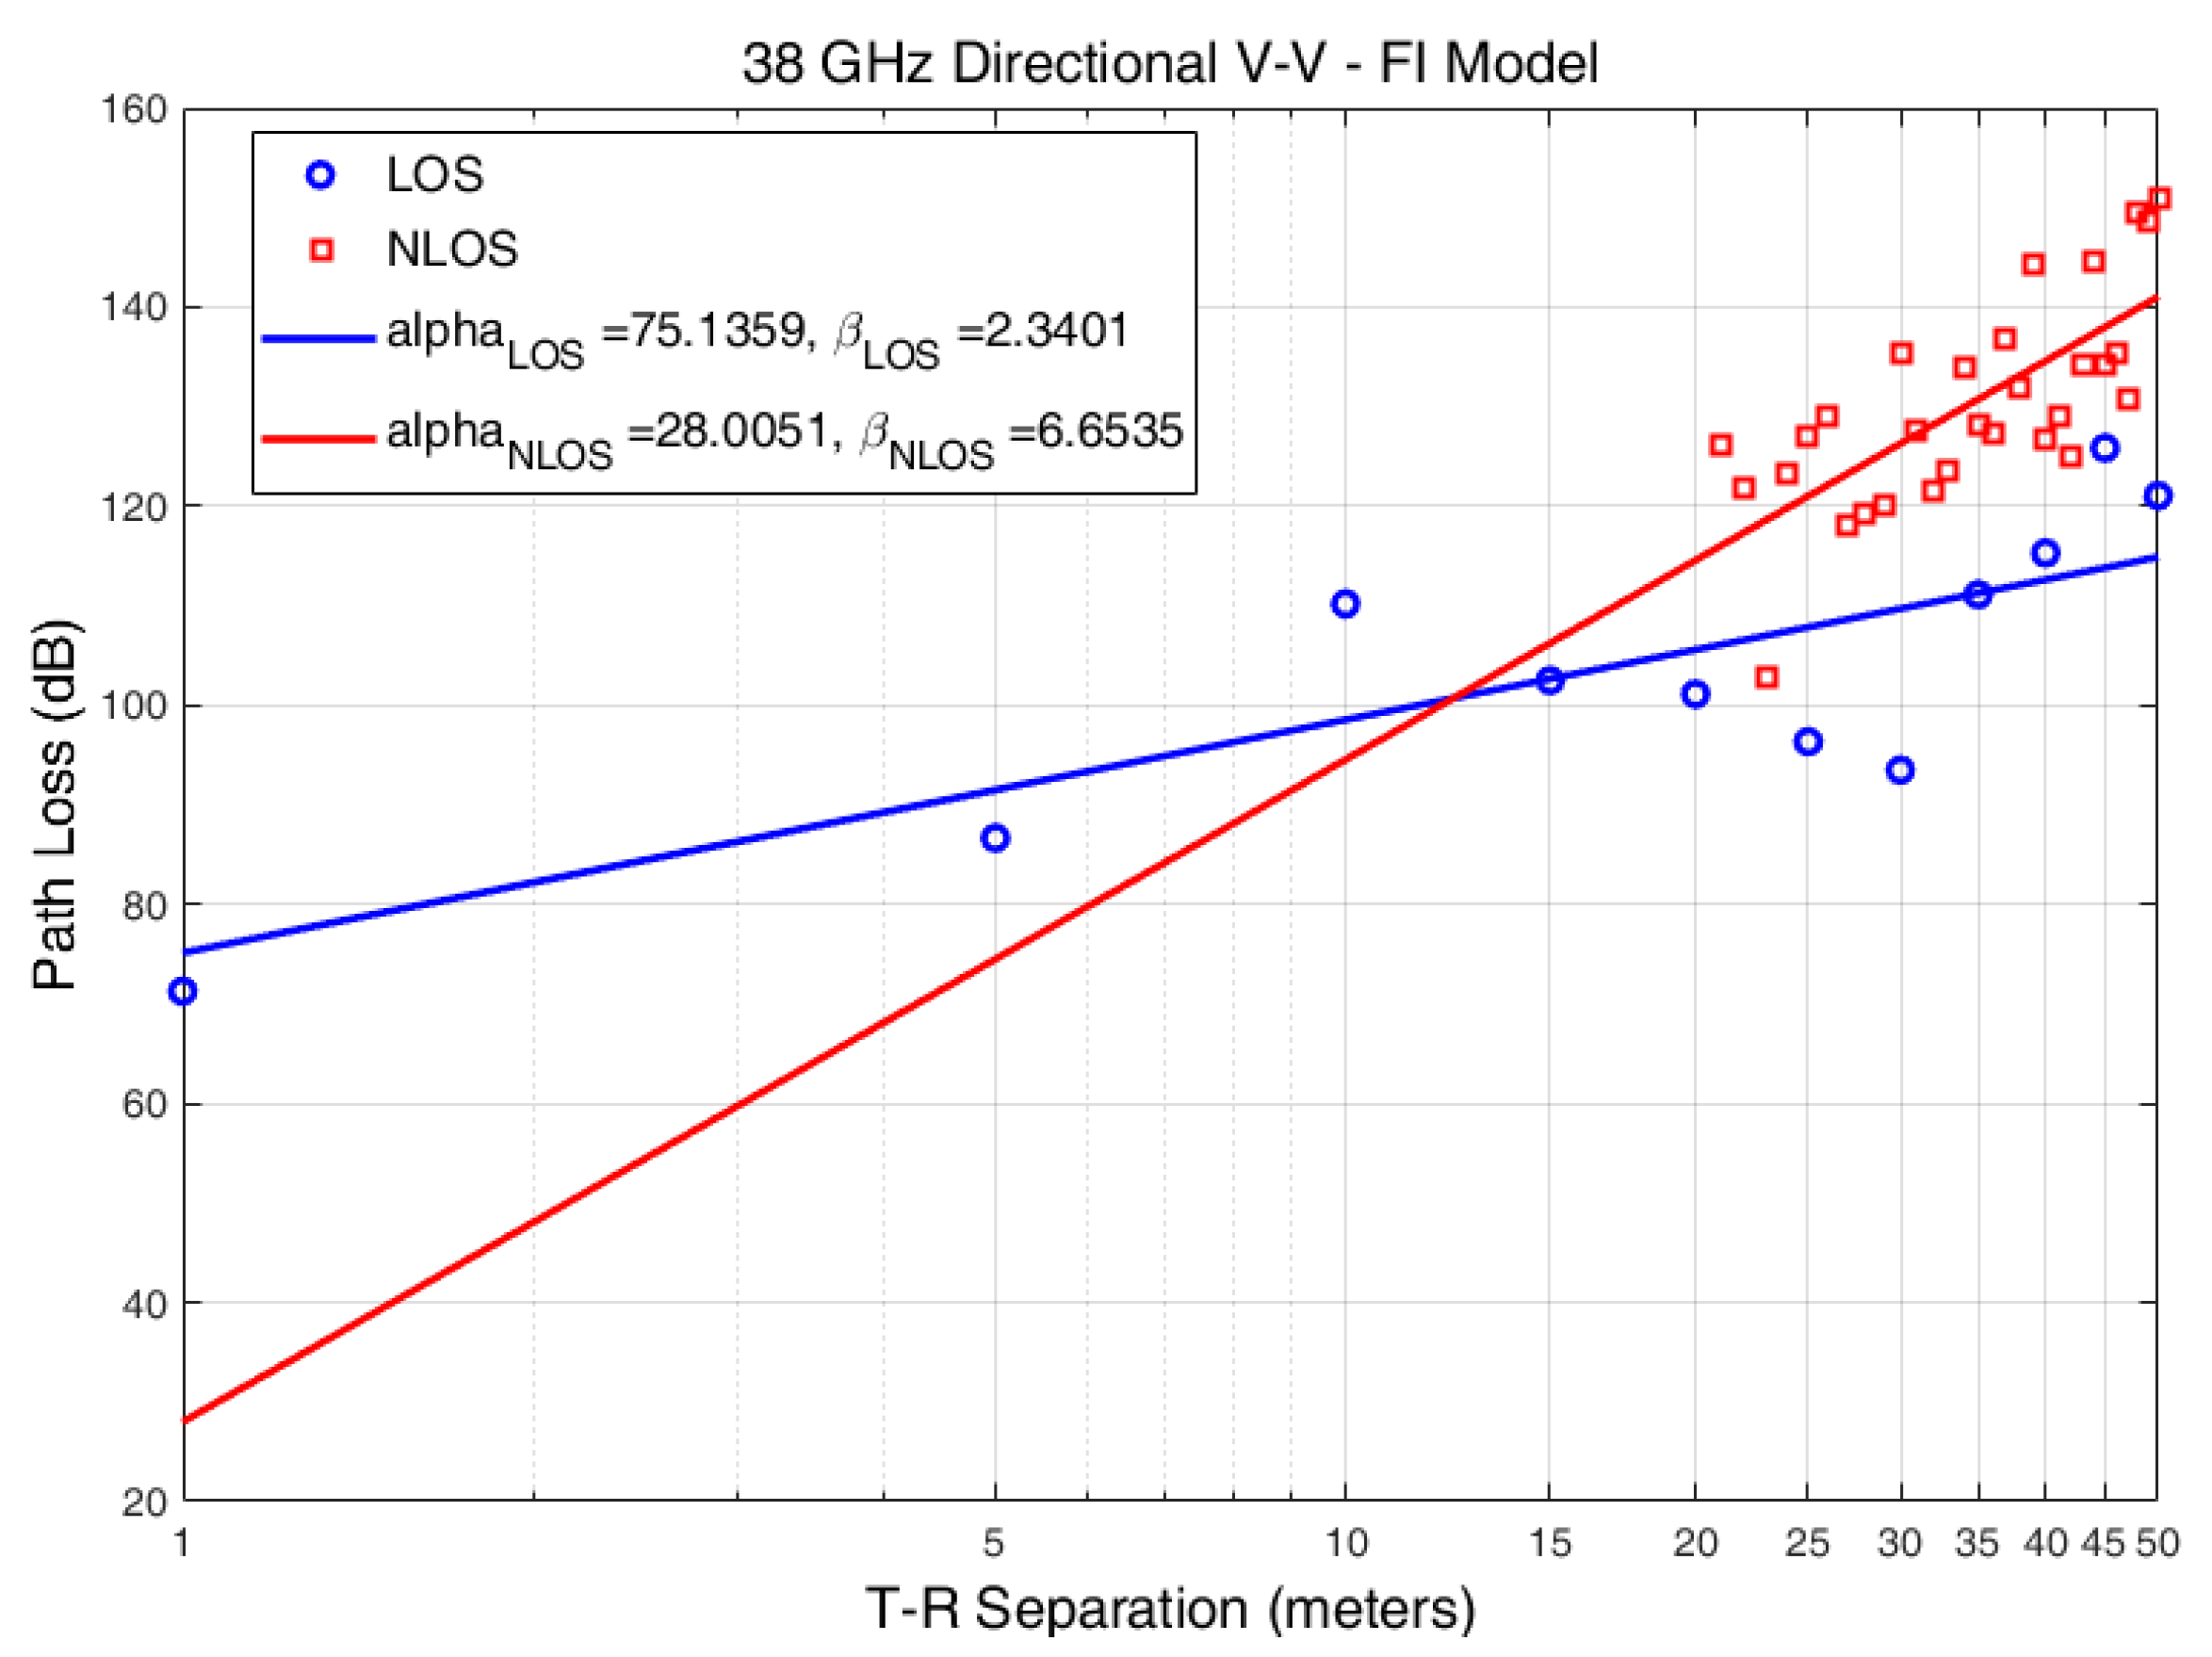
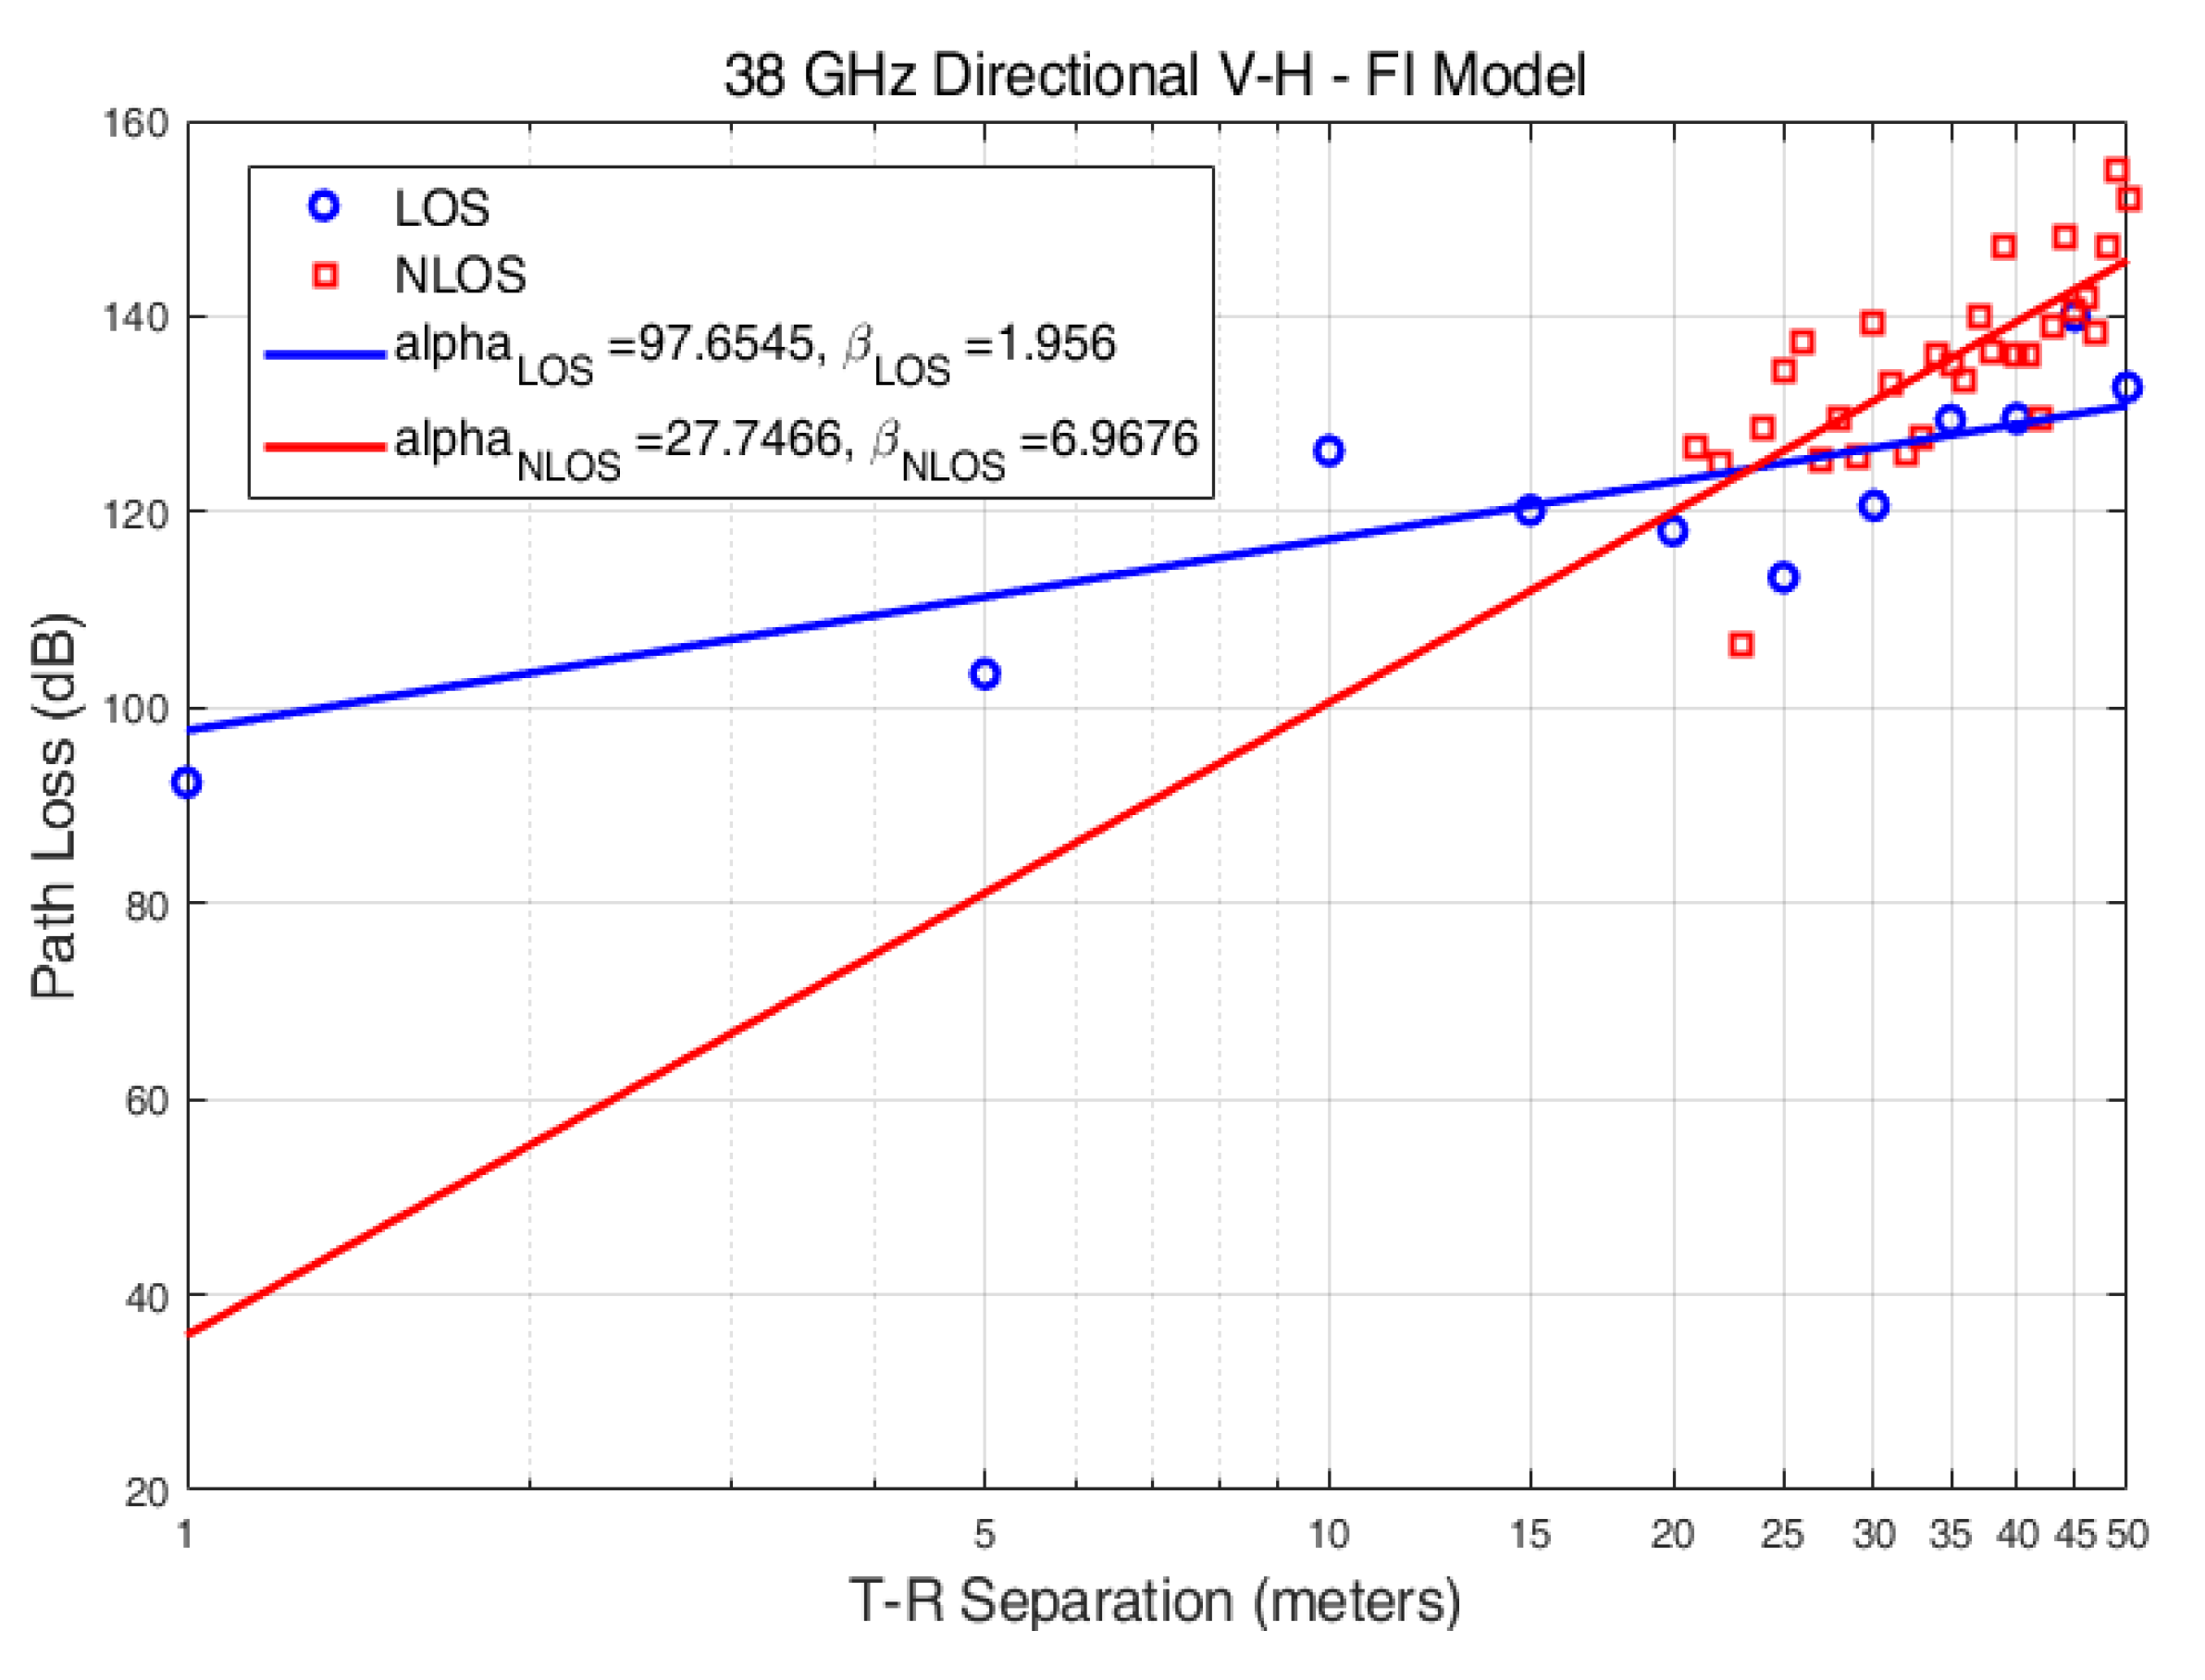
| Env. | Pol. | |||
|---|---|---|---|---|
| LOS | V-V | 2.3401 | 75.1359 | 9.0714 |
| V-H | 1.9560 | 97.6545 | 6.5463 | |
| NLOS | V-V | 6.6535 | 28.0051 | 7.0683 |
| V-H | 6.9676 | 27.7466 | 6.9574 |
| Parameters | Values |
|---|---|
| Operating frequency | 38 GHz |
| Channel bandwidth | 40 MHz |
| Number of resource blocks | 200 |
| No. of users per cell | [10, 20, …, 50] |
| No. of BSs | 21 |
| Network scenario | Urban (random user deployment) |
| CI propagation model | Table 2. PLE (3.0990 for LOS V-V, 4.2556 for LOS V-H, 4.3202 for NLOS V-V) |
| FI propagation model | Table 3. (β is 2.3401 & α is 75.1359 for LOS V-V, β is 1.9560 & α is 97.6545 for LOS V-H, β is 6.6535 & α is 28.0051 for NLOS V-V |
| Network geometry | Regular hexagonal grid |
| gNB Transmission power | 46 dBm |
| Antenna type | Tri-sector tilted |
| User’s speed | 5 kmph |
| No. of Tx | 2 |
| No. of Rx | 2 |
| Scheduling algorithm | Proportional fair scheduling |
| No. of iteration | 1000 |
| UE height | 1.7 m |
| gNB antenna height | 5 m |
| Transmission mode | Closed loop spatial multiplexing (CLSM) and eight layer spatial multiplexing |
| gNBs separation | 200 m |
| Fading model | Rayleigh fading |
| Coupling losses | 70 dB |
© 2019 by the authors. Licensee MDPI, Basel, Switzerland. This article is an open access article distributed under the terms and conditions of the Creative Commons Attribution (CC BY) license (http://creativecommons.org/licenses/by/4.0/).
Share and Cite
Qamar, F.; Hindia, M.N.; Dimyati, K.; Noordin, K.A.; Majed, M.B.; Abd Rahman, T.; Amiri, I.S. Investigation of Future 5G-IoT Millimeter-Wave Network Performance at 38 GHz for Urban Microcell Outdoor Environment. Electronics 2019, 8, 495. https://doi.org/10.3390/electronics8050495
Qamar F, Hindia MN, Dimyati K, Noordin KA, Majed MB, Abd Rahman T, Amiri IS. Investigation of Future 5G-IoT Millimeter-Wave Network Performance at 38 GHz for Urban Microcell Outdoor Environment. Electronics. 2019; 8(5):495. https://doi.org/10.3390/electronics8050495
Chicago/Turabian StyleQamar, Faizan, MHD Nour Hindia, Kaharudin Dimyati, Kamarul Ariffin Noordin, Mohammed Bahjat Majed, Tharek Abd Rahman, and Iraj Sadegh Amiri. 2019. "Investigation of Future 5G-IoT Millimeter-Wave Network Performance at 38 GHz for Urban Microcell Outdoor Environment" Electronics 8, no. 5: 495. https://doi.org/10.3390/electronics8050495