Parkinson’s Disease Detection from Drawing Movements Using Convolutional Neural Networks


Speech Technology Group, Center for Information Processing and Telecommunications, E.T.S.I Telecomunicación, Universidad Politécnica de Madrid, Avenida Complutense, 30. 28040 Madrid, Spain
*
Author to whom correspondence should be addressed.
Electronics 2019, 8(8), 907; https://doi.org/10.3390/electronics8080907
Submission received: 1 August 2019
/
Revised: 13 August 2019
/
Accepted: 14 August 2019
/
Published: 17 August 2019
(This article belongs to the Special Issue Recent Advances in Biometrics and its Applications)
Abstract
:Nowadays, an important research effort in healthcare biometrics is finding accurate biomarkers that allow developing medical-decision support tools. These tools help to detect and supervise illnesses like Parkinson’s disease (PD). This paper contributes to this effort by analyzing a convolutional neural network (CNN) for PD detection from drawing movements. This CNN includes two parts: feature extraction (convolutional layers) and classification (fully connected layers). The inputs to the CNN are the module of the Fast Fourier’s transform in the range of frequencies between 0 Hz and 25 Hz. We analyzed the discrimination capability of different directions during drawing movements obtaining the best results for X and Y directions. This analysis was performed using a public dataset: Parkinson Disease Spiral Drawings Using Digitized Graphics Tablet dataset. The best results obtained in this work showed an accuracy of 96.5%, a F1-score of 97.7%, and an area under the curve of 99.2%.
1. Introduction
Research in biometrics has grown significantly in recent years with an increasing number of applications. One of the most important application is healthcare. According to the Biometrics Research Group Inc. [1], biometrics is driving technological transformation in the global healthcare market by reducing costs and improving care delivery to patients over long term. Biometrics Research Group Inc. [1] estimated that the entire global marketplace for biometric solutions in the healthcare market will reach US$5 billion by 2020. This group defined “healthcare biometrics” not only as a set of biometric applications for controlling access to electronic medical reports and patient identification, but also medical-decision support tools for patient care. These tools extract biomarkers that characterize patient health and can be used to help in illness detection (by means of patient screening), analysis of the response to certain medication and the supervision of long term or cureless illness like Parkinson’s disease (PD). This paper contributes in the proposal of PD biomarkers.
PD is a neurodegenerative disease produced by the loss of dopaminergic function and characterized by motor disorders, such as tremor, bradykinesia, rigidity, and postural instability [2]. These disturbances involve motor planning, programming and sequencing, and movement initiation and execution [3]. PD is one of the most common neurodegenerative disorders (the second after Alzheimer’s disease) and affects more than 1% of people over 60 years old [4].
There is currently no objective test for PD and the rate of misdiagnosis is high, especially when the diagnosis is made by a non-specialist: the probability of an inaccurate diagnosis can be as high as 20% [5]. A careful analysis of the main symptoms, such as tremor, bradykinesia, and rigidity increase the diagnosis accuracy, but clinical assessments can be influenced by the physician subjectivity. Medical decision support tools are very interesting for increasing objectivity and for helping in an early diagnosis. This early diagnosis would allow the design of specific treatments for PD patients [6,7]. An important research goal for neurodegenerative diseases is to identify accurate biomarkers [8]. In the literature, there is a wide range of studies for PD detection focused on speech processing [9,10,11] where the diagnosis is done using sustained vowels and natural speech. Additionally, motor symptoms can also be detected and supervised, modeling patient movements and gait [12,13].
Alteration in the kinematics of handwriting is one of the initial signs observed in PD. McLennan et al. [14] reported that approximately 5% of patients with PD showed micrographia (abnormally small letter size) and 30% of patients reported worsening of handwriting before the onset of motor symptoms. Motor symptoms associated with Parkinson’s disease (stiffness, bradykinesia, and tremor) cause three main changes in writing [15]: the size of writing [16] (micrographia [17]), pen-pressure [18], and kinematics. Several tools have been developed to analyze PD patient handwriting [19]. Not only the static aspects but also the dynamic ones are interesting such as speed and pen-pressure reduction during writing [17,20]. Several review papers have been published recently [21,22]. The handwriting of a person depends on the visual capability [16], writing style, or language skills of the person [23], showing a large inter-subject variability. An alternative to handwriting is the use of drawings. Table 1 summarizes the main characteristics of previous works on PD detection based on drawings: reference, participants, tasks, methodology, performance, and granularity.
The methodology refers to the machine learning algorithms used for feature extraction and classification. The granularity corresponds to the amount of data required to take a decision: one decision per subject (considering all drawings from the same subject), one decision per drawing, or one decision per drawing fraction. The smaller the amount of data considered, the more challenging is the decision. The positive aspect of using a smaller amount of data is that the system can be less invasive. All the works included in Table 1 use a subject-wise cross validation. This cross-validation strategy consists of dividing the data into training and testing subsets guarantying that there are not drawings from the same subject in training and testing in the same experiment. This way, we prevent the system from learning specific characteristics of a subject instead of PD features.
Kotsavasiloglou et al. [24] used a pen-and-tablet device to study differences in hand movement and muscle coordination between healthy subjects and Parkinson’s disease patients. The authors used five metrics including the mean horizontal velocity, the normalized velocity variability (in units of 1 per second), the standard deviation of the horizontal velocity, and the entropies of the horizontal and vertical components of the signal. They evaluated several classification algorithms, obtaining for the best results an accuracy (ACC: Percentage of examples correctly classified) of 88.63% and an Area Under the ROC Curve (AUC) of 93.1%. Zham et al. [15] evaluated 10 features including static and dynamic information using the Naïve Bayes algorithm for classification. They obtained an accuracy of 83.2% and an AUC of 93.3%. These two previous works [15,24] took a decision every drawing fraction of approximately 2 seconds.
The last three works used the same dataset: the Parkinson Disease Spiral Drawings Using Digitized Graphics Tablet dataset [27]. Gallicchio et al. [25] proposed the use of DeepESNs obtaining an accuracy of 89.3%. Khatamino et al. [26] used a convolution neural network (CNN) inspired in the AlexNet [28] composed of two main parts (convolutional layers for feature extraction and full connected layers for classification). Khatamino et al. [26] considered a simplified version (a smaller number of layers) because a smaller dataset was used to train the CNN parameters. In this work, we use also a simplified version of the AlexNet but with an important difference: The inputs to the CNN are the spectrum points instead of the raw data directly. This difference has been very important to improve the performance. The reason is because the tremor, that is the most prevalent PD symptom, becomes more apparent in the frequency domain. To the best of our knowledge, this work shows the best results on the Parkinson Disease Spiral Drawings Using Digitized Graphics Tablet dataset [27] considering a subject-wise cross validation.
This paper is organized as follows. Section 2 reviews the material and methods used in this study, including a description of the dataset and the CNN. Section 3 describes the experiments and the obtained results. Section 4 includes the main discussion. Finally, Section 5 summarizes the main conclusions of the paper.
2. Materials and Methods
This section describes the dataset used in this study, the signal preprocessing and the CNN used for PD detection from drawing movements.
2.1. Dataset
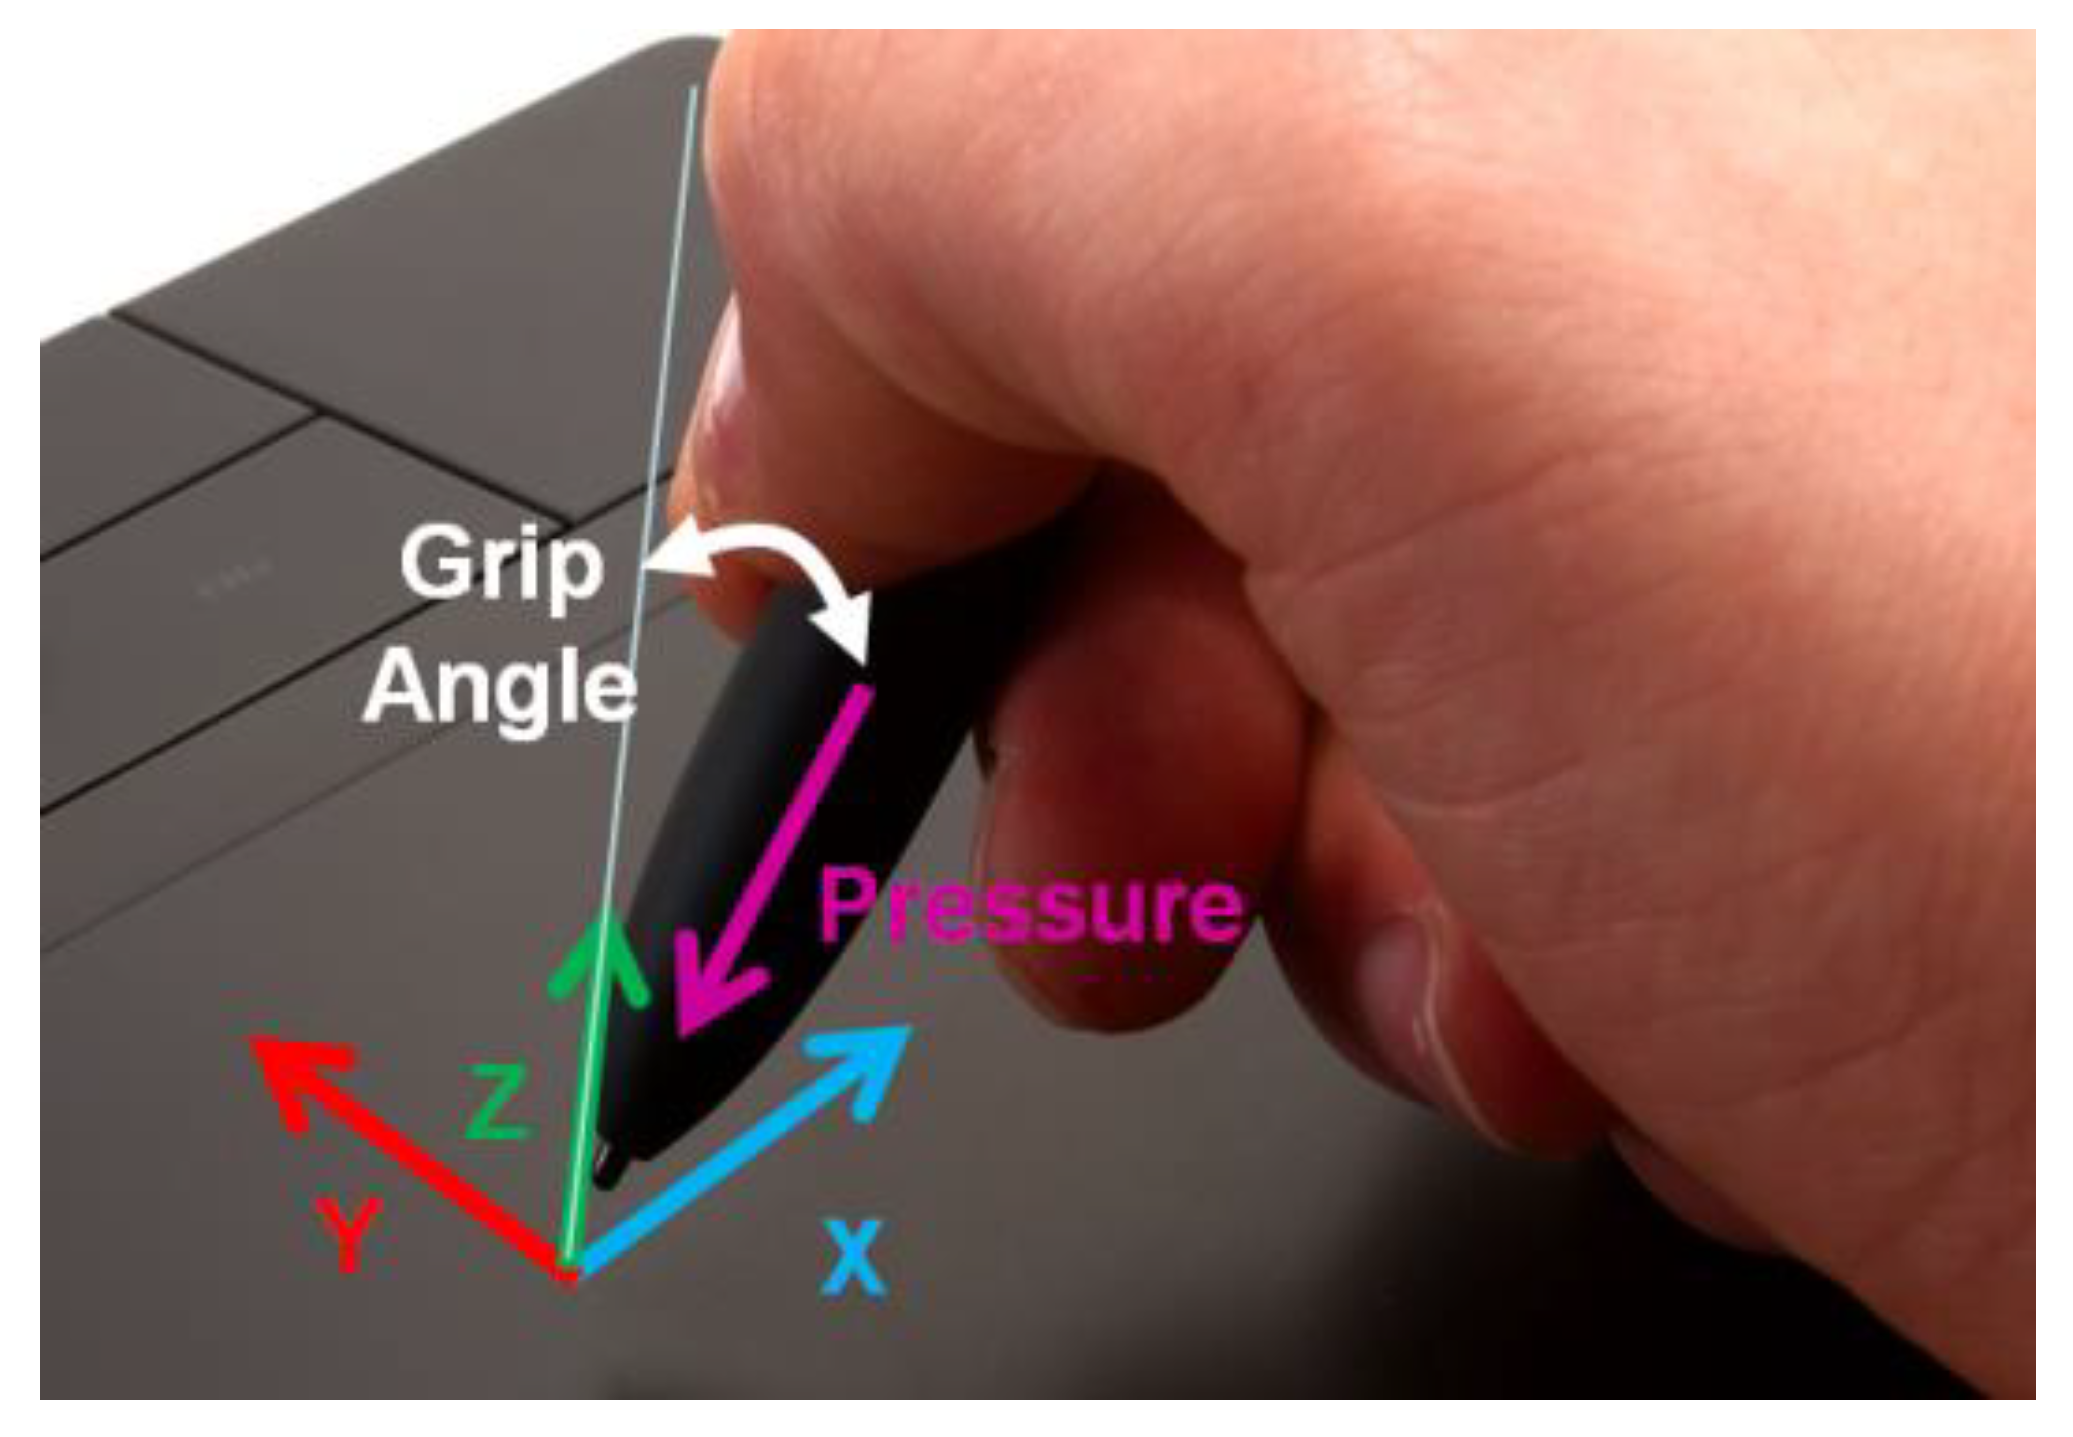
We used a public dataset: the Parkinson Disease Spiral Drawings Using Digitized Graphics Tablet dataset [27]. This dataset includes spiral drawings from 77 people, 62 with PD and 15 healthy people in the control group. The dataset was recorded using the Wacom Cintiq 12WX graphics tablet [29]. This tablet allows showing a PC’s screen on its display and interacting with a digital pen. In total, five time-series were recorded for each drawing. Every recording includes information about X-Y-Z coordinates, pressure, and grip angle (Figure 1) obtained from the API functions of the device.
All the subjects performed three types of handwriting recordings. The first one was the Static Spiral Test (SST) [30]. In this type, subjects were asked to retrace three wound Archimedean spirals that appear in the screen. The second type was the Dynamic Spiral Test (DST). Unlike SST, for DST, the Archimedean spiral appeared and disappeared for a few seconds, forcing the subject to keep in mind the image while drawing. The last test was Stability Test on Certain Point (STCP). In this test, a red point is situated in the middle of the screen. The participants had to hold the pen on the red point for several seconds without touching the screen. The target was to observe the hand tremor.
2.2. Signal Preprocessing
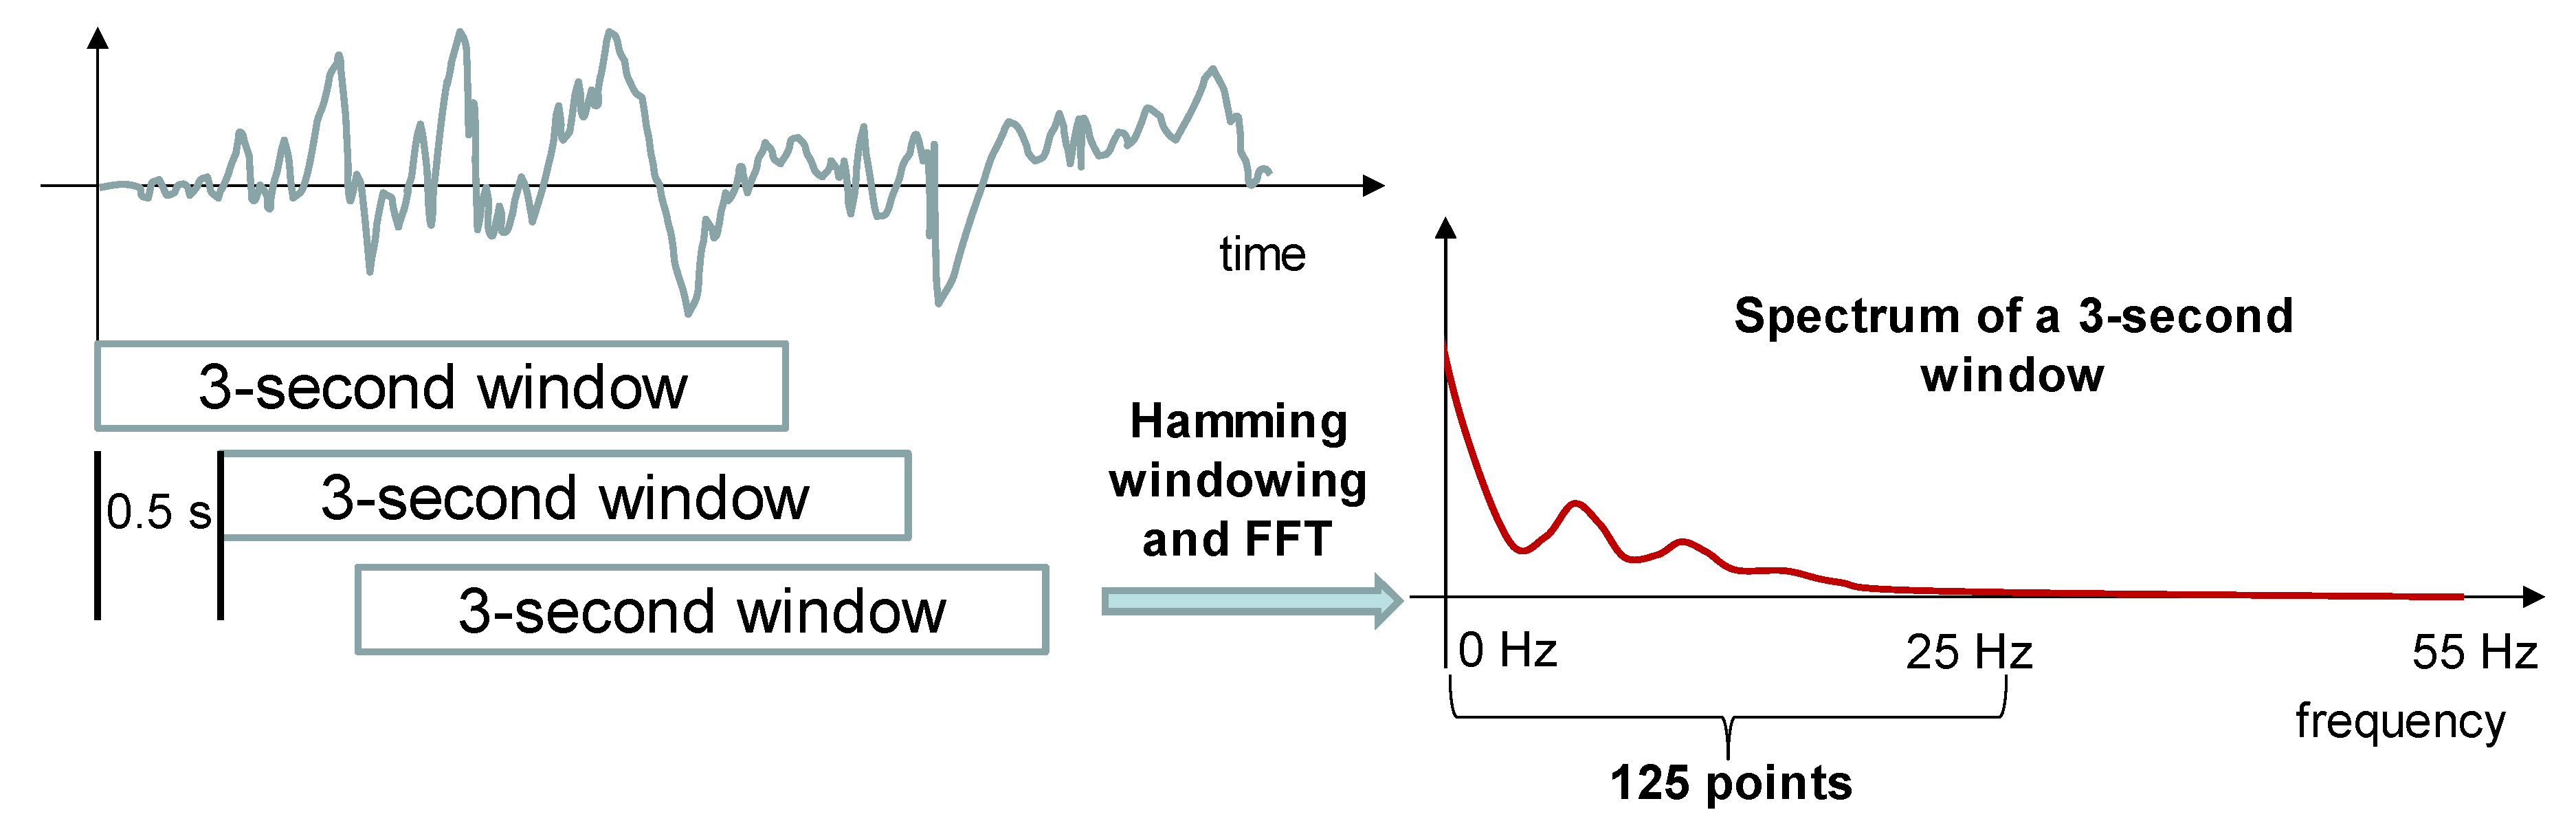
The dataset was obtained in two phases with two different sampling rates, 110 Hz and 140 Hz. In order to have uniform data, all the recordings were resampled to the same sampling rate of 110 Hz. The sample sequence was divided into 3-second windows (330 samples per window) separated by 0.5 seconds (it means a 2.5-second overlap between two consecutive windows). All the windows from PD subjects were labeled as class 1 and all 3-second windows from healthy subjects were labeled with class 0. Each window was expanded to 512 points using zero padding. After that, the module of the Fast Fourier’s Transform (FFT) was obtained using a Hamming windowing. As the FFT is symmetric for real signals, a 256-point representation of the spectrum was obtained in the 0–55 Hz frequency range. From this representation, we selected the first 125 points of the spectrum corresponding to the 0–25 Hz frequency band because the energy in the frequency spectrum above 25 Hz was negligible, less than 1% of the total energy. Figure 2 represents the preprocessing carried out to all signals recorded from each drawing (five signals in total). As a result of this preprocessing step, five spectra of 125 points were obtained for every 3-second window.
2.3. Convolutional Neural Networks
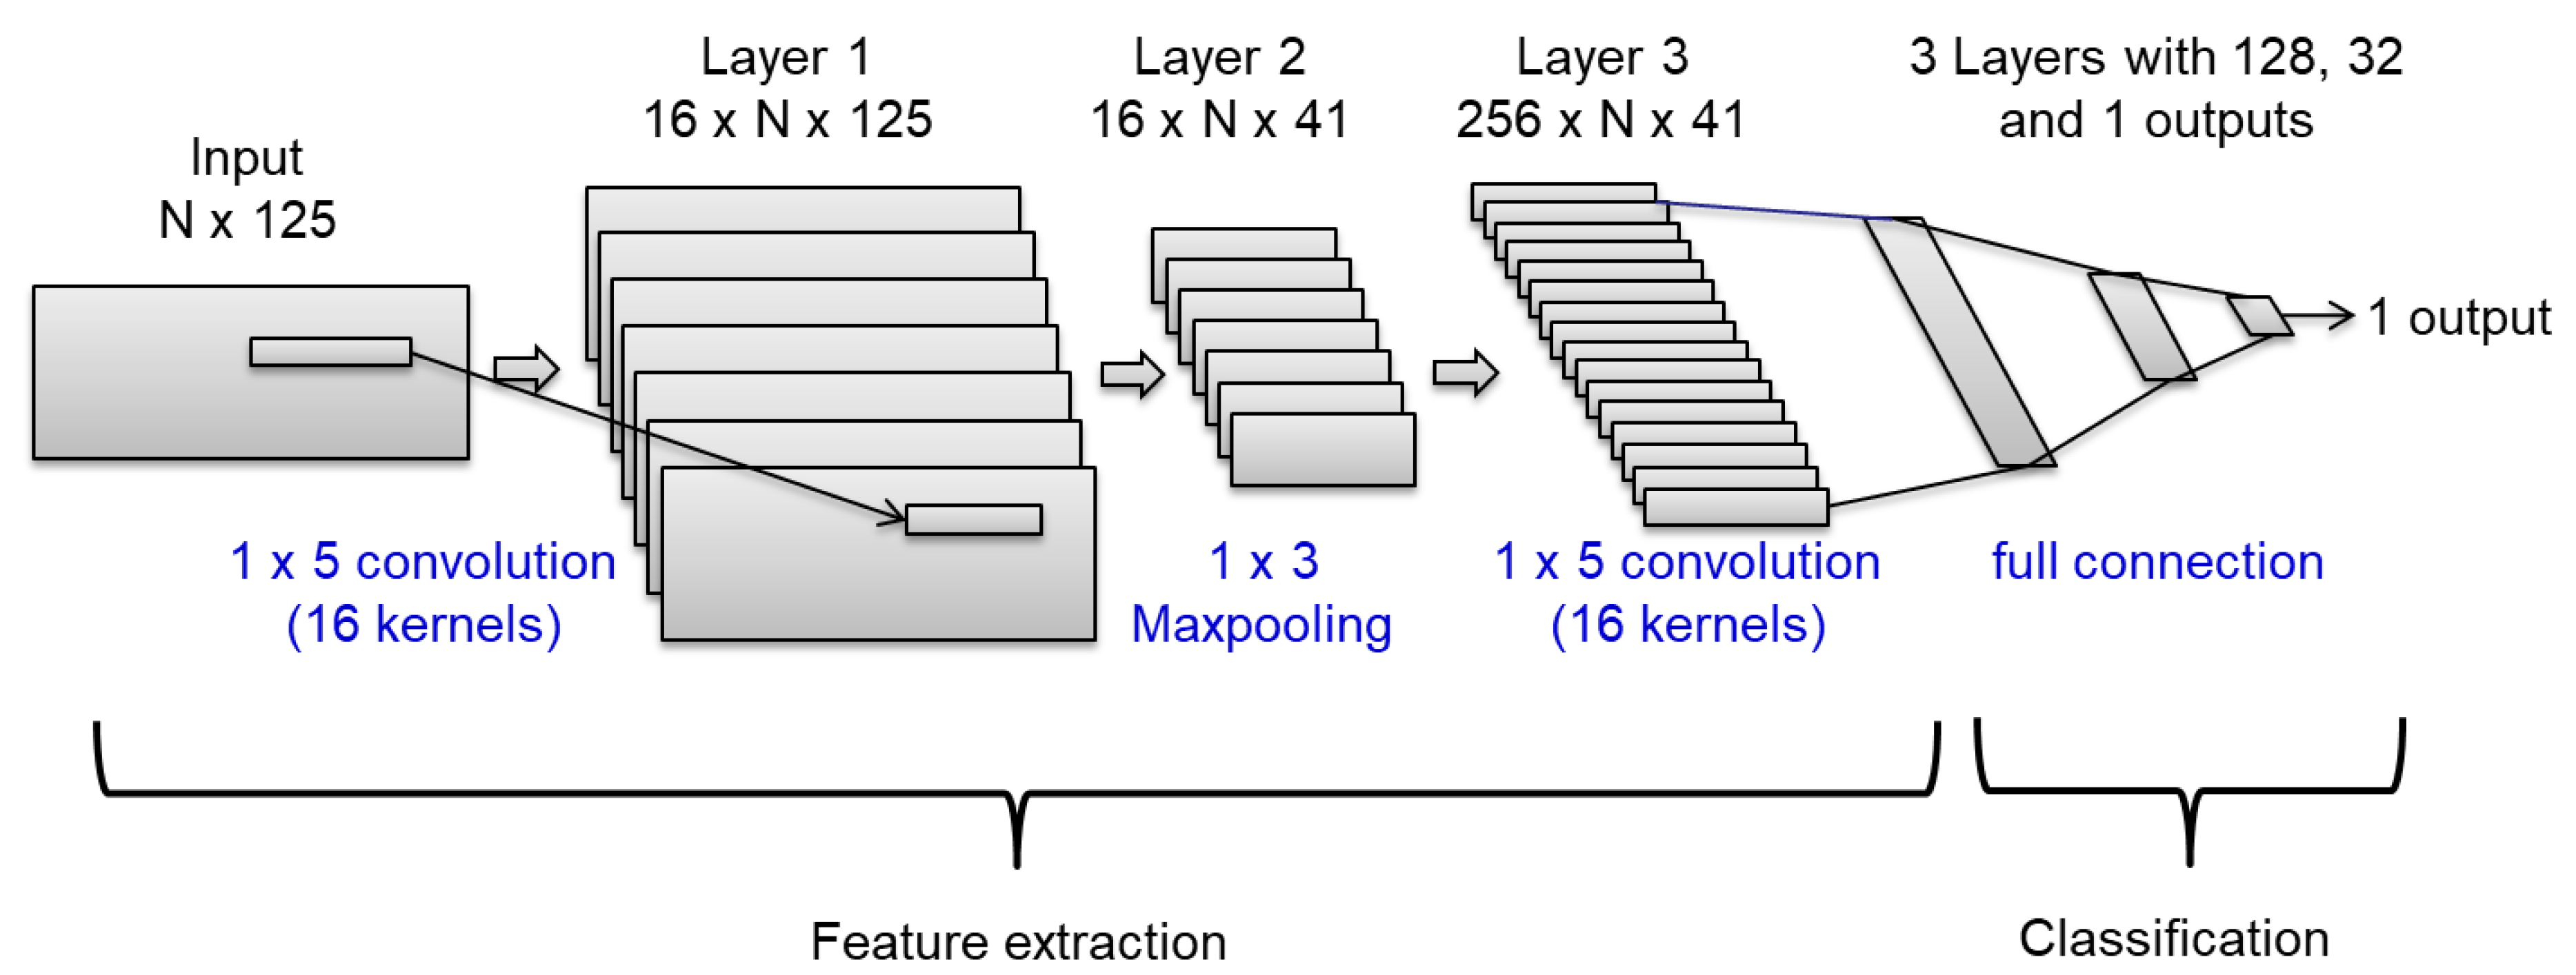
Figure 3 shows the CNN analyzed in this work. The CNN is organized in two parts: The first part is composed of two convolutional layers, considering 16 filters with dimensions 1 × 5. We included an intermediate Maxpooling layer between the convolutional ones. This part tries to extract the main features from the inputs. The second part includes three fully connected layers for classification. After convolutional and fully connected layers, Dropout layers are included to avoid over fitting. The percentage of deactivated weights was 20%. This architecture was inspired by Khatamino et al.’s work [26] where the authors proposed a simplification of the AlexNet CNN [28]. This simplification was necessary because a smaller dataset was used to train the CNN parameters.
The inputs are compiled in a 2 D matrix with N × 125 dimensions. N is the number of signals considered in the CNN: one when considering only one signal independently, and five when using all the time-series for X, Y, Z, pressure and grid angle. 125 points correspond with the number of points in the module of the FFT. The last layer has only one output with a sigmoid function because we classify between two classes. This output should be close to 1 for PD patients (class 1) and close to 0 for healthy subjects (class 0). The output layer uses the binary cross-entropy as loss metric.
We used the training set (using part of the training set for validation) to adjust the main parameters of the deep learning structure: 25 epochs, batch_size equal to 100, and ReLU as the activation function in all intermediate layers. The optimizer was fixed to the root-mean-square propagation method. This optimizer also reported the best results in Khatamino et al.’s work [26].
2.4. Subject-Wise Cross-Validation
We used a subject-wise five-fold cross-validation [31]. The recordings were randomly divided into five subsets. Four out of five subsets were used to train the CNN and the fifth subset was used to test the system. The experiments were repeated five times modifying the test and training sets. All the recordings from the same subject were included in the same subset; thereby there were not recordings from the same subject in training and testing in the same experiment. We computed classification accuracy, F1-score, sensitivity vs. specificity curves and AUC in all experiments. The results presented are the average of the five experiments (folds).
The main parameters of the deep learning structure were adjusted subdividing the training set. The four folds used for training were subdivided, leaving three folds for weights training and one-fold for adjusting the main parameters of the CNN. Once the CNN structure was defined, the weights were retrained using the four folds.
3. Experiments and Results
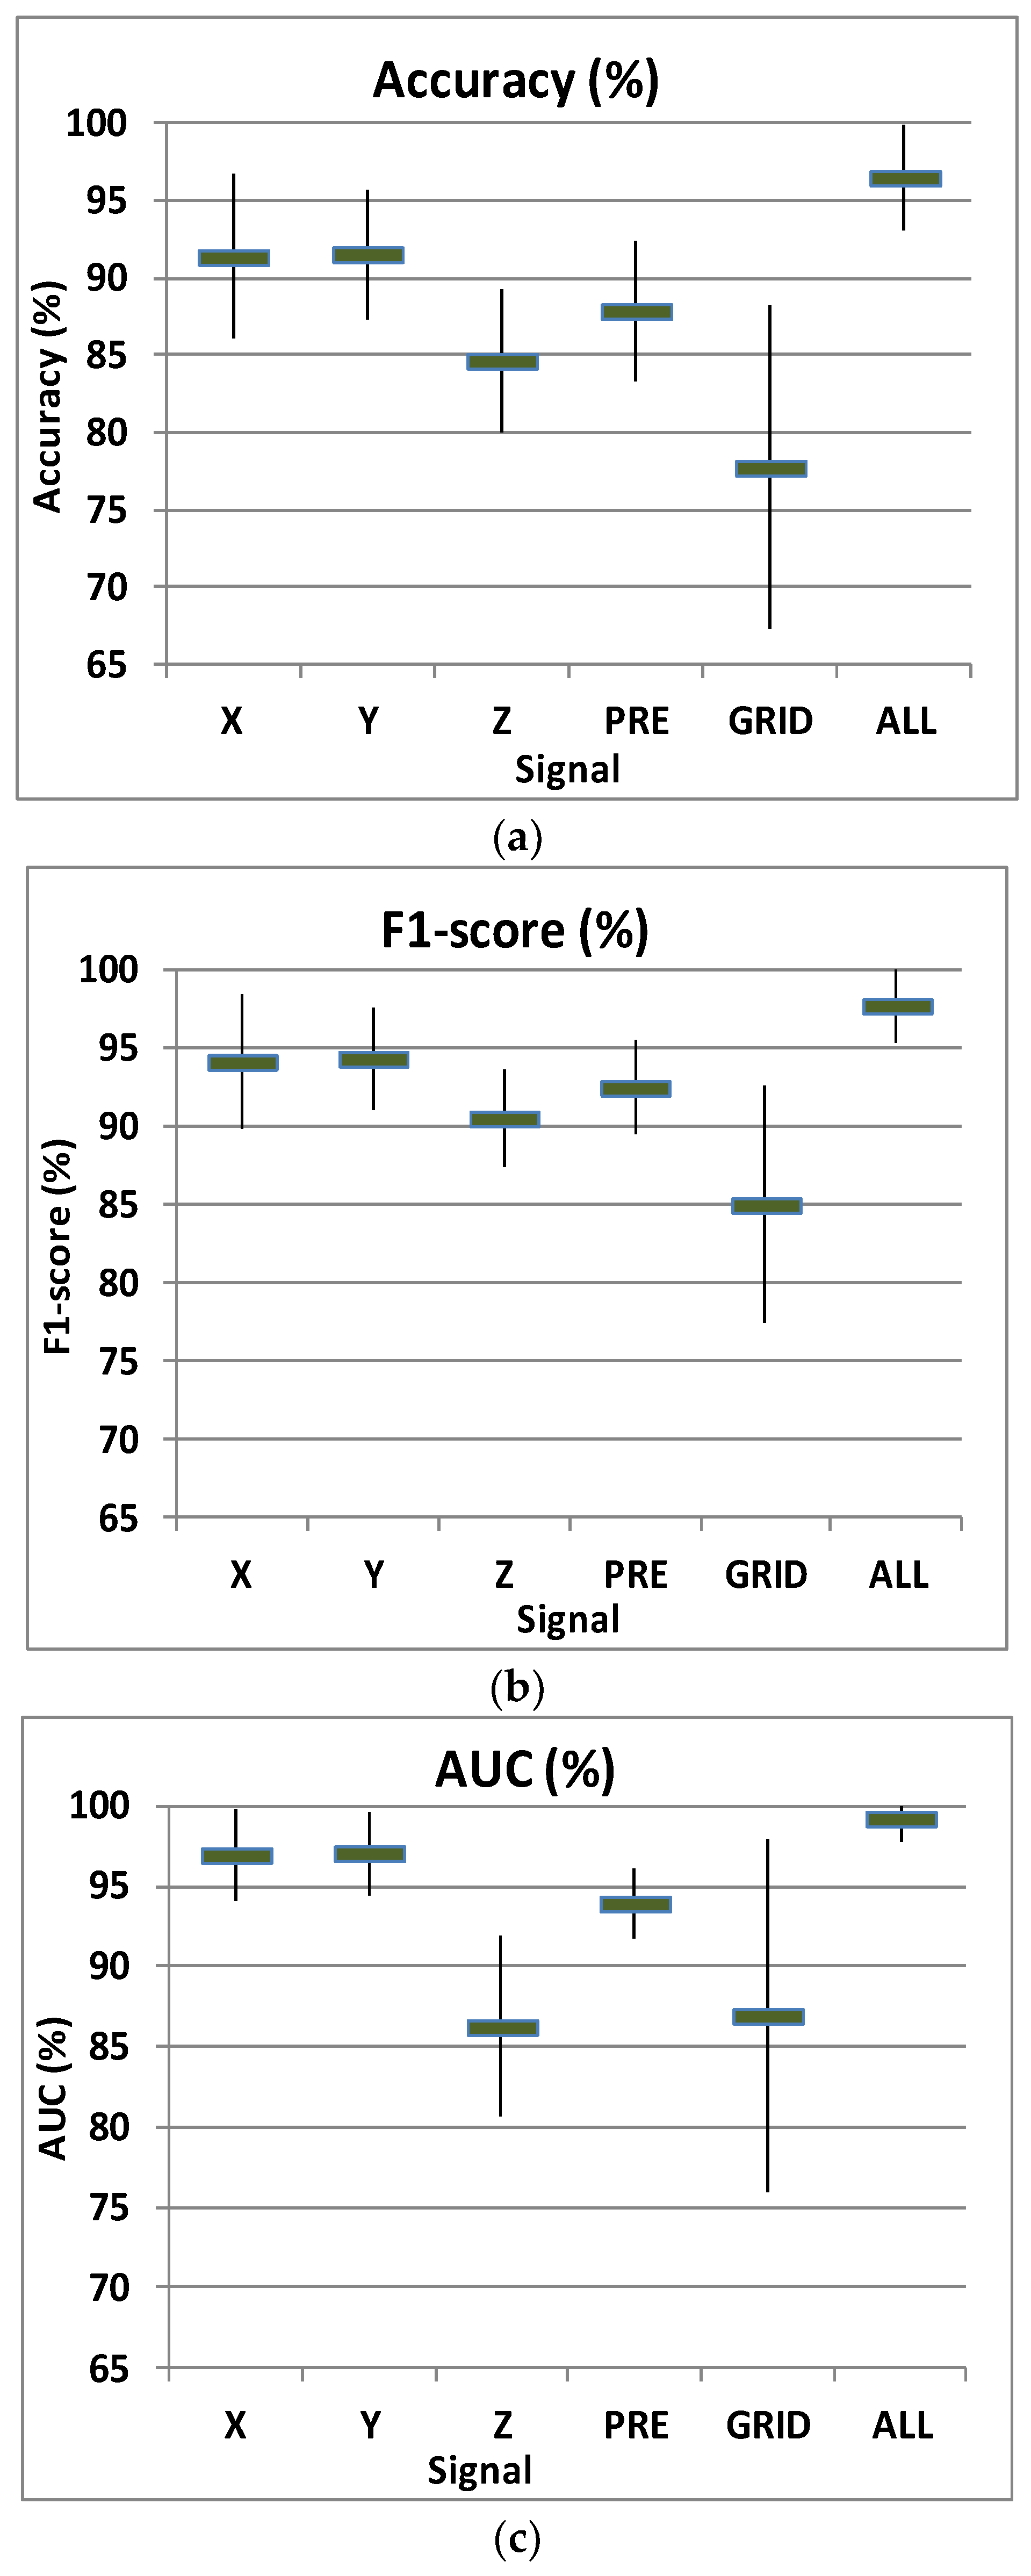
Figure 4 shows mean and standard deviation of accuracy (a), F1-score (b), and AUC (%) (c) for the subject-wise five-fold cross-validation. The two most informative signals were the coordinates X and Y. When using all the signals, the system reported an accuracy of 96.5%, F1-score of 97.7% and an AUC (%) of 99.2%.
These results are considerably better than those reported in previous works with different datasets but using also spiral drawings: Kotsavasiloglou et al. [24] obtained an accuracy of 88.63% and an AUC of 93.1% while Zham et al. [15] reported an accuracy of 83.2% and an AUC of 93.3%.
When considering previous studies over the same dataset, Gallicchio et al. [25] obtained an accuracy of 89.3% while Khatamino et al. [26] reported an accuracy of 72.5% for the subject-wise cross-validation. We used a CNN with a similar structure to the CNN used by Khatamino et al. [26] but the inputs to the CNN are the spectrum points instead of the raw data directly. This difference has been very important to improve the performance. The reason is because PD tremor becomes more apparent in the frequency domain: in the spectrum of the X and Y coordinates, it is possible to see peaks of energy corresponding to the tremor frequency (between 3–9 Hz [32]) and its harmonics (Figure 2). The main reason for obtaining better results compared to previous works has been the use of a CNN considering the spectrum points as inputs to the CNN.
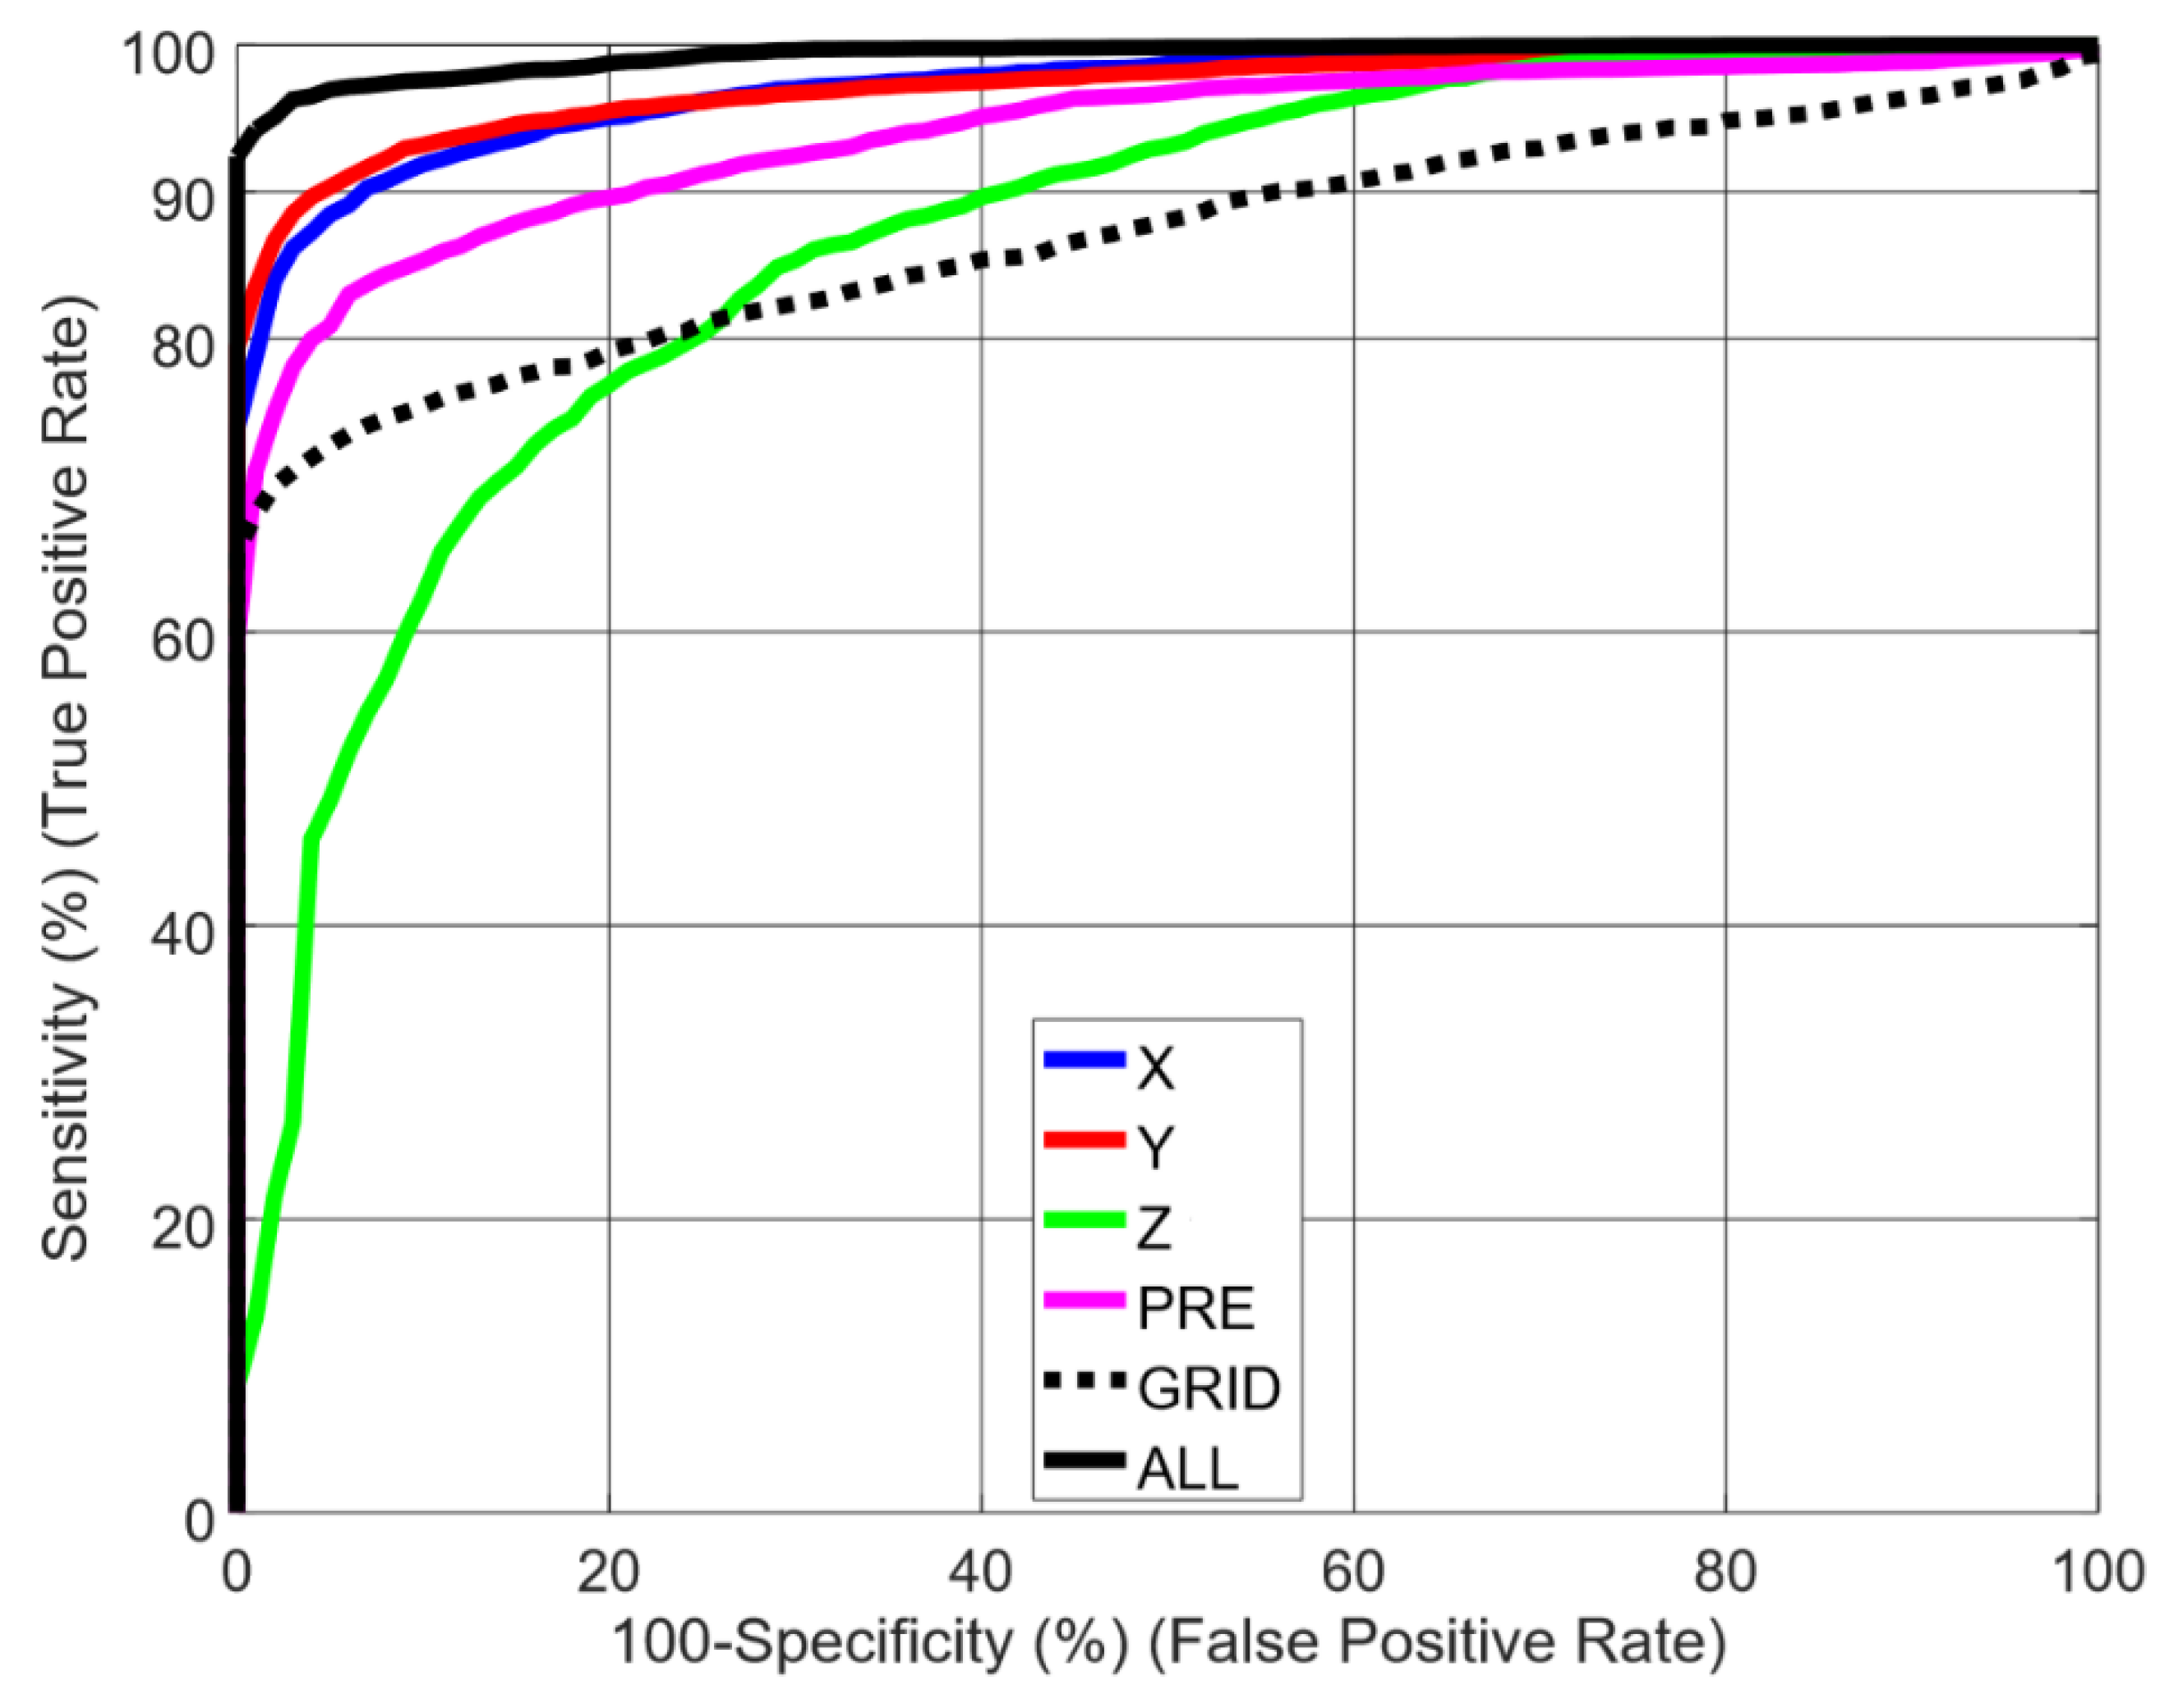
Figure 5 shows sensitivity vs. specificity curves for every signal independently: X, Y, and Z coordinates, pressure (PRE), and grid angle (GRID) and including all the signals together (ALL). As seen in previous figures, X and Y coordinates showed very good results, obtaining the best performance when combining all the signals. On the other hand, coordinate Z and grid angle (GRID) were the less informative spectra. When removing these spectra from the 2D input matrix, we observed a small loss of performance in AUC (< 1%), but not statistically significant (according to Hanley’s method [33]).
4. Discussion
The good results obtained in the previous section validate the use of drawings movements as a PD biomarker. This biomarker is very interesting because it is obtained in a non-invasive way: the patient only must draw certain figures on a tablet. Based on this biomarker, medical-decision support tools can be developed for PD detection and patient supervision (after a positive diagnosis).
Nowadays, PD diagnosis is very difficult and requires the combination of biomarkers based on symptoms like tremor, bradykinesia, and rigidity in order to increase the diagnosis accuracy. In this context, biomarkers can help to improve the health care by patient screening. This way, physicians can focus on the most probable patients reducing the diagnosis time. An earlier diagnosis would allow the development of specific treatment strategies for PD patients [6,7].
The supervision of patients is important for monitoring the progression of PD. PD provokes symptoms [34] that can be alleviated with medication. A long-term use of this medication can cause side effects, such as dyskinesia (involuntary muscle movements). In order to reduce these side effects, the physician must periodically adjust the minimum dosage to manage the symptoms according to the disease progression. A widely method used by physicians to rate the current state of PD is the Unified Parkinson’s Disease Rating Scale [35]. One important limitation of this method is that the patient must visit the physician periodically. This is a problem for a patient with motion difficulties. A second limitation is that the information obtained by the physician is limited to a short session every few months. Non-invasive automatic biomarkers for supervising PD symptoms can provide objective and long-term supervision data to support the physician decision.
5. Conclusions
Alteration in the kinematics of drawing is one of the initial signs of PD and evaluating drawing movements is easy to perform because it does not require any invasive procedures. The main contribution has been the proposal of the spectrum as inputs to a CNN for PD detection from spiral drawing movements. The CNN includes convolution layers (features learning) and fully connected layers (for PD detection). We evaluated the detection capability of different directions during drawing movements obtaining the best results for X and Y directions. Using a public dataset, Parkinson Disease Spiral Drawings Using Digitized Graphics Tablet dataset, the best results obtained in this work showed an accuracy of 96.5%, a F1-score of 97.7% and an area under the curve of 99.2%. These results validate the use of drawings movements to develop medical-decision support tools for PD detection (patient screening) and long-term patient supervision.
As commented in Section 3, coordinate Z and grid angle were the less informative spectra. We observed a small loss of performance when removing these spectra from the 2D input matrix, but this difference was not statistically significant with the small dataset considered in this work. It would be interesting to evaluate this CNN with a larger dataset and analyze if the loss of performance (when removing coordinate Z and grid angle) remains negligible and suggest removing them from the final system. Another interesting research line for future work is to evaluate other architectures of deep neural networks like Recurrent Neural Networks (RNNs). RNNs have showed interesting improvements when modelling patterns in time-series.
Author Contributions
Conceptualization, M.G.-M., J.M.M. and R.S.-S.; Formal analysis, R.S.-S.; Funding acquisition, J.M.M. and R.S.-S.; Investigation, M.G.-M. and R.S.-S.; Software, M.G.-M. and R.S.-S.; Supervision, R.S.-S.; Validation, J.M.M.; Writing – original draft, M.G.-M.; Writing – review & editing, J.M.M. and R.S.-S..
Funding
The research was funded by MINECO with AMIC (MINECO, TIN2017-85854-C4-4-R), and CAVIAR (MINECO, TEC2017-84593-C2-1-R) projects. We gratefully acknowledge the support of NVIDIA Corporation with the donation of the Titan X Pascal GPU used for this research.
Acknowledgments
Authors thank all the other members of the Speech Technology Group for the continuous and fruitful discussion on these topics
Conflicts of Interest
The authors declare no conflict of interest.
References
- O’Neil King, R. Biometrics in Healthcare; Biometrics Research Group, Inc.: Toronto, ON, Canada, 2017; Available online: https://www.biometricupdate.com/wp-content/uploads/2017/04/special-report-global-biometric-healthcare.pdf (accessed on 11 August 2019).
- Jankovic, J. Parkinson’s disease: Clinical features and diagnosis. J Neurol. Neurosurg. Psychiatry 2008, 79, 368–376. [Google Scholar] [CrossRef] [PubMed]
- Contreras-Vidal, J.L.; Stelmach, G.E. Effects of parkinsonism on motor control. Life Sci. 1995, 58, 165–176. [Google Scholar] [CrossRef]
- Tysnes, O.B.; Storstein, A. Epidemiology of Parkinson’s disease. J. Neural Transm. 2017, 124, 901–905. [Google Scholar] [CrossRef] [PubMed]
- Rizzo, G.; Copetti, M.; Arcuti, S.; Martino, D.; Fontana, A.; Logroscino, G. Accuracy of clinical diagnosis of Parkinson disease: A systematic review and meta-analysis. Neurology 2016, 86, 566–576. [Google Scholar] [CrossRef] [PubMed]
- Ammenwerth, E.; Nykanen, P.; Rigby, M.; de Keizer, N. Clinical decision support systems: Need for evidence, need for evaluation. Artif. Intell. Med. 2013, 59, 1–3. [Google Scholar] [CrossRef] [PubMed]
- Dreiseitl, S.; Binder, M. Do physicians value decision support? A look at the effect of decision support systems on physician opinion. Artif. Intell. Med. 2005, 33, 25–30. [Google Scholar] [CrossRef]
- Mattison, H.A.; Stewart, T.; Zhang, J. Applying bioinformatics to proteomics: Is machine learning the answer to biomarker discovery for PD and MSA? Mov. Disord. 2012, 27, 1595–1597. [Google Scholar] [CrossRef]
- Lahmiri, S.; Shmuel, A. Detection of Parkinson’s disease based on voice patterns ranking and optimized support vector machine. Biomed. Signal Process. Control 2018, 49, 427–433. [Google Scholar] [CrossRef]
- Gómez-García, J.A.; Moro-Velázquez, L.; Godino-Llorente, J.I. On the design of automatic voice condition analysis systems. Part I: Review of concepts and an insight to the state of the art. Biomed. Signal Process. Control 2019, 51, 181–199. [Google Scholar] [CrossRef] [Green Version]
- Gómez-García, J.A.; Moro-Velázquez, L.; Godino-Llorente, J.I. On the design of automatic voice condition analysis systems. Part II: Review of speaker recognition techniques and study on the effects of different variability factors. Biomed. Signal Process. Control 2019, 48, 128–143. [Google Scholar] [CrossRef]
- Viteckova, S.; Kutilek, P.; Svoboda, Z.; Krupicka, R.; Kauler, J.; Szabo, Z. Gait symmetry measures: A review of current and prospective methods. Biomed. Signal Process. Control 2018, 42, 89–100. [Google Scholar] [CrossRef]
- San-Segundo, R.; Navarro-Hellín, H.; Torres-Sánchez, R.; Hodgins, J.; De la Torre, F. Increasing Robustness in the Detection of Freezing of Gait in Parkinson’s Disease. Electronics 2019, 8, 119. [Google Scholar] [CrossRef]
- McLennan, J.E.; Nakano, K.; Tyler, H.R.; Schwab, R.S. Micrographia in Parkinson’s disease. J Neurol. Sci. 1972, 15, 141–152. [Google Scholar] [CrossRef]
- Zham, P.; Arjunan, S.P.; Raghav, S.; Kumar, D.K. Efficacy of Guided Spiral Drawing in the Classification of Parkinson’s Disease. IEEE J. Biomed. Health Inform. 2018, 22, 1648–1652. [Google Scholar] [CrossRef]
- Potgieser, A.R.; Roosma, E.; Beudel, M.; de Jong, B.M. The effect of visual feedback on writing size in parkinson’s disease. Parkinsons Dis. 2015, 2015, 857041. [Google Scholar] [CrossRef]
- Drotár, P.; Mekyska, J.; Rektorová, I.; Masarová, L.; Smékal, Z.; Faundez-Zanuy, M. Evaluation of handwriting kinematics and pressure for differential diagnosis of Parkinson’s disease. Artif. Intell. Med. 2016, 67, 39–46. [Google Scholar] [CrossRef]
- Letanneux, A.; Danna, J.; Velay, J.L.; Viallet, F.; Pinto, S. From micrographia to Parkinson’s disease dysgraphia. Mov. Disord. 2014, 29, 1467–1475. [Google Scholar] [CrossRef]
- Thomas, M.; Lenka, A.; Kumar Pal, P. Handwriting Analysis in Parkinson’s Disease: Current Status and Future Directions. Mov. Disord. Clin. Pract. 2017, 4, 806–818. [Google Scholar] [CrossRef]
- Rosenblum, S.; Samuel, M.; Zlotnik, S.; Erikh, I.; Schlesinger, I. Handwriting as an objective tool for Parkinson’s disease diagnosis. J. Neurol. 2013, 260, 2357–2361. [Google Scholar] [CrossRef]
- Impedovo, D.; Pirlo, G. Dynamic Handwriting Analysis for the Assessment of Neurodegenerative Diseases: A Pattern Recognition Perspective. IEEE Rev. Biomed. 2019, 12, 209–220. [Google Scholar] [CrossRef]
- Impedovo, D.; Pirlo, G. Chapter 7: Online Handwriting Analysis for the Assessment of Alzheimer’s Disease and Parkinson’s Disease: Overview and Experimental Investigation. In Series on Language Processing, Pattern Recognition, and Intelligent Systems. Pattern Recognition and Artificial Intelligence; World Scientific Publishing: Singapore, 2019; pp. 113–128. [Google Scholar]
- van Drempt, N.; McCluskey, A.; Lannin, N.A. A review of factors that influence adult handwriting performance. Aust. Occup. Ther. J. 2011, 58, 321–328. [Google Scholar] [CrossRef]
- Kotsavasiloglou, C.; Kostikis, N.; Hristu-Varsakelis, D.; Arnaoutoglou, M. Machine learning-based classification of simple drawing movements in Parkinson’s disease. Biomed. Signal Process. Control 2017, 31, 174–180. [Google Scholar] [CrossRef]
- Gallicchio, C.; Micheli, A.; Pedrelli, L. Deep Echo State Networks for Diagnosis of Parkinson’s Disease. arXiv 2018, arXiv:1802.06708. [Google Scholar]
- Khatamino, P.; Cantürk, İ.; Özyılmaz, L. A Deep Learning-CNN Based System for Medical Diagnosis: An Application on Parkinson’s Disease Handwriting Drawings. In Proceedings of the 2018 6th International Conference Control Engineering Information Technology, Istanbul, Turkey, 25–27 October 2018; pp. 1–6. [Google Scholar] [CrossRef]
- Isenkul, M.E.; Sakar, B.E.; Kursun, O. Improved spiral test using digitized graphics tablet for monitoring Parkinson’s disease. In Proceedings of the 2nd International Conference on e-Health and Telemedicine (ICEHTM-2014), Istanbul, Turkey, 22–24 May 2014; pp. 171–175. Available online: https://archive.ics.uci.edu/ml/datasets/Parkinson+Disease+Spiral+Drawings+Using+Digitized+Graphics+Tablet (accessed on 11 August 2019). [CrossRef]
- Krizhevsky, A.; Sustskever, I.; Hinton, G.E. ImageNet classification with deep convolutional neural networks. Commun. ACM 2017, 60, 84–90. [Google Scholar] [CrossRef]
- Hahne, U.; Schild, J.; Elstner, S.; Alexa, M. Multi-touch focus+ context sketch-based interaction. In Proceedings of the 6th Eurographics Symposium on Sketch-Based Interfaces and Modeling, New Orleans, LA, USA, 1–2 August 2009; ACM: New York, NY, USA, 2009; pp. 77–83. [Google Scholar]
- Saunders-Pullman, R.; Derby, C.; Stanley, K.; Floyd, A.; Bressman, S.; Lipton, R.B.; Deligtisch, A.; Severt, L.; Yu, Q.; Kurtis, M.; et al. Validity of spiral analysis in early Parkinson’s disease. Mov. Disord. 2008, 23, 531–537. [Google Scholar] [CrossRef]
- Chui, K.T.; Lytras, M.D. A Novel MOGA-SVM Multinomial Classification for Organ Inflammation Detection. Appl. Sci. 2019, 9, 2284. [Google Scholar] [CrossRef]
- Deuschl, G.; Fietzek, U.; Klebe, S.; Volkmann, J. Chapter 24 clinical neurophysiology and pathophysiology of Parkinsonian tremor. In Handbook of Clinical Neurophysiology; Hallett, M., Ed.; Elsevier: Amsterdam, The Netherlands, 2003; Volume 1, pp. 377–396. [Google Scholar]
- Hanley, J.A.; McNeil, B.J. The meaning and use of the area under a receiver operating characteristic (ROC) curve. Radiology 1982, 143, 29–36. [Google Scholar] [CrossRef]
- Shargel, L.; Mutnick, A.H.; Souney, P.F.; Swanson, L.N. Comprehensive Pharmacy Review; Lippincott Williams & Wilkins: Philadelphia, PA, USA, 2008. [Google Scholar]
- Goetz, C.G.; Tilley, B.C.; Shaftman, S.R.; Stebbins, G.T.; Fahn, S.; Martinez Martin, P.; Poewe, W.; Sampaio, C.; Stern, M.B.; Dodel, R.; et al. Movement disorder society-sponsored revision of the unified Parkinson’s disease rating scale (mds-updrs): Scale presentation and clinimetric testing results. Mov. Disord. 2008, 23, 2129–2170. [Google Scholar] [CrossRef]
Figure 1.
Recorded information: x-y-z coordinates, pressure, and grip angle.

Figure 2.
Signal preprocessing carried out for every time-series.

Figure 3.
Deep learning structure including convolutional and fully connected layers.

Figure 4.
Mean and standard deviation of accuracy (a), F1-score (b), and Area Under the Curve (AUC) (%) (c) for every signal independently: X, Y, and Z coordinates, pressure (PRE), and grid angle (GRID) and including all the signals together (ALL).
Figure 4.
Mean and standard deviation of accuracy (a), F1-score (b), and Area Under the Curve (AUC) (%) (c) for every signal independently: X, Y, and Z coordinates, pressure (PRE), and grid angle (GRID) and including all the signals together (ALL).

Figure 5.
Sensitivity vs. specificity curves for every signal independently: X, Y, and Z coordinates, pressure (PRE), and grid angle (GRID) and including all the signals together (ALL).
Figure 5.
Sensitivity vs. specificity curves for every signal independently: X, Y, and Z coordinates, pressure (PRE), and grid angle (GRID) and including all the signals together (ALL).


Table 1.
Main characteristics of previous works on PD (Parkinson’s disease) detection based on drawings. ACC (accuracy), AUC (Area Under the Curve).
Table 1.
Main characteristics of previous works on PD (Parkinson’s disease) detection based on drawings. ACC (accuracy), AUC (Area Under the Curve).
| Reference | Participants | Tasks | Methodology | Performance | Granularity |
|---|---|---|---|---|---|
| Kotsavasiloglou et al. [24] | 24 PD 20 Control | Line drawing | Naïve Bayes with Handcrafted features | ACC = 88.6% | Line drawing (2 s. aprox.) |
| Zham et al. [15] | 31 PD 31 Control | Archimedean guided spiral | Naïve Bayes with Handcrafted features | AUC = 93.3% | Segments between pen-down and pen-up (2 s. aprox.) |
| Gallicchio et al. [25] | 62 PD 15 Control | Spirals and stability movement | Deep Echo State Networks (DeepESNs) | ACC = 89.3% | Drawing (> 10 s.) |
| Khatamino et al. [26] | 62 PD 15 Control | Spirals and stability movement | Convolution Neural Network from raw data | ACC = 72.5% | Drawing (> 10 s.) |
| This work | 62 PD 15 Control | Spirals and stability movement | Convolution Neural Network from spectrum | ACC = 96.5% AUC = 99.2% | Fraction of drawing (3 s.) |
© 2019 by the authors. Licensee MDPI, Basel, Switzerland. This article is an open access article distributed under the terms and conditions of the Creative Commons Attribution (CC BY) license (http://creativecommons.org/licenses/by/4.0/).
Share and Cite
MDPI and ACS Style
Gil-Martín, M.; Montero, J.M.; San-Segundo, R. Parkinson’s Disease Detection from Drawing Movements Using Convolutional Neural Networks. Electronics 2019, 8, 907. https://doi.org/10.3390/electronics8080907
AMA Style
Gil-Martín M, Montero JM, San-Segundo R. Parkinson’s Disease Detection from Drawing Movements Using Convolutional Neural Networks. Electronics. 2019; 8(8):907. https://doi.org/10.3390/electronics8080907
Chicago/Turabian StyleGil-Martín, Manuel, Juan Manuel Montero, and Rubén San-Segundo. 2019. "Parkinson’s Disease Detection from Drawing Movements Using Convolutional Neural Networks" Electronics 8, no. 8: 907. https://doi.org/10.3390/electronics8080907
Note that from the first issue of 2016, this journal uses article numbers instead of page numbers. See further details here.