Effective Data Selection and Management Method Based on Dynamic Regulation in Opportunistic Social Networks


School of Computer Science and Engineering, Central South University, Changsha 410075, Hunan, China
*
Author to whom correspondence should be addressed.
Electronics 2020, 9(8), 1271; https://doi.org/10.3390/electronics9081271
Submission received: 14 July 2020
/
Revised: 2 August 2020
/
Accepted: 6 August 2020
/
Published: 7 August 2020
(This article belongs to the Special Issue Opportunistic Networks)
Abstract
:5G has brought a huge increase in data, and the number of nodes and types of messages are becoming more and more complex. The Internet of things has become a large and complex network. More and more devices can be used as nodes in opportunistic social networks. The attitude of nodes to messages is different and changeable. However, in the previous opportunistic network algorithm and mass data transmission environment, due to the lack of effective information selection and management means, it was easy to lead to transmission delay and high consumption. Therefore, we propose Effective Data Selection and Management (EDSM). EDSM uses the current state of the node as the basis for forwarding messages. When the cache space is insufficient, EDSM will perform cache replacement based on the message cache value and delete the information with the lowest cache value. Simulation results show that the algorithm has good performance in terms of delivery rate and latency.
1. Introduction
The 5G era is coming, and network users and various electronic devices are increasing day by day [1,2]. People’s daily work and life have become increasingly inseparable from networks (Microblog, Facebook, various Communities, etc.), which leads to the continuous growth of data volume in the network [3]. News and advertising information will be spread on the Internet, so understanding the communication mechanism behind the information can help people to better understand the information on the Internet [4,5,6].
The information dissemination on opportunistic social networks has changed under the influence of many factors [7,8,9], including the choice of nodes and the change in information transmission. There are many factors that affect information transmission and these factors play an important role [10,11,12]. Basically, they are related to nodes or messages [13]. In addition, information dissemination on social media is sometimes affected by the information push function provided by social media services, such as Facebook’s News Feed, and Sina Microblog’s instant tweet. These aspects are the key factors of network information dissemination [14,15], which together determine the mechanism of network information dissemination.
However, most nodes in opportunistic social networks use mobile devices, and the chance of encountering between-nodes creates characteristics of intermittent connection [16,17,18]. Therefore, during a node encounter, the amount of message interaction is limited. This means that accurate and effective information needs to be transmitted, especially now that the devices are mobile [19,20,21]. In such a complex network, not only the basis of forwarding messages, but also the state of nodes should be considered, because the state of nodes has different attitudes to messages.
Opportunistic social networks have a lot of information, and there are complex relationships between nodes [22,23,24]. We propose an information propagation model for node state transition. The in-depth analysis of the competition propagation process of different types of information on the opportunistic social networks proves that the network node state is Markov, and the node state transition probability matrix and its calculation formula are derived. This divides messages into different types, and the node state is affected by the node’s propagation speed, replacement rate, and discard rate, and opportunistic social network topology. In the case of insufficient cache space, messages can be selectively deleted according to the cache value and node state.
Specifically, the main contribution of this paper can be summarized as the following three aspects:
- Combining Markov chain theory, a competitive information dissemination model based on opportunity social network is proposed, which describes the transition between different states of nodes;
- Determine the state of the node at the current time by deriving the transition probability between different states. The node forwards different types of messages with priority according to the state of the node;
- A message caching mechanism is proposed. When the node cache space is insufficient, the message with the least cache value in the cache space is selected and replaced according to the node state.
The rest of the paper is arranged as follows. The second section discusses the related work. The third section introduces system model design, includes the state transition matrix and transition probability. The fourth part presents the performance evaluation of the proposed method and the analysis with other algorithms. The last part includes the summary of the whole work.
2. Related Work
In Reference [25], the authors propose a basic interest-based dissemination algorithm, to show that nodes tend to group together based on interests. The algorithm uses the information of nodes’ social connections, interests and contact history as an important basis for dissemination because they think that nodes based on the same interest have a higher chance of meeting, that is, the same interest represents the same benefits [26]. However, this kind of interest is diverse, and it will change as the nodes change. When the interests are very broad, or the interest is too single, it may cause certain problems. Finally, they propose five heuristics for sorting the messages in a node’s memory, and solve the energy consumption caused by the exchange of large amounts of unrelated data in Epidemics.
Ying et al. [27] propose a fair and socially aware message-forwarding mechanism for opportunistic social networks. The number of nodes forwarding messages depends on the current social relationship and the remaining life of the message. By limiting the number of messages forwarded by users with strong social relationships, the problem of fairness in message-forwarding is solved to a certain extent. At the same time, a social relationship credit is set for the nodes, and the Markov chain model is used to study and update the social connections of the nodes. This means that the messages generated by different nodes have different priorities when transmitting messages, which further improves the issue of fairness.
Socievole et al. [28] proposed a method of constructing multiple social network layers using temporal detected social network(DSN) graph and other static social network graphs, and a routing protocol ML-SOR that uses multiple layers of social networks to select nodes as message relays. It changes the choice of finding the right message relay node in the past and studies the relationships between social network layers in terms of node centrality, community structure, connection strength, and link prediction [29]. Obviously, it can be seen that the similarity between communities at different levels is very low [30], and the DSN graphs are closely related. The analysis of the behavior of nodes on different social network layers provides novel insights into the comparability of social networks. Experimental results show that by combining different types of social information, messages can be delivered with high probability while keeping the overhead ratio very small.
In Reference [31], the authors proposed Interest spaces for opportunistic networks, an interest-based dissemination framework that spreads data by taking advantage of nodes’ context information. There are four layers in the Interest Spaces framework: the application layer, data layer. trust and security layer and opportunistic layer. There are two types of tags that a message can have: general and specific. Each specific tag is a subset of a general tag, and the reunion of all specific tags pertaining to a general tag would contain all data marked with the general tag. The data aggregation method is based on the idea that strongly connected nodes can work together to deliver data to interested destinations. Experimental results show that the overall hit rate and delivery latency of the opportunistic network are improved.
Ciobanu et al. [32] proposed a novel opportunistic network-routing algorithm entitled SPRINT. Expanding the social relationship between nodes was statically determined based on historical information in the past. An additional prediction component was added to the routing algorithm, and the future behavior of the node is predicted based on the Poisson distribution. Since the behavior of nodes has a certain regularity, based on past contacts, the probability of encountering a node is calculated based on the ratio between the number of times each node has an encounter and the total number of encounters. Experiments proved that in some cases, the distribution of contacts per person is highly predictable, and can be approximated as Poisson distribution.
Sati et al. [33] studied the impact of parameters such as the arrival time, replication count, number of relayed nodes, time to live (TTL), and message size on routing performance in opportunistic networks. They evaluated the impact of different buffer management policies and message generators. Experimental results show that the buffer strategy should be selected according to factors such as network characteristics. Pandey et al. [34] optimize link energy consumption by using small world characteristics. They reduce the number of hops in the transmission process. By adding the new link to balance the energy consumption of nodes, the data transmission with low delay and energy balance is realized.
3. System Model Design
The data propagate on the nodes of the network, and the relationship between the nodes is complex. Most of the data transmission environments are represented by graphic structure. A complex network that contains linked information and attribute information can be represented as G = (V,E), where V usually represents the node set, and E usually represents the edge of the node.
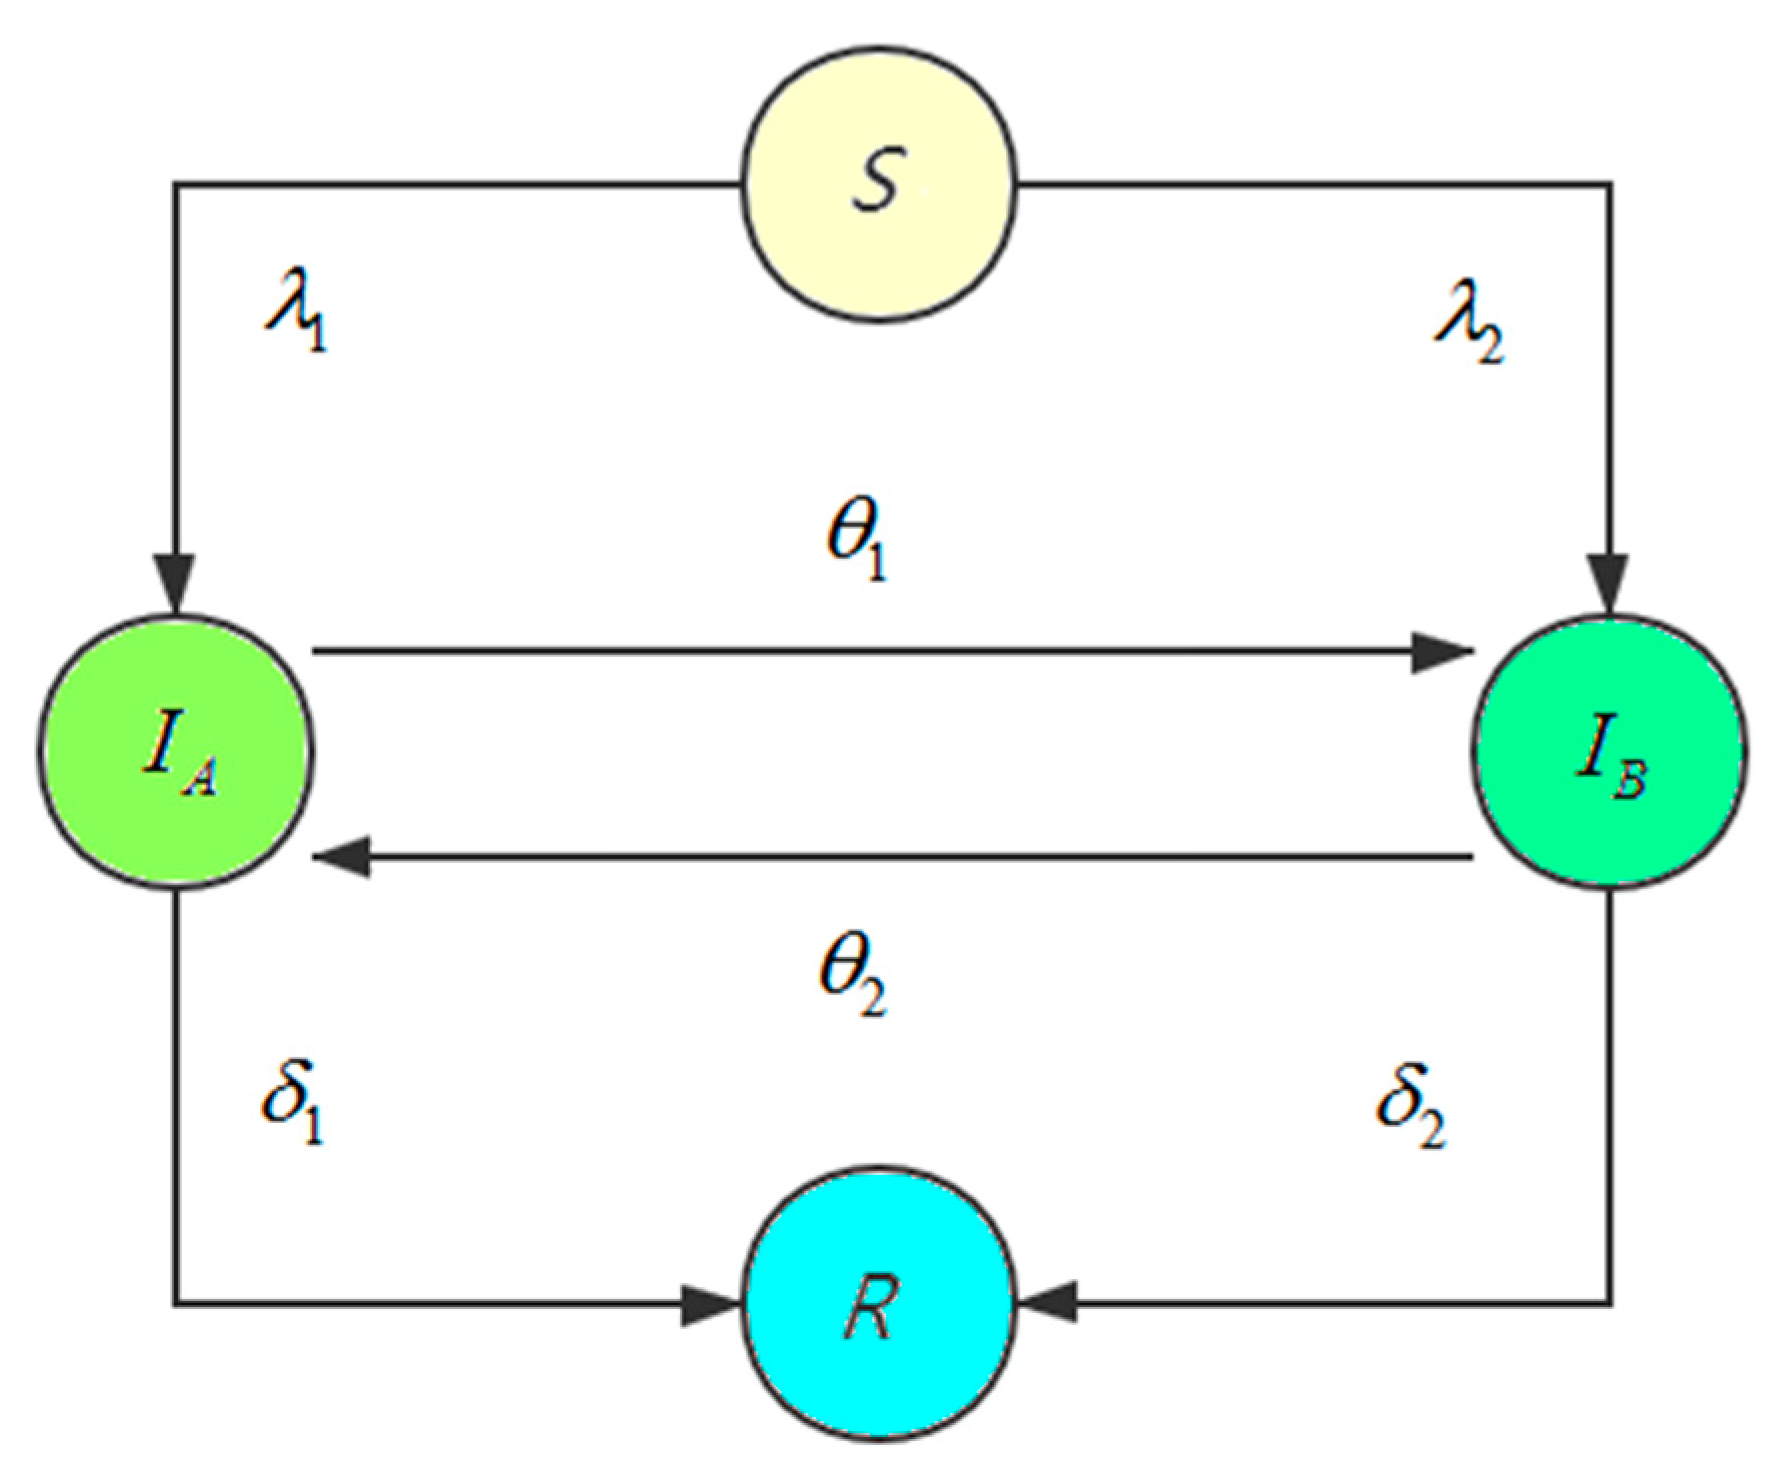
In opportunistic social networks, there are two opposite types of information for transmission. We express the competition of messages in the network by describing the competition of messages A and B. We divide the status of nodes into four categories: the nodes that have not propagated any information (S-state), the nodes that have received information A and propagated (IA-state), the nodes that have received information B and propagated (IB-state), the nodes that have lost interest in information dissemination and have a resistance attitude to all information (R-state). When the message type in the network changes to N, the attitude of nodes to different types of messages is as follows: a positive attitude to current messages (-state), negative attitude to current messages and equal attitude to all messages (S-state). The expansion of message types does not affect the total attitude of nodes to messages, only the number of attitudes. That is to say, other types of message than type A can be regarded as type B. The competition and cooperation between n types of messages can be simplified into the competition and cooperation between two types of messages. The state transition diagram between nodes is shown in Figure 1.
In Figure 1, different colors represent different states of nodes, which indicate the transition between different states of nodes. and represent the propagation rate of information and , which are used to describe the preference degree of S-state nodes for different information. Message propagation is proportional to its value. and represent the abandonment rate of information and , and indicate the abandonment degree of this type of message. Over time, nodes change state with the influence of these values. and represent the replacement rate of information and , indicating the probability that the state of a node will be affected by multiple other types of message. The larger , the greater the attractiveness of information , which can convert the node state of the disseminated information to the node state of the disseminated information . Conversely, the larger , the greater the attractiveness of information , which can convert the node state of the disseminated information to the node state of the disseminated information . In the process of communication, there is both competition and cooperation between information and information , that is to say, on some nodes, it may inhibit the propagation of the other party, while on other nodes, it may promote the propagation of the other party. In fact, it reflects the relationship between them. Therefore, the position of competition and cooperation can be changed.
According to the probability diagram, the state space of opportunistic social network nodes is , and the state transition of each node is related to the message type and other factors. This process is affected by the information that is in a competitive relationship among the current nodes. The next state of a node is not related to the historical state of the node, but only to the current state. That is to say, the “future” of the node does not depend on the “past” and is only determined by the “present”. The whole propagation process can be regarded as a Markov random process. Therefore, the distribution function can be used to describe the Markov property of node state transitions. X is used to represent the random variable of node state transition. The state space of process is , and is a set of time series. Under the condition , the conditional distribution function of is exactly equal to the conditional distribution function of under the condition . Therefore, without considering the external interference, the competitive information dissemination process in the system is essentially a Markov chain in which each opportunistic social network node continuously carries out state transformation in state space . The transfer probability matrix can be obtained
In the process of competitive information transmission, a node starts from S-state , transforms into IA-state or IB-state at time , and then, after several time steps of competition, finally transforms into state at time . From then on, the node state will not change until the end of the transmission process. For the two types of message, the state transition probability matrix is a matrix. When the message types become n in the network, the size of the matrix is , including the transition probability between various types of message states, S-state and R-state.
The transition probability of the node state in the opportunistic social network is not only related to the node’s propagation speed, replacement rate and abandonment rate, but also closely related to the opportunistic social network structure. The adjacency matrix of node represents the adjacency relationship between network nodes. In this model, the opportunistic social network is abstracted as an undirected graph, so the adjacency matrix D is an N-order matrix. The number of neighboring edges of a node in the opportunistic social network is called the degree of the node, and it is represented by k. The adjacency matrix representation method of the node and the node degree representation method of the network structure are essentially equivalent.
In an opportunistic social network, each node represents a state variable, and the edge between nodes represents the dependency between two variables. The transformation of node state is determined by the joint probability distribution of all neighboring node states, that is, the product of propagation rate and replacement rate. Thus, the system is essentially a Markov random airport [35]. Next, consider the transition probability of the node in the and states, that is, the node state, is transmitted between IA-state and IB-state.
In the process of information dissemination, the IA-state node and the IB-state node will compete when they are adjacent. At the next moment, they all want each other to transform into the same state as their own at this time. The degree of competition depends on their replacement rate. There are multiple and nodes in the opportunistic social network at the same time. and are used to represent the number of them. Therefore, the transition probabilities , , and can be deduced as follows
In Formulas (2)–(5), and , respectively, represent the number of nodes in the IA-state and IB-state. In Formula (2), the node in IA-state will be affected by the node in IB-state, and will be affected by the abandonment rate of type A information. In Formula (5), the node in IB-state will be affected by the node in IA-state, and will be affected by the abandonment rate of type B information. In Formulas (3)–(4), the transition between two states of the node is affected by the other state.
Similarly, the transition probabilities of other states can also be obtained, as shown in Equation (6).
We use to represent the possible states of node i, then the states of nodes , , and are, respectively, , , , . The state of a node is a discrete random variable and its weight is the same in some cases. Therefore, the probability that a node belongs to a certain state at a certain time can be expressed as the mathematical expectation of the state. In other words, we can think that the two are equal. Among them, , , and , respectively, represent the probability that node at time belongs to state , , and as shown in Equation (7).
In Formula (7), a node must belong to one of the four states at a certain time. Therefore, it must satisfy the normalization and countably additive property of probability, that is, .
According to the probability matrix and Equation (7), the probability model of information transmission can be obtained, as shown in Equation (8).
In Formula (8), is the value of row i and column j in the adjacency matrix of opportunistic social network nodes.
The opportunistic social network is composed of multiple communities. There are many nodes formed by different devices in the network. It has the characteristics of a social network. The nodes include mobile devices carried by people, and communication between nodes is intermittent. Therefore, it also shows the characteristics of the opportunistic network. During the period, the total number of nodes in the opportunistic social network is , which is stable, and what changes at each moment is the proportion of the points in the network at different state. The number of , , and state counters in the network at time t is , , and , respectively. The evolution process of the information transmission model in the online social network can be expressed as a set of differential Equations, as shown in Equation (9).
It is known from Equation (9) that the competitive permutation relationship of information and is mainly reflected in items and at the right end of Equation and . Let
Because , there are three kinds of competition relations, as follows:
(1). When , , the speed of replacing state node is faster than that of replacing state node, information is in competitive advantage, and the system suppresses the propagation of information . Nodes will forward messages of type A first;
(2). When , , similarly, information is in the competitive advantage, and the system suppresses the spread of information . Nodes will forward messages of type B first;
(3). When , , the competitiveness of information and is the same, which is in a temporary equilibrium state. At this time, the node treats messages and with the same attitude.
For the above-mentioned situation of different types of information competition, while considering different types of information, we set message importance values for different messages within the same information. Information moves forward according to its different importance.
The importance of a message is determined by two aspects: on the one hand, the importance of the message content is determined by the sender of the message, and, on the other hand, the time to live (TTL) value, hops and size of the message. It is necessary to determine the important message index of the node sender, limit the number of important messages within a certain period of time, and automatically degrade when the limit is reached. Therefore, the importance measure value used to define message m is
In Formula (11), represents a value set by the message sender according to the degree of importance of the content of m, , and a larger indicates that the content of m is more important. The remaining survival time of m is . It should be noted that the TTL in the opportunistic social network indicates the remaining survival time of the message.
A smaller TTL value, indicates that the message is nearer to being deleted, making it more of a priority to be forwarded. The hop number of m is , and the smaller , indicating that the less this message is forwarded, the more it needs to be forwarded as soon as possible. The size of m is , and the smaller is, the more important the message per bit in m is.
In opportunistic social networks, the cache space of nodes is limited. When the receiver’s buffer is insufficient during transmission, some messages in the buffer need to be deleted to ensure that the nodes have enough buffer space to receive data. Messages deleted from the cache should have the lowest cache value.
Define the caching value of the message as
In Equation (12), the smaller the , The greater the probability that message m has been forwarded. Conversely, the larger the , the smaller the probability that the message m is forwarded, and the message m needs to be retained. In particular, when the is reduced to 0, the message has exceeded its expiration date and the cache value is zero. The larger , the more important the content of the message m, and the greater the value of caching the message. is the current state of the node. It determines the order of message replacement in the cache.
Stability is a performance of the system. The system will be affected by some factors. If the system is unstable, the physical quantities in the system will deviate from its equilibrium working point. Model stability means that the system can accurately return to the equilibrium state. Routh stability criterion [36] is the most commonly used method to determine the stability of the model. It is a necessary and sufficient condition to determine the stability of the system.
For Equation (9) of the differential equations of the information transmission model, the two ends of the four equations are added to obtain
The model satisfies ( is constant).
If the network reaches the equilibrium point at time , then the network will be in equilibrium, so there is
From Formula (14), the equilibrium point is related to S-state, IA-state and IB-state. Therefore, we can set the equilibrium point as , and we can get three solutions, , , of the system of equations. These three solutions are the equilibrium points of the information propagation model. The specific expressions of , , are as follows:
(1). , initial state, there are no messages in the network for transmission;
(2). , ending state, the balance point after the information has been transmitted to the whole opportunistic social network;
(3). When ,
This indicates that the system reaches the balance point of temporary stable state in the process of competitive communication. is the degree distribution function of the network, which represents the probability of selecting a node whose degree value is , that is, the probability that the node has edge connections.
When , the equilibrium point is a stable state.
At equilibrium point , is
The characteristic polynomial of a matrix can be set as
Solve the characteristic polynomial of J(E0) in Equation (16). We can solve
The Routh array table at point is shown in Table 1.
According to the Routh–Hurwitz stability criterion, the system is stable only when the coefficients in the first column of the array table are all positive real numbers.
can be obtained
Therefore, the equilibrium point is stable only when , or , . That is, the model is in the problem state where information cannot be transmitted, and the number of nodes covered by information and information is zero. If the above conditions are not met, the system may present a single type of message propagation, which is not what we want to see. After the A, B type of message dissemination, the system will reach a non-zero equilibrium point, so that the network can be stable again. The method can be designed via Algorithm 1 as follow:
| Algorithm 1. Effective Data Selection and Management algorithm |
| EDSM (M,S,F) { |
| SendDest(F,V,SV); |
| //Send M’s destination address set F and message summary vector SV to all nodes in neighbor V |
| Receive SV and state information; |
| //All neighbor nodes return |
| ComputeState(SV,Node); |
| //Compute node state |
| SortDecend(M); |
| //Determine the priority of message forwarding |
| for each m in M do { //Forwarding messages by value and state |
| Get ; //Determining Neighbor Nodes for Forwarding Messages |
| for each b in do { |
| call MsgForward (m,b); |
| UpdateState(); |
| //Update node status |
| } |
| } |
| UpdateNeighbor(V,T) |
| //Maintaining Neighbor Node Set V and state for each cycle T |
| } |
| MsgForward(m,b) { //Cache Replacement Strategy |
| ; |
| while ( {//Insufficient cache space |
| find in A;//Find the message with the smallest cache value according to the state |
| } |
| if |
| if |
| delete D from cache and compact cache; } |
| send m to b; |
| } |
| } |
4. Simulation and Analysis
In this paper, we use Opportunistic Network Environment (ONE) to simulate EDSM, and compare the performance of EDSM with typical routing algorithms: Epidemic, PROPHET and PROPICMAN. The ONE is an opportunistic network environment simulator. It provides a powerful tool for generating trajectories. It uses different routing protocols to simulate message forwarding experiments. It can observe real-time simulation interactions and experimental results. This article chooses a map of Helsinki and uses Working Day Movement model to simulate how people move in real life. After running the simulation ten times using the platform, the average value was taken as the final result. Set the value of θ at the time of message generation to be uniformly distributed on . Among them, type A and type B messages are randomly assigned. The proportion of different types is different in each simulation. The node degree of the article obeys an approximate normal distribution. The average node degree of the experimental network is 40, and the change range of the node degree is small. The specific simulation parameters are set as shown in Table 2.
This paper defines the standard deviation of node residual energy as follows.
Standard deviation of node residual energy. The standard deviation of node residual energy reflects the difference in residual energy between nodes. The smaller the standard deviation of node residual energy, the better the performance of energy balance. The standard deviation of node residual energy is
is the mean of residual energy of all nodes in the network, K is the set of all nodes in the network, and the number of nodes is N.
The number of nodes in the network is set to 260, the buffer size is 30 MB, and the ratio of dead nodes in the network increases from 0.1 to 0.5. The running time of the network is 1 h~7 h, and the standard deviation of residual energy of nodes in different algorithms is calculated every 1 h.
It can be seen from Figure 2 that, as the network running time increases, the residual energy standard deviation of the nodes of different algorithms increases. The residual energy standard deviation in the nodes of the EDSM is the smallest, indicating that the remaining energy distribution of the nodes of the EDSM is more uniform. This is because EDSM combines the status of the current node in routing, so that the delivered message conforms to the current trend. It can select different messages in a timely manner for forwarding according to the node status and the importance measure value.
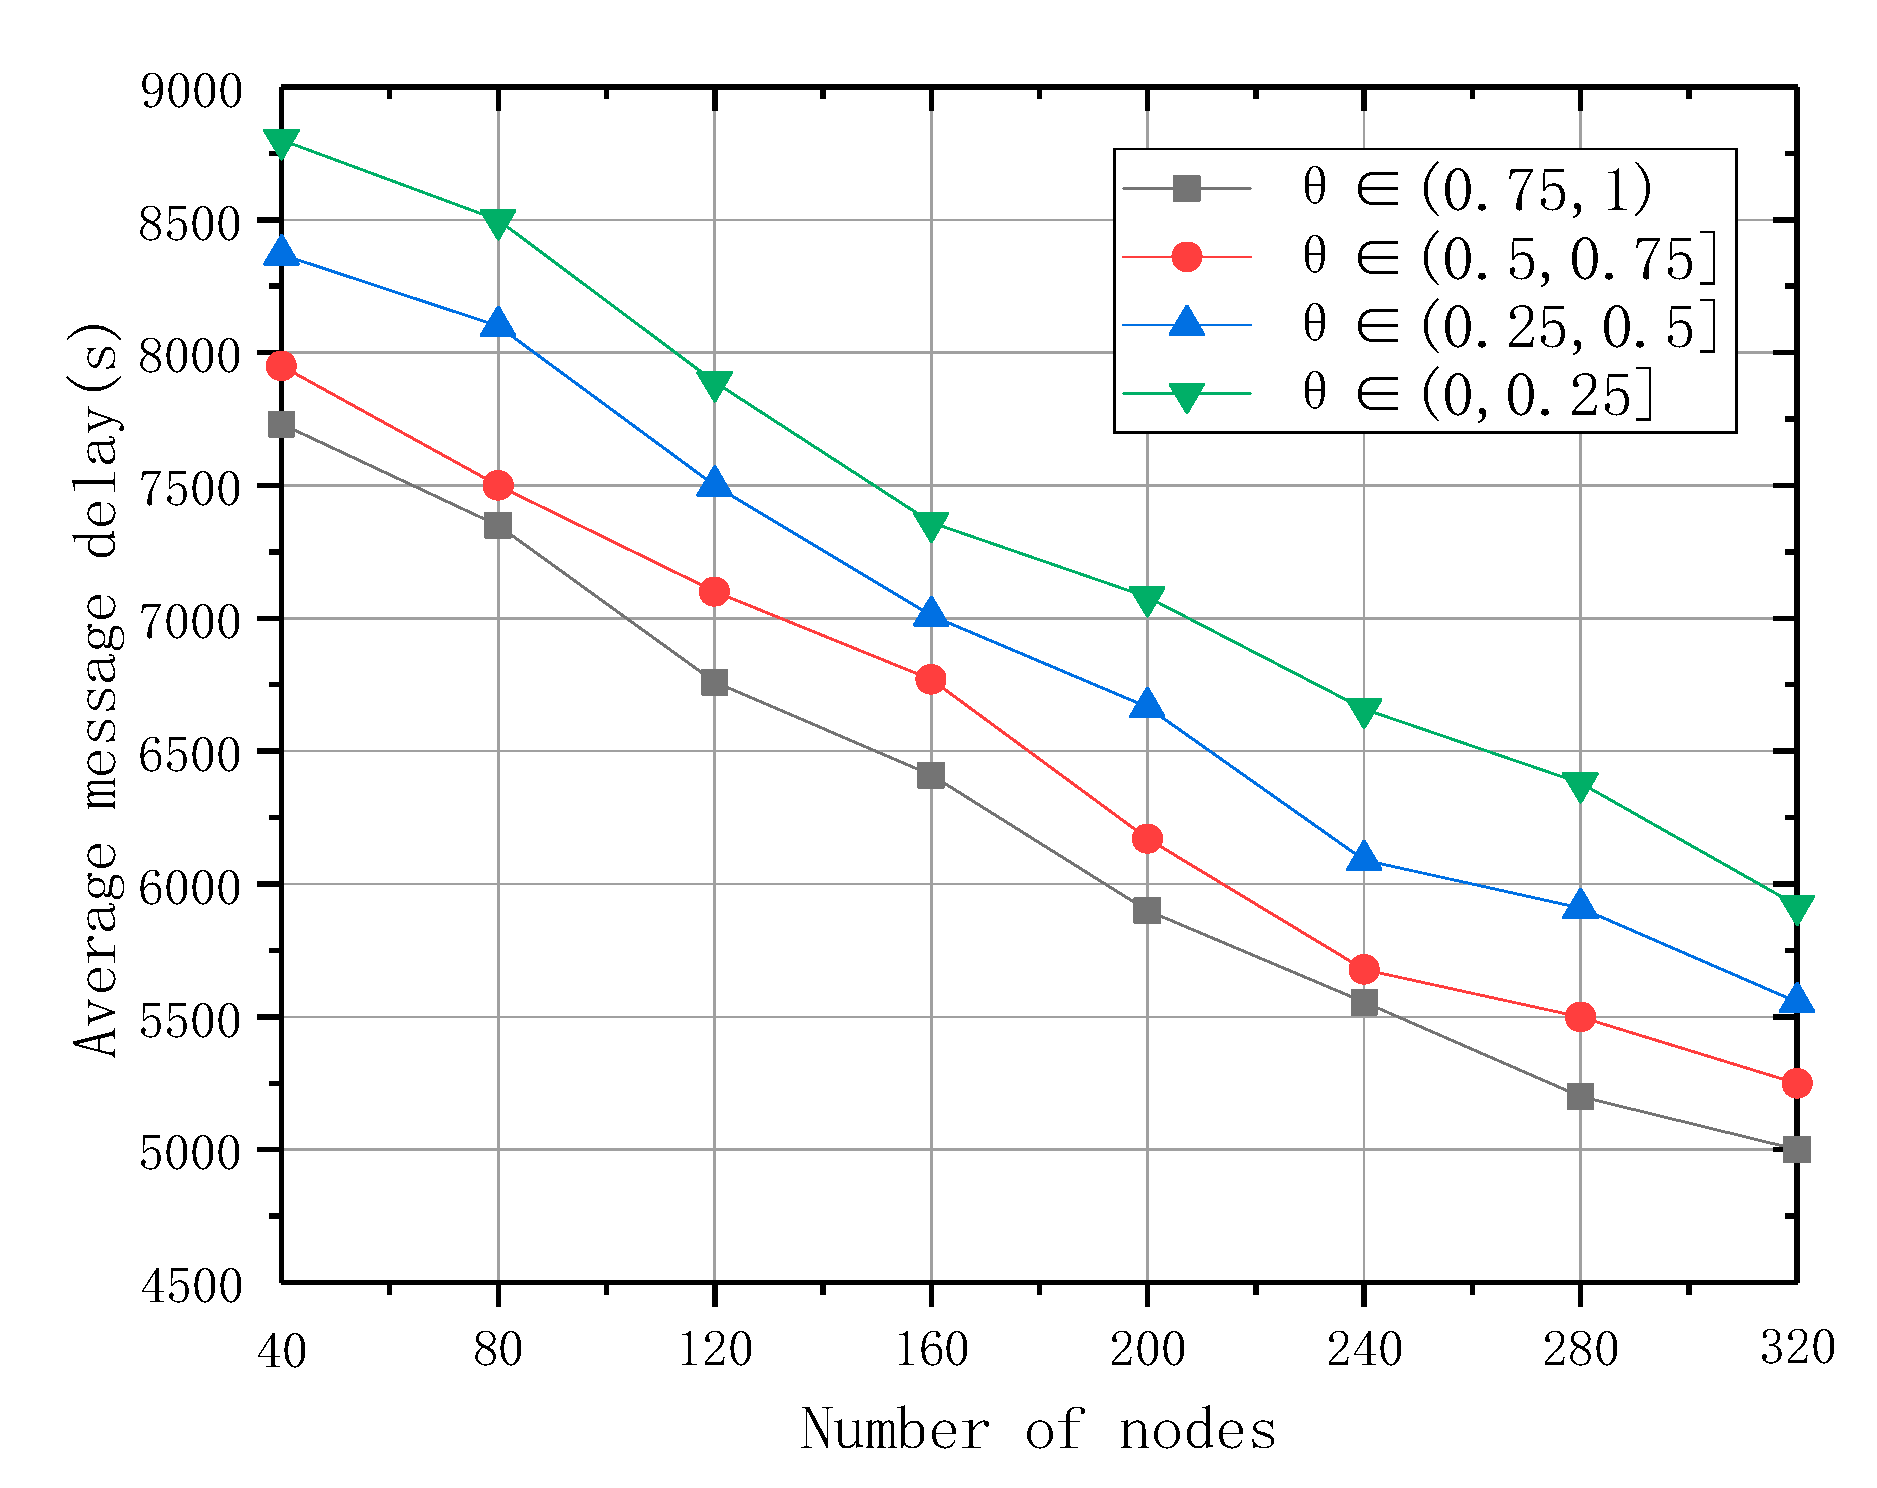
Figure 3 shows the average message delay of EDSM under a different number of nodes and different θ intervals. It can be seen from the graph that the average message delay of different θ intervals decreases with the increase in the number of nodes. The larger the value of θ, the lower the average message delay. This is because the greater the θ value, the greater the message importance measure, and the higher the priority in message forwarding and cache replacement. The average message delay of is 5%, 9.5% and 15% lower than that of , and , respectively.
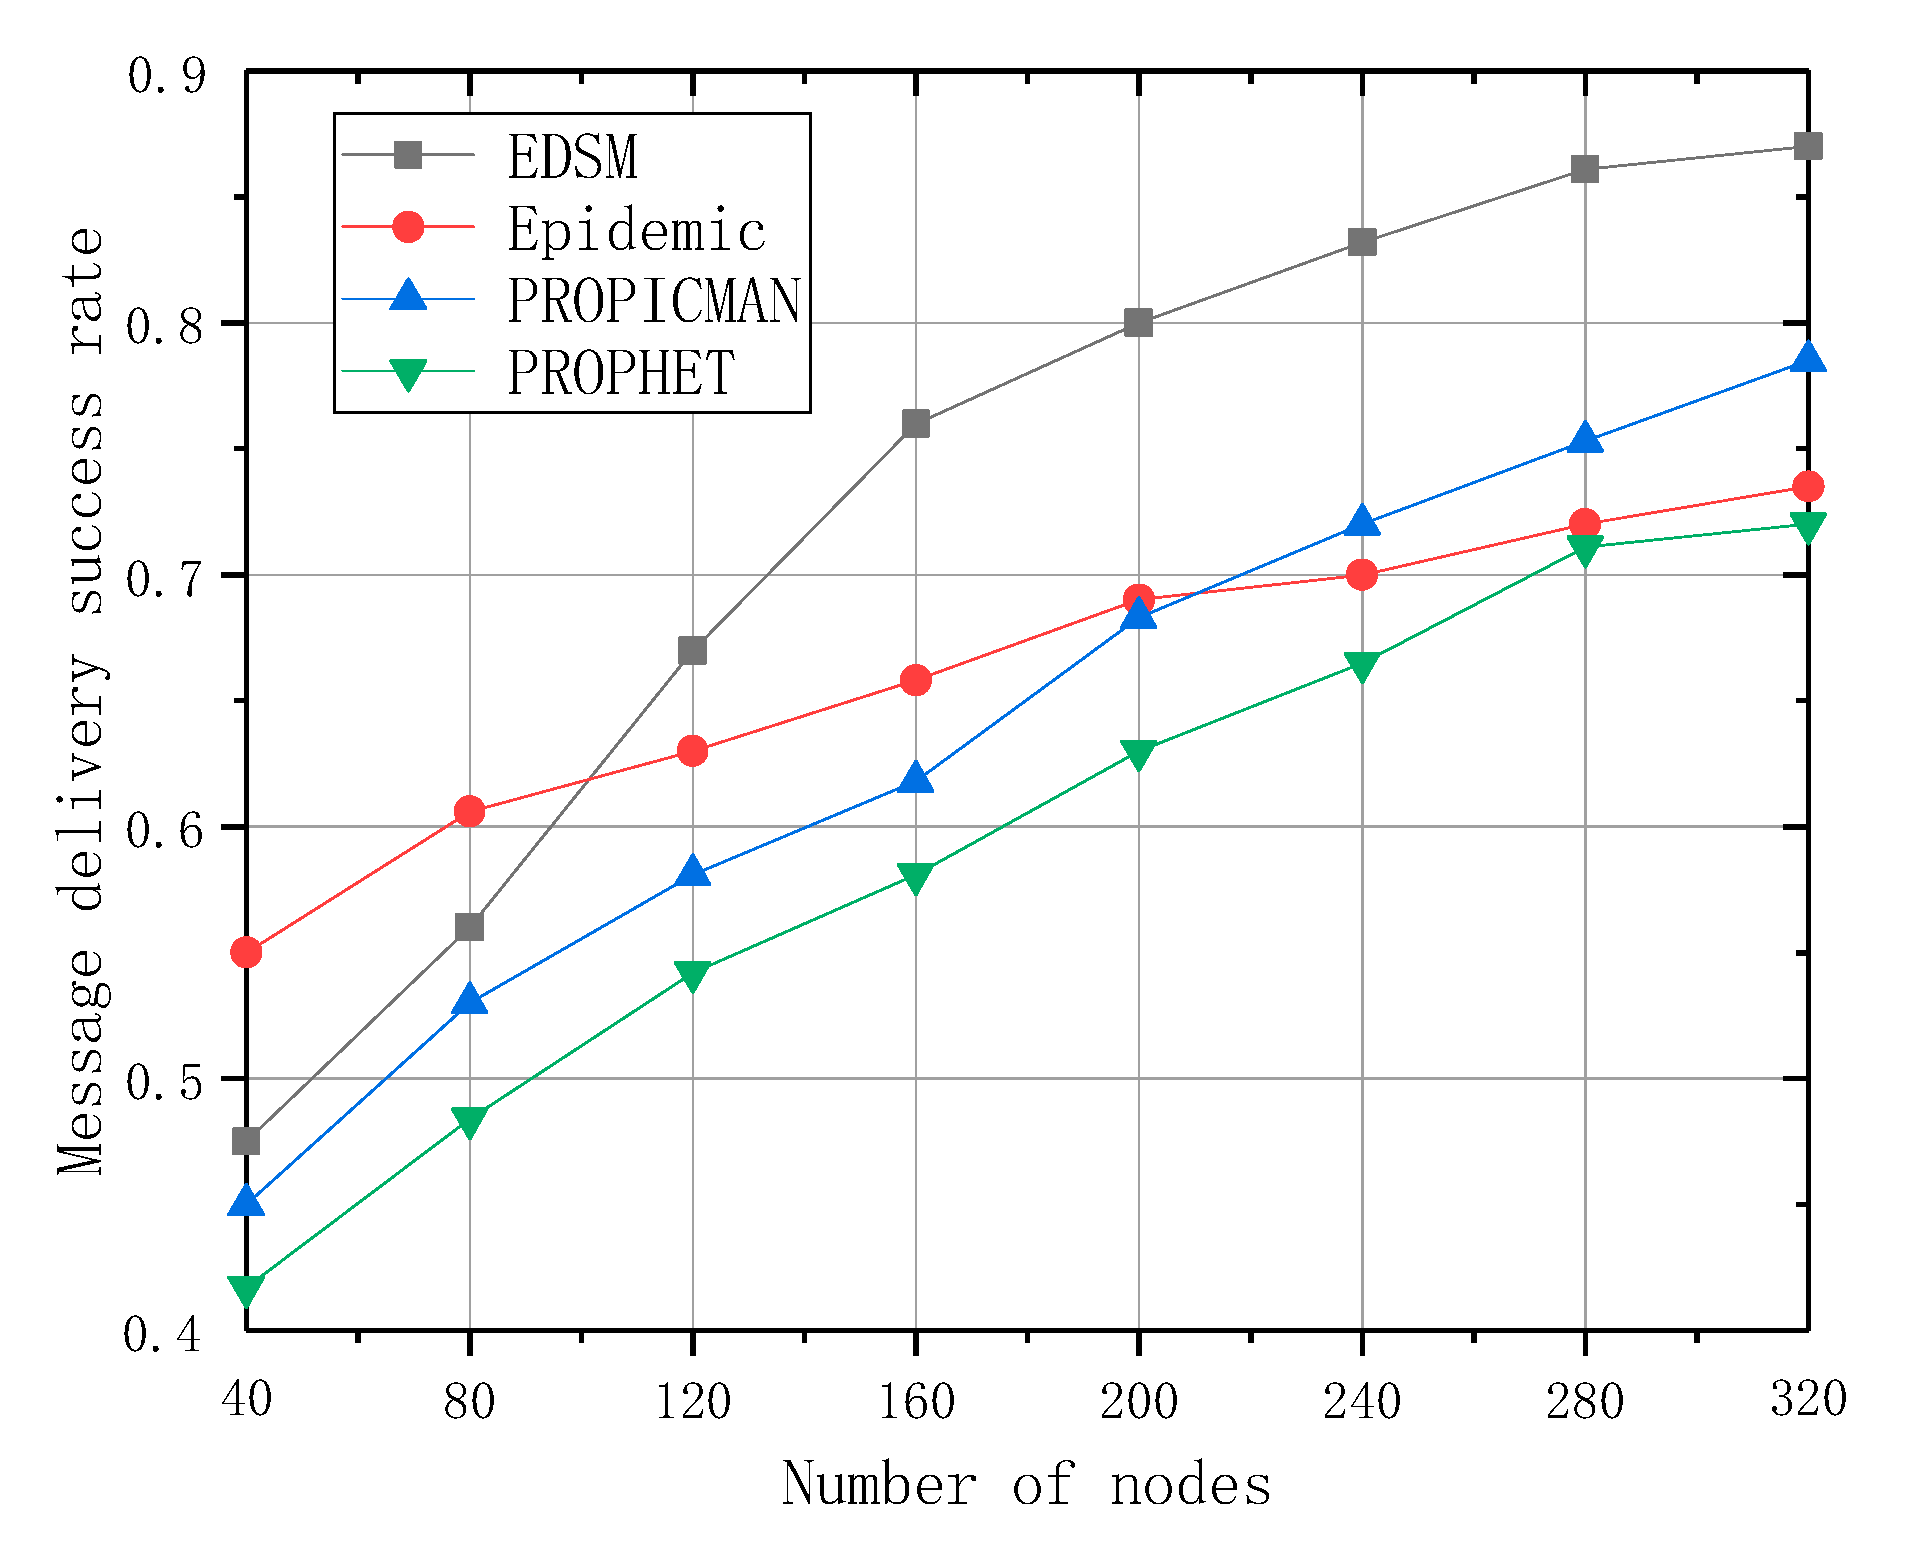
Figure 4 shows the success rate of message delivery for different numbers of nodes. It can be seen from the figure that EDSM has the highest message delivery success rate to a certain extent, while Epidemic is the highest at the beginning, but the growth is not obvious after the number of nodes reaches a certain level. This is because epidemics have the largest number of message copies and can achieve the best success rate when the number of nodes is small. When the number of nodes and copies in the network is too large, it will lead to cache space and excessive energy consumption, especially in the case of insufficient energy of some nodes. This will result in a reduction in the number of surviving nodes. When more nodes die in the network, the transmission success rate will be greatly reduced. This is determined by the characteristics of Epidemic. EDSM ‘s message delivery success rate increased by 13%, 18% and 12%, respectively, over PROPICMAN, PROPHET and Epidemic.
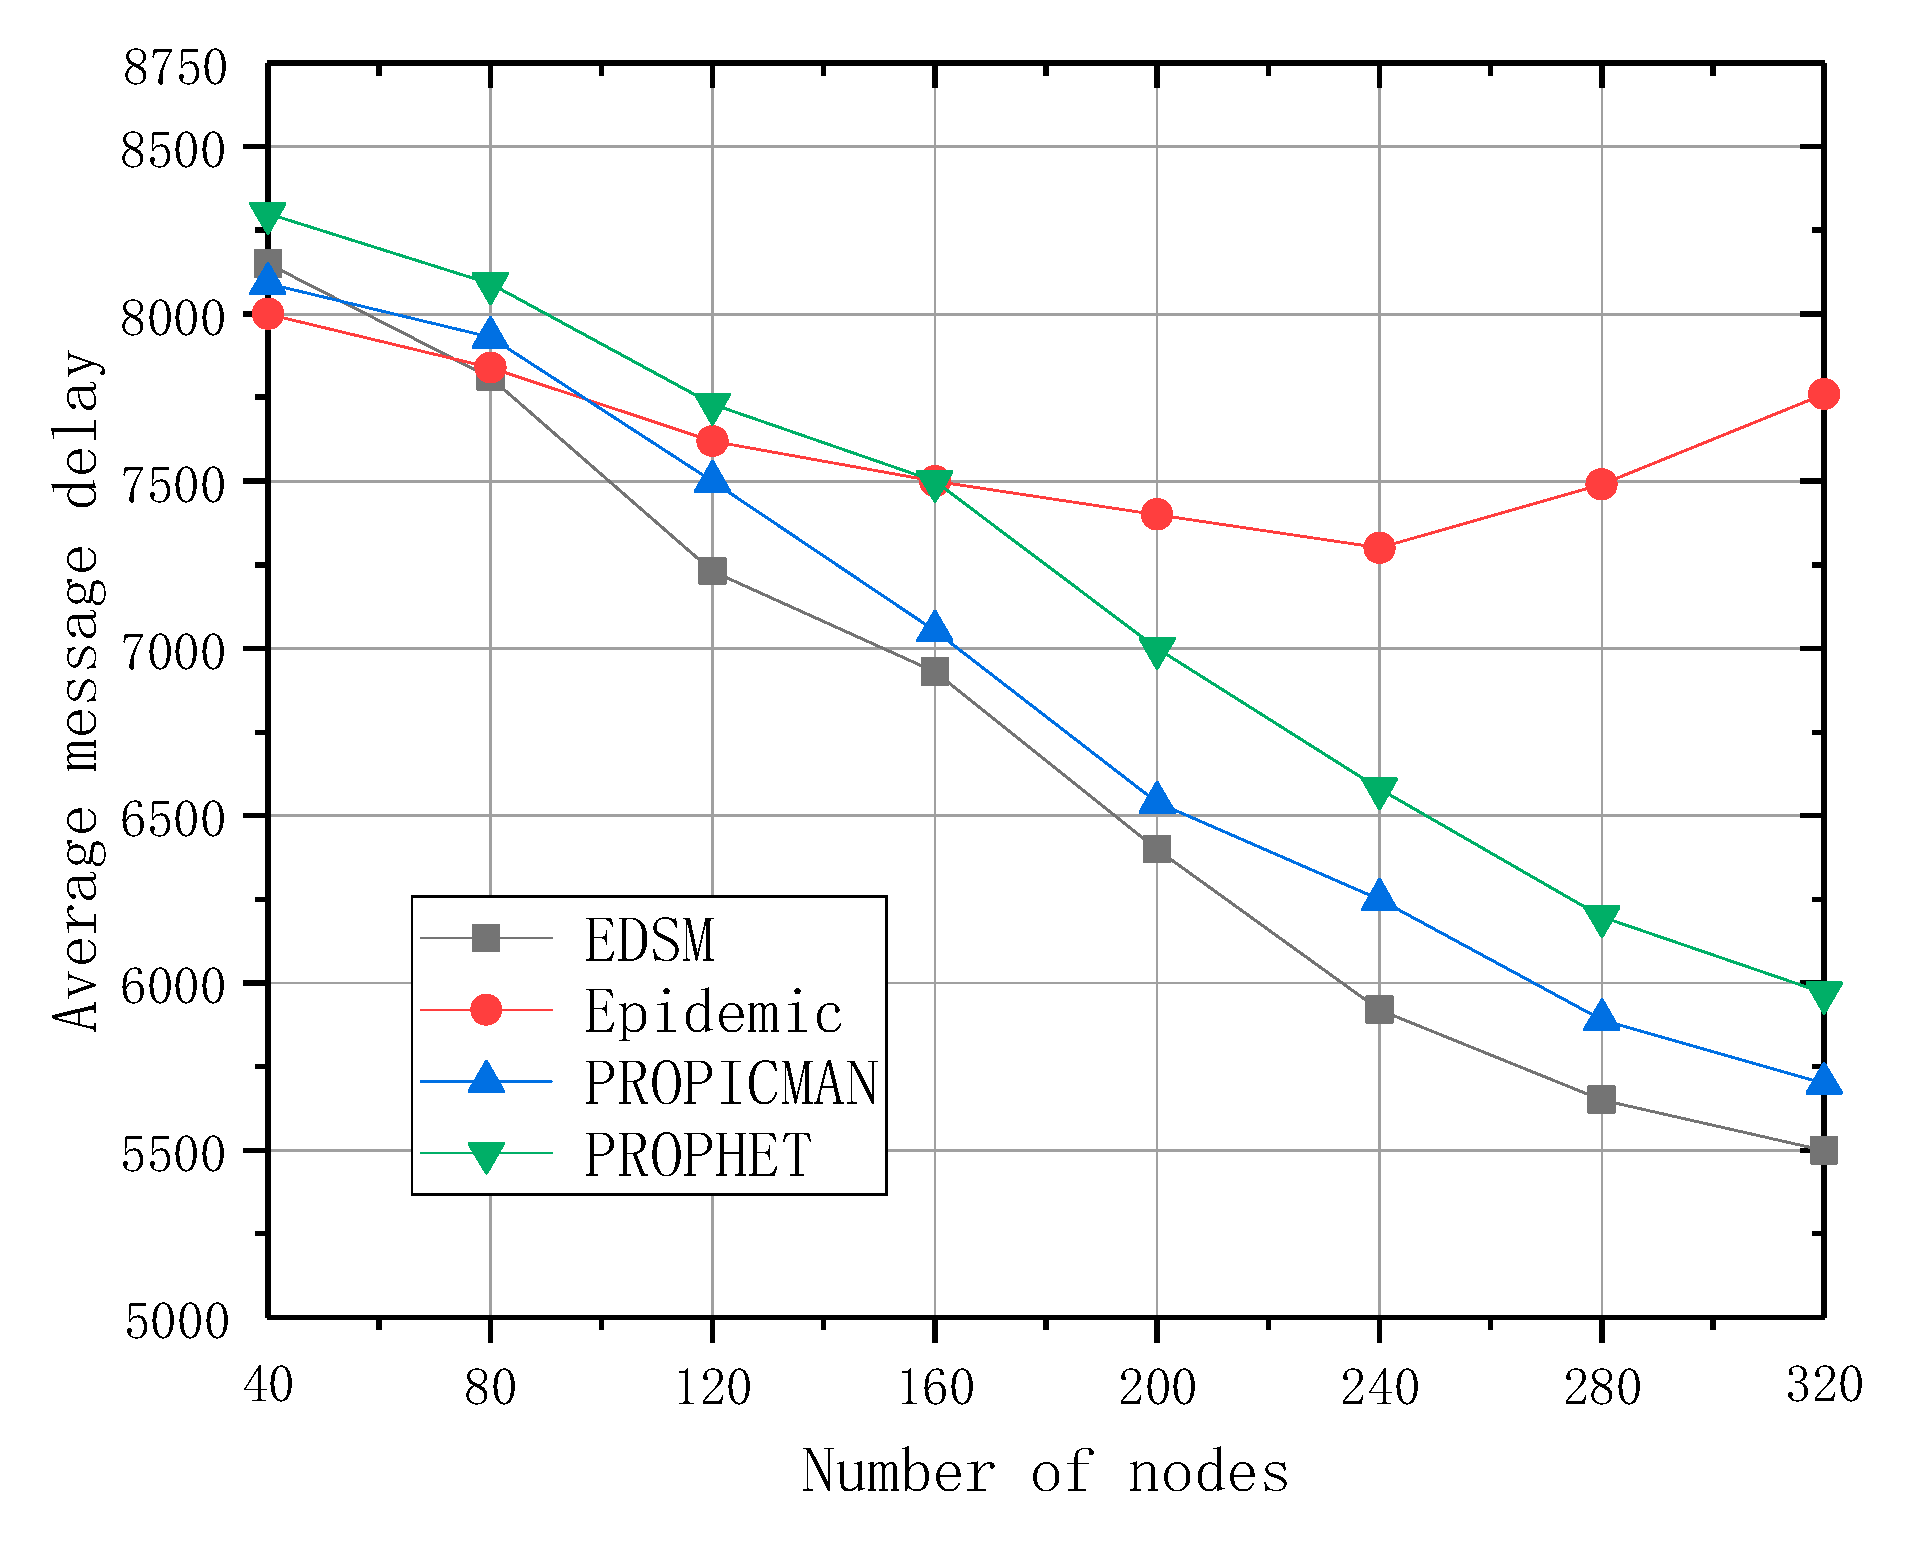
Figure 5 shows the average message delay for different number of nodes. As can be seen from the graph, the average message latency of EDSM, PROPICMAN and PROPHET decreases rapidly with the increase in the number of nodes. Epidemic has the highest average message latency, which decreases first and then increases. This is because with the increase in the number of nodes, there are a large number of replica messages in the network, which affects the receiving and forwarding of messages. According to the state information and cache replacement strategy of the node, EDSM has the lowest average message latency and is close to PROPICMAN. The average message latency of EDSM is 2%, 5% and 14% lower than that of PROPICMAN, PROPHET and Epidemic, respectively.
Figure 6 shows the network overhead ratio for different number of nodes. As can be seen from the graph, the network overhead ratio increases with the number of nodes. Epidemic has the high network overhead ratio and the most obvious upward trend. This is because Epidemic does not control the number of replicas of messages, which leads to high overhead. EDSM and PROPICMAN have little difference in network overhead ratio and both are relatively low. This is because these two algorithms effectively control the network overhead. EDSM’s network overhead ratio is 63% and 37% lower than that of Epidemic and PROPHET, respectively.
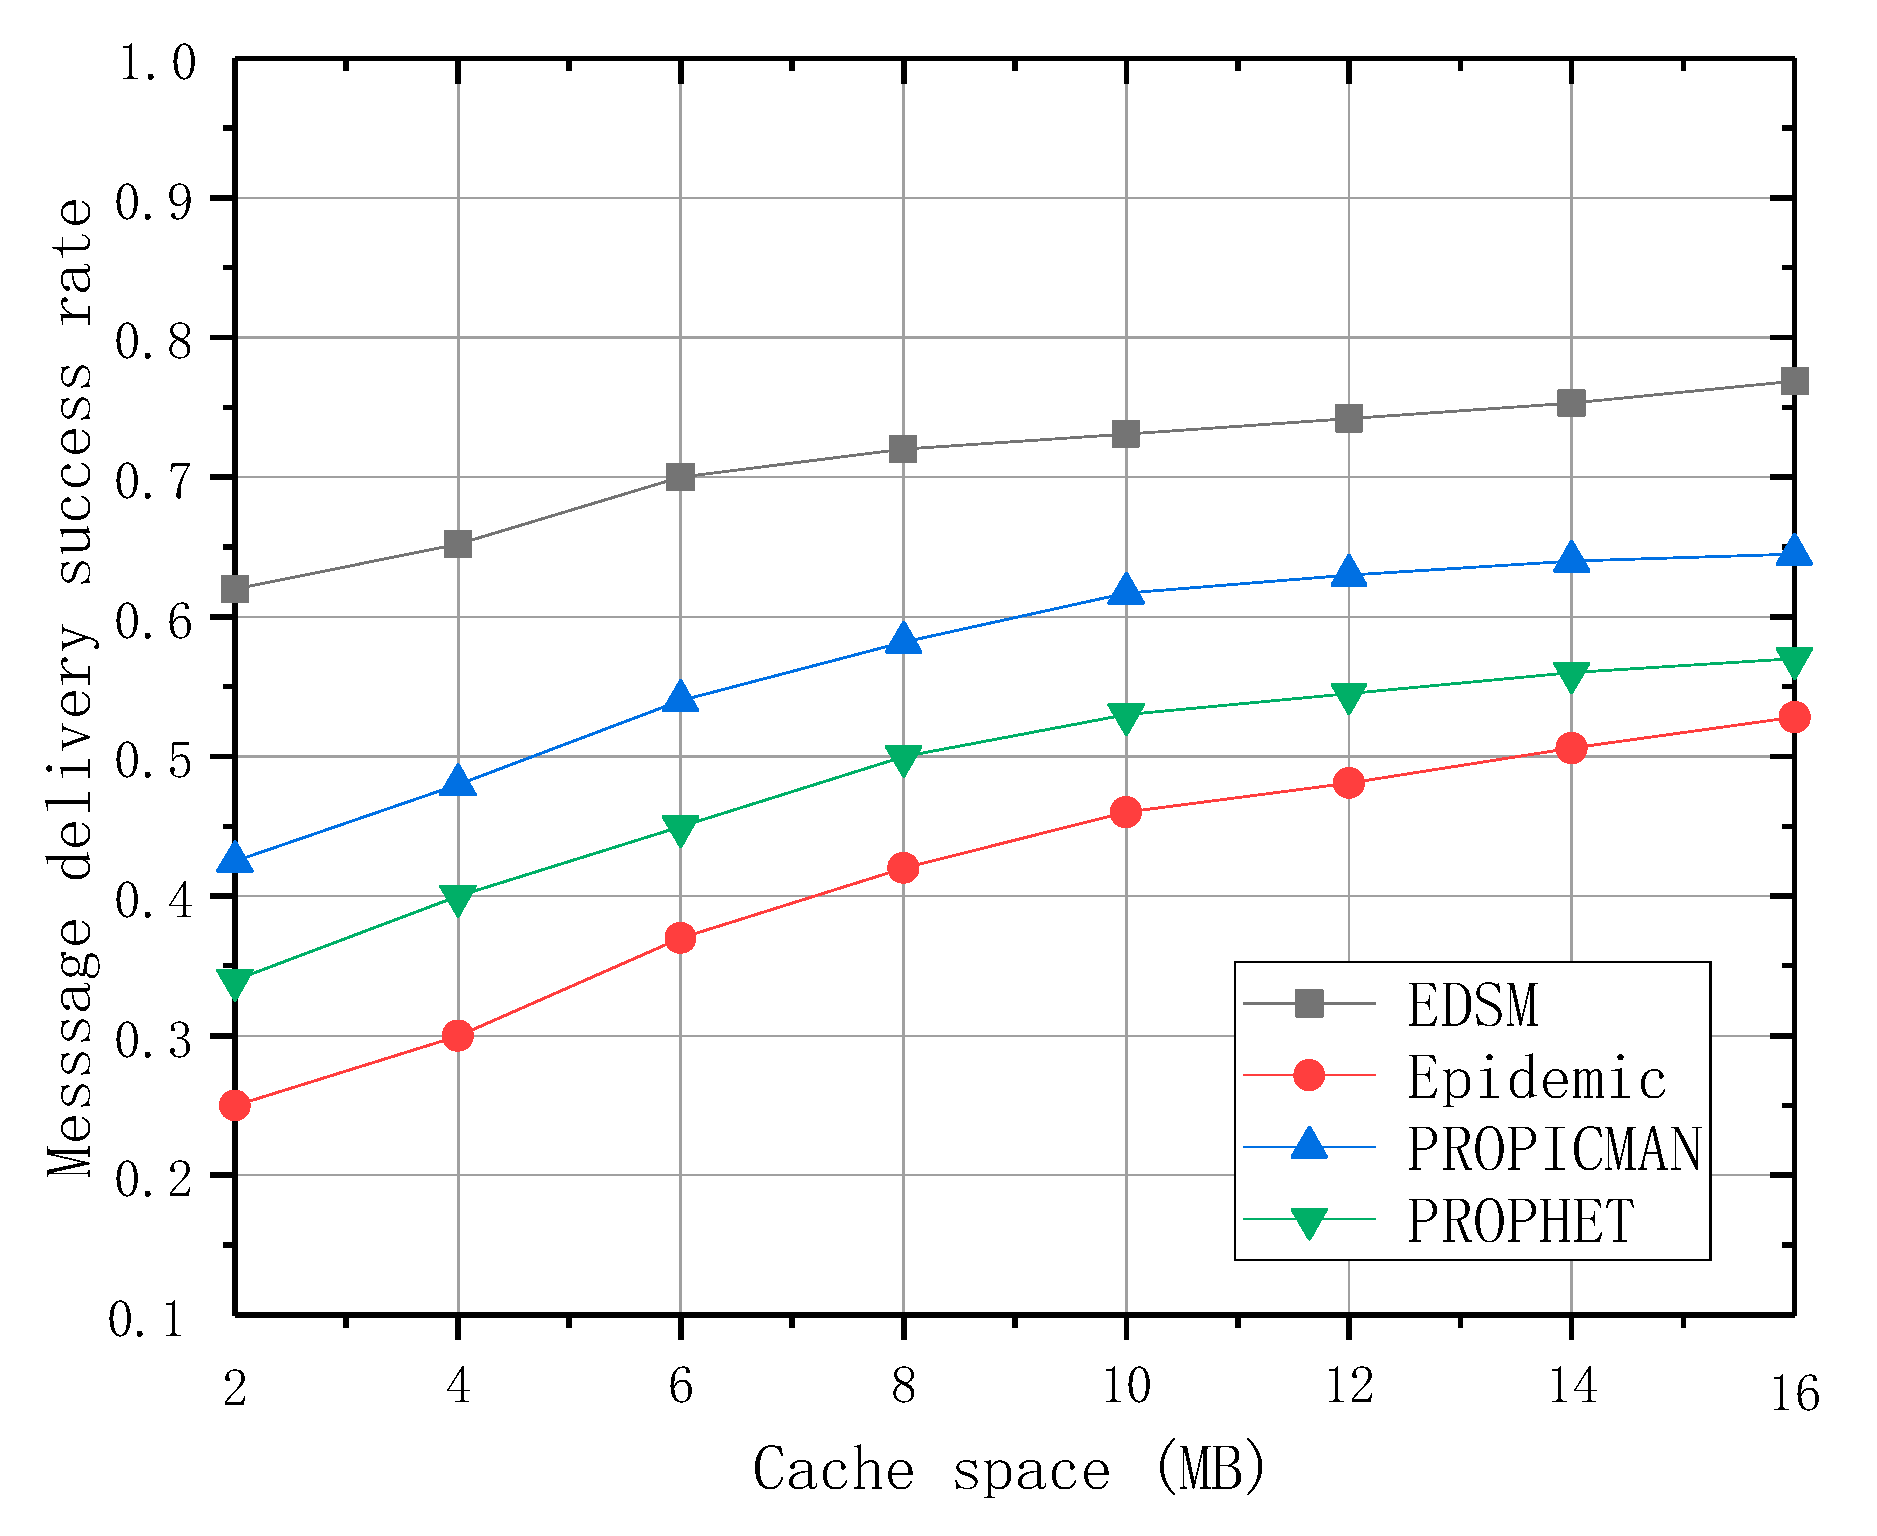
Figure 7 depicts the success rate of message delivery in different cache spaces. From the graph, we can see that the success rate of the message delivery of the four algorithms increases with the increase in buffer space, and the growth rate gets lower and lower. EDSM has the highest message delivery success rate.
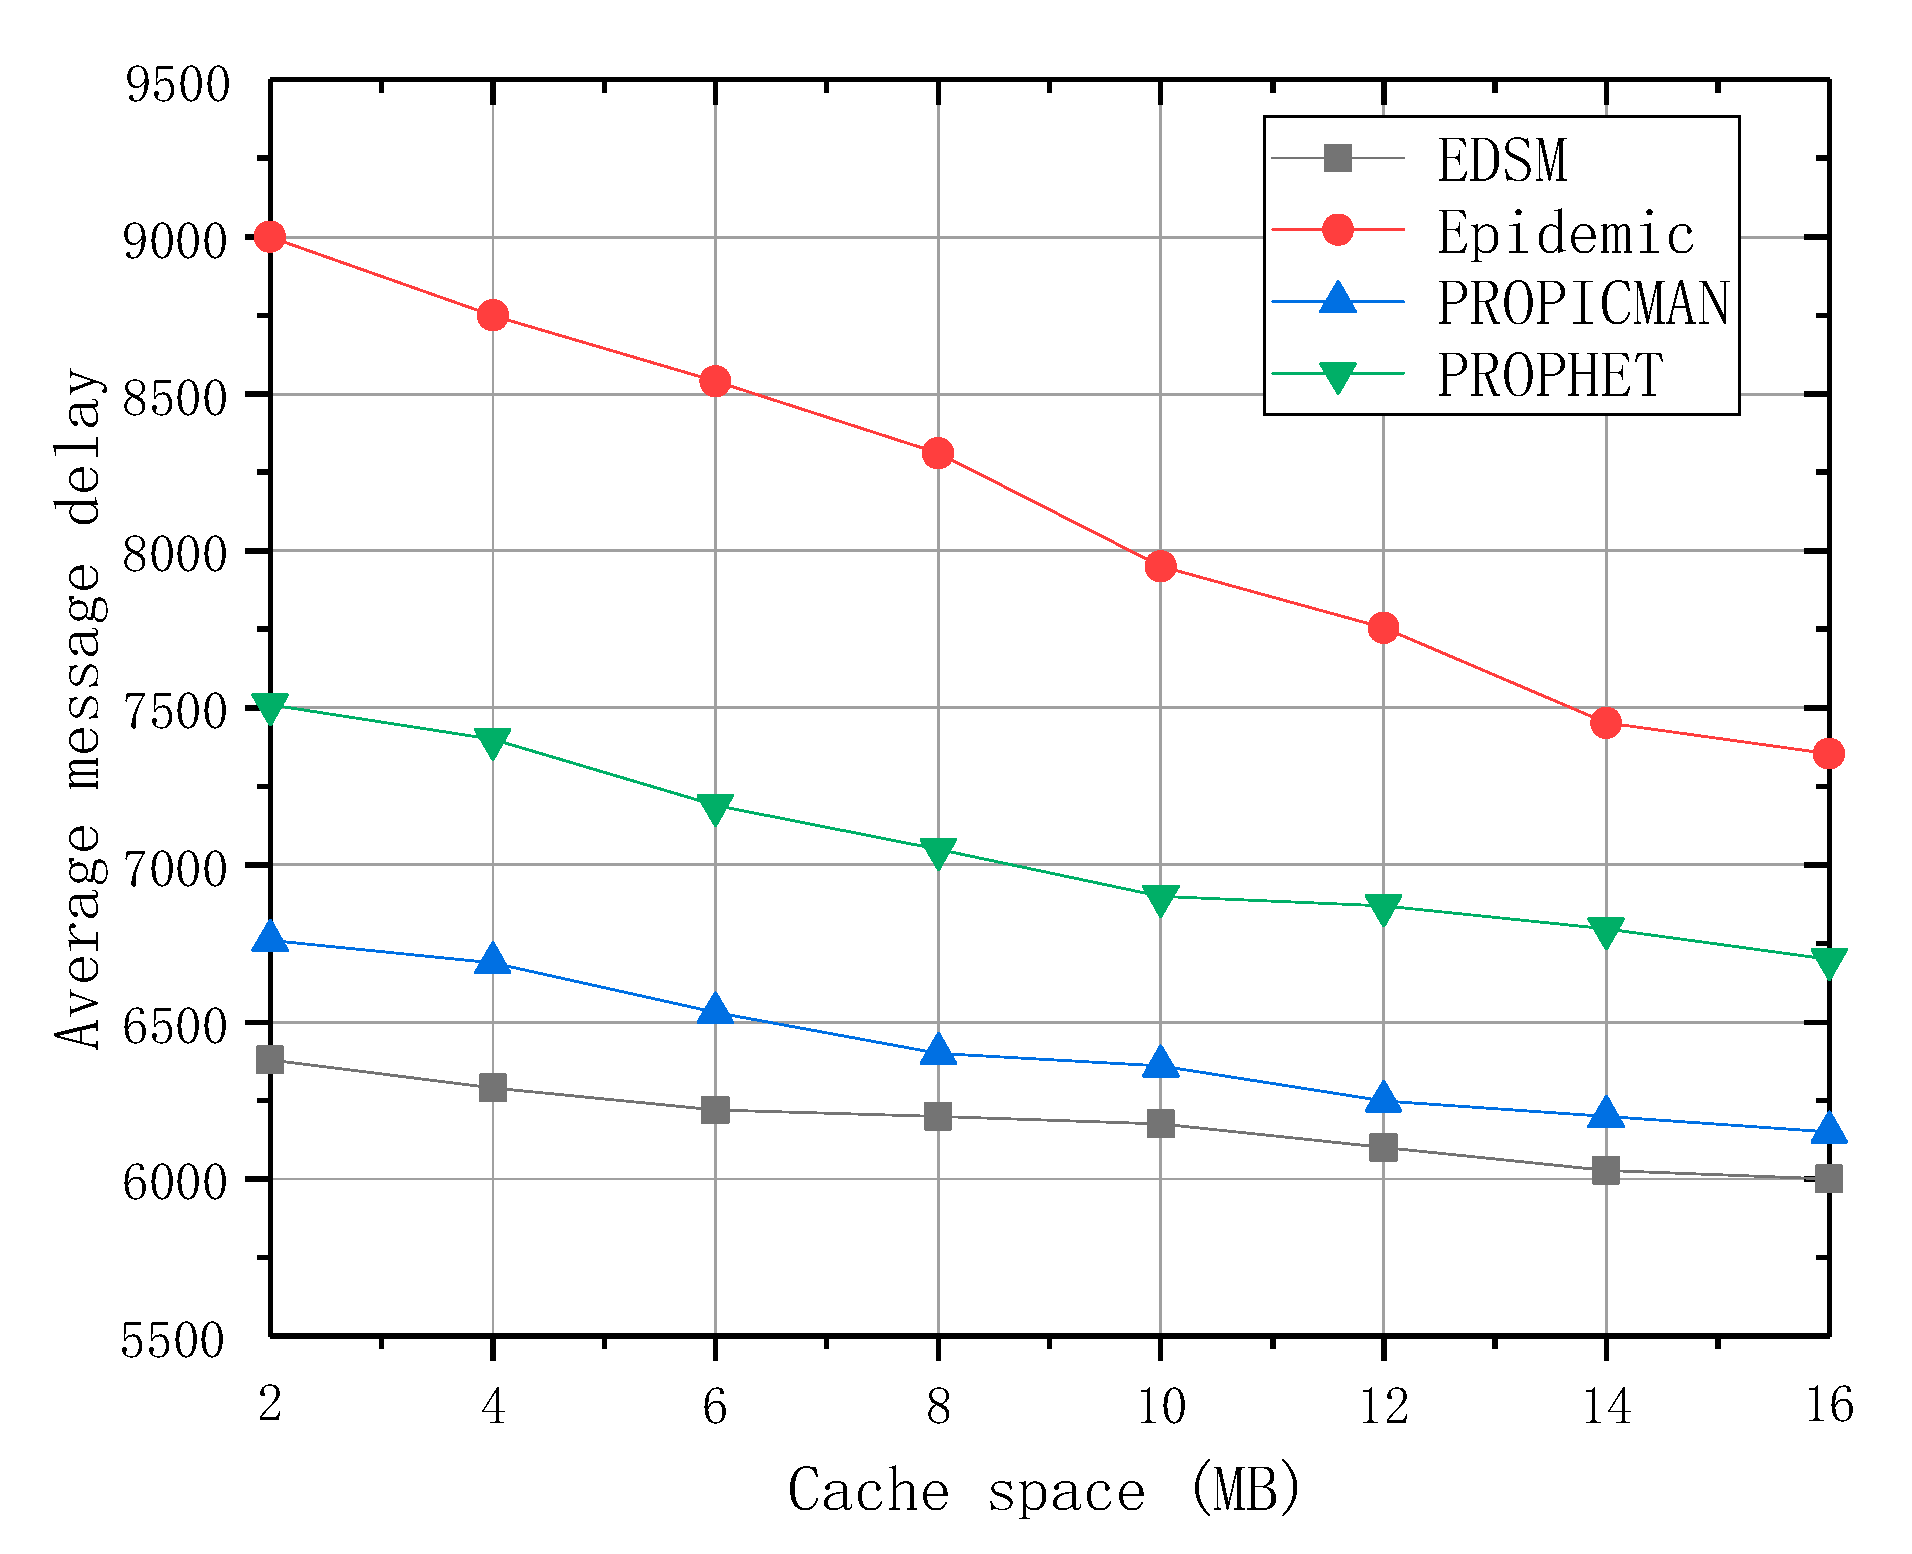
Figure 8 depicts the average message delay of different algorithms in different cache spaces. As can be seen from the graph, the average message delay decreases with the increase in buffer space. The Epidemic has the high average message delay, and the downward trend is most obvious. EDSM and PROPICMAN has the lowest average message delay and the change is gentle.
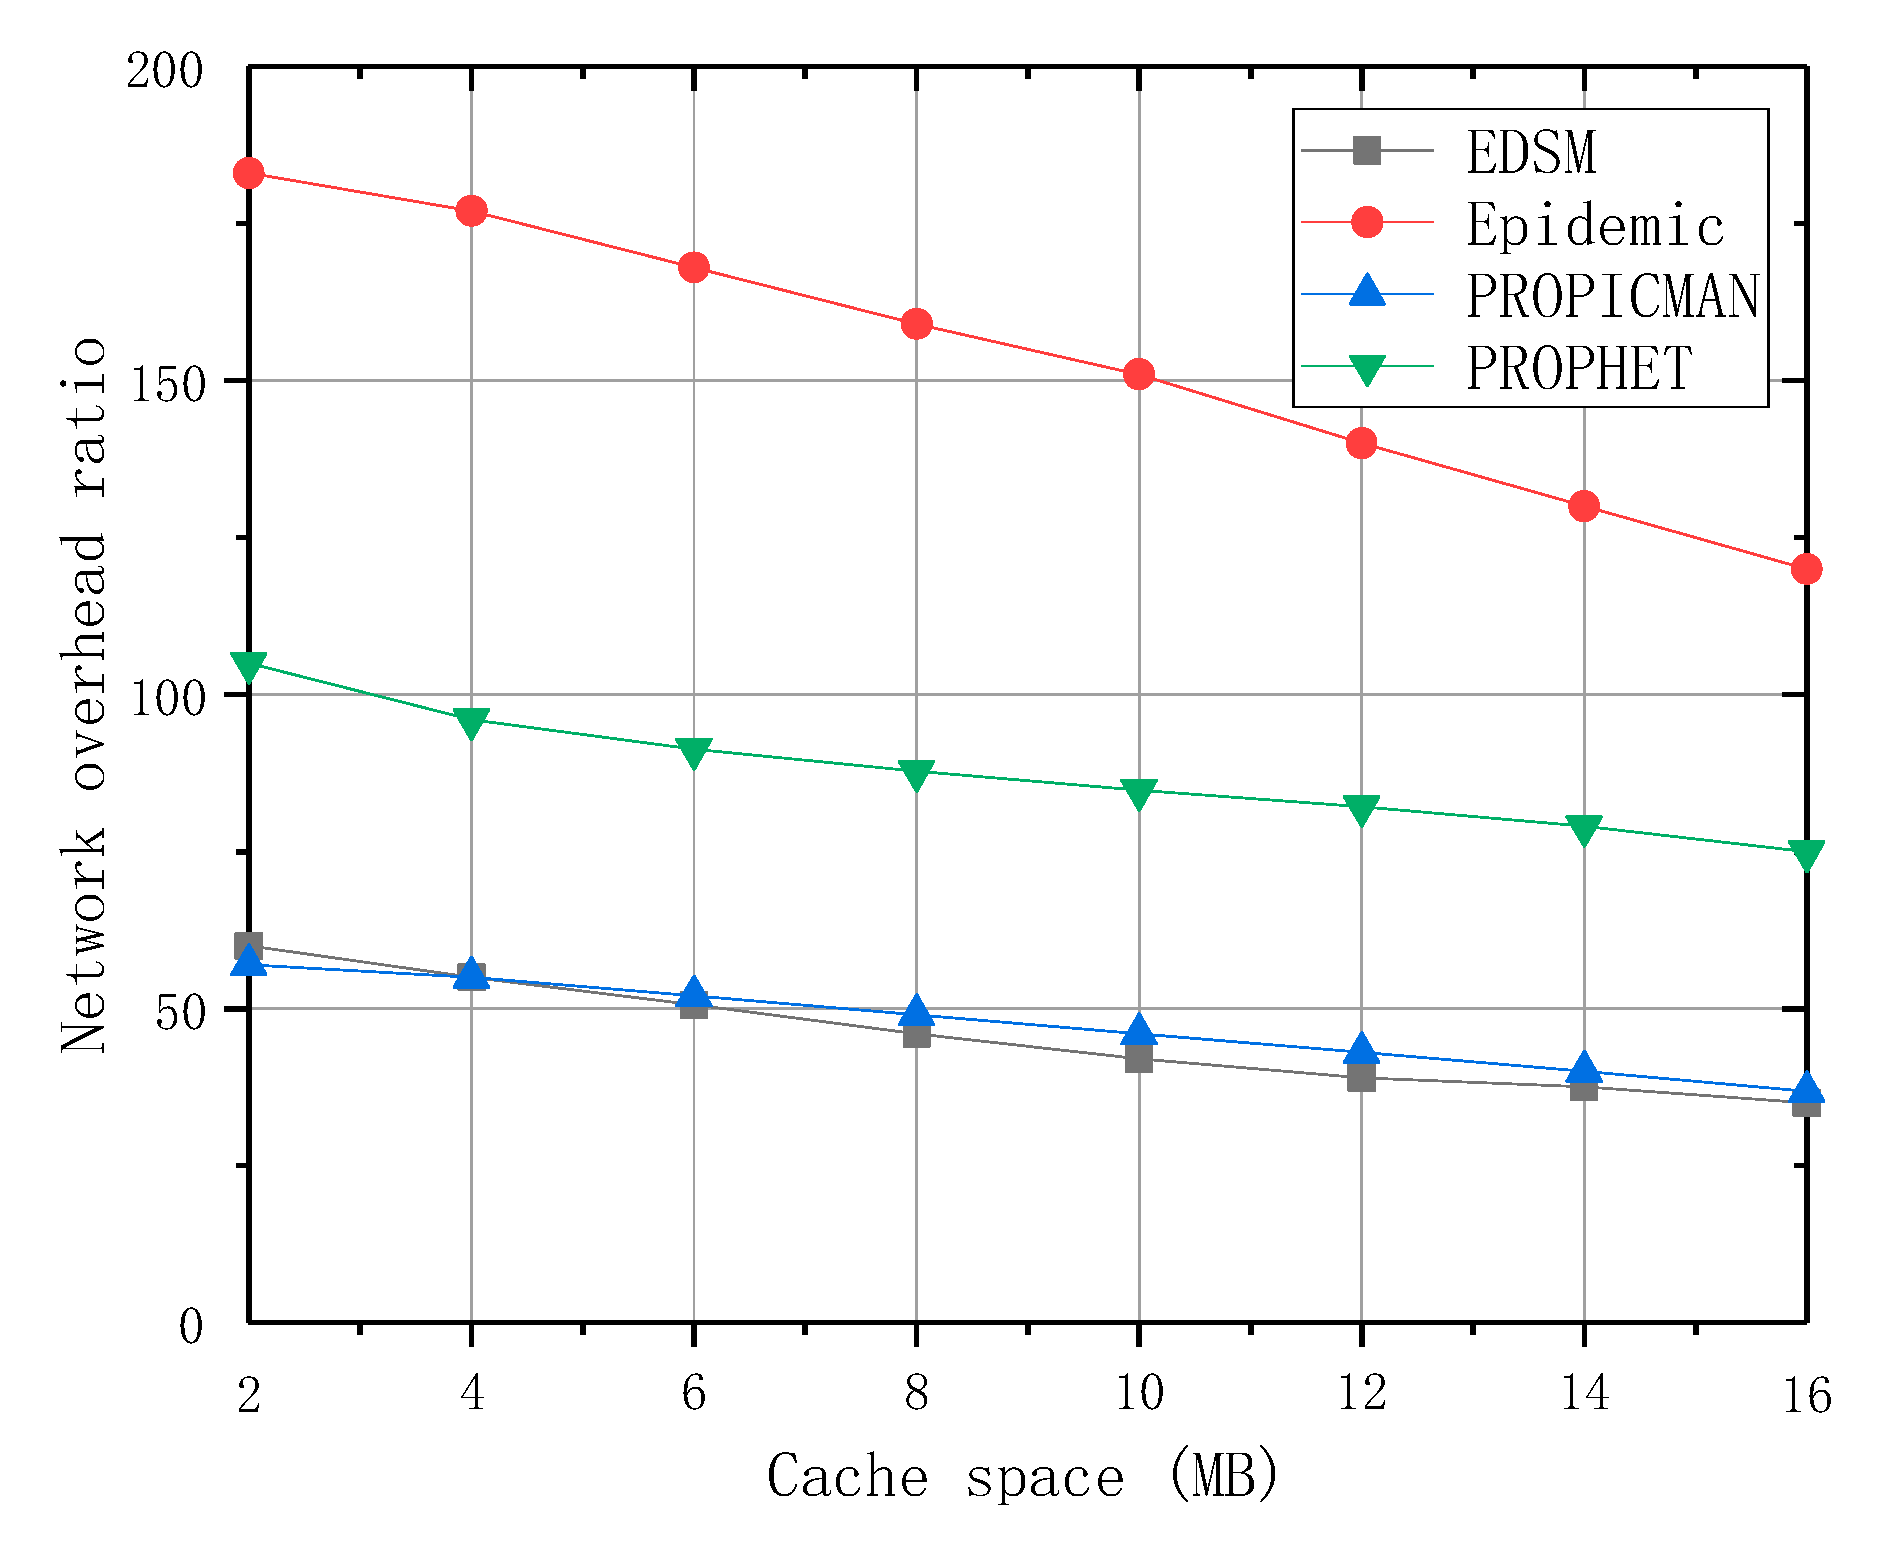
Figure 9 depicts the network overhead ratio in different cache spaces. With the increase in cache space, the network overhead ratio of the four algorithms decreases. Epidemic’s network overhead ratio has the most obvious downward trend. The network overhead ratio of EDSM and PROPICMAN is basically the same, and the downward trend is relatively stable.
It can be seen from the above results that the node cache size affects the performance of the algorithm. In the opportunistic social networks, the larger the buffer space, the more messages the node can carry. When they encounter other nodes, they forward more messages. Therefore, the higher the success rate of message delivery, the lower the average message delay. In the process of data forwarding, PROPICMAN, PROPHET and Epidemic use the first-in first-out cache strategy. Therefore, the performance of Epidemic algorithms will be affected by cache space factors. The performance of EDSM, PROPHET and PROPICMAN algorithms is not greatly affected by the cache space factor. When EDSM replaces the cache, different node states are considered. Therefore, the impact of cache space on EDSM is limited.
5. Conclusions
This paper mainly provides a new research idea and method for the study of information in an opportunistic social network, and proposes that there is a competitive relationship between messages in the network. Nodes interact with each other and attract changes in the direction of their own state. The network node state is proved to be Markov, and the state transition of nodes is deduced. According to the importance of the message and the status of the node to determine the message forwarding sequence, when the cache space is insufficient, the message with the lowest cache value will be deleted to increase the cache capacity of the node space. The experimental results show that this reduces the transmission delay of messages, improves the success rate of message delivery, and ensures a small network overhead.
In future work, we may focus on forming a resource schedule and cache optimization methods where the node can select the next transmit neighbors to keep and deliver messages.
Author Contributions
All authors designed the project and drafted the manuscript, collected the data, wrote the code and performed the analysis. All participated in finalizing and approved the manuscript. All authors have read and agreed to the published version of the manuscript.
Funding
This work was supported in The National Natural Science Foundation of China (61672540); Hunan Provincial Natural Science Foundation of China (2018JJ3299, 2018JJ3682).
Conflicts of Interest
The authors declare no conflict of interest.
References
- Wu, Z.; Wu, B.; Su, Z.; Zhang, X. Development challenges for 5G base station antennas. In Proceedings of the 2018 International Workshop on Antenna Technology (iWAT), Nanjing, China, 5–7 March 2018; pp. 1–3. [Google Scholar] [CrossRef]
- Hernandez-Orallo, E.; Murillo-Arcila, M.; Cano, J.C.; Calafate, C.T.; Conejero, J.A.; Manzoni, P. An analytical model based on population processes to characterize data dissemination in 5g opportunistic networks. IEEE Access 2018, 6, 1603–1615. [Google Scholar] [CrossRef]
- Wang, S.; Wang, X.; Huang, J.; Bie, R.; Cheng, X. Analyzing the potential of mobile opportunistic networks for big data applications. Netw. IEEE 2015, 29, 57–63. [Google Scholar] [CrossRef]
- Wu, J.; Chen, Z.; Zhao, M. An efficient data packet iteration and transmission algorithm in opportunistic social networks. J. Ambient Intell. Humaniz. Comput. 2020, 11, 3141–3153. [Google Scholar] [CrossRef]
- Wu, J.; Chen, Z.; Zhao, M. Information cache management and data transmission algorithm in opportunistic social networks. Wirel. Netw. 2019, 25, 2977–2988. [Google Scholar] [CrossRef]
- Haoran, S.; Muqing, W.; Yanan, C. A Community-Based Opportunistic Routing Protocol in Delay Tolerant Networks. In Proceedings of the 2018 IEEE 4th International Conference on Computer and Communications (ICCC), Chengdu, China, 7–10 December 2018; pp. 296–300. [Google Scholar] [CrossRef]
- Guan, P.; Wu, J. Effective data communication based on social community in social opportunistic networks. IEEE Access 2019, 7, 12405–12414. [Google Scholar] [CrossRef]
- Wu, J.; Tian, X.; Tan, Y. Hospital evaluation mechanism based on mobile health for IoT system in social networks. Comput. Biol. Med. 2019, 109, 138–147. [Google Scholar] [CrossRef] [PubMed]
- Wu, J.; Chen, Z.; Zhao, M. SECM: Status Estimation and Cache Management algorithm in opportunistic networks. J. Supercomput. 2019, 75, 2629–2647. [Google Scholar] [CrossRef]
- Wang, N.; Wu, J. Optimal data partitioning and forwarding in opportunistic mobile networks. In Proceedings of the 2018 IEEE Wireless Communications and Networking Conference (WCNC), Barcelona, Spain, 15–18 April 2018; pp. 1–6. [Google Scholar] [CrossRef]
- Zhong, K.; Zhang, S.; Zou, A.; Liu, L.; Tang, J. A Data Forwarding Algorithm Based on Nodal Activities in Opportunistic Networks. In Proceedings of the IEEE 18th International Conference on Communication Technology (ICCT), Chongqing, China, 8–11 October 2018; pp. 1346–1350. [Google Scholar] [CrossRef]
- Kim, S.K.; Kim, J.U. Measure for centrality based forwarding schemes in opportunistic networks. In Proceedings of the 2016 6th International Conference on Information Communication and Management (ICICM), Hatfield, UK, 29–31 October 2016; pp. 105–108. [Google Scholar] [CrossRef]
- Wu, J.; Chen, Z.; Zhao, M. Community recombination and duplication node traverse algorithm in opportunistic social networks. Peer Peer Netw. Appl. 2020, 13, 940–947. [Google Scholar] [CrossRef]
- Wang, Y.; Wu, J. Social-tie-based information dissemination in mobile opportunistic social networks. In Proceedings of the IEEE 14th International Symposium on “A World of Wireless, Mobile and Multimedia Networks” (WoWMoM), Madrid, Spain, 4–7 June 2013; pp. 1–6. [Google Scholar] [CrossRef]
- Dong, Y.; Yang, W.; Znati, T. Carriers Selection for Content Dissemination in Social Opportunistic Networks. In Proceedings of the 2015 IEEE Conference on Collaboration and Internet Computing (CIC), Hangzhou, China, 27–30 October 2015; pp. 235–243. [Google Scholar] [CrossRef]
- Wu, J.; Chen, Z.; Zhao, M. Weight distribution and community reconstitution based on communities communications in social opportunistic networks. Peer Peer Netw. Appl. 2019, 12, 158–166. [Google Scholar] [CrossRef]
- Luo, J.; Wu, J.; Wu, Y. Advanced Data Delivery Strategy Base on Multi-Perceived Community with IoT in Social Complex Networks. Complexity 2020, 2020, 3576542. [Google Scholar] [CrossRef]
- Soelistijanto, B.; Howarth, M.P. Transfer reliability and congestion control strategies in opportunistic networks: A survey. IEEE Commun. Surv. Tutor. 2013, 16, 538–555. [Google Scholar] [CrossRef] [Green Version]
- Ko, H.; Lee, J.; Pack, S. An Opportunistic Push Scheme for Online Social Networking Services in Heterogeneous Wireless Networks. IEEE Trans. Netw. Serv. Manag. 2017, 14, 416–428. [Google Scholar] [CrossRef]
- Zhang, X.; Su, Y.; Qu, S.; Xie, S.; Fang, B.; Philip, S.Y. IAD: Interaction-Aware Diffusion Framework in Social Networks. IEEE Trans. Knowl. Data Eng. 2018, 31, 1341–1354. [Google Scholar] [CrossRef] [Green Version]
- Socievole, A.; De Rango, F. Energy-aware centrality for information forwarding in mobile social opportunistic networks. In Proceedings of the 2015 International Wireless Communications and Mobile Computing Conference (IWCMC), Dubrovnik, Croatia, 24–28 August 2015; pp. 622–627. [Google Scholar]
- Prodhan, A.T.; Das, R.; Kabir, H.; Shoja, G.C. TTL based routing in opportunistic networks. J. Netw. Comput. Appl. 2011, 34, 1660–1670. [Google Scholar] [CrossRef]
- Batabyal, S.; Bhaumik, P. Delay-overhead trade-offs in mobile opportunistic network using TTL based restricted flooding. In Proceedings of the 2014 Applications and Innovations in Mobile Computing (AIMoC), Kolkata, India, 27 February–1 March 2014; pp. 9–14. [Google Scholar] [CrossRef]
- Huang, Y.; Dong, Y.; Zhang, S.; Wu, G. TTL sensitive social-aware routing in mobile opportunistic networks. In Proceedings of the Consumer Communications and Networking Conference, Las Vegas, NV, USA, 10–13 January 2014; pp. 810–814. [Google Scholar] [CrossRef]
- Ciobanu, R.I.; Marin, R.C.; Dobre, C.; Cristea, V. Interest-awareness in data dissemination for opportunistic networks. Ad Hoc Netw. 2015, 25, 330–345. [Google Scholar] [CrossRef]
- Hui, P.; Crowcroft, J.; Yoneki, E. Bubble Rap: Social-based forwarding in delay tolerant networks. IEEE Trans. Mob. Comput. 2011, 10, 1576–1589. [Google Scholar] [CrossRef] [Green Version]
- Ying, B.; Xu, K.; Nayak, A. Fair and Social-Aware Message Forwarding Method in Opportunistic Social Networks. IEEE Commun. Lett. 2019, 23, 720–723. [Google Scholar] [CrossRef]
- Socievole, A.; Yoneki, E.; De Rango, F.; Crowcroft, J. ML-SOR: Message routing using multi-layer social networks in opportunistic communications. Comput. Netw. 2015, 81, 201–219. [Google Scholar] [CrossRef]
- Socievole, A.; Yoneki, E.; De Rango, F.; Crowcroft, J. Opportunistic message routing using multi-layer social networks. In Proceedings of the 2nd ACM Workshop on High Performance Mobile Opportunistic Systems, Barcelona, Spain, 3–8 November 2013; pp. 39–46. [Google Scholar] [CrossRef] [Green Version]
- Socievole, A.; De Rango, F.; Caputo, A. Wireless contacts, Facebook friendships and interests: Analysis of a multi-layer social network in an academic environment. In Proceedings of the 2014 IFIP Wireless Days (WD), Rio de Janeiro, Brazil, 12–14 November 2014; pp. 1–7. [Google Scholar] [CrossRef]
- Ciobanu, R.I.; Marin, R.C.; Dobre, C.; Cristea, V.; Mavromoustakis, C.X.; Mastorakis, G. Opportunistic dissemination using context-based data aggregation over interest spaces. In Proceedings of the 2015 IEEE International Conference on Communications (ICC), London, UK, 8–12 June 2015; pp. 1219–1225. [Google Scholar] [CrossRef]
- Ciobanu, R.I.; Dobre, C.; Cristea, V. SPRINT: Social prediction-based opportunistic routing. In Proceedings of the 2013 IEEE 14th International Symposium on “A World of Wireless, Mobile and Multimedia Networks” (WoWMoM), Madrid, Spain, 4–7 June 2013; pp. 1–7. [Google Scholar] [CrossRef]
- Sati, S.; Probst, C.; Graffi, K. Analysis of buffer management policies for opportunistic networks. In Proceedings of the 2016 25th International Conference on Computer Communication and Networks (ICCCN), Waikoloa, HI, USA, 1–4 August 2016; pp. 1–8. [Google Scholar] [CrossRef]
- Pandey, O.J.; Hegde, R.M. Low-latency and energy-balanced data transmission over cognitive small world WSN. IEEE Trans. Veh. Technol. 2018, 67, 7719–7733. [Google Scholar] [CrossRef]
- Arnesen, P.; Tjelmeland, H. Prior specification of neighbourhood and interaction structure in binary Markov random fields. Stat. Comput. 2017, 27, 737–756. [Google Scholar] [CrossRef] [Green Version]
- Beutel, A.; Prakash, B.A.; Rosenfeld, R.; Faloutsos, C. Interacting viruses in networks: Can both survive. In Proceedings of the International Conference on Knowledge Discovery & Data Mining, Kuala Lumpur, Malaysia, 29 May–1 June 2012; Volume 12, pp. 426–434. [Google Scholar]
Figure 1.
The state transition diagram.

Figure 2.
Standard deviation of node residual energy under different network running time.

Figure 3.
Average Message Delay in Different θ Intervals.

Figure 4.
Message delivery rate under different number of nodes.

Figure 5.
Average message delay under a different number of nodes.

Figure 6.
Network overhead ratio under different number of nodes.

Figure 7.
Message delivery success rate in different cache.

Figure 8.
Average message delay in different cache spaces.

Figure 9.
Network overhead ratio in different cache spaces.


Table 1.
The Routh array table at point .
| Order | First Column Coefficient | Second Column Coefficient |
|---|---|---|
| r3 | 1 | |
| r2 | 0 | |
| r1 | 0 | |
| r0 | 0 |
Table 2.
simulation parameters’ setting.
| Parameter | Value |
|---|---|
| Simulation time | 24 h |
| Simulation area | 4500 × 3400 m2 |
| Message size | 50~200 KB |
| TTL | 5 h |
| Message transmission rate | 250 KBps |
| Interval time between message generation | 30 s |
| Maximum transmission radius | 10 m |
| Bus speed | 20~40 km/h |
| Pedestrian speed | 3~5 km/h |
| Node initial energy | 500 J |
© 2020 by the authors. Licensee MDPI, Basel, Switzerland. This article is an open access article distributed under the terms and conditions of the Creative Commons Attribution (CC BY) license (http://creativecommons.org/licenses/by/4.0/).
Share and Cite
MDPI and ACS Style
Wu, J.; Yin, S.; Xiao, Y.; Yu, G. Effective Data Selection and Management Method Based on Dynamic Regulation in Opportunistic Social Networks. Electronics 2020, 9, 1271. https://doi.org/10.3390/electronics9081271
AMA Style
Wu J, Yin S, Xiao Y, Yu G. Effective Data Selection and Management Method Based on Dynamic Regulation in Opportunistic Social Networks. Electronics. 2020; 9(8):1271. https://doi.org/10.3390/electronics9081271
Chicago/Turabian StyleWu, Jia, Sheng Yin, Yutong Xiao, and Genghua Yu. 2020. "Effective Data Selection and Management Method Based on Dynamic Regulation in Opportunistic Social Networks" Electronics 9, no. 8: 1271. https://doi.org/10.3390/electronics9081271
Note that from the first issue of 2016, this journal uses article numbers instead of page numbers. See further details here.