
Assessment of Large Scale Photovoltaic Power Generation from Carport Canopies


1
Electrical Engineering Deparment, King Abdulaziz University, P.O. Box 80204, Jeddah 21589, Saudi Arabia
2
King Salman ben Abdulaziz Chair for Energy Research, King Abdulaziz University, P.O. Box 80204, Jeddah 21589, Saudi Arabia, [email protected]
3
Energy & Climate Change Divisions, Sustainable Energy Research Group, University of Southampton, Southampton SO17 1BJ, UK
*
Author to whom correspondence should be addressed.
Energies 2017, 10(5), 686; https://doi.org/10.3390/en10050686
Submission received: 15 March 2017
/
Revised: 4 May 2017
/
Accepted: 5 May 2017
/
Published: 13 May 2017
(This article belongs to the Section L: Energy Sources)
Abstract
:Reliance on fossil fuel-driven energy supply is a major contributor to global emissions. In order to stay within the Paris Agreement’s temperature rise limits, current and growing energy consumption will need to be significantly underpinned by deployment of low/non-carbon power generation. This work promotes power generation at the megawatt scale from solar photovoltaics (PV) systems deployed in untapped car parking areas, which are estimated to represent up to ~6.6% of the urban footprint within cities. The methodology developed is globally applicable to support PV development, including site selection and PV array configuration. It is underpinned by a case study in a university campus, which has a similar footprint as assigned in cities for vehicle parking. The methodology demonstrates that less than 1% of the available parking spaces are affected by shadows from surrounding buildings or vegetation. The work shows that by utilising such parking areas within the selected campus a PV installation with a capacity of ~36.4 MWp, which can generate ~66.2 GWh of electricity annually, would be feasible. Financial analysis based on multiple scenarios indicates that a 50% return on investment is achievable over 25 years at an export tariff of USD ¢4.5/kWh, which is commensurate with the latest granted bids for a similar export tariff.
1. Introduction
Population growth projections indicate that the pace of urban development will continue in the coming decades and by 2050 over 70% of the global population will live and work in cities [1]. In addition, cities account for around 70% of man-made CO2 emissions, hence representing a major contributor to climate change [2,3]. As a result, many cities around the world—including those in fast-growing developing countries where urban growth will be the largest—have in many cases set up urban plans to: (a) accommodate rapidly increasing population; (b) reduce energy consumption; and (c) develop policies to mitigate adverse impact of a changing climate [4,5,6]. Such countries include resource-rich Middle Eastern countries, the United States and China [7,8,9]. Most of these countries rely heavily on fossil fuels as a major source for power generation with some having ambitious targets to replace a proportion of this with renewable energy power generation. However, policies and large-scale deployment of renewable energy technologies will need to be expedited through strategies to exploit appropriate opportunities to make this happen quickly within urban environments [10]. Furthermore, most large-scale renewable power plants, especially those well publicised in terms of their competitive projects’ costs [11], were deployed in less populated rural areas rather than within cities’ footprint. This is because land prices in cities are at a premium and there is a perceived limitation of the availability of large areas within urban boundaries [12]. It is well understood that appropriate surfaces on buildings in cities could be utilised for renewables such as solar photovoltaic (PV) technologies [13]. However, buildings in a city often possess significant diversity in terms of density and geometry, making it challenging to deploy contiguous renewables at scale in the urban areas. Many studies agree that for cities to meet their energy demand, they must be designed and configured with the ability of generating some of their electrical power needs from within their boundaries [14,15].
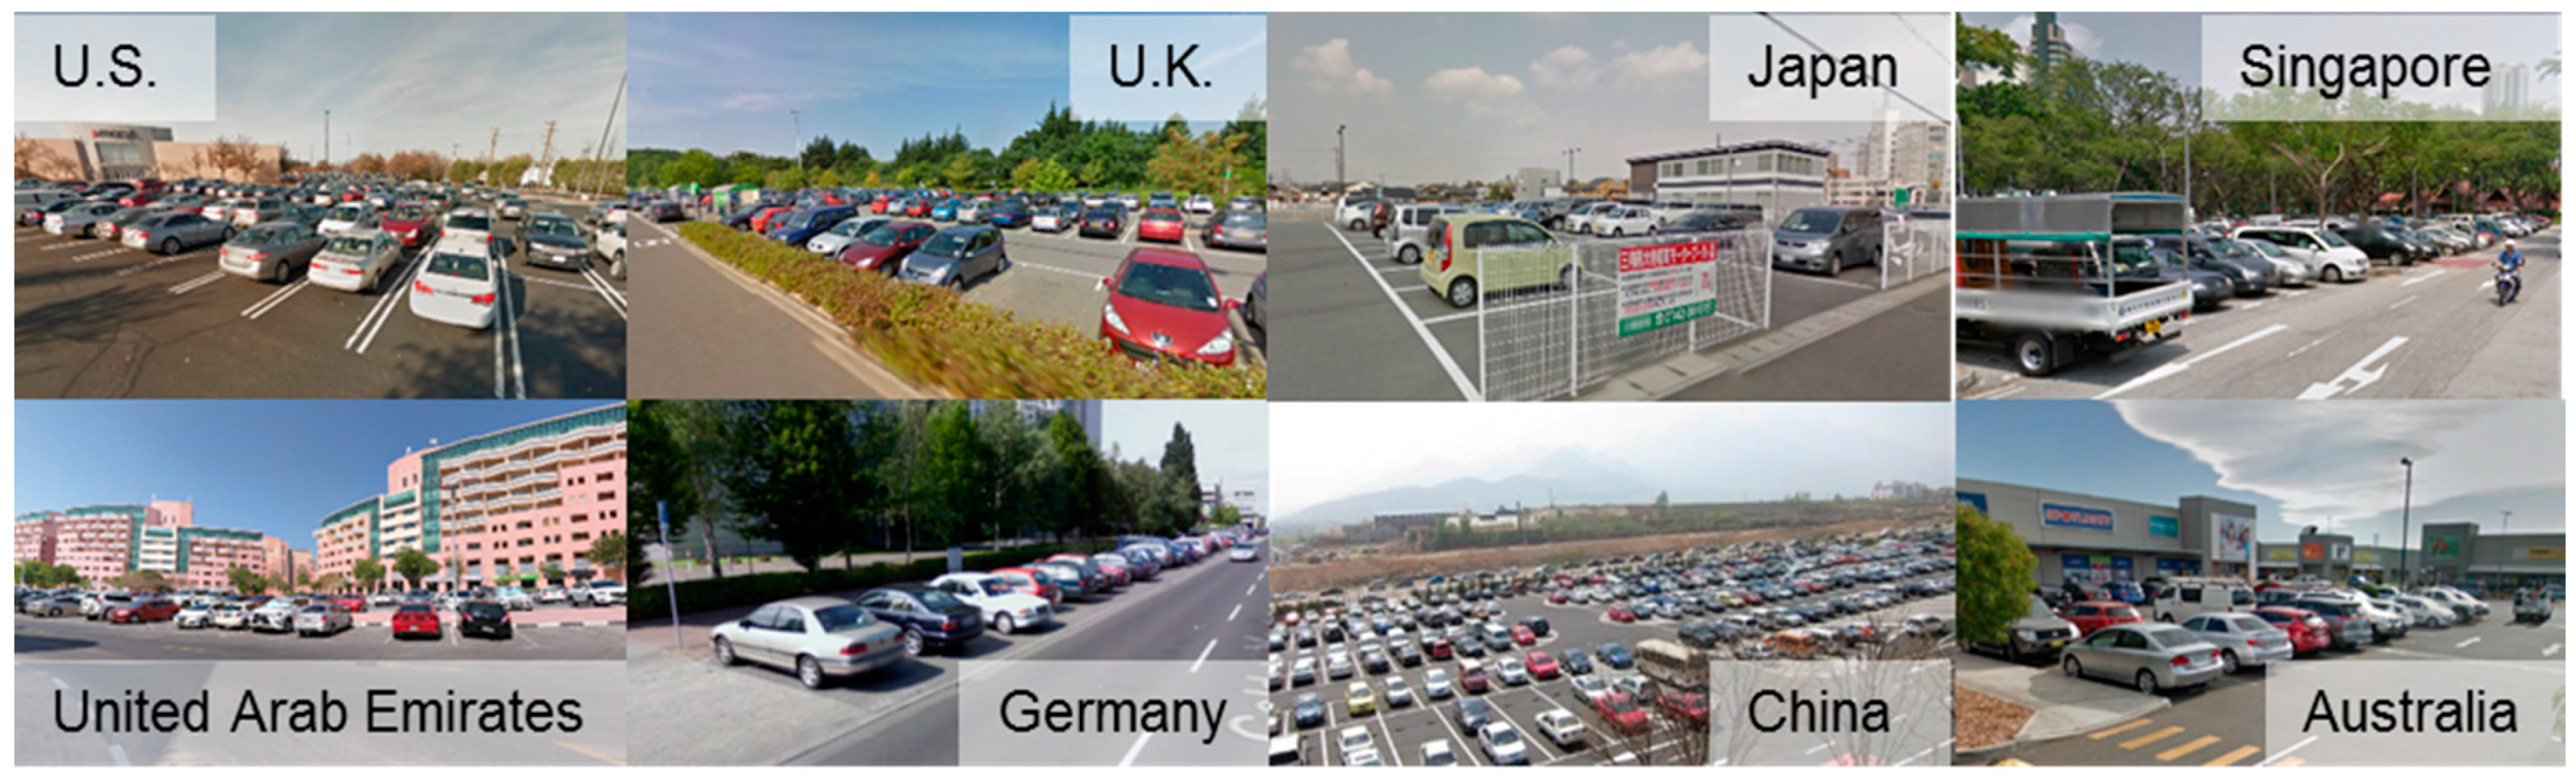
Over the last two decades, building integrated photovoltaics (BIPV) technologies (including rooftop PV) were proven as one of the most cost-effective renewable energy conversion technologies to be applied in densely populated urban areas [16,17]. It has been estimated that around 20 GWp of rooftop PV was installed globally in 2014 and the figure is predicted to rise to over 37 GWp by 2019 [18]. As indicted earlier, the deployment of PV in buildings presents difficulties due to uncertainty concerning building geometrics and urban layouts [19,20]. In addition, the orientation and the architectural configuration of buildings in some cases may be not appropriate for the optimal integration of PV. On the other hand, open car parks, which cover enormous areas within cities as vehicular spaces (see Figure 1) have higher flexibility and can accommodate structures that are optimally designed to integrate PV for higher energy yields [21,22].
In a case study of Tippecanoe County (USA), Davis et al. [23] found that 6.6% of total urban footprint of the county is used as car parks, and the number of parking lots is equivalent to 2.2 times the total number of registered vehicles in the county. Figure 1 depicts examples of car parks in the world that are currently built as open parking lots. These are normally in close proximity to workplaces, shopping centres, or airports and provide secure and convenient access for people with vehicles using surrounding facilities. Existing car parking areas, if constructed with shading structures, can better protect pedestrians and vehicles from various weather conditions. In addition, a study by Du et al. [24] showed that carports provide vehicles with pre-cooling, which can effectively offset the latter’s electricity consumption due to reduced air conditioning demand especially at start up. A number of economics studies in universities in the USA [25,26] have shown that parking lots with shading structures are overwhelmingly welcomed by staff and students, demonstrating not only there is a need for clear engineering approaches but also the assessment of the economic and financial requirements for such development [21,22].
Open car parks have not been systematically utilised for PV deployment and this work provides seminal methodology and analysis to support such deployment. Moreover, in many countries especially those blessed with large solar resource, deployment of PV systems in such areas has a potential that could be as large as PV in buildings and hence provides another pathway to cities to achieve their low carbon targets. Utilising open car parks for PV systems provides additionality—for instance in utilising the electricity generated for local energy demand—which includes charging electrical vehicles. For the latter, it is important that when such systems are deployed, electrical charging infrastructure is also included in the mix. This will future-proof the technology/installation to be ready when electrical vehicles become prevalent. However, given the fact that large-scale car parks are in close proximity to the grid infrastructure, currently, it is more useful to use the output from such PV systems to offset local power demands such as air-conditioning. This is particularly important for countries such as Saudi Arabia, where a significant proportion of electricity consumption is used to cope with such demands, which are phased with the electricity generated from PV systems. This work presents a study that provides engineering approaches needed and economic appraisal for the implementation of solar photovoltaic (PV) shading of carports. It systematically addresses resource assessment, linkage to available areas, including orientation and configuration needed for such deployment. Our research provides a globally applicable methodology and analysis to support such deployment in these specific urban areas, which are deemed to be of huge potential for PV deployment, which, in many countries, could be as large as that of building integrated PV. The developed approach will be beneficial to cities, planners, academics and other researchers interested in this field as the work is also underpinned by a case study in a university site in Saudi Arabia, which provides the necessary data to test methodology and applicability.
2. Methodology
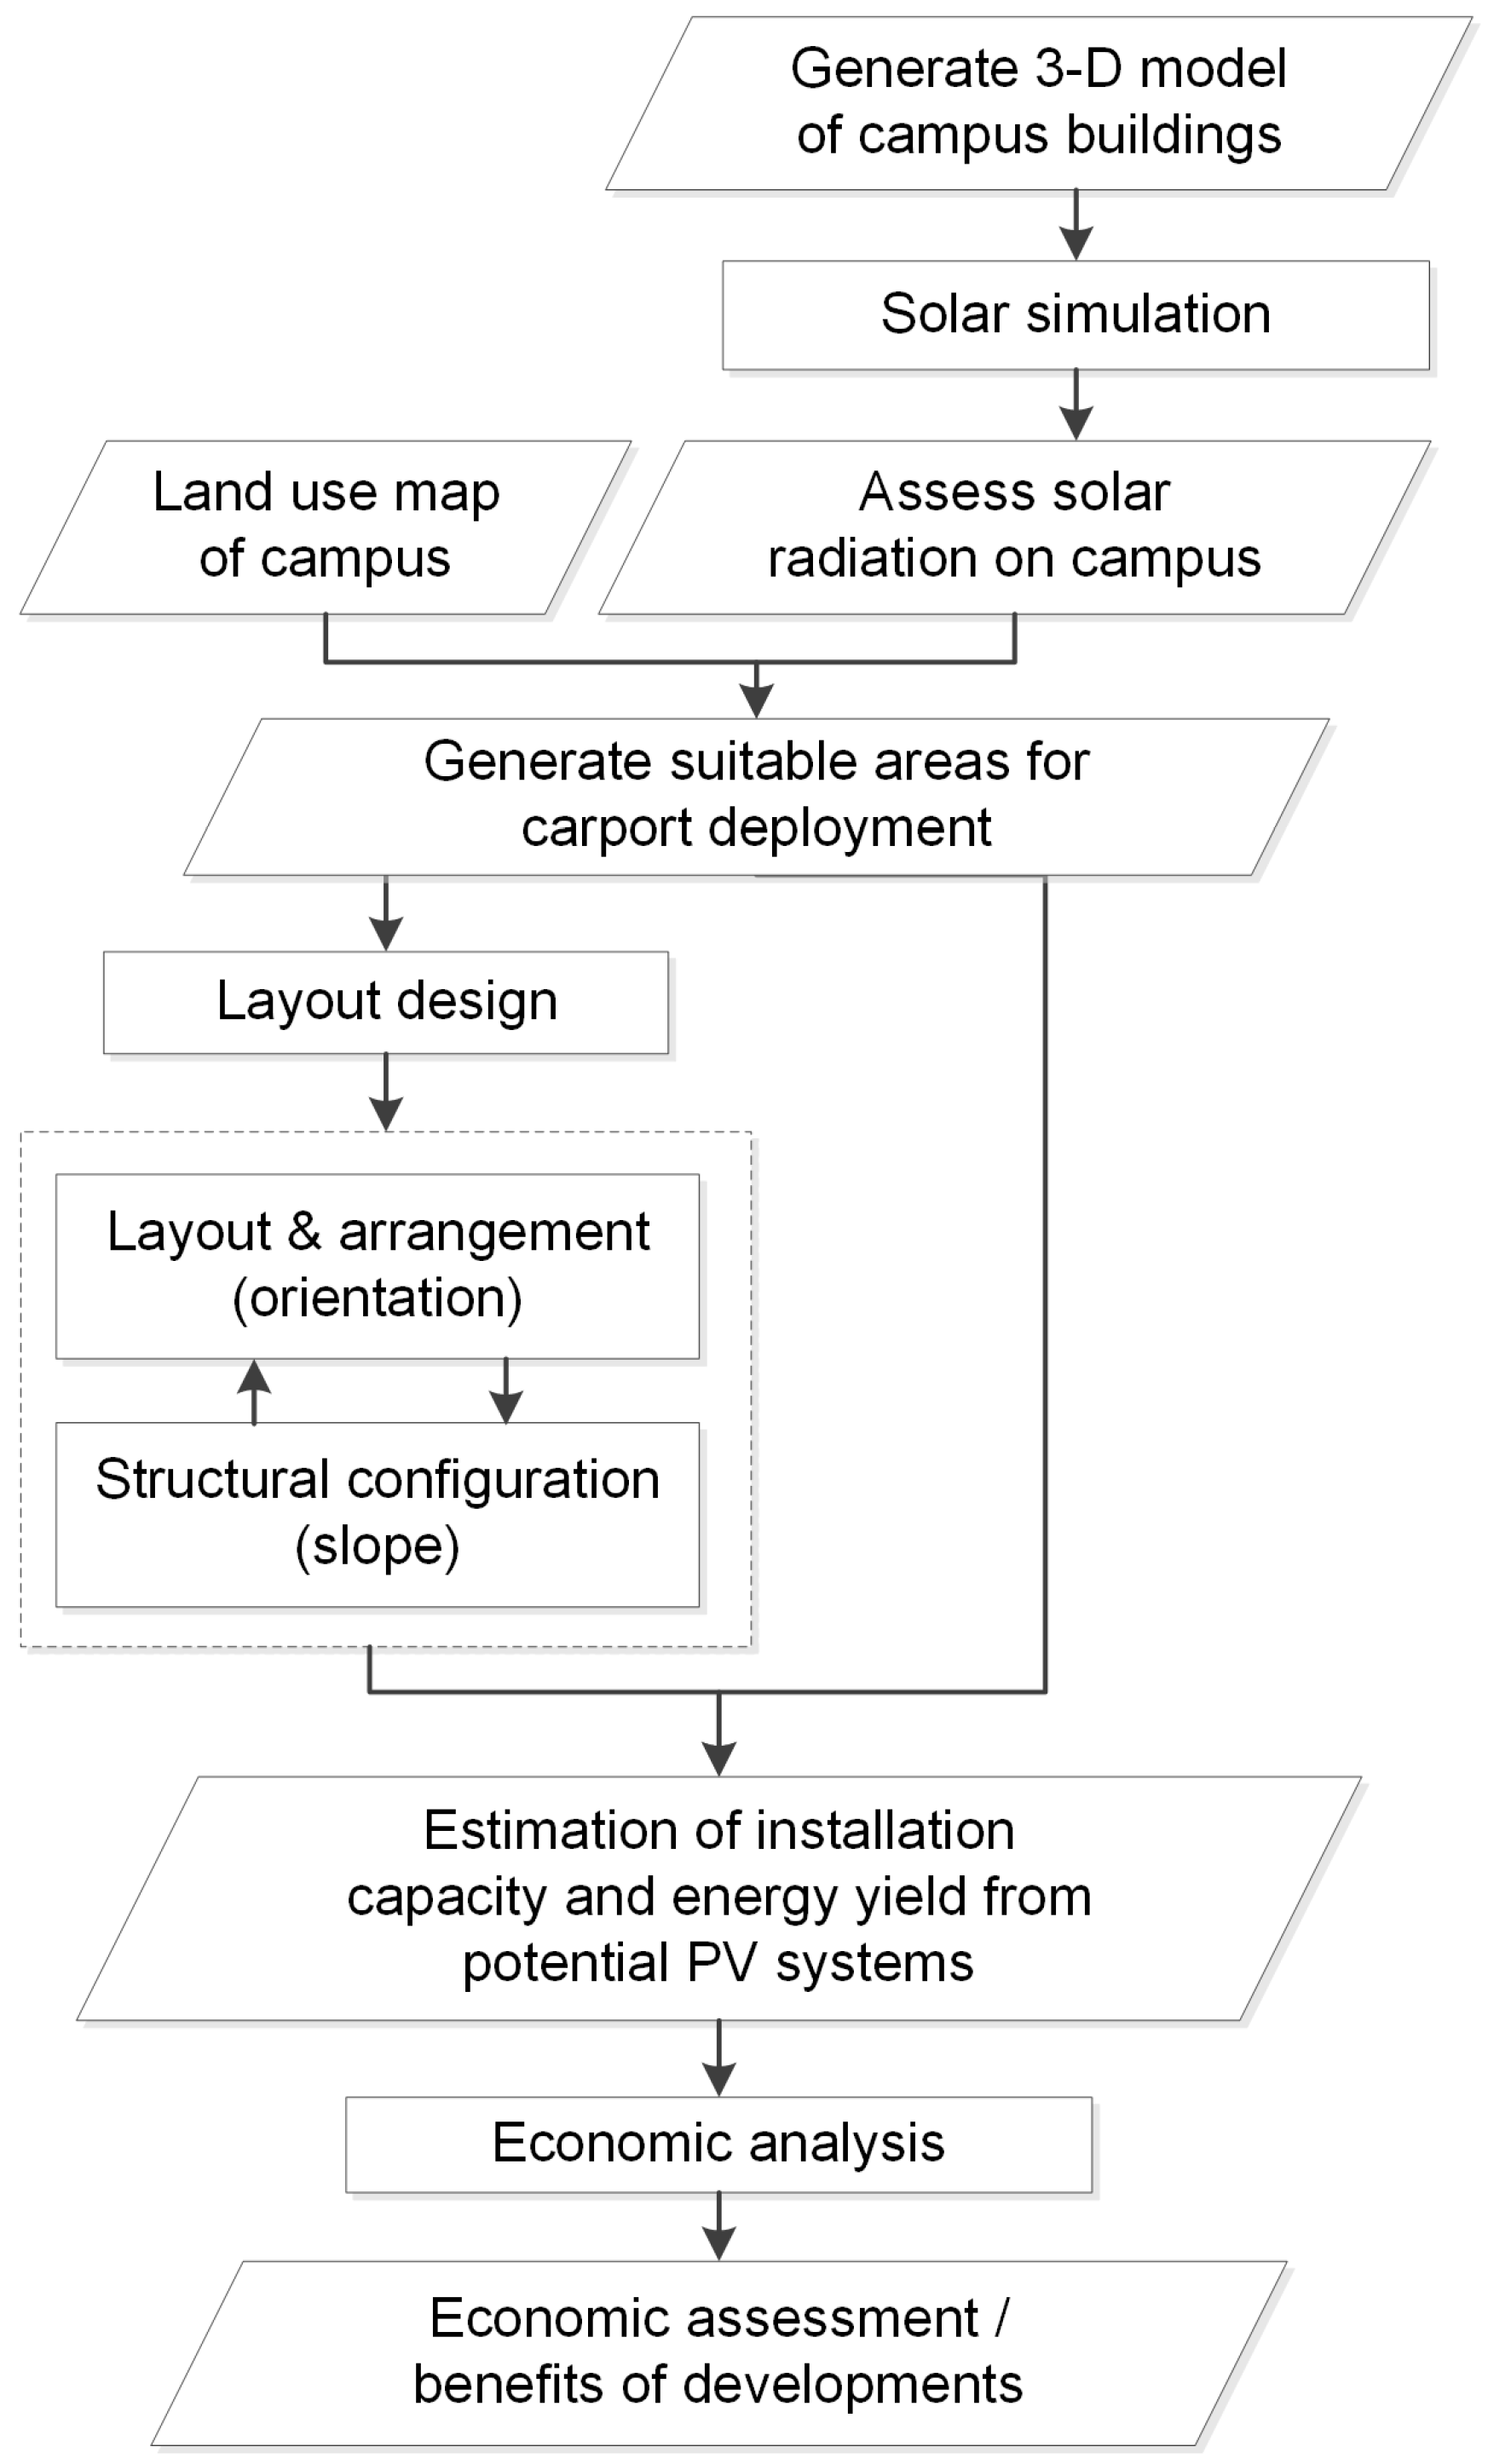
In this work, we have developed an approach based on geographic information system (GIS) to: (a) identify suitable spaces in a given area of car parking that will be suitable for deployment of PV shading on carports and (b) optimise the configuration and placement of the carport structures for maximum solar gain. The utilisation of geographic information system (GIS) has been increasingly adopted in solar PV analysis to carry out assessment of solar resources, and its application in regions such as Europe, North America and Asia and has been well documented [27,28,29,30,31]. In some cases, such an approach utilises light detection and ranging (LiDAR) data to facilitate the simulation of solar radiation on various surface areas, enabling PV system deployment and assessments to be conducted at large geographic scale [30,32]. The methodology developed here combines a number of GIS-based spatial analysis tools, and the processes are shown in Figure 2 and the required stages are summarised as follows:
- (1)
- A solar radiation simulation is conducted for the entire area considered, including parking spaces, vegetation and the surrounding built-up environment. GIS-based tools such as Area Solar Radiation on ArcGIS [33] or solaR on R [34] can be utilised with the Digital Elevation Model (DEM) datasets to estimate the amount of solar radiation on various earth surfaces within a given area. A further simulation is then conducted on the results to identify areas that are affected by shadows due to adjacent buildings or surrounding vegetation. The proportion of shadow-affected spaces in a given area is determined by two main factors, which are (a) height of surrounding buildings and their distance to the parking area and (b) latitude of the study area. Areas affected by shading are excluded from the assessment.
- (2)
- In the next step, areas identified as not affected by shading are spatially analysed, identifying their shapes and main orientations. These variables are utilised in the design of carport arrangement, obtaining the optimal layout of parking lots in order to make the best use of available spaces. As car parking spaces are normally constructed in the form of arrays, their carports in a single car park are likely to be constructed with a same orientation (ΩC). This orientation is required to be tested by using existing applications such as PV-GIS [35] to verify whether it is appropriate for PV applications. If not, as shown in Figure 2, an alternative orientation will need to be re-proposed and repeat the GIS spatial analysis.
- (3)
- The geometrics of the carport structure are then configured to identify optimal slope for PV systems. Based on orientations (ΩC) that are obtained from previous steps, existing applications such as PV-GIS are used to specify the optimal angle of the slope [35]. In addition, as carports are regularly constructed with a back-to-back structure, their configuration needs to consider PV systems facing both directions.
- (4)
- The last step is to estimate the electricity generation from potential PV-embedded on carports. The results can be used in economic analysis to assess investment requirements and payback period for the development. Such considerations can then be linked to the consumption profile of the relevant entity owning/occupying the car parking areas. This latter step will inform the project owner of the scope of energy that can be displaced by the deployed PV systems for the investments made which will allow an informed decision making process.
The electricity generated from PV systems is estimated by using two distinct modelling approaches: (a) a dynamic solar simulation model utilising TRNSYS software [36,37], where the appropriate weather files, system configuration, and other local conditions are included for the solar analysis; and (b) utilising PV-GIS, an online software tool, which automatically assigns weather information based on the geographic location of potential PV systems. Whilst the first approach requires intensive effort and knowledge to construct the dynamic model, the second approach—as pointed out by Choi et al. [38]—tends to use relatively simplistic methodologies, and hence may be less accurate than the performance obtained from dynamic modelling. Therefore, this work provides both analyses and compares the results obtained from both modelling approaches (see Section 3.3.5).
Testing the Methodology
The integration of PV systems on car parking facilities has been marginally exploited in some cases in Europe and the USA [13,39]. However, PV in car parking has not been fully studied in the Middle East (ME), a region with high solar resource and many car parks that need shading. Both of these lead to a real opportunity to develop PV-integrated car park shading facilities (PV canopies) and to test our approach. The case study for this work is focussed on the Kingdom of Saudi Arabia (KSA) where the resource is high and where the authors have appropriate, relevant data. In addition, the selected test site represents an important case study for the subject and the country as it (a) provides scale which will give an indication of the potential power generation from PV carport shading and (b) due to the year round high temperatures and direct irradiation experienced in KSA, vehicles require shading when parked, to provide a cooler environment and protection for the vehicles. The analysis, which is given in detail in the in Section 3 below, will also provide the site owners with a blueprint to exploit PV technologies in dual role of power generation and shading for vehicles, which can be replicated elsewhere in the world where such duel role is needed.
3. Case Study Analysis
This section covers the overall case study of a university campus with a large footprint in one of the cities in Saudi Arabia. The reasons for selecting a university are that universities are bastions for teaching, knowledge generation, innovation and the development of skills. They are also beacons for leadership in societal approaches to minimise our impact on the environment. Universities can act as learning entities to showcase appropriate and environmentally sensitive technologies so that others can learn from and replicate. It is with this in mind that this work is aimed at sustainable power production and addresses research conducted within a university’s physical footprint as an area to study and deploy PV systems on surface that are otherwise unused.
As LiDAR data was not available for the site under consideration, in our analysis King Abdulaziz University’s campus plans (maps) obtained from their Estates Department were used. These maps provided terrain information, which allowed us to identify appropriate sites that could be utilised for PV installations. In the following sub-sections, we present a brief details of the country and why this research is important in Section 3.1, then the characteristics of the site considered and it historical energy consumption in Section 3.2. In Section 3.3 we provide detailed analysis following the methodology steps given in Section 2 and Figure 2 above.
3.1. Saudi Arabia
According to the United States Energy Information Administration (EIA) projections the Kingdom of Saudi Arabia (KSA) will face rapidly increasing demand of electricity in the coming decades [9,40]. In response to this, the government has set up plans to increase the country’s power generation capacity including the target announced in 2012 of 41 GW from solar photovoltaics (PV) by 2032 [41]. Mansouri et al. [42] indicated that the government’s target, if achieved, will effectively promote Saudi Arabia to become less dependent on fossil fuels, hence reducing its GHG emissions. However, this target is now revised to 9.5 GW from all renewables by 2030 with a review to be conducted under the soon-to-be launched King Salman Renewable Energy Initiative [43].
Saudi Arabia has the longest sunshine hours and the highest solar radiation intensity in the world [9,44,45]. Large-scale development of PV systems in KSA however, faces a series of challenges. Baras et al. [45] pointed out that extreme temperature in KSA would affect the efficiency of photovoltaic (PV) systems, and the high dust loading on PV panels could have a significant impact on electricity generation [46]. Such challenges have not been sufficiently considered in currently available assessments of the solar resource in KSA. Hepbasli and Alsuhaibani [47] reviewed existing studies and concluded that large-scale PV development in KSA would require not only financial investment but also intensive education and training on PV applications within universities technical colleges, as well as training entities. Such findings were also supported by Alyahya et al. [41], who suggest that in order to achieve the government’s target for PV development, local universities could play an important role in terms of providing the skilled cohorts and capacity to fulfil the renewables target. As this research is based on a university campus, we hope that its analysis and outcomes will provide a nucleus to support the development of such capacity.
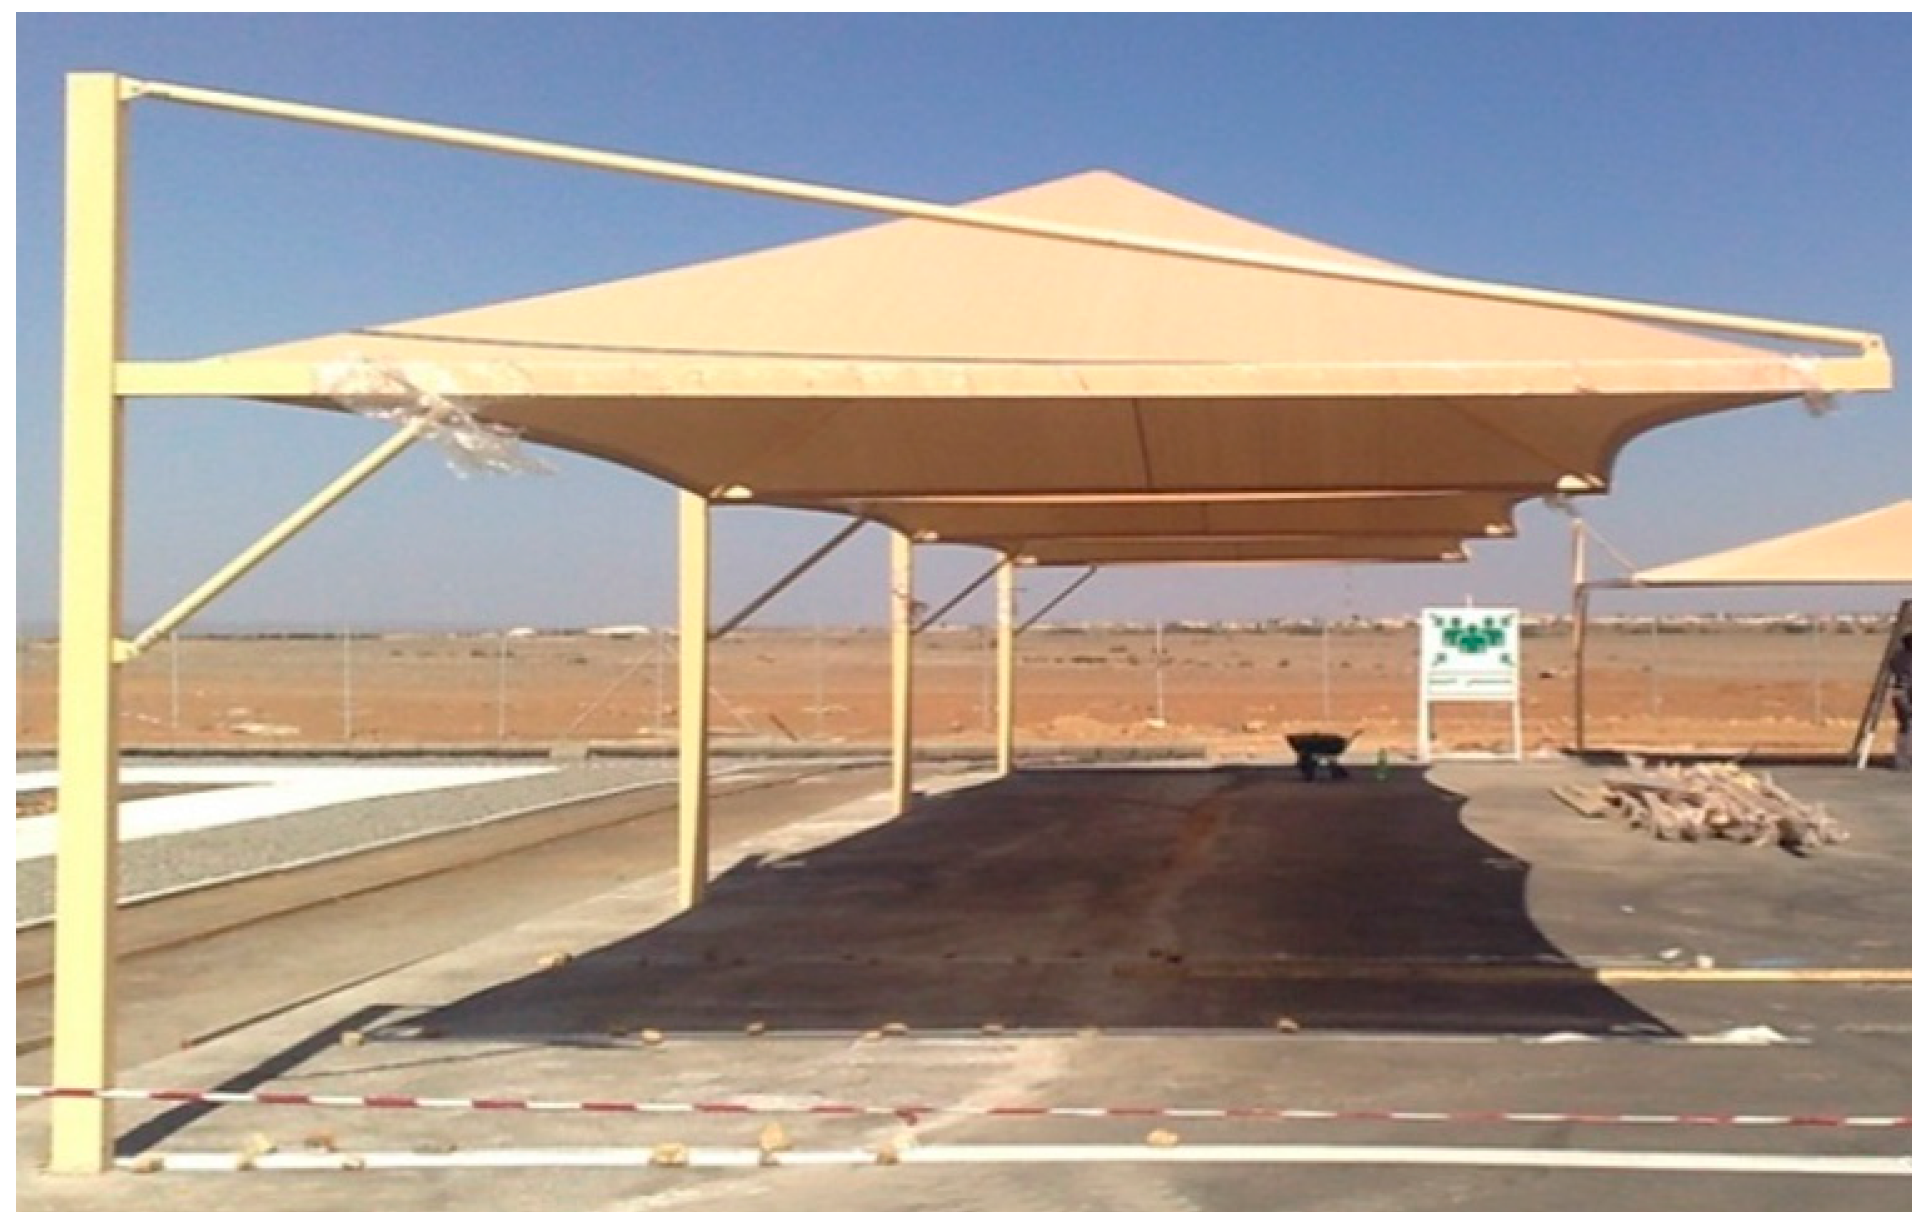
In Saudi Arabia, the car is the dominant mode of transport as public transport within cites is rather limited. Furthermore, and because of the year round high temperatures and direct irradiation, vehicles require shading when parked to provide a cooler environment and protection for the vehicles. In most cases, shading is currently provided by a cloth-type material integrated into a support structure made of steel and aluminium. Such shading surfaces are suitable for the integration of solar photovoltaic within their structures and, if integrated well, can provide the required shading as well as generate solar power that can be utilised locally or exported to the grid. This case study addresses two specific solutions namely, the generation of renewable power and shading for vehicles.
3.2. Campus Characteristics and Energy Consumption
Our case study was centred on the areas occupied by the King Abdulaziz University (KAU, Jeddah, Saudi Arabia). KAU’s campus provides a large-scale case study appropriate for our methodology and the analysis will link the potential solar PV power generation to the load profile of the campus that can displace imports from the grid. According to the KAU masterplan, the campus occupies approximately 7.2 km2 of which 0.7 km2 is designated to buildings and approximately 0.6 km2 (594,611 m2) for car parking. This means approximately 8% of the campus footprint has been assigned for vehicle parking.
In this work, we only address power generation, specifically from solar photovoltaics implemented within functional surfaces. While there is a huge potential for PV in buildings, our approach here only considers PV power production derived from car park shading infrastructure from both the already shaded or utilised slots (see Figure 3) and those exposed areas that are currently not covered by shading elements.
The following sections provide the overall analysis, the steps taken to arrive at the results and their implication to the case study in hand. It conveys the results and discussion that stem from the analysis undertaken to (a) understand the consumption profile of the KAU campus; (b) derive the power from the various sites on the campus; and (c) provide an indication of the power produced by PV from car parking areas compared to the current consumption needs of the University.
Status of Energy Consumption of the KAU Campus
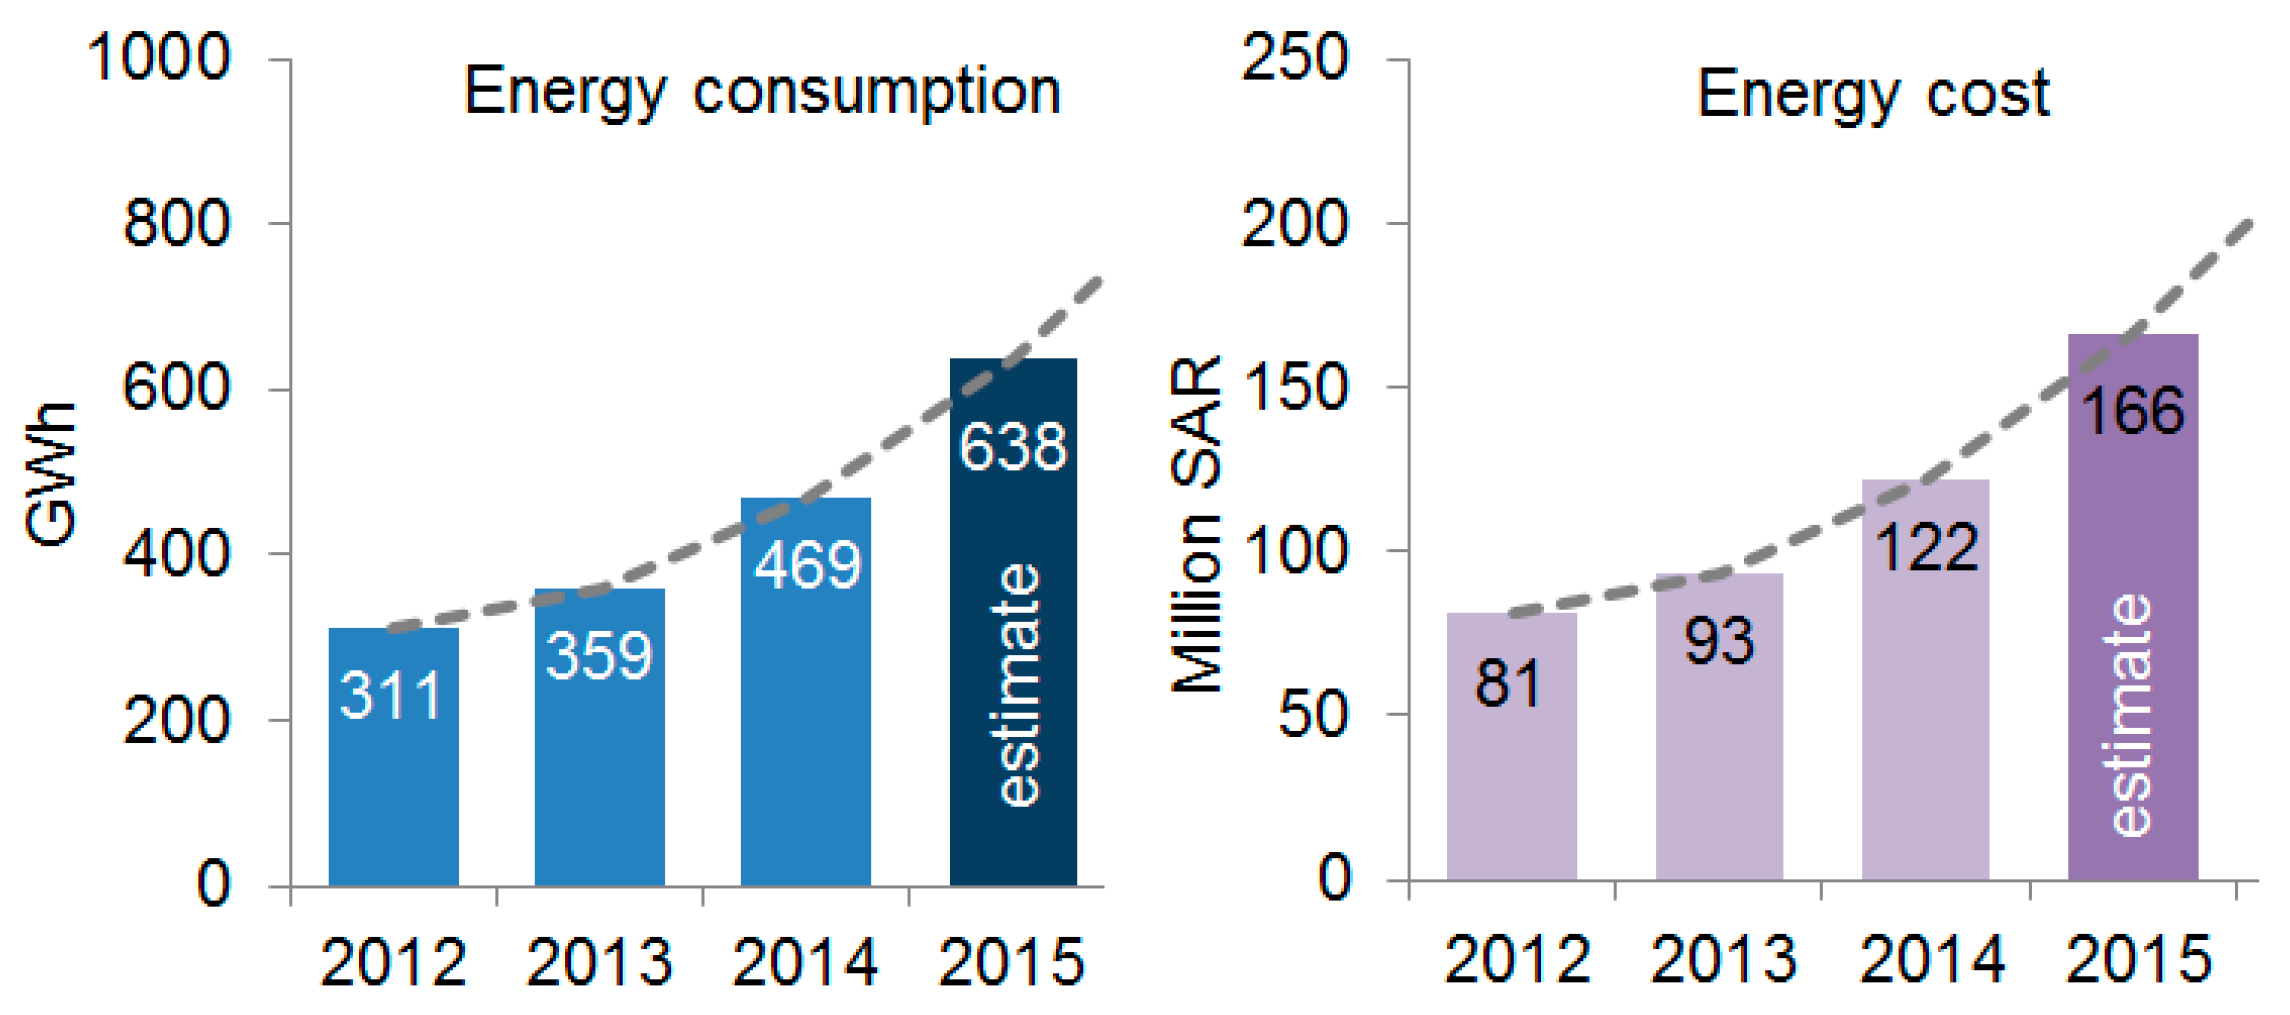
In order to support its service and expansion plans, King Abdulaziz University consumes a large amount of electrical power. Figure 4 gives an indication of the actual historical consumption from 2012 to 2014. Following this trend, we predict the consumption in 2015 will reach 638 GWh. As can be deduced from Figure 4, energy consumption increased by 51% between 2012 and 2014 and is projected to double in 2015. In terms of cost, we predict that, in 2015 KAU will spend approximately 166 million Saudi Arabian Riyal (SAR) equivalent to 44 million US dollars on energy bills, which is SAR 44 million (36%) higher than 2014, and 105% higher than 2012 (Figure 4). This increase is attributable to support the needed demand of new buildings that are coming on stream for the last five years within the KAU campus. However, such increase in consumption will almost certainly create budget difficulties for the University especially in the current era of austerity and from a sustainability point of view. Hence, deploying renewable technologies on the campus would assist in reducing the burden of the ever-increasing demand and will also contribute to reducing the environmental footprint of the University.
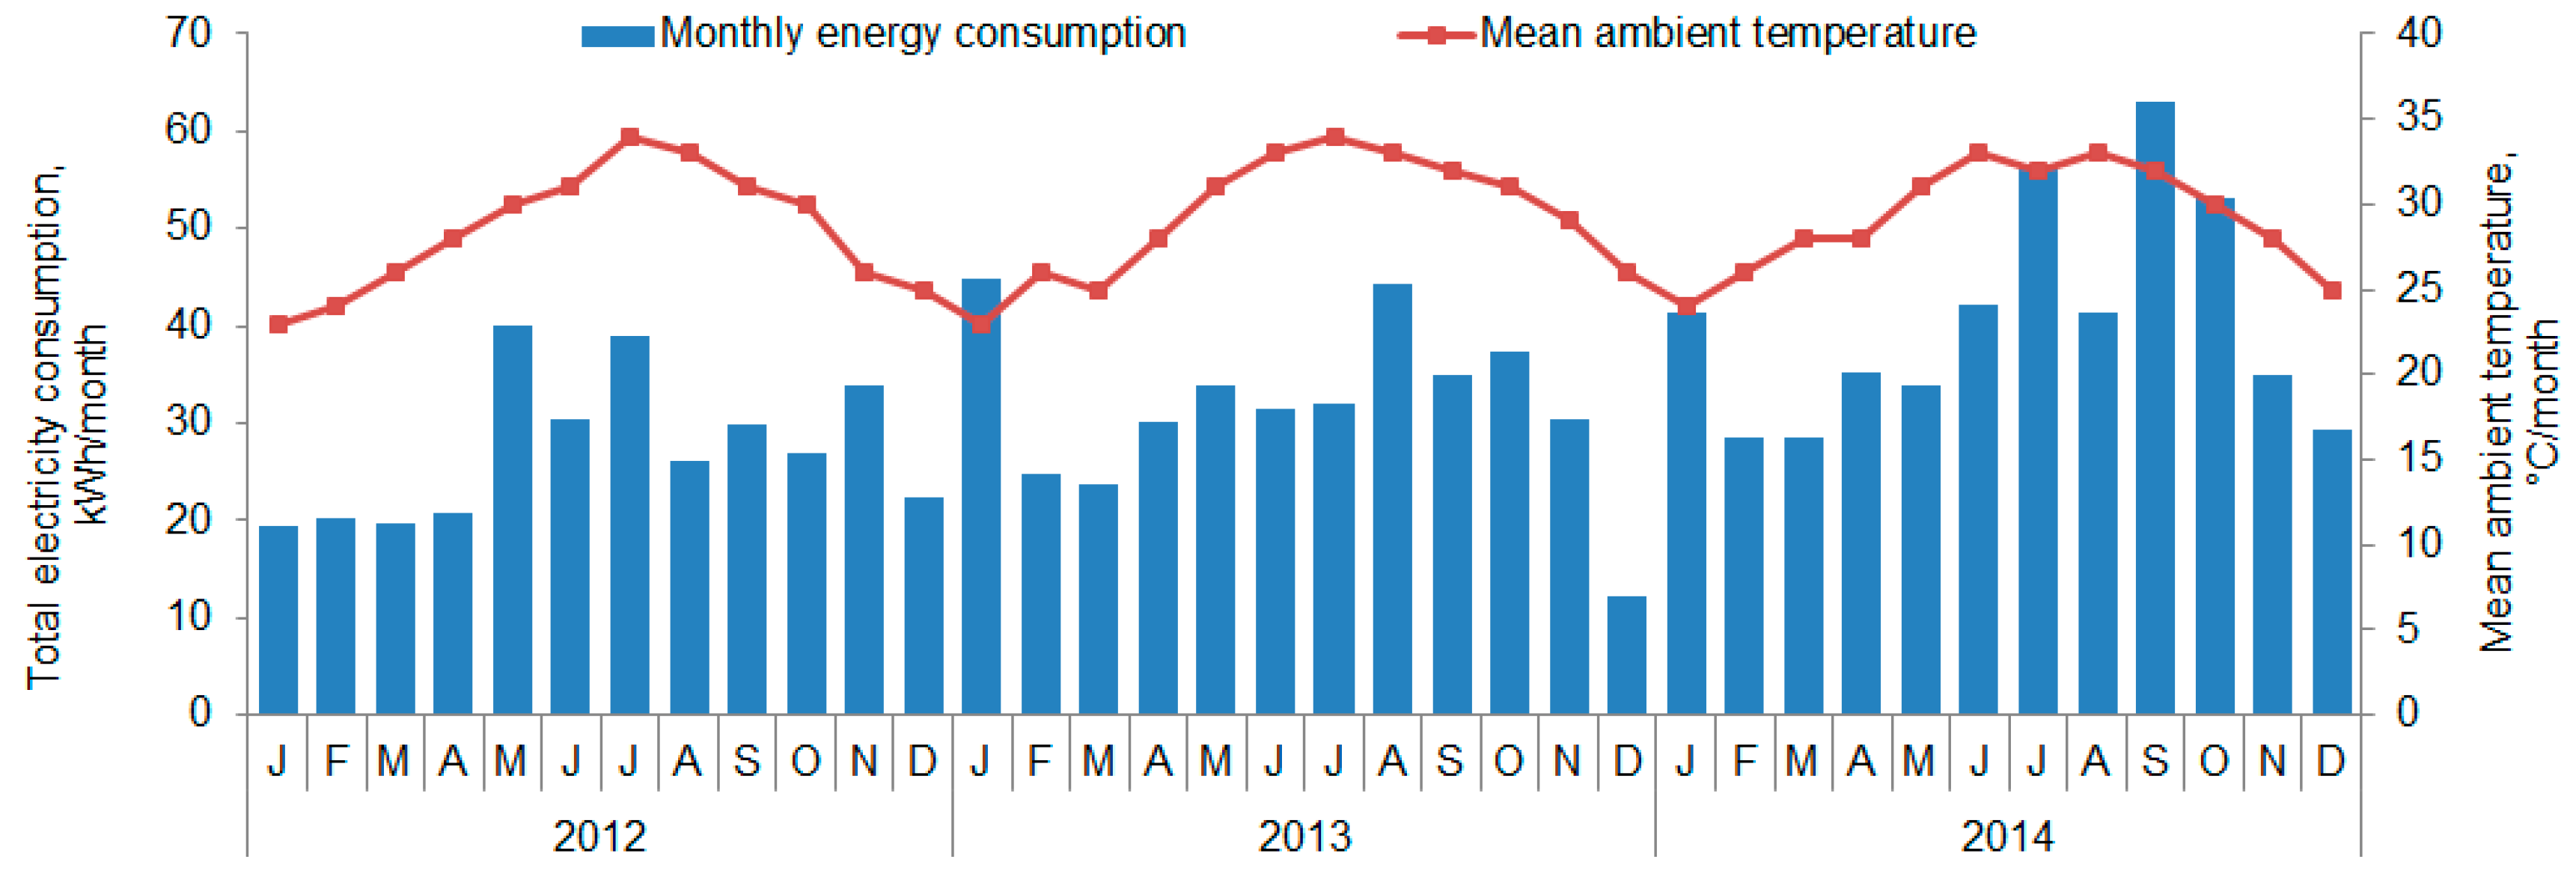
The monthly load profile for the campus is shown in Figure 5. As overall metered data is not available and due to the large number of meters in the university, the consumption data was determined from monthly bills paid by the University which show the overall GWh used and the cost.
There are some elements of variability shown in the presented data and these are likely to be associated with holidays and Ramadan periods, which are mainly governed by lunar year occurrence (Figure 5). However, for 2014 we are confident of the data accuracy as it clearly represents the yearly load profile, showing the summer months’ expected air conditioning loads as well as the holiday period, represented by the dip in consumption for August. Figure 5 also shows the mean temperature for the months where consumption data is available. As can be seen from the figure, although ambient temperature has not shown much change in the years shown, electricity consumption has increased significantly. This echoes our early mentioned prediction that the energy consumption of the campus will increase considerably.
3.3. Estimating Appropriate Areas for PV Deployment
In order to arrive at areas which are appropriate for deploying PV systems, the analysis has to take into account the designated car parking areas derived from the campus layout, study of the orientations of these and the influence of shading by both buildings and other structure. The analysis and the results are given in the following sections.
3.3.1. Campus Layout
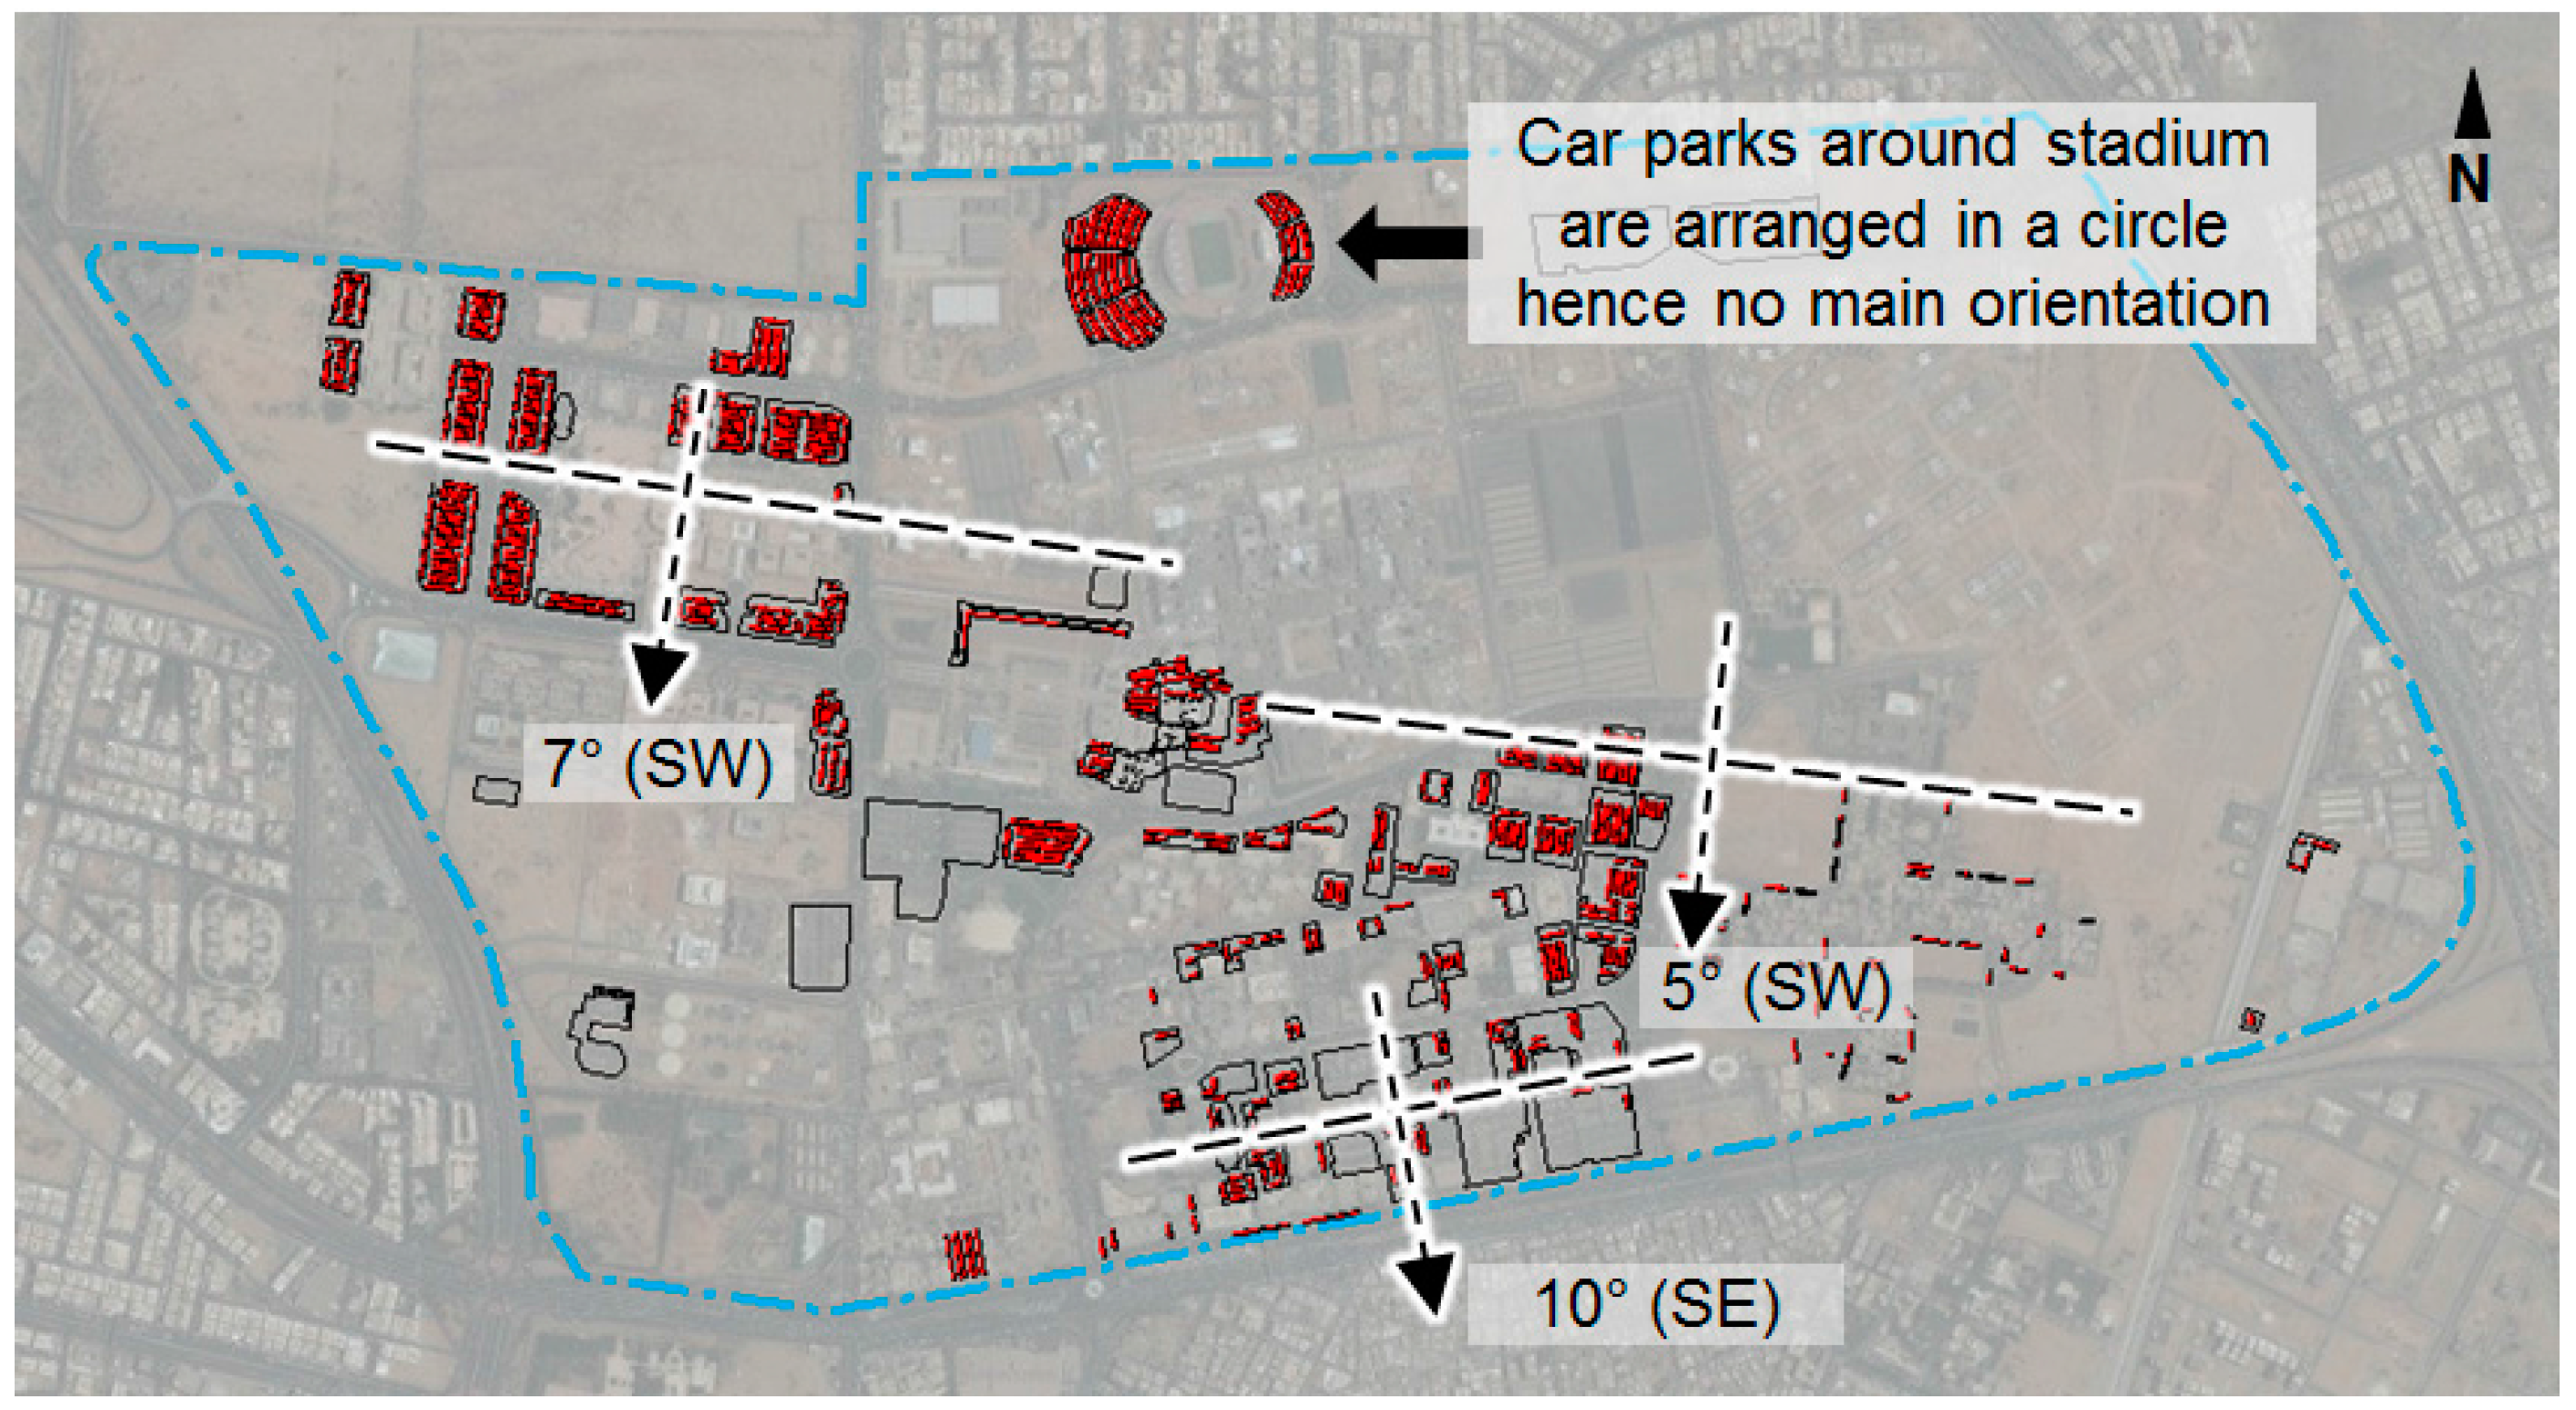
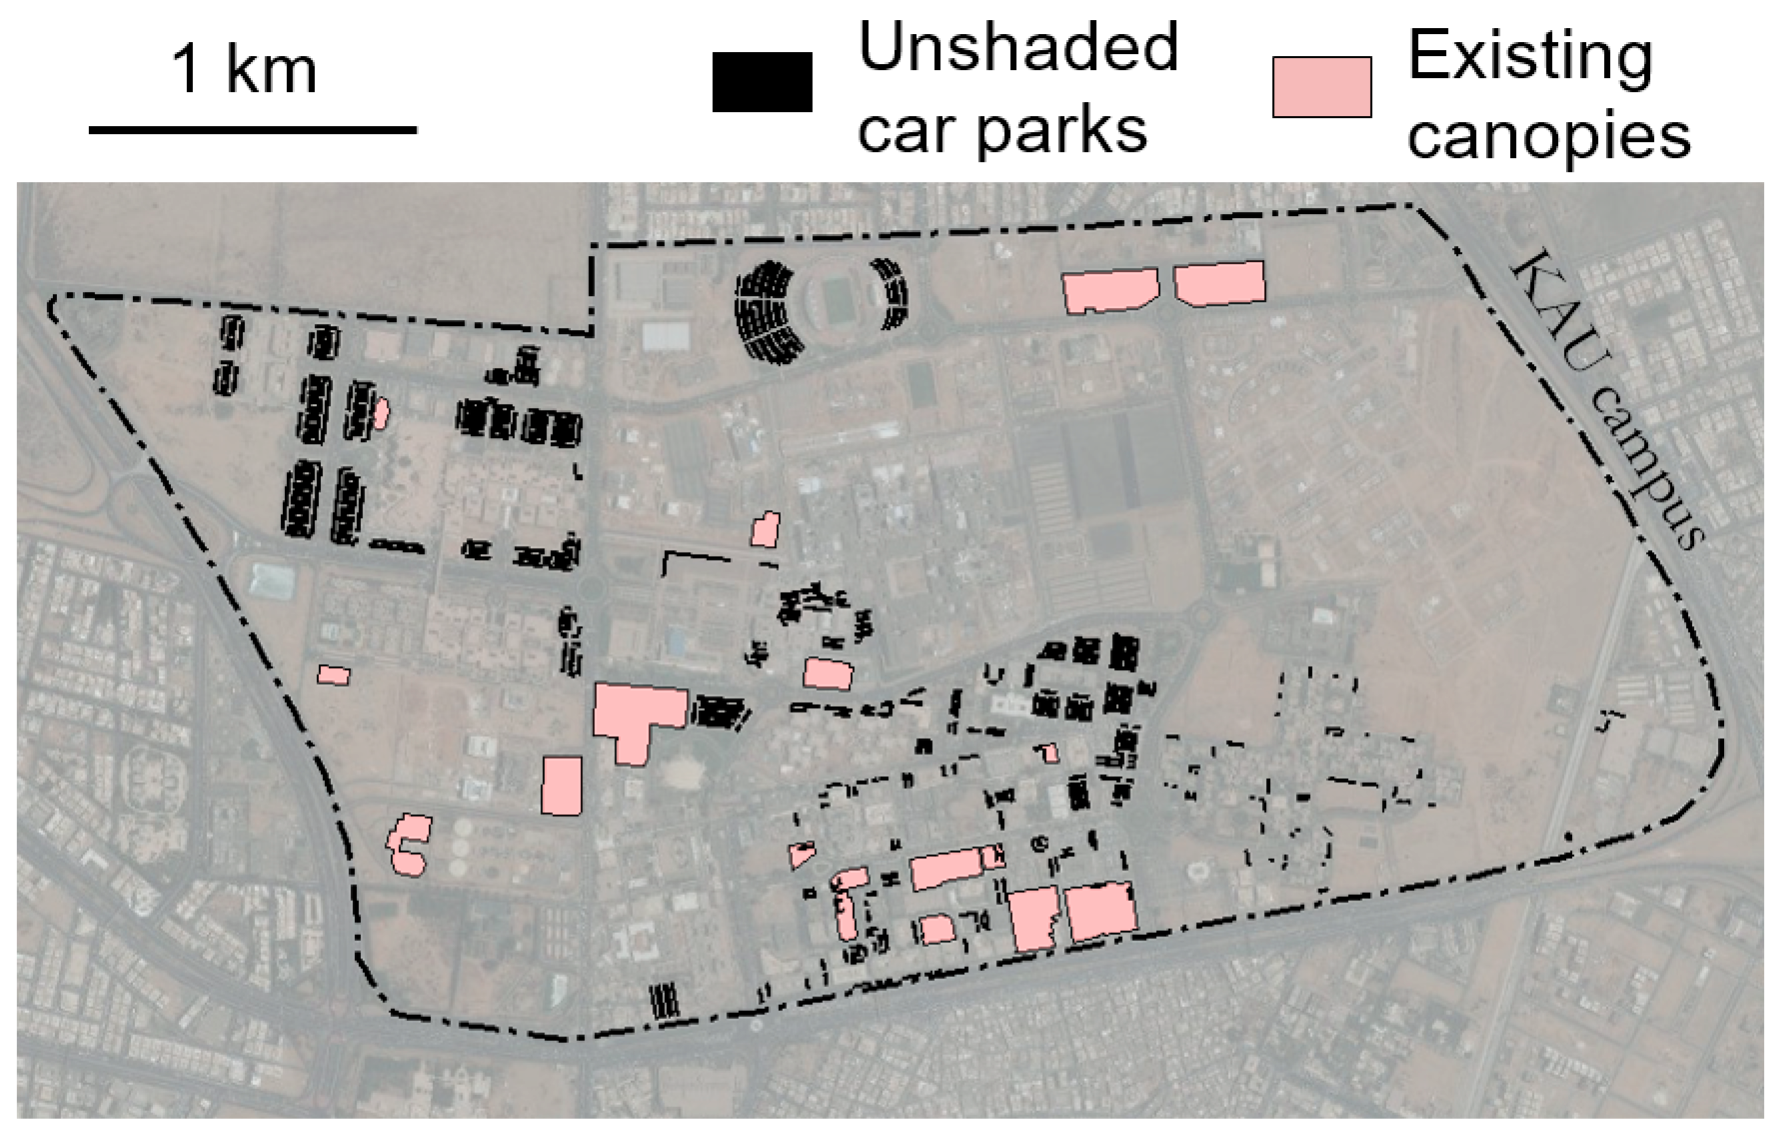
Figure 6 shows all car parking spaces in the KAU campus with existing shaded car ports, shown in red. Our GIS analysis indicates that these car parks have two distinctive layouts, facing either around 5 to 7 degrees to the southwest (with south being 0° or 10° to the southwest). A large number of carports are around the new University stadium and already have shading canopies installed. The analysis also indicates that existing canopies layout (structures) can be directly replicated on the unshaded cap parking areas. In essence, such orientations allow us to transpose the alignments of existing canopies on all unshaded paces and conduct solar radiation simulations at these orientations.
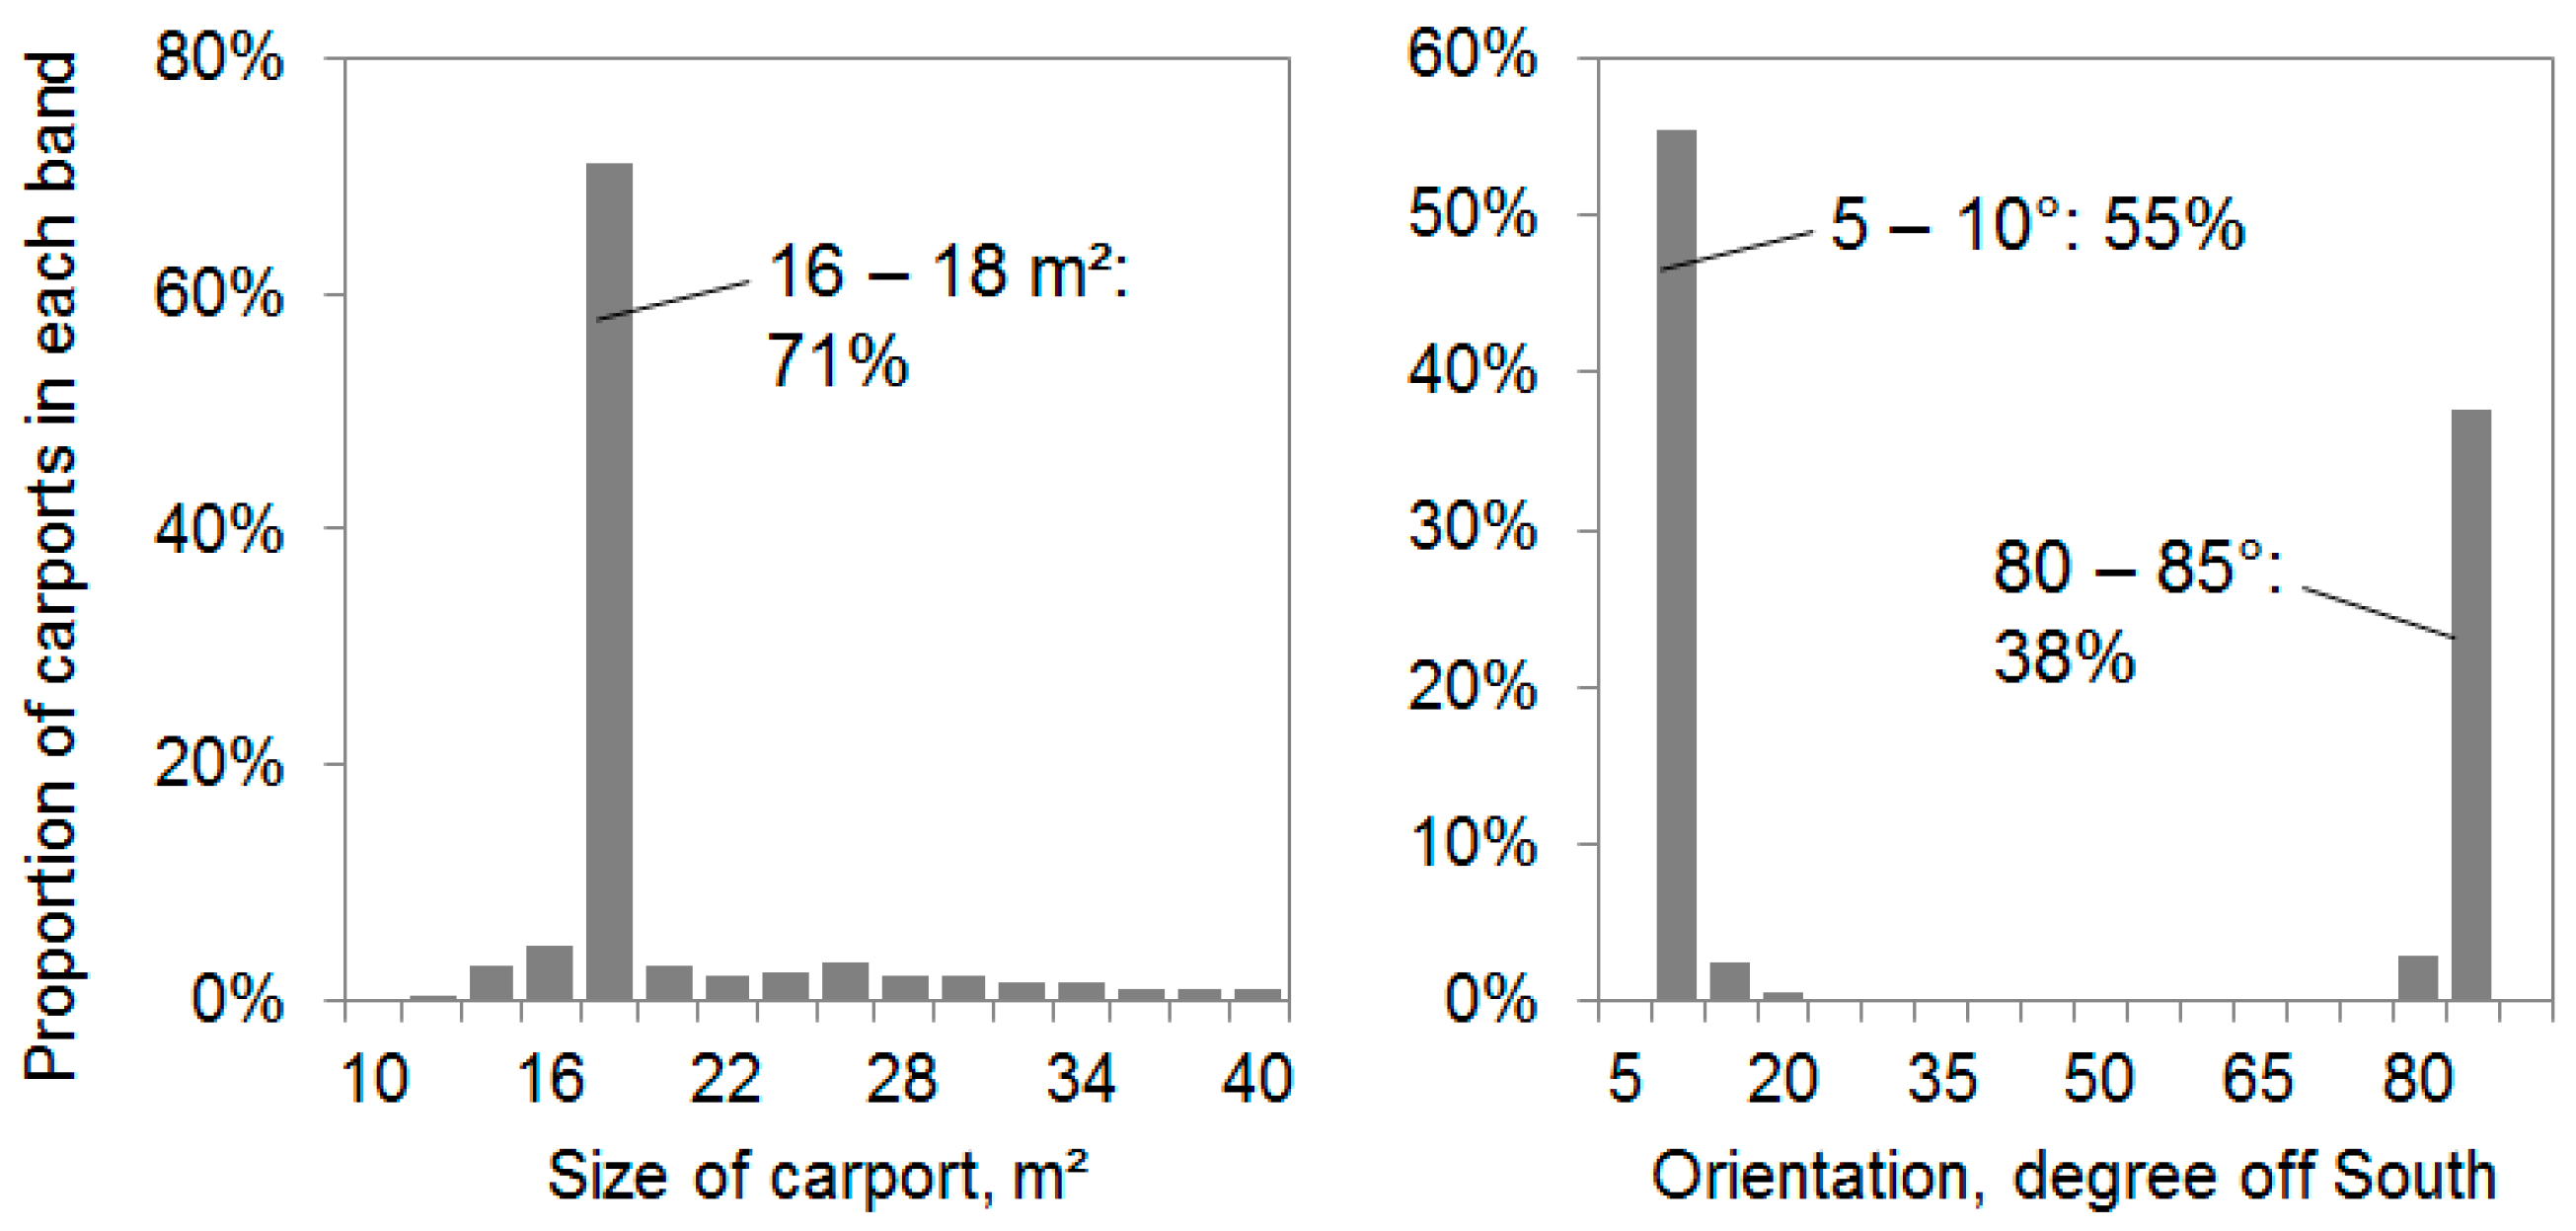
Hence, our initial GIS analysis was directed towards investigating the size and orientation of carports that have been installed with canopies, and the results are shown in Figure 7. The results indicate that existing canopies bear considerable similarity in terms of size and orientation. Over 70% of the shaded car ports have an area of between 16 and 18 m2, (Figure 7) and the vast majority of existing canopies are either facing south with a small deviation angle of 5 to 10 degree, or have a relatively large angle of 80 to 85 degree (Figure 7).
On average, a typical parking canopy would occupy approximately 16.7 m2 of ground surface and have a main orientation of around 8.3°. Further details of sizes and orientations of existing canopies are shown in Table 1.
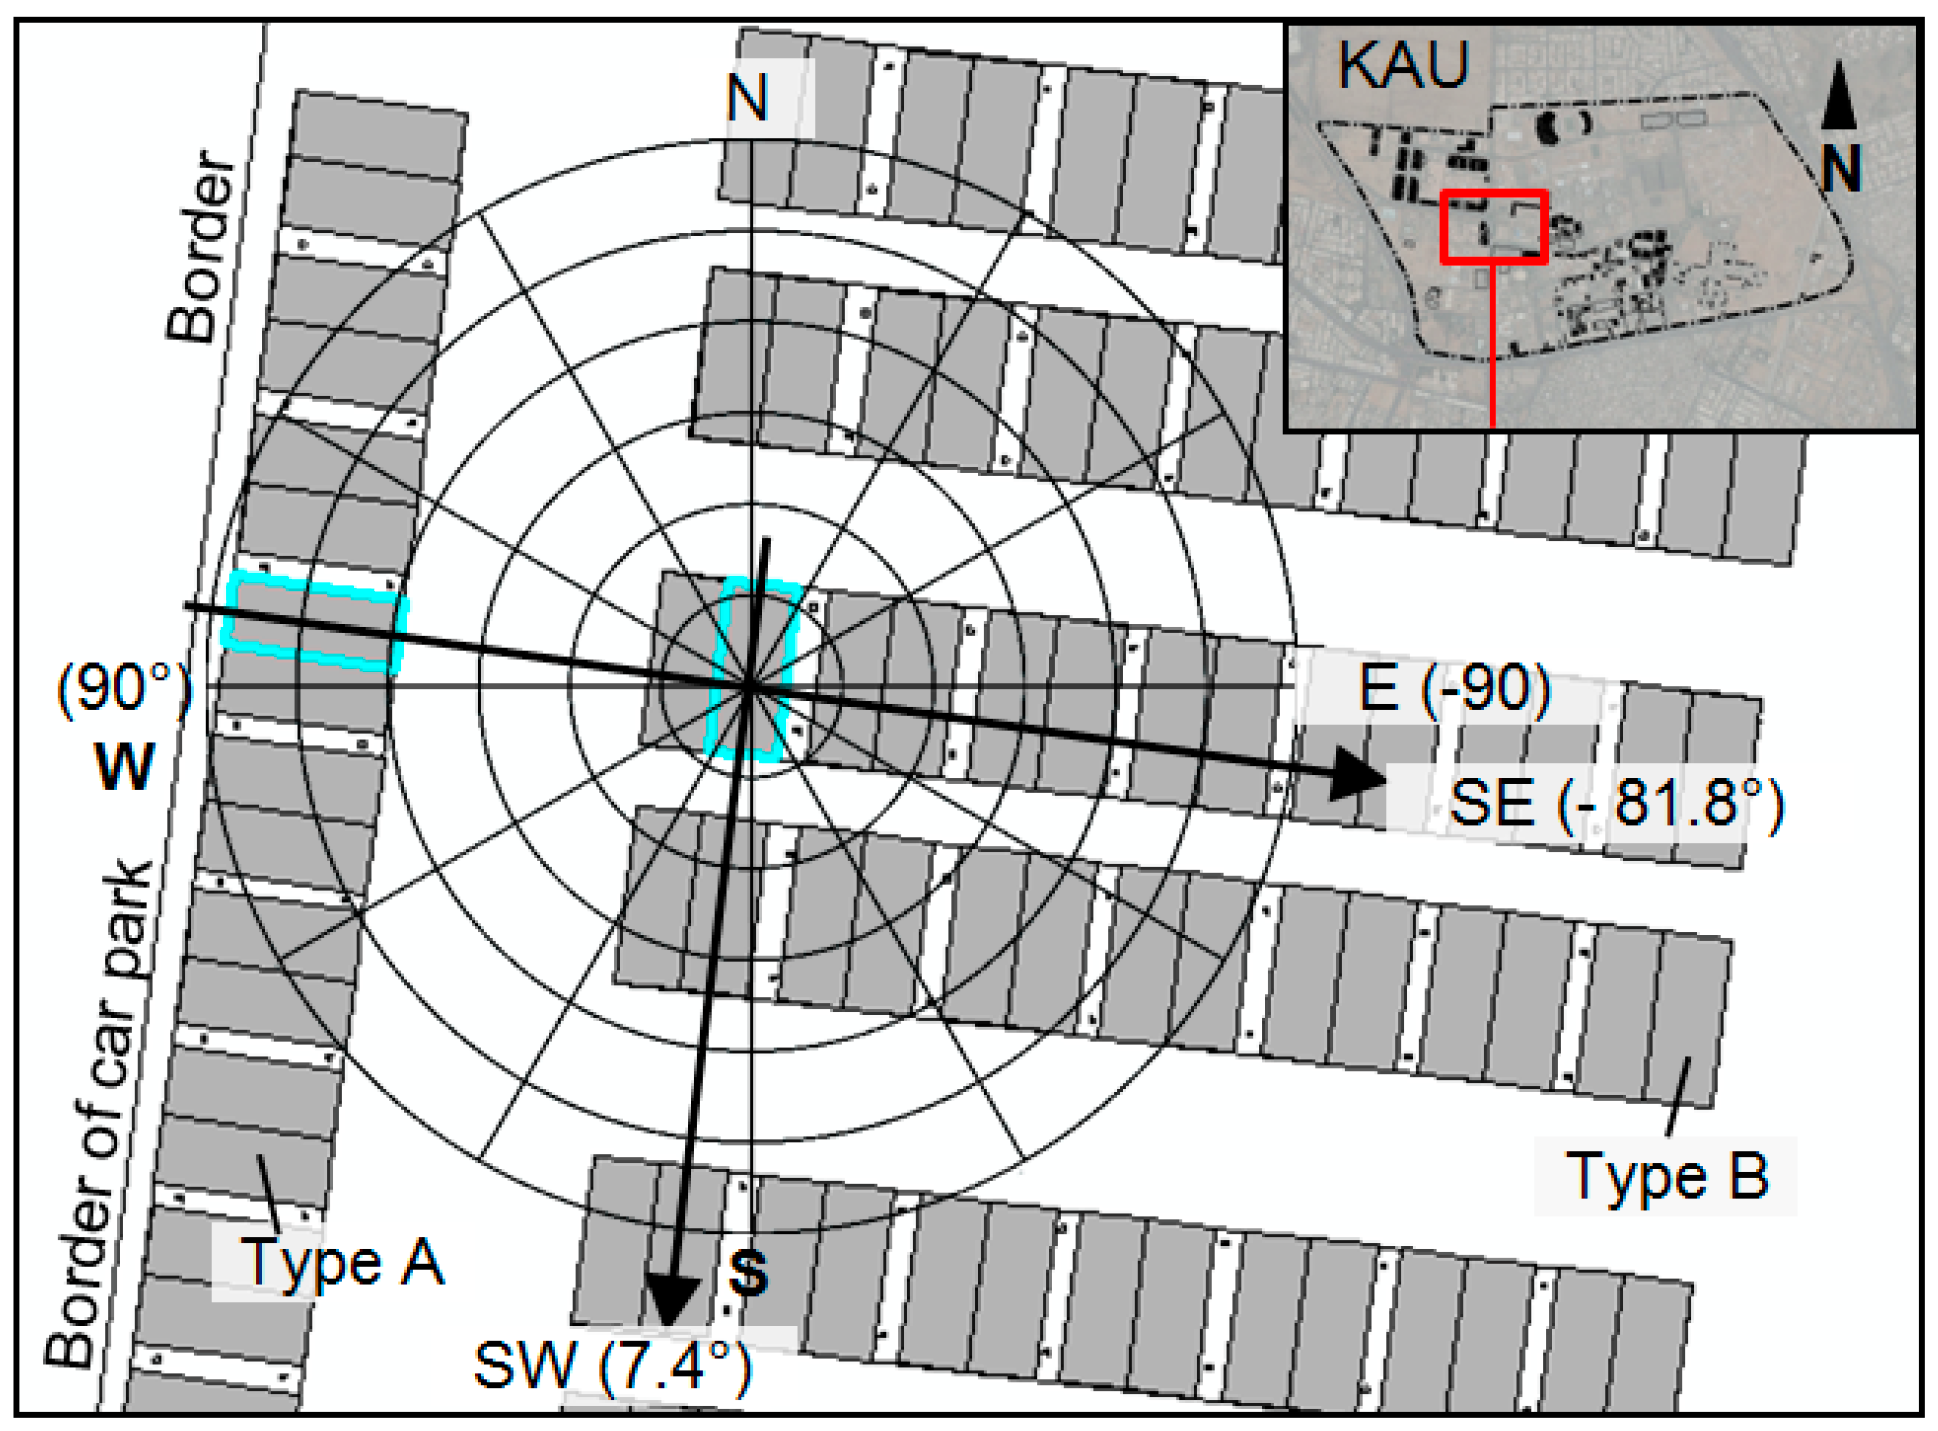
Figure 8 shows a section of the campus masterplan within the developed GIS illustrating the layout of carports within a randomly selected section of the campus car parking areas. This selected section represents 86 carports and the layout depicts a high similarity among existing canopies. Carports Type A encompasses 16 car-parking slots, which are located next to the border of the car park. Each slot occupies a ground footprint of approximately 16.7 m2, with the main orientation towards the southeast, approximately 81.8 degree of the south. These carports are approximately the same size as the 70 carports (Type B) which are on the right side of the diagram. Type B carports face predominantly towards the south and the orientation is around 8 degrees off south to the southwest side. For clarity, two sample carports were selected and are highlighted in blue in the diagram to represent each type of carport. Their orientations are −83° (with 0° being the due south and −90 being the east) and 8° (south west), respectively. These orientations will be considered later to determine the optimum design and the energy yield from the installed PV carport shading systems within the campus.
3.3.2. Shading Influence
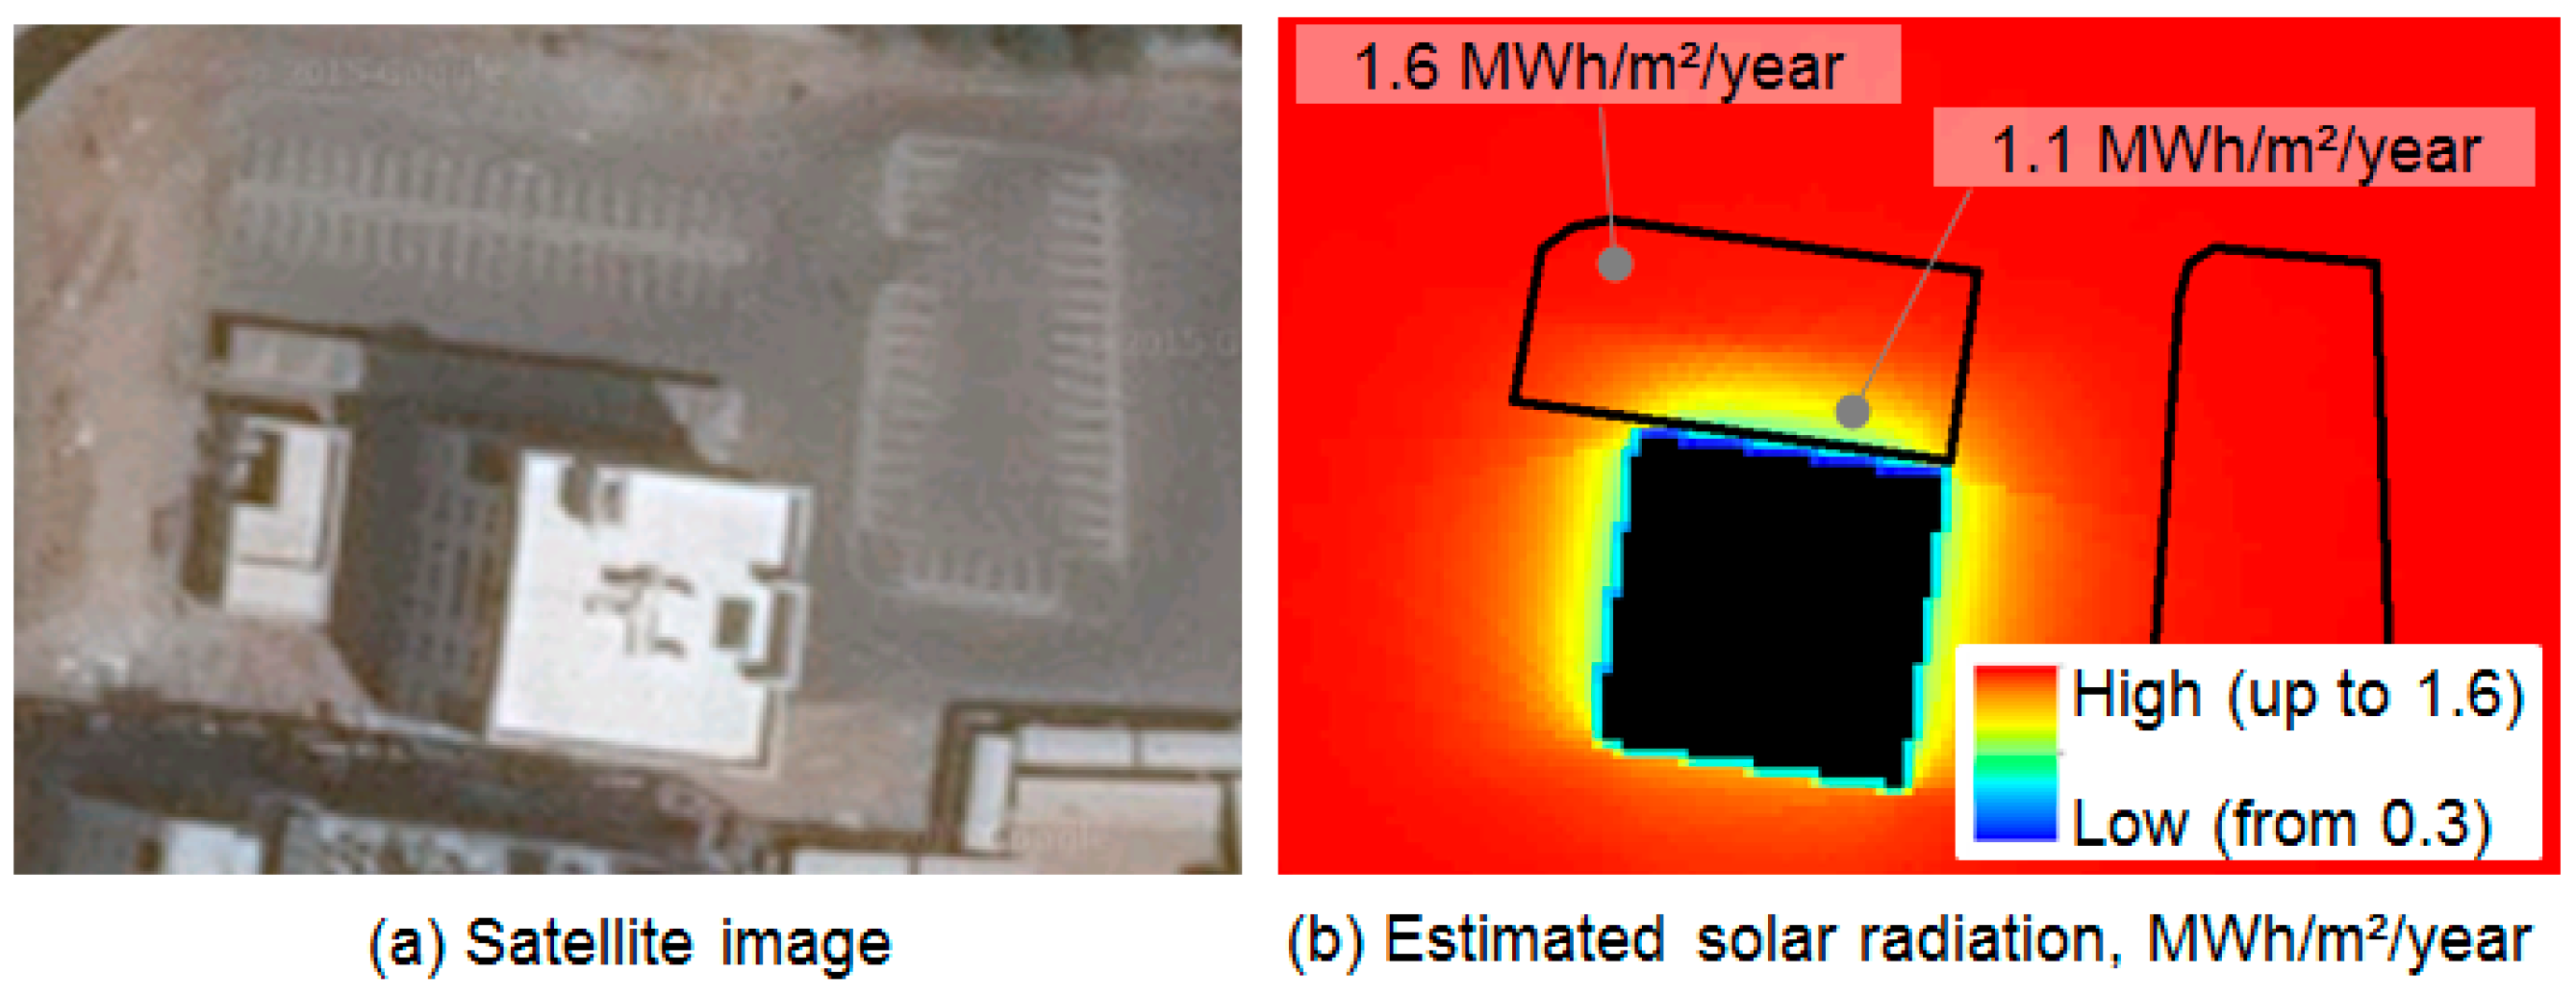
Figure 9 shows an example of the shading analysis conducted within the GIS to investigate the impact on power production. The figure shows the shading caused by a 4-storey building (Figure 9a) on the adjacent areas. There are two car parks close to this building, one to the north side and the other to northeast side, respectively. As can be seen from the satellite image in the figure, both these car parks have no existing canopies (Figure 9a). These car parks are outlined in Figure 9b as well as the solar radiation derived from our simulation. The results show that only the car park at the north of the building is partially affected by the building shadow and most of the affected areas are on the southeast corner (Figure 9b). The affected area has less solar radiation (1.1 MWh/m2/year) compared to that of other unshaded areas which has a value of 1.6 MWh/m2/year. Most of these areas however, are currently used as access routes for cars rather than for parking.
Following the same considerations as above, we conducted analysis on buildings within the campus with special focus on buildings adjacent to car parking slots to identify shading affected areas. Our results indicate that less than 1% of parking areas (2025 m2) within KAU are affected by shadows cast by buildings. Therefore, shading caused by buildings has limited impact on the utilisation of PV systems within car parks and the 1% shaded areas were excluded from the analysis.
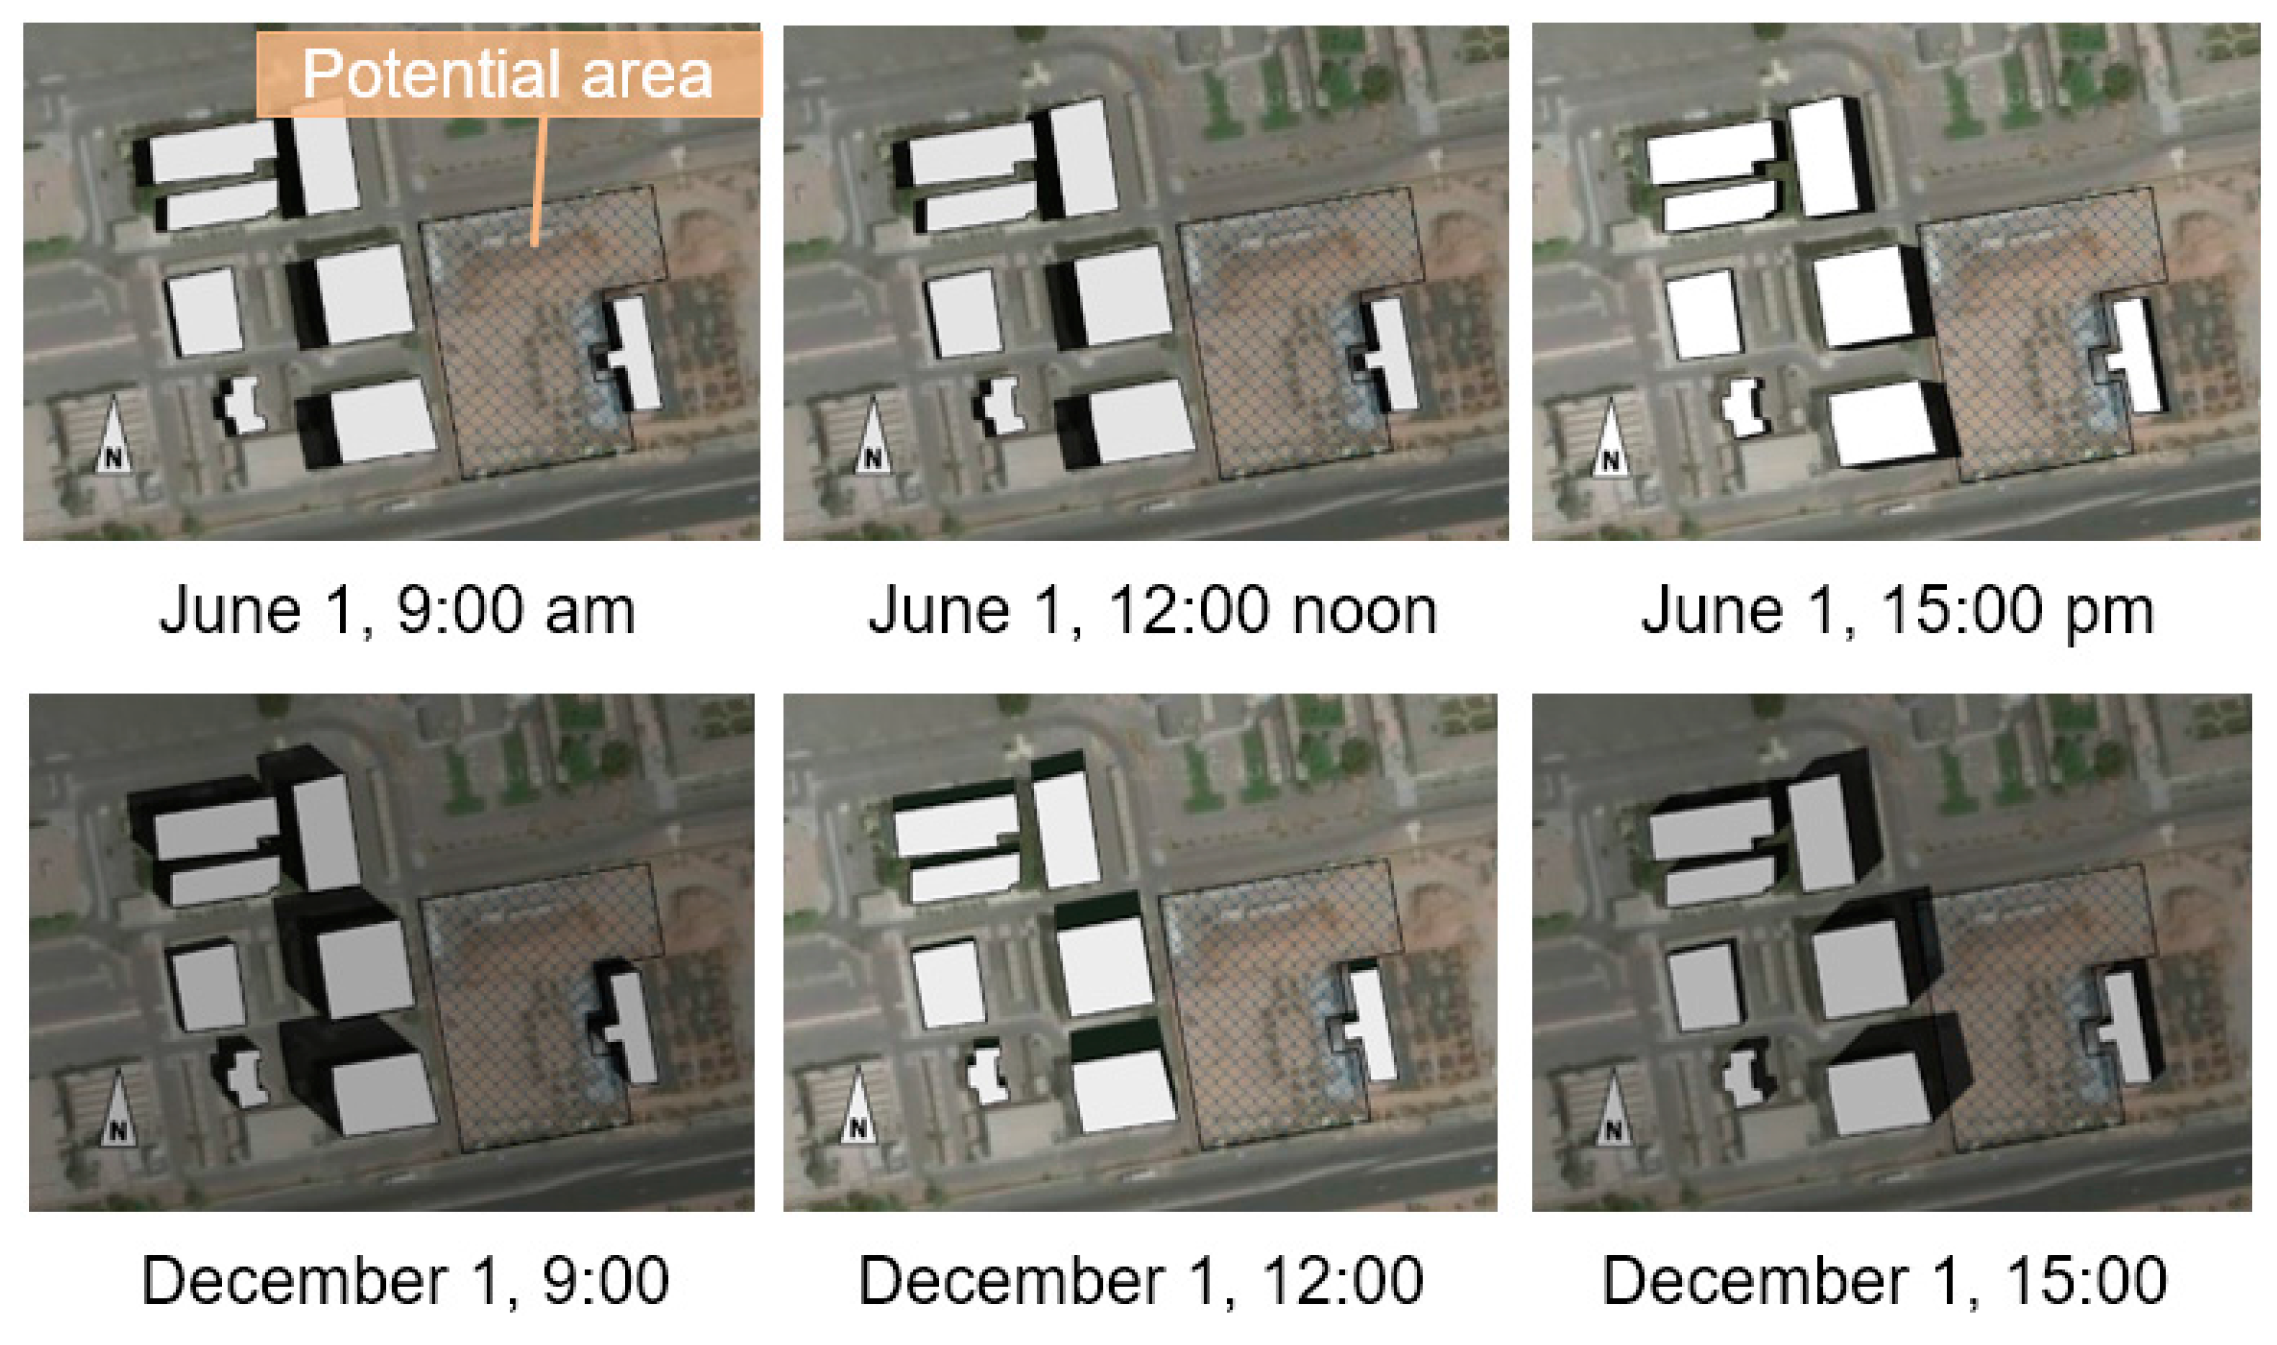
Solar radiation analysis was undertaken at half-hourly basis for the entire car parking areas within the campus linked to the shading effects from all buildings mentioned above. An example is given in Figure 10, where the shading effect is demonstrated as a function of various periods in the day and season. As can be seen from the figure, only slight shading occurs at the boundary of the parking area for 1 June at 15:00 whereas for 1 December, at 15:00 shading penetrates to approximately 2 m within the parking area. The overall outcome of these considerations is to arrive at unshaded available areas that can be used for PV systems as shading canopies for car park within the University.
3.3.3. Geometrics of Potential Solar Canopies
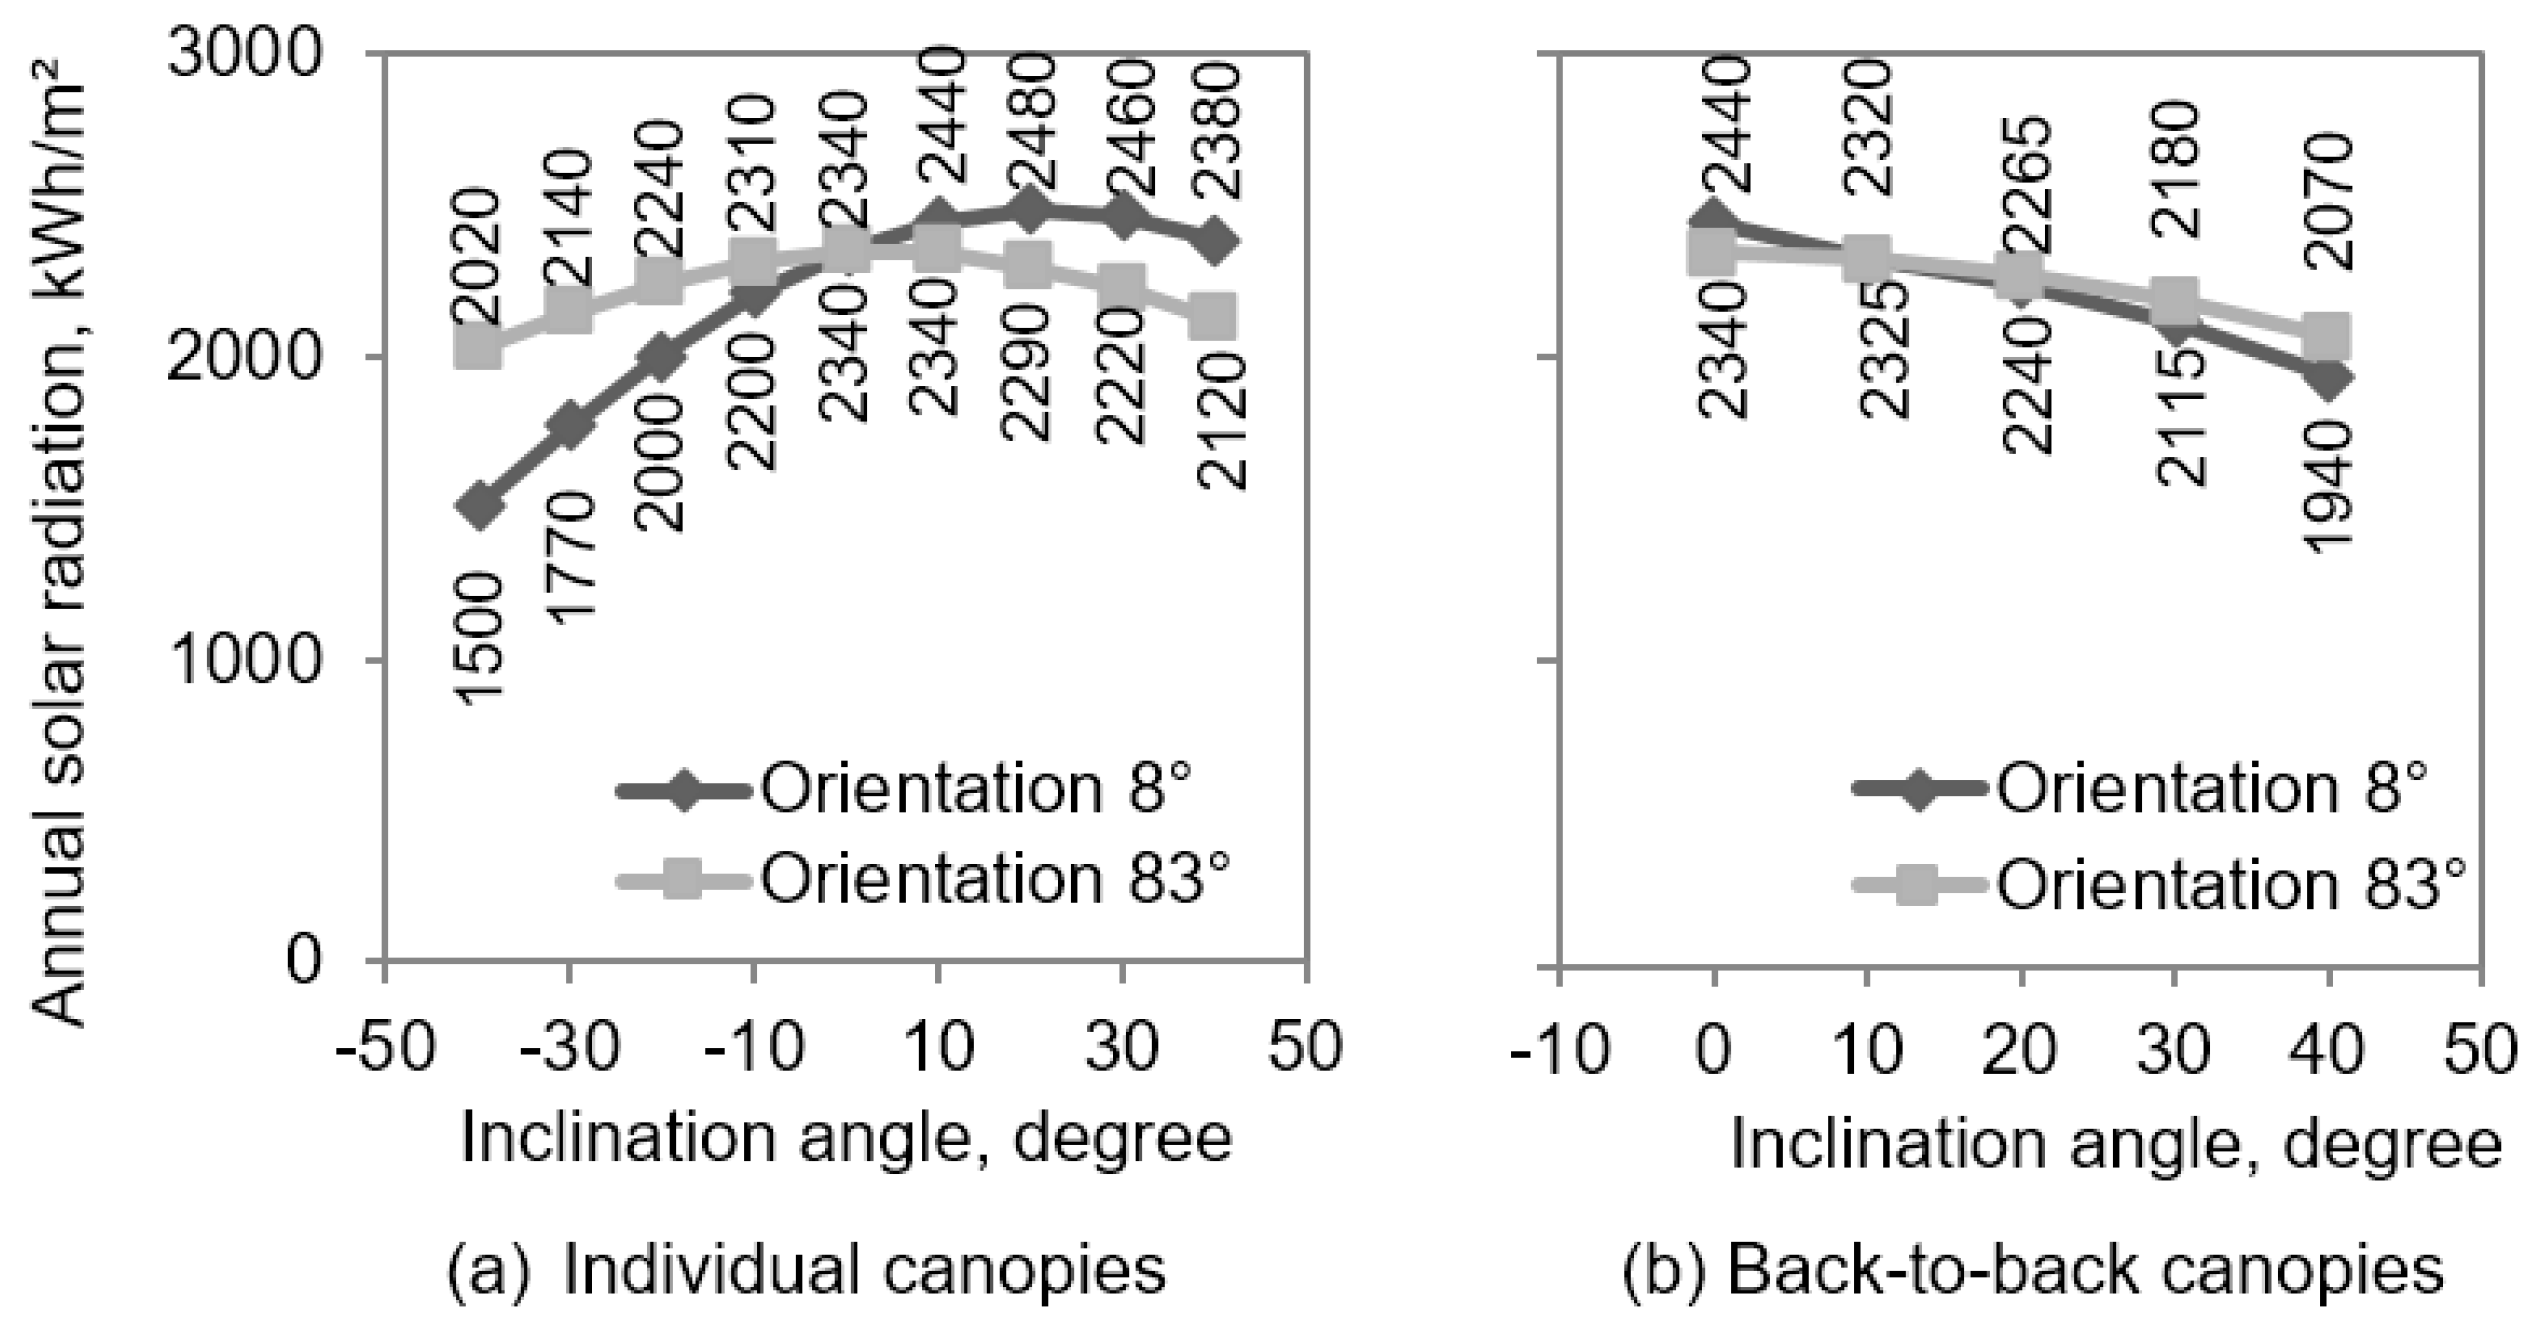
As the amount of electricity generation from PV systems is significantly affected by available areas, their orientation and inclination, we have carried out analysis to optimise the design of canopy structure to receive maximum solar radiation. As discussed earlier, the orientation of carports (canopies) is predefined and in order to achieve maximum energy yield the optimal inclination for canopies related to specific orientations will need to be determined. Figure 11 shows the annual solar irradiance as a function orientation and inclination of existing parking canopies. As indicated earlier these canopies are facing predominantly either 8° or 83° (with 0° being the due south). Solar radiation analysis was carried out to identify the optimal inclination angle for canopies that are already installed and have these orientations. In order to quickly ascertain the solar potential for a carport as a function of the available orientations and areas within the case study car parking area the PV-GIS [35,48] was used to estimate the amount of solar radiation on various surfaces. The results show that for individual canopies that have an orientation of 8° (either southwest or southeast), the optimal inclination angle is 20° (Figure 11a).
As can be seen from Figure 11, the results of solar radiation do not however vary significantly for inclinations between 0° and 40°. When the inclination is lower than 0° (i.e., canopies facing the opposite direction), the amount of solar radiation drops sharply with the decreasing inclination, and the annual radiation is only 1500 kWh/m2 for canopies that have a slope of −40°. Canopies that have orientations close to 83° are found to be less affected by inclination angle. Although the optimal inclination is 0° (2340 kWh/m2), an inclination of −40° can still receive a considerable amount of radiation at 2020 kWh/m2 (Figure 11a).
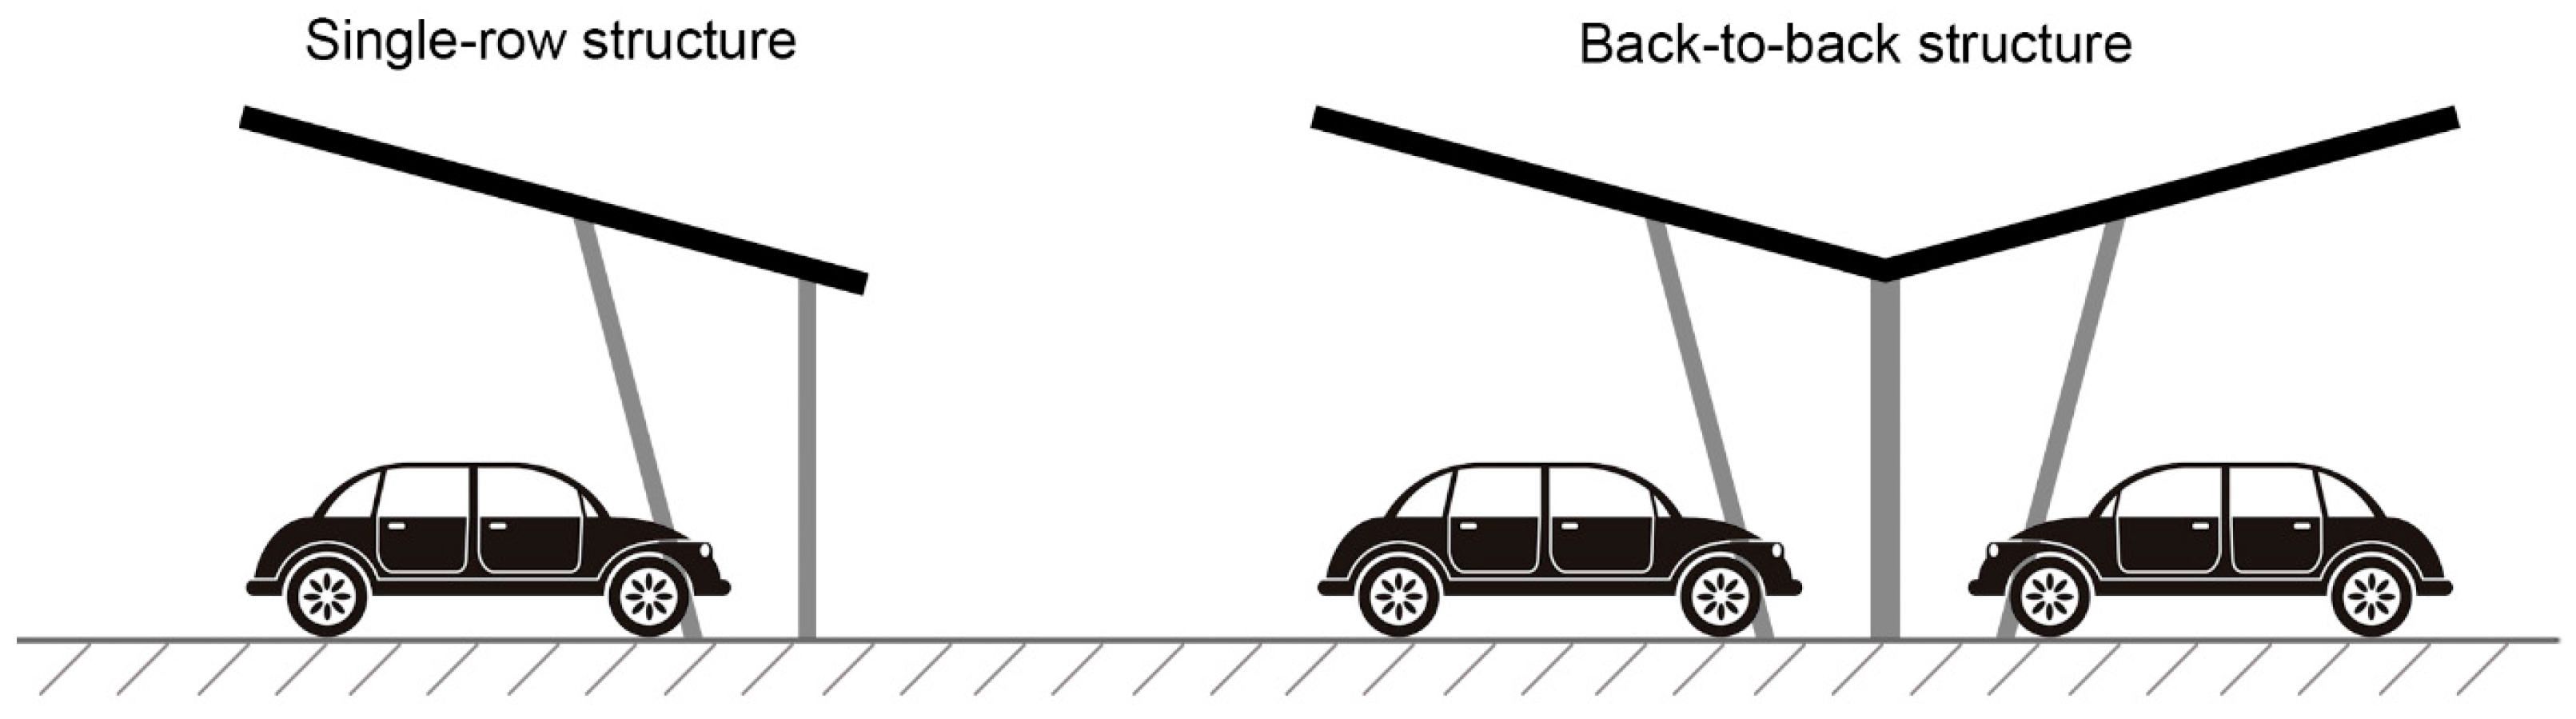
It is important to point out that most of the canopies will be installed with a back-to-back structure, i.e., two canopies joined together (as shown in Figure 12), each facing in the opposite direction. These structures are normally designed to have identical, symmetrical inclinations for both sides, as this is more aesthetically pleasing. Choosing the optimal inclination for such structures would, therefore, require consideration of both sides. The results for such configuration are shown in Figure 11b, where the optimal inclination for maximum solar radiation is always 0° for the two orientations of 8° and 83°.
As evident from the above, having a unified inclination angle for all canopies in the car parks would be more aesthetically pleasing and, due to uniformity, could also result in reduced manufacturing and installation costs. In addition, for the solar panel to work efficiently, the design of the canopies will need to take into account the issue of dust build-up and cleaning it. This will necessitate having the solar panels inclined at an appropriate angle to allow for this to occur efficiently. Hence, for the back-to-back canopies, a unified inclination angle of 20° has been chosen. This is a compromise from the 0° inclination where the maximum solar irradiance occurs. Such an inclination would also prevent rainwater or dust from building up on top of canopies, maintaining a cleaner surface for solar gain.
To summarise, our consideration for the size and orientation have settled on the following: (a) 17 m2 is used to represent the size of ground space of a typical car port; and (b) a 20° inclination, resulting in a total roof space of 18.1 m2. This assumes a 275 Wp crystalline PV module (size 1.6 m2) with an efficiency of 20% This area is sufficient to accommodate a 2.75 kWp solar PV array.
3.3.4. Available Parking Areas and Potential of PV Deployment Capacity
In order to estimate the overall potential energy yield from the implementation of PV arrays on car parking, consideration must be given to the parking areas currently shaded and unshaded. This will provide the University with a clearer picture of the potential and its impact on campus energy consumption.
Figure 13 depicts a graphical representation of the KAU campus and shows the unshaded car parking areas (coloured pink) as well as car ports that already have canopies installed (shaded). Currently, the shaded parking areas have cloth type canopies (see Figure 2). According to the KAU masterplan (Figure 13), 0.7 km2 of the campus is designated to buildings and approximately 0.6 k m2 (594,611 m2) or 8% of the campus footprint is for car parking.
A large proportion of the designated car parking areas have been installed with cloth canopies (Table 2), and currently about 193,615 m2 of car parking areas remain un-shaded. These areas can be directly utilised for PV arrays as canopies to provide shading.
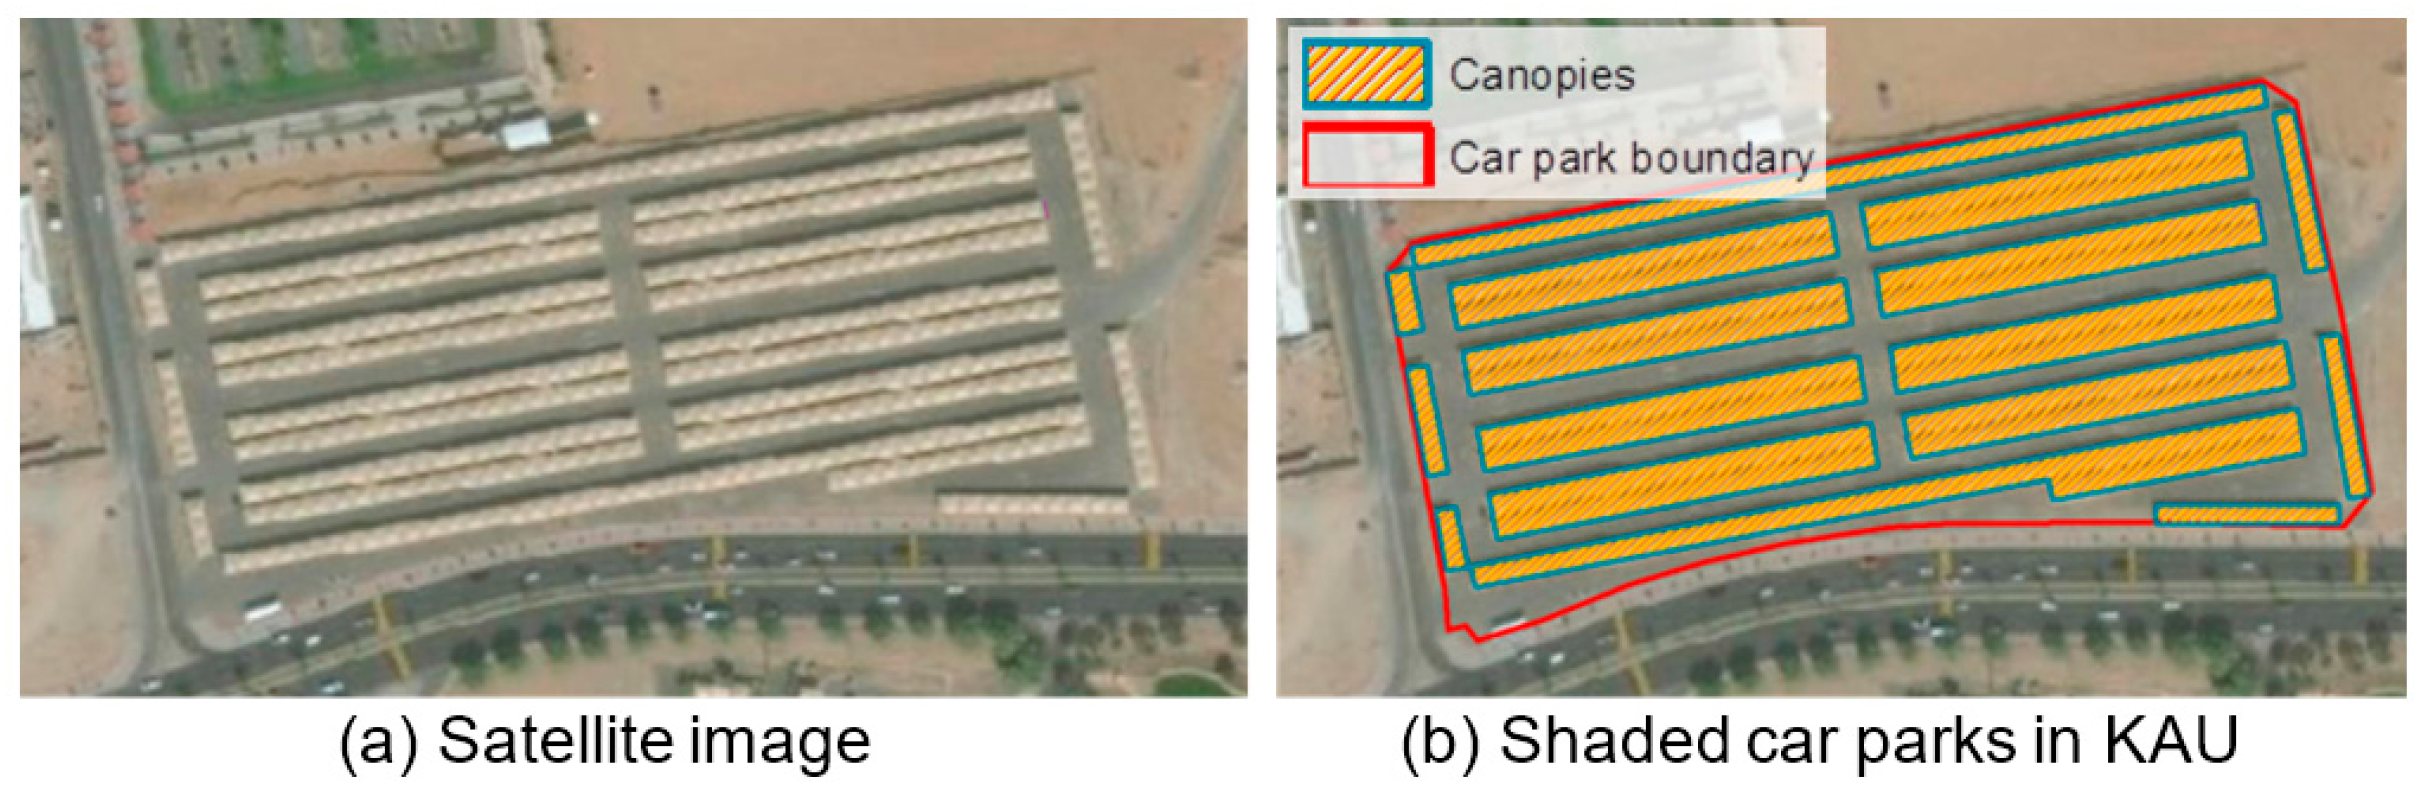
It must be noted however, that the shading infrastructure (PV or otherwise) does not occupy the whole physical footprint of the dedicated car parking areas, because space is needed to position foundations, to install and maintain canopies and, more importantly, for car/occupier access and manoeuvring. Such requirements are illustrated in Figure 14, which shows a car parking area with canopies and the surrounding areas. We have used the developed GIS to estimate the footprint of the shaded fraction of these areas, termed as utilisation factor. For the figure shown, we estimate the utilisation factor of the shaded footprint is approximately 53.7% which is the highest found in the analysis. It must be noted that this factor varies between parking areas, and we used the GIS to arrive at an average value (31%) for the shaded car parking areas in the campus.
For the unshaded areas, we assume a value of 50%, which is appropriate as the engineering design will achieve such a target for the whole unshaded areas of the campus. By developing both the shaded and unshaded areas for PV deployment, we estimate a combined utilisation factor of 37% (Table 3).
The results of these considerations are summarised in Table 3. In the table, and from the GIS, we define specific polygons with the attributes of each parking slot. This provided an automatic count of the currently shaded parking slots of 6772. For the unshaded areas we used the 50% utilisation factor and the typical size of existing slot (17 m2) to arrive at the estimated number of car parking slots of 5796 (Table 3).
For the unshaded areas, we estimate that a PV capacity of 16.1 MWp can be deployed on these areas, and in addition, for existing canopies, we estimate that these would deploy a PV system of over 20.3 MWp. We appreciate that the already shaded areas may present a difficulty in deploying PV within the current structure. However, our study has considered options for such deployment using current structure and foundations but possibly using lighter PV modules. Overall, car parks in the KAU campus have the potential of deploying around 36 MWp of PV capacity.
3.3.5. Dynamic Simulation and Energy Yield
This section covers the approaches and results obtained from the dynamic simulation (TRNSYS) and PV-GIS. A comparison of outcomes is also included to provide an indication of how these approaches fared in their consideration of the energy yields from the estimated deployable PV systems.
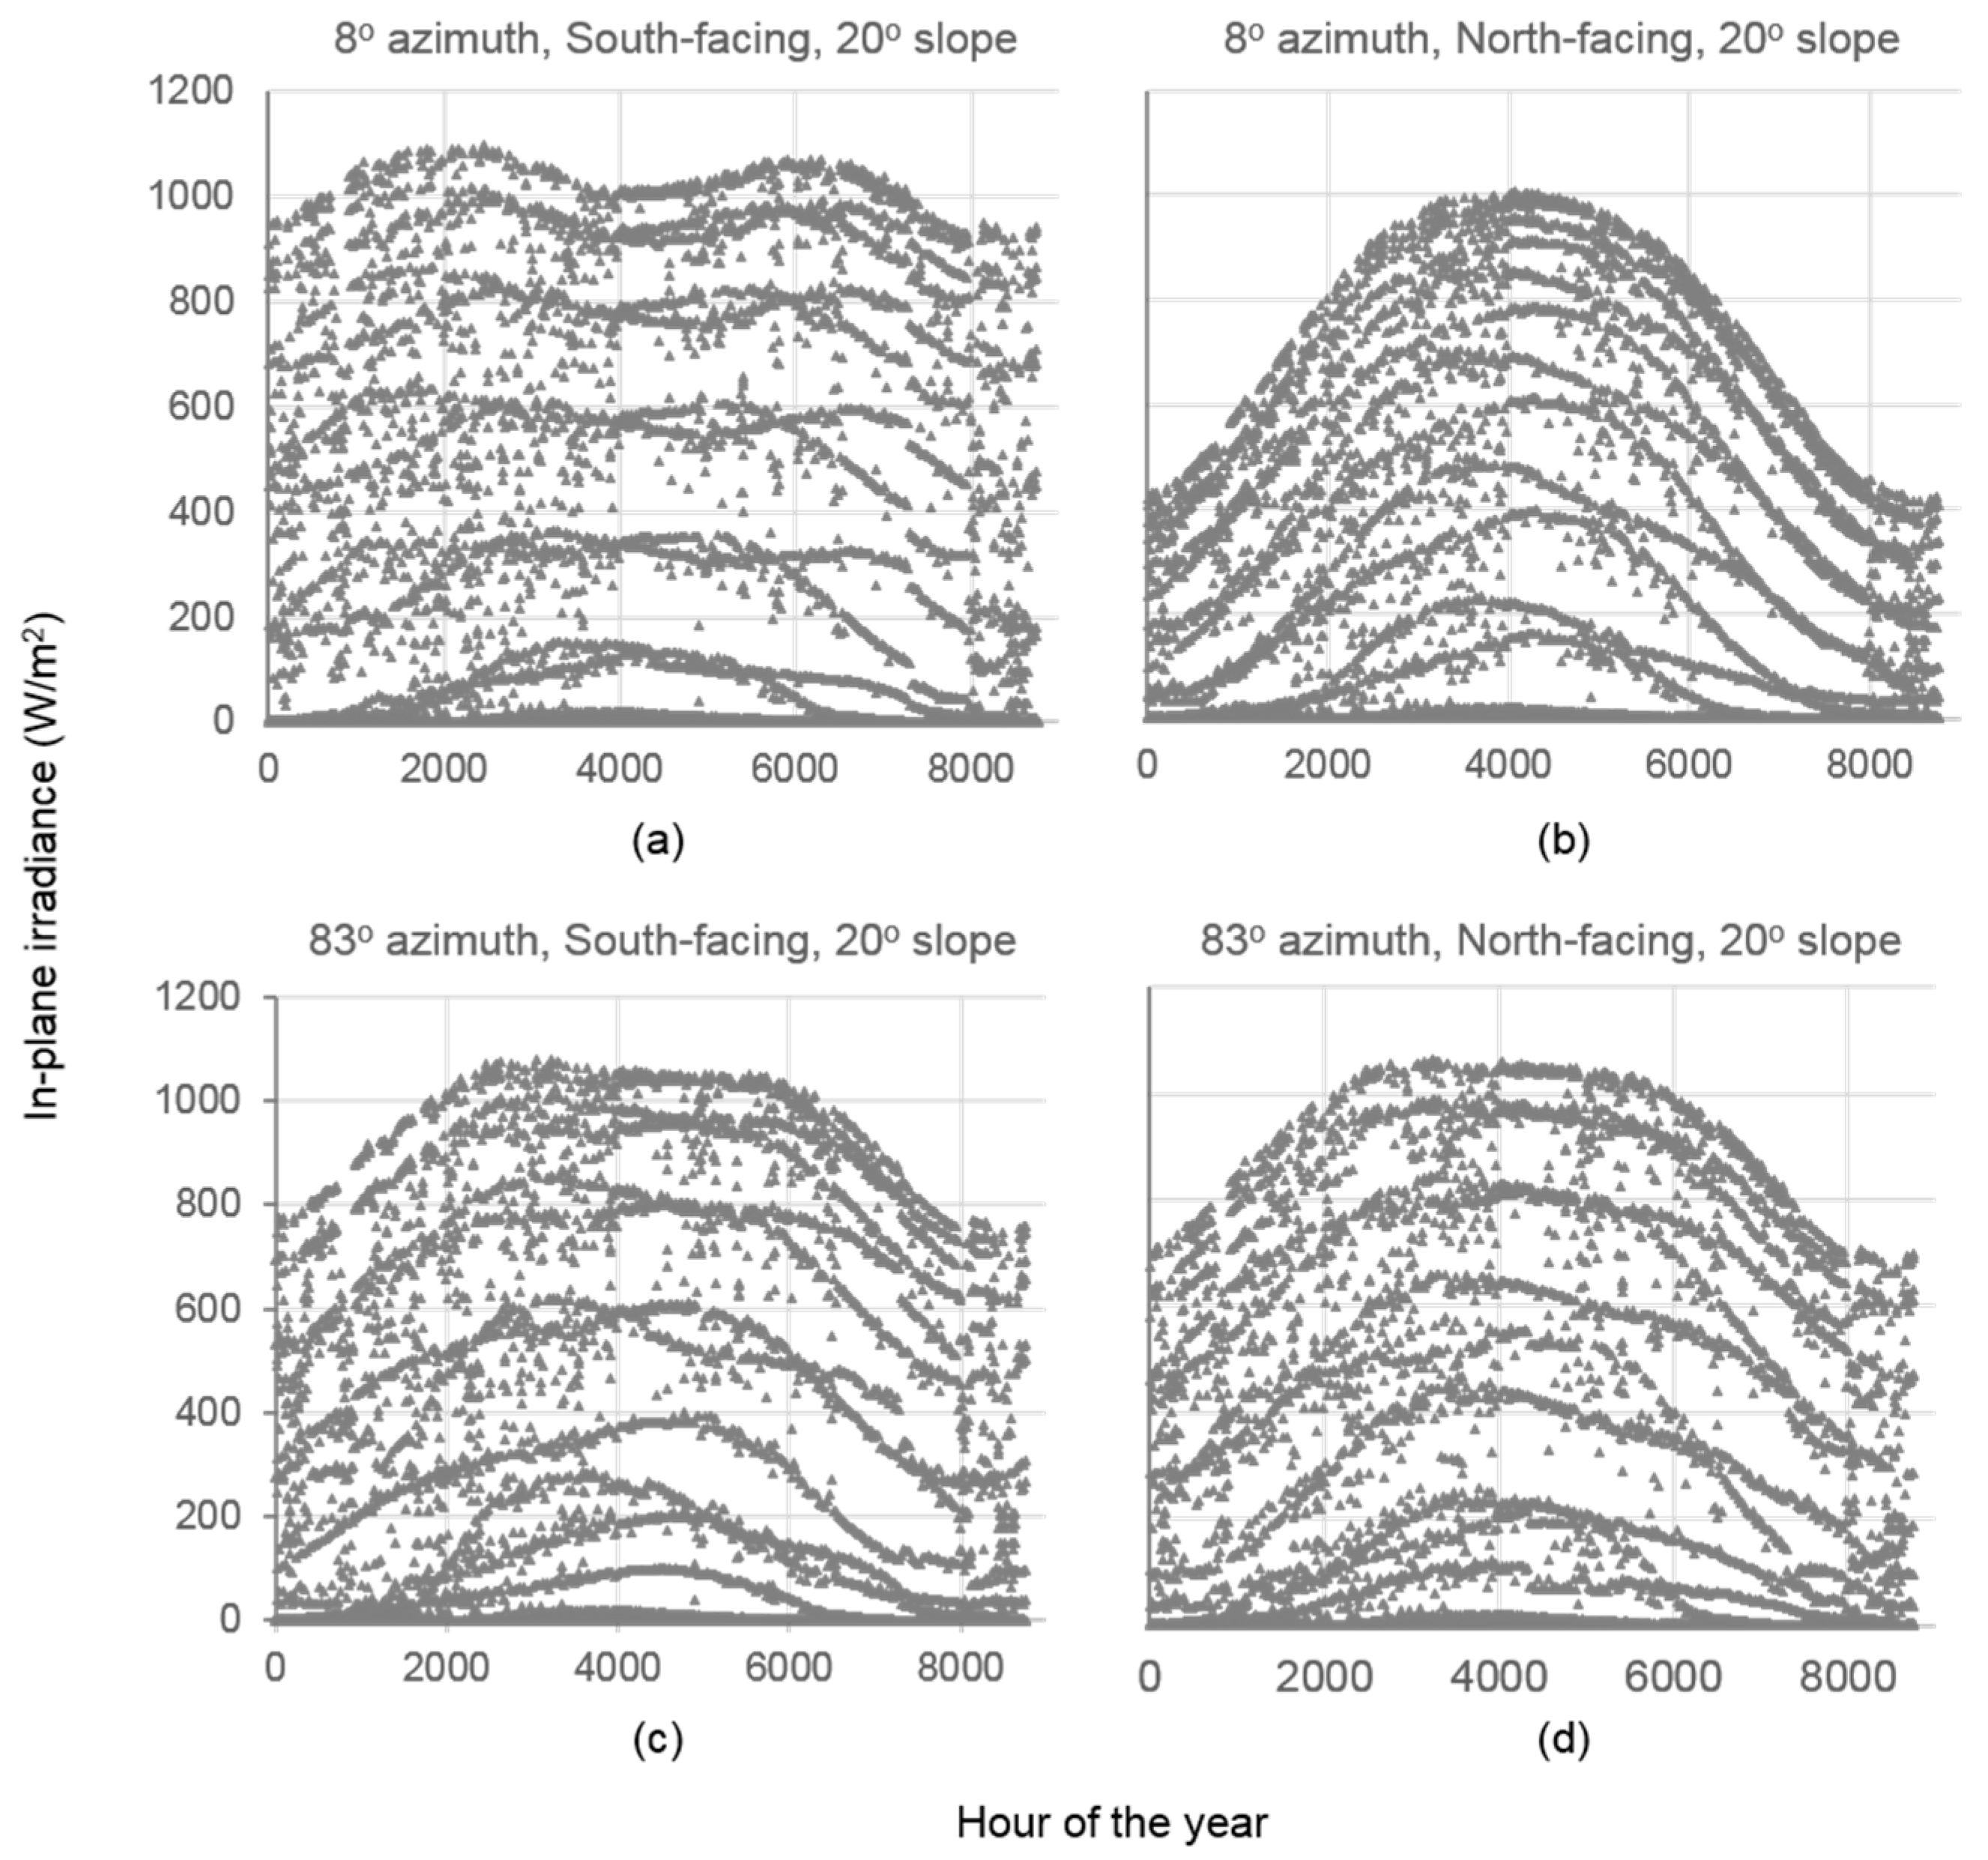
To estimate the performance ratio of the proposed PV carport canopy, a dynamic simulation was undertaken using TRNSYS (version 17) [36,37], and its accuracy has been well tested and documented in numerous studies such as [38,49,50]. In our simulation, the Riyadh EnergyPlus weather (epw) file (404380_IWEC) was used as input to the monocrystalline PV module model within TRNSYS (Type 94a). The in-plane solar irradiance received by the PV systems at various geometric settings–(see Section 3.3.3) was calculated from the weather file using a Reindl based model [36,37] within TRNSYS (Type 15-3), as shown in Figure 15.
The TRNSYS dynamic simulation calculates the module temperature at each timestep (hour) alongside the maximum power point output (MPPmax) of the module and form factor, (FF) as given by:
where is the open circuit voltage, and is the short circuit current.
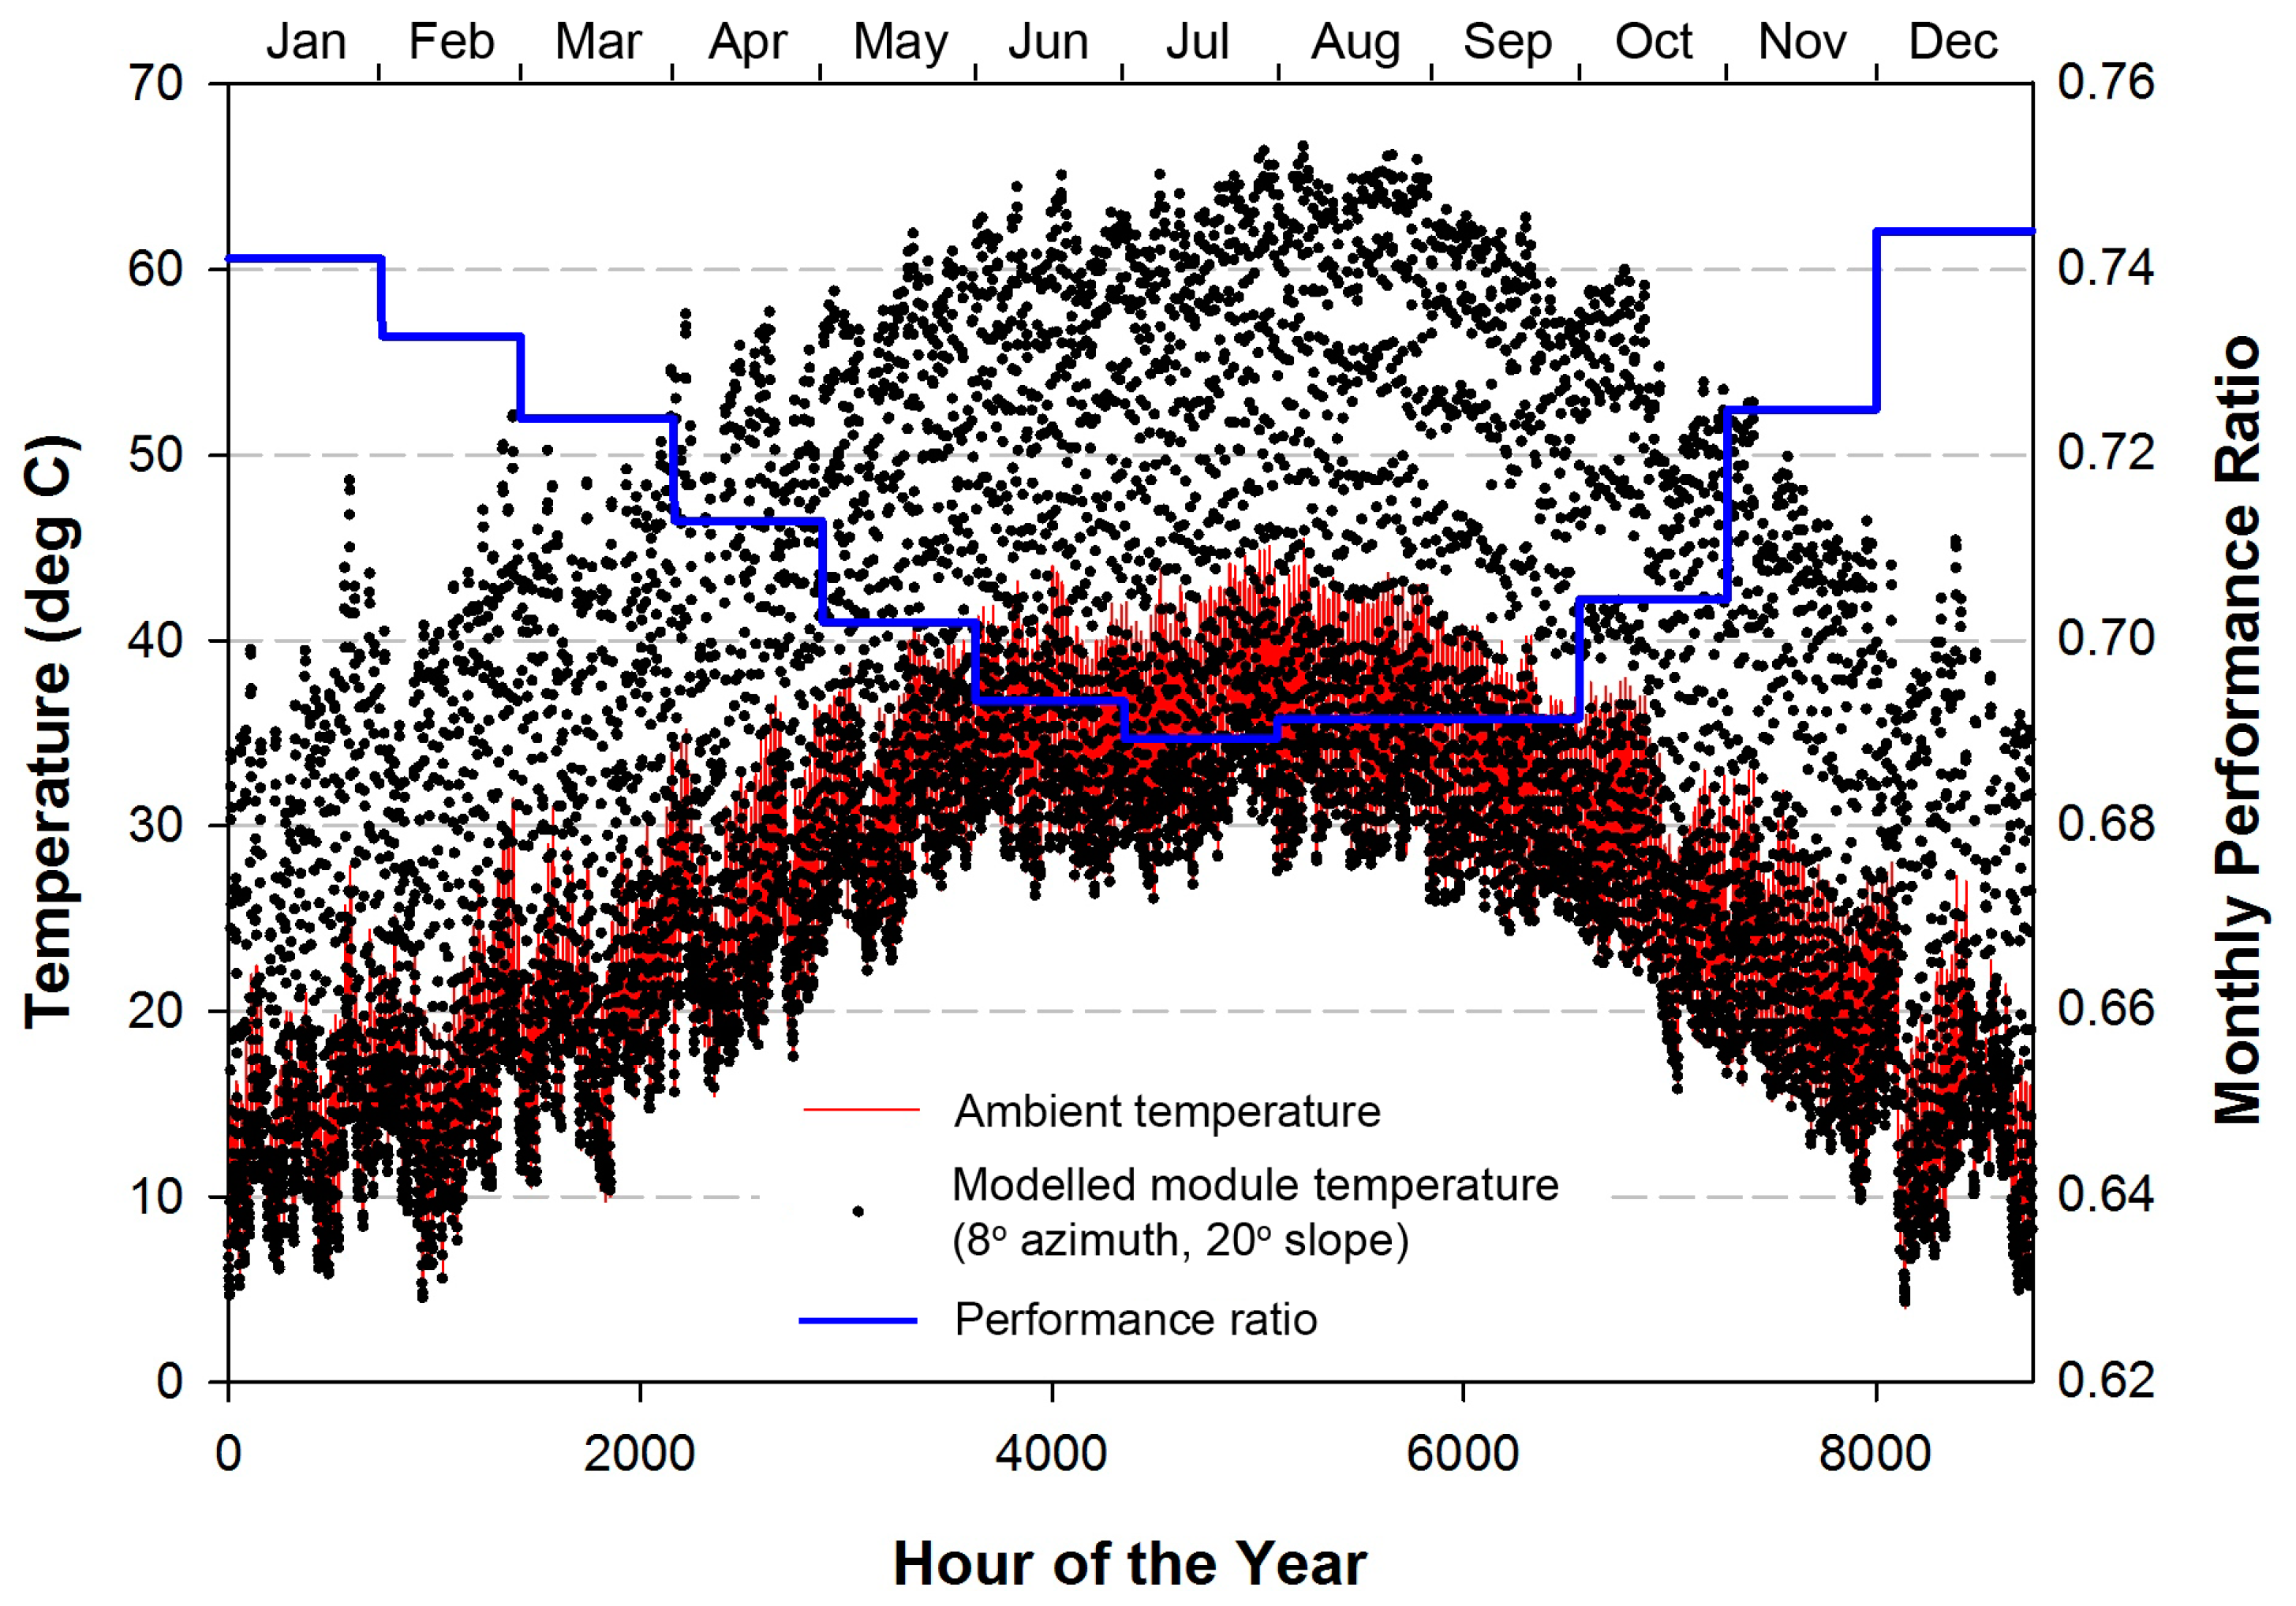
Figure 16 shows the ambient temperature (from the weather file) and the TRNSYS modelled module temperature over the year. The peak modelled module temperature was 67 degrees Celsius occurring in August, representing a rise of 42 degrees from Standard Test Conditions of 25 °C. As shown in Figure 16, this causes significant variation in the performance of PV system where the monthly performance ratio of PV systems is the lowest (under 70%) in summer months (June to September). The highest performance ratio is found to be over 74% in December when the ambient and module temperatures are the lowest in the year.
The results obtained from TRNSYS in terms of irradiance and energy yield and those from PV-GIS are shown in Table 4. Both simulations use the same input parameters including inverter efficiency, of 95%, dc cable losses, at 3%, dust and reflection effect at 2%, and other losses such as mismatch at 1%) were use. As can be seen from Table 4, the results show good agreement for estimating the annual irradiance on and electricity generation (energy yield).
It is clear from Table 4 that the estimated energy yield (electricity generation) from PV-GIS is 8% smaller than that obtained from the dynamic modelling of TRNSYS. Hence, analysis of the overall electricity generation potential for the entire case study campus were conducted using the results from the dynamic modelling of TRNSYS. Since the vast majority of carports deployed will be using back-to-back structure (see Figure 12 in Section 3.3.3) with azimuth of either 8° (southeast) or 83° (southwest), the average electricity generation potential per kWp of PV is estimated to be (1907 + 1733)/2 = 1820 kWh per year.
Based on results presented in Table 4, the unshaded areas in the case study campus have a PV install capacity of 16.1 MWp, which is estimated to generate a total amount of electricity at 29.3 GWh/year. In addition, for existing shaded canopies, the PV install capacity is estimated to be over 20.3 MWp, providing a potential electricity generation at 36.9 GWh/year. Overall, car parks in the KAU campus have the potential of deploying around 36.4 MWp of PV capacity, which can generate approximately 66.2 GWh of electricity per year. According to the latest energy consumption data provided by KAU, the campus consumed 469 GWh of electricity in the year of 2014. This means that the deployment of solar PV on carports in the campus will reduce the electricity demand of the campus by approximately 14.1% annually at the 2014 demand.
3.3.6. Case Study Economic Assessment
The cost of large-scale PV deployment can vary considerably due to a large number of factors, and, in the UK, the overall installation cost for community-scale PV systems is likely to be around £1134 to £2253 per kilo-watt of installation [51], equivalent to USD 1735 to 3447, or SAR 6498 to 12,910 per kWp installed. It is important to note that currency exchanges in this research are provided by using the mean exchange rates of GBP to USD or SAR for the year of 2015, namely 1 GBP(£) = 1.53 USD ($) = 5.73 SAR. However, the costs in [51] are out-of-date and recent installation costs in the UK on average were down to £800/kWp. Hence, our analysis used this reduced figure, which is equivalent to USD 1224 or SAR 4584. The overall installation cost for the PV carport development is therefore, estimated to be USD 44.5 million or SAR 166.8 million.
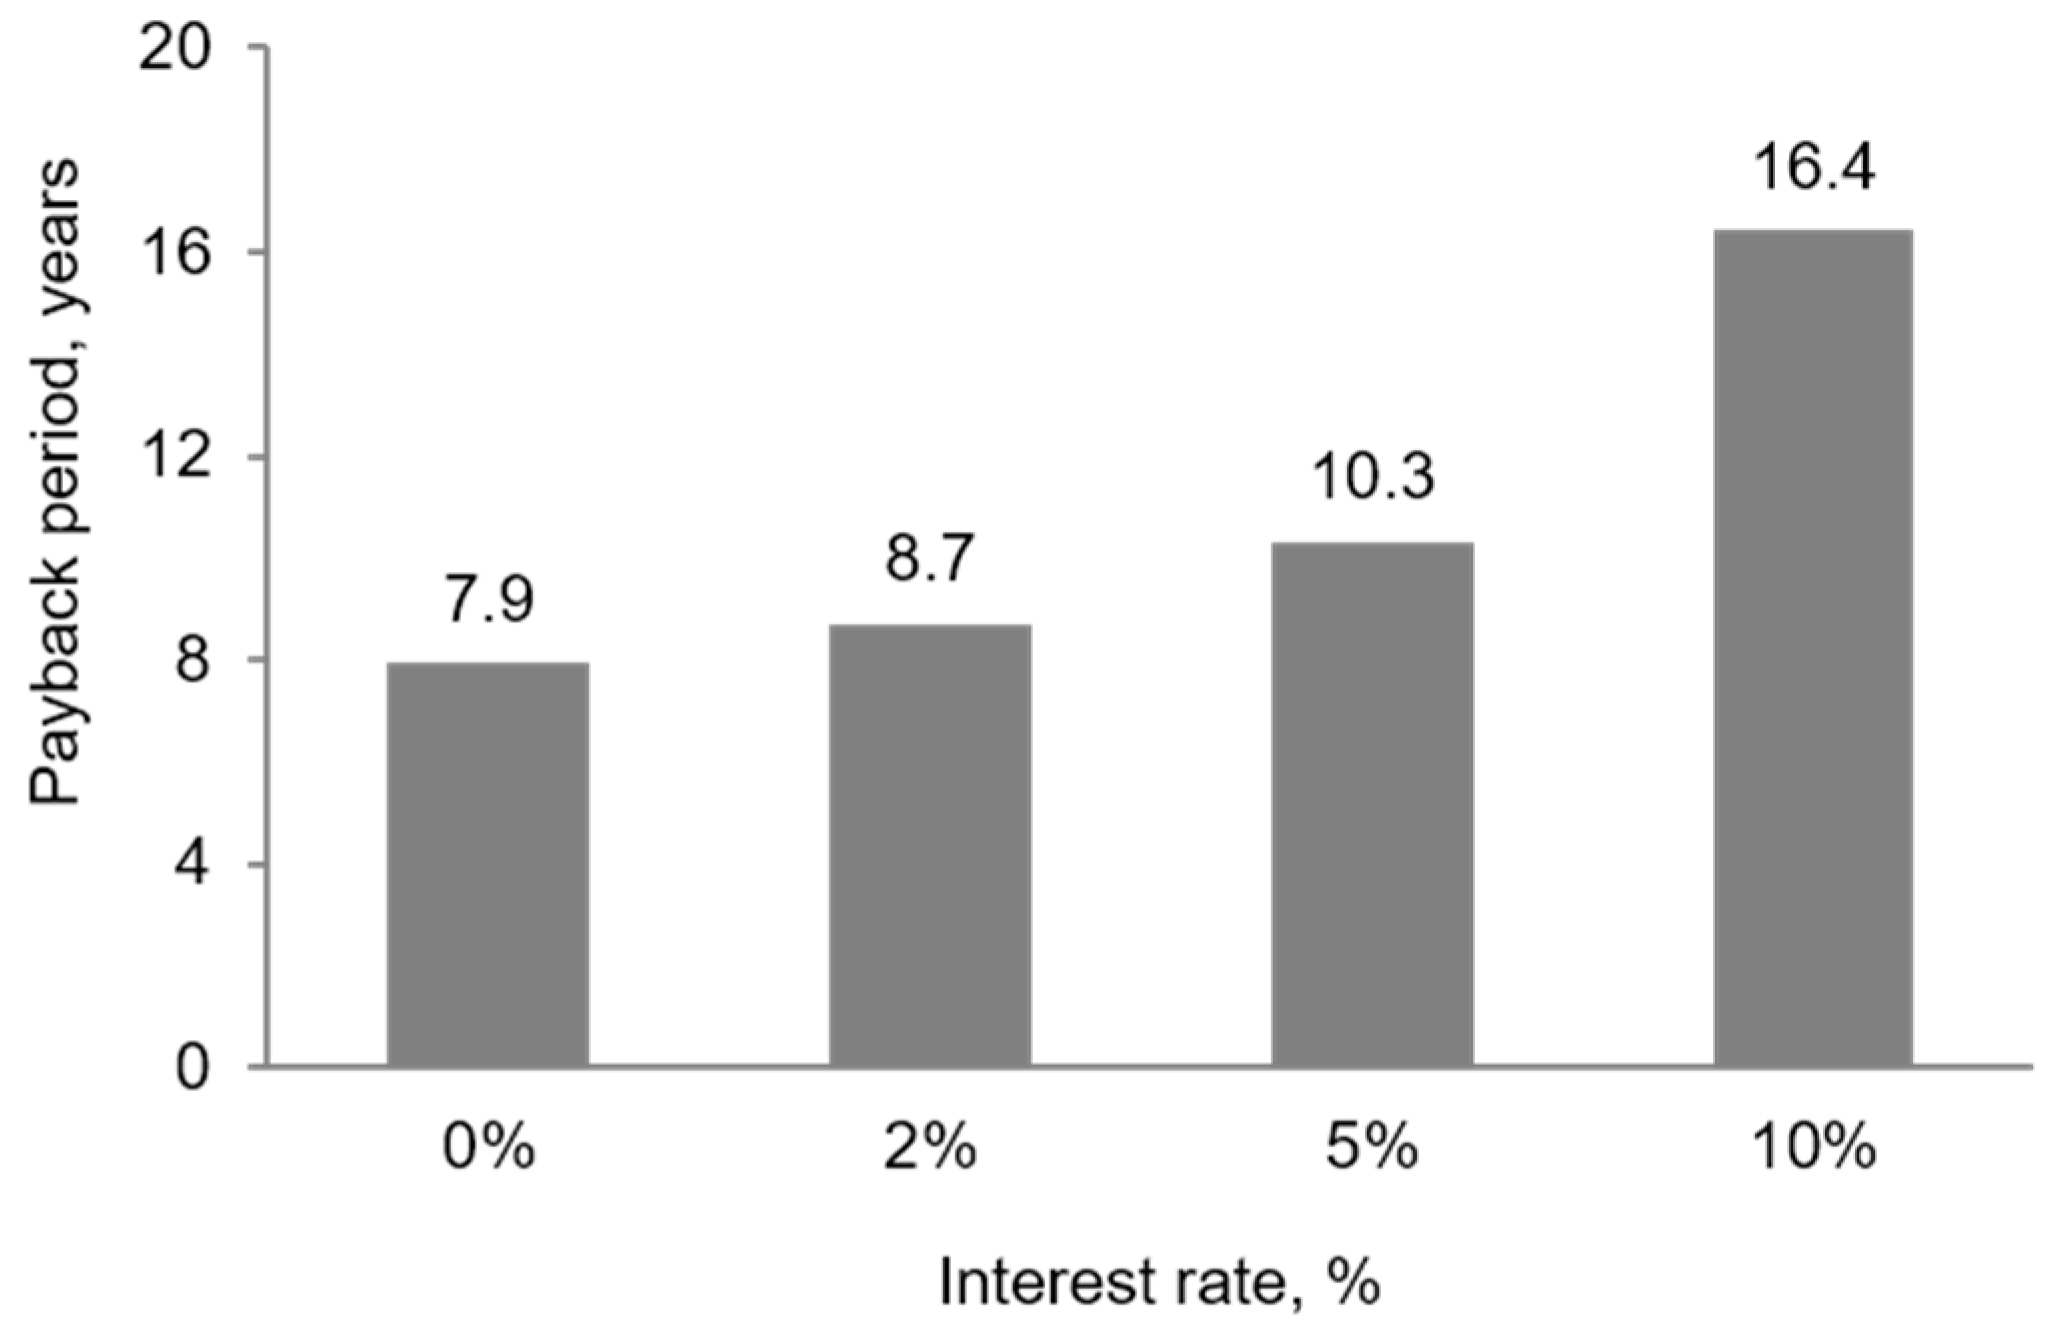
KAU currently pays a fixed rate of electricity import of 0.32 SAR per kWh, (USD 0.085). In 2014, the campus spent 122 million SAR on the purchase of electricity (previous rate at SAR 0.26). There is however, no feed-in tariff scheme in Saudi Arabia to provide financial support for electricity generated from renewable sources. Therefore, the economic benefit of PV deployment on campus can only be derived solely from the avoidance of the cost of electricity import. In order to arrive at the payback period for the investment for PV deployment, four different interest rates—0%, 2%, 5% and 10% were chosen, and the results are given in Figure 17. For these rates, the payback period varies in the range of 7.9–16.4 years. This should be reflected in relation to PV systems lasting at least 25 years. Furthermore, and during this period, the cost of electricity is more than likely to increase coupled with a market in which the cost of PV continues to fall. These factors combined will further reduce the payback period.
3.3.7. Case Study Conclusions
Harnessing the enormous Saudi solar resource for power production could provide new job opportunities and growth. It could also provide the necessary electrical capacity to support the projected increases in consumption and alleviate the current reliance on fossil fuels. According to the King Abdulaziz University’s masterplan, approximately 8% (0.6 km2) of the campus footprint has been assigned for vehicle parking, which is remarkably similar to the area currently assigned as campus buildings. Such designated parking regions provide enormous surface areas for utilising PV, which can fulfil the dual role of shading and power production for the campus.
Our analysis indicates that around 200,000 m2 of car parking areas currently have not been shaded with the normal cloth system. These areas can be utilised directly to provide PV shading canopies for over 5000 parking spaces. The total PV capacity that can be installed using these areas is estimated to be 16.1 MWp, which can generate over 29.3 GWh of electricity per year. Furthermore, currently over 400,000 m2 of car parking areas have already been installed with cloth-based shading canopies. In our view, these canopies can also be utilised for solar shading, but either using lighter weight PV modules or adapting the infrastructure to support the normal heavier glass based modules. If this is accepted, our analysis indicates that the current areas with canopies will have a total PV capacity of approximately 20.3 MWp, which can potentially generate around 36.9 GWh per year. Hence, for the KAU campus, we estimated that overall, car parking areas will have a potential deployment of PV systems with a capacity of approximately 36.4 MWp generating around 66.2 GWh of electricity per year.
The cost of large-scale PV development can vary considerably. Using installation cost of £800/kWp (USD 1224 or SAR 4584 per kWp) obtained from recently completed projects in the UK, we estimate that the overall installation cost for the total installed PV capacity on carport areas to be USD 44.5 million or SAR 166.8 million. However, the £800/kWp cost is more than likely to be less in Saudi Arabia due to the large PV capacity to be deployed within KAU and due to cheaper labour costs. It is important to note that for PV systems, the cost for maintenance will need to be considered as part of the overall investment. In our consideration, the £800/kWp cost includes maintenance and inverter replacement. The latter is estimated to be replaced every 10 years.
For the payback period and for the four interest rates investigated, our analysis indicates that this will be in the range 7.9–16.4 years at the current cost of electricity paid by KAU (0.32 SAR/kWh or USD 0.085/kWh). This range should be reflected in relation to PV systems that should last at least 25 years, during which the cost of electricity is more than likely to increase, coupled with a market in which the cost of PV is always declining. These factors will undoubtedly reduce the payback period further.
As there is no feed-in tariff scheme in Saudi Arabia the economic benefit of PV electricity such as what proposed here will be solely from the avoidance of electricity import. Due to this, our recommendation is that in the interim, KAU utilises the electricity generated from PV systems to displace electrical imports from the grid as this option provides the best economic case-having a value of 0.32 SAR per kWh, equivalent to USD 0.085.
4. Economic Considerations
One concern related to such large-scale deployment is the financial competitiveness of the investment needed. Therefore, it is instructive to consider recent large-scale deployment of PV globally but especially in the Middle East. Projects of this kind are regularly evaluated for return on investment in terms of a “bid tariff” that can be set per unit of electricity generated by the development and exported to the national grid for a fixed number of years. Such export tariffs takes into account a number of factors as shown in Equation (2):
where is the return of investment (ROI), denotes the number of years after the commissioning of the project, denotes the expected lifetime of the system, is the unit cost of electricity import (USD/kWh), is the amount of electricity generation of each year (kWh), represents other financial incentive for electricity generation from PV systems such as feed-in tariff (USD), and is the total cost of investment of the solar carport systems.
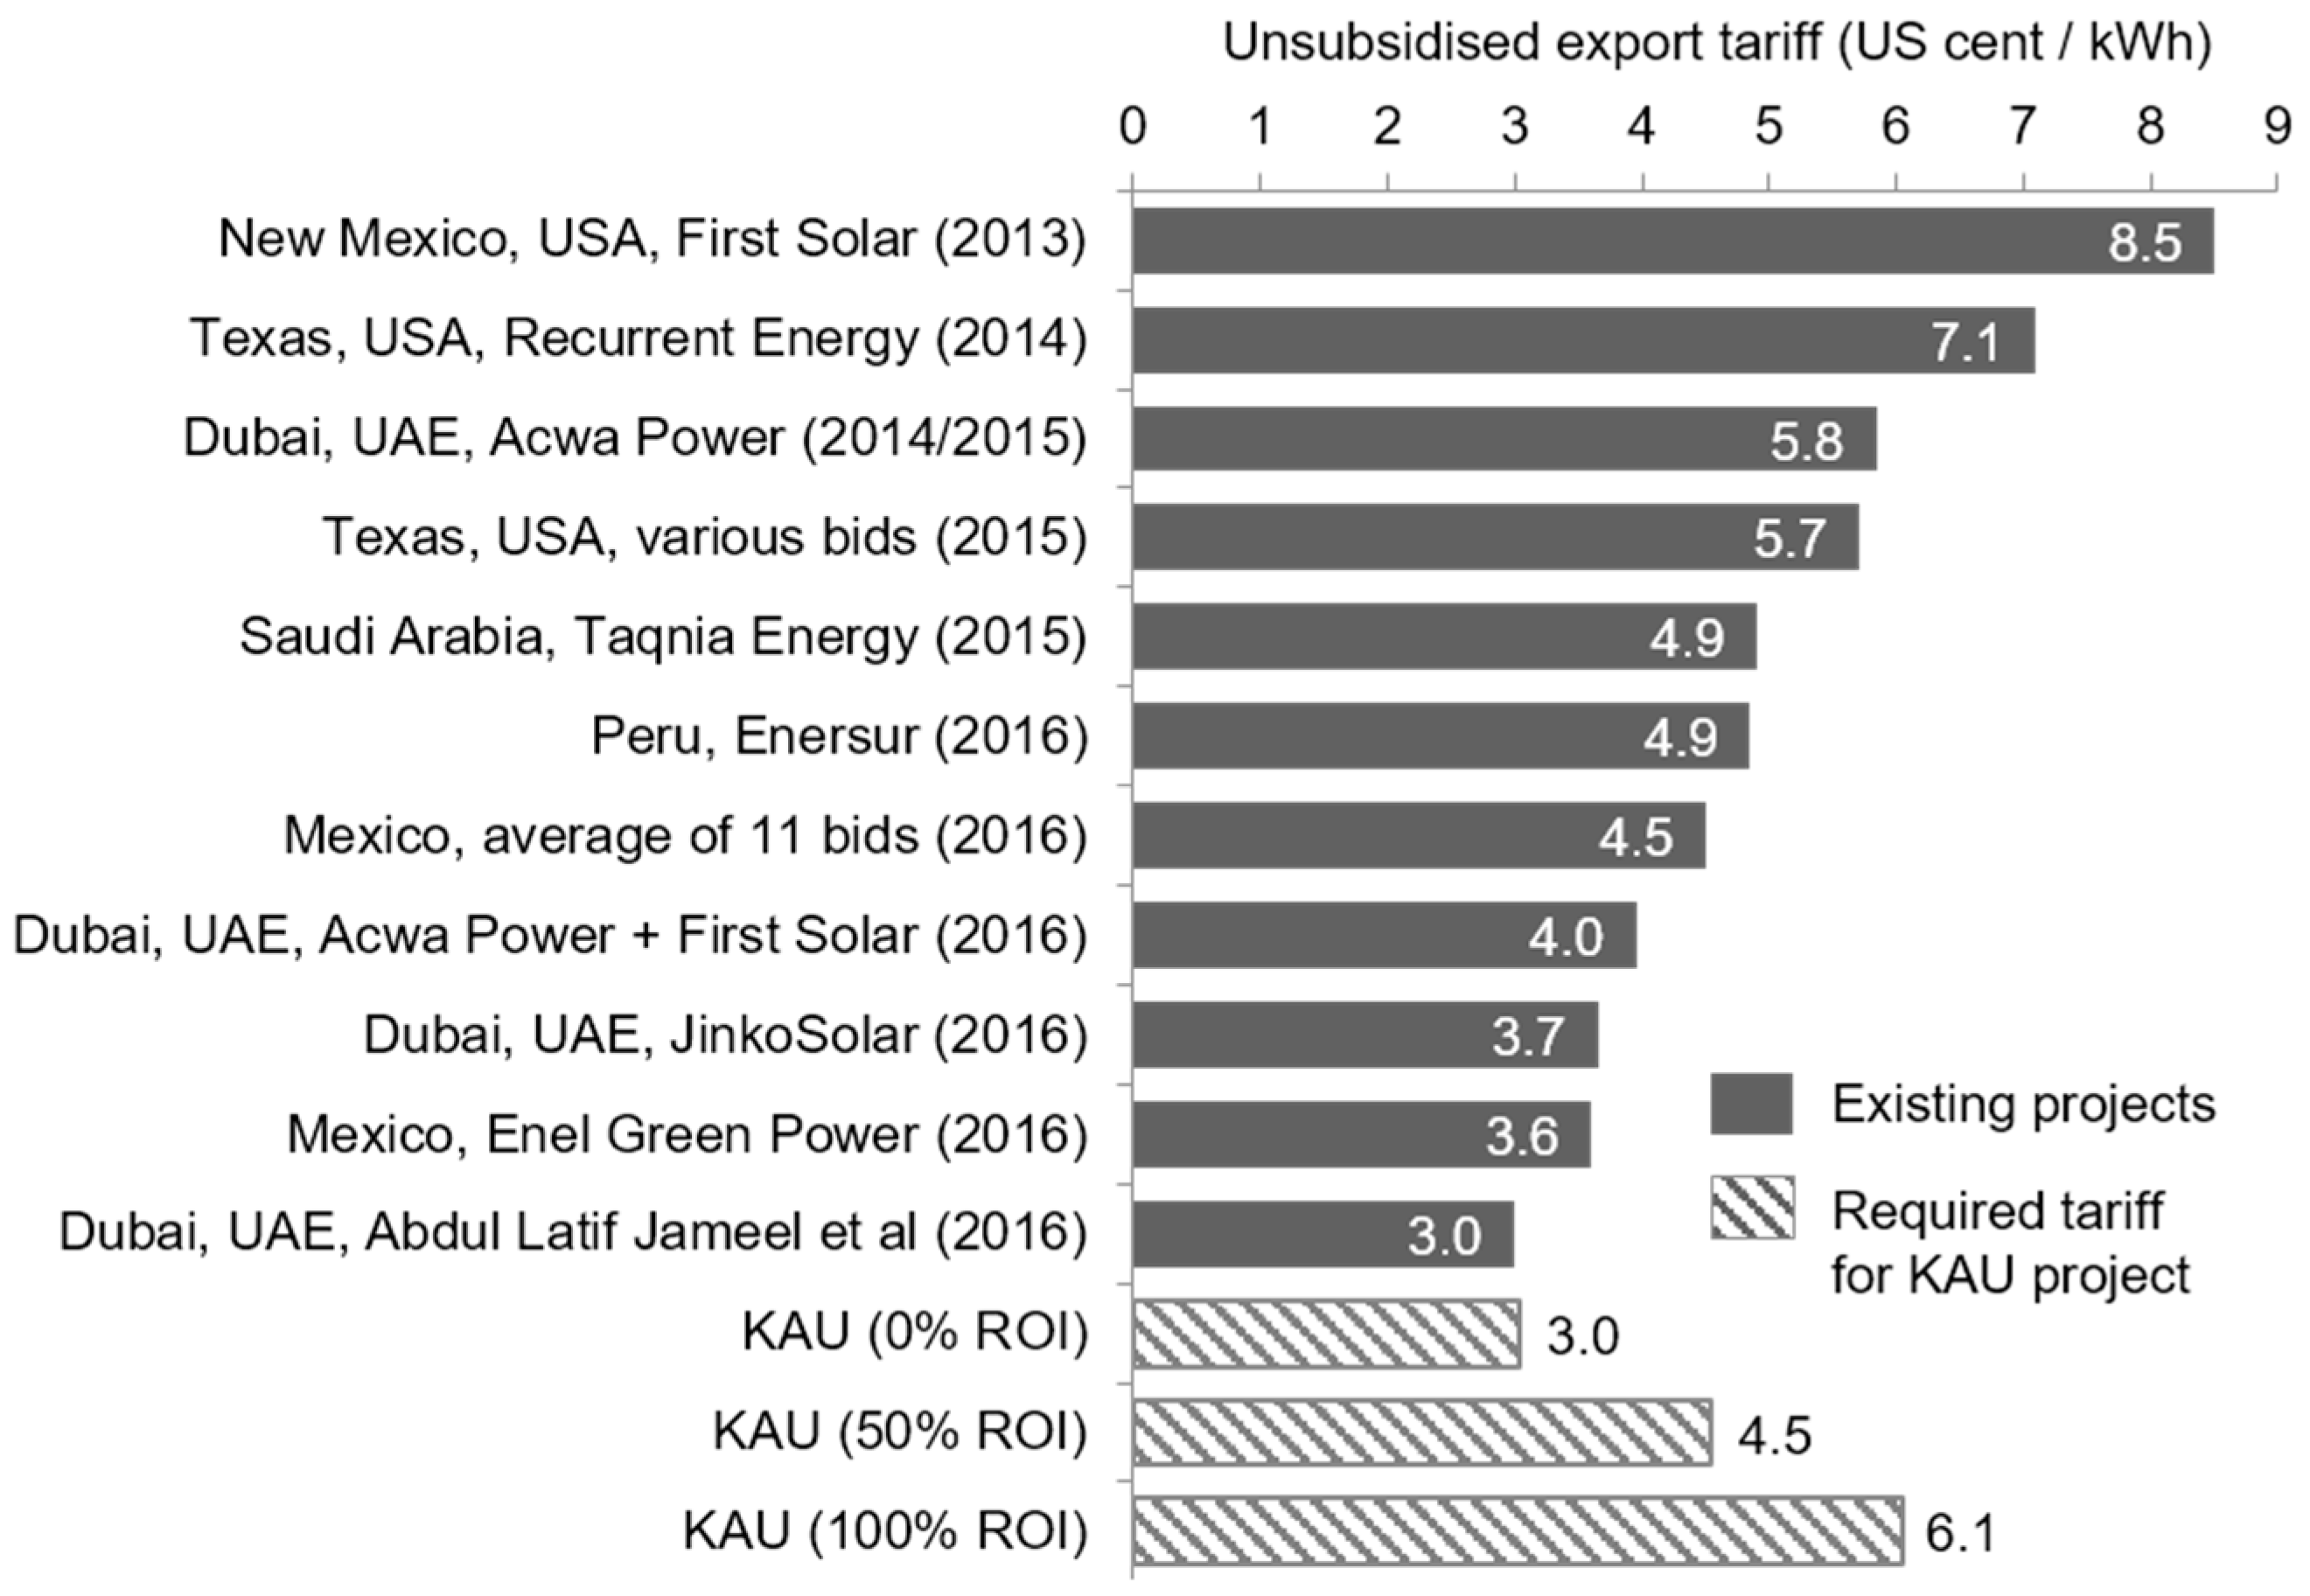
In this research, we consider now the international approach for bidding for PV project to deliver electricity as a certain price–bid price. This can be thought off as adopting an export tariff scheme for the KAU solar PV carport case study discussed above. For this case, the investment () is estimated earlier is approximately USD 44.5 million. The lifetime of the system () is estimated to be 25 years, and during this period no additional financial incentives are considered, so . It is further assumed in our analysis that the deployed PV systems will have capacity losses at a fix rate of 1% per year over the lifetime of the system [52,53,54]. This means the initial electricity generation of 66.2 GWh for the year one will reduce to 52.0 GWh by year 25. Using Equation 1, the required export tariffs for different return of investment (ROI) projections are shown in Table 5. The results indicate that in order to recover capital cost of the PV deployment with no return on investment the tariff for electricity export will need to be around USD Cent (¢) 3.03 for a period of 25 years. For a 50% and 100% return on investment, the required export tariffs will be USD ¢4.54 and USD ¢6.05 per kWh respectively.
Such levels of tariffs are compared with those reported from existing PV projects shown in Figure 18. The results show that the PV generation tariff has considerably decreased over the past three years from over USD ¢8.5 per kWh in 2013 to only USD ¢3.0 per kWh in 2016. The comparison shows the export tariffs requirement for the PV deployment for the KAU campus case study are higher (hashed in Figure 18) than tariffs used by existing PV projects in the Middle East region. This is undoubtedly attributed to the higher cost/kWp taken here arising from the UK experience for PV deployment at much smaller scale than that used for the projects mentioned in Figure 18.
As previously mentioned, we feel that the USD 1224/kWp (£800/kWp) will be less due to the large PV capacity to be deployed in KAU and due to cheaper labour costs in Saudi Arabia. For the KAU case study project and for the same assumptions as before, our analysis indicates that the cost per kWp will need to be around £500 (equivalent to USD 765 or SAR 2865) to provide a 50% return on investment over 25 years. In this case, the investment will be around USD 27.8 million and the export tariff cost will be USD ¢3.3.03–6.05/kWh which compares well with the latest granted bid in the Dubai’s Sheikh Maktoum Solar Park Phase III Abdul Latif Jameel project [11,55].
It is also worth noting that due to the fact that the considered carport areas are in close proximity to the loads in city, the power generated could also be stored strategically to provide local power and perhaps balance to the grid. Such adoption will be feasible due the development of new storage technologies creating a further advantageous investment through time of use tariffs and adaptation of smart grid opportunities that will undoubtedly arise in the near future.
Furthermore, it is important to note that investment for carport-mounted PV systems is likely to be more expensive than that of ground mounted PV systems due to comparatively more complicated deployment of the structure and its additional cost in urban areas. Nevertheless, there are additional significant indirect economic and social benefits from such deployment in cities. Firstly, carport canopies will provide shading to vehicles parked underneath, which contributes to the cooling demand of vehicles and in turn reduces the electricity consumption due to usage of air conditioning [24]. This effect is specifically significant in tropical and subtropical climate regions where such shading is provided through another system, which can be replaced with PV. Secondly and unlike other large-scale PV deployment, canopy structures provide additional protection to drivers, others walking under such canopies as well as the vehicle against extreme weather conditions, improving wellbeing and providing comfort. Furthermore, the utilisation of open car parks for PV deployment shows how renewable energy systems can be integrated into building-dense urban environment. The scale will not only provide considerable power generation, but also opportunities to offset energy import by large-scale organisations.
5. Overall Conclusions
Car parks which cover substantial areas surrounding many institutions including university campuses, colleges, schools, hospitals, large industrial units, shopping malls, large arenas and businesses. Such areas have great potential to integrate solar PV systems, contributing to electrical power services geared to support local loads or for export to the grid.
In this work, we presented our analysis for a large-scale PV deployment in a university campus where the dedicated areas for car parking cover 8% of the campus footprint which is similar to the reported the 6.6% car parking footprint in cities [23]. The analysis presented here will contribute to the exploitation of these areas to provide sustainable energy through a dual role for photovoltaic technologies–power production and solar shading. Such areas are deemed to be of large scale and are underutilised. Deploying PV at such sites will have power outputs that large enough to contribute to national renewables and low carbon targets. As these areas are mainly closer to the loads they can be combine with storage to provide balance to the grid at advantageous tariffs. In addition as the cost of PV is declining, e.g., recent projects in Chile at bid price of USD ¢2.91/kWh [56], such areas in addition to environmental benefits, can provide important investments portfolios to deliver power at cost less that fossil fuels drive electrical energy.
Finally, this work was geared to provided methodology and evidence to accelerate the deployment of renewables in new, underutilised areas in urban environments. We feel that the scale of such deployments will contribute to international development targets, especially those under the Sustainable Development Goals, (Goals 7, 11), which also aims to “make cities and human settlements inclusive, safe, resilient and sustainable” by 2030 [57]. The developed approach and analysis will therefore be beneficial to cities, planners and other researchers interested in this field.
Acknowledgments
This work is part of the activities of King Salman bin Abdulaziz Chair for Energy research at King Abdulaziz University (KAU), KSA. The fund was provided jointly by the KAU Vice Presidency for Projects and the Chair for Energy Research in KAU. The investigation was performed in collaboration with the Energy and Climate Change Division and the Sustainable Energy Research Group at the University of Southampton, UK, (www.energy.soton.ac.uk).
Author Contributions
The authors contributed equally to the paper including data gathering, modelling, analysis, discussion of the outcomes and the conclusion. More specifically, Abdulsalam S. Alghamdi led this research project, obtained essential research data and campus analysis; AbuBakr S. Bahaj covered the work on potential of PV systems and conducted economic impact analysis; Yue Wu undertook GIS analysis of the case study area; all authors contributed to the writing and revision of the manuscript.
Conflicts of Interest
The authors declare no conflict of interest.
References
- World Urbanization Prospects: The 2014 Revision, Highlights (ST/ESA/SER.A/352); United Nations Department of Economic and Social Affairs Population Division: New York, NY, USA, 2014.
- Bailey, R.; Longhurst, J.W.S.; Hayes, E.T.; Hudson, L.; Ragnarsdottir, K.V.; Thumim, J. Exploring a city’s potential low carbon futures using Delphi methods: Some preliminary findings. J. Environ. Plan. Manag. 2012, 55, 1022–1046. [Google Scholar] [CrossRef]
- Byrne, J.; Taminiau, J.; Kurdgelashvili, L.; Nam, K. A review of the solar city concept and methods to assess rooftop solar electric potential, with an illustrative application to the city of Seoul. Renew. Sustain. Energy Rev. 2015, 41, 830–844. [Google Scholar] [CrossRef]
- Eicker, U.; Klein, M. Large-scale renewable energy integration within energy-efficient urban areas: Results from three German case studies. Int. J. Low Carbon Technol. 2012, 9, 202–213. [Google Scholar] [CrossRef]
- Theodoridou, I.; Karteris, M.; Mallinis, G.; Papadopoulos, A.M.; Hegger, M. Assessment of retrofitting measures and solar systems’ potential in urban areas using Geographical Information Systems: Application to a Mediterranean city. Renew. Sustain. Energy Rev. 2012, 16, 6239–6261. [Google Scholar] [CrossRef]
- Zhang, L.; Feng, Y.; Chen, B. Alternative Scenarios for the Development of a Low-Carbon City: A Case Study of Beijing, China. Energies 2011, 4, 2295–2310. [Google Scholar] [CrossRef]
- Araos, M.; Berrang-Ford, L.; Ford, J.D.; Austin, S.E.; Biesbroek, R.; Lesnikowski, A. Climate change adaptation planning in large cities: A systematic global assessment. Environ. Sci. Policy 2016, 66, 375–382. [Google Scholar] [CrossRef]
- Baiocchi, G.; Minx, J.; Hubacek, K. The Impact of Social Factors and Consumer Behavior on Carbon Dioxide Emissions in the United Kingdom. J. Ind. Ecol. 2010, 14, 50–72. [Google Scholar] [CrossRef]
- Zell, E.; Gasim, S.; Wilcox, S.; Katamoura, S.; Stoffel, T.; Shibli, H.; Engel-Cox, J.; Subie, M. Al Assessment of solar radiation resources in Saudi Arabia. Sol. Energy 2015, 119, 422–438. [Google Scholar] [CrossRef]
- Adam, K.; Hoolohan, V.; Gooding, J.; Knowland, T.; Bale, C.S.E.; Tomlin, A.S. Methodologies for city-scale assessment of renewable energy generation potential to inform strategic energy infrastructure investment. Cities 2016, 54, 45–56. [Google Scholar] [CrossRef]
- Clover, I. Third Phase of Dubai’s DEWA Solar Project Attracts Record Low Bid of US 2.99 Cents/kWh. Available online: https://www.pv-magazine.com/2016/05/02/third-phase-of-dubais-dewa-solar-project-attracts-record-low-bid-of-us-2-99-centskwh_100024383/ (accessed on 8 May 2017).
- Yenneti, K.; Day, R.; Golubchikov, O. Spatial justice and the land politics of renewables: Dispossessing vulnerable communities through solar energy mega-projects. Geoforum 2016, 76, 90–99. [Google Scholar] [CrossRef]
- James, P.A.B.; Jentsch, M.F.; Bahaj, A.S. Quantifying the added value of BiPV as a shading solution in atria. Sol. Energy 2009, 83, 220–231. [Google Scholar] [CrossRef]
- Kanters, J.; Wall, M. A planning process map for solar buildings in urban environments. Renew. Sustain. Energy Rev. 2016, 57, 173–185. [Google Scholar] [CrossRef]
- Amado, M.; Poggi, F. Solar energy integration in urban planning: GUUD model. Energy Procedia 2014, 50, 277–284. [Google Scholar] [CrossRef]
- Yang, T.; Athienitis, A.K. A review of research and developments of building-integrated photovoltaic/thermal (BIPV/T) systems. Renew. Sustain. Energy Rev. 2016, 66, 886–912. [Google Scholar] [CrossRef]
- Delisle, V.; Kummert, M. Cost-benefit analysis of integrating BIPV-T air systems into energy-efficient homes. Sol. Energy 2016, 136, 385–400. [Google Scholar] [CrossRef]
- Masson, G.; Orlandi, S. Global Market Outlook for Solar Power 2015–2019; Solar Power Europe: Brussels, Belgium, 2014. [Google Scholar]
- Celik, B.; Karatepe, E.; Silvestre, S.; Gokmen, N.; Chouder, A. Analysis of spatial fixed PV arrays configurations to maximize energy harvesting in BIPV applications. Renew. Energy 2015, 75, 534–540. [Google Scholar] [CrossRef]
- Zomer, C.; Nobre, A.; Reindl, T.; Ruther, R. Shading analysis for rooftop BIPV embedded in a high-density environment: A case study in Singapore. Energy Build. 2016, 121, 159–164. [Google Scholar] [CrossRef]
- Brenna, M.; Dolara, A.; Foiadelli, F.; Gafaro, L.; Leva, S.; Longo, M. Solar energy exploitation for charging vehicles. UPB Sci. Bull. Ser. C Electr. Eng. 2015, 77, 277–284. [Google Scholar]
- Brenna, M.; Dolara, A.; Foiadelli, F.; Leva, S.; Longo, M. Urban scale photovoltaic charging stations for electric vehicles. IEEE Trans. Sustain. Energy 2014, 5, 1234–1241. [Google Scholar] [CrossRef]
- Davis, A.Y.; Pijanowski, B.C.; Robinson, K.; Engel, B. The environmental and economic costs of sprawling parking lots in the United States. Land Use Policy 2010, 27, 255–261. [Google Scholar] [CrossRef]
- Du, Y.; Wang, J.; Huang, W.; Fan, Z. Simulation and analysis on heat transfer and pre-cooling characteristics of new solar power vehicle parking ventilation system. In Proceedings of the 2015 IEEE International Transportation Electrification Conference (ITEC), Chennai, India, 27–29 August 2015. [Google Scholar]
- Bybee, H.; Durrant, J.; McNeel, A.; Millsap, R.; Vasquez, R.; Wiley, E. Feasibility Study to Install Photo Voltaic Structures at the University of Utah; University of Utah: Salt Lake City, UT, USA, 2010. [Google Scholar]
- Robinson, J.; Brase, G.; Griswold, W.; Jackson, C.; Erickson, L. Business models for solar powered charging stations to develop infrastructure for electric vehicles. Sustainability 2014, 6, 7358–7387. [Google Scholar] [CrossRef]
- Latif, Z.A.; Zaki, N.A.M.; Salleh, S.A. GIS-based estimation of rooftop solar photovoltaic potential using LiDAR. In Proceedings of the 2012 IEEE 8th International Colloquium Signal Processing and Its Applications (CSPA), Melaka, Malaysia, 23–25 March 2012; pp. 388–392. [Google Scholar]
- Carneiro, C.; Morello, E.; Desthieux, G. Assessment of Solar Irradiance on the Urban Fabric for the Production of Renewable Energy using LIDAR Data and Image Processing Techniques. In Advances in GIScience; Sester, M., Bernard, L., Paelke, V., Eds.; Lecture Notes in Geoinformation and Cartography; Springer: Berlin/Heidelberg, Germany, 2009; pp. 83–112. [Google Scholar]
- Catita, C.; Redweik, P.; Pereira, J.; Brito, M.C. Extending solar potential analysis in buildings to vertical facades. Comput. Geosci. 2014, 66, 1–12. [Google Scholar] [CrossRef]
- Nguyen, H.T.; Pearce, J.M. Incorporating shading losses in solar photovoltaic potential assessment at the municipal scale. Sol. Energy 2012, 86, 1245–1260. [Google Scholar] [CrossRef]
- Lukač, N.; Seme, S.; Žlaus, D.; Štumberger, G.; Žalik, B. Buildings roofs photovoltaic potential assessment based on LiDAR (Light Detection And Ranging) data. Energy 2014, 66, 598–609. [Google Scholar] [CrossRef]
- Jakubiec, J.A.; Reinhart, C.F. A method for predicting city-wide electricity gains from photovoltaic panels based on LiDAR and GIS data combined with hourly Daysim simulations. Sol. Energy 2013, 93, 127–143. [Google Scholar] [CrossRef]
- Hetrick, W.A.; Rich, P.M.; Barnes, F.J.; Alamos, L.; Weiss, S.B. GIS-based Solar Radiation Flux Models. Am. Soc. Photogramm. Remote Sens. Tech. Pap. 1993, 3, 132–143. [Google Scholar]
- Lamigueiro, O.P. Solar: Solar Radiation and Photovoltaic Systems with R. J. Stat. Softw. 2012, 50. [Google Scholar]
- Joint Research Centre (JRC) Photovoltaic Geographical Information System (PVGIS). Available online: http://re.jrc.ec.europa.eu/pvgis/apps4/pvest.php# (accessed on 6 August 2015).
- McCormick, P.G.; Suehrcke, H. Diffuse fraction correlations. Sol. Energy 1991, 47, 311–312. [Google Scholar] [CrossRef]
- Reindl, D.T.; Beckman, W.A.; Duffie, J.A. Evaluation of hourly tilted surface radiation models. Sol. Energy 1990, 45, 9–17. [Google Scholar] [CrossRef]
- Choi, Y.; Rayl, J.; Tammineedi, C.; Brownson, J.R.S. PV Analyst: Coupling ArcGIS with TRNSYS to assess distributed photovoltaic potential in urban areas. Sol. Energy 2011, 85, 2924–2939. [Google Scholar] [CrossRef]
- Tulpule, P.J.; Marano, V.; Yurkovich, S.; Rizzoni, G. Economic and environmental impacts of a PV powered workplace parking garage charging station. Appl. Energy 2013, 108, 323–332. [Google Scholar] [CrossRef]
- U.S. Energy Information Administration. Country Analysis Brief: Saudi Arabia; U.S. Energy Information Administration: Washington, DC, USA, 2014.
- Alyahya, S.; Irfan, M.A. Role of Saudi universities in achieving the solar potential 2030 target. Energy Policy 2016, 91, 325–328. [Google Scholar] [CrossRef]
- Mansouri, N.Y.; Crookes, R.J.; Korakianitis, T. A projection of energy consumption and carbon dioxide emissions in the electricity sector for Saudi Arabia: The case for carbon capture and storage and solar photovoltaics. Energy Policy 2013, 63, 681–695. [Google Scholar] [CrossRef]
- Saudi Arabia Government Vision 2030; Saudi Arabia Government: Riyadh, Saudi Arabia, 2016.
- Al-Mostafa, Z.A.; Maghrabi, A.H.; Al-Shehri, S.M. Sunshine-based global radiation models: A review and case study. Energy Convers. Manag. 2014, 84, 209–216. [Google Scholar] [CrossRef]
- Baras, A.; Bamhair, W.; Alkhoshi, Y.; Alodan, M.; Engel-Cox, J. Opportunities and Challenges of Solar Energy in Saudi Arabia. In Proceedings of the World Renewable Energy Forum, Denver, CO, USA, 13–17 May 2012; Fellows, C., Ed.; American Solar Energy Society: Boulder, CO, USA, 2012; pp. 1–6. [Google Scholar]
- Sarver, T.; Al-Qaraghuli, A.; Kazmerski, L.L. A comprehensive review of the impact of dust on the use of solar energy: History, investigations, results, literature, and mitigation approaches. Renew. Sustain. Energy Rev. 2013, 22, 698–733. [Google Scholar] [CrossRef]
- Hepbasli, A.; Alsuhaibani, Z. A key review on present status and future directions of solar energy studies and applications in Saudi Arabia. Renew. Sustain. Energy Rev. 2011, 15, 5021–5050. [Google Scholar] [CrossRef]
- Šúri, M.; Huld, T.A.; Dunlop, E.D. PV-GIS: A web-based solar radiation database for the calculation of PV potential in Europe. Int. J. Sustain. Energy 2005, 24, 55–67. [Google Scholar] [CrossRef]
- Kanyarusoke, K.; Gryzagoridis, J.; Oliver, G. Validation of TRNSYS modelling for a fixed slope photovoltaic panel. Turk. J. Electr. Eng. Comput. Sci. 2015, 24, 4763–4772. [Google Scholar] [CrossRef]
- Quesada, B.; Sánchez, C.; Cañada, J.; Royo, R.; Payá, J. Experimental results and simulation with TRNSYS of a 7.2 kWp grid-connected photovoltaic system. Appl. Energy 2011, 88, 1772–1783. [Google Scholar] [CrossRef]
- Department of Energy & Climate Change Official Statistics—Solar PV Cost Data (Online Dataset). Available online: https://www.gov.uk/government/statistics/solar-pv-cost-data (accessed on 8 May 2017).
- Jordan, D.; Kurtz, S. Overview of Field Experience—Degradation Rates & Lifetimes. In Proceedings of the Solar Power International 2015, Anaheim, CA, USA, 14–17 September 2015. [Google Scholar]
- Jordan, D.C.; Smith, R.M.; Osterwald, C.R.; Gelak, E.; Kurtz, S.R. Outdoor PV degradation comparison. In Proceedings of the 35th IEEE Photovoltaic Specialists Conference (PVSC’10), Honolulu, HI, USA, 20–25 June 2010; National Renewable Energy Laboratory: Golden, CO, USA, 2010; pp. 2694–2697. [Google Scholar]
- Jordan, D.C.; Kurtz, S.R. Photovoltaic degradation rates—An Analytical Review. Prog. Photovoltaics Res. Appl. 2013, 21, 12–29. [Google Scholar] [CrossRef]
- Mahapatra, S. Dubai Gets Record-Low Bid of 2.99 USC/kWh for 800 MW Solar PV Project. Available online: http://cleantechnica.com/2016/05/02/lowest-solar-price-dubai-800-mw-solar-project/ (accessed on 8 May 2017).
- Solar Server Chile Energy Tender: 12,430 GWh to Be Added, with Sensational Low Bids. Available online: http://www.solarserver.com/solar-magazine/solar-news/current/2016/kw34/chile-energy-tender-12430-gwh-to-be-added-with-sensational-low-bids.html?utm_source=REA+Members+Mailing+List&utm_campaign=1567a39b71-160826_REA_newsletter&utm_medium=email&utm_term=0_e (accessed on 26 August 2016).
- ICSU ISSC. Review of Targets for the Sustainable Development Goals: The Science Perspective; International Council for Science (ICSU): Paris, France, 2015. [Google Scholar]
Figure 1.
Examples of car parks around the world (Google Map streetview).

Figure 2.
Illustration of the methodological steps undertaken to assess appropriate areas, orientation and configure PV deployment as shading for parking areas and to estimate power production from these areas.
Figure 2.
Illustration of the methodological steps undertaken to assess appropriate areas, orientation and configure PV deployment as shading for parking areas and to estimate power production from these areas.

Figure 3.
Image of existing car parking canopies.

Figure 4.
Electricity consumption and spend profile for KAU from 2012 to 2014. For 2015 is estimated.
Figure 4.
Electricity consumption and spend profile for KAU from 2012 to 2014. For 2015 is estimated.

Figure 5.
Monthly energy consumption of KAU and mean monthly temperature of Jeddah.

Figure 6.
Layout of the car parking areas in KAU and their main orientations. Red areas are carports that have already been installed with canopies.
Figure 6.
Layout of the car parking areas in KAU and their main orientations. Red areas are carports that have already been installed with canopies.

Figure 7.
Number of existing covered carports that have different sizes and their orientations.

Figure 8.
Orientation of existing canopies for vehicle shading in a randomly selected car park in KAU.
Figure 8.
Orientation of existing canopies for vehicle shading in a randomly selected car park in KAU.

Figure 9.
Example of analysis of shading from buildings and the annual solar radiation on areas close to a 4-storey building within the campus; (a) satellite image of the site © Google Map; (b) estimated solar radiation.
Figure 9.
Example of analysis of shading from buildings and the annual solar radiation on areas close to a 4-storey building within the campus; (a) satellite image of the site © Google Map; (b) estimated solar radiation.

Figure 10.
Shading from buildings as a function of various periods in the day (9:00, 12:00, 15:00) and season (summer and autumn), see text for explanation.
Figure 10.
Shading from buildings as a function of various periods in the day (9:00, 12:00, 15:00) and season (summer and autumn), see text for explanation.

Figure 11.
Annual solar radiation on canopies that have various orientation and inclination, (a) individual canopies; (b) average radiation on canopies of back-to-back structure.
Figure 11.
Annual solar radiation on canopies that have various orientation and inclination, (a) individual canopies; (b) average radiation on canopies of back-to-back structure.

Figure 12.
Diagram illustrating single-row carport structure (left) and back-to-back structure (right).
Figure 12.
Diagram illustrating single-row carport structure (left) and back-to-back structure (right).

Figure 13.
Shaded and un-shaded cap parks in KAU.

Figure 14.
Comparison of areas occupied by canopies and the entire car park footprint (a) satellite image of the cloth shaded parking area and (b) actual footprint of shaded areas occupied the canopies.
Figure 14.
Comparison of areas occupied by canopies and the entire car park footprint (a) satellite image of the cloth shaded parking area and (b) actual footprint of shaded areas occupied the canopies.

Figure 15.
Irradiance from TRNSYS Reindl model at 4 geometric settings: (a) 8° azimuth south-facing 20° slope; (b) 8° azimuth north-facing, 20° slope; (c) 83° south-facing, 20° slope; and (d) 83° azimuth north-facing, 20° slope. Calculation uses the Riyadh 404380_IWEC weather file (where IWEC stands for International Weather for Energy Calculation).

Figure 16.
Ambient temperature, modelled module temperature over the year (8° southeast, 20° slope), and monthly performance ratio of PV systems obtained from TRNSYS simulation using Riyadh 404380_IWEC EnergyPlus weather file.
Figure 16.
Ambient temperature, modelled module temperature over the year (8° southeast, 20° slope), and monthly performance ratio of PV systems obtained from TRNSYS simulation using Riyadh 404380_IWEC EnergyPlus weather file.

Figure 17.
Estimated payback periods at different interest rates.

Figure 18.
Comparison of estimated generation tariff with reported tariff of existing PV projects [55].
Figure 18.
Comparison of estimated generation tariff with reported tariff of existing PV projects [55].


Table 1.
Size of carports with existing canopies.
| Carport Characteristics | Min | Max | Mean | Median | Standard Deviation |
|---|---|---|---|---|---|
| Ground Space (m2) | 11.6 | 40.0 | 18.5 | 16.7 | 5.1 |
| Orientation (Absolute Value) | 0.1° | 85.4° | 38.2° | 8.3° | 36.5° |
Table 2.
Car parking areas shaded and unshaded.
| Total Car Park Area | Shaded (Cloth Canopies) | Unshaded |
|---|---|---|
| 594,611 m2 | 400,996 m2 | 193,615 m2 |
Table 3.
Summary of solar PV installation capacity by utilising suitable car park areas.
| Model Results | Shaded Car Parks | Unshaded Car Parks | Total |
|---|---|---|---|
| Area, m2 | 400,996 | 193,615 | 594,611 |
| Mean utilisation factor | 31% | 50% | 37% |
| Number of car ports | 6772 | 5796 (estimated) | 12,568 |
| Estimated installation capacity, MWp | 20.3 | 16.1 | 36.4 |
Table 4.
Comparison of electricity generation estimates using TRNSYS versus PV-GIS.
| Model results | 8° Southeast, ±20° Slope | 83° Southwest, ±20° Slope | |||
|---|---|---|---|---|---|
| TRNSYS | PV-GIS | TRNSYS | PV-GIS | ||
| Irradiance (kWh/m2) | south-facing | 2373 | 2490 | 2155 | 2290 |
| north-facing | 2109 | 2010 | 1875 | 2240 | |
| Energy yield (kWh/kWp) | south-facing | 2031 | 1930 | 1848 | 1780 |
| north-facing | 1782 | 1560 | 1617 | 1740 | |
| back-to-back | 1907 | 1745 | 1733 | 1760 | |
Table 5.
Required export tariff for different ROI projections (unit: ¢/kWh).
| Expected ROI over 25 years | 0% | 50% | 100% |
|---|---|---|---|
| Required export tariff | 3.03 | 4.54 | 6.05 |
© 2017 by the authors. Licensee MDPI, Basel, Switzerland. This article is an open access article distributed under the terms and conditions of the Creative Commons Attribution (CC BY) license (http://creativecommons.org/licenses/by/4.0/).
Share and Cite
MDPI and ACS Style
Alghamdi, A.S.; Bahaj, A.S.; Wu, Y. Assessment of Large Scale Photovoltaic Power Generation from Carport Canopies. Energies 2017, 10, 686. https://doi.org/10.3390/en10050686
AMA Style
Alghamdi AS, Bahaj AS, Wu Y. Assessment of Large Scale Photovoltaic Power Generation from Carport Canopies. Energies. 2017; 10(5):686. https://doi.org/10.3390/en10050686
Chicago/Turabian StyleAlghamdi, Abdulsalam S., AbuBakr S. Bahaj, and Yue Wu. 2017. "Assessment of Large Scale Photovoltaic Power Generation from Carport Canopies" Energies 10, no. 5: 686. https://doi.org/10.3390/en10050686
Note that from the first issue of 2016, this journal uses article numbers instead of page numbers. See further details here.