Spectral Response of Polycrystalline Silicon Photovoltaic Cells under Real-Use Conditions

Renewable Energy Center, School of Engineering, São Paulo State University (UNESP), Guaratinguetá, Avenida Ariberto Pereira da Cunha 333, Guaratinguetá 12516-410, São Paulo, Brazil
*
Author to whom correspondence should be addressed.
Energies 2017, 10(8), 1178; https://doi.org/10.3390/en10081178
Submission received: 11 May 2017
/
Revised: 31 July 2017
/
Accepted: 2 August 2017
/
Published: 10 August 2017
Abstract
:The standard test conditions for photovoltaic modules are not capable of reproducing the environmental variations to which the modules are subjected under real operating conditions. The objective of this experimental work is to be an initial study on how the electric energy generation of photovoltaic cells varies according to the different wavelength ranges of the solar light spectrum under real operating conditions. Two modules were installed outdoors; color filters, which allow the passage of light at specific wavelengths, were installed on one of them. The amount of energy produced by the module with the filter was compared to the reference module, and the relative efficiency of each filter was defined. As a result, it was found that crystalline silicon modules do not respond uniformly to sunlight, being more sensitive to the red band (relative efficiency of 23.83%) and less sensitive to the green band (19.15%). The infrared contributes to a significant portion of energy production (relative efficiency of 13.56%), overcoming its negative effect of reducing energy generation capacity due to high photovoltaic cell temperature.
1. Introduction
Most of the modern world uses fossil fuels as its primary source of energy. Coal, oil and natural gas accounted for 66.4% of the world consumption by 2014 [1]. They are abundant, easy to carry and have high energy density; however, they cause great impacts on the environment by the emission of chemical compounds capable of accelerating climate change.
Widely available almost everywhere on the globe and practically inexhaustible on a human time scale, solar energy is now a promising energy source with great potential to meet some of the human needs. It can be obtained by the use of photovoltaic cells and modules, whose efficiency depends on their manufacturing process and the environmental conditions of the place where they are installed [2].
It is assumed that all of the radiation received by the solar cells is equivalent to the Air Mass 1.5 (AM1.5) standard. There are daily, seasonal, and regional differences in the spectral distribution of solar radiation at the ground level [3] that could make this assumption imprecise. The AM1.5 standard is used to perform the specification of panels in the laboratory. In addition, laboratory tests are not capable of reproducing the variations of the spectrum, solar radiation, and ambient temperature to which the photovoltaic panels are subjected throughout a day in a real installation. Thus, the panel response under real operating conditions may differ from the technical specifications obtained in tests under controlled conditions.
A photovoltaic panel or module (PV) is characterized by parameters that are determined by the manufacturers under the Standard Test Conditions (STC): irradiance of 1000 W·m−2, constant temperature of the cells at 25 °C, and the AM1.5 standard sunlight spectrum. However, these parameters cannot be used to estimate the energy output of a module under real operating conditions, since the energy production in these conditions differs from STC due to variable environmental factors, the geographical location of the module, and the spectral response of each photovoltaic technology [4,5,6].
Factors that can modify the capacity of the energy production of photovoltaic modules are: the operating temperature, wind speed, irradiance, and the spectrum of sunlight, which have been studied by several authors.
According to Ishii, Otani, and Nakashima [7], the operating temperature contributes between 15% and 20% to the reduction of the efficiency of polycrystalline silicon modules. The contribution of the solar spectrum is lower, about 3%. Similarly, Huld and Amillo [8] studied the effect of several variables on the performance of photovoltaic panels. They concluded that variations in the solar spectrum received by crystalline silicon cells leads to a performance variation between −5% and +2%. The influence of temperature and irradiance lead to a performance variation between −15% and +5%. The assembly type affects the panel temperature: non-ventilated assemblies such as the ones made on rooftops result in an increase in the panel temperature. This increase can be minimized if there is wind incidence, which reduces the temperature difference between the module and the environment, and if the operating regime is the maximum power point tracking [6,9]. In addition, the temperature difference between the panel and the environment depends on efficiency: the higher the efficiency of the module, the lower the losses and working temperature [6]. There are several active and passive cooling methods for photovoltaic panels, in order to increase efficiency: heat exchangers with aluminum or copper pipes run by refrigerant fluid; heatsinks with fin coolers, with natural or artificial ventilation; continuous spraying of water on the surface of the panels; and direct liquid circulation in the rear of modules with solar concentration [10,11,12].
The maximum power that a photovoltaic panel can reach varies according to the variations of the solar spectrum received by the component and the angle incidence of light, which change throughout the day and year [4,8]. However, the STC do not consider these variations when determining the nominal power of the modules, but other authors have recently addressed this topic in their studies. Cañete, Carretero, and Sidrach-de-Cardona [4] compared the efficiency of four photovoltaic panel technologies under real climatic conditions in southern Spain and concluded that thin-film cells show greater variation in energy production according to the seasons, being consistent with [8]. In addition, they reported that the daily efficiency of polycrystalline silicon cells was shown to be 7.6% lower under real operating conditions than in the standard test conditions due to the working high temperature.
The energy production of photovoltaic systems can be estimated by the atmospheric conditions of the installation site. Different combinations of irradiance and temperature are considered in several works [13,14,15], but variations of the spectrum are generally disregarded.
The influence of spectral variations on the PV performance depends on the spectral response of each photovoltaic cell technology [5]. In addition, the effective spectral irradiance—that is, the one that actually contributes to the current generation in the panel—is different from the standard AM1.5 spectrum used in laboratory tests of cells and modules, which covers a wide range of wavelengths. In general, solar panels do not respond to the full AM1.5 spectrum [5,16,17,18]. The impact of the spectral distribution on energy production varies for each month of the year and decreases as the latitude of the installation site of the photovoltaic modules decreases [19]. In addition, the spectral impact can be reduced by using a wavelength range between 350 nm and 1050 nm for analysis [20].
In the same way that cooling methods were projected to reduce the impact of temperature and increase the efficiency of photovoltaic systems, several research works have been carried out to find ways to increase energy production by modifying the light spectrum received by the panel. Some of these methods include: optical traps [21], antireflective layers [22,23,24,25], luminescent down-shifting layers [26,27,28,29] and color filters [30,31]. Landrock et al. [31] developed a solar simulator with tungsten lamps and color correction using low-cost filters. The light source was evaluated according to three parameters: spectral response, spatial uniformity, and temporal stability. The spectrum of the lamps was verified with a high-precision spectrometer and was corrected with the installation of four color filters.
In the aforementioned works, photovoltaic cells were always exposed to the complete sunlight spectrum, in both controlled laboratory and real-use conditions. The influence of the spectrum is obtained through the use of spectrometers and sophisticated mathematical methods (i.e., by indirect methods). In this work, photovoltaic cells are exposed to just a specific wavelength range of the solar spectrum at a time through the use of color filters. In this way, it is possible to directly verify the effect of each wavelength range of sunlight on the capacity of the energy production of photovoltaic modules, without using complex mathematical methods or expensive measurement equipment like a spectrometer. Furthermore, PV cells are exposed to real variations of environmental temperature, solar spectrum, and the angle of incidence of light—aspects that solar simulators cannot reproduce in the laboratory.
The objective of this experimental work is to be an initial study on how the electric energy generation of polycrystalline silicon photovoltaic cells varies according to the different wavelength ranges of the solar light spectrum, under real operating conditions. Low-cost color filters are used to directly verify the effect of the spectral response of individual wavelength ranges.
2. Materials and Methods
2.1. Assembling the Experiment
The experiments were carried out at the Renewable Energy Center of the São Paulo State University (UNESP), School of Engineering, Guaratinguetá City (latitude 22°28′ south, longitude 45°6′ west, altitude 530 m). The site presents Köppen climatic classification Aw, with average temperatures varying between 18.2 °C in July and 24.8 °C in February [32]. The overall solar radiation varies between the minimum value of 3.02 kWh·m−2 per day in June and the maximum of 5.35 kWh·m−2 per day in November [33].
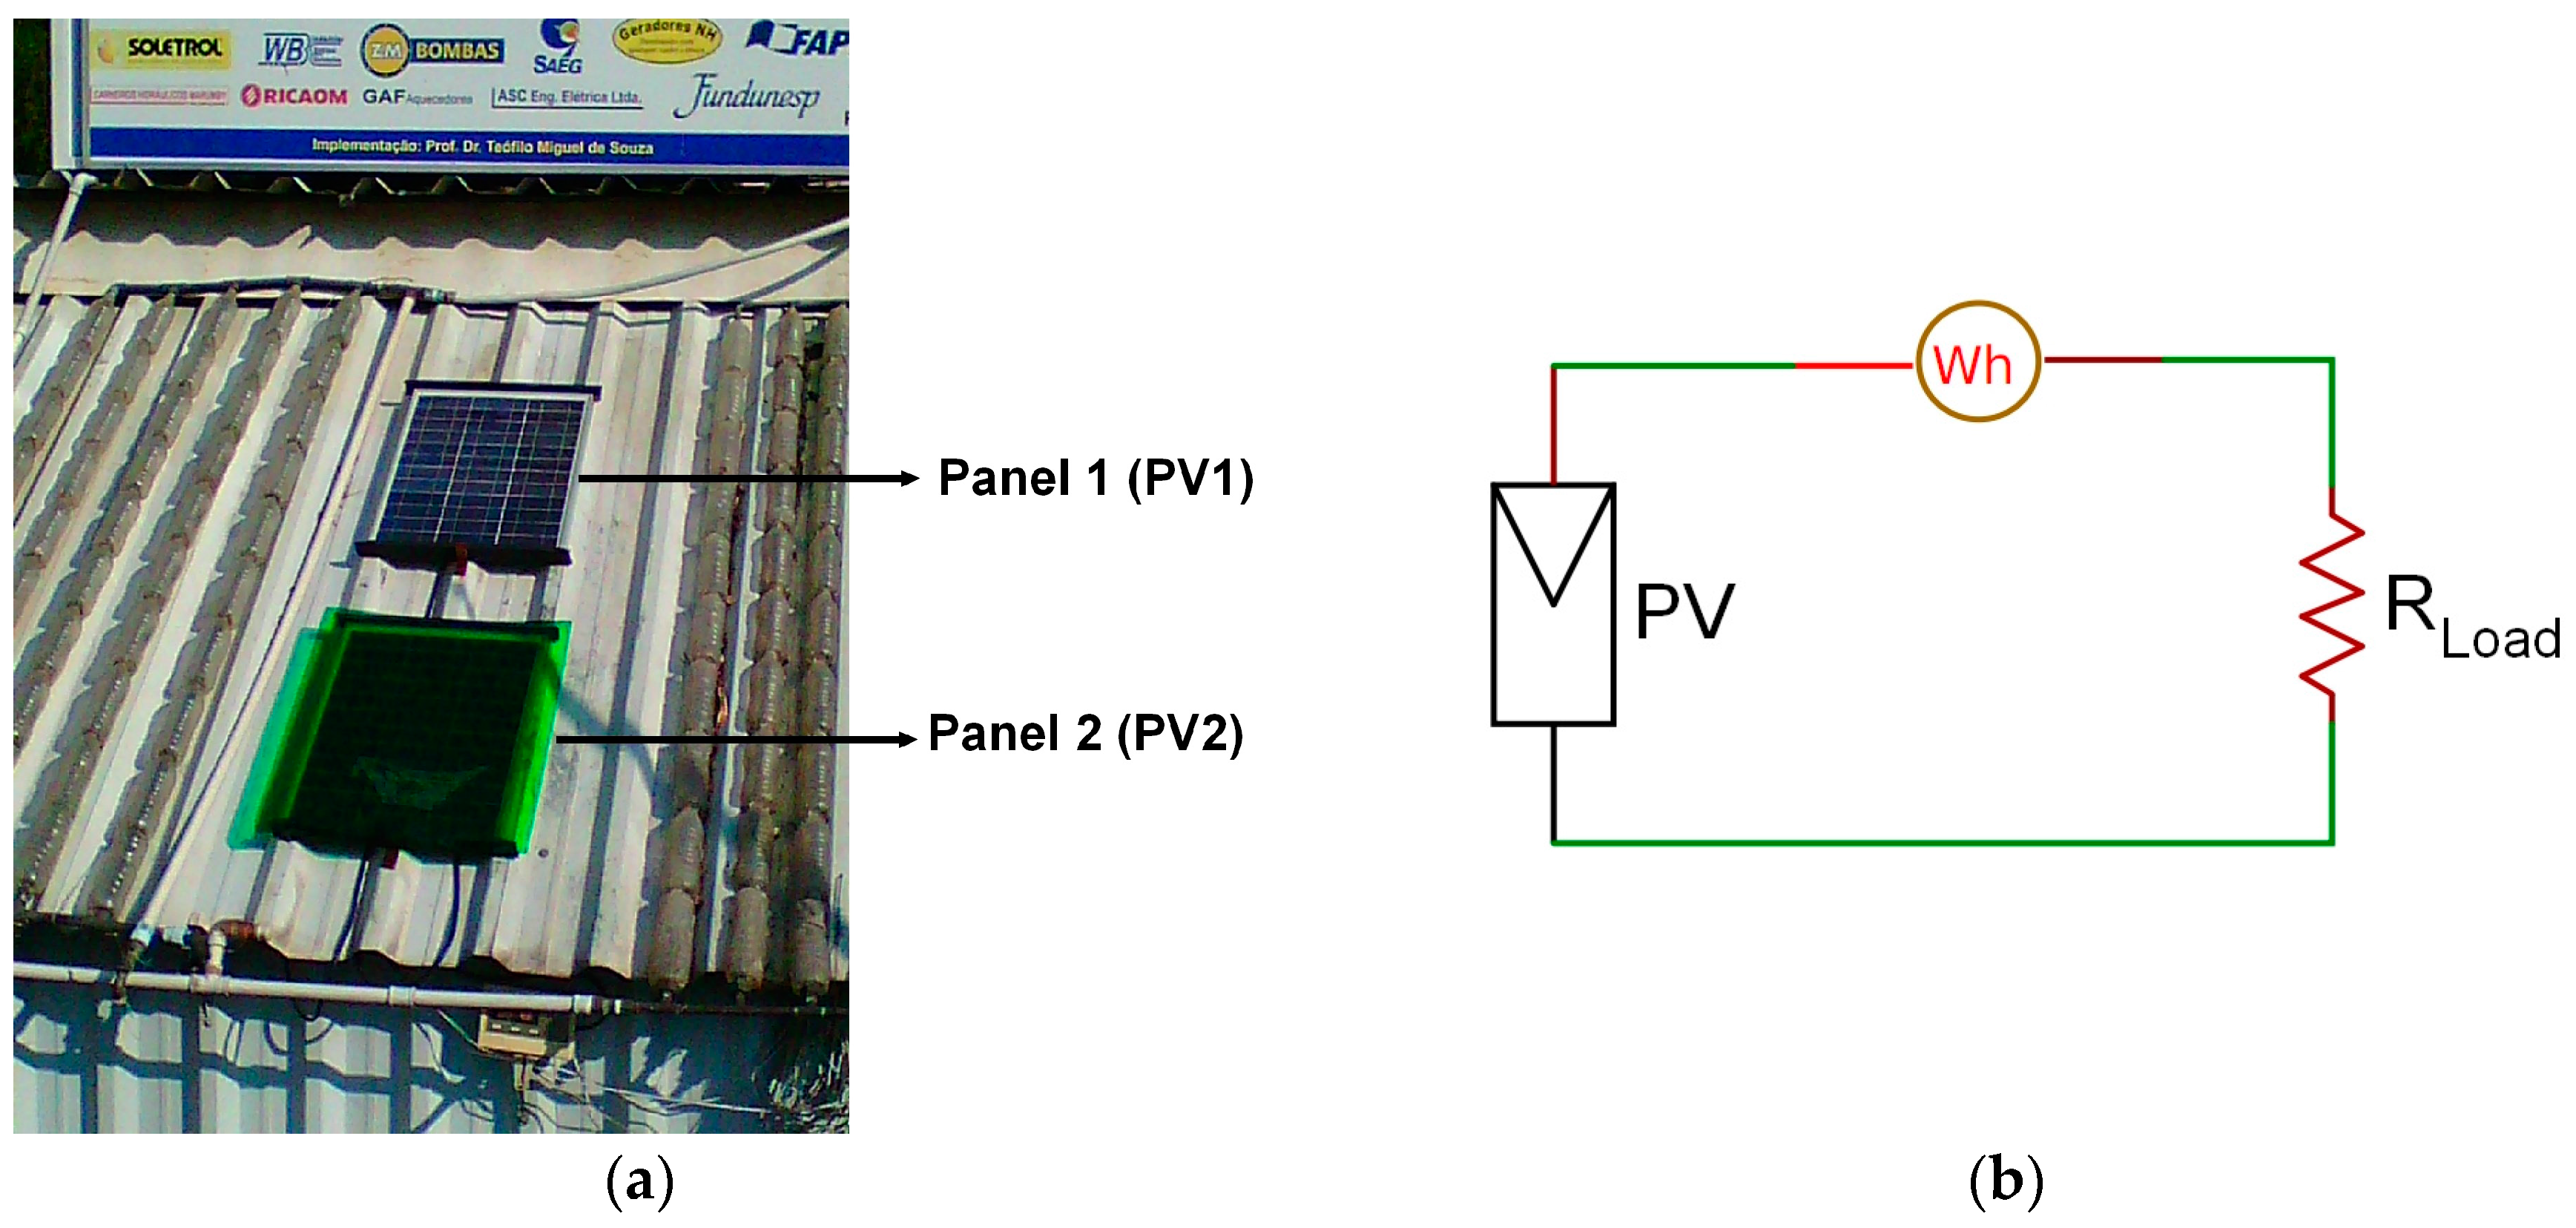
Two identical photovoltaic panels were mounted on a metal roof with individual support structures, as exemplified in Figure 1a. The roof slope is 32° to the horizontal, and it is oriented at 40° east. The photovoltaic panels are of the model STP022-12/D, manufactured by Suntech enterprise (Suntech Power Holding Co. Ltd., Wuxi, China), and they have a maximum power of 22 W and 36 cells of polycrystalline silicon. The nominal parameters of these panels are: open-circuit voltage (VOC) of 21 V, short-circuit current (ISC) of 1.61 A, voltage at maximum power (VMP) of 16.8 V, and current at maximum power (IMP) of 1.31 A.
Each of the photovoltaic panels was connected to a direct current watt-hour meter and then to a power resistor of 12 Ω, which acts as a load for each panel, according to Figure 1b. The watt-hour meters are manufactured by Portable Power Supplies (PortaPow Ltd., Bromley, United Kingdom), model DC (Direct Current) Power Monitor, and withstand voltages up to 50 V and currents up to 5 A. The 12 Ω power resistor was chosen in order to make the photovoltaic panels work most of the time near the maximum power point of their I–V curve. Moreover, using a fixed-value resistor simplifies the experimental setup, as it is not necessary to use I–V curve tracer equipment.
Eight color filters were fixed, one at a time, only on Panel 2; Panel 1 is used as a reference. The color filters were installed 1 cm above the solar panels, and they were kept outstretched by a strong adhesive tape in order to resist moderate winds. Although covering a photovoltaic module can increase its temperature under sunlight, measurements made at initial tests showed that, at the experiment site, the temperature of Panel 2 (with color filter) was not much higher than the temperature of Panel 1 (without filter). Therefore, in order to simplify the data acquisition process, the temperature of the solar panels was not registered over the measurement period. Furthermore, the color filter area is larger than the solar module area, so no natural light hits the photovoltaic module at its edges.
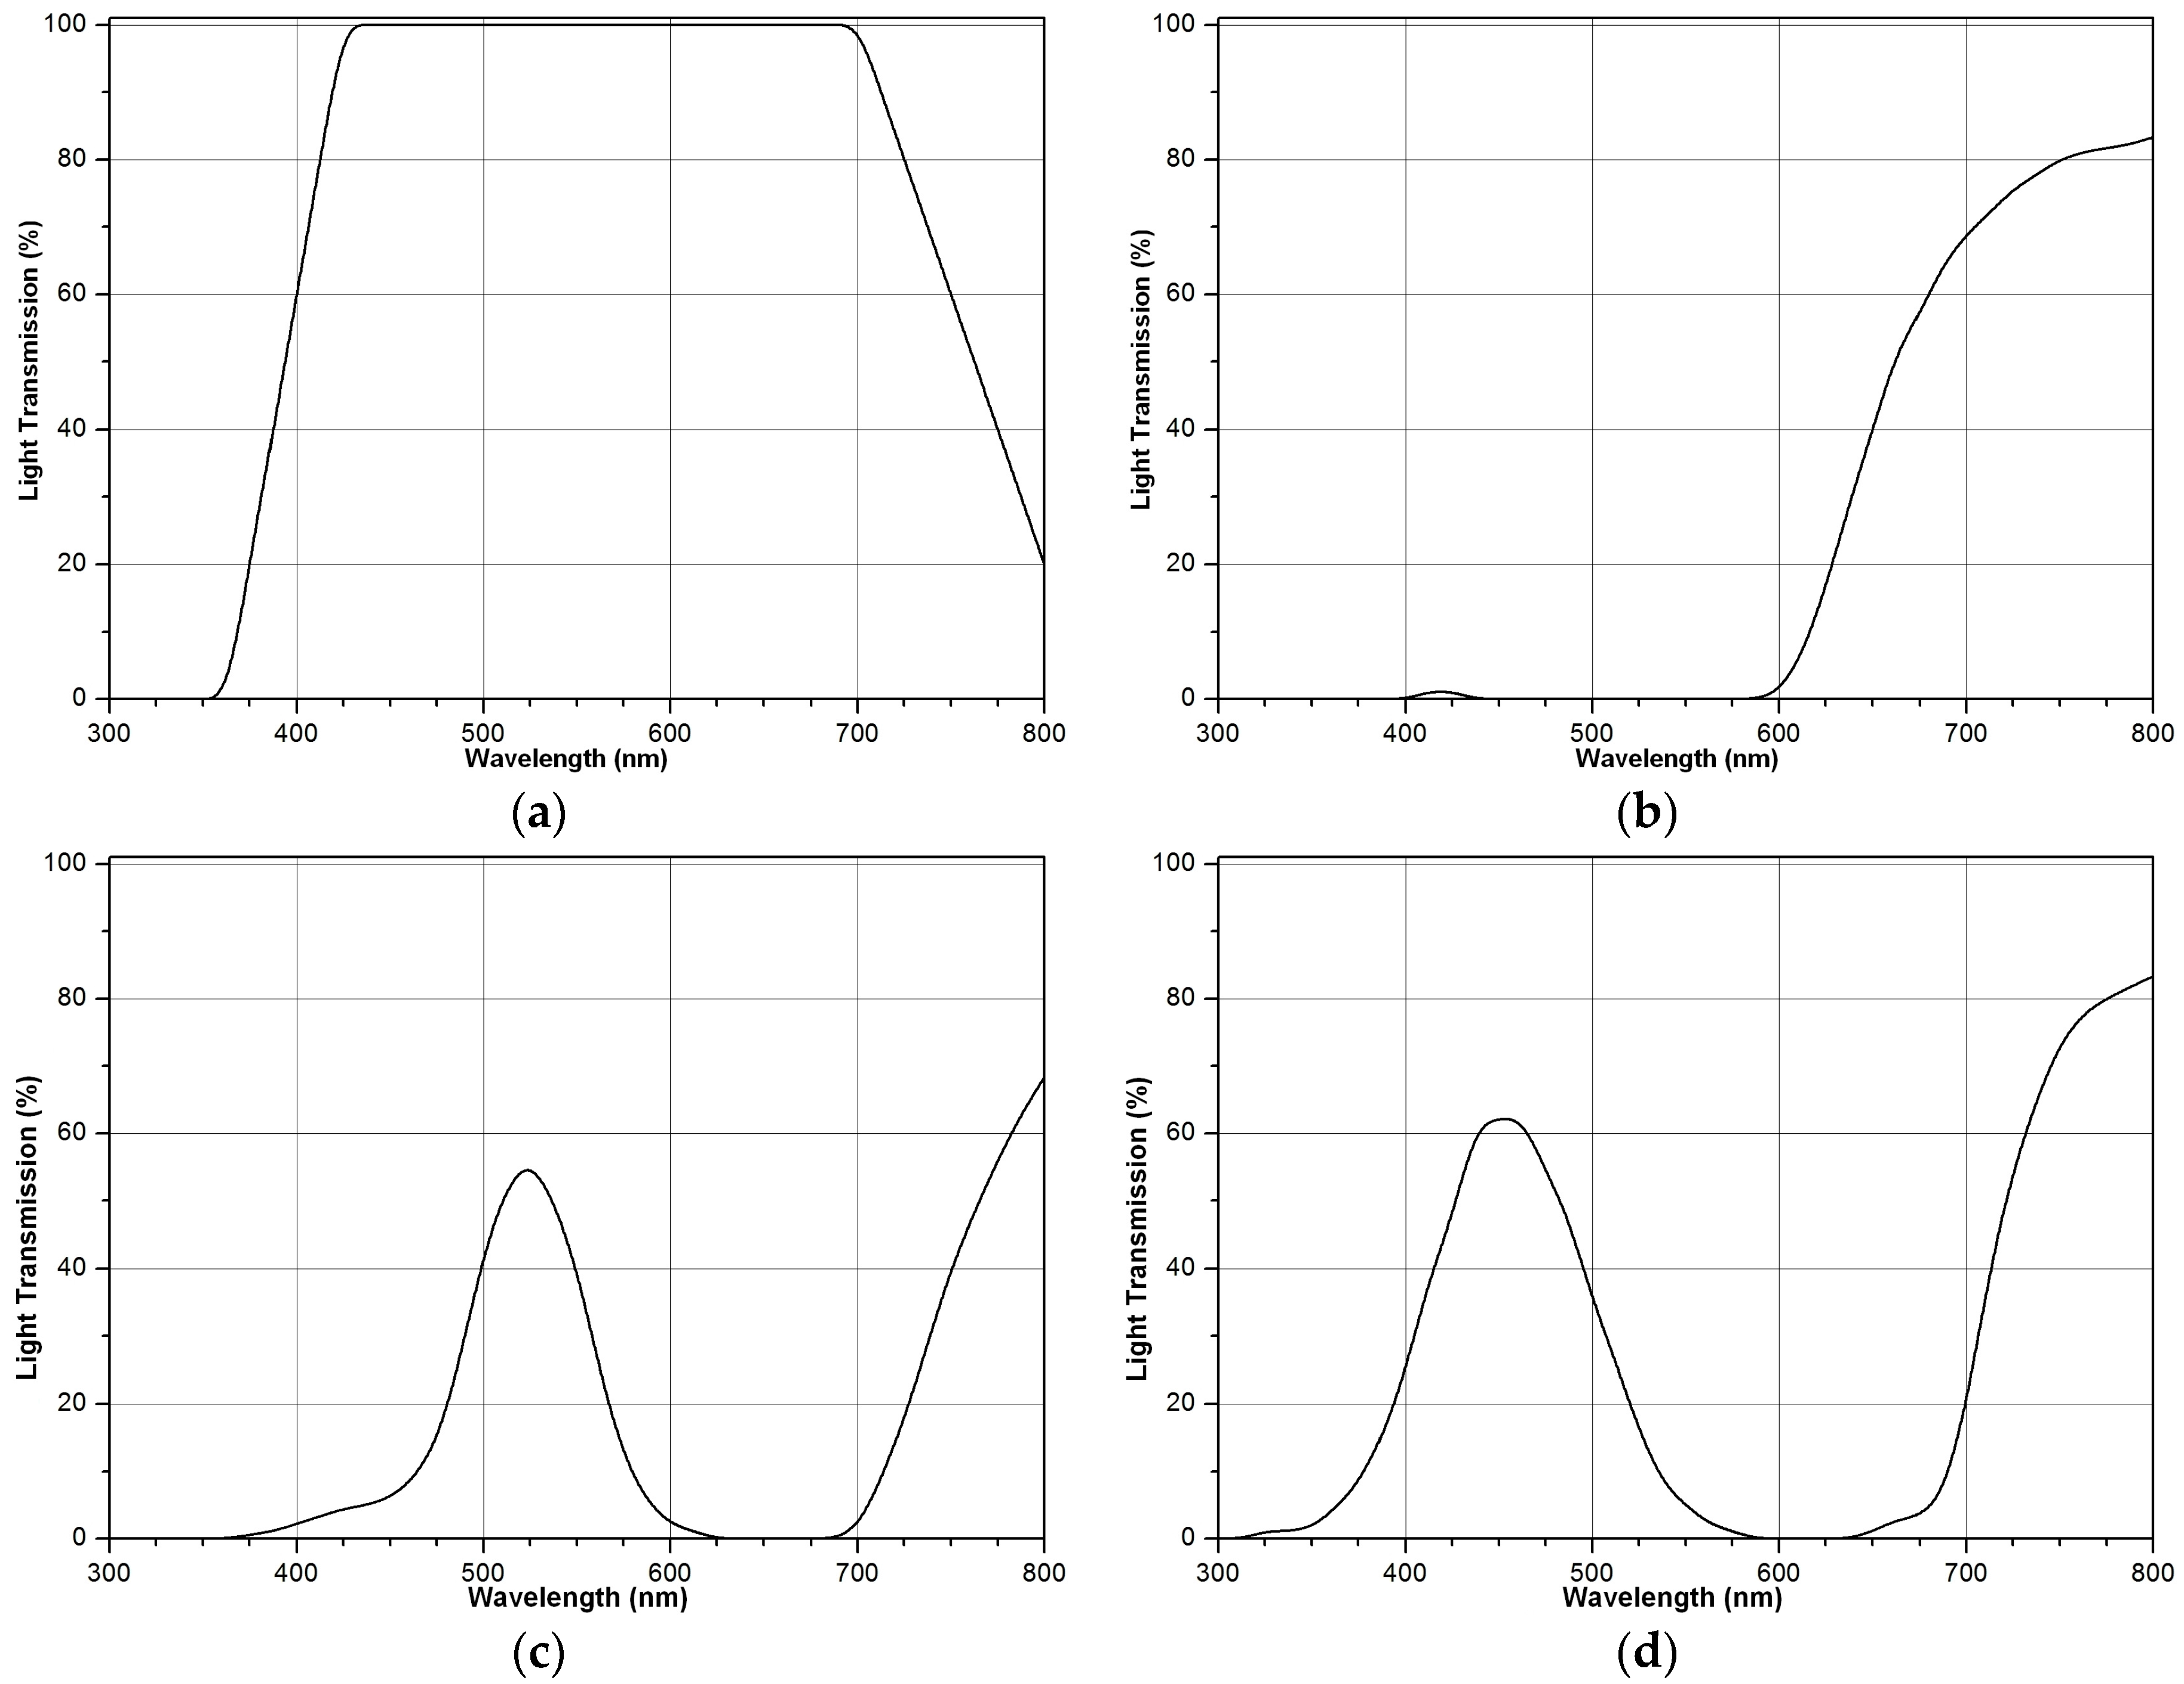
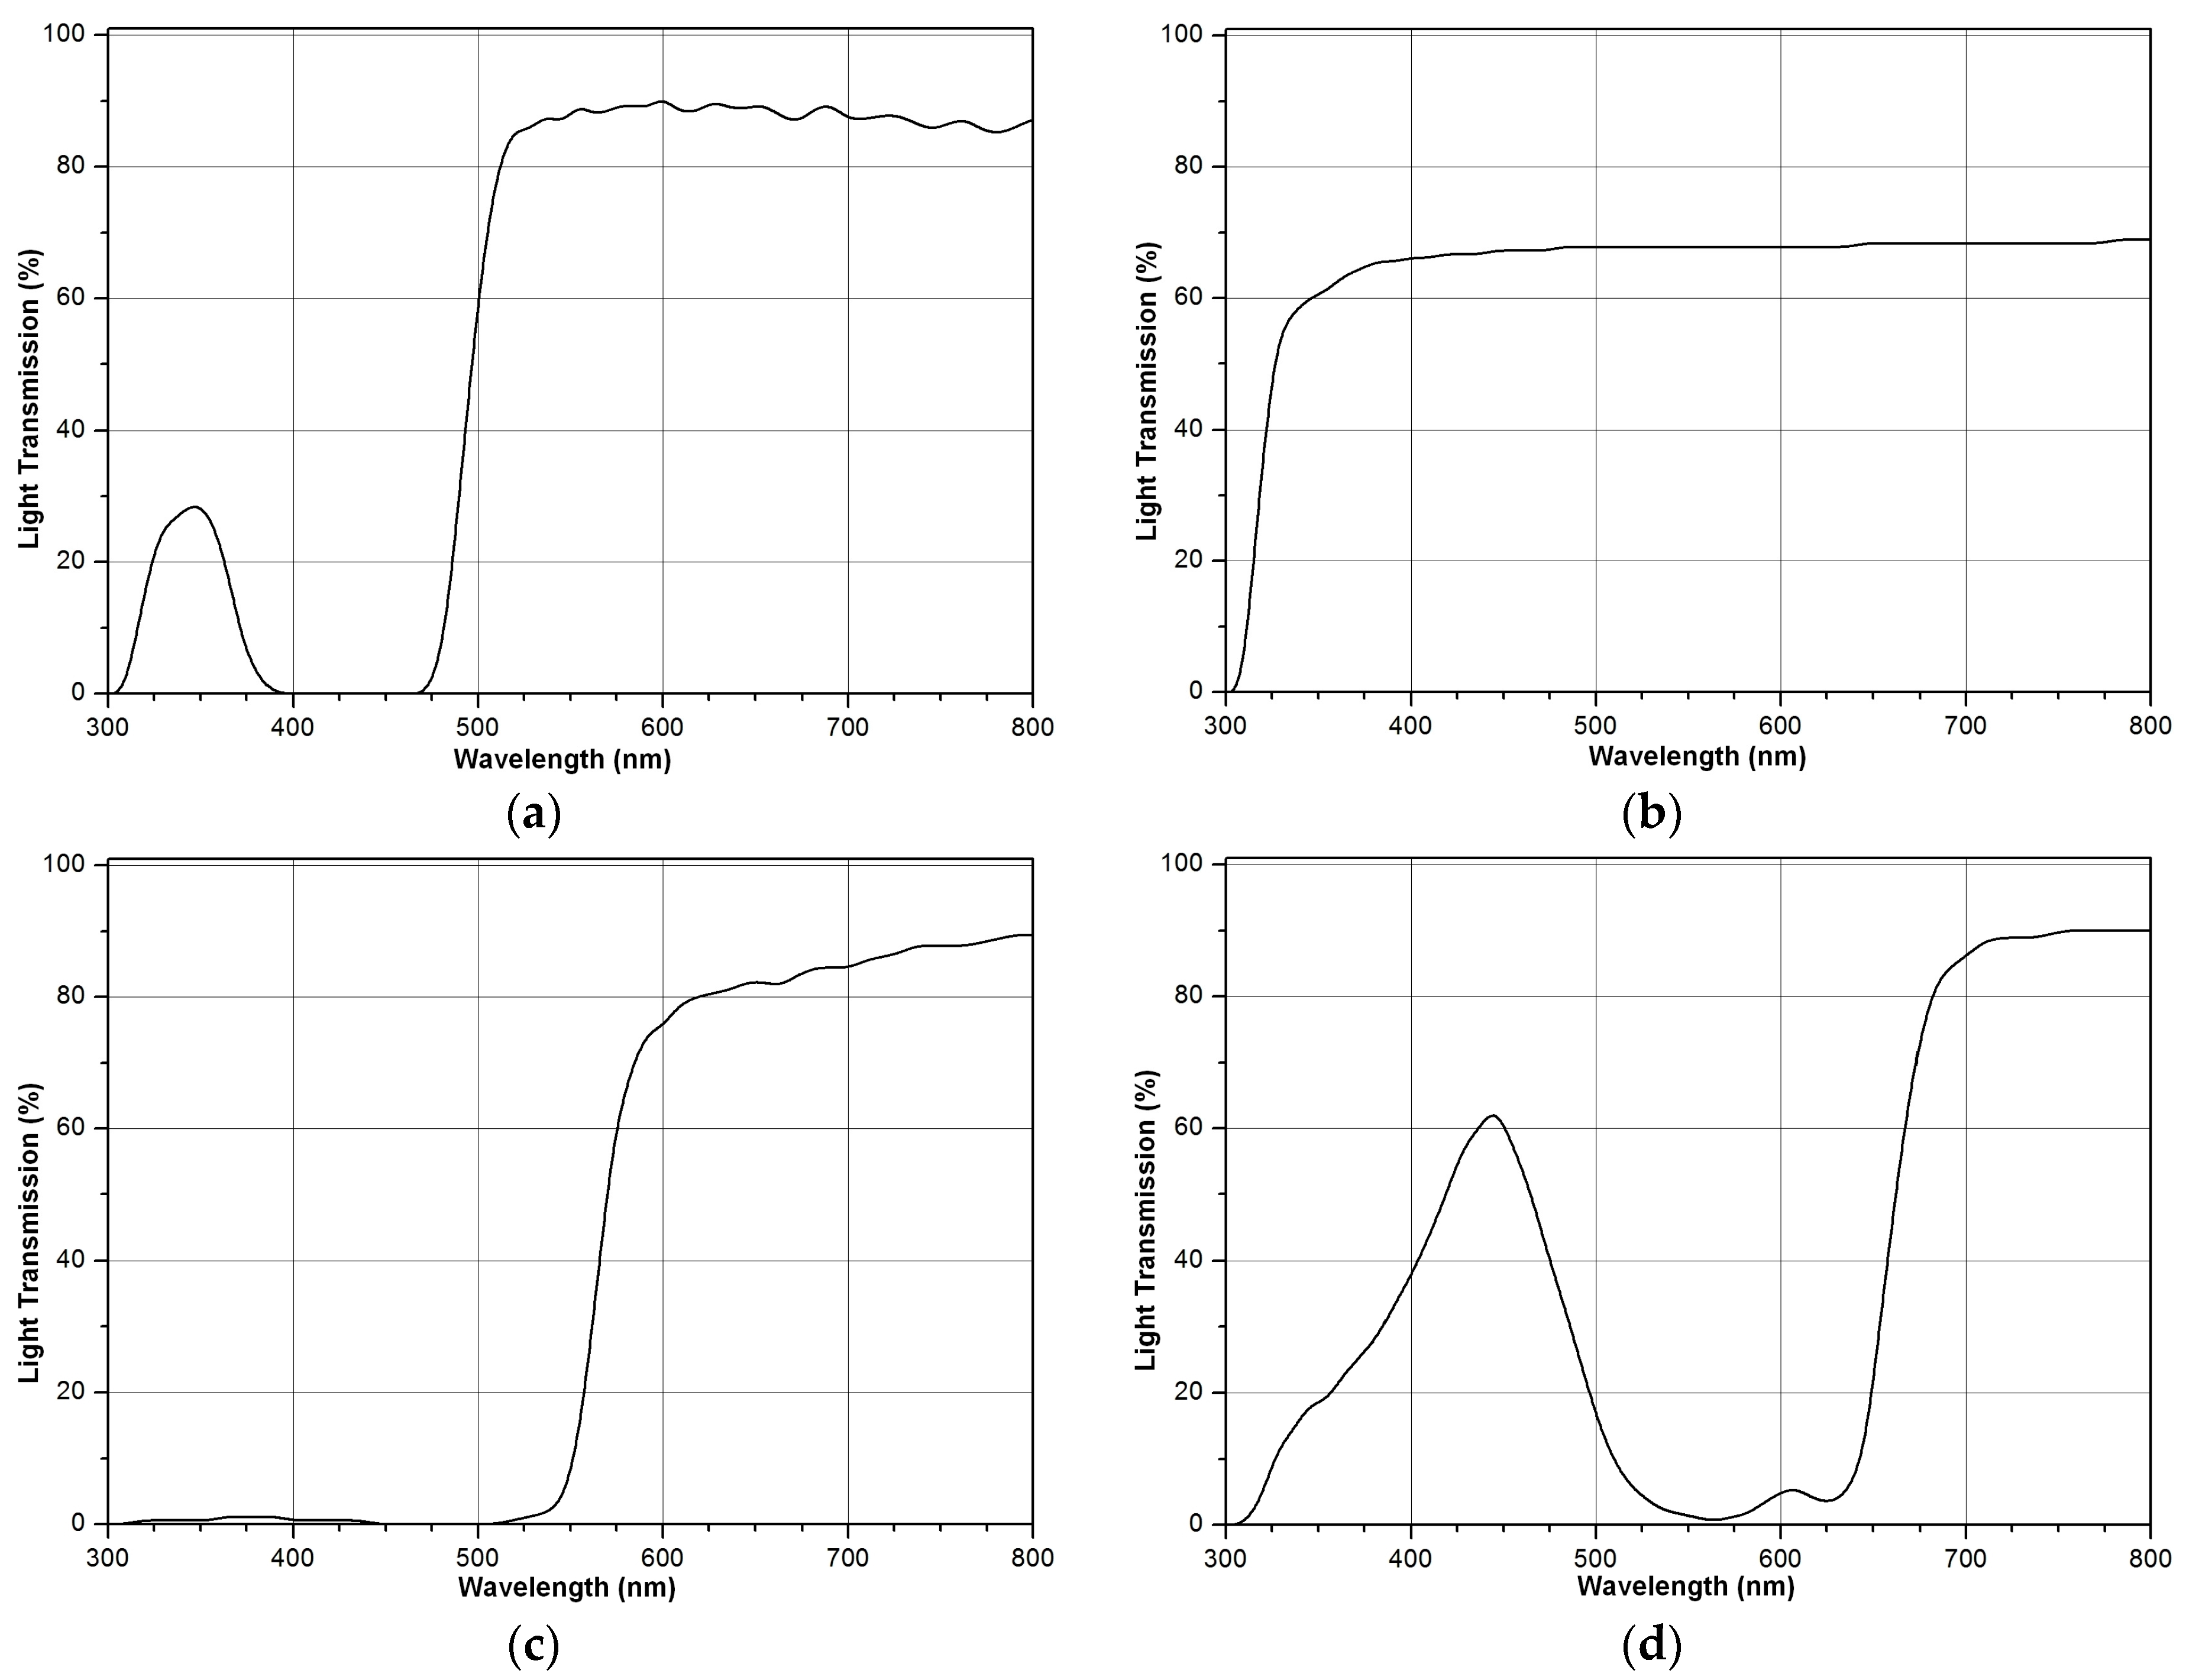
Each filter has a different spectral energy distribution (SED) curve, as shown in Figure 2 and Figure 3. The filters were divided into two groups, according to the characteristics of their SED curves: primary filters, which have SED curves covering the main wavelength ranges of the spectrum in isolation; and secondary filters, whose SED curves include several wavelength bands simultaneously. The filters are manufactured by Cotech Sensitizing (Cotech Sensitizing Ltd., Tredegar, United Kingdom). Each filter allows only part of the spectrum of light to pass through it; the visible light filter allows all visible light to pass through it, blocking the infrared (IR) rays. In addition, because they are made of plastic material, all filters block ultraviolet rays (wavelengths below 300 nm).
On each measuring day, one color filter was installed at the beginning of the day and removed at the end of the sunlight period at the test location. The filters were tested sequentially, day after day, repeating the sequence several times in the measurement period, so as to minimize the influence of the changes of the solar angle of incidence. The angle of incidence simultaneously affects both solar modules (as they were installed side-by-side), and the effects of its changes over a whole year are minimized when one uses the mean value of relative efficiency.
2.2. Analysis Method
The electrical characteristics of the photovoltaic panels were determined under real operating conditions through an experimental data survey. The circuit of Figure 1b was used, with a power rheostat replacing the fixed-value power resistor. A contact thermometer was used to register the temperature at the top surface of the solar modules. Furthermore, irradiance at the moment of the test was registered through a portable solar power meter. After this survey, spectral response measurements were performed.
On each day of measurement, the watt-hour meters recorded the measuring time interval during which the PV modules received sunlight, and the amount of energy generated by each panel. The meters were switched on and off simultaneously, producing the same amount of time for the two modules. In addition, only days with measurement intervals longer than one hour were considered valid.
The following analysis variables were calculated with the experimental data: relative efficiency, mean unitary power, radiation level, and potential for power generation. Relative efficiency is the ratio between the amount of energy generated in a day by the solar module with the color filter and the energy produced by the module without a filter, which is used as the basis for comparison, as indicated by Equation (1):
where ηR is the relative efficiency (percentage value), EPV2 is the amount of energy generated by Panel 2 (in W·h), and EPV1 is the amount of energy produced by Panel 1. For example, if on a given day the module with the red filter generates 12 W·h and the module without the filter generates 60 W·h, there is a relative efficiency of 20% for this filter. The visible light filter has the characteristic of blocking the passage of the infrared rays, allowing all visible sunlight to pass through it. Due to that fact, in order to obtain the infrared relative efficiency, it is necessary to calculate the complement (100%—ηR-VISIBLE LIGHT) of the directly-obtained values of relative efficiency for the visible light filter in order to have values that are coherent with the other filters.
The mean unitary power is defined as the ratio between the amount of energy generated by the panel without color filters and the measurement time interval for each square meter of the module’s area, according to Equation (2). Although it is not directly related to the spectral response of photovoltaic cells, this magnitude is very useful for the analysis of local irradiance conditions. It is handy for the design of photovoltaic systems (in which an estimation of the energy production is required), and allows forecasting of the amount of energy produced in different climatic conditions, without having to measure the daily irradiance.
where is the mean unitary power (in W·m−2), nCEL is the number of PV cells in the panel, ACEL is the area of a cell (in m2), and Δt is the measurement time interval converted to decimals.
The calculation of the mean unitary power allows each day of measurement to be classified according to the level of radiation received by the photovoltaic module without a filter. Thus, the values of mean unitary power obtained over the measurement period were grouped into five categories as shown in Table 1.
The potential for power generation indicates how much power a photovoltaic generation plant installed in a particular location can produce in a given period (monthly, seasonally, or annually, for example). Its calculation is expressed in Equation (3):
where is the potential for power generation (in W) and nM is the number of mean unitary power measurements in the period considered.
Two correction factors were applied to the relative efficiency values found for each filter. The F1 factor minimizes the intrinsic difference between the capacity of the energy production of the photovoltaic modules. Both modules are of the same model and underwent the same manufacturing process. However, they may show small differences in their characteristic curves, which may result in a difference in the amount of energy generated by each panel, even if they are subjected to similar conditions of irradiance and temperature. The F1 factor is calculated through 15 experimental measurements, made on non-consecutive and randomly-chosen days during the measurement period, in which no filter was installed on both photovoltaic panels. The average relative efficiency values of each measurement were calculated and converted from percentage to absolute value, thus obtaining the F1 factor, according to Equation (4):
where is the average relative efficiency (percentage value).
The correction factor F2 serves to mathematically make the total irradiance of all filters the same, in order to eliminate the influence of the different total irradiance levels of each color filter. The total irradiance is calculated by applying the SED curve of each color filter to the standard AM1.5 solar spectrum and then integrating it from 280–4000 nm. The irradiances are, respectively, 503.6 W·m−2 for visible light filter; 537.5 W·m−2 for red; 509.0 W·m−2 for green; 567.8 W·m−2 for blue; 757.7 W·m−2 for yellow; 684.8 W·m−2 for frost; 656.1 W·m−2 for amber; and 624.5 W·m−2 for lavender.
By using the F2 correction factor, the spectral distribution curves of each filter are different, but the solar cells always receive the same total irradiance. To calculate this factor, the spectral distribution curves of each filter are applied to the standard AM1.5 spectrum, given by the ASTM International G173-03:2012 standard [34], and integration is performed in the wavelength range from 280–4000 nm, obtaining the total irradiance value. Then, these values are normalized amongst each other, and the total blue filter irradiance is chosen as the reference value, according to Equation (5). The blue filter was chosen because it has the highest total irradiance among the primary filters; however, any other filter could have been chosen as the reference. The choice of the reference value does not affect the results.
where F2f is the correction factor F2 specific for the f filter (dimensionless), GBLUE is the total blue filter irradiance (in W·m−2), and Gf the total irradiance for the f filter (in W·m−2).
The correction factors F1 and F2 are applied to each calculated relative efficiency value for all eight filters employed in this work:
where ηr corr is the corrected relative efficiency (percentage value). Therefore, by using the two proposed correction factors, the only aspect that influences the spectral response of photovoltaic modules is the difference between the spectral energy distribution curves of each filter used in this work.
Then, statistical measures are used for the analyses: mean, median, standard deviation, minimum value, and maximum value. These measures are arranged in a modified box plot, which allows a visual comparison between the relative efficiency obtained for each filter and shows the respective numerical values. The discussion of the results occurs through comparisons between the statistics of each filter.
3. Results and Discussion
3.1. Electrical Characteristics of Photovoltaic Modules
The experimental data survey to determine the electrical characteristics of the photovoltaic panels occurred in April 2016, on days of clear sky without any clouds. Table 2 shows the results of the experimental survey for each panel in the real value columns and the nominal values of the panels for comparison.
From the information in Table 2, it can be concluded that the modules have different characteristics from the nominal specifications. In particular, it is noted that the maximum power and the open circuit voltage are considerably smaller. These electrical characteristics were significantly affected by the high working temperature of the cells, which was more than twice as high as the nominal test temperature. This implies lower form factors for the panels, as well as values different from nominal for the voltage and current at the maximum power. Although cell temperature is not the only major factor that influences its electrical characteristics, it plays an important role on the real energy generation capacity of photovoltaic modules.
The degradation of the cells due to exposure to weather caused a reduction in the current supply capacity of the modules, which can be seen from the lower values of the short-circuit current. Although the irradiance at the time of measurements was lower than the nominal value (0.92% and 0.5% lower, respectively, for PV1 and PV2), the short-circuit current was 7.89% lower than the nominal value for Panel 1 and 1.18% lower for Panel 2, indicating that the effect of cell degradation was predominant. It is noteworthy that the short-circuit current varied linearly with the irradiance received by the panel; therefore, the expected reduction of this variable was lower than the recorded one. In addition to the differences in nominal characteristics, there were differences between the two modules: Panel 2 generally showed better characteristics than Panel 1. This justifies the use of the F1 correction factor.
3.2. Irradiance Conditions
One hundred and fifty-five valid measurements were made between 16 October 2015 and 27 September 2016. The average value of the measurement time intervals over this period was 5 h, 3 min, and 38 s. The measurements were obtained predominantly on days with high radiation level, representing 43.87% of the total, followed by 21.94% of the days presenting medium-low radiation (caused by variable cloudiness), 15.48% with medium-high, 10.32% with very low, and 8.39% with low radiation level.
Table 3 shows the mean values of the potential for power generation divided by season. Spring can be characterized as a season with great variability in cloudiness. In summer, periods of high radiation alternate with days of heavy cloudiness and rainfall, which cause low levels of radiation. The periods of cloudiness in these stations implied lower potentials for power generation. The autumn is characterized by long sunny periods interrupted by brief cloudy and rainy periods. Similar to autumn, in winter, there are mainly days with high radiation, but interspersed by brief periods of cloudiness. Autumn and winter are the most favorable seasons to use photovoltaic energy, presenting the greatest potentials for power generation.
3.3. Spectral Response of Photovoltaic Cells
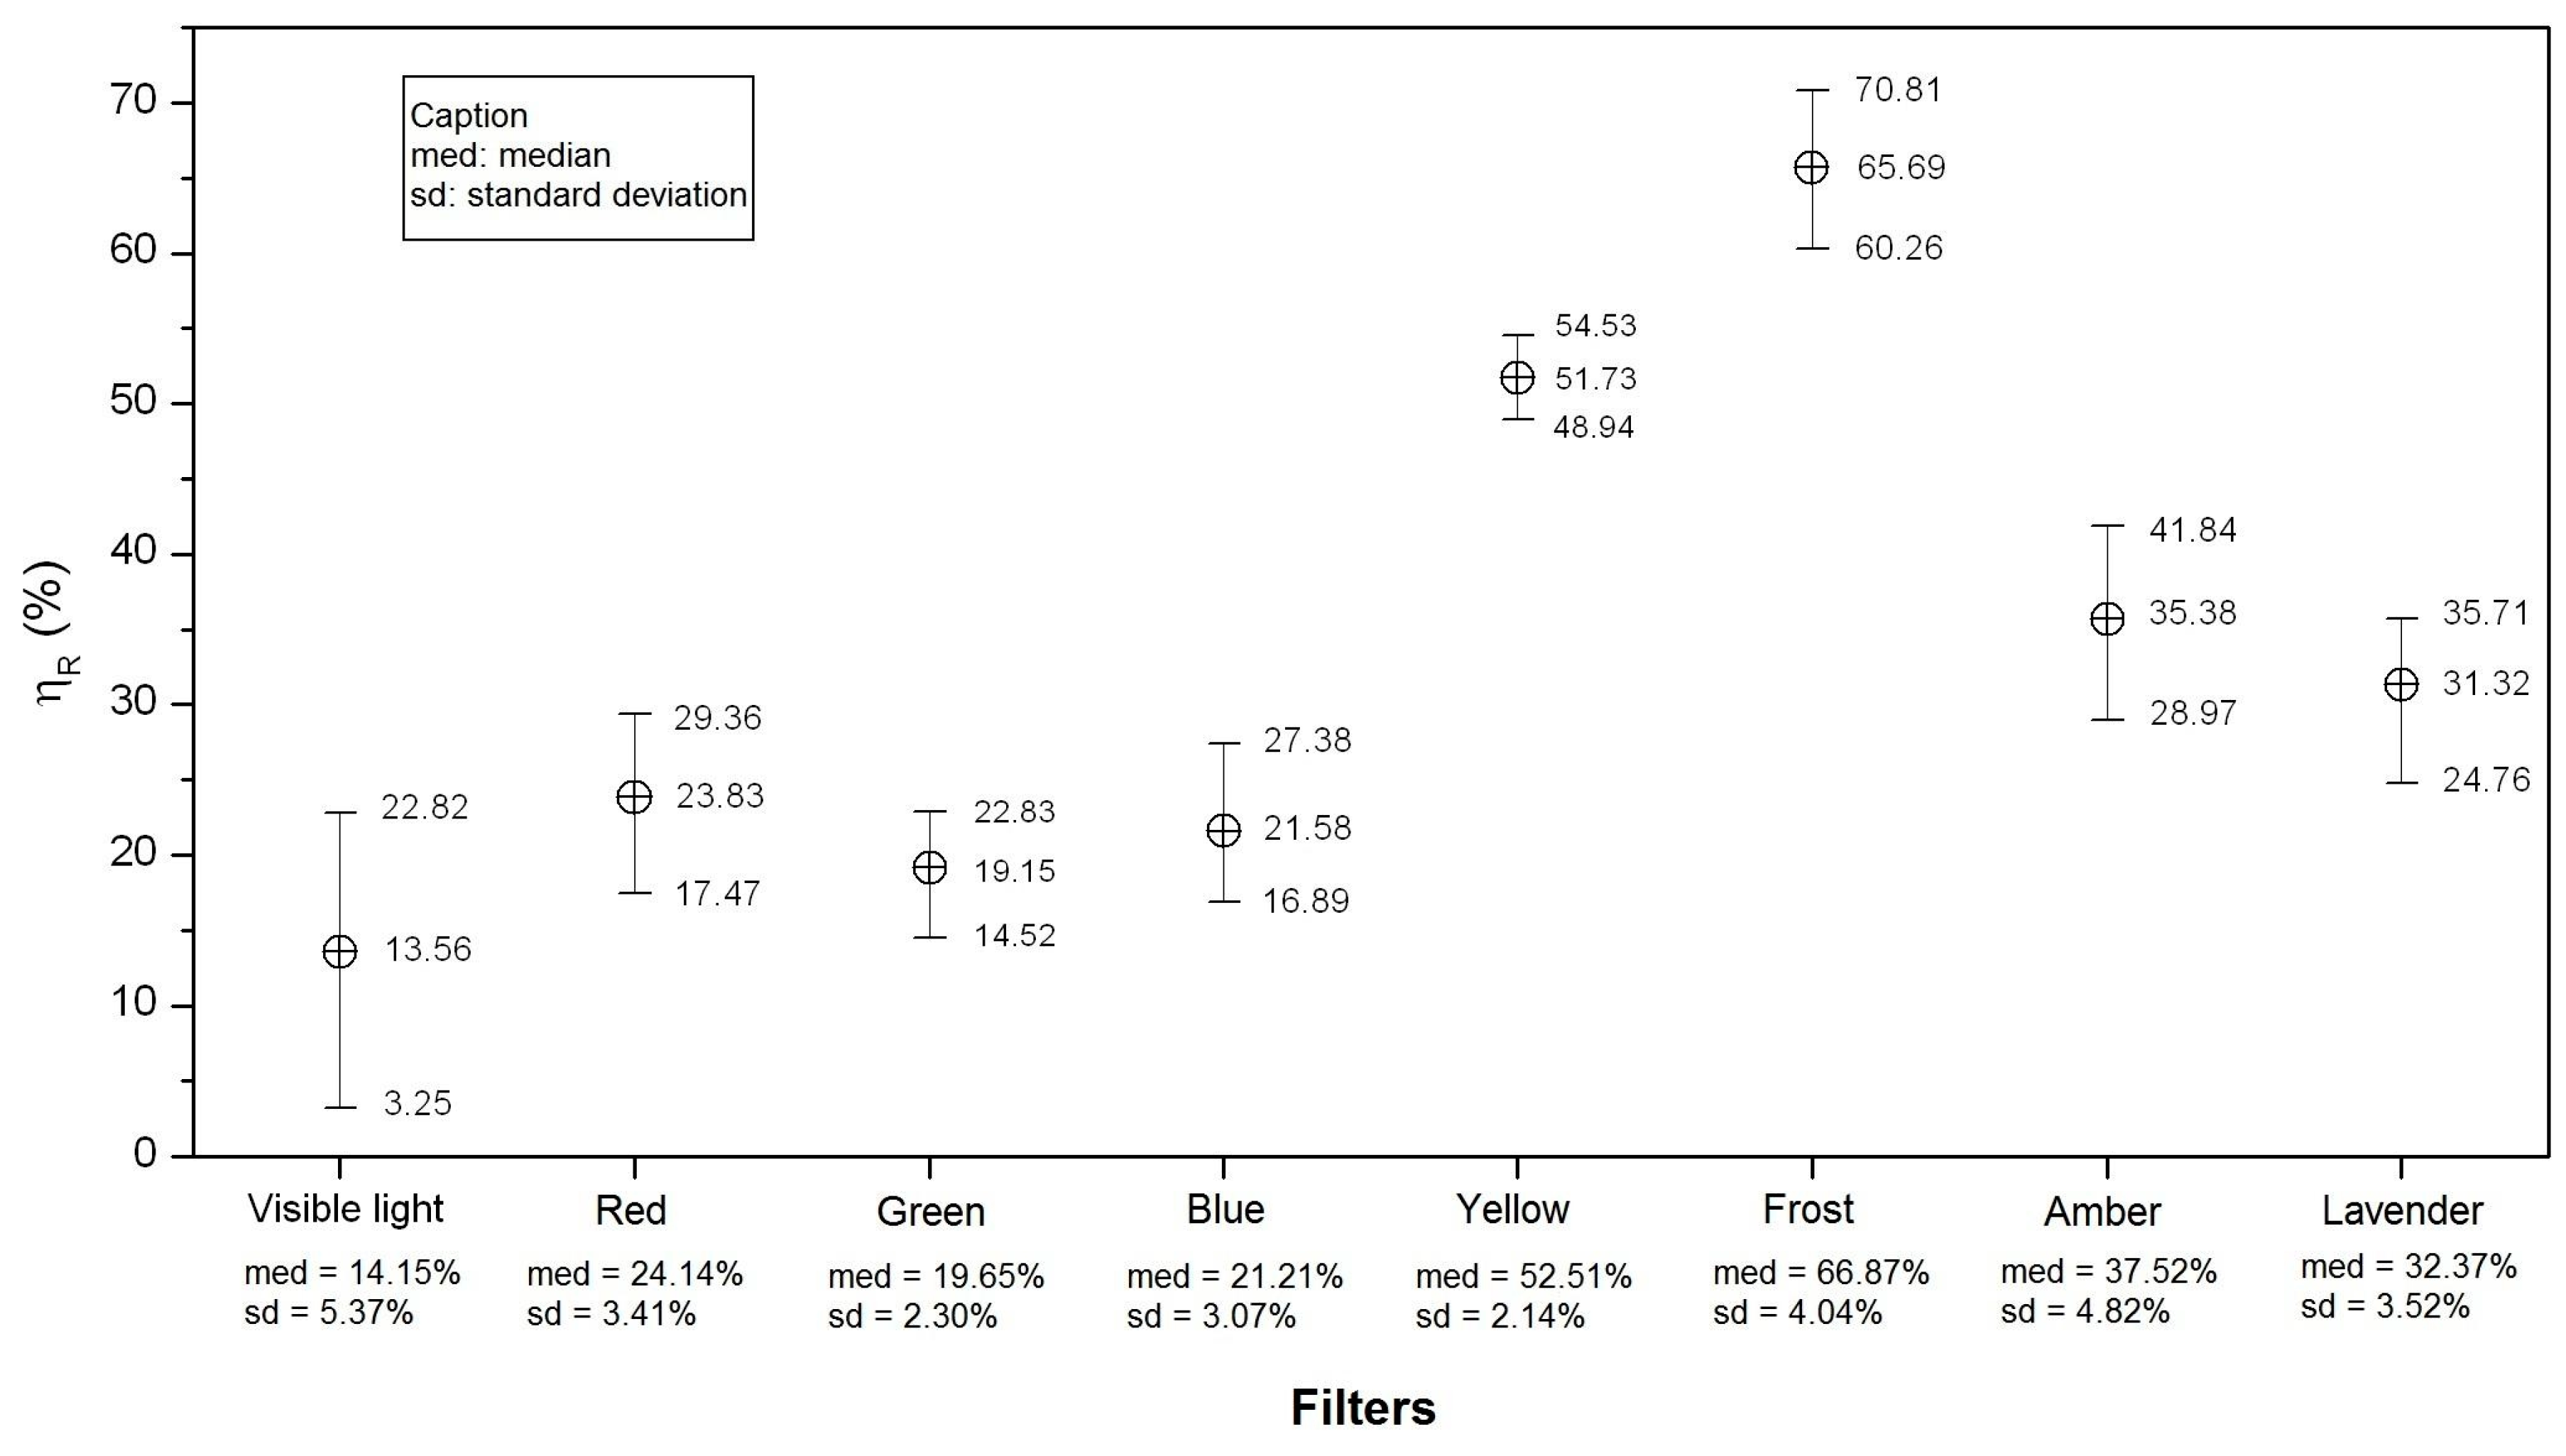
The correction factors F1 and F2 were applied to the relative efficiency values of each of the eight color filters used, and the mean, median, standard deviation, minimum, and maximum values were determined for each dataset. The results are shown in the modified box plots of Figure 4.
Comparing the mean and median of each filter, one can note that these quantities have close values for all filters. The median is a measure of central tendency that is not influenced by extreme values of the data range [35,36]; therefore, this means that the extreme values of the measurements do not interfere with the result of the average calculation, and thus, its mean is a significant parameter for comparing the relative efficiency of each filter.
The standard deviations are indicators of the level of uncertainty of the experiment, and assumed relatively small values compared to their respective means, thus showing that the relative efficiency did not vary greatly over the measurement period. This implies that low uncertainties were obtained in the measurements. An exception was the infrared result of the visible light filter; its standard deviation presented the highest value, showing a greater amplitude of corrected relative efficiency variation, ranging from 3.25–22.82% for an average value of 13.56%. The daily variations in the filter efficiency were caused by climatic variations at the site of the experiments, such as changes in cloudiness, ambient temperature, and atmospheric variations, which caused changes in the received solar spectrum at the ground level, resulting in different responses of the photovoltaic panels for each measurement day. Relative efficiency evaluates the energy output of one module related to the other, and since the two panels were installed side-by-side and were subject to the same climatic conditions, daily variations in temperature and solar spectrum also influenced both of them. Furthermore, the temperature raise caused by covering the Panel 2 with the color filters was not considered at this work in order to simplify the measurement process, but it could also have influenced the uncertainty levels of the results.
When comparing the average relative efficiency of the red, green, and blue primary filters, it can be seen that the photovoltaic panel produced more energy in the red wavelength range, with a relative efficiency of 23.83%, followed by the blue and green ones, respectively. In this way, it can be concluded that photovoltaic cells were more sensitive to radiation in the red band, which starts at about 650 nm, according to Figure 2b. It is interesting to note that although the response to the red range was visually the greatest, the red filter was the darkest of all, which could lead to the hypothesis that this would be the filter with the lowest rate of light transmission, and consequently the lowest relative efficiency. This means that the visual appearance was not a relevant factor for its spectral response; the energy spectral distribution curve determined the response of each filter.
Furthermore, one can note that there was a small difference in the energy production between the red, green, and blue filters, ranging from 19.15% in the green one to 23.83% in the red one. This shows that there is no specific and isolated range in which the production of energy is far superior or very inferior to the others. All wavelength bands contributed significantly to the generation of energy in the crystalline silicon photovoltaic cells.
Regarding the visible light filter, the initial hypothesis—based on the electrical characteristics of photovoltaic cells—was that the module should not respond positively to the infrared radiation, since the literature indicates that the higher the working temperature of the cells, the lower the energy production is [4,6,14,15]. For this reason, it was expected that when installing the visible light filter on Panel 2, an increase in the energy generated relative to Panel 1 would occur, because the IR radiation (responsible for the increase in temperature) would be blocked. However, the average value of relative corrected efficiency in Figure 4 indicated that there was in fact a reduction in the energy production. This means that the panel responded to infrared radiation and generated a considerable amount of energy in this wavelength range.
IR radiation caused two simultaneous effects on the photovoltaic panel: on the one hand, it increased the panel temperature, which reduced the power generated; on the other hand, the module responded to this wavelength range, contributing to an increase in the power generated. The average infrared relative efficiency of the visible light filter was 13.56% (positive value), which implies that the effect of infrared energy generation outweighed the losses caused by the rise in temperature. If the effect of temperature exceeded that of energy production, the infrared relative efficiency would result in negative values (i.e., relative efficiency of visible light filter above 100%) because the energy generated by Panel 2 would be higher than that of Panel 1 due to the reduction of the temperature provided by the visible light filter.
Thus, it is concluded that infrared radiation was an important component of the sunlight spectrum for polycrystalline photovoltaic cells and cannot be suppressed, which would cause a reduction in the power generated by the photovoltaic panel, and in turn, a reduction of the panel efficiency. For this reason, in order to minimize the losses caused by an increase in the working temperature of the module, it is necessary to find other methods that do not cause the reduction or blockage of the infrared radiation captured by the panel.
Secondary filters have SED curves that cover multiple wavelength band-passes simultaneously. Thus, there is no way to analyze the response of photovoltaic cells to an isolated range of wavelengths; the analysis of the results of these filters was done by directly comparing them to the primary filters. The results of the relative efficiency of these filters showed that several wavelength ranges of sunlight contributed to the energy generation of photovoltaic modules, from ultraviolet to infrared; i.e., there was no wavelength range that was harmful to the capacity of the energy production of silicon polycrystalline photovoltaic modules.
4. Conclusions
In this work, the way in which the electric energy generation of photovoltaic cells varied according to different wavelength ranges of solar light spectrum was verified. The cells were tested under actual operating conditions and were subject to environmental variations at the site where they were installed.
There was a difference in the spectral response of the photovoltaic modules in the red, green, and blue bands, with relative efficiencies of 23.83%, 19.15%, and 21.58%, respectively. It can be concluded that polycrystalline silicon panels did not respond uniformly to sunlight, being more sensitive to the red band (longer wavelengths) and less sensitive to the green band, although the difference between the bands was small.
The infrared response—indicated by the relative efficiency of 13.56%—proved that the cells are capable of generating energy in the non-visible range of the spectrum. Besides contributing to the production of energy, the infrared was responsible for the generation of the heat on the cells. However, the effect of heat was overcome by the generation of energy, from which it can be concluded that the infrared is an important component of the sunlight spectrum and the reason why it cannot be suppressed. Thus, by using methods of increasing the efficiency of photovoltaic panels by reducing cell temperature, one cannot reduce or block infrared radiation, as a reduction in the efficiency of the device may occur. One has to find ways to reduce the temperature without damaging the infrared band.
As a suggestion for future works, it is proposed to carry out tests of photovoltaic panels of higher power under real operating conditions in order to verify if there are significant differences in the behavior between low- and high-power modules. Other cell types could be investigated so that any differences in the spectral response of different photovoltaic technologies could be verified. An alternative work can be developed by replacing the color filters used (made of plastic material) with dichroic filters, which present more precise spectral distribution curves, although they have a higher cost. Finally, further investigations on the relation between the spectral response to individual wavelength ranges and the temperature increase of photovoltaic modules can be performed.
Supplementary Materials
The following are available online at www.mdpi.com/1996-1073/10/8/1178/s1. Table S1: Collected experimental data.
Acknowledgments
The present work was carried out with the support of CNPq, National Council of Scientific and Technological Development—Brazil, process number 134367/2015-4.
Author Contributions
Evaldo C. Gouvêa and Teófilo M. Souza conceived and designed the experiments; Evaldo C. Gouvêa performed the experiments; Evaldo C. Gouvêa and Teófilo M. Souza analyzed the data; Pedro M. Sobrinho and Teófilo M. Souza contributed materials and analysis tools; Evaldo C. Gouvêa wrote the paper.
Conflicts of Interest
The authors declare no conflict of interest.
References
- International Energy Agency (IEA). Key World Energy Statistics 2016; International Energy Agency: Paris, France, 2015; Available online: http://www.iea.org/publications/freepublications/publication/KeyWorld2016.pdf (accessed on 11 December 2016).
- Mekhilef, S.; Saidur, R.; Kamalisarvestani, M. Effect of dust, humidity and air velocity on efficiency of photovoltaic cells. Renew. Sustain. Energy Rev. 2012, 16, 2920–2925. [Google Scholar] [CrossRef]
- Andrews, R.W.; Pearce, J.M. The effect of spectral albedo on amorphous silicon and crystalline silicon solar photovoltaic device performance. Sol. Energy 2013, 91, 233–241. [Google Scholar] [CrossRef]
- Cañete, C.; Carretero, J.; Sidrach-de-Cardona, M. Energy performance of different photovoltaic module technologies under outdoor conditions. Energy 2014, 65, 295–302. [Google Scholar] [CrossRef]
- Dirnberger, D.; Blackburn, G.; Müller, B.; Reise, C. On the impact of solar spectral irradiance on the yield of different PV technologies. Sol. Energy Mater. Sol. Cells 2015, 132, 431–442. [Google Scholar] [CrossRef]
- Kurnic, J.; Jankovec, M.; Brecl, K.; Topic, M. Outdoor testing of PV module temperature and performance under different mounting and operational conditions. Sol. Energy Mater. Sol. Cells 2011, 95, 373–376. [Google Scholar] [CrossRef]
- Ishii, T.; Otani, K.; Takashima, T. Effects of solar spectrum and module temperature on outdoor performance of photovoltaic modules in round-robin measurements in Japan. Prog. Photovolt. 2011, 19, 141–148. [Google Scholar] [CrossRef]
- Huld, T.; Amillo, A.M.G. Estimating PV Module Performance over Large Geographical Regions: The Role of Irradiance, Air Temperature, Wind Speed and Solar Spectrum. Energies 2015, 8, 5159–5181. [Google Scholar] [CrossRef] [Green Version]
- Kaldellis, J.K.; Kapsali, M.; Kavadias, K.A. Temperature and wind speed impact on the efficiency of PV installations. Experience obtained from outdoor measurements in Greece. Renew. Energy 2014, 66, 612–624. [Google Scholar] [CrossRef]
- Sargunanathan, S.; Elango, A.; Mohideen, S.T. Performance enhancement of solar photovoltaic cells using effective cooling methods: A review. Renew. Sustain. Energy Rev. 2016, 64, 382–393. [Google Scholar] [CrossRef]
- Bahaidarah, H.M.S.; Baloch, A.A.B.; Gandhidasan, P. Uniform cooling of photovoltaic panels: A review. Renew. Sustain. Energy Rev. 2016, 57, 1520–1544. [Google Scholar] [CrossRef]
- Jakhar, S.; Soni, M.S.; Gakkhar, N. Historical and recent development of concentrating photovoltaic cooling technologies. Renew. Sustain. Energy Rev. 2016, 60, 41–59. [Google Scholar] [CrossRef]
- Amrouche, B.; Guessoum, A.; Belhamel, M. A simple behavioural model for solar module electric characteristics based on the first order system step response for MPPT study and comparison. Appl. Energy 2012, 91, 395–404. [Google Scholar] [CrossRef]
- Hernandez, J.; Vallejo, W.; Gordillo, G. Practical method for estimating the power and energy delivered by photovoltaic modules operating under non-standard conditions. Prog. Photovolt. 2013, 21, 867–875. [Google Scholar] [CrossRef]
- García-Domingo, B.; Aguilera, J.; Casa, J.; Fuentes, M. Modelling the influence of atmospheric conditions on the outdoor real performance of a CPV (Concentrated Photovoltaic) module. Energy 2014, 70, 239–250. [Google Scholar] [CrossRef]
- Nofuentes, G.; García-Domingo, B.; Muñoz, J.V.; Chenlo, F. Analysis of the dependence of the spectral factor of some PV technologies on the solar spectrum distribution. Appl. Energy 2014, 113, 302–309. [Google Scholar] [CrossRef]
- Nagae, S.; Toda, M.; Minemoto, M.; Takakura, H.; Hamakawa, Y. Evaluation of the impact of solar spectrum and temperature variations on output power of silicon-based photovoltaic modules. Sol. Energy Mater. Sol. Cells 2006, 90, 3568–3575. [Google Scholar] [CrossRef]
- Fernandez, E.F.; Soria-Moya, A.; Almonacid, F.; Aguilera, J. Comparative assessment of the spectral impact on the energy yield of high concentrator and conventional photovoltaic technology. Sol. Energy Mater. Sol. Cells 2016, 147, 185–197. [Google Scholar] [CrossRef]
- Alonso-Abella, M.; Chenlo, F.; Nofuentes, G.; Torres-Ramírez, M. Analysis of spectral effects on the yield of different PV (photovoltaic) technologies: The case of four specific sites. Energy 2014, 67, 435–443. [Google Scholar] [CrossRef]
- Dirnberger, D.; Müller, B.; Reise, C. On the uncertainty of energetic impact on the yield of different PV technologies due to varying spectral irradiance. Sol. Energy 2015, 111, 82–96. [Google Scholar] [CrossRef]
- Dijk, L.; Paetzold, U.W.; Blab, G.A.; Schropp, R.E.I.; Vece, M.D. 3D-printed external light trap for solar cells. Prog. Photovolt. 2016, 24, 623–633. [Google Scholar] [CrossRef] [PubMed]
- Chang, P.K.; Hsieh, P.T.; Tsai, F.J.; Lu, C.H.; Yeh, C.H.; Houng, M.P. Improvement of the short-circuit current density and efficiency in micromorph tandem solar cells by an anti-reflection layer. Thin Solid Films 2011, 520, 550–553. [Google Scholar] [CrossRef]
- Atyaoui, M.; Dimassi, W.; Atyaoui, A.; Elyagoubi, J.; Ouertani, R.; Ezzaouia, H. Improvement in photovoltaic properties of silicon solar cells with a doped porous silicon layer with rare earth (Ce, La) as antireflection coatings. J. Lumin. 2013, 141, 1–5. [Google Scholar] [CrossRef]
- Liu, S.; Niu, X.; Shan, W.; Lu, W.; Zheng, J.; Li, Y.; Duan, H.; Quan, W.; Han, W.; Wronsky, C.R.; Yang, D. Improvement of conversion efficiency of multicrystalline silicon solar cells by incorporation a reactive ion etching texturing. Sol. Energy Mater. Sol. Cells 2014, 127, 21–26. [Google Scholar] [CrossRef]
- Chen, W.H.; Lin, H.H.; Hong, F.C.H. Improvement of conversion efficiency of multi-crystalline silicon solar cells using reactive ion etching with surface pre-etching. Thin Solid Films 2015, 597, 50–56. [Google Scholar] [CrossRef]
- Klampaftis, E.; Richards, B.S. Improvement in multi-crystalline silicon solar cell efficiency via addition of luminescent material to EVA encapsulation layer. Prog. Photovolt. 2011, 19, 345–351. [Google Scholar] [CrossRef]
- Atre, A.C.; Dionne, J.A. Realistic upconverter-enhanced solar cells with non-ideal absorption and recombination efficiencies. J. Appl. Phys. 2011, 110, 034505. [Google Scholar] [CrossRef]
- Apostoluk, A.; Zhu, Y.; Masenelli, B.; Delaunay, J.J.; Sibiński, M.; Znajdek, K.; Focsa, A.; Kaliszewska, I. Improvement of the solar cell efficiency by the ZnO nanoparticle layer via the down-shifting effect. Microelectron. Eng. 2014, 127, 51–56. [Google Scholar] [CrossRef]
- Bu, I.Y.Y. Self-assembled, wrinkled zinc oxide for enhanced solar cell performances. Mater. Lett. 2014, 122, 55–57. [Google Scholar] [CrossRef]
- Wen, L.; Chen, Q.; Song, S.; Yu, Y.; Jin, L.; Hu, X. Photon harvesting, coloring and polarizing in photovoltaic cell integrated color filters: Efficient energy routing strategies for power-saving displays. Nanotechnology 2015, 26, 265203. [Google Scholar] [CrossRef] [PubMed]
- Landrock, C.; Omrane, B.; Aristizabal, J.; Kaminska, B.; Menon, C. An improved light source using filtered tungsten lamps as an affordable solar simulator for testing of photovoltaic cells. In Proceedings of the 2011 IEEE 17th International Mixed-Signals, Sensors and System Test Workshop, Santa Barbara, CA, USA, 16–18 May 2011; IEEE: Los Alamitos, CA, USA, 2011; pp. 153–158. [Google Scholar] [CrossRef]
- Centro de Pesquisas Meteorológicas Aplicadas à Agricultura (CEPAGRI). Climate of São Paulo State Cities: Guaratinguetá. Available online: http://www.cpa.unicamp.br/outras-informacoes/clima-dos-municipios-paulistas.html (accessed on 25 October 2016).
- Centro de Referência para Energia Solar e Eólica Sérgio Brito (CRESESB). Solar Potential—Sundata. Available online: http://www.cresesb.cepel.br/index.php?section=sundata (accessed on 26 August 2016).
- ASTM International. ASTM G173-03: Standard Tables for Reference Solar Spectral Irradiances: Direct Normal and Hemispherical on 37° Tilted Surface; ASTM International: West Conshohocken, PA, USA, 2012. [Google Scholar]
- Montgomery, D.C. Design and Analysis of Experiments, 8th ed.; John Wiley & Sons: Hoboken, NJ, USA, 2013. [Google Scholar]
- Triola, M.F. Introdução à Estatística, 10th ed.; LTC: Rio de Janeiro, Brazil, 2008. [Google Scholar]
Figure 1.
Experimental setup. (a) Installation of the photovoltaic (PV) modules, with the identification of the panels. At the time recorded, a green color filter was installed on the PV2 module; (b) The circuit used to record the energy generated by each panel.
Figure 1.
Experimental setup. (a) Installation of the photovoltaic (PV) modules, with the identification of the panels. At the time recorded, a green color filter was installed on the PV2 module; (b) The circuit used to record the energy generated by each panel.

Figure 2.
Spectral energy distribution (SED) curves of the primary filters: (a) visible light; (b) red; (c) green; (d) blue. The original names of the filters adopted by the manufacturer are, respectively: Heat Shield, Medium Red, Dark Green and Medium Blue.
Figure 2.
Spectral energy distribution (SED) curves of the primary filters: (a) visible light; (b) red; (c) green; (d) blue. The original names of the filters adopted by the manufacturer are, respectively: Heat Shield, Medium Red, Dark Green and Medium Blue.

Figure 3.
Spectral energy distribution curves of the secondary filters: (a) yellow; (b) frost; (c) amber; (d) lavender. The original names of the filters adopted by the manufacturer are, respectively: Medium Yellow, Hampshire Frost, Dark Amber, and Special Medium Lavender.
Figure 3.
Spectral energy distribution curves of the secondary filters: (a) yellow; (b) frost; (c) amber; (d) lavender. The original names of the filters adopted by the manufacturer are, respectively: Medium Yellow, Hampshire Frost, Dark Amber, and Special Medium Lavender.

Figure 4.
Comparison among the corrected relative efficiency of color filters. The values inside the box plot represent, from top to bottom, maximum value, mean value, and minimum value.
Figure 4.
Comparison among the corrected relative efficiency of color filters. The values inside the box plot represent, from top to bottom, maximum value, mean value, and minimum value.


Table 1.
Radiation levels.
| Radiation Level | (W/m2) |
|---|---|
| High | ≥61.6 |
| Medium-high | 50.4–61.599 |
| Medium-low | 28–50.399 |
| Low | 14–27.999 |
| Very low | ≤13.999 |
Table 2.
Nominal and real electrical characteristics of photovoltaic panels.
| Characteristic | Nominal Value | Real Value (PV1) | Real Value (PV2) |
|---|---|---|---|
| Short-circuit current | 1.61 A | 1.483 A | 1.591 A |
| Open-circuit voltage | 21 V | 17.897 V | 17.89 V |
| Irradiance | 1000 W·m−2 | 990.75 W·m−2 | 993.75 W·m−2 |
| Cell temperature | 25 °C | 57 °C | 58.9 °C |
| Maximum power | 22 W | 16.07 W | 17.66 W |
| Voltage at Maximum power | 16.8 V | 11.99 V | 14.09 V |
| Current at Maximum power | 1.31 A | 1.340 A | 1.255 A |
| Form factor | 65.09% | 60.53% | 62.13% |
Table 3.
Potential for power generation divided by seasons of the year.
| Season | nM | (W) |
|---|---|---|
| Spring | 29 | 7.54 |
| Summer | 31 | 8.51 |
| Autumn | 50 | 10.39 |
| Winter | 45 | 10.96 |
© 2017 by the authors. Licensee MDPI, Basel, Switzerland. This article is an open access article distributed under the terms and conditions of the Creative Commons Attribution (CC BY) license (http://creativecommons.org/licenses/by/4.0/).
Share and Cite
MDPI and ACS Style
Gouvêa, E.C.; Sobrinho, P.M.; Souza, T.M. Spectral Response of Polycrystalline Silicon Photovoltaic Cells under Real-Use Conditions. Energies 2017, 10, 1178. https://doi.org/10.3390/en10081178
AMA Style
Gouvêa EC, Sobrinho PM, Souza TM. Spectral Response of Polycrystalline Silicon Photovoltaic Cells under Real-Use Conditions. Energies. 2017; 10(8):1178. https://doi.org/10.3390/en10081178
Chicago/Turabian StyleGouvêa, Evaldo C., Pedro M. Sobrinho, and Teófilo M. Souza. 2017. "Spectral Response of Polycrystalline Silicon Photovoltaic Cells under Real-Use Conditions" Energies 10, no. 8: 1178. https://doi.org/10.3390/en10081178
Note that from the first issue of 2016, this journal uses article numbers instead of page numbers. See further details here.