Tidal Turbines’ Layout in a Stream with Asymmetry and Misalignment


Laboratoire de Génie Côtier et Environnement (LGCE), Cerema, Direction Eau Mer et Fleuves, ER, 155 rue Pierre Bouguer, Technopôle Brest-Iroise, BP 5, 29280 Plouzané, France
*
Author to whom correspondence should be addressed.
Energies 2017, 10(11), 1892; https://doi.org/10.3390/en10111892
Submission received: 17 October 2017
/
Revised: 8 November 2017
/
Accepted: 11 November 2017
/
Published: 17 November 2017
(This article belongs to the Section L: Energy Sources)
Abstract
:A refined assessment of tidal currents variability is a prerequisite for successful turbine deployment in the marine environment. However, the numerical evaluation of the tidal kinetic energy resource relies, most of the time, on integrated parameters, such as the averaged or maximum stream powers. Predictions from a high resolution three-dimensional model are exploited here to characterize the asymmetry and misalignment between the flood and ebb tidal currents in the “Raz de Sein”, a strait off western Brittany (France) with strong potential for array development. A series of parameters is considered to assess resource variability and refine the cartography of local potential tidal stream energy sites. The strait is characterized by strong tidal flow divergence with currents’ asymmetry liable to vary output power by 60% over a tidal cycle. Pronounced misalignments over 20 are furthermore identified in a great part of energetic locations, and this may account for a deficit of the monthly averaged extractable energy by more than 12%. As sea space is limited for turbines, it is finally suggested to aggregate flood and ebb-dominant stream powers on both parts of the strait to output energy with reduced asymmetry.
1. Introduction
The hydro-kinetic energy of tidal currents has the potential to contribute to a significant part of the exploitation of marine renewable resources in industrial countries, bringing a highly predictable power with reduced visual impacts for coastal users and communities [1]. Successful deployments of tidal kinetic energy converters require accurate resource assessments to optimize the performance, design and location of devices while reducing investor risks and improving governments energy plans. Regional sites’ selection relies usually on GIS (Geographic Information Systems) decision-aid tools to conduct a multi-criteria analysis of the physical, environmental, practical and economical constraints of tidal energy projects [2,3,4]. As extensive in situ observations cannot reasonably encompass the tidal hydrodynamics conditions at the regional scale, the associated resource assessments rely, most of the time, on numerical modeling tools. Besides the uncertainty of these large-scale predictions [5,6,7], these resource assessments consider generally a restricted number of parameters, primarily the averaged and maximum amplitude of tidal current and associated stream power, setting aside further studies about the spatial and temporal variability of available kinetic energy.
However, refined investigations of tidal current variabilities are fundamental in the early stages of devices’ development, focusing, in particular, on the variations of current amplitude and directions between flood and ebb (asymmetry and misalignment). Indeed, as stream power output is related to the velocity cubed, tidal current asymmetry may strongly impact the extractable energy over a tidal cycle, by modifying the available kinetic energy between the flood and ebb phases. On the basis of a circulation model in the Orkney archipelago (Scotland, UK), Neill et al. [8] reported thus that a asymmetry in tidal current velocity results in a asymmetry in power density. Rectilinear misalignment between the flood and ebb current directions may furthermore impact the performance of horizontal-axis turbines, designed to harvest uni-directional flow. By relying on experimental data and a Blade Element Momentum (BEM) code, Galloway et al. [9] suggest that power reductions may be apparent for turbine yaw above 7.5 with an approximate reduction at 22.5 in misalignment directions. Further effects may appear on the capacity factor and structural side loading [10]. It is thus suggested that flow deviations greater than 20 from the axial turbine direction will compromise the structural integrity of devices [11].
As tidal stream energy sites occupy, in a high proportion, restricted surfaces in the vicinity of headlands and straits characterized by complex coastline geometry and significant water-depth variations [12], numerical modeling at high-spatial resolution, below 100 m, is required to assess tidal stream power variability. However, except local studies such as simulations conducted by Neill et al. [8] in Orkney archipelago, Lewis et al. [7] in the Irish sea or Guillou and Chapalain [13] in the Fromveur Strait (western Brittany, France), few numerical modeling studies have investigated the asymmetry and misalignment of tidal currents and its effects on the generated technical resource, at the scale of potential stream energy sites.
The present investigation complements these studies by (1) assessing tidal current variability (asymmetry and misalignment) and associated stream power and (2) identifying the optimal areas for the implementation of tidal kinetic energy converters. The application is conducted in the “Raz de Sein” (western Brittany, Figure 1), a region of interest for tidal array development along the coasts of France (Section 2.1).
The numerical approach is based on a three-dimensional (3D) circulation model that computes at high-spatial resolution the evolution of tidal current velocities in the area of interest (Section 2.2). Model predictions are evaluated against available in situ measurements of current amplitude and direction in the vicinity of the “Raz de Sein” (Section 3.1). This local assessment of the model’s performance is supplemented by a synoptic comparison with established database of tidal currents. Beyond the cartography of the annual averaged and maximum tidal stream powers (Section 3.2), numerical predictions are exploited to characterize resource variability focusing on current asymmetry and rectilinear misalignments between the flood and ebb directions (Section 3.3.1 and Section 3.3.2). Setting aside advanced turbine array optimization methods [14,15], a series of criteria based on water depths, current amplitude, asymmetry and misalignment are retained to refine cartographies of the potential sea space for tidal stream energy extraction (Section 3.4). Two turbine systems are considered based on horizontal axis and yaw drive-based devices, respectively. This investigation results in the optimal location of tidal kinetic energy converters and promotes the aggregation strategy of stream powers in the area of interest.
2. Materials and Methods
2.1. Study Site
The tidal strait considered here is located in the southwestern part of Brittany (France) and separates the isle of Sein from the Raz headland over a distance of around 6 km (Figure 1). The bathymetry is characterized by a spatial gradient along the latitude with mean water depths between 25 and 30 m in the south and greater than 40 m in the north. A series of rocky islets, on which the lighthouse of Tévennec rests, separates the northern part of the strait in two channels orientated along the northwestern and northeastern directions, respectively. The spatial distribution of water depths shows furthermore a prominent longitudinal shoal, entitled the “Chaussée de Sein”, surrounding the isle of Sein over a distance of around 25 km with mean water depths mostly below 15 m. Whereas the surrounding environment presents a highly heterogeneous spatial distribution of sediment bed types with a succession of gravel deposits and localized sand supplies [16], the local area is covered by rocky substrates as an extension of the “Chaussée de Sein” in the strait.
The “Raz de Sein” experiences strong tidal currents with peak velocities liable to exceed in mean spring conditions [17]. Furthermore, significant tidal recirculations with a diameter of around 2 km appear during flood and ebb peak periods, on both sides of the flow emerging from the strait. As local assessments of tidal stream power around France have primarily focused on the two prominent sites of the Alderney Race (“Raz Blanchard”) in the western English Channel [18,19] and the Fromveur Strait [20,21] in northwestern Brittany, a reduced number of investigations was conducted in the “Raz de Sein”. However, the values of the tidal velocities (>2.5 ) and the water depths (>25 m) match the basic conditions required for the implementation of first-generation turbine technologies, covering the great part of existing prototype devices in pre-commercial demonstration stages [22]. Whereas this site has not been retained by the French government for the primary development of tidal farm projects, the extractable stream power may thus provide, at the local scale, a very promising solution to restrict electricity consumption of the isle of Sein, currently based on an expensive and polluting fuel power station.
2.2. Model Description
The numerical modeling is based on TELEMAC 3D, the 3D circulation module of the finite-element modeling system TELEMAC (Version v7p2, EDF R&D, France) [23]. This module solves the continuity and Reynolds-averaged momentum equations on a planar unstructured computational grid duplicated along the vertical direction following a uniform -transformation. The horizontal grid is composed of 51,226 nodes with a spatial resolution of around 10 km at offshore sea boundaries to 30 m in the “Raz de Sein”, while 15 -levels are adopted along the vertical.
The 3D model setup is mainly based on the implementation performed by Guillou et al. [21] for the assessment of tidal stream power in the Fromveur Strait. However, the main features of the model’s configuration are briefly described hereafter as modifications have been made to databases considered in this simulation. The spatial distribution of the mean water depth derives from the HOMONIM (“Historique, Observation, MOdélisation des NIveaux Marins”) project (SHOM (“Service Hydrographique et Océanographique de la Marine”), Météo-France) [24]. It was completed in some parts of offshore areas by the regional database of Loubrieu et al. [25]. The flow is considered to be turbulent over a rough bottom. Following Guillou and Thiébot [20,26] and Guillou et al. [21], the associated roughness parameter is determined by matching sediment bottom types from the map established by Hamdi et al. [16] with roughness observations compiled by Soulsby [27]. The roughness parameter over rock outcrops, characterized by a relative uncertainty in relation to the shape of seabed features in potential stream energy sites [20], is fixed to . The horizontal eddy viscosity is parametrized following Smagorinsky [28] while the vertical viscosity is computed with the mixing length model proposed by Quetin [29]. Whereas Brittany may be subjected to strong stormy waves [30,31,32] liable to interact with tidal currents in stream energy sites [21,33], the influence of wind-generated surface-gravity waves is disregarded in the present investigation assuming that the tide is the dominant hydrodynamic forcing. As thermal fronts develop at the west of the isle of Sein and in the entrance of bays with tidally-mixed waters in the “Raz de Sein” [34,35], the influence of density gradients on currents is also disregarded in the present study. Wind effects are considered only for the assessment of model predictions, by computing the surface shear stress with the coefficient proposed by Flather [36]. Hourly wind velocity components at 10 m above the free surface are provided at 0.2 spatial resolution by the Climate Forecast System Reanalysis Version 2 (CFSRv2) [37]. The model is finally driven by 13 major harmonic tidal constituents of the TPXO8 -atlas database (, , , , , , , , , , , and ) covering western Brittany with a spatial resolution of [38].
The theoretical available tidal stream energy per unit area (in ) is computed as:
where u is the amplitude of horizontal current and is the density of seawater taken equal to . The associated generated technical resource is estimated by relying on OpenHydro power curves neglecting turbine interactions and feedback between energy extraction and the hydrodynamics, as well as adopting device characteristics described by Bedard et al. [39] and Christian and Vennel [40]. Taking into account the range of tidal current amplitudes in the strait, a rated power of 1.0 MW is considered with a rated speed of and a cut-in speed of . The total energy produced over a period of time T is finally computed as:
with the time step between two outputs of stream power predictions.
Simulations were conducted during two periods: (1) June 1993 for the assessment of the model performance and (2) the year 2016 to estimate the variability of the tidal kinetic energy over a long time period.
3. Results and Discussion
3.1. Evaluation of Model Predictions
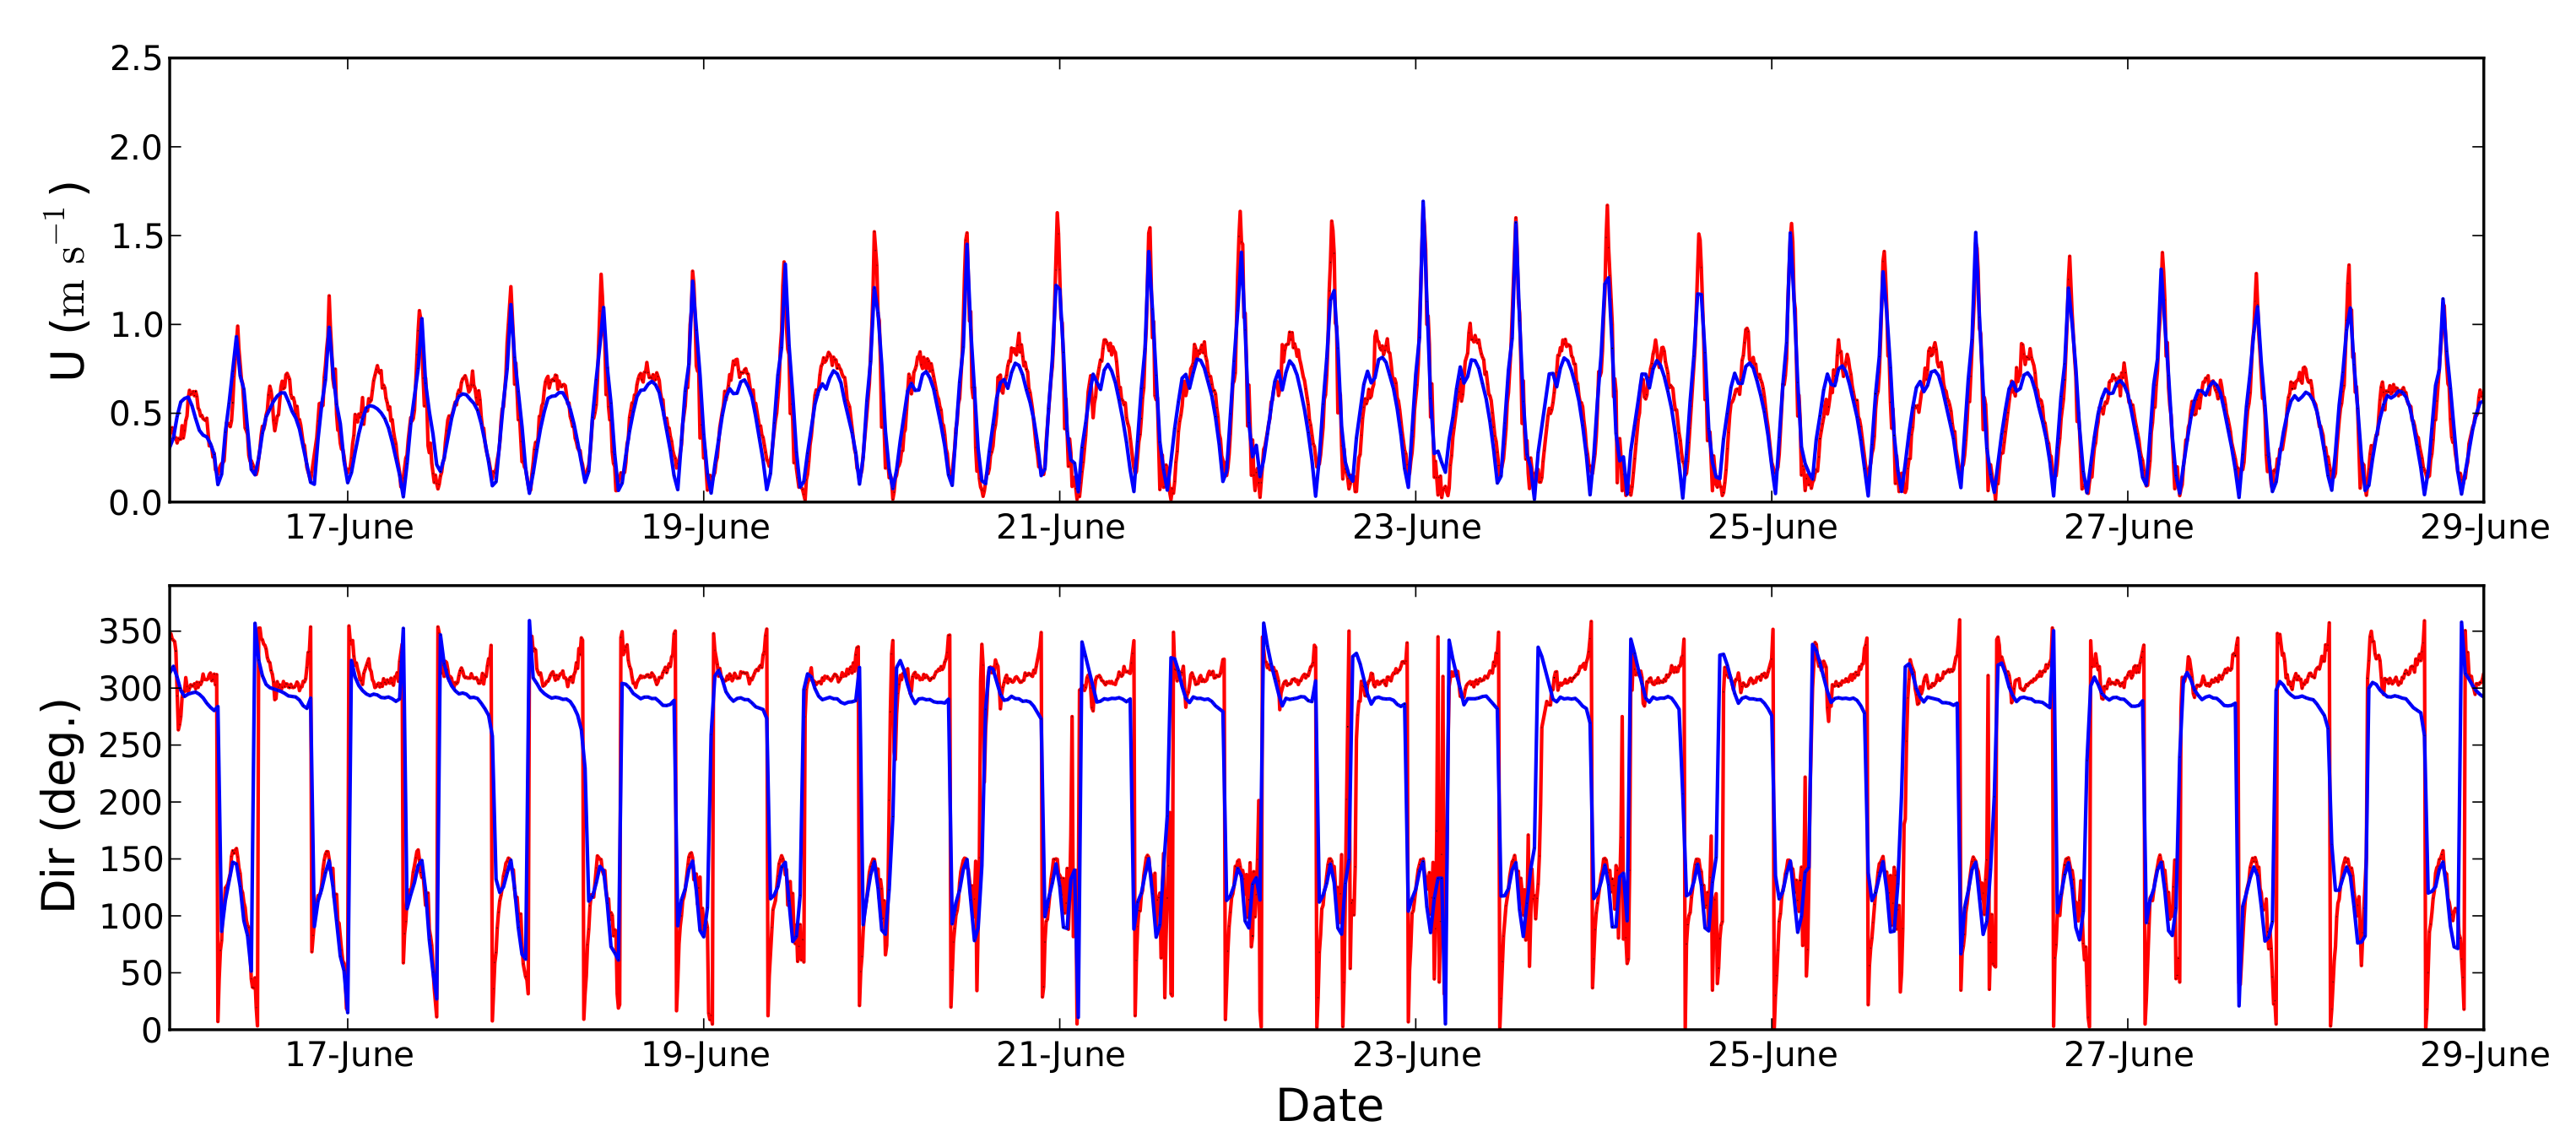
The evaluation of model predictions is performed against available in situ observations of current amplitude and direction acquired by the French navy SHOM (“Service Hydrographique et Océanographique de la Marine”) from June–July 1993 in the northwestern part of the “Raz de Sein” (Figure 1, , ). The period between 17 June and 29 June 1993, characterized by spring tidal conditions, is retained for the assessment of numerical results as fair weather conditions prevail with significant wave heights below 1.5 m and wind speed velocities restricted to at the measurement point. This comparison is performed 10 m above the bed as this corresponds to the operating height of most horizontal-axis turbines in western Brittany [21].
An overall good agreement is obtained between predicted and observed current amplitudes and directions (Figure 2). In spite of an underestimation of the current amplitude of around in peak spring conditions, the model reproduces the pronounced asymmetry of tidal current at the measurement point, characterized by strong and short northwestern components emerging from the “Raz de Sein” and reduced long-lasted southeastern velocities.
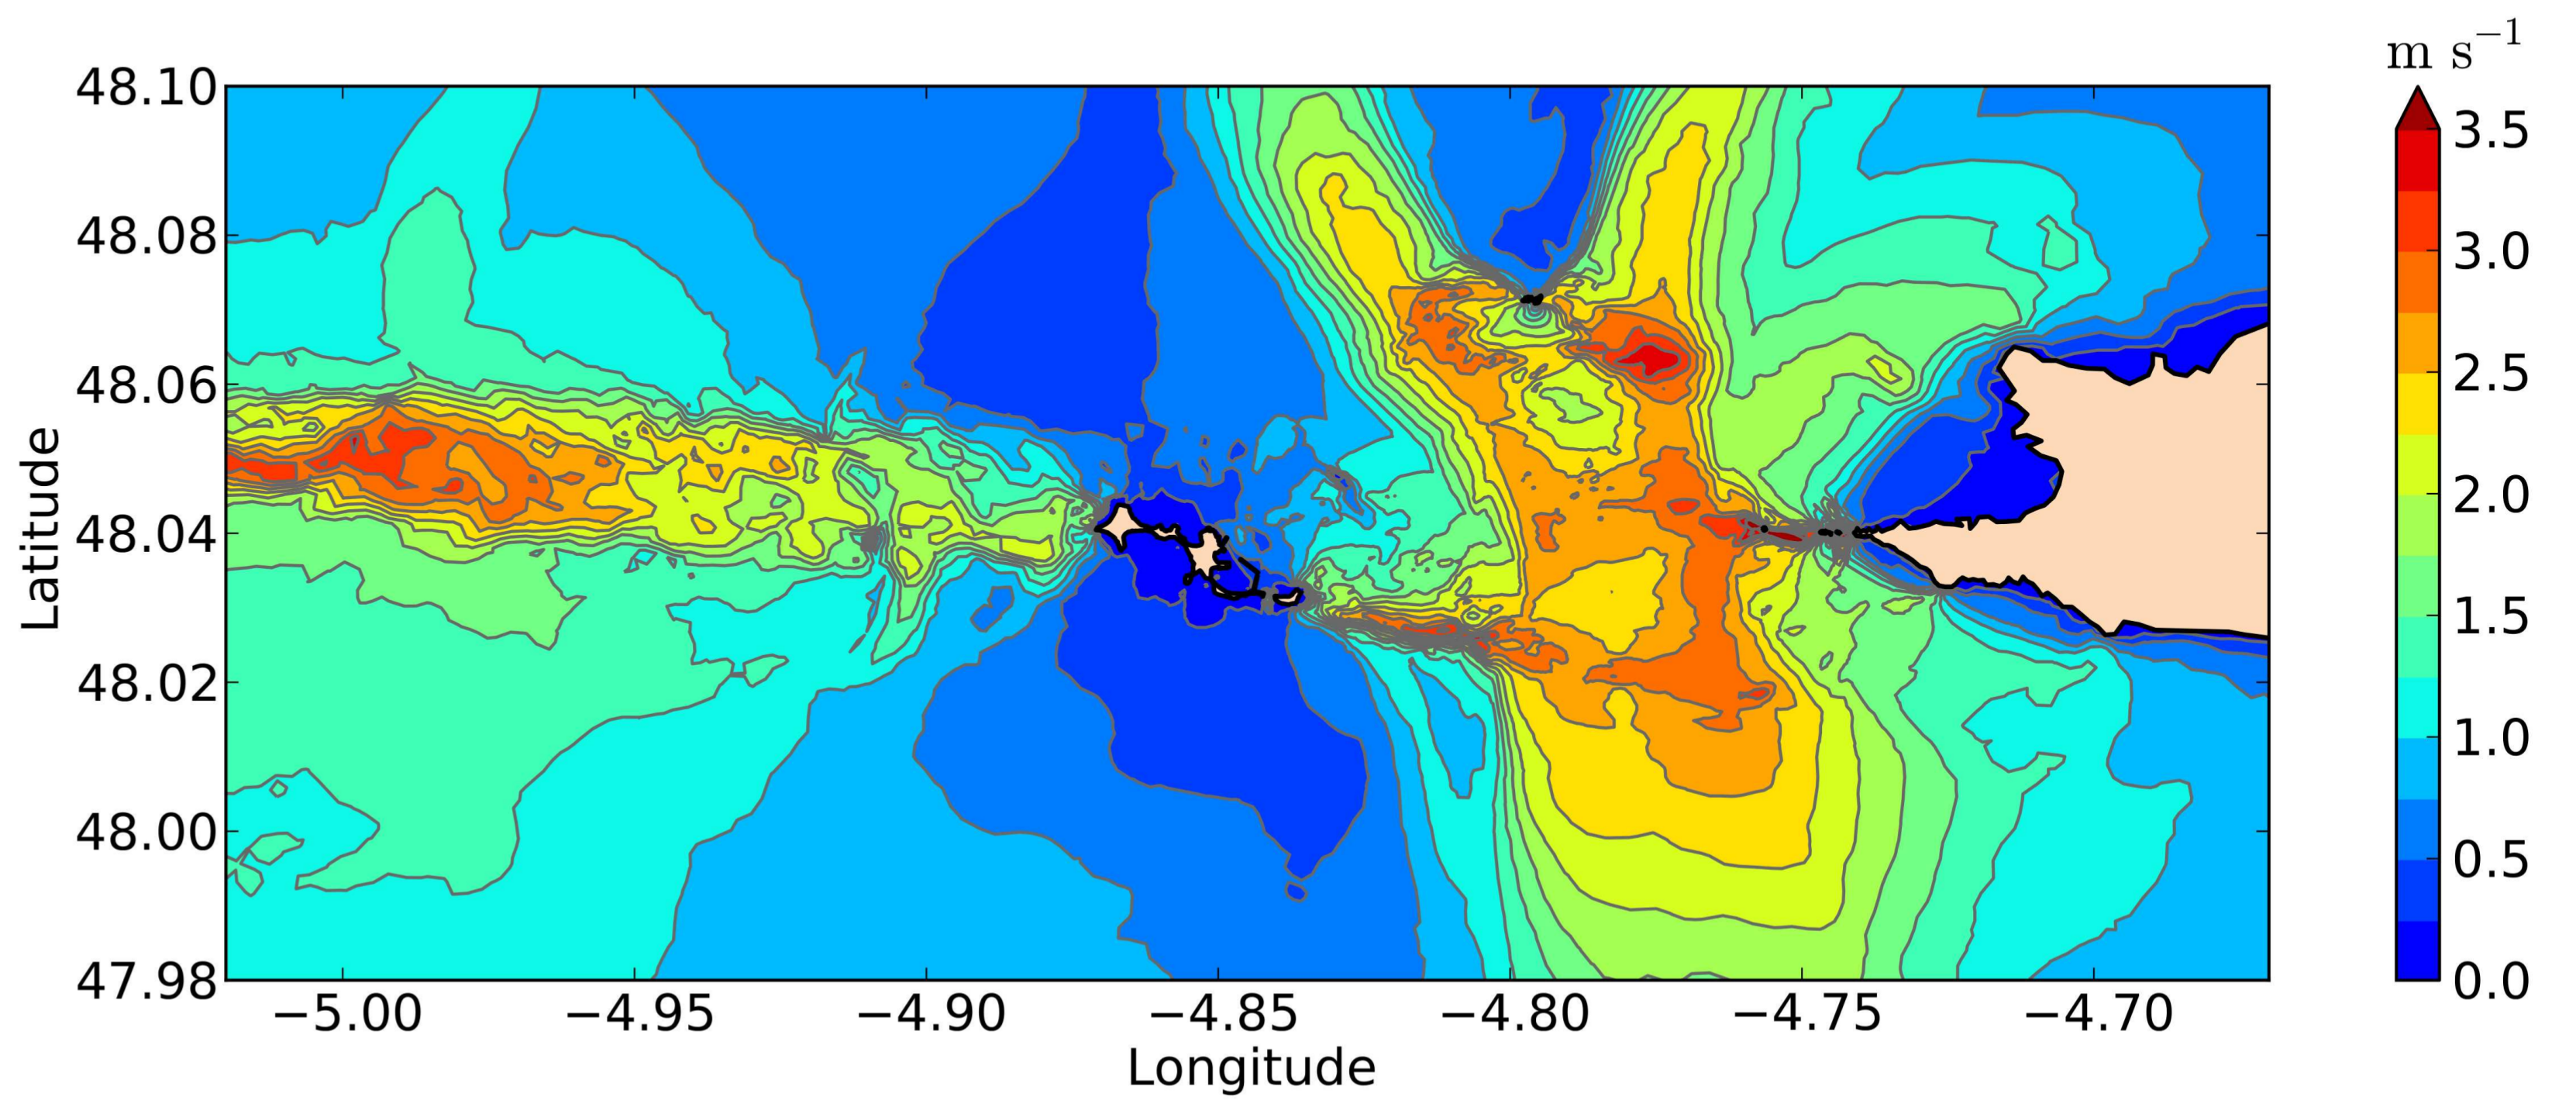
This local assessment of the model’s performance is supplemented by a synoptic evaluation based on numerical estimations provided by the SHOM. Figure 3 compares, in mean spring conditions, tidal current ellipses issued from the SHOM database [41] and predicted with TELEMAC 3D. Whereas differences appear on northern and southern parts of the “Chaussée de Sein” and in the vicinity of rocky islets and shoals of the “Raz de Sein”, this regional assessment confirms the ability of the numerical model to reproduce the temporal and spatial variabilities of the amplitude and direction of spring tidal currents in the area of interest. The spatial distribution of predicted maximum depth-averaged tidal currents in mean spring conditions (Figure 4) is furthermore found consistent with maps established by the SHOM in the area of interest [17]. The tidal hydrodynamics is thus characterized by current velocities exceeding with localized increases up to between rocky islets and over shoals bordering the strait. Prominent tidal eddies appear furthermore on both parts of the strait during flood and ebb peaks. The northern part of the “Raz de Sein” is thus characterized by a separation of the flow between the northeastern and northwestern directions, in relation to channels formed on both parts of the islet of Tévennec (Section 2.1, Figure 1 and Figure 4).
3.2. Averaged and Maximum Tidal Stream Powers
Figure 5 displays the spatial distribution of the averaged and maximum predicted tidal stream energy per unit area during a year (2016). As tidal stream power is computed from a cubic power law on current amplitude, these distributions exhibit the spatial gradient of tidal current velocity in the area of interest. Predictions show thus maximum stream power over in the “Raz de Sein” and along the southern and northern wakes of the flow emerging from the strait while values are restricted below elsewhere, with an exception for the western region of the “Chaussée de Sein” (Figure 5b). Over this area, shallow water depths exhibit thus a increase of tidal currents with values over in mean spring conditions (Figure 4). However, as water depths over 25 m are required to ensure a constant immersion of devices and sufficient navigational clearance [22], this region is not primarily targeted for the implementation of tidal stream turbines.
Following the resource criteria adopted by the Carbon Trust [42], mean kinetic power density should exceed for a reasonable economic viability in the setting up of first-generation devices. Along the coasts of France, such power density is found in the Alderney Race (western English Channel) and in the Fromveur Strait (western Brittany) [19,20,43]. In the “Raz de Sein”, locations where this power density exceeds are restricted to the vicinity of shoals and rocky islets and headlands bordering the strait (Figure 5a). In these latter regions, the water depths are not sufficient to set up tidal turbines. However, potential sites with larger surfaces are identified by applying the criteria adopted by Iyer et al. [44], retaining spring peak flows in excess of and water depths between 25 and 50 m. These areas correspond to two latitudinal branches extending from the southern extent of the strait till the islet of Tévennec (Figure 4). The potential sea space for extracting tidal kinetic energy covers almost all the strait from its southern to northern extents if second-generation technologies, designed to efficiently harvest lower currents with a mean spring peak over , were considered [7,22]. Whereas this investigation confirms the potential of the “Raz de Sein” for the exploitation of tidal kinetic energy, the averaged and maximum values of stream powers provide only first preliminary assessments about the spatial distribution of hot spots. Further studies have, in particular, to be conducted about the temporal variability by exhibiting tidal current asymmetry and misalignment between flood and ebb.
3.3. Tidal Current Variability
3.3.1. Tidal Current Asymmetry
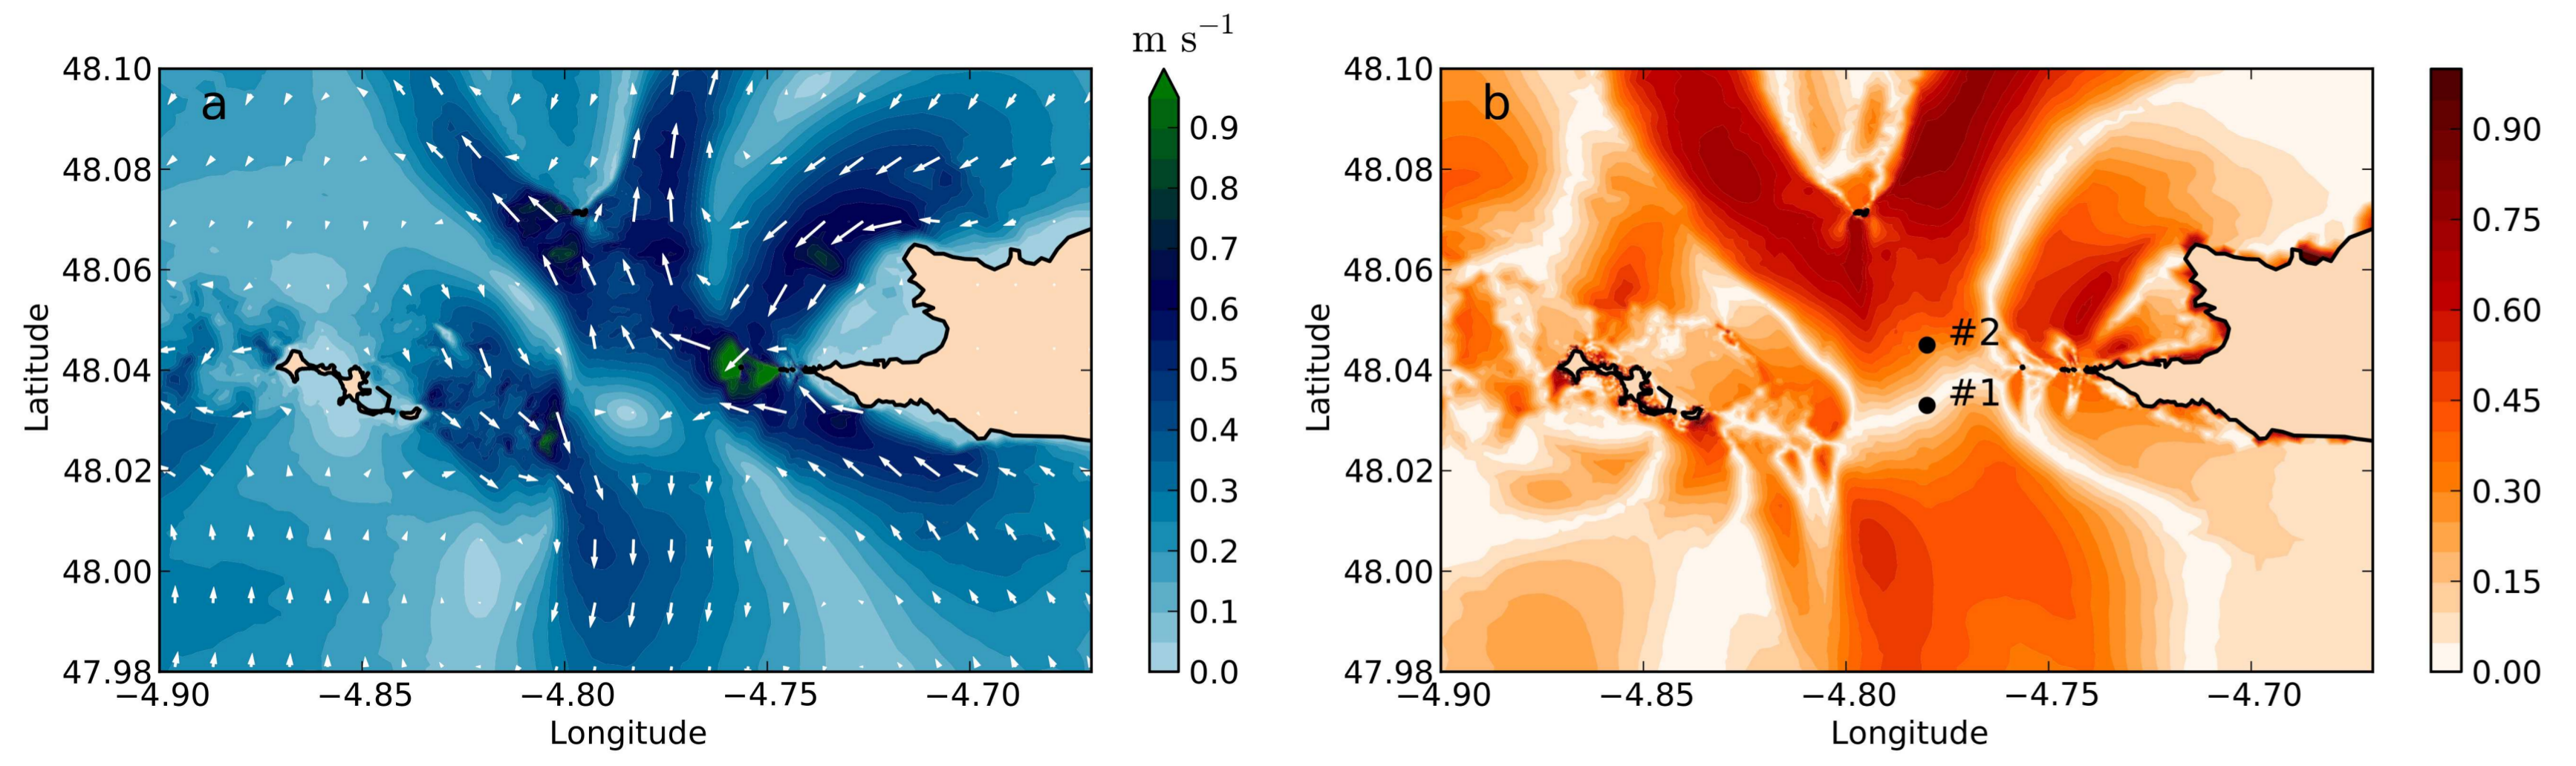
As exhibited by Neill et al. [8], tidal current asymmetry between flood and ebb is a key parameter that characterizes the variability in power production. As power is related to the velocity cubed, reduced tidal asymmetry may thus result in significant variations in power output over a tidal cycle. In order to guarantee a sufficient continuous energy production over the semi-diurnal time scale, sites with reduced asymmetry are primarily targeted for the exploitation of tidal kinetic energy. At the scale of the “Raz de Sein”, this asymmetry may be characterized by the spatial distribution of predicted residual Eulerian depth-averaged currents (Figure 6a). Indeed, these residual currents represent here the average of velocity vectors over a mean spring tidal cycle, exhibiting differences in magnitude and direction between flood and ebb periods. It is complemented by the ratio A of peak tidal currents during flood and ebb (Figure 6b):
where is the maximum of the peak velocity between flood and ebb and is the minimum one. This parameter varies between zero and one. Values close to unity account for significant tidal asymmetry, whilst values close to null show weak asymmetry.
A divergence area is exhibited in the “Raz de Sein” between the northern and southern pathways (Figure 6a). This asymmetry is associated with a prominent flood-dominated region in the north of the strait with residual currents up to and an ebb-dominated area in the south. Such current asymmetry is typical of tidal strait dynamics as confirmed by numerical investigations conducted in the potential stream energy sites of Orkney [8] or the Fromveur Strait [13,20]. Moreover, the divergence area, with reduced current asymmetry in the center of the strait, presents, most of the time, the strongest tidal currents. This location is thus primarily targeted for the development of tidal farm projects in tidal straits or channels. In the area of interest, this corresponds to a narrow band, with a width of around 500 m, connecting the isle of Sein with the Raz headland (Figure 6b). Over this region, values of parameter A are restricted to 0.1, a limit that accounts for a variation in peak tidal currents between flood and ebb of about .
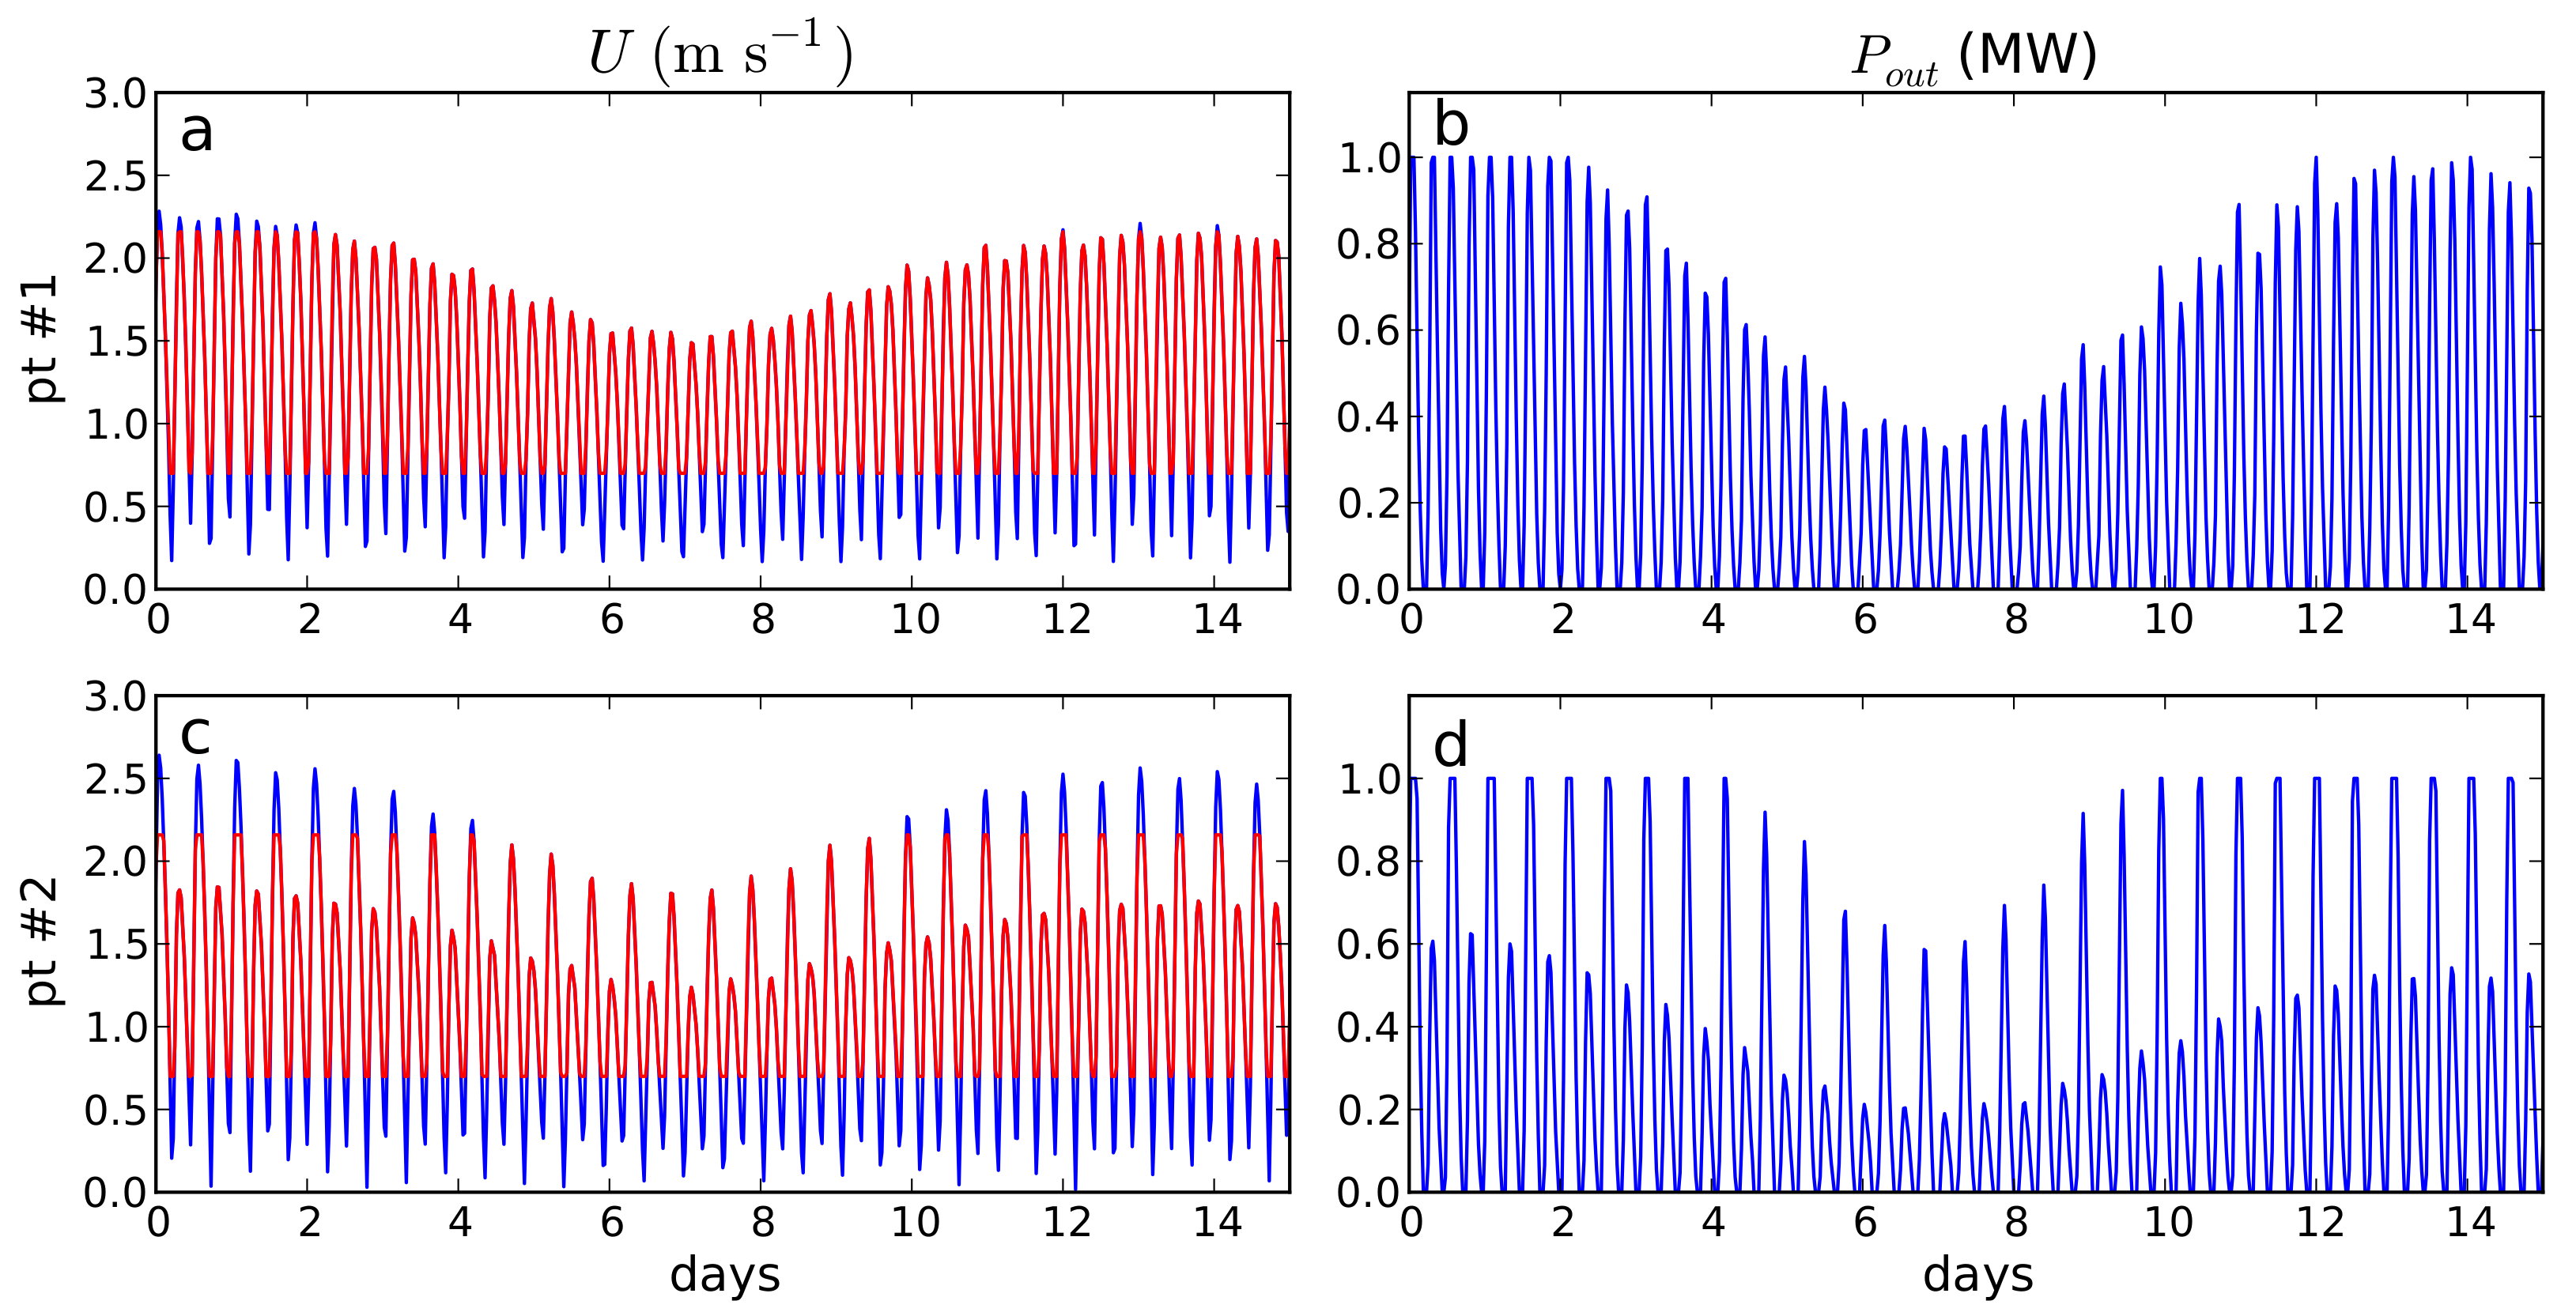
Tidal velocities are extracted at 10 m above the seabed, at Points #1 (A = 0.001) and #2 (A = 0.309) (Figure 6b and Figure 7), during a month (January 2016). The associated generated practical power is calculated from a hypothetical turbine based on OpenHydro power curves, assuming a rated power of 1.0 MW (Section 2.2). Whereas Point #2 is characterized by stronger velocities ( against at Point #1 in spring conditions), the generated energy produced over a month is slightly stronger at Point #1 (196 MWh against 193 MWh at Point #2). This difference is about . However, stronger modulations are exhibited at the semi-diurnal time scale with output power varying between 0.4 and 1.0 MW at Point #2 in spring conditions (Figure 7d).
3.3.2. Tidal Current Misalignment
A specific method is implemented to approach tidal current misalignment between flood and ebb. The computation is achieved over a year (2016) to integrate variations of current directions in relation to tidal conditions over the different neap/spring periods. The algorithm, developed in the present study, computes the directional distribution of tidal stream power P (Equation (1)) at each grid node and extracts the misalignment direction between maximum contributions during flood and ebb (Figure 8). The resulting spatial distribution of exhibits a strong contrast in current direction between (1) the northeastern and (2) the southern and western parts of the “Raz de Sein” (Figure 9). The tidal strait is thus characterized by a southern region with near rectilinear flow between maximum flood and ebb stream powers, which extends towards the northwest in the north. Strong misalignments are found elsewhere varying from to more than in the vicinity of headlands and shoals bordering the “Raz de Sein”. Whereas further investigations may be conducted about directions spreading around maximum powers, this cartography provides noticeable information for the exploitation of tidal kinetic energy in this strait.
Locations with reduced misalignment directions are thus desirable to set up bidirectional turbines with a fixed axis, whereas yaw drive-based systems, which follow the current direction, may be considered elsewhere. An illustration is provided by comparing the generated power output from these two systems in an area with near-rectilinear flow (Point #3) and a location with current misalignment of between ebb and flood (Point #4) (Figure 8 and Figure 9). Figure 10 displays the generated practical powers from a 1-MW turbine in spring-neap conditions of January 2016. This computation is performed by considering the current component aligned in the axis of the turbine, setting aside variations of the optimum angle of attack of the blades as the turbine rotates [45]. Following this approach, slight differences in generated powers are obtained at Point #3, the energy produced over a month varying by between the two systems (168 MWh for a yaw drive-based system against 166 MWh for a bidirectional turbine) (Figure 10a). Stronger differences are obtained at Point #4 where misalignment directions between flood and ebb influence the energy produced (Figure 10b). The total energy over a month is thus found to vary by between the yaw drive-based system (286 MWh) and bidirectional turbines with a fixed axis (251 MWh). In the area of interest, devices liable to handle changes in flow directionality have thus the potential to improve energy yield, by reducing potential losses in the technically exploitable power.
3.4. Potential Tidal Stream Energy Sites
The investigation of tidal current variability is employed to refine the cartography of potential tidal stream energy sites in the “Raz de Sein”. A series of criteria based on water depths, current amplitude, asymmetry and misalignment (Table 1) is retained to identify these locations.
As exhibited in Section 3.2, the criteria adopted by the Carbon Trust [42] based on stream power density are very restrictive for the identification of potential sites. Instead, high energy sites suitable for first- and second-generation technologies are selected following Iyer et al. [44] and Lewis et al. [7] by retaining locations with a minimum mean spring peak current speed over or and water depths in the range of 25–50 m (criteria Ca1 and Cb1, Table 1). As exhibited in Section 3.2, the application of these criteria highlights the interest in the “Raz de Sein” for the exploitation of tidal stream power (Figure 11a,d). However, further constraints are associated with tidal current asymmetry and misalignment (Section 3.3.1 and Section 3.3.2).
Indeed, the potential sea space for first- and second-generation technologies reduces dramatically to parts of the divergence area identified in the center of the strait (Section 3.3.1) if locations with reduced tidal current asymmetry () are considered (criteria Ca2 and Cb2, Table 1, Figure 11b,e). Whereas these locations may be primarily retained for the exploitation of tidal kinetic energy, it accounts for a very limited sea space in comparison with surfaces exhibiting criteria Ca1 and Cb1. Nevertheless, as exhibited by Neill et al. [8] in the Orkney archipelago, a more balanced source of power may be reached by aggregating opposing flood and ebb-dominant stream powers on both parts of the tidal strait, thus extending potential areas for the set up of turbines in the “Raz de Sein”.
For this purpose, areas with reduced misalignment directions are to be considered if the extraction of tidal kinetic energy is restricted to bidirectional tidal turbines with a fixed axis. Frost et al. [45] have recently shown, from computational fluid dynamics modeling, that an axial flow misalignment of can modify the maximum theoretical available power from a horizontal fixed-axis turbine by . This limit is retained here for the aggregation of stream powers on both parts of the strait. It exhibits a bottle-shaped surface with its body in the southern part of the strait and its neck in its northern part (criteria Ca3 and Cb3, Table 1, Figure 11c,f). If we retained two points on both parts of the strait (#5 and #6), it is thus possible to reduce the flood/ebb asymmetry of extractable stream powers from a horizontal fixed-axis turbine and produce a smooth and balanced power output (Figure 12). Such an extraction method is to be favored for horizontal fixed-axis turbines in the “Raz de Sein” as the area holding both near-rectilinear tidal currents and weak misalignment directions reduces to a surface of around in the center of the strait. This latter sea space corresponds furthermore to second-generation technologies of tidal kinetic energy converters.
4. Conclusions
The circulation model TELEMAC 3D has been implemented in the strait of the “Raz de Sein”, a region with strong potential for turbine array development, in order to investigate the spatial and temporal variabilities of tidal currents. A series of simplified parameters is considered to characterize these variabilities and optimize the design and location of tidal kinetic energy converters. Numerical predictions are assessed against available in situ measurements of tidal currents’ amplitude and direction in the vicinity of the strait. This local assessment is supplemented by a synoptic comparison of model predictions with an established numerical database in the area of interest. The main outcomes of the present study are as follows:
- The tidal hydrodynamics is characterized by a divergence area in the center of the strait with reduced asymmetry of current amplitude between the flood and ebb periods. Such locations, typical of a tidal strait, are primarily targeted for the implementation of turbines, as current asymmetry can reduce the total energy yield and impact the consistency of the generated technical resource over the daily time scale.
- The northeastern part of the strait exhibits furthermore significant tidal current misalignment between flood and ebb, which supports the development of the yaw mechanism in industrial designs of turbines. Conversely, the southern and northeastern areas are characterized by near rectilinear flow of particular interest for fixed-orientation devices.
- Maps are produced to identify at the scale of the “Raz de Sein” the areas primarily targeted for the implementation of tidal turbines. The potential sea space for the implementation of horizontal-axis turbines with a fixed axis reduces dramatically if areas with limited tidal current asymmetry are targeted. This promotes aggregation methods between flood and ebb-dominant stream powers on both parts of the strait to produce more balanced power output and extend the surface where stream power may be extracted.
The exploitation of numerical predictions provides potential developers with key information for a successful deployment of a tidal turbine in the marine environment. The method, applied in the present investigation, may furthermore provide guidance on the development of refined complex resource assessments of stream power variability at the scale of potential areas of interest for the exploitation of tidal kinetic energy. However, taking into account the complex tidal recirculations induced on both parts of the strait, this numerical assessment will naturally benefit from extended concurrent measurements improving predictions’ accuracy in relation to bottom roughness parametrization. Further investigations may, in particular, be conducted along the water column exhibiting the variation of tidal current asymmetry and directionality with elevation for different heights of tidal stream turbines. These studies may finally be complemented by long-time predictions about diurnal or lunar inequalities, exhibiting the effects on inter-annual variabilities of the resource.
Acknowledgments
In situ observations and bathymetric data used here were provided by the French navy SHOM (“Service Hydrographique et Océanographique de la Marine”). Numerical simulations were performed on HPC facilities DATARMOR of “Pôle de Calcul Intensif pour la Mer” (PCIM) (http://www.ifremer.fr/pcim). The present paper is a contribution to the research program DIADEME (“Design et InterActions des Dispositifs d’extraction d’Energie Marine avec l’Environnement”) of the Laboratory of Coastal Engineering and Environment (Cerema, www.cerema.fr).
Author Contributions
Nicolas Guillou is the principal investigator of this research study. Georges Chapalain contributed to the writing and commented on the draft of the manuscript.
Conflicts of Interest
The authors declare no conflict of interest.
References
- Magagna, D.; Uihlein, A. Ocean energy development in Europe: Current status and future perspectives. Int. J. Mar. Energy 2015, 11, 84–104. [Google Scholar] [CrossRef]
- Defne, Z.; Haas, K.A.; Fritz, H.M. GIS based multi-criteria assessment of tidal stream power potential: A case study for Georgia, USA. Renew. Sustain. Energy Rev. 2011, 15, 2310–2321. [Google Scholar] [CrossRef]
- Tang, H.; Qu, K.; Chen, G.; Kraatz, S.; Aboobaker, N.; Jiang, C. Potential sites for tidal power generation: A thorough search at coast of New Jersey, USA. Renew. Sustain. Energy Rev. 2014, 39, 412–425. [Google Scholar] [CrossRef]
- Campbell, R.; Letetrel, C.; Rio, A.; Martinez, A. Methodology for estimating the French tidal current energy resource. Int. J. Mar. Energy 2017, 19, 256–271. [Google Scholar] [CrossRef]
- Black and Veatch. Phase II. In UK Tidal-Stream Energy Resource Assessment; Technical Report; The Carbon Trust: London, UK, 2005. [Google Scholar]
- O’Rourke, F.; Boyle, F.; Reynolds, A. Tidal current energy resource assessment in Ireland: Current status and future update. Renew. Sustain. Energy Rev. 2010, 14, 3206–3212. [Google Scholar] [CrossRef]
- Lewis, M.; Neill, S.; Robins, P.; Hashemi, M. Resource assessment for future generations of tidal-stream energy arrays. Energy 2015, 83, 403–415. [Google Scholar] [CrossRef] [Green Version]
- Neill, S.; Hashemi, M.; Lewis, M. The role of tidal asymmetry in characterizing the tidal energy resource of Orkney. Renew. Energy 2014, 68, 337–350. [Google Scholar] [CrossRef]
- Galloway, P.; Myers, L.; Bahaj, A. Experimental and numerical results of rotor power and thrust of a tidal turbine operating at yaw and in waves. In Proceedings of the World Renewable Energy Congress 2011—Marine and Ocean Technology, Linköping, Sweden, 8–13 May 2011. [Google Scholar]
- Frost, C.; Morris, C.; Mason-Jones, A.; O’Doherty, D.; O’Doherty, T. The efficiency of flow directionality on tidal turbine performance characteristics. Renew. Energy 2015, 78, 609–620. [Google Scholar] [CrossRef]
- Harding, S.; Bryden, I. Directionality in prospective Northern UK tidal current energy deployment sites. Renew. Energy 2012, 44, 474–477. [Google Scholar] [CrossRef]
- Neill, S.; Hashemi, M.; Lewis, M. Tidal energy leasing and tidal phasing. Renew. Energy 2016, 85, 580–587. [Google Scholar] [CrossRef]
- Guillou, N.; Chapalain, G. Assessing the impact of tidal stream energy extraction on the Lagrangian circulation. Appl. Energy 2017, 203, 321–332. [Google Scholar] [CrossRef]
- Funke, S.; Farell, P.; Pigott, M. Tidal turbine array optimization using the adjoint approach. Renew. Energy 2014, 63, 658–673. [Google Scholar] [CrossRef]
- Kramer, S.; Funke, S.; Piggott, M. A continuous approach for the optimization of tidal turbine farms. In Proceedings of the 11th European Wave and Tidal Energy Conference Series, Nantes, France, 6–11 September 2015. [Google Scholar]
- Hamdi, A.; Vasquez, M.; Populus, J. Cartographie des Habitats Physiques Eunis—Côtes de France; Technical Report DYNECO/AG/10-26/JP; Ifremer: Issy-les-Moulineaux, France, 2010. [Google Scholar]
- Service Hydrographique et Océanographique de la Marine (SHOM). Courants de Marée—Mer D’Iroise de L’île Viergeà la Pointe de Penmarc’h; Technical Report 560-UJA; Service Hydrographique et Océanographique de la Marine: Brest, France, 2016. [Google Scholar]
- Bahaj, A.; Myers, L. Analytical estimates of the energy yield potential from the Alderney Race (Channel Islands) using maring current energy converters. Renew. Energy 2004, 29, 1931–1945. [Google Scholar] [CrossRef]
- Coles, D.S.; Blunden, L.S.; Bahaj, A.S. Assessment of the energy extraction potential at tidal sites around the Channel Islands. Energy 2017, 124, 171–186. [Google Scholar] [CrossRef]
- Guillou, N.; Thiébot, J. The impact of seabed rock roughness on tidal stream power extraction. Energy 2016, 112, 762–773. [Google Scholar] [CrossRef]
- Guillou, N.; Chapalain, G.; Neill, S.P. The influence of waves on the tidal kinetic energy resource at a tidal stream energy site. Appl. Energy 2016, 180, 402–415. [Google Scholar] [CrossRef]
- Robins, P.; Neill, S.; Lewis, M.; Ward, S. Characterising the spatial and temporal variability of the tidal-stream energy resource over the northwest European shelf seas. Appl. Energy 2015, 147, 510–522. [Google Scholar] [CrossRef] [Green Version]
- Hervouet, J.M. Hydrodynamics of Free Surface Flows, Modelling With the Finite Element Method; Cambridge University Press: Cambridge, UK, 2007; p. 311. [Google Scholar]
- SHOM. MNT Bathymétrique de la Façade Atlantique (Projet HOMONIM). Available online: http://diffusion.shom.fr/produits/bathymetrie/mnt-facade-atl-homonim.html (accessed on 1 September 2017).
- Loubrieu, B.; Bourillet, J.; Moussat, E. Bathy-Morphologique Régionale Du Golfe De Gascogne Et De La Manche, Modèle Numérique; Technical Report; Ifremer: Issy-les-Moulineaux, France, 2008. [Google Scholar]
- Guillou, N.; Thiébot, J. Environmental impact of a tidal stream farm: Predictions sensitivity to bottom roughness. In Proceedings of the 15emes Journees De L’hydrodynamique, Brest, France, 22–24 November 2016. [Google Scholar]
- Soulsby, R. The bottom boundary layer of shelf seas. In Physical Oceanography of Coastal and Shelf Seas; Johns, B.E., Ed.; Elsevier: Amsterdam, The Netherlands, 1983; pp. 189–266. [Google Scholar]
- Smagorinsky, J. General circulation experiments with the primitive equations I: The basic experiments. Mon. Weather Rev. 1963, 91, 99–164. [Google Scholar] [CrossRef]
- Quetin, B. Modèles mathématiques de calcul des écoulements induits par le vent. In Proceedings of the 17th Congress of the International Association of Hydraulic Research, Baden-Baden, Germany, 15–19 August 1977. [Google Scholar]
- Guillou, N.; Chapalain, G. Numerical modeling of nearshore wave energy resource in the Sea of Iroise. Renew. Energy 2015, 83, 942–953. [Google Scholar] [CrossRef]
- Guillou, N. Evaluation of wave energy potential in the Sea of Iroise with two spectral models. Ocean Eng. 2015, 106, 141–151. [Google Scholar] [CrossRef]
- Guillou, N.; Chapalain, G. Wave energy potential in the Sea of Iroise. In Proceedings of the 11th European Wave and Tidal Energy Conference Series, Nantes, France, 6–11 September 2015. [Google Scholar]
- Guillou, N. Modelling effects of tidal currents on waves at a tidal stream energy site. Renew. Energy 2017, 114, 180–190. [Google Scholar] [CrossRef]
- Guillou, N.; Chapalain, G.; Duvieilbourg, E. Modelling impact of bottom roughness on sea surface temperature in the Sea of Iroise. Cont. Shelf Res. 2013, 54, 80–92. [Google Scholar] [CrossRef]
- Guillou, N.; Chapalain, G.; Duvieilbourg, E. Sea surface temperature modeling in the Sea of Iroise: Assessment of boundary conditions. Ocean Dyn. 2013, 63, 849–863. [Google Scholar] [CrossRef]
- Flather, R. Results from Surge Prediction Model of the North-West European Continental Shelf from April, November and December 1973; Technical Report Report Number 24; Institute of Oceanographic: New Delhi, India, 1976. [Google Scholar]
- Saha, S.; Moorthi, S.; Wu, X.; Wang, J.; Nadiga, S.; Tripp, P.; Behringer, D.; Hou, Y.-T.; Chuang, H.-Y.; Iredell, M.; et al. The NCEP Climate Forecast System Version 2. J. Clim. 2014, 27, 2185–2208. [Google Scholar] [CrossRef]
- Egbert, G.; Bennett, A.; Foreman, M. TOPEX/POSEIDON tides estimated using a global inverse model. J. Geophys. Res. 1994, 99, 24821–24852. [Google Scholar] [CrossRef]
- Bedard, R.; Previsic, M.; Siddiqui, O.; Hagerman, G.; Robinson, M. Survey and Characterization of Tidal in Stream Energy Conversion (TISEC) Devices; Technical Report; Electric Power Research Institute (EPRI): Palo Alto, CA, USA, 2005. [Google Scholar]
- Christian, C.; Vennel, R. Efficiency of tidal turbine farms. Coast. Eng. 2012, 1, 4. [Google Scholar] [CrossRef]
- SHOM. Available online: http://datashom.fr (accessed on 1 September 2017).
- Black and Veatch. UK Tidal Current Resource and Economics; Technical Report; Commissioned by the Carbon Trust and Npower, Project Number 121393; Black and Veatch: Overland Park, KS, USA, 2011. [Google Scholar]
- Thiébot, J.; Bailly du Bois, P.; Guillou, S. Numerical modeling of the effect of tidal stream turbines on the hydrodynamics and the sediment transport—Application to the Alderney Race (Raz Blanchard), France. Renew. Energy 2015, 75, 356–365. [Google Scholar] [CrossRef]
- Iyer, A.S.; Couch, S.J.; Harrison, G.P.; Wallace, A.R. Variability and phasing of tidal current energy around the United Kingdom. Renew. Energy 2013, 51, 343–357. [Google Scholar] [CrossRef]
- Frost, C.; Evans, P.; Mason-Jones, M.H.; O’Doherty, T.; O’Doherty, D. The impact of axial flow misalignment on a tidal turbine. Renew. Energy 2017, 113, 1333–1344. [Google Scholar] [CrossRef]
Figure 1.
Spatial distribution of the mean water depth in the “Raz de Sein” with the location of the available measurement point (blue triangle).
Figure 1.
Spatial distribution of the mean water depth in the “Raz de Sein” with the location of the available measurement point (blue triangle).

Figure 2.
Measured (red) and predicted (blue) time series of the amplitude and direction (anticlockwise convention from the east) of the current 10 m above the seabed at the measurement point in June 1993.
Figure 2.
Measured (red) and predicted (blue) time series of the amplitude and direction (anticlockwise convention from the east) of the current 10 m above the seabed at the measurement point in June 1993.

Figure 3.
Current ellipses of depth-averaged velocities for mean spring tidal conditions (red) issued from the SHOM (“Service Hydrographique et Océanographique de la Marine”) database [41] and (blue) predicted with TELEMAC 3D.
Figure 3.
Current ellipses of depth-averaged velocities for mean spring tidal conditions (red) issued from the SHOM (“Service Hydrographique et Océanographique de la Marine”) database [41] and (blue) predicted with TELEMAC 3D.

Figure 4.
Maximum amplitude of depth-averaged tidal currents over a mean spring tidal cycle.

Figure 5.
(a) Averaged and (b) maximum theoretical available tidal stream power during a year (2016).
Figure 5.
(a) Averaged and (b) maximum theoretical available tidal stream power during a year (2016).

Figure 6.
(a) Residual depth-averaged tidal currents and (b) parameter A characterizing the tidal current asymmetry during a mean spring tidal cycle. The black circles in Figure 6b show the locations of Points #1 and #2.
Figure 6.
(a) Residual depth-averaged tidal currents and (b) parameter A characterizing the tidal current asymmetry during a mean spring tidal cycle. The black circles in Figure 6b show the locations of Points #1 and #2.

Figure 7.
Predicted tidal current speeds at 10 m above the seabed in spring-neap conditions (a,c) and associated generated practical power from a 1-MW turbine (b,d) at Points #1 and #2 (Figure 6b). The red line accounts for the effective tidal velocity that generates power.
Figure 7.
Predicted tidal current speeds at 10 m above the seabed in spring-neap conditions (a,c) and associated generated practical power from a 1-MW turbine (b,d) at Points #1 and #2 (Figure 6b). The red line accounts for the effective tidal velocity that generates power.

Figure 8.
Directional distribution of available tidal stream power energy per unit area P (expressed in percentage of total power density over a year) in conditions of near rectilinear flow (Point #3) and current directional asymmetry (Point #4).
Figure 8.
Directional distribution of available tidal stream power energy per unit area P (expressed in percentage of total power density over a year) in conditions of near rectilinear flow (Point #3) and current directional asymmetry (Point #4).

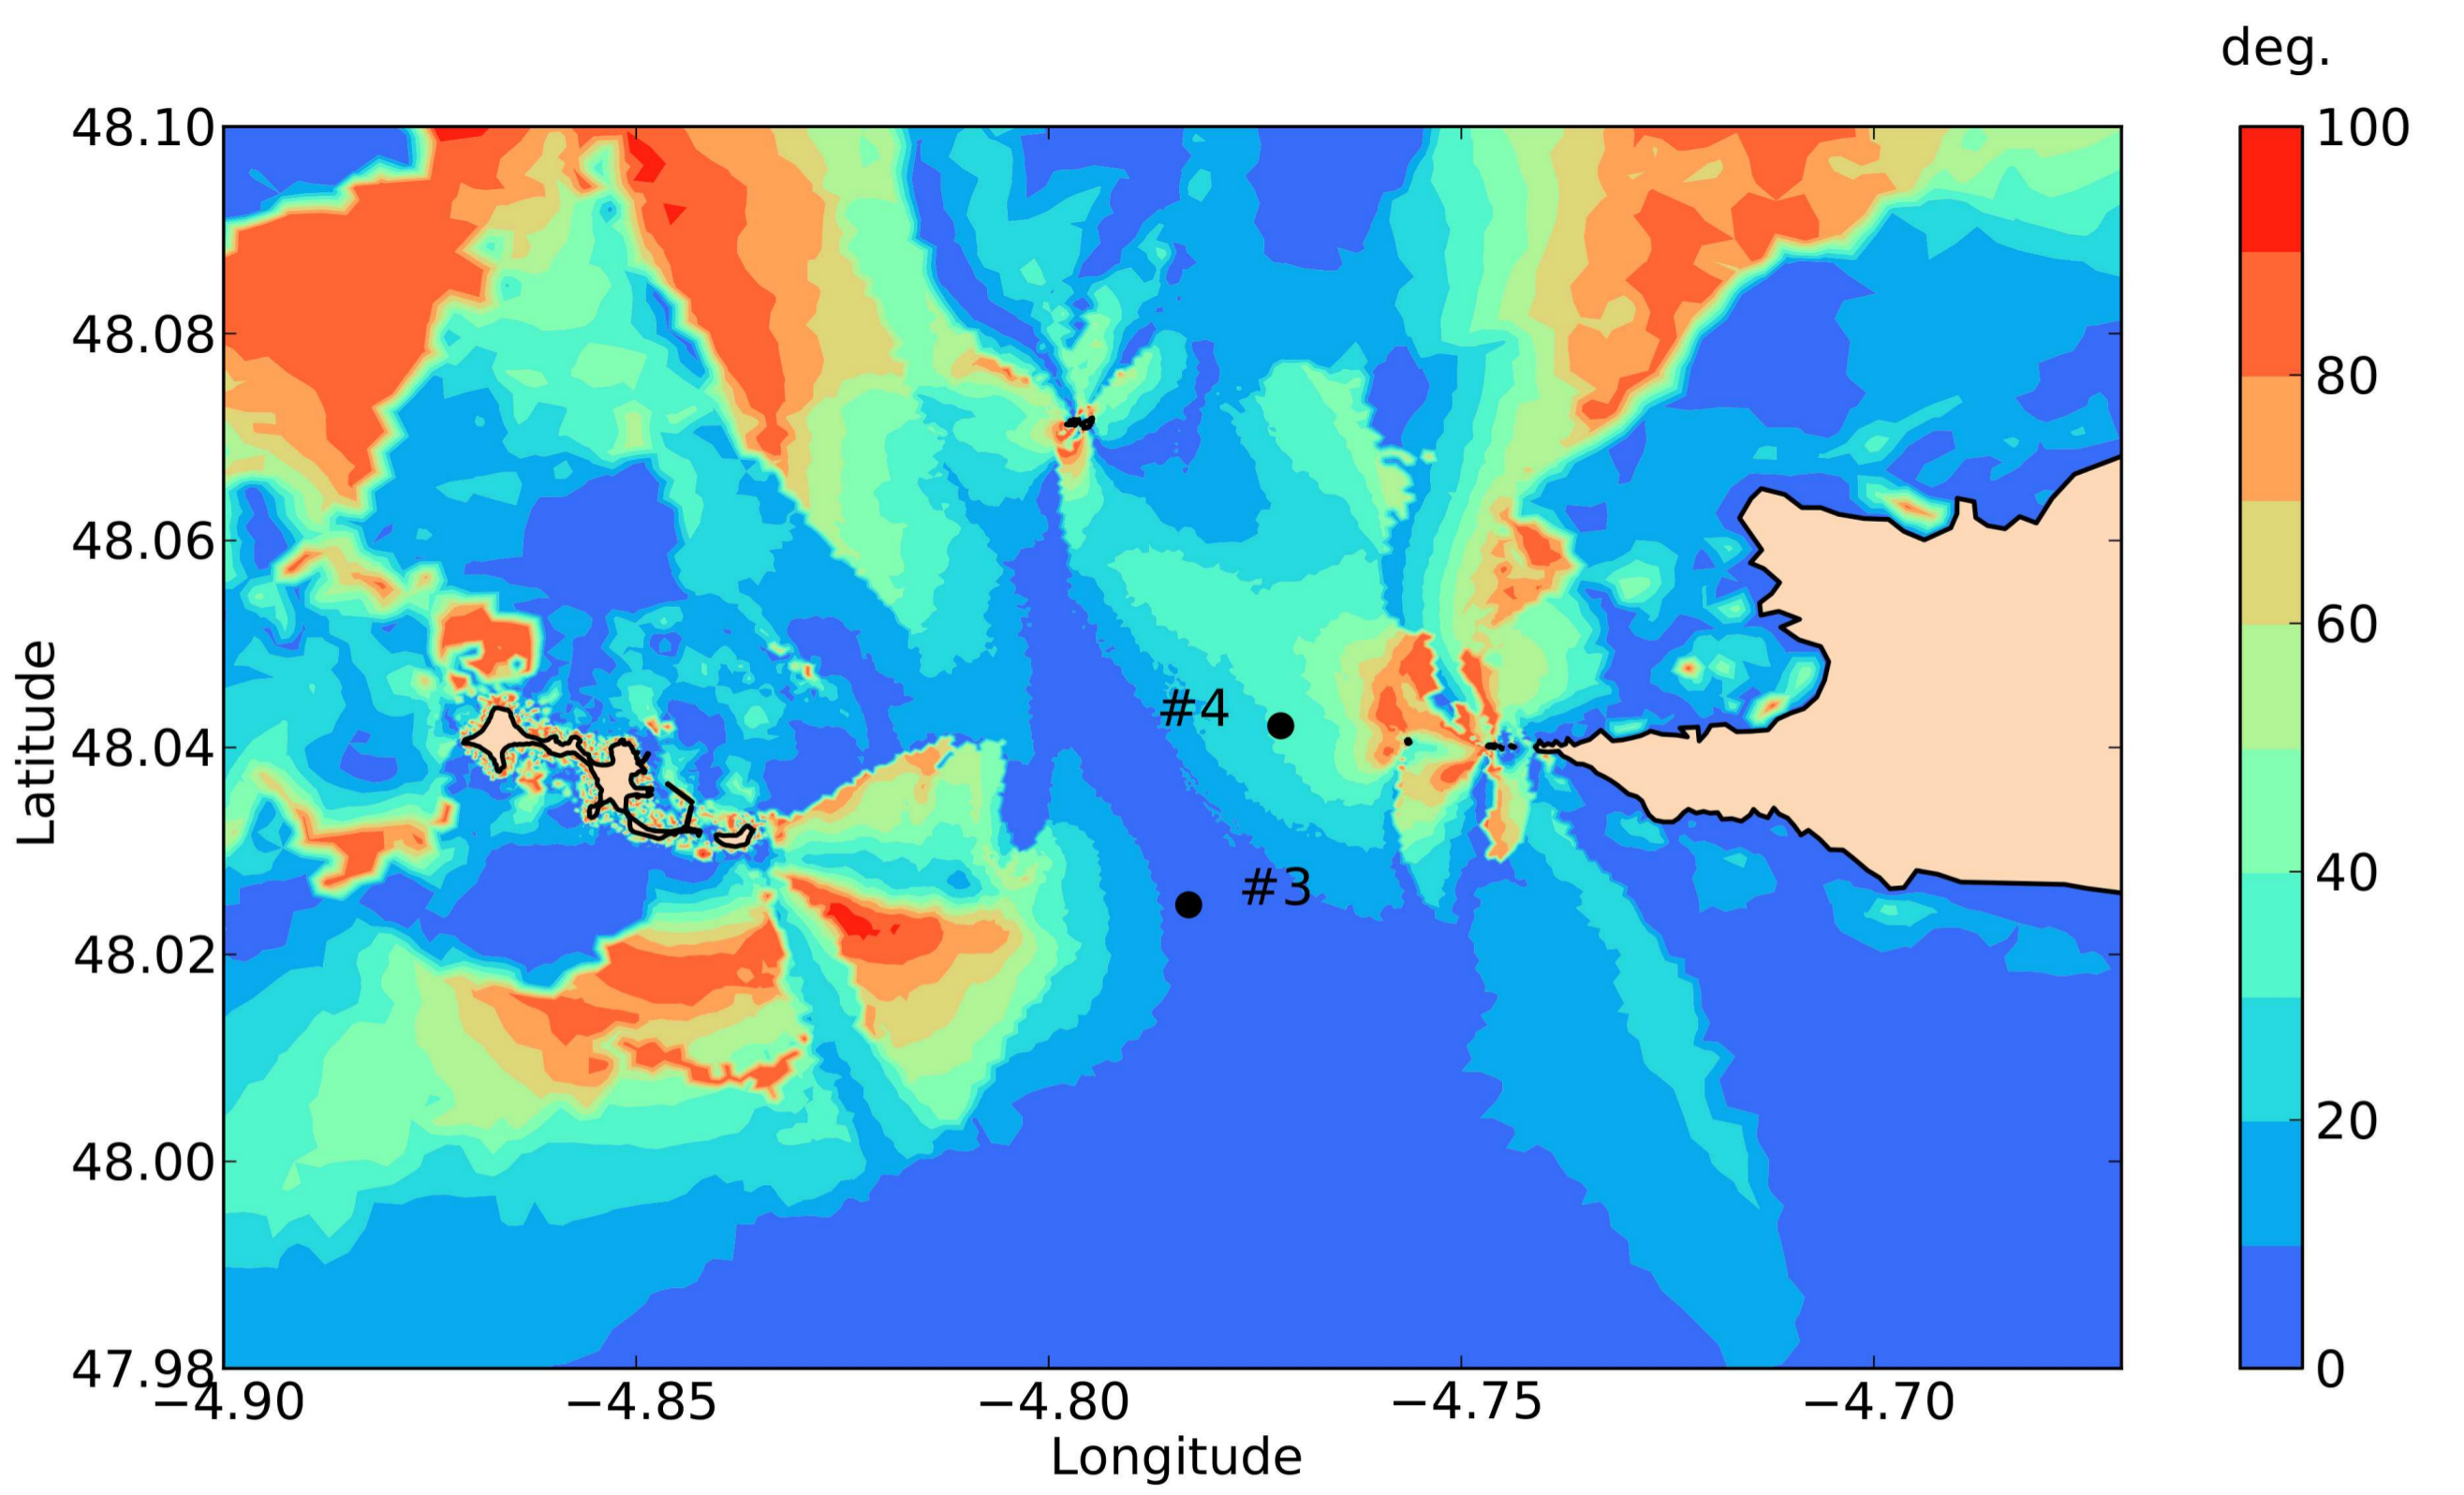
Figure 9.
Averaged misalignment direction between tidal stream power peaks in ebb and flood over a year. The black circles show the locations of Points #3 and #4.
Figure 9.
Averaged misalignment direction between tidal stream power peaks in ebb and flood over a year. The black circles show the locations of Points #3 and #4.

Figure 10.
Generated practical power at 10 m above the seabed from a 1-MW turbine with a fixed axis (blue line) and a yaw (red line) at Points #3 (a) and #4 (b) in spring-neap conditions (Figure 9).
Figure 10.
Generated practical power at 10 m above the seabed from a 1-MW turbine with a fixed axis (blue line) and a yaw (red line) at Points #3 (a) and #4 (b) in spring-neap conditions (Figure 9).

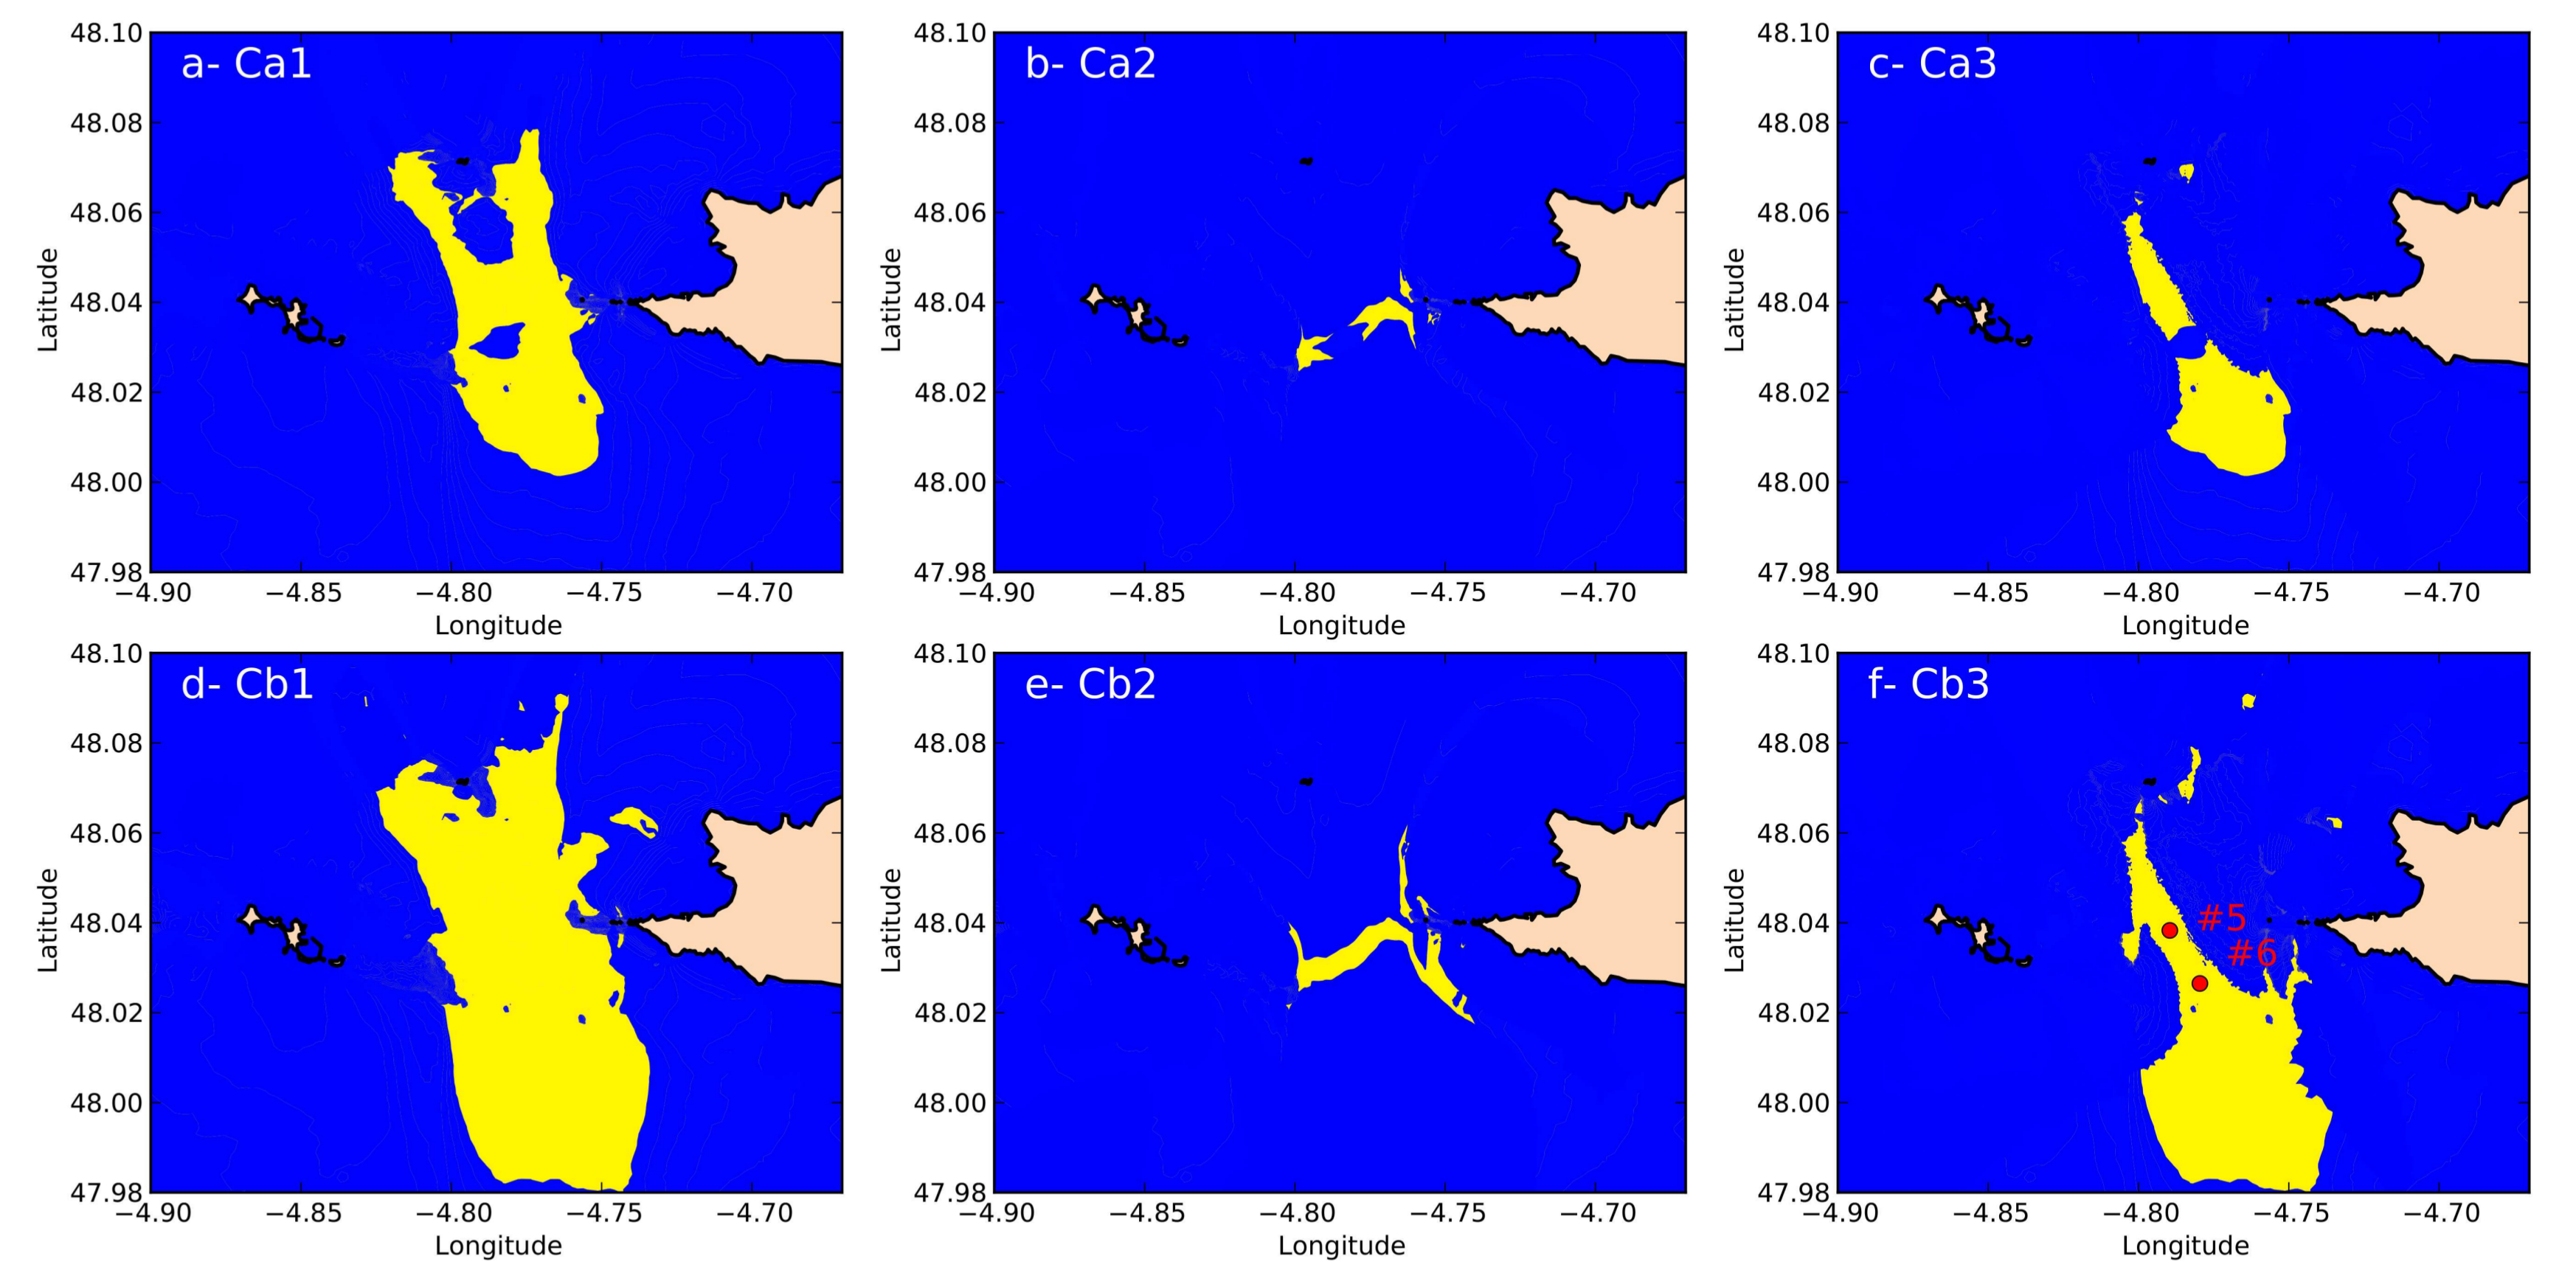
Figure 11.
Cartography of potential tidal stream energy sites based on criteria Ca1-3 (a–c), Cb1-3 (d–f) (Table 1). The yellow areas represent regions matching these criteria. The red circles show the locations of Points #5 and #6.
Figure 11.
Cartography of potential tidal stream energy sites based on criteria Ca1-3 (a–c), Cb1-3 (d–f) (Table 1). The yellow areas represent regions matching these criteria. The red circles show the locations of Points #5 and #6.

Figure 12.
Generated practical powers at 10 m above the seabed from a 1-MW turbine with a fixed axis (a) at Points #5 and #6 along with (b) aggregated power .
Figure 12.
Generated practical powers at 10 m above the seabed from a 1-MW turbine with a fixed axis (a) at Points #5 and #6 along with (b) aggregated power .


Table 1.
Criteria adopted for the cartography of potential tidal stream energy sites.
| Criteria | |||||
|---|---|---|---|---|---|
| Ca1 | • | • | |||
| Ca2 | • | • | • | ||
| Ca3 | • | • | • | ||
| Cb1 | • | • | |||
| Cb2 | • | • | • | ||
| Cb3 | • | • | • | ||
© 2017 by the authors. Licensee MDPI, Basel, Switzerland. This article is an open access article distributed under the terms and conditions of the Creative Commons Attribution (CC BY) license (http://creativecommons.org/licenses/by/4.0/).
Share and Cite
MDPI and ACS Style
Guillou, N.; Chapalain, G. Tidal Turbines’ Layout in a Stream with Asymmetry and Misalignment. Energies 2017, 10, 1892. https://doi.org/10.3390/en10111892
AMA Style
Guillou N, Chapalain G. Tidal Turbines’ Layout in a Stream with Asymmetry and Misalignment. Energies. 2017; 10(11):1892. https://doi.org/10.3390/en10111892
Chicago/Turabian StyleGuillou, Nicolas, and Georges Chapalain. 2017. "Tidal Turbines’ Layout in a Stream with Asymmetry and Misalignment" Energies 10, no. 11: 1892. https://doi.org/10.3390/en10111892
Note that from the first issue of 2016, this journal uses article numbers instead of page numbers. See further details here.