Comparative Study of Energy Performance between Chip and Inlet Temperature-Aware Workload Allocation in Air-Cooled Data Center


School of Control and Computer Engineering, North China Electric Power University, Beijing 102206, China
*
Author to whom correspondence should be addressed.
Energies 2018, 11(3), 669; https://doi.org/10.3390/en11030669
Submission received: 30 January 2018
/
Revised: 10 March 2018
/
Accepted: 12 March 2018
/
Published: 16 March 2018
Abstract
:Improving the energy efficiency of data center has become a research focus in recent years. Previous works commonly adopted the inlet temperature constraint to optimize the thermal environment in the data center. However, the inlet temperature-aware method cannot prevent the servers from over-cooling. To cope with this issue, we propose a thermal-aware workload allocation strategy with respect to the chip temperature constraint. In this paper, we conducted a comparative evaluation of the performance between the chip and inlet temperature-aware workload allocation strategies. The workload allocation strategies adopt a POD-based heat recirculation model to characterize the thermal environment in data center. The contribution of the temperature-dependent leakage power to server power consumption is also considered. We adopted a sample data center under constant-flow and variable-flow cooling air supply to evaluate the performance of these two different workload allocation strategies. The comparison results show that the chip temperature-aware workload allocation strategy prevents the servers from over-cooling and significantly improves the energy efficiency of data center, especially for the case of variable-flow cooling air supply.
1. Introduction
The explosive growth of information technology (IT) and cloud computation in recent years makes data centers consume nearly 2% of total worldwide electricity [1]. In order to provide an acceptable temperature and humidity environment for maintaining the stable operation of IT equipment, approximately 30–50% of energy consumption in an air-cooled data center is consumed by the cooling system [2]. Cooling energy consumption is an important part of the operation cost of data center [3]. Thus, improving the cooling efficiency of the data center attracts more and more attention in the design and operation stages.
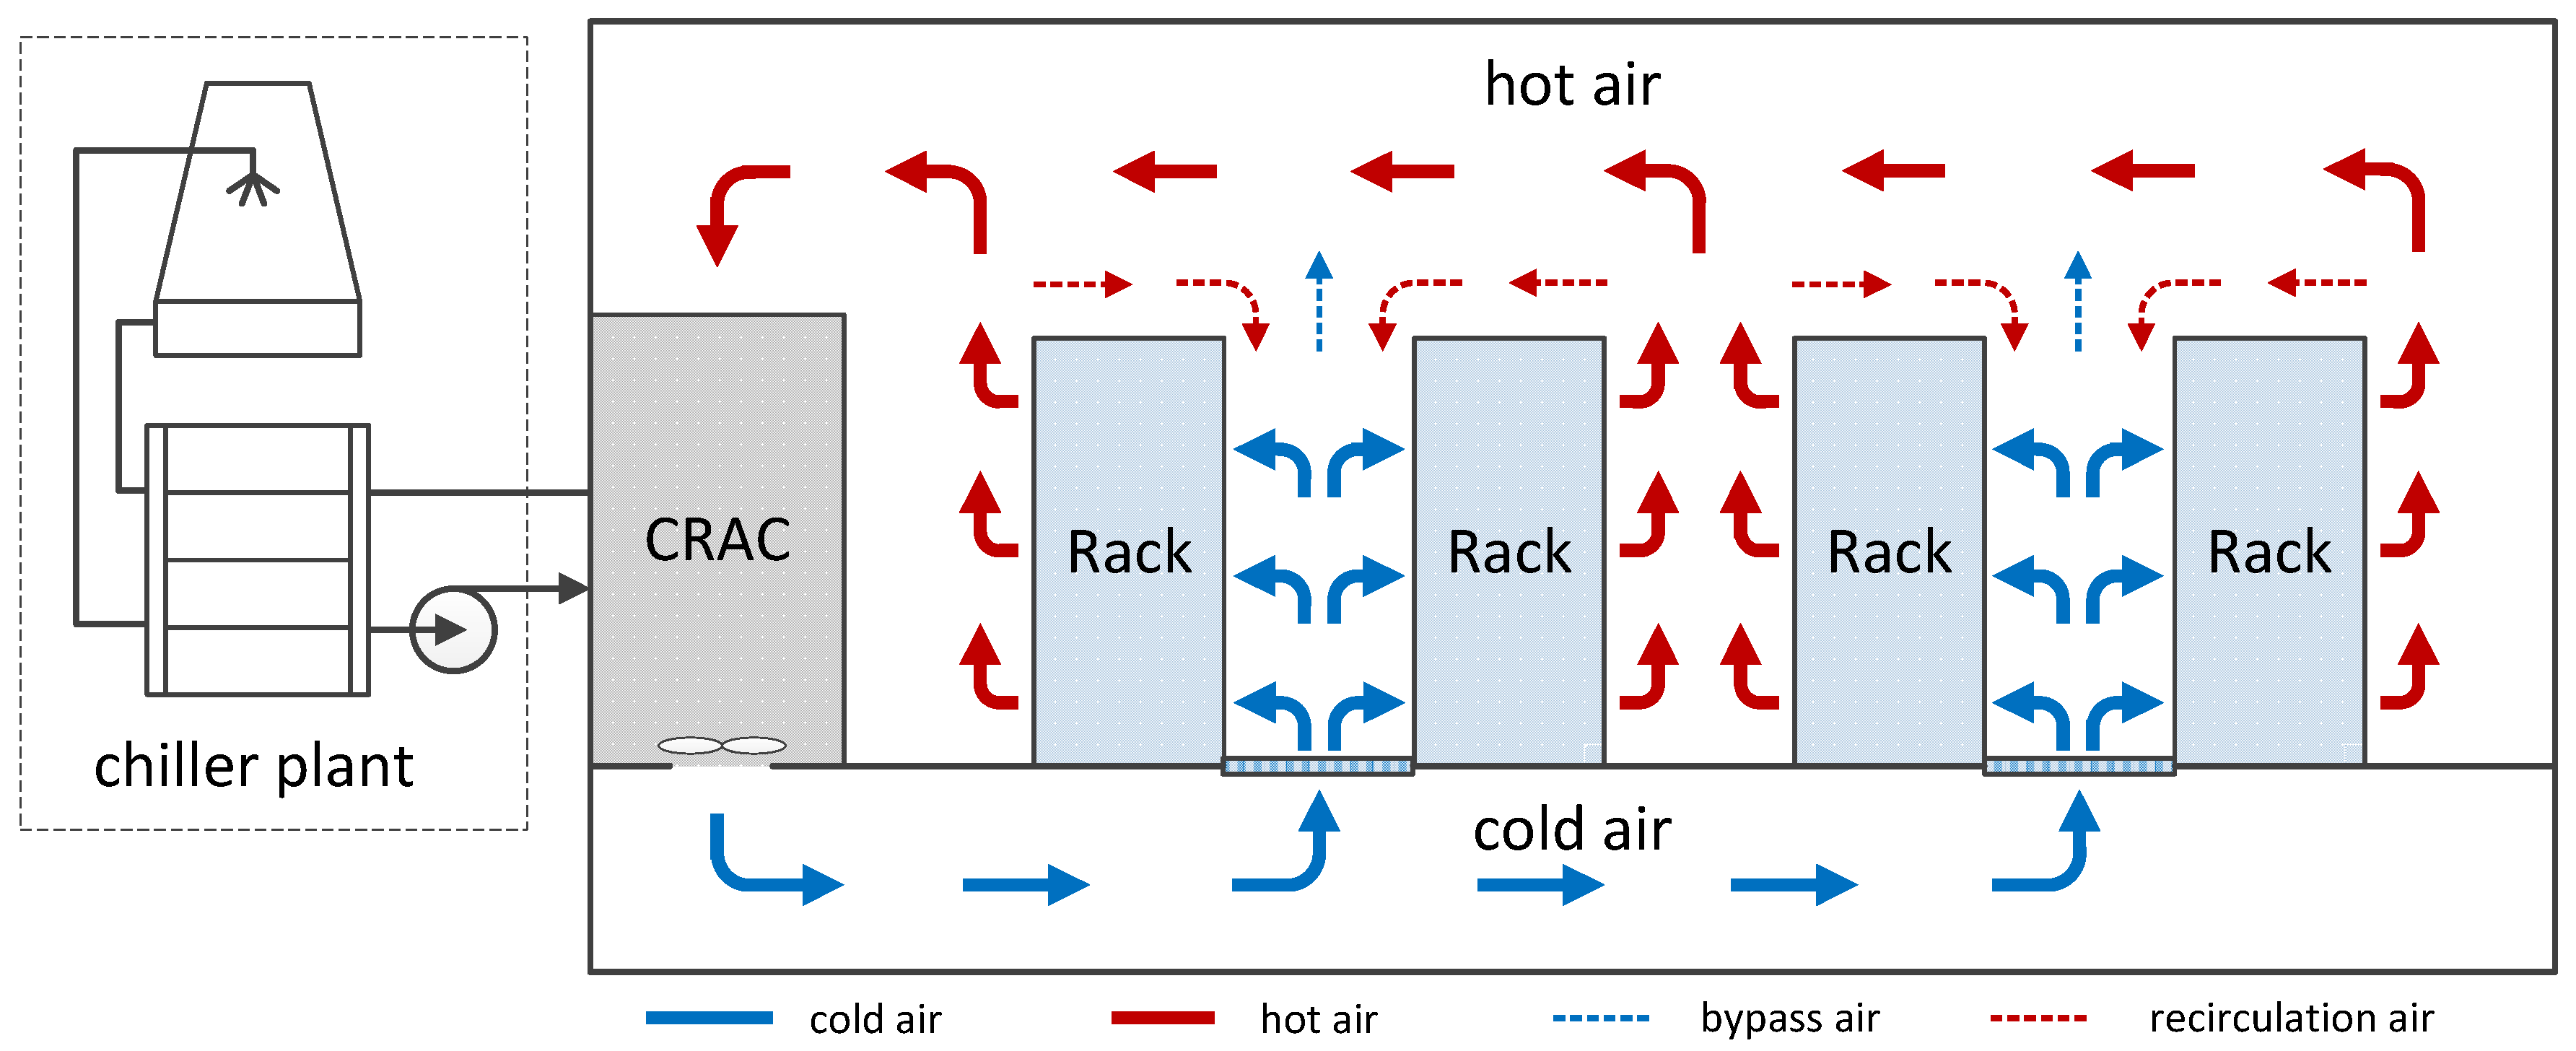
The typical air-cooled data centers commonly adopt the raised floor structure, as shown in Figure 1. The server racks are placed on the plenum and organized according to the hot aisle-cold aisle arrangement. The cooling air from computer room air condition (CRAC) is blown into the underfloor plenum and then distributes to the cold aisle via the perforated tiles. The rack inlets of the neighboring rows draw cooling air from the same cold aisle to remove the heat generated by IT equipment. Meanwhile, the rack outlets expel the same amount of exhaust hot air to the hot aisle. Finally, the heat generated by IT equipment is removed from the room space by CRAC. The hot aisle-cold aisle arrangement weakens the mixing of exhaust hot air and supplied cold air at server inlet, and effectively improves the energy efficiency of cooling system. Unfortunately, the exhaust hot air from electrical equipment still immerses into the cold aisle, especially at the top and side of server racks. In addition, some cooling air escapes from the cold aisle without passing through the server chassis. These recirculation airs elevate the temperature at server inlet and form some local hotspots. In order to provide an acceptable temperature environment for servers in these particular areas, the cooling system blows excess cold air into the equipment room, causing some servers over-cooled.
In fact, the workload in data center is easily migrated across servers via consolidation/ virtualization techniques. For computing-intensive data centers, this allows any computational task to be executed on any server. According to previous works, the energy efficiency of data center is improved by optimizing the workload distribution among servers. To maintain an acceptable thermal state for IT equipment, the inlet temperature is used as the optimization constraint in these studies. However, the inlet temperature-aware methods cannot prevent server from over-cooling since the server’s thermal state is correlated to its workload and the cooling air supply. To cope with this problem, we propose a chip temperature-aware strategy to optimize the workload scheduling in high-performance computing (HPC) data center. In this article, we conducted a comparative evaluation of the performance between the chip and inlet temperature-aware workload allocation strategies. These two workload allocation strategies are based on the heat recirculation model. Unlike previous works, the POD method is adopted to predict the cross-interference coefficients for the data center under variable-flow cooling air supply. In addition, the temperature-dependent leakage power of IT equipment is also estimated by a linear model. The comparison results show that the chip temperature-aware workload allocation strategy achieves a significant reduction in holistic power consumption of data center, especially for the case of variable-flow cooling air supply.
The rest of this article is organized as follows. Section 2 briefly reviews the related work. Section 3 presents the system model and the problem statement of chip and inlet temperature-aware workload allocation strategies. Section 4 compares the performances of these two different workload allocation strategies through a case study. Section 5 gives a summary of this article.
2. Relate Works
To enhance the energy efficiency in the air-cooled data center, previous studies have paid attention to optimize the thermal environment and the workload allocation of servers. In this section, we present a brief review of the related works.
With regard to the cooling efficiency, many researchers adopted computational fluid dynamics (CFD) software to study the geometric layout of data center. Nada et al. conducted a series of CFD simulations to investigate the impact of geometry layout on the thermal environment in data center [4,5]. They evaluated the thermal environment using several metrics, such as supply/return heat indices (SHI/RHI) and return temperature indices (RTI). Priyadumkol et al. performed a comprehensive study of different cooling systems in data center using CFD simulations [6]. The results showed that a significant reduction in cooling power is achieved by combining different cooling systems. In order to improve the energy efficiency in a data center, an enormous amount of attention has been focused on thermal modeling and workload scheduling [2,7,8]. Sun et al. proposed a spatio-temporal analytical model to study the thermal-aware task scheduling for a set of high-performance computing applications in both heterogeneous and homogeneous data center [9,10]. Tang et al. proposed a heat recirculation model to describe the thermal environment in data center [11,12]. They adopted a cross-interference matrix to characterize the heat transfer around the server racks. Based on the heat recirculation model, the supply temperature of cooling system is maximized for a given workload. Khalaj et al. presented a reduce order model to describe the heat flow in data center [13]. On the base of this reduced-order model, they proposed a multi-objective optimization problem that minimizes the impact of hot spots by optimizing workload distribution. Song et al. have constructed an artificial neural network to predict the effect of cooling air supply on temperature distribution [14]. The artificial neural network is then combined with a genetic algorithm to optimize the cooling air supply. Besides that, proper orthogonal decomposition (POD), as a reduced-order model algorithm, is widely used to derive temperature profiles from observations [15,16]. Samadiani et al. developed a POD-based modeling framework to predict the temperature distribution in computer room [17,18]. Based on the POD-based model, they proposed a compromise decision support problem to optimize the design parameters of data center. Ghosh et al. presented a POD-based multi-parameter model for predicting the transient temperature distribution in air-cooled data center [19,20]. Compared with the measurement data, the proposed method reconstructed the temperature profiles with an acceptable accuracy. Fouladi et al. combined a POD-based model with a flow network method to describe the cooling system in data center [21]. Their study showed that the optimization of cooling system achieved a significant reduction in cooling energy.
These inlet temperature-aware methods achieved a substantial improvement in energy efficiency in computer room, even though the inlet temperature does not properly characterize the thermal state of IT equipment.
3. System Model and Problem Statement
This section provides the system model used in our work. First, a POD-based heat recirculation model is introduced to characterize the thermal environment in data center, followed by a description of the power model for IT equipment and cooling system. Finally, the workload allocation strategies are proposed on the basis of the system models.
3.1. POD-Based Heat Recirculation Model
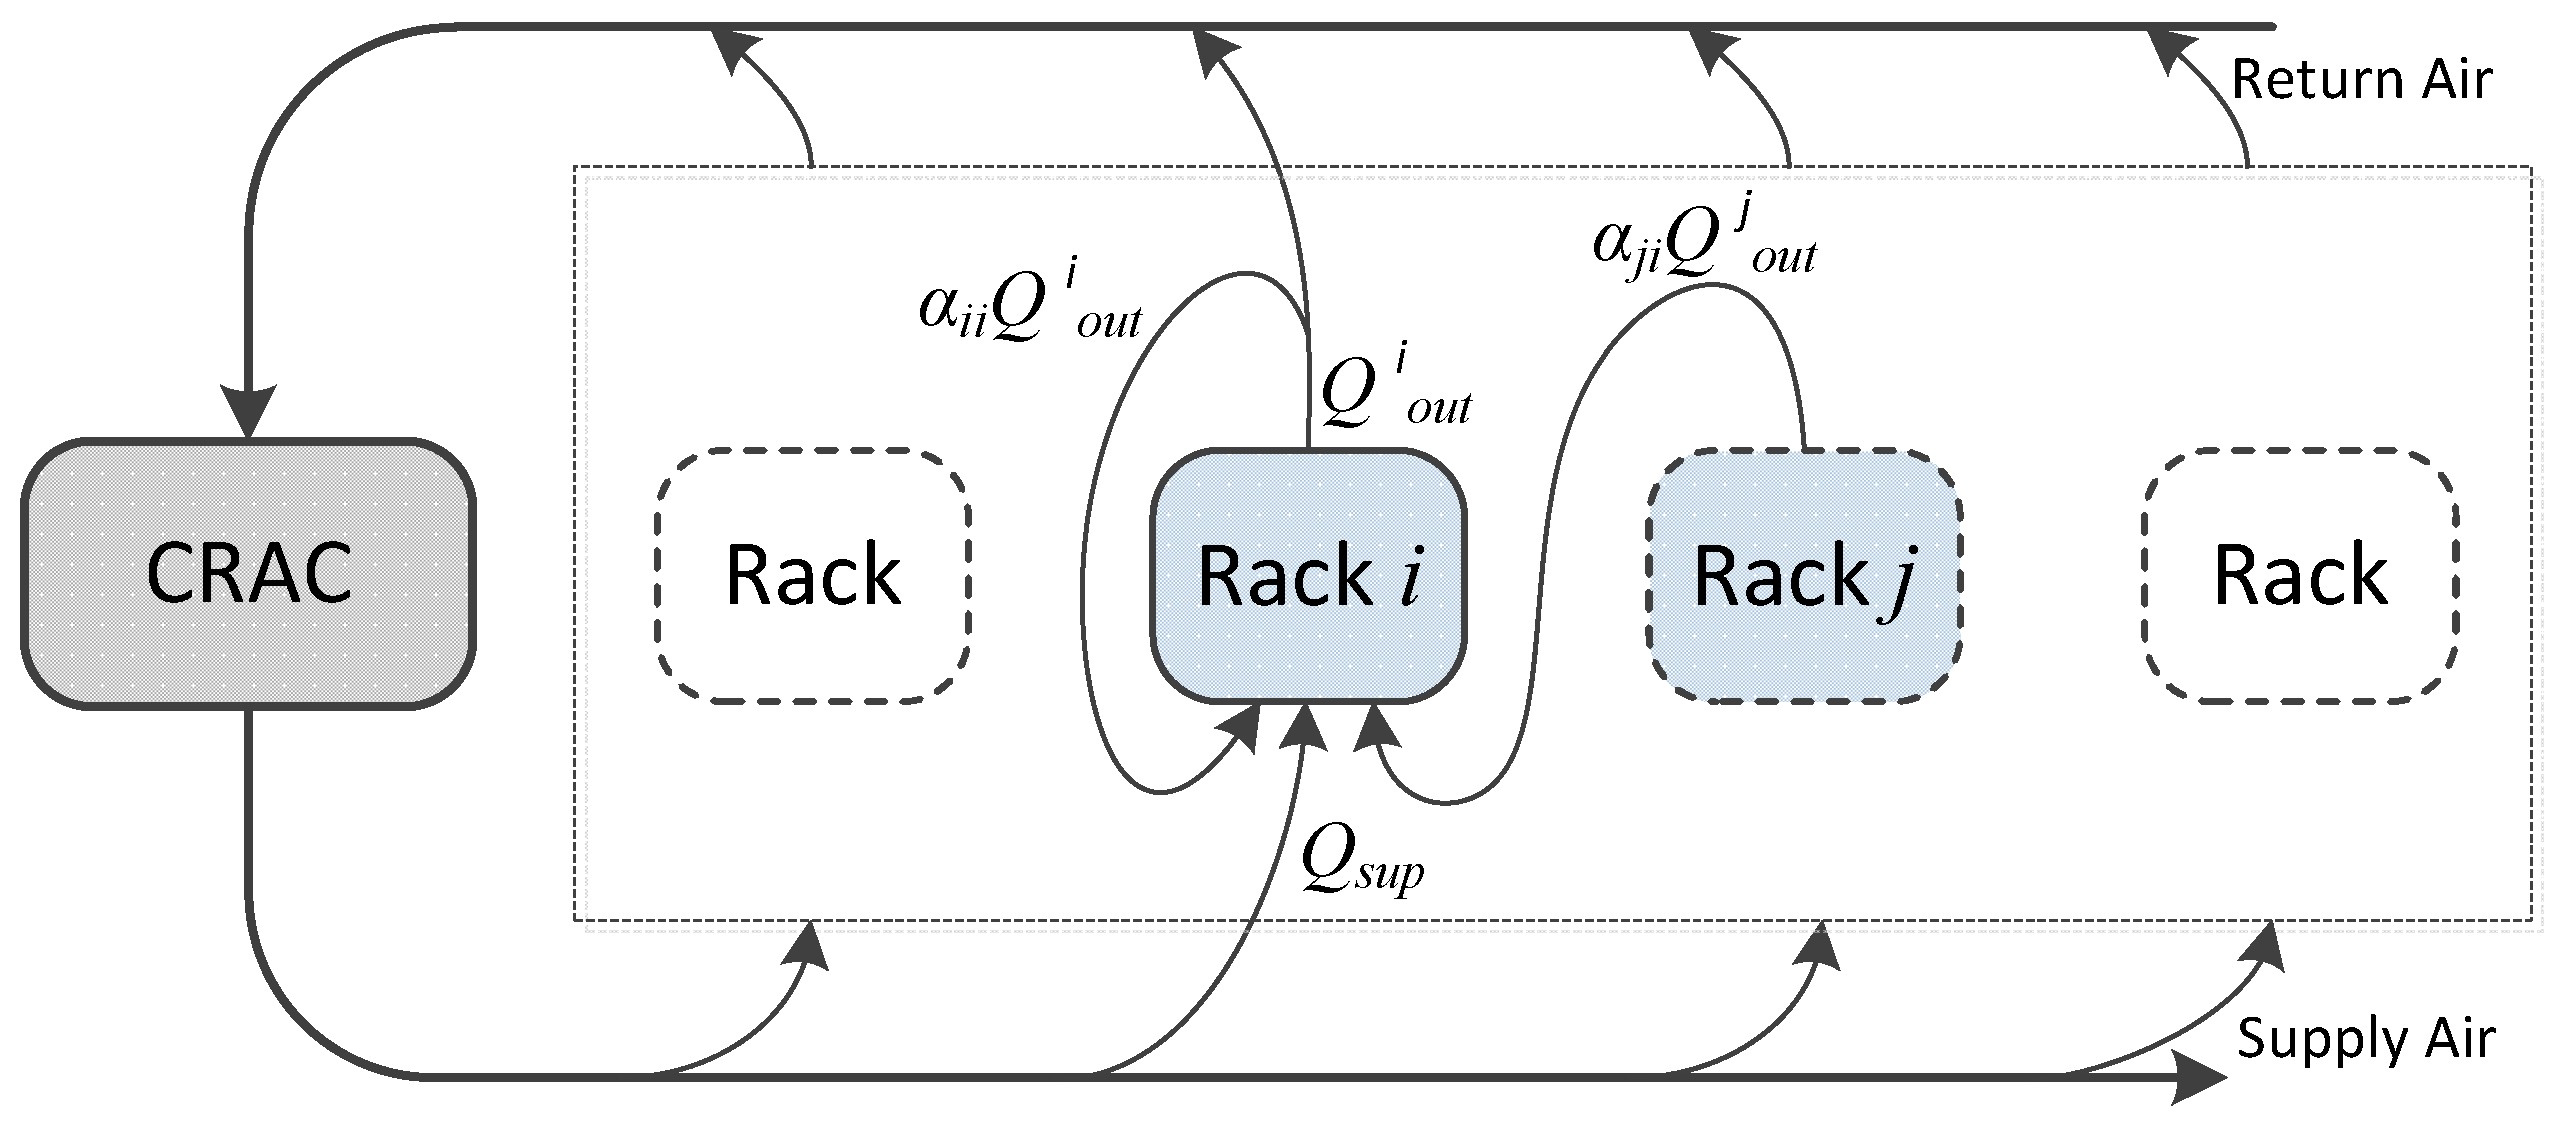
In a typical air-cooled data center, as shown in Figure 1, we assume there are n server chassis and each server chassis is considered to be a thermal node. In order to remove the heat generated by the IT equipment, server chassis i draws a constant amount of cooling air at average temperature and expels the same amount of exhaust air at average temperature . Due to the heat recirculation around server racks, the air sucked by server chassis is the mixture of cooling air from CRAC and the exhaust air from server chassis outlets. The typical heat transfer among server racks, as shown in Figure 2, can be described using a cross-interference coefficient matrix proposed by Tang et al. [11], where denotes the amount of heat transfer from chassis i to chassis j. It has been proved that the cross-interference coefficients depend on the geometry layout and the air velocity field in data center. In the previous works, the cross-interference coefficients are commonly obtained from CFD simulation. However, for the case of variable-flow cooling air supply, this method is not suitable for the iterative optimization due to time-consuming. To cope with this problem, we adopt a POD-based method to rapidly derive the cross-interference coefficients of data center.
3.1.1. Proper Orthogonal Decomposition
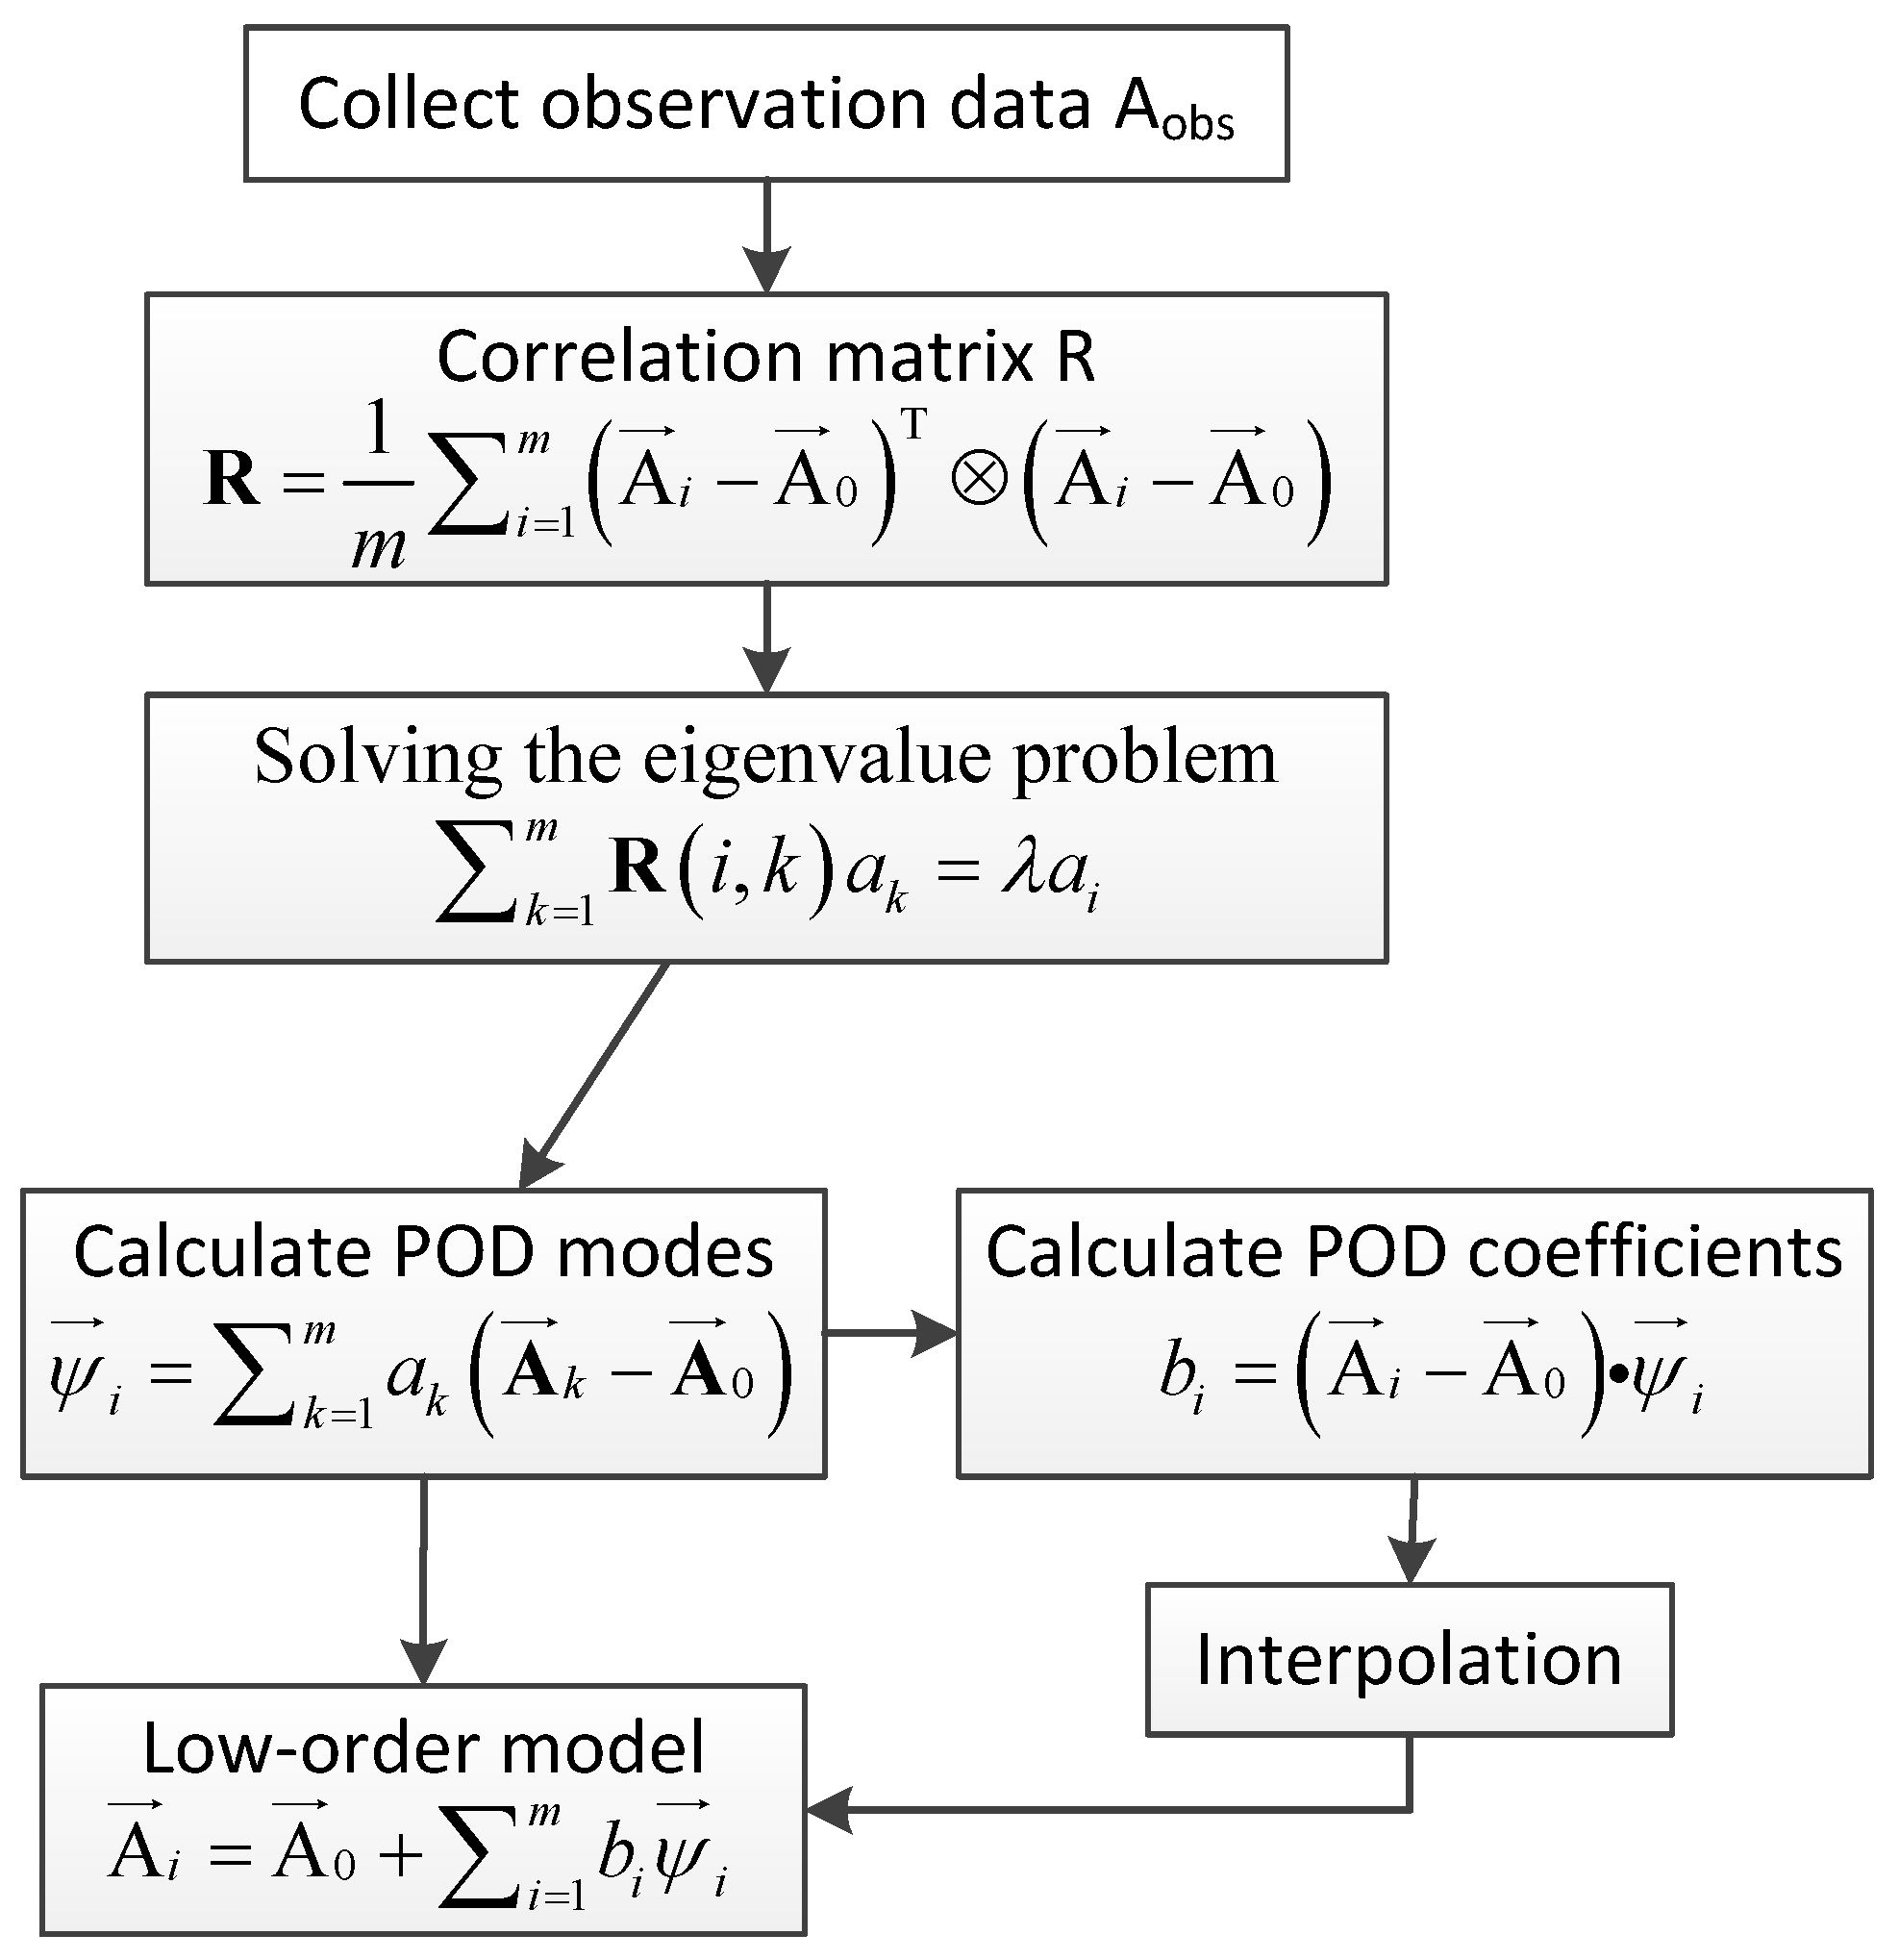
The Proper orthogonal decomposition (POD) is a reduced-order model method widely applied in varies fields. It is capable to derive an orthonormal basis set from the observation dataset to reconstruct the original high-dimensional process [22,23]. In this section, we present a POD-based framework on the base of simulation data to predict the cross-interference coefficients of data center under different cooling air supply. The procedure of this POD algorithm, as shown in Figure 3, is described as follows:
- Generate observation data set: For the POD algorithm used in present study, the m observations of cross-interference coefficient are generated from CFD simulation by varying the cooling air supply. The cross-interference coefficients in data center can be expressed in vector form:where denotes the i-th observation, is the mean of m observations, denotes the fluctuate value of the i-th observation.
- Calculate POD basis : For a set of observation cases, the POD basis is calculated byIn Equation (2), the weight coefficient for assembling the i-th POD basis is obtained by solving an eigenvalue problem:where is the correlation matrix. The eigenvalue denotes the energy of the corresponding POD basis.
- Predict the cross-interference coefficients for new case: According to the POD model reduction algorithm, the cross-interference coefficients is expanded as:where is the coefficient of POD basis. For the observation case, the coefficient of POD basis for reconstructing the original observation is determined byNow, for each observation case, we have a set of coefficients to match the design variable, such as cooling air supply in present study. In order to predict the cross-interference coefficients of data center with variable-flow cooling system, the coefficient of POD basis corresponding to arbitrary cooling air supply is generated by interpolation among the coefficient sets of observation solutions.
3.1.2. Heat Recirculation Model
In present study, we adopted the abstract model proposed by Tang et al. to describe the heat transfer among servers in data center [11,12]. Assuming that all the power consumed by IT equipment is converted to heat, the steady heat exchange between server chassis i and the cooling air, according to the thermodynamic law and the energy conservation law, is expressed as
where is the power consumption of chassis i, denotes the heat carried by outlet airflow, denotes the heat carried by inlet airflow, is the density of air, is the specific heat of air, is the volume flowrate of cooling air passing through chassis i, and denote the average temperature of inlet and outlet airflow respectively.
For brevity, Equation (6) is rewritten as
where . Since the physical properties of air in data center can be considered as constants, the value of is determined by the air flowrate of server chassis i. Equation (7) means the heat load of chassis i heats the airflow from to .
Considering the heat recirculation among all n server chassis in data center, the heat balance of chassis i is expressed as
or equivalently as
where is the sum of recirculation heat sucked by chassis i, is the heat carried by the cooling air from CRAC, is the supply temperature of CRAC. Now, we rewrite Equations (7) and (8) in vector form:
where is defined as
is the outlet temperature vector, is the supply temperature vector and is the power consumption vector.
Considering the IT equipment in server chassis has homogeneous physical states, we adopt a thermal resistance model to characterize the steady heat transfer between IT equipment and cooling air [24], which is expressed as
or equivalently as
where and are the thermal-physical properties of chassis i representing the chip temperature and the convective thermal resistance respectively. This heat resistance is depends on the heat exchanger area and the cooling air velocity. For all n server chassis in data center, the chip temperature is expressed as:
where is defined as
denotes the chip temperature vector.
3.2. Server Power Model
The server power consumption consists two parts: computing power and leakage power [25]. The computing power can be estimated by a linear function of server utilization rate [26]. Assuming that the servers within chassis i work at the same utilization rate, hence the computing power of chassis i is expressed as:
where [0, 1] is the utilization rate, and represent the idle power and the additional computing power for handling workload, respectively. Considering the temperature-dependent leakage effect, the power consumption of server chassis i is modeled as
where is a function of chip temperature for estimating the leakage power [27]. In the operating temperature range, can be approximated as a linear function with acceptable accuracy [28].
Now, the power consumption of chassis i is given by
which means the server power consumption is correlated with the utilization rate and the chip temperature.
3.3. Cooling System Power Model
For a typical air-cooled data center, the cooling power is mainly consumed by the chiller system and the CRAC blower.
The power consumption of chiller system depends on its heat load and coefficient of performance (COP). COP is defined as the ratio of the heat load to the chiller power consumption. Considering all the power drawn by IT equipment is converted to heat, COP is expressed as
where denotes the power consumption of IT equipment. In this work, the COP of chiller system is estimate by an empirical model
obtained from HP utility data center [29], where COP is a quadratic function of the supply temperature. Now, the chiller power is expressed as
Besides the chiller system, the CRAC blower consumes additional power to deliver cooling air to the computer room. In present study, the power consumption of CRAC blower is estimated as follows:
where is the volume flowrate of cooling air, , and denote the reference working condition of CRAC blower, as shown in Table 1.
3.4. Problem Statement
From the energy perspective, the performance of workload allocation strategy in air-cooled data center can be characterized by the holistic power consumption. In present study, the data center adopts a variable-flow cooling system to provide cooling air. For a given heat load, the power consumption of cooling system is correlated to the supply temperature and the volume flowrate of cooling air. Considering the contribution of auxiliary equipment (such as facilities lighting, etc.) to the total energy cost is negligible, the total power consumption of data center is expressed as
where demotes the power consumption of IT equipment, and denote the power consumption of cooling system.
For simplicity, assume that the data center has n identical server chassis and the servers in chassis i work at utilization rate , thus the server chassis can be seen as a thermal node. In present study, we consider there is a linear mapping between server workload and server utilization, the total workload in data center is defined as . Based on the system models described above, we propose a chip temperature-aware workload allocation strategy to optimize the workload assignment. For comparison, this article also describes an inlet temperature-aware workload allocation strategy. Two different workload distribution strategies are as follows:
(a) Chip temperature-aware workload allocation (CTWA)
In order to provide an acceptance thermal state for electronic equipment, this strategy adopts the chip temperature as constraint to optimize the workload spreading among servers. According to the previous studies, the threshold of chip temperature is set to 75 °C which will not decrease the reliability and performance of IT equipment [30]. The problem is defined as:
(b) Inlet temperature-aware workload allocation (ITWA)
This is a proactive scheduling strategy that keeps the server inlet temperature below the threshold by optimizing the workload distribution scheme, it was first proposed by Tang et al. [31]. According to the guidelines provided by American Society of Heating Refrigeration and Air-conditioning Engineers (ASHRAE), the threshold of inlet temperature is set to 27 °C [1]. The problem is defined as:
In the above optimization problem, the air supply temperature , the air volume flowrate and the workload allocation vector are used as the decision variables. The constraint 15 °C ≤ ≤ 35 °C ensures the air supply temperature is within the chiller operating range.
In order to solve the optimization problems, a single-objective genetic algorithm (GA) is applied to explore the design variables space to find the near-optimal solution that minimizes the holistic power consumption of data center. In present study, the chromosome used in GA algorithm is defined as , and the fitness of chromosome is measure by data center power consumption:
The GA algorithm is implemented using the global optimization toolbox in MATLAB (Version R2016b, MathWorks Inc., Natick, MA, USA).
4. Simulation and Discussion—Case Study
4.1. Simulation Setup
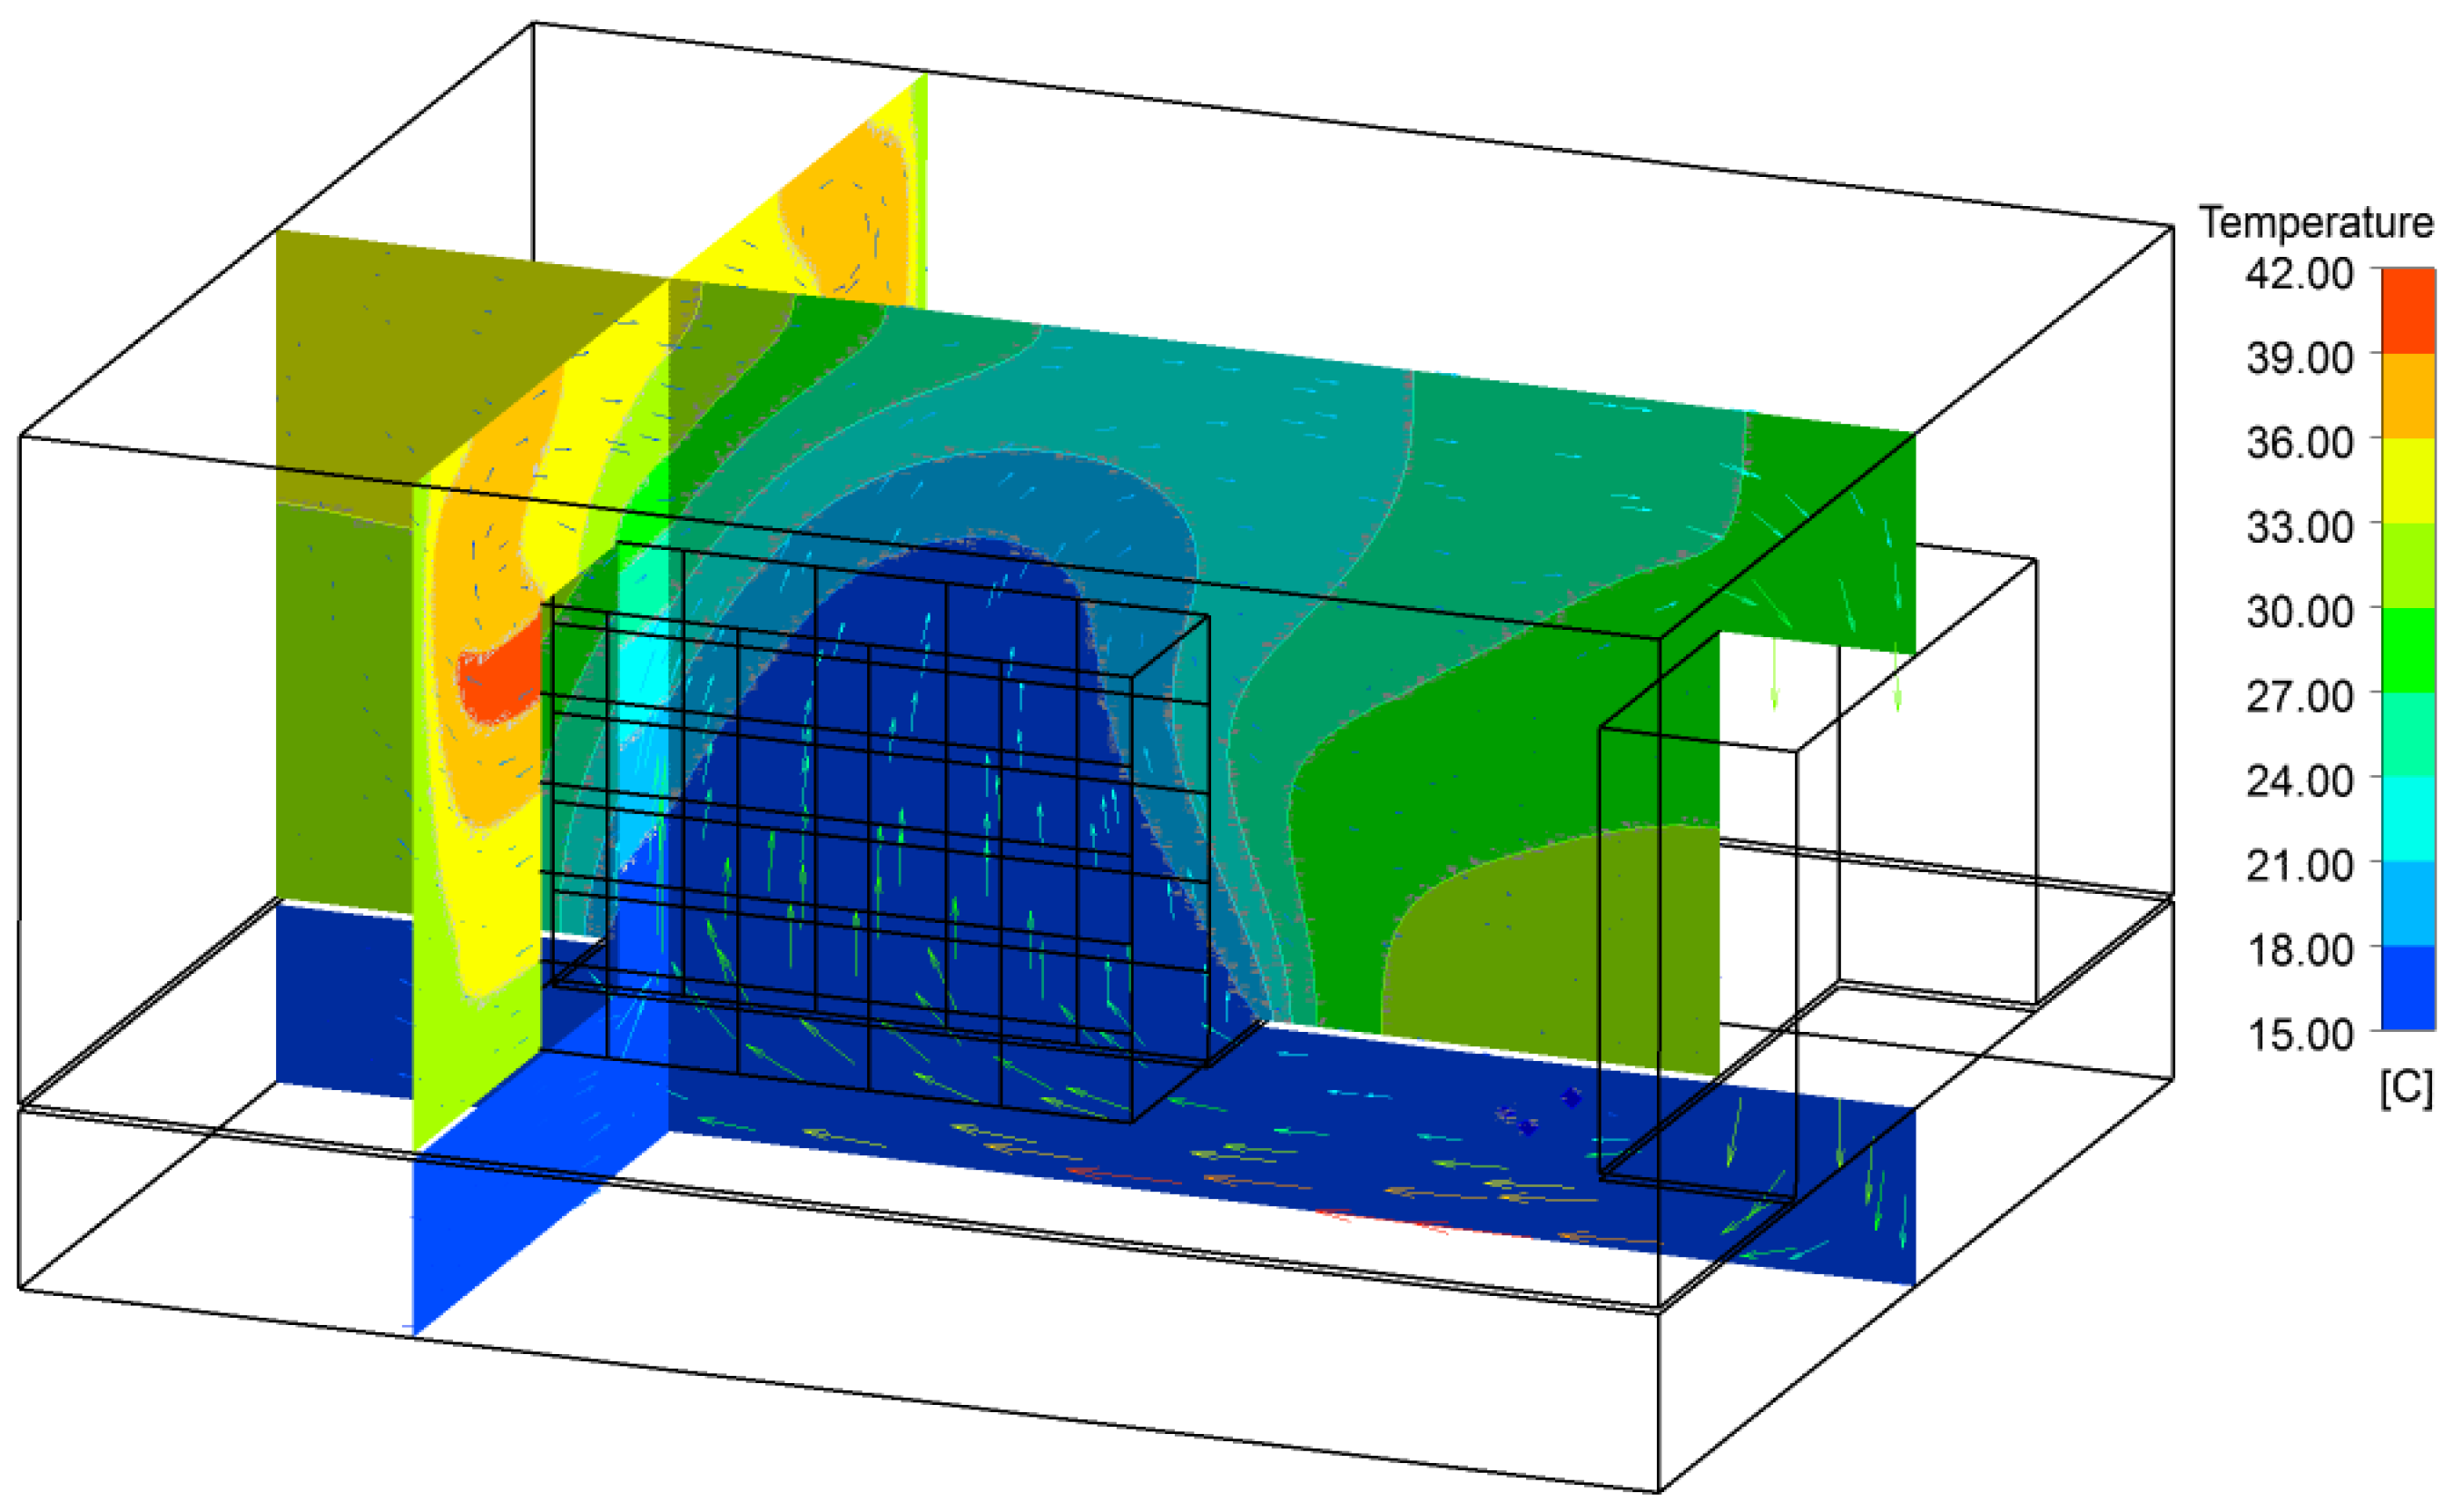
In this study, a sample data center simulated with Ansys CFX 14.5 is used to evaluate the performance of workload allocation strategies described in Section 3.4. Figure 4 presents the geometry layout of the sample data center. The length and the width of room are 7.8 m and 6 m respectively. The height of plenum is 0.8 m and the ceiling is 3 m above the raised floor. A single CRAC provides cooling air to the computer room via two rows of five perforated tiles (0.6 × 0.6 m2, 25% open). Above the raised floor, ten server racks are arranged symmetrically on either side of the perforated tiles. There are five server chassis in each rack and each server chassis draws 0.226 m3 of cooing air per second to remove the heat generated by IT equipment. The air volume flowrate of CRAC is in the range of 5.04–17.64 m3/s and the supply temperature is in the range of 15–35 °C. The pressure drop of the cooling air through perforated tile is estimated as , where and v denote the air density and the air velocity respectively, and K is the resistance factor that depends on the opening ratio (K = 42.8 for a perforated tile with 25% opening).
The data center model is meshed using Gambit software (Version 2.4.6, Fluent Inc., Lebanon, NH, USA) and solved using Ansys CFX software (Version 14.5, ANSYS Inc., Canonsburg, PA, USA) until the maximum residual error is below 1 × 10⁻⁵. The air in computational domain is considered to be incompressible. Table 2 presents the air material properties applied in CFD simulation. The buoyancy effect is estimated using Boussinesq model. Considering the accuracy and the computation time, the data center model is meshed with 1,242,720 hexahedral elements. In order to quantify the air recirculation around the server racks, the virtual tracer is introduced at the outlet of each server chassis [32]. By measuring the tracer at the inlet of target server chassis, we can obtain the mass ratio of recirculation air originating from each server chassis.
As illustrated in Figure 4, the sample data center contains 50 identical server chassis. The previous research shows that the typical server in idle state consumes nearly 50% of peak power [33]. In this work, we assume the peak power and the idle power of server chassis are 4200 W and 2100 W respectively. The computing power is expressed as . Base on the measure data in [30], the temperature-dependent leakage power is estimated by . Thus, the power consumption of server chassis i is expressed as
Assuming the server temperature reaches 75 °C when the server utilization is 100% and the server inlet temperature is 27 °C, the thermal resistance of server chassis is set as =0.011928 K/W according to Equations (12) and (26). For simplicity, we assume the corresponding server chassis in each row work at the same utilization. In our work, a GA algorithm with integer encoding is adopted to search the optimal cooling parameters and workload allocation scheme, as presented in Section 3.4. There are 200 solutions in each generation and the chromosomes are initialized by allocating the workload to each chassis node equally. The crossover function is set as scattered. The crossover probability is 0.8 and the mutation probability is 0.05. The server utilization, the supply temperature, and the CRAC air flowrate vary in steps of 0.05%, 0.5 °C, and 0.252 m3/s, respectively.
4.2. Verification of POD-Based Heat Recirculation Model
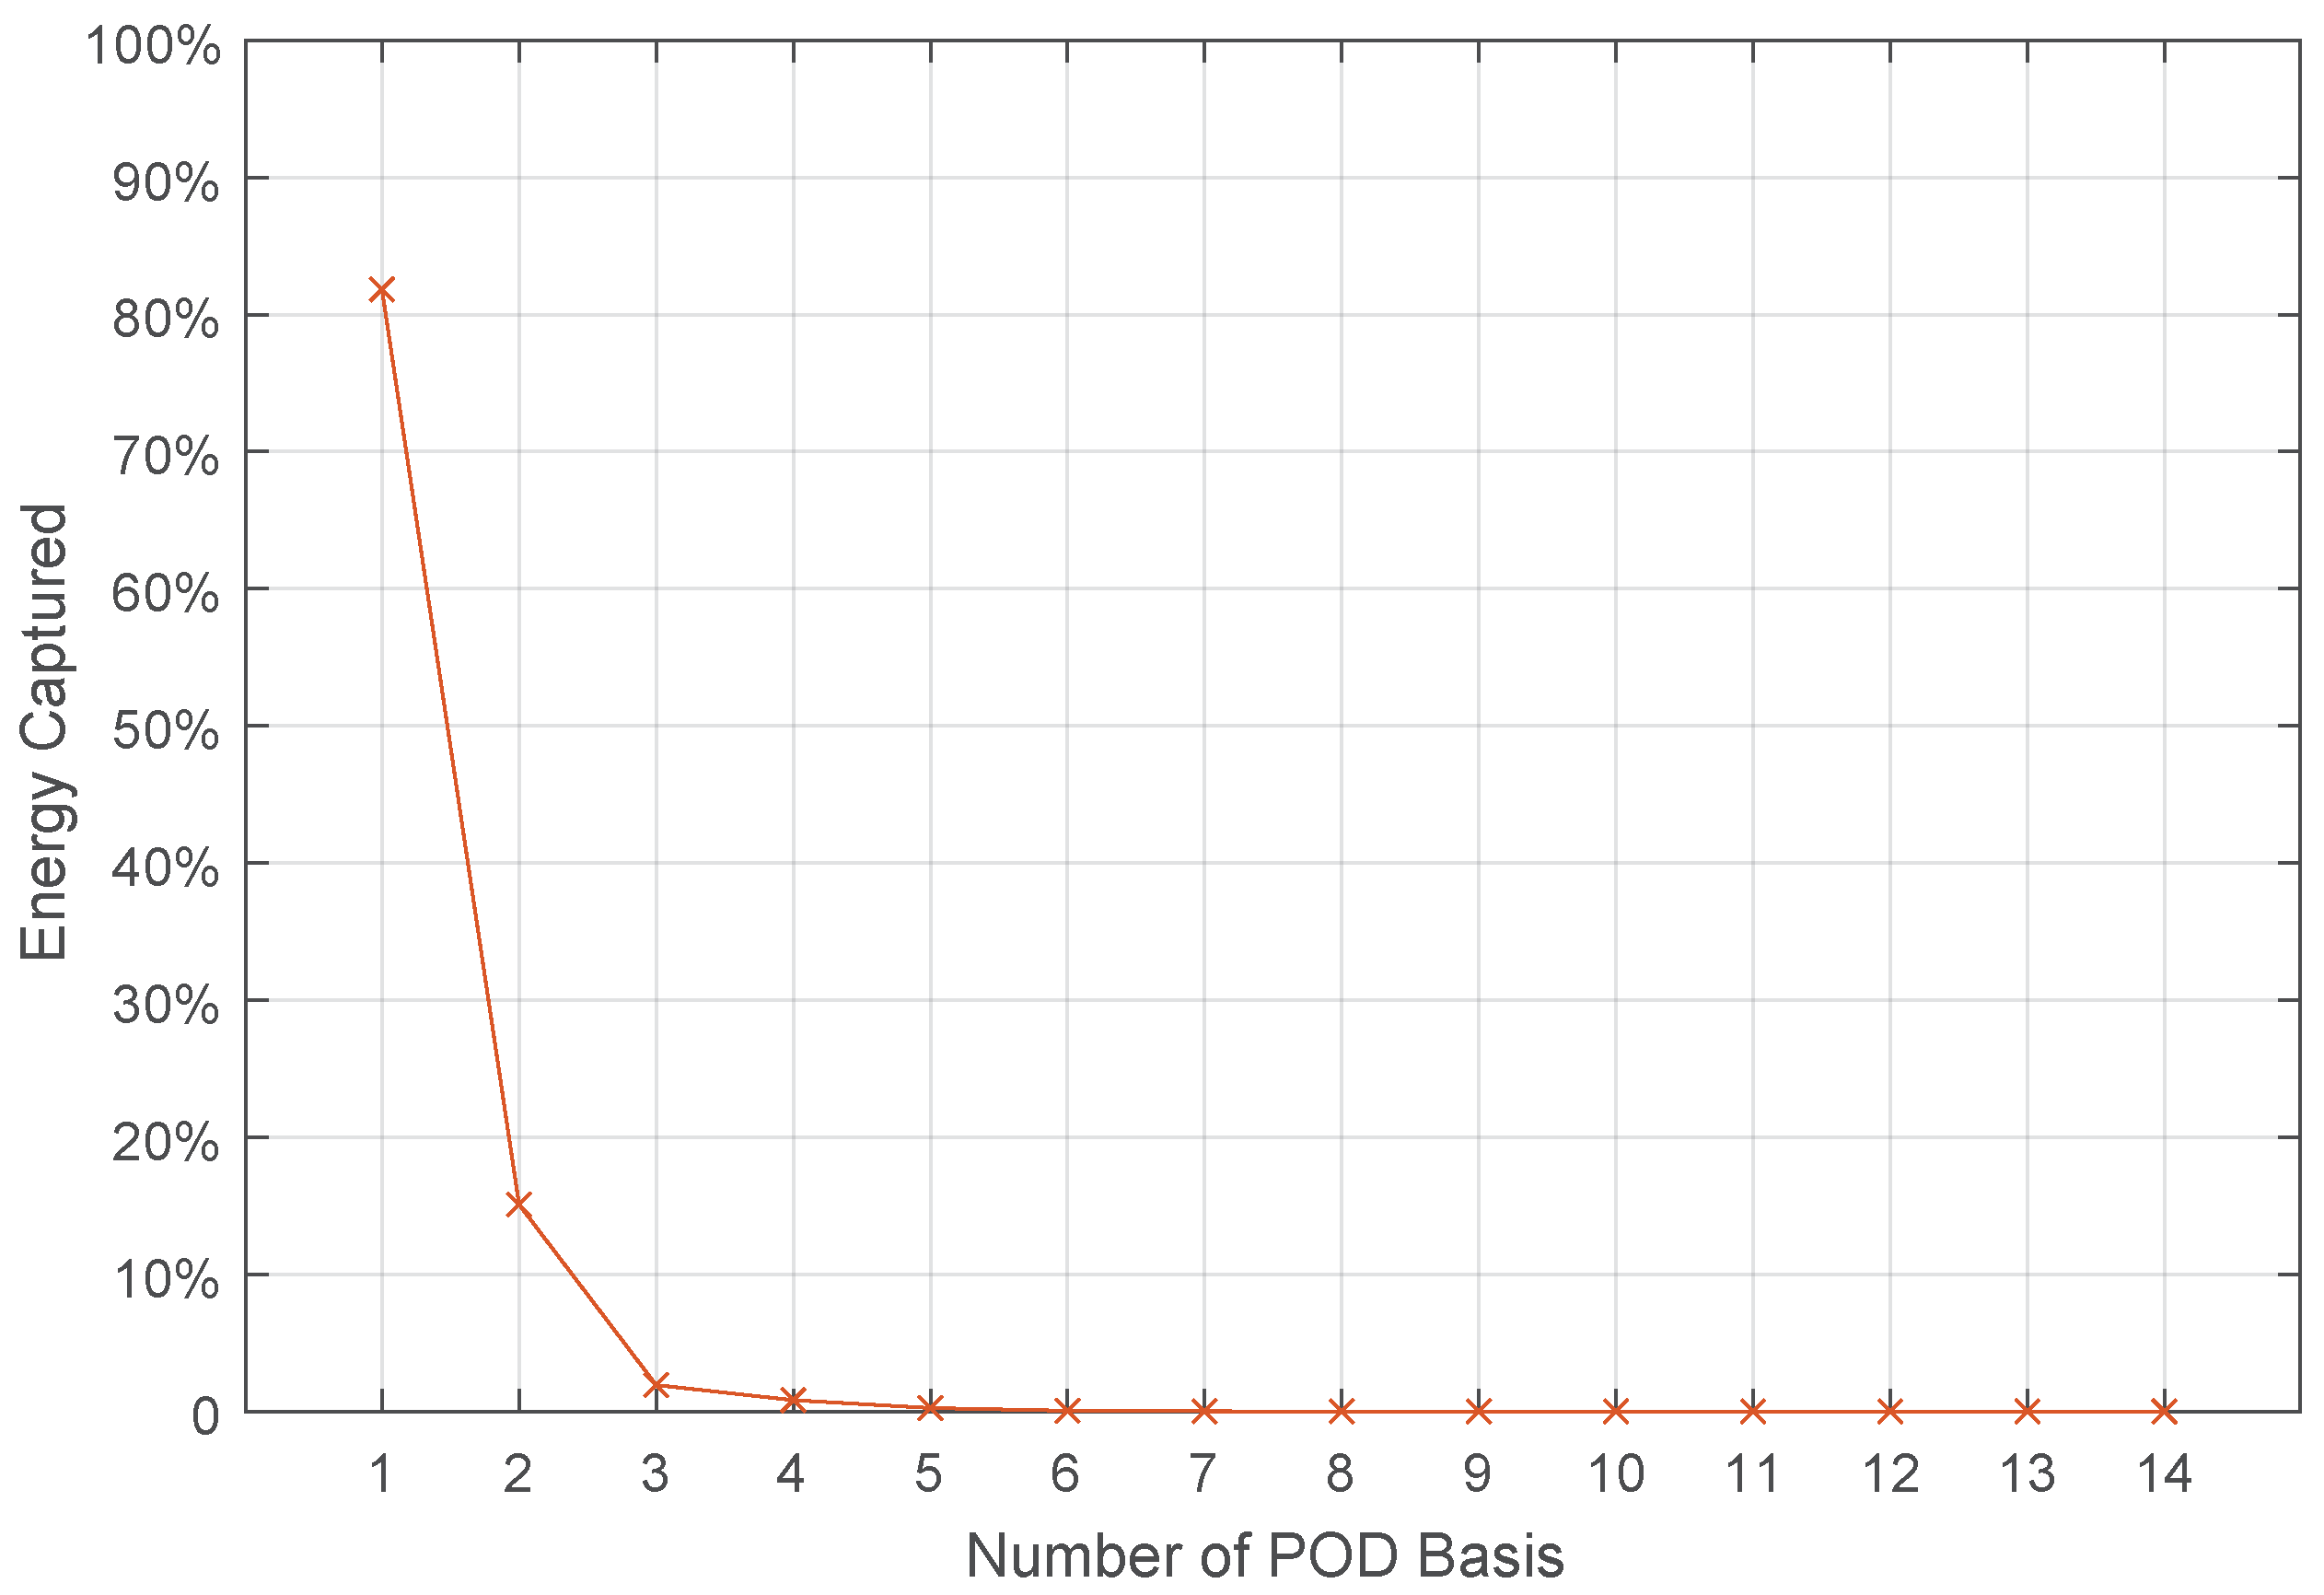
In this study, we use 14 CFD simulation cases to develop the POD models to reconstruct the cross-interference matrix. The observations are obtained by varying the air flowrate of CRAC, where . Using the POD algorithm presented in Section 3.1, we derive 14 POD bases from the observations and the energy of each POD basis is shown in Figure 5. We observe that the first several POD bases contain most of the system energy. In order to accurately describe the heat recirculation, we use 7 POD bases, which retain 99.92% of the total energy, to reconstruct the cross-interference matrix. For each observation case, the POD bases have a set of weight coefficients corresponding to the cooling air supply. In order to characterize the heat recirculation in data center with variable-flow cooling supply, the coefficients of POD bases are generated using cubic spline interpolation among the coefficient sets of 14 observation solutions. In present study, the flowrate of cooling air can vary in the range of 5.04 to 17.64 m3/s.
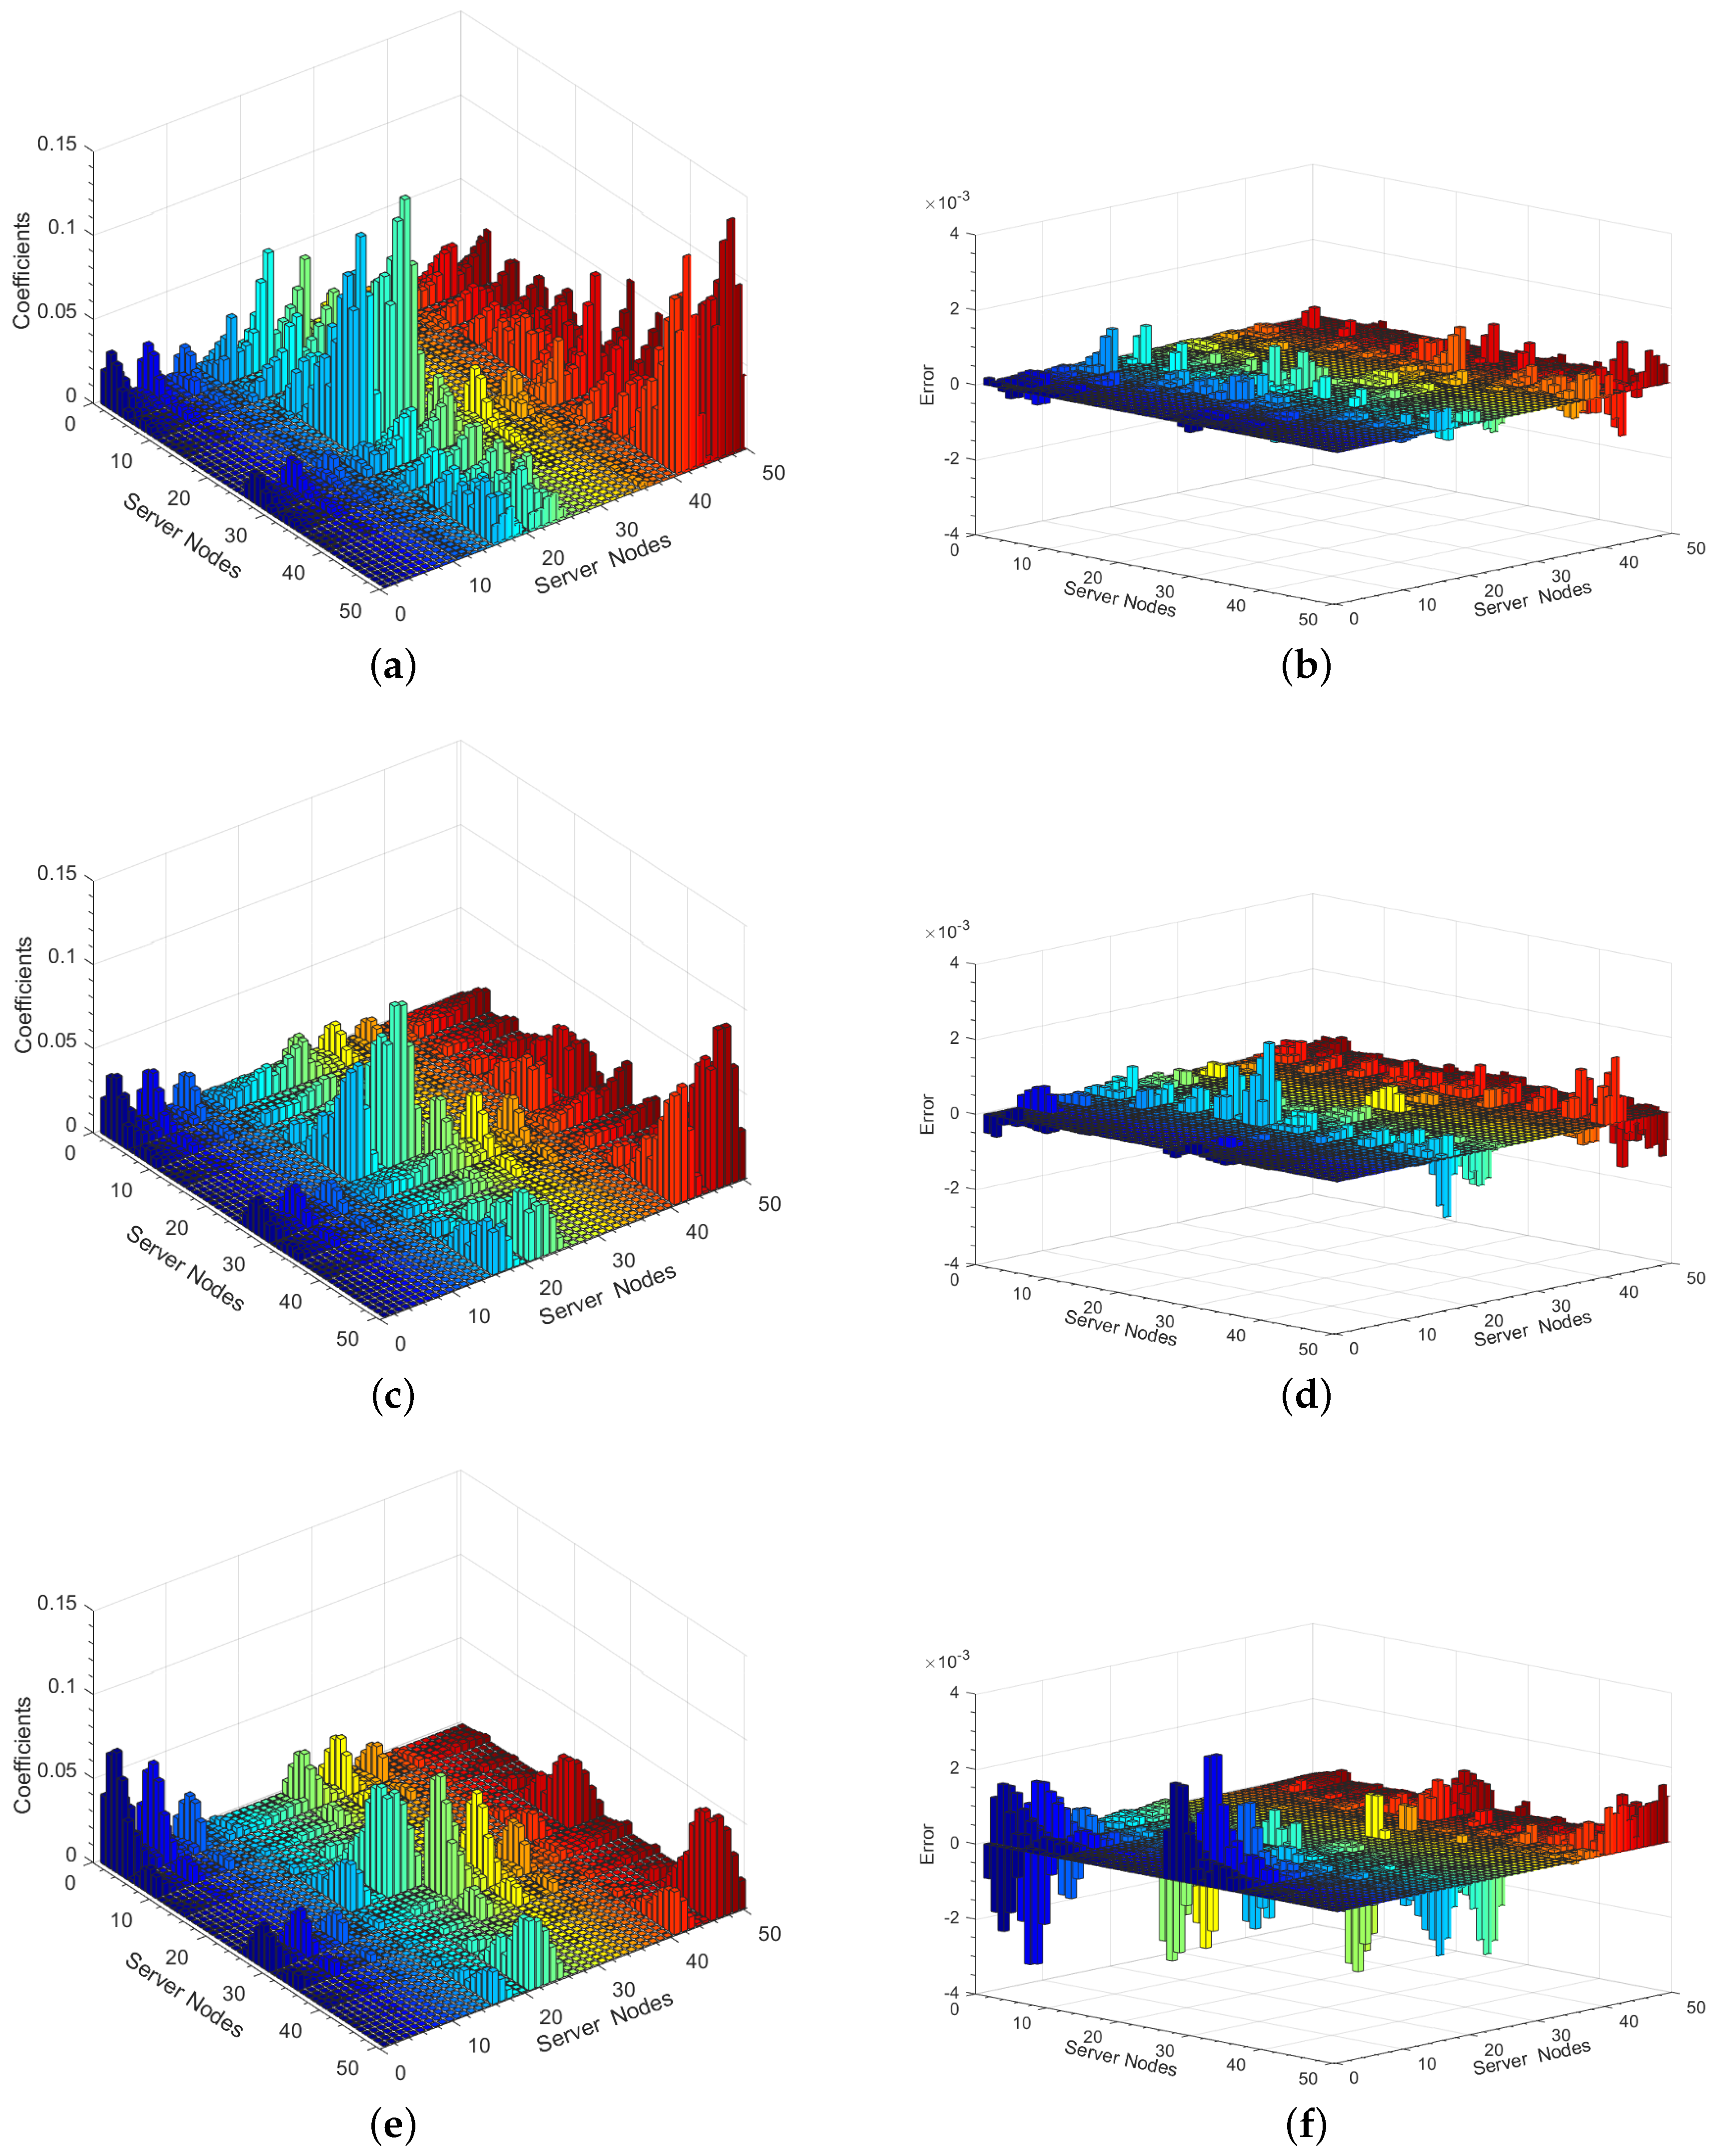
Figure 6 shows the POD reconstructions of the cross-interference matrix for data center under different cooling air supply, in addition, the corresponding reconstruction errors are also presented. We observe that the heat recirculation among server chassis significantly weakens with the increase of cooling air supply. This implies that increasing the supply of cooling air can improve the thermal environment in data center. As shown in Figure 6, comparing to the simulation results of the corresponding cases, the POD reconstruction errors of cross-interference coefficients are below 3.9 × 10⁻³.
In order to evaluate the accuracy of POD reconstruction, we compare the temperature distributions calculated using cross-interference matrices obtained by POD method and CFD simulation. Assuming the power consumption of server chassis is 4200 W and the temperature of cooling air is 15 °C, the inlet temperature distribution is calculated according to Equation (11). Table 3 shows the temperature errors between POD reconstructions and CFD simulations. For inlet temperature distribution of POD reconstruction, the maximum temperature error is 0.249 °C and the mean temperature error is below 0.037 °C. This implies that the cross-interference matrix obtained by POD reconstruction has an acceptable accuracy to describe the heat recirculation in data center.
It is noteworthy that the POD-based heat recirculation model does not just describe the thermal environment in homogeneous data center, but also describes the thermal environment in the heterogeneous data center, because the cross-interference coefficients depend only on the geometric layout and the air velocity field.
4.3. Comparison between Chip and Inlet Temperature-Aware Workload Allocation
In this section, we compare the performance of chip and inlet temperature-aware workload allocation strategies for the sample data center using different cooling systems: constant-flow (CF) and variable-flow (VF). The data center utilization rates in comparison study are 30%, 50%, 70% and 90%.
4.3.1. Case Study A: Constant-Flow Cooling System
For the data center using a constant-flow cooling system, we assume that the cooling air supply equals the demand of server chassis. In present study, the volume flowrate of cooling air is set as = 11.79 m3/s and the correspongding air velocity at CRAC outlet is 4.68 m/s.
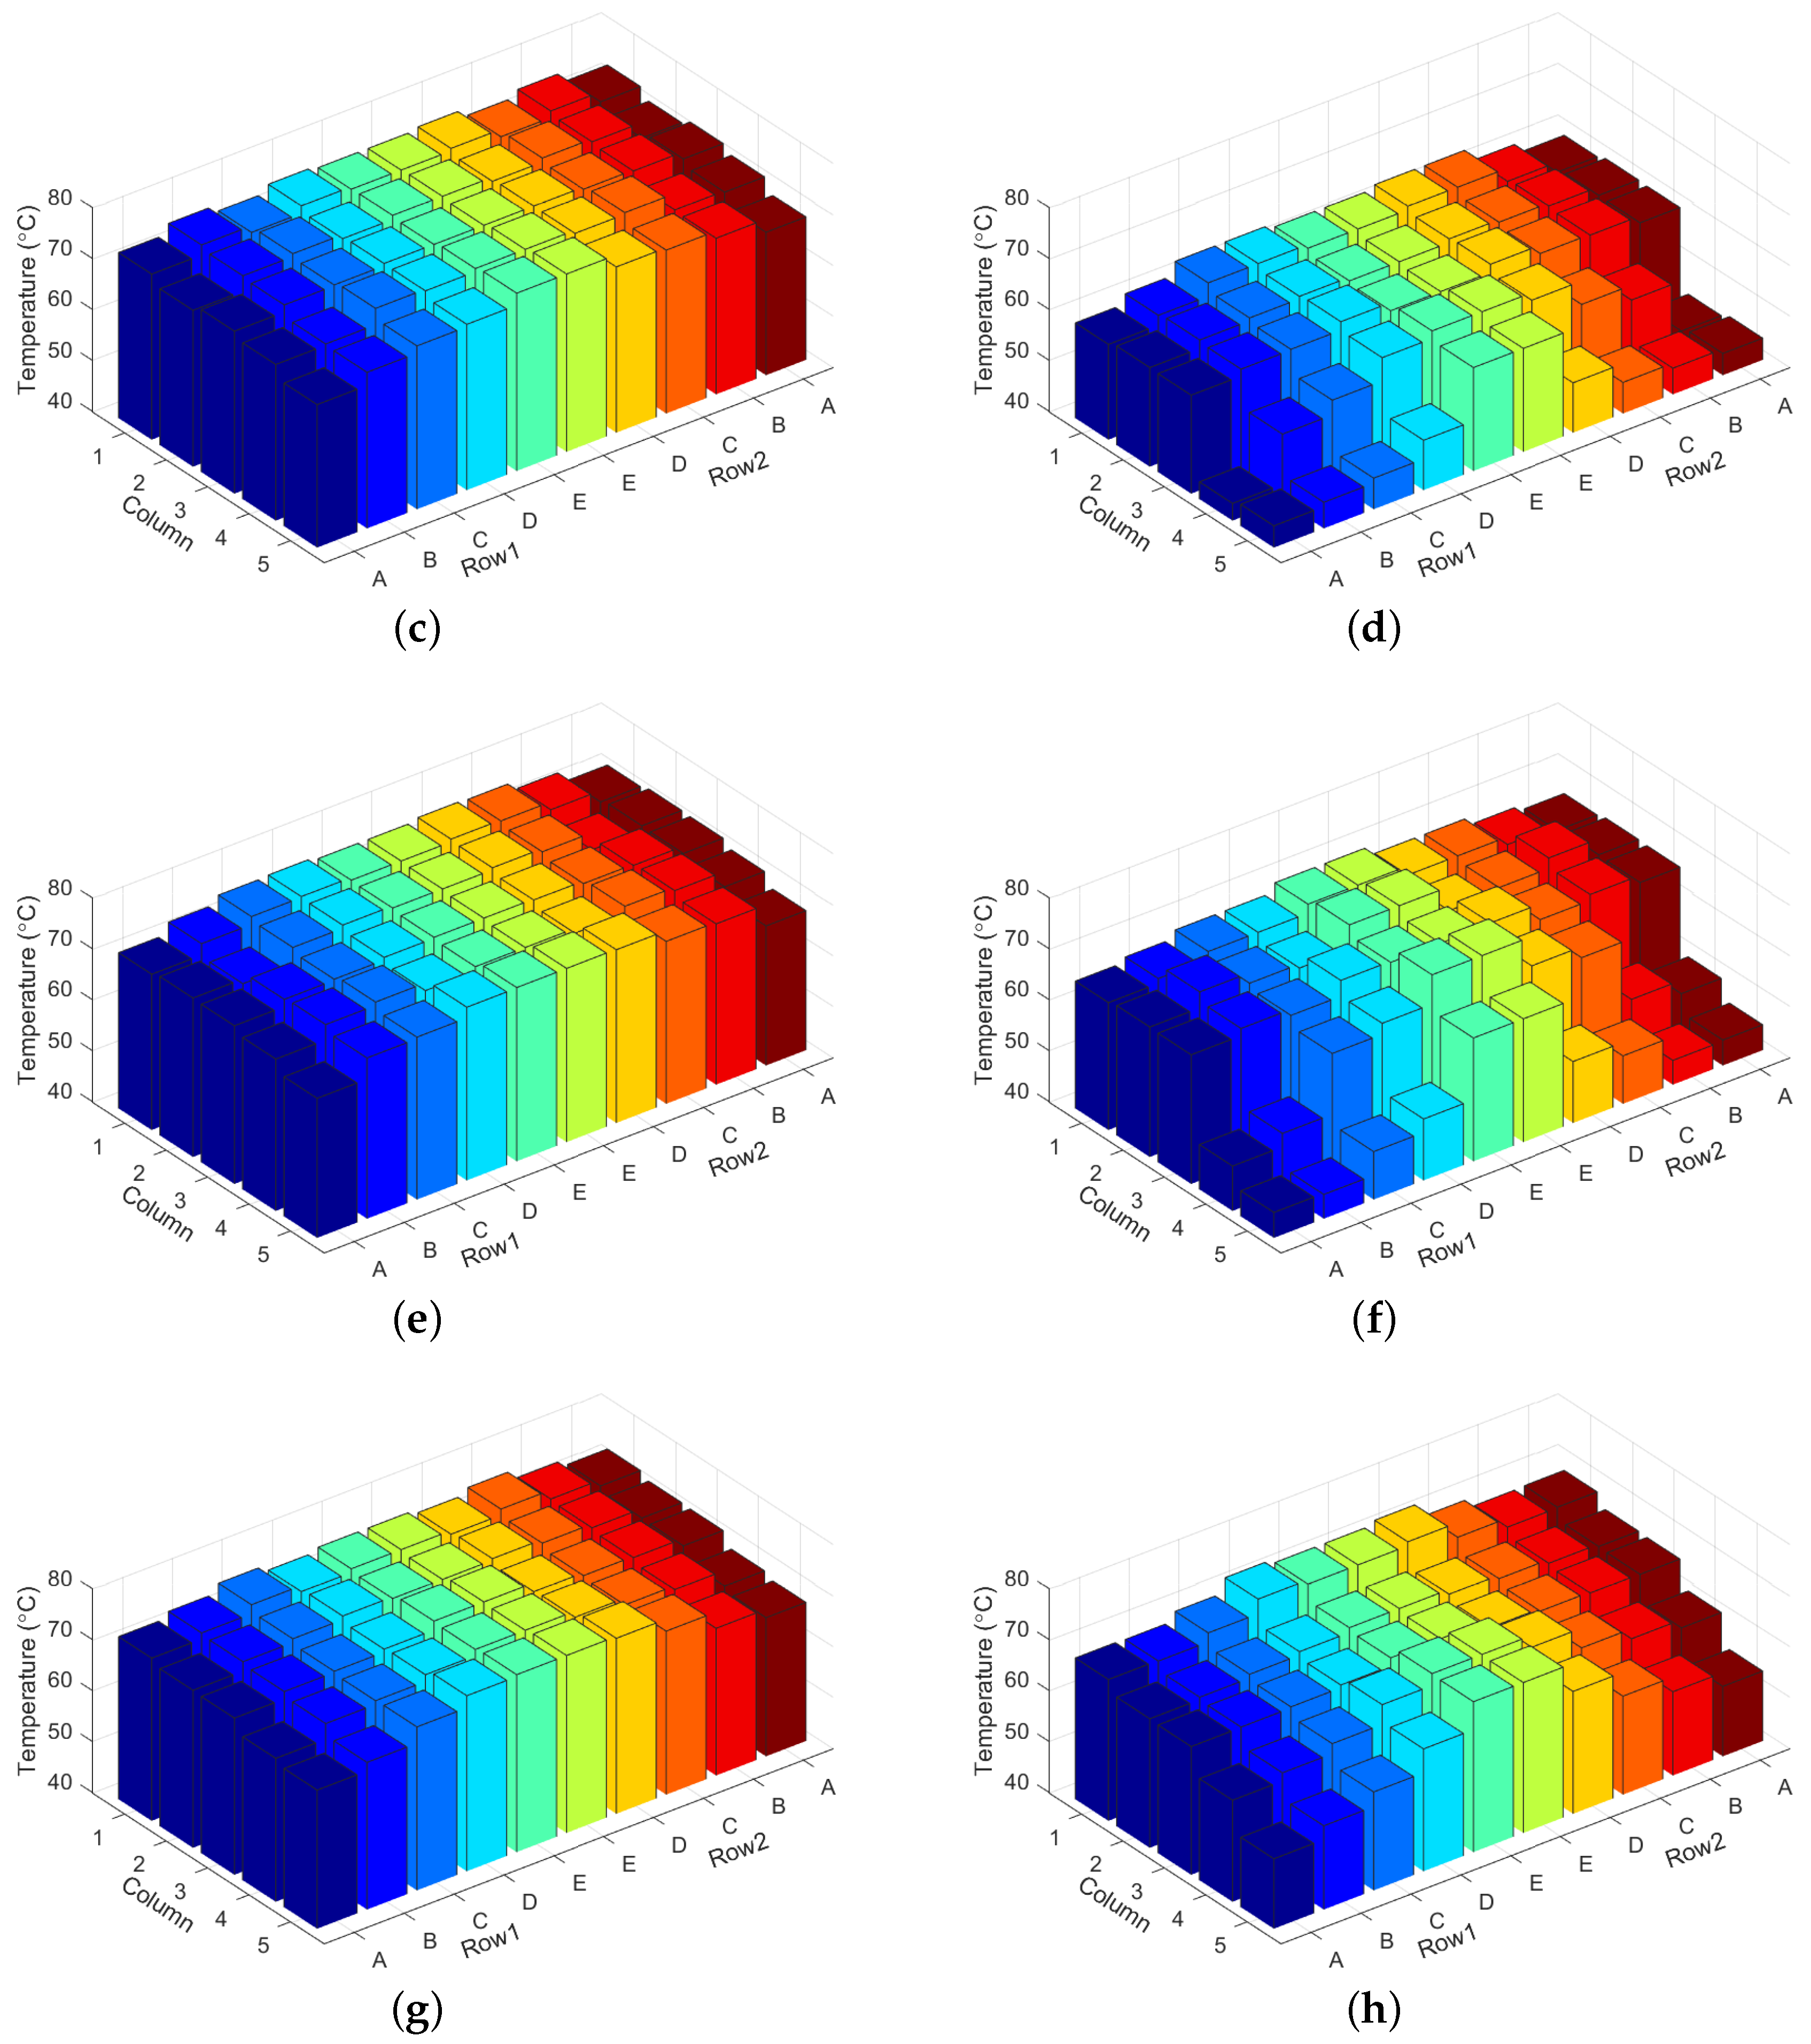
Figure 7 presents the chip temperature distributions achieved by different workload allocation strategies in data center under constant-flow cooling air supply. We observe that the chip temperature-aware workload allocation strategy achieves a nearly uniform chip temperature distribution in each case, and most of the temperatures are close to 75 °C. This implies that the chip temperature-aware method effectively prevents the servers from over-cooling. In contrast, the chip temperatures achieved by the inlet temperature-aware workload allocation strategy distribute over a large range, and many chip temperatures are far below the threshold ( = 75 °C), especially at the server chassis that contribute more to heat recirculation. This means that a portion of the cooling power is wasted on those servers with lower chip temperatures.
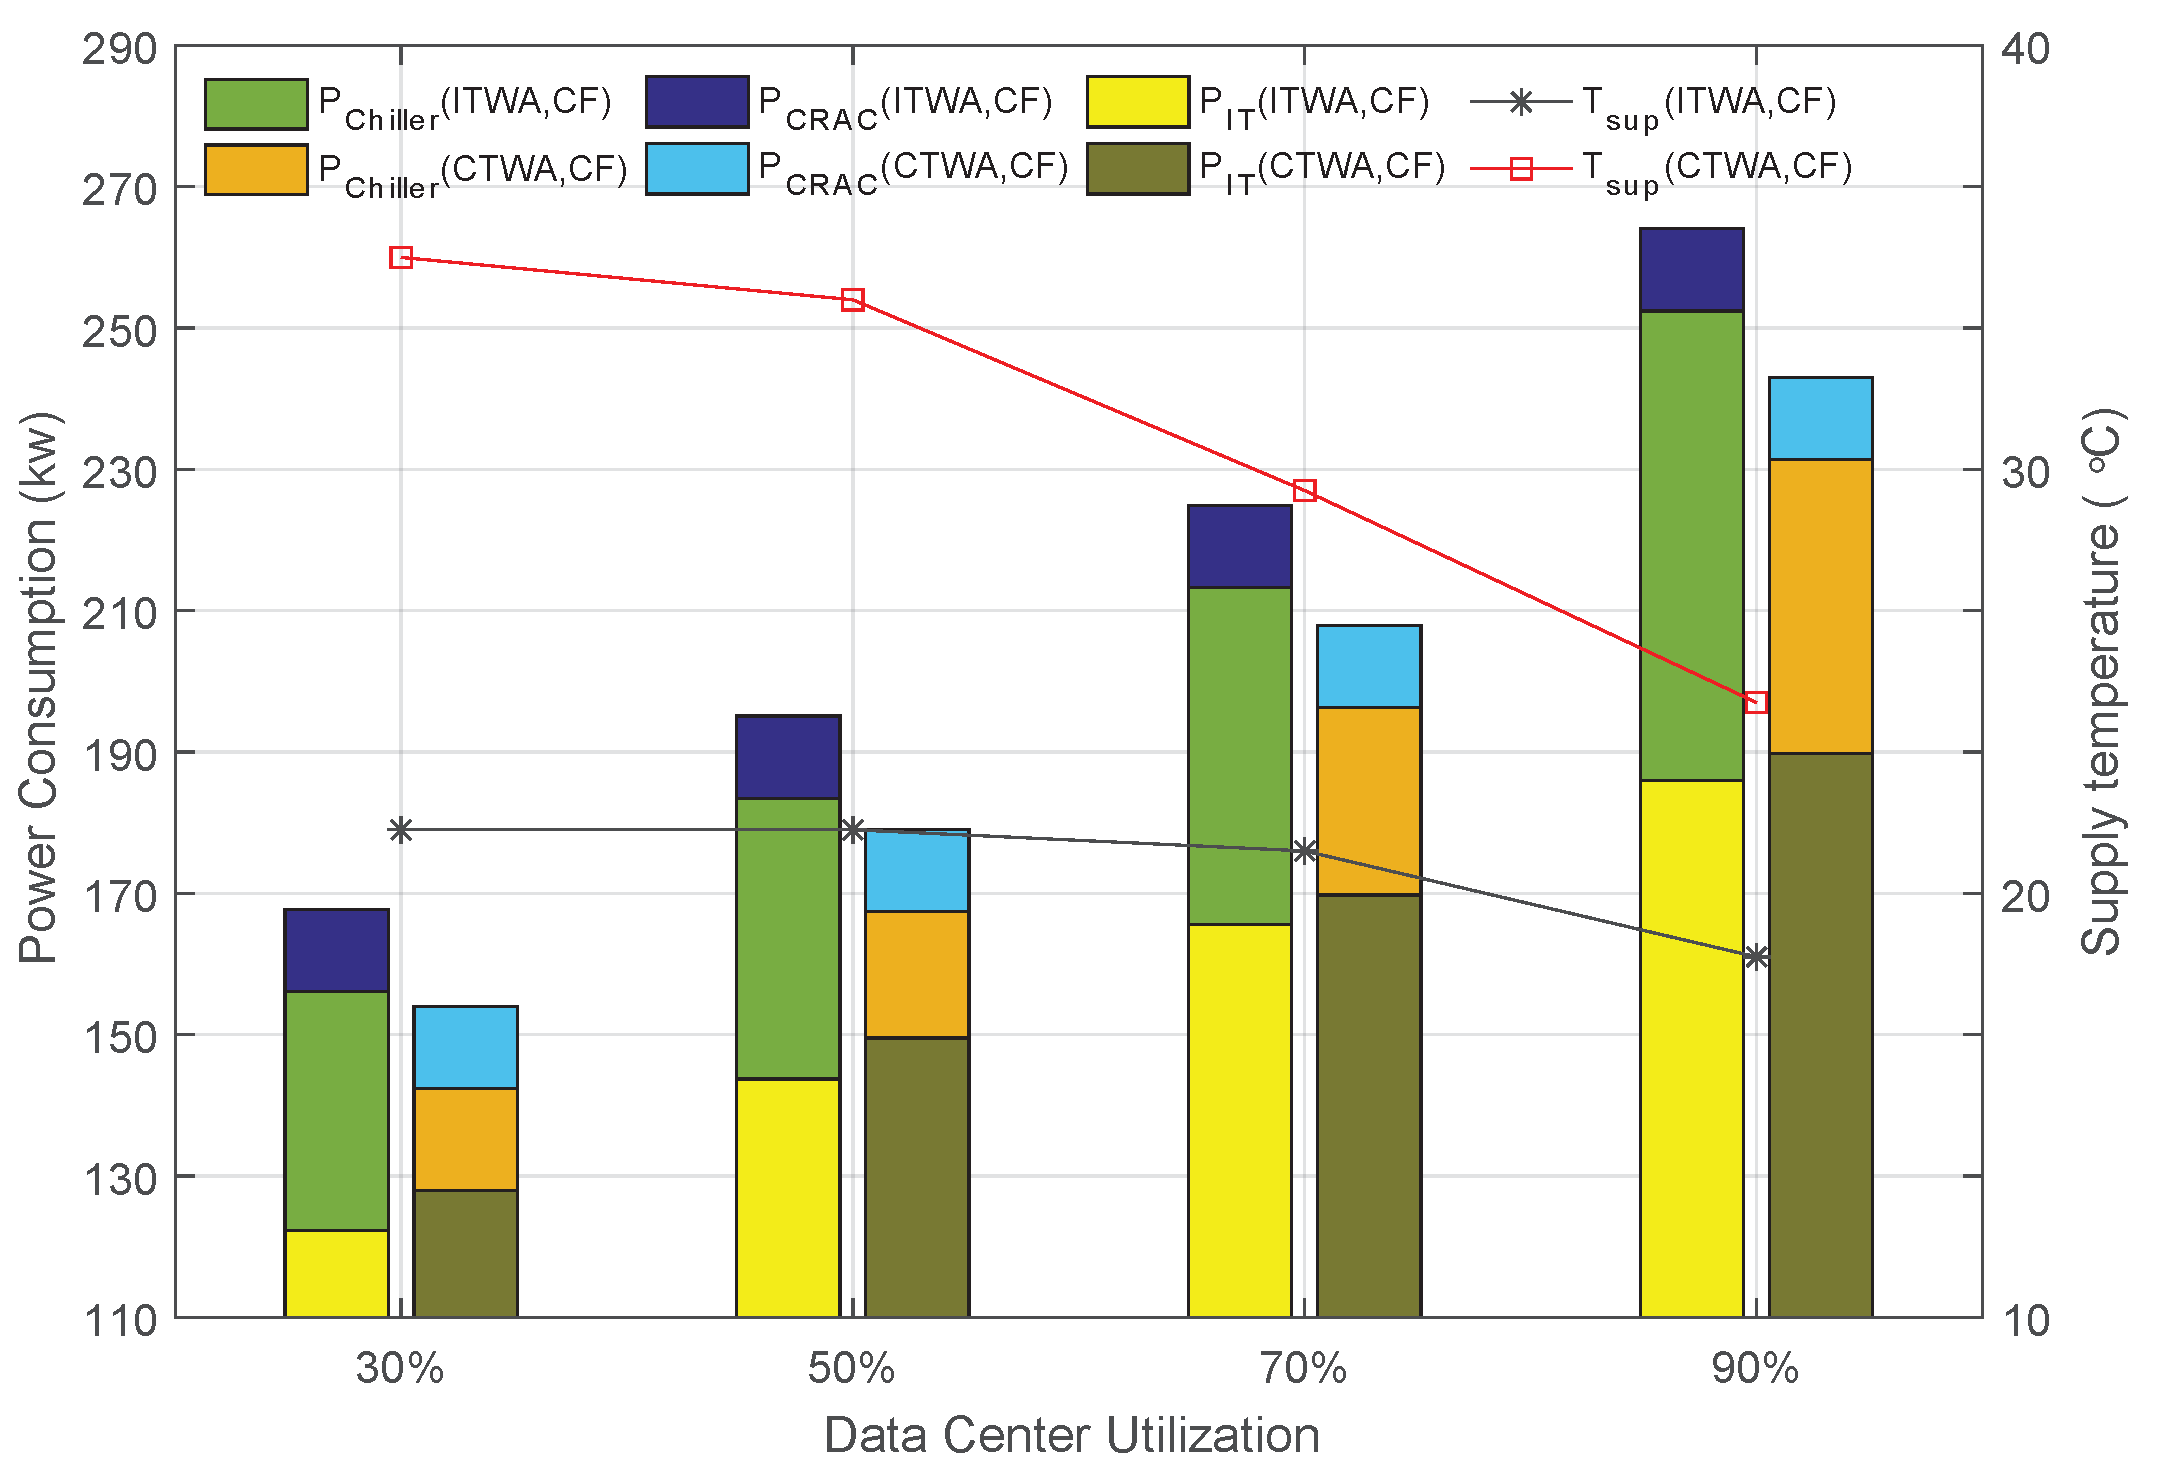
Figure 8 shows the power consumption of data center under constant-flow cooling air supply. In contrast with the inlet temperature-aware workload allocation strategy, we observe that the chip temperature-aware method achieves a lower holistic power consumption in data center since it allows a higher supply temperature of cooling air and achieves a significant reduction in chiller power for each case. Compared to the inlet temperature-aware method, although the temperature-dependent leakage power leads to higher IT equipment power for the cases using the chip temperature-aware method as shown in Figure 8, the chip temperature-aware workload allocation strategy still achieves energy saving since the reduction of cooling power.
4.3.2. Case Study B: Variable-Flow Cooling System
In this case study, the sample data center employs a variable-flow cooling system with the air flowrate of CRAC varying from 5.04 m3/s to 17.64 m3/s. As described in Section 3.3, the power consumption of CRAC is a cubic function of the volume flowrate.
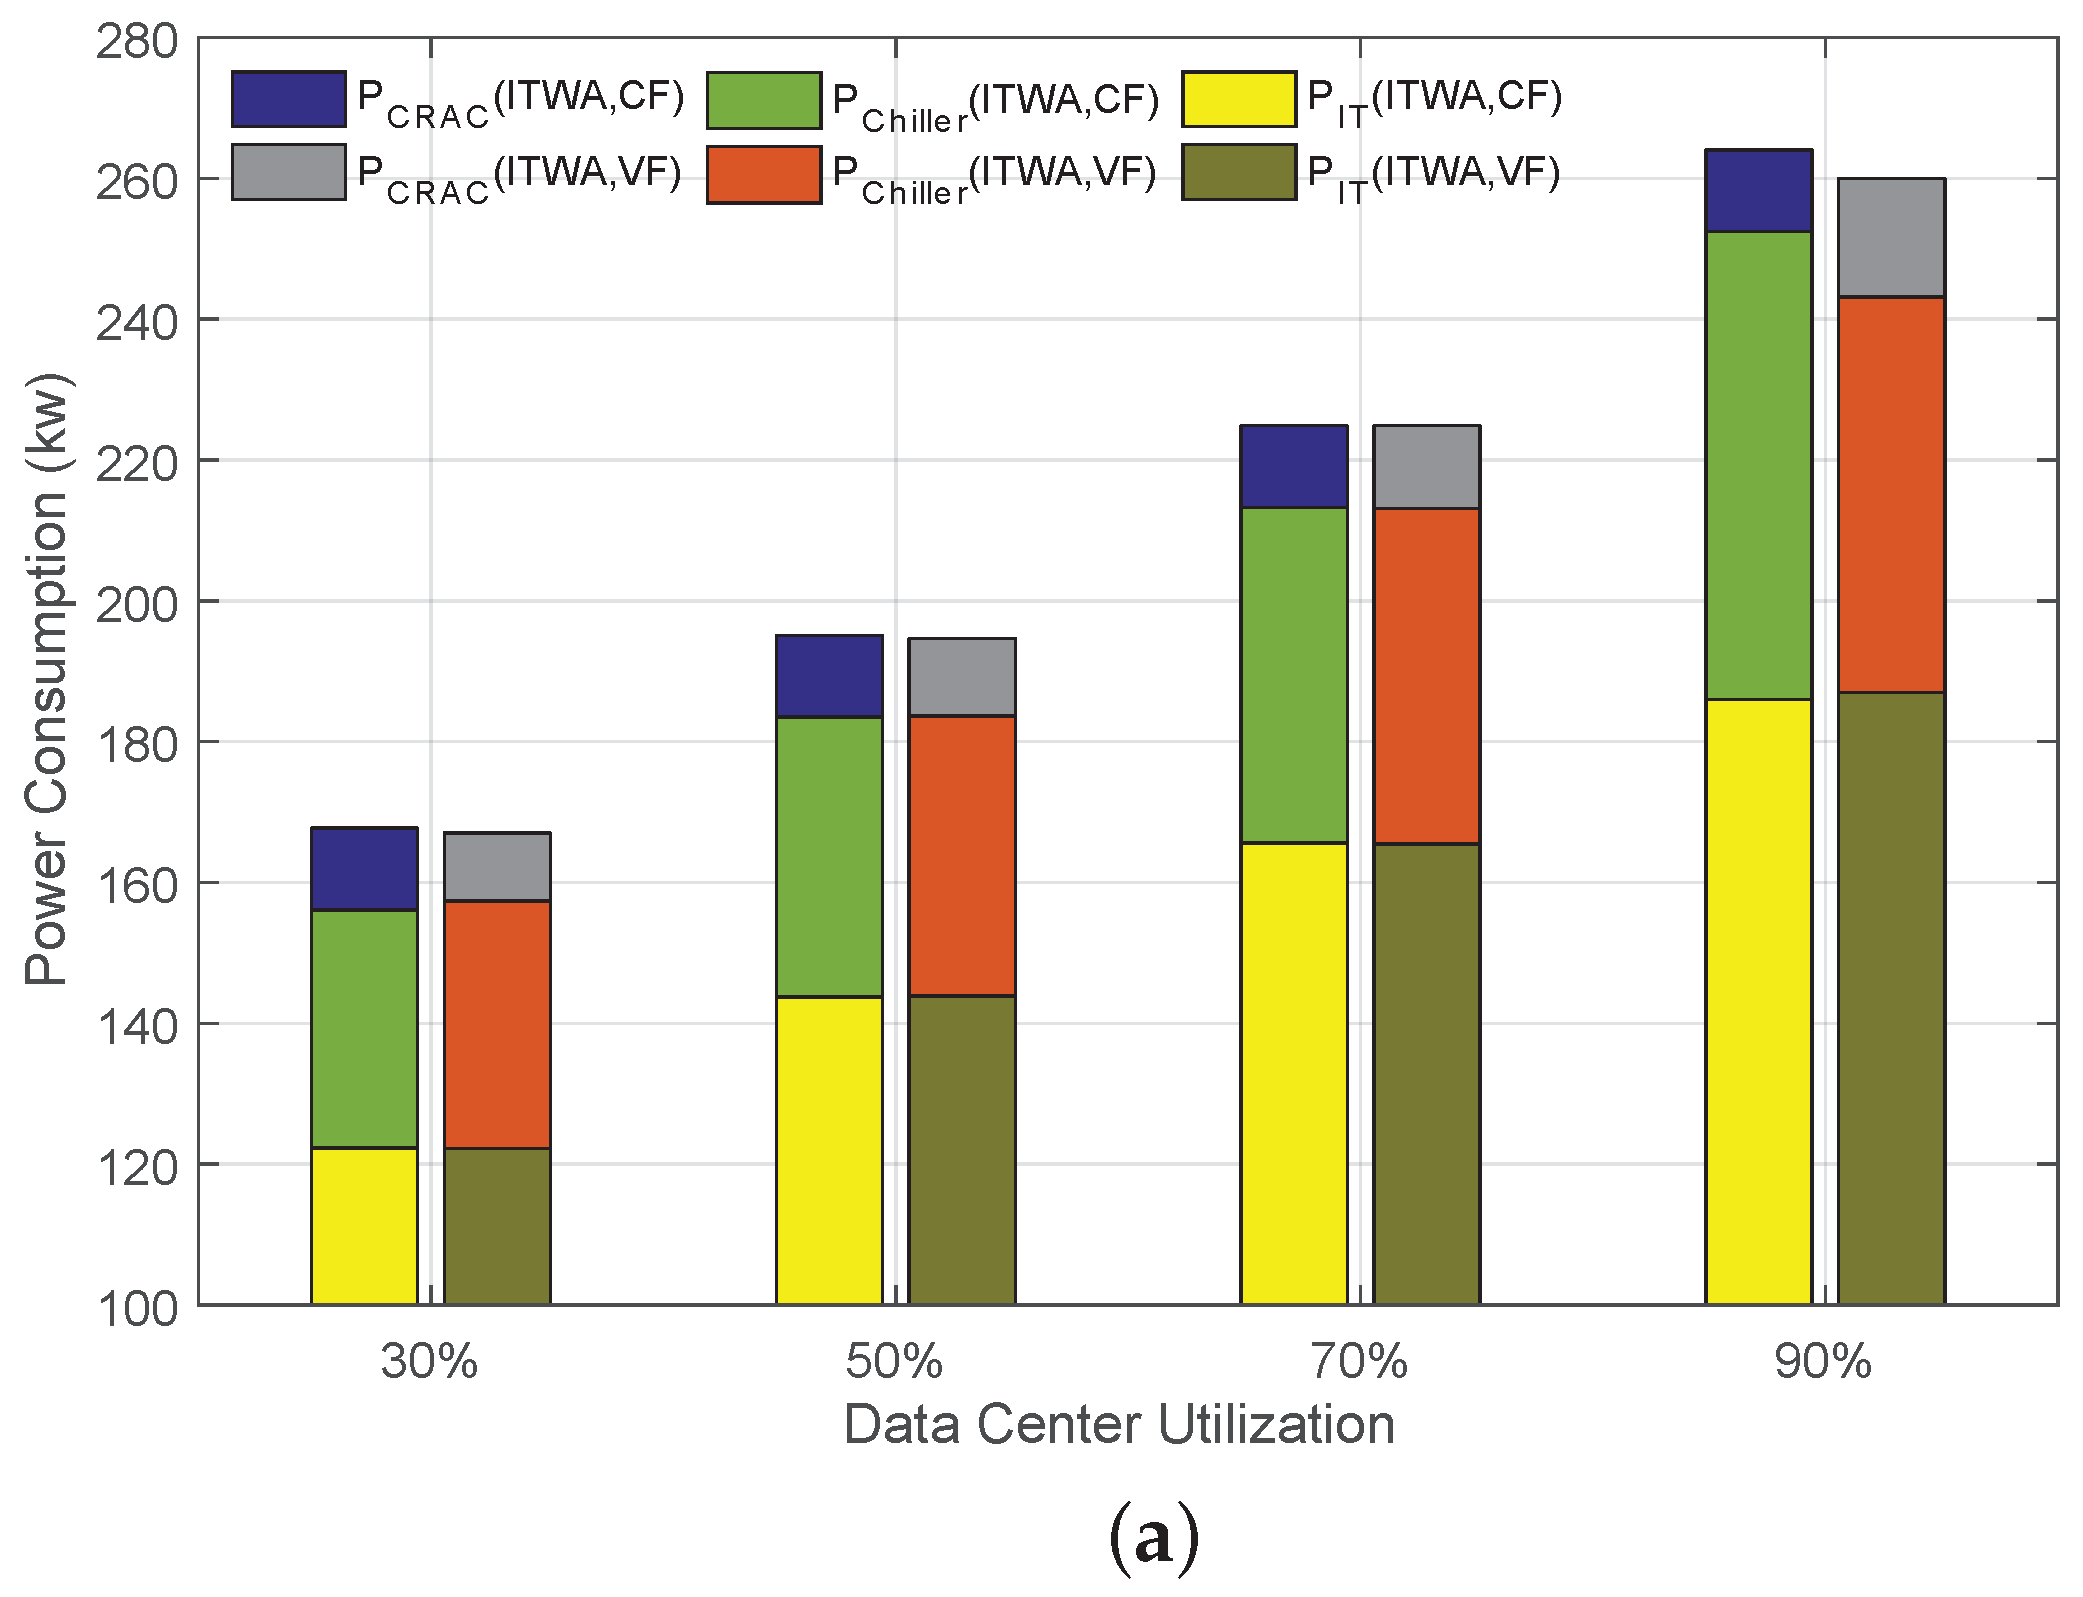
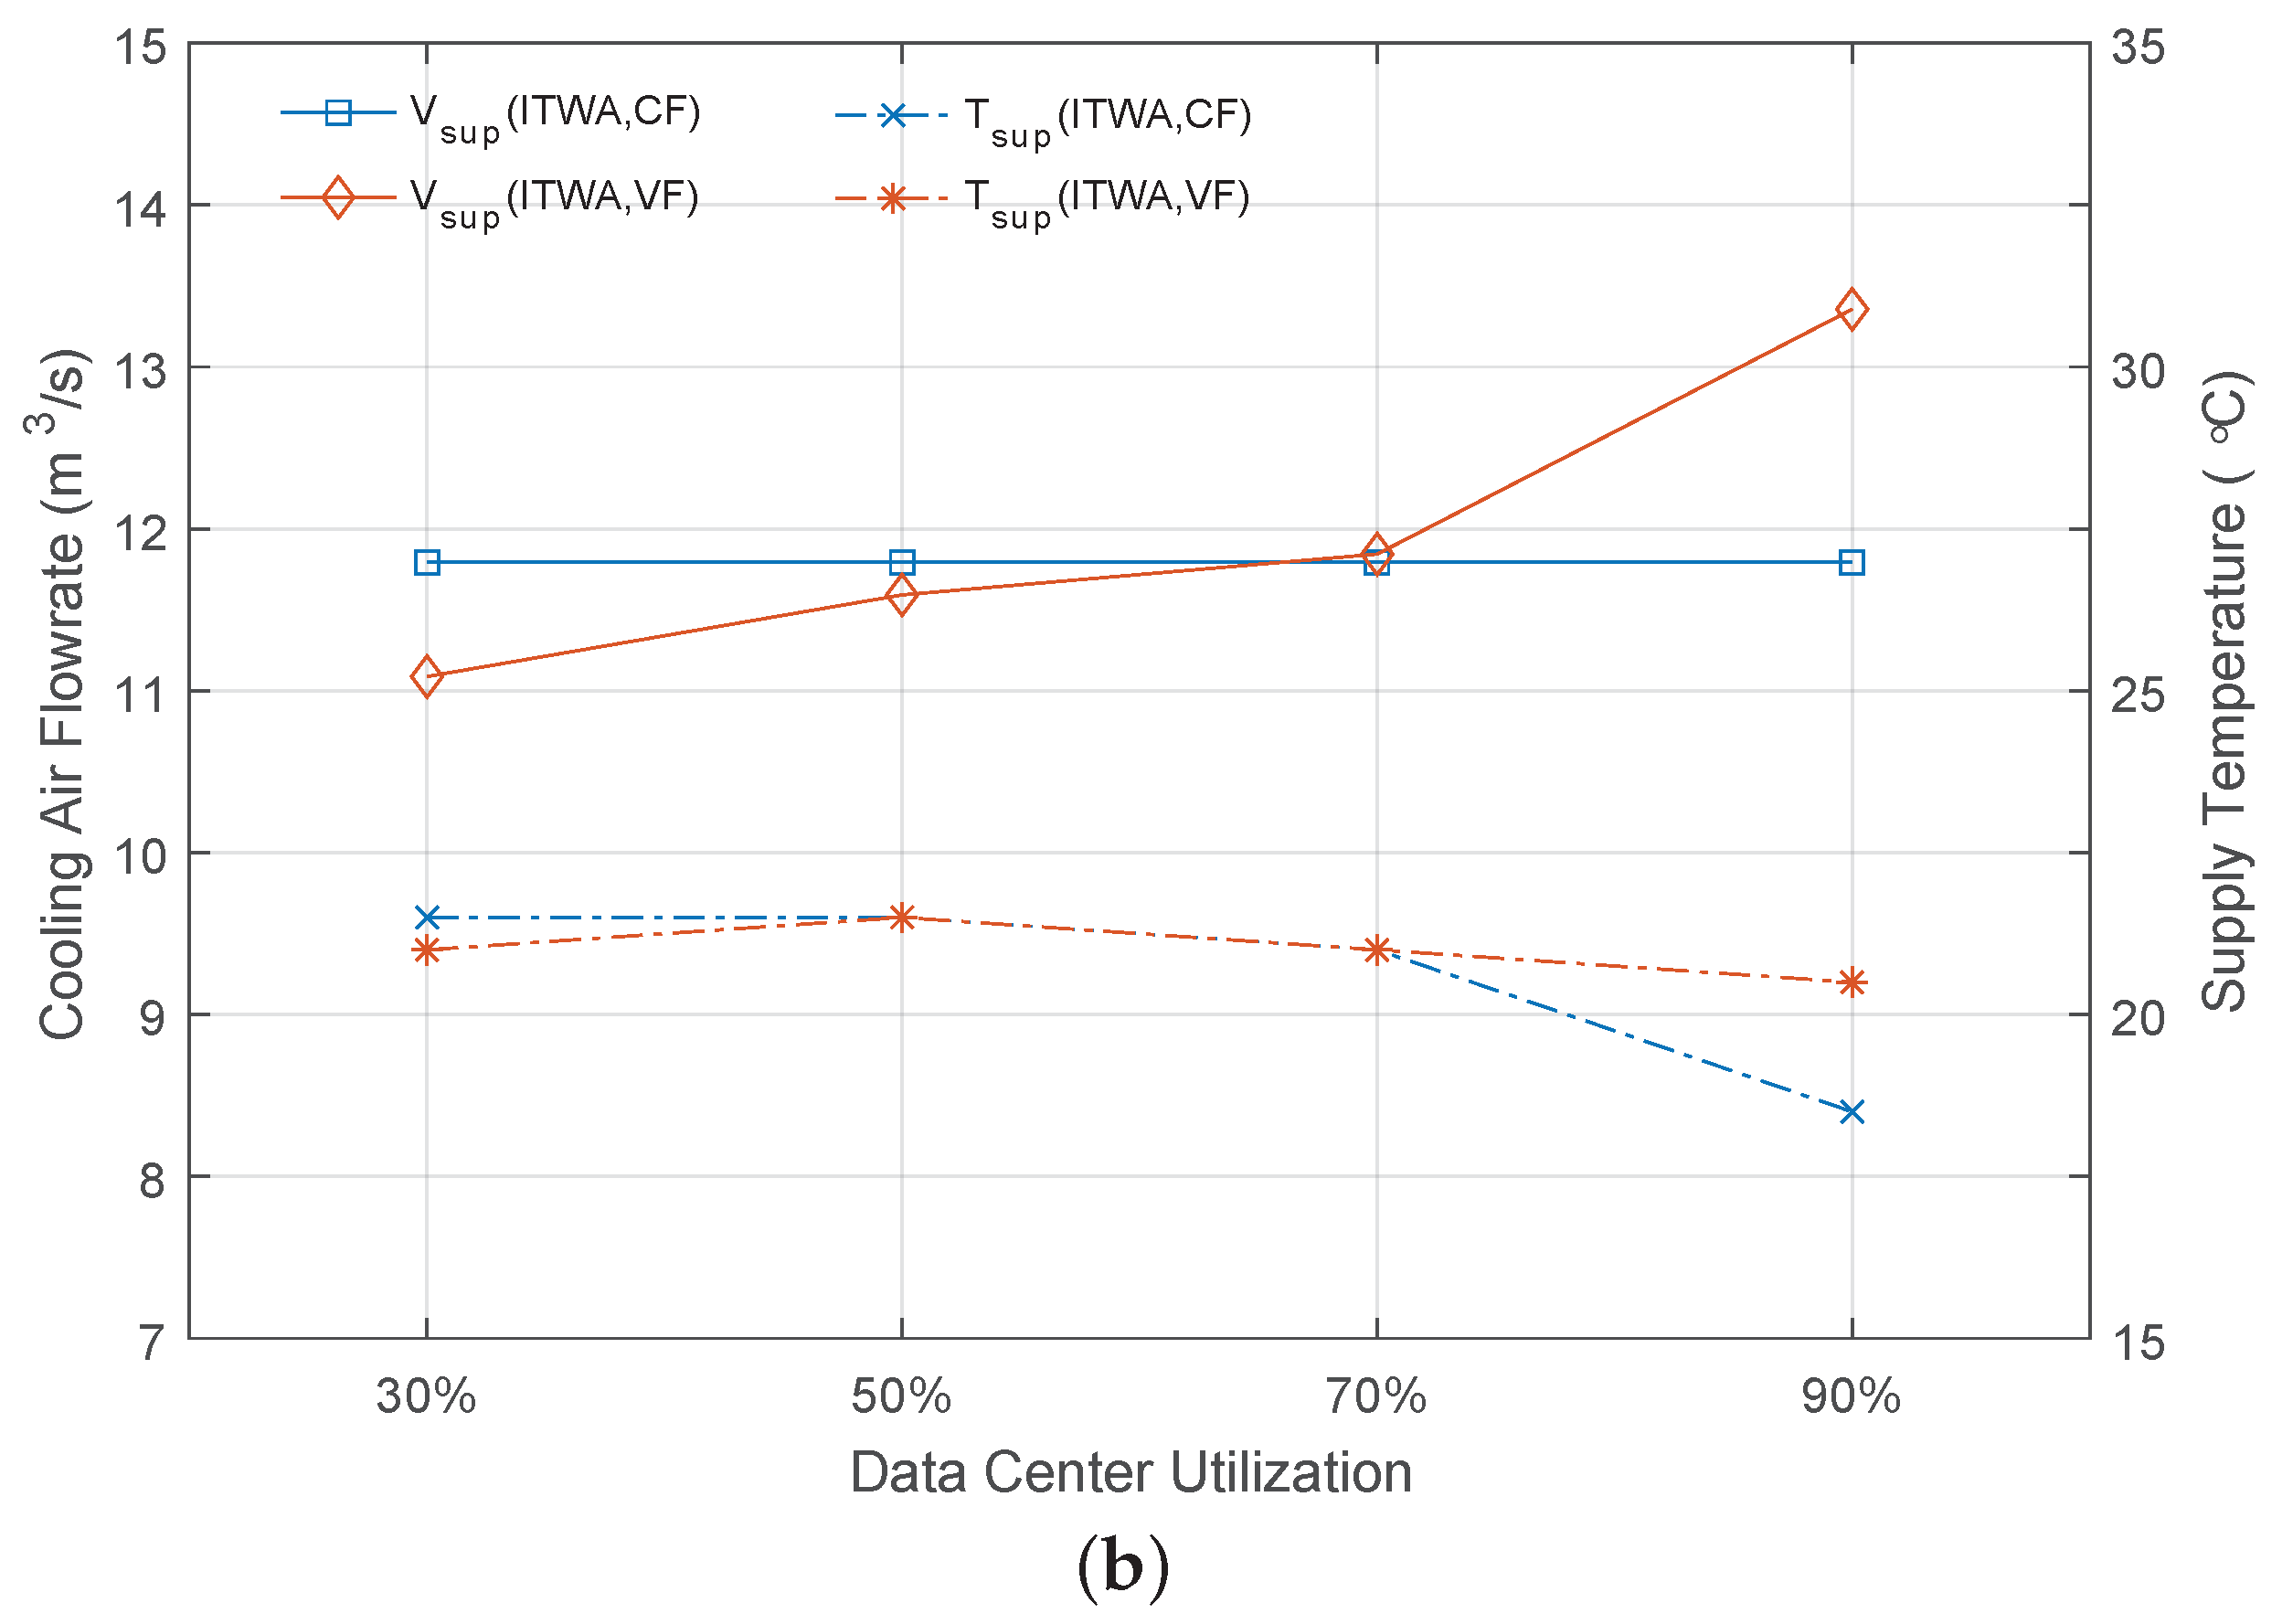
Figure 9 shows the power consumption and cooling parameters of data center achieved by the inlet temperature-aware workload allocation strategy. Compared to the power consumption of data center under constant-flow cooling air supply, the inlet temperature-aware workload allocation strategy achieves a negligible reduction in the holistic power consumption of data center by changing the supply volume of cooling air, except for the case with 90% data center utilization. At 90% utilization, the heat recirculation is weakened since the increase of cooling air supply. Therefore, the supply temperature is allowed to increase from 18.5 °C to 20.5 °C. Despite the increase of cooling air supply requires a higher CRAC power, the reduction of chiller power still leads to lower holistic power consumption in data center. At 30% utilization, although the cooling system reduces the supply of cooling air and achieves a reduction in CRAC power, as shown in Figure 9b, the power saving in data center is negligible since there is an almost equal increase in cooler power.
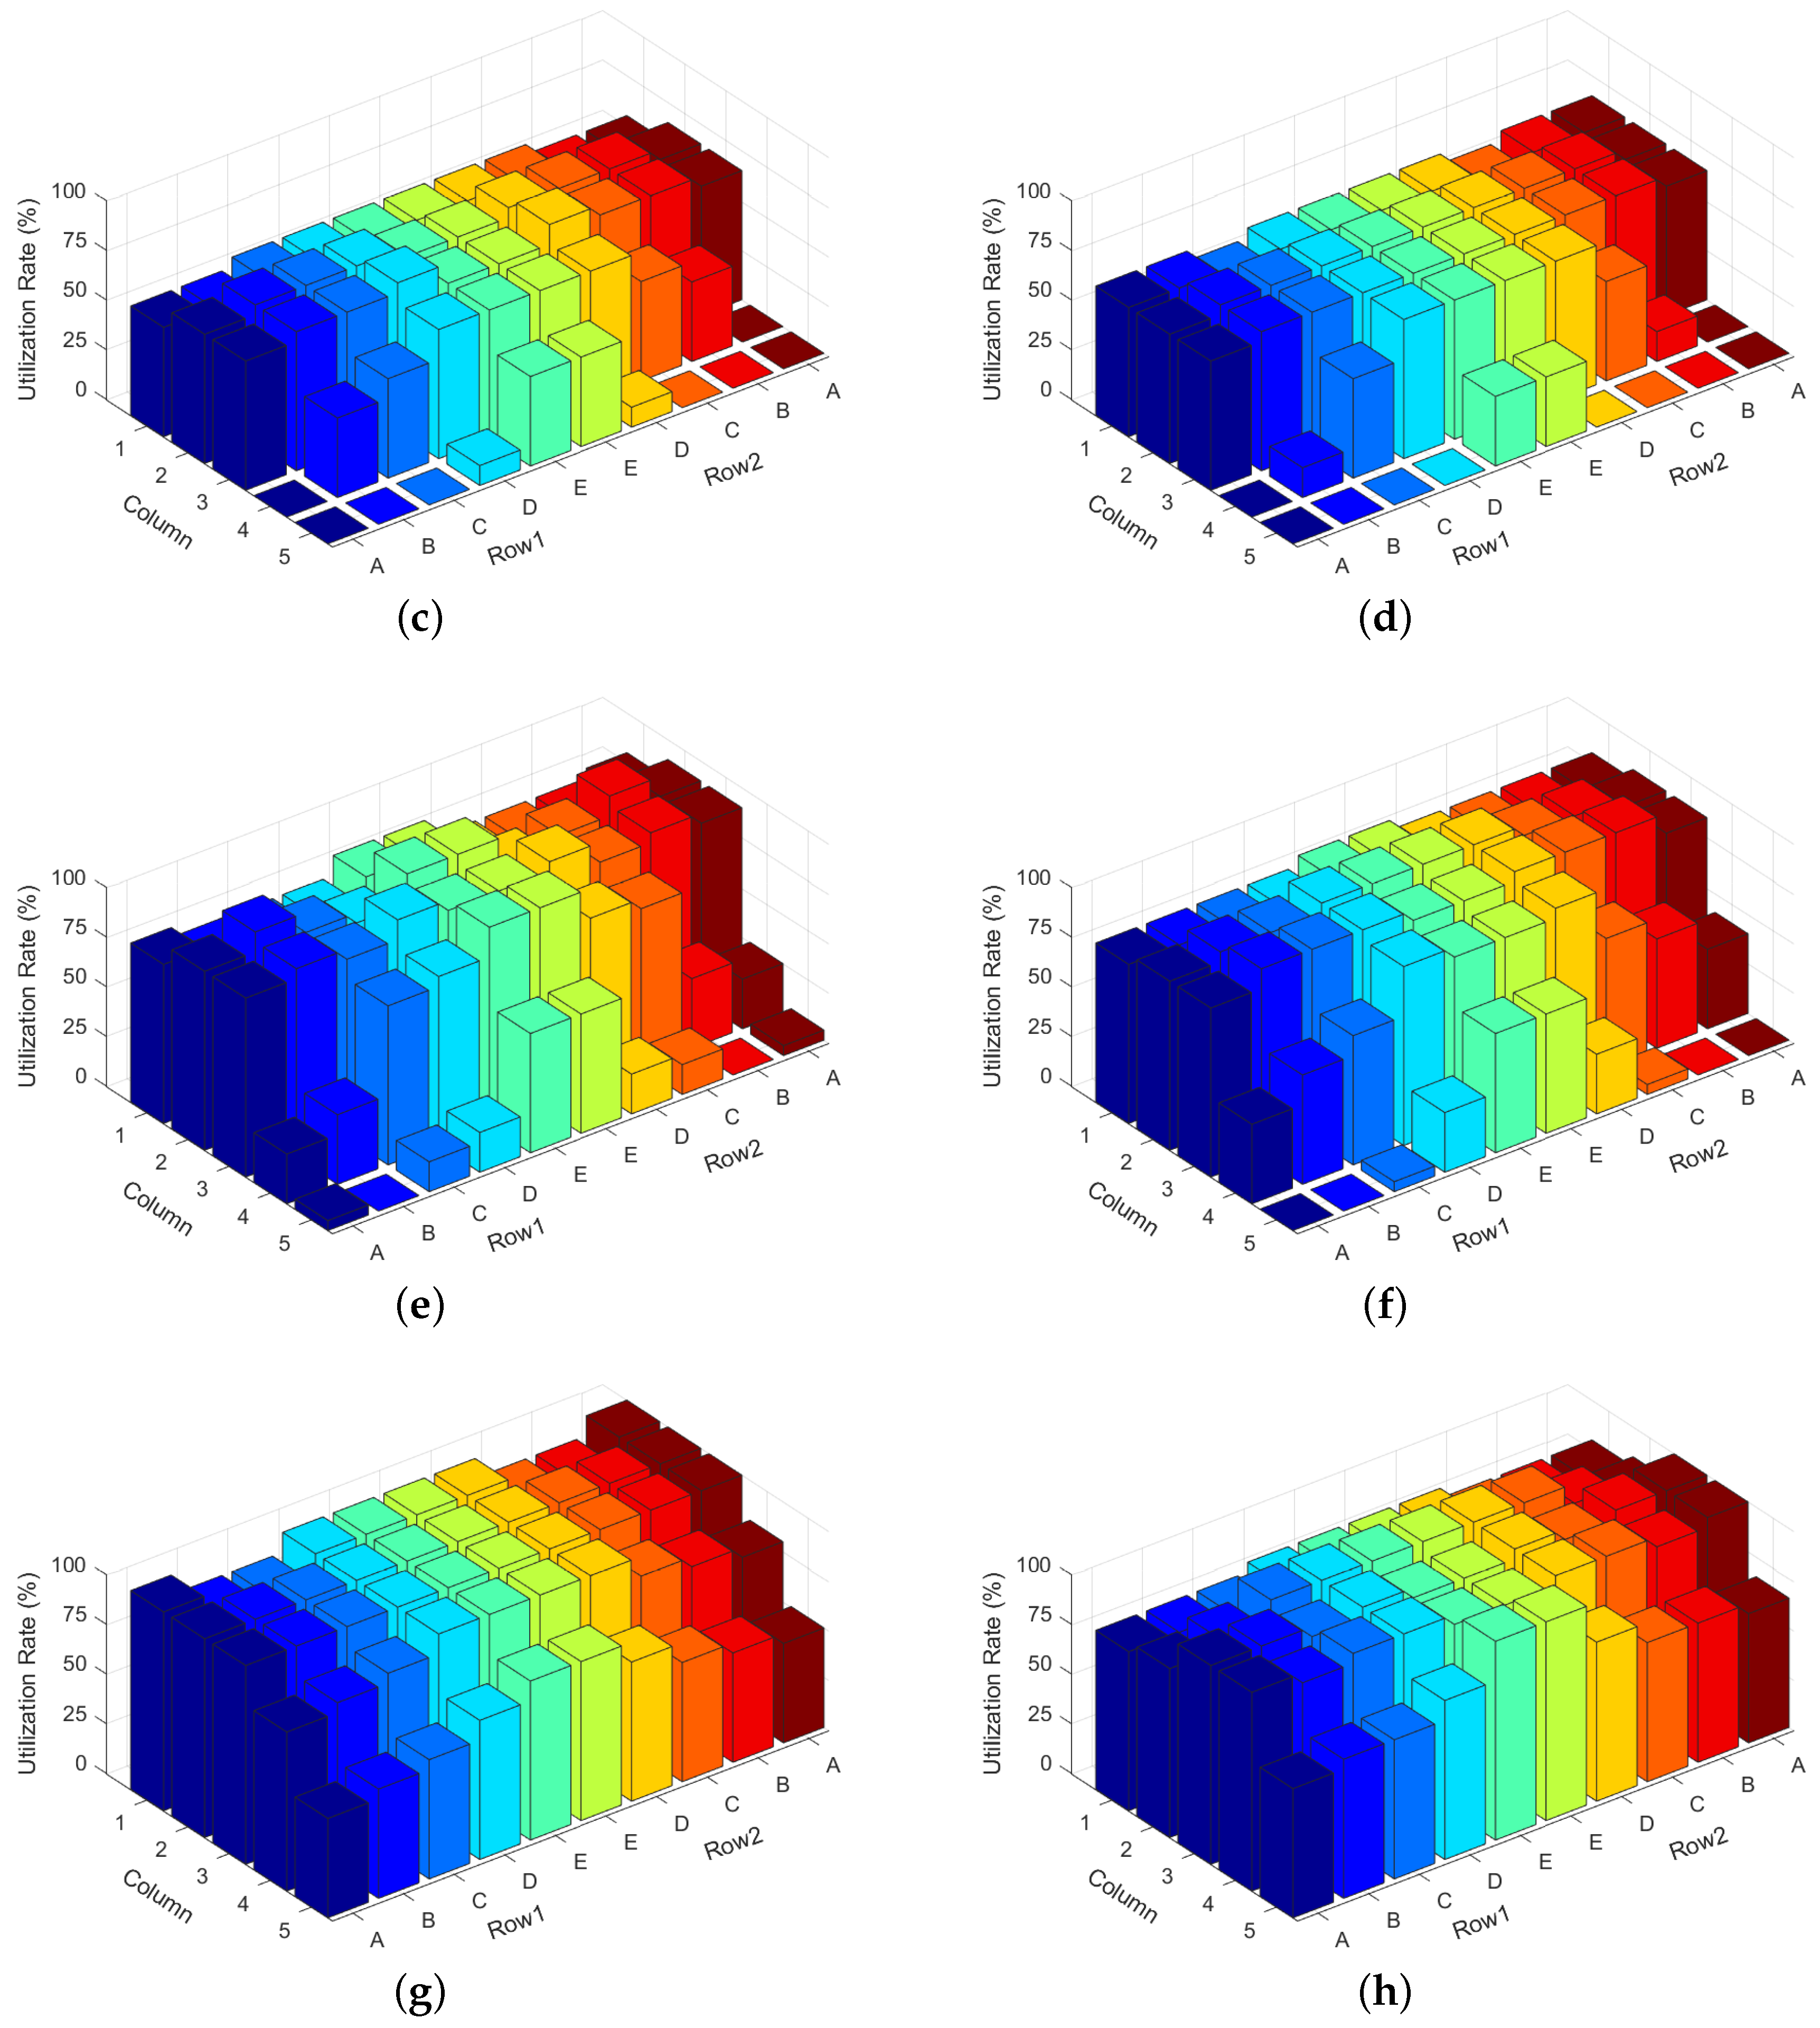
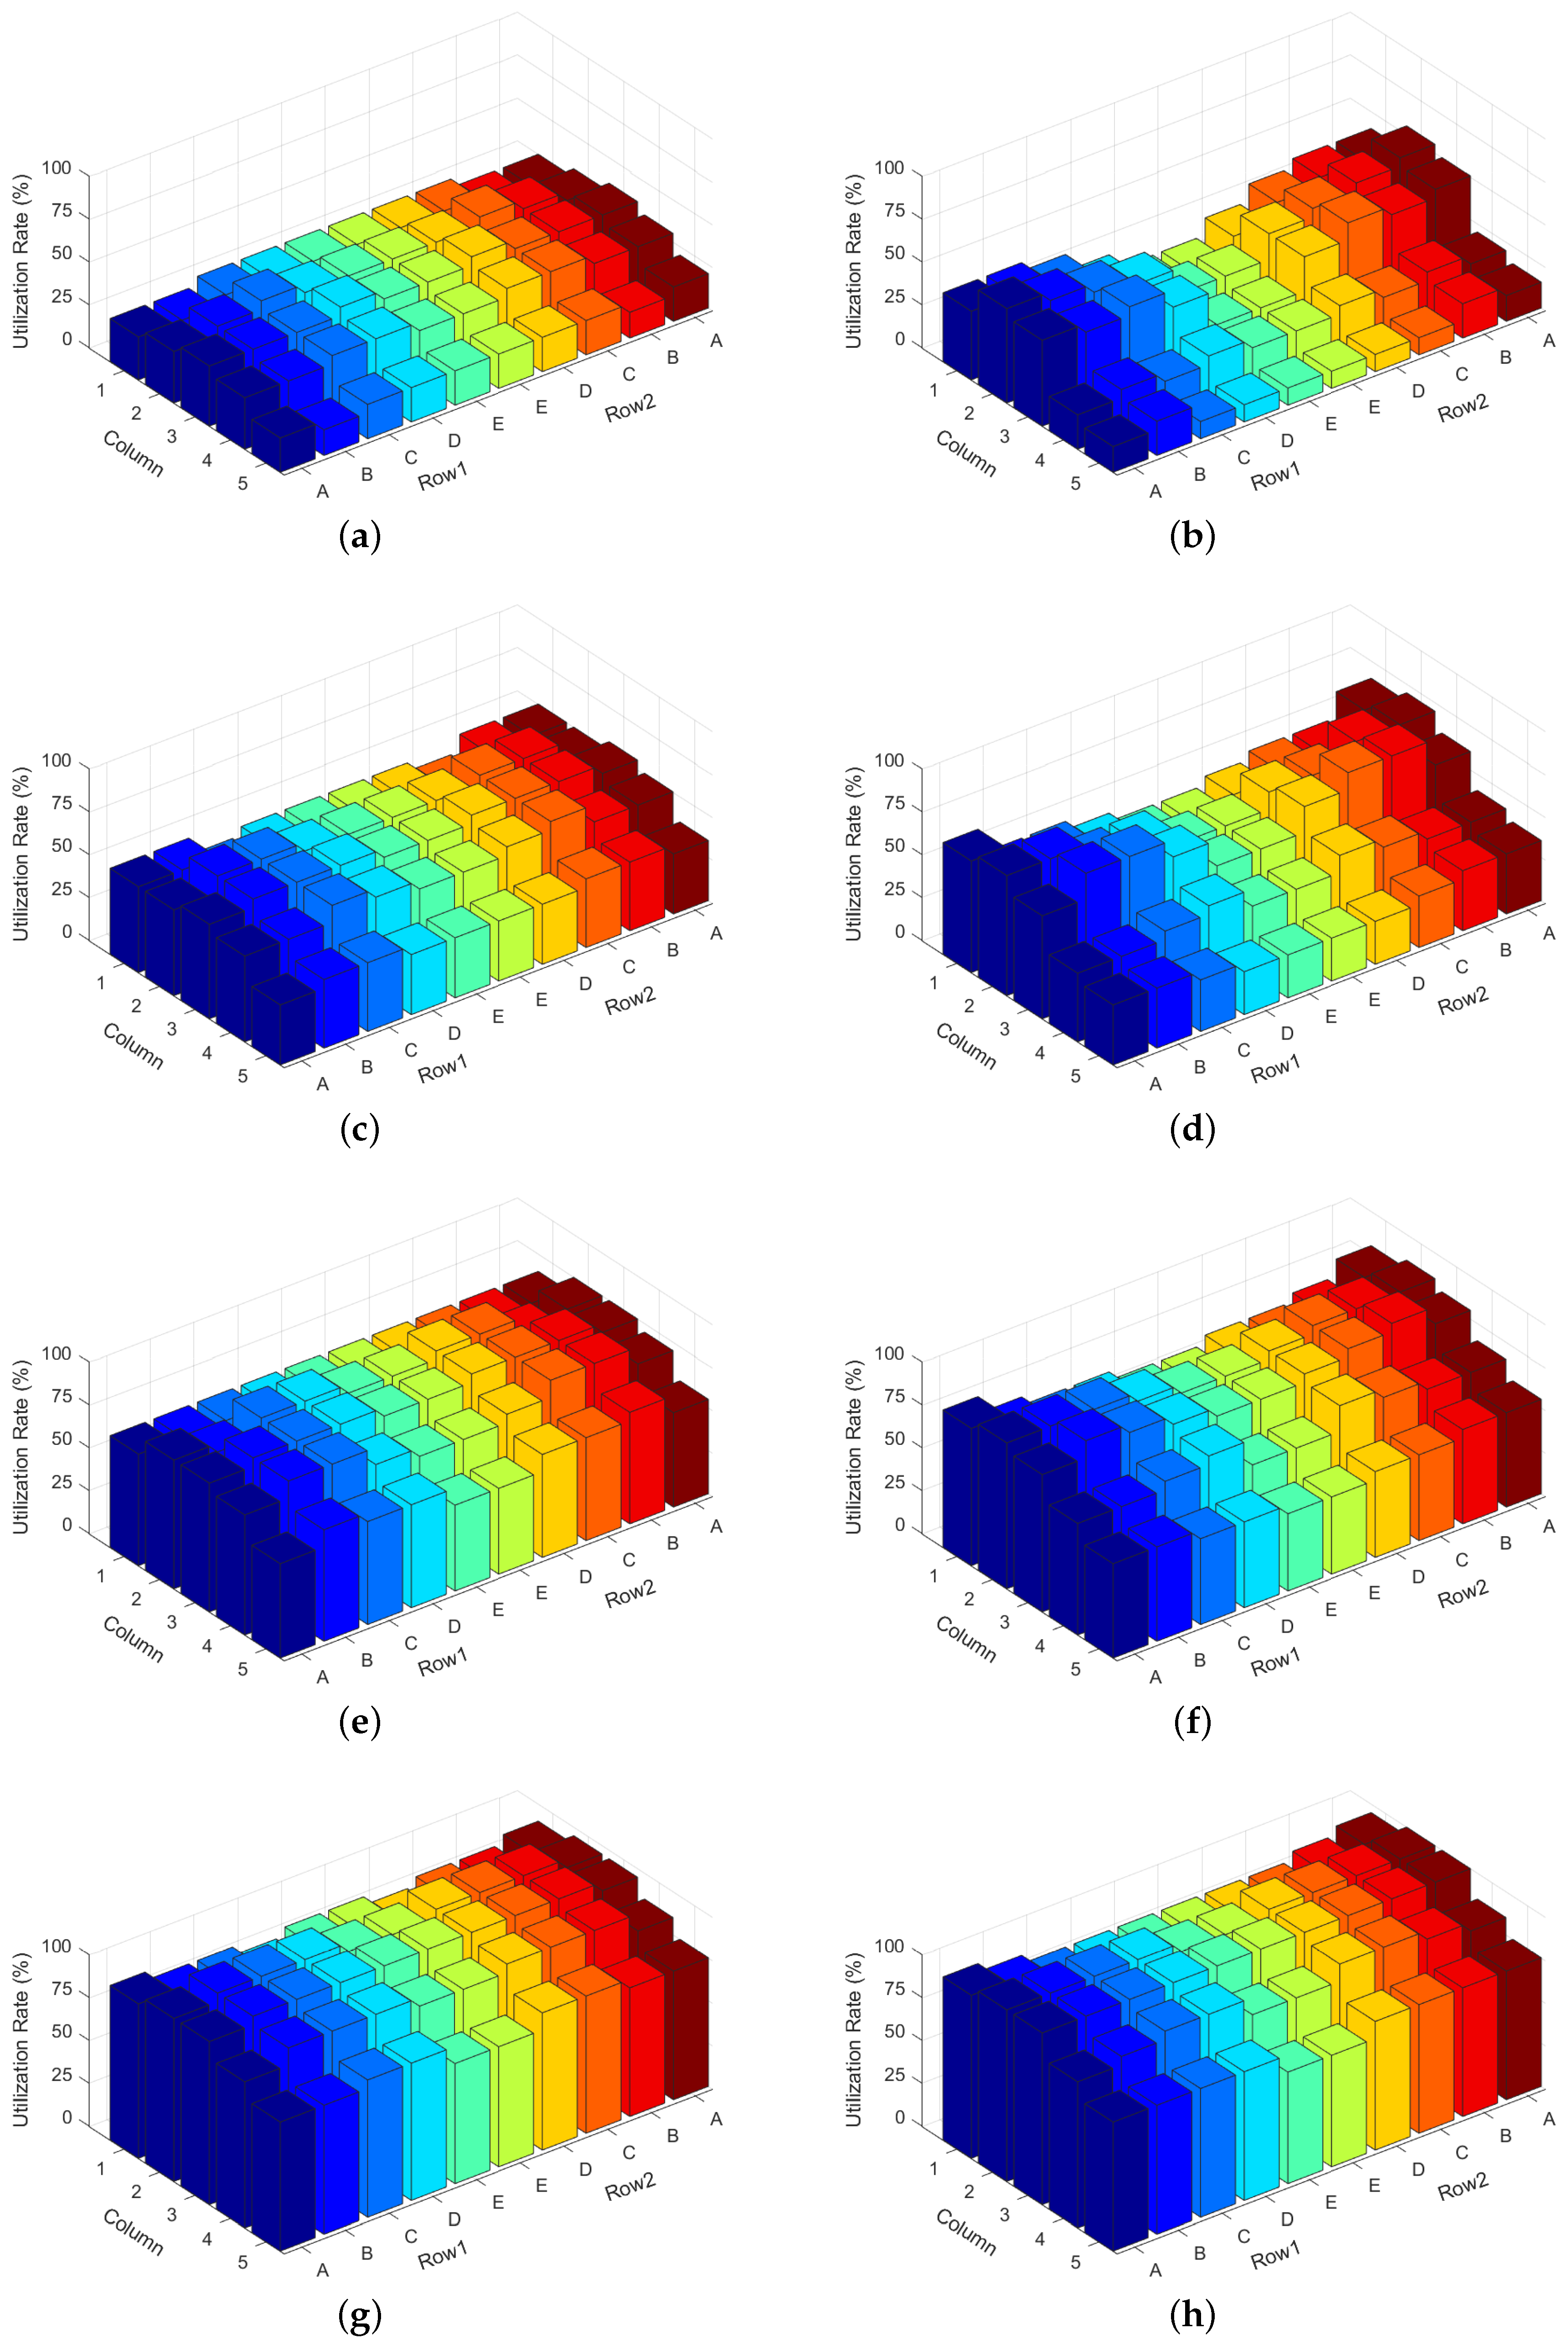
Figure 10 presents the workload distribution achieved by the inlet temperature-aware workload allocation strategy. Comparing the cases of constant-flow and variable-flow cooling air supply, we observe that the inlet temperature-aware workload distribution strategy tends to adjust workloads on servers that contribute more to heat recirculation. For the cases with 30% and 50% utilizations as shown in Figure 10a–d, the workload distributions under variable-flow cooling supply reduce workload from the lower positions of columns 4 and 5 since the decrease of cooling air supply enhances the contribution of heat recirculation at these locations. For the workload distributions of 90% utilization as shown in Figure 10g,h, since the increase of cooling air supply weakens the heat recirculation in data center, we observe that the workload distribution under variable-flow cooling supply assigns more workloads to columns 4 and 5. Meanwhile, the servers located in column 1 are assigned less workload due to the increase of supply temperature.
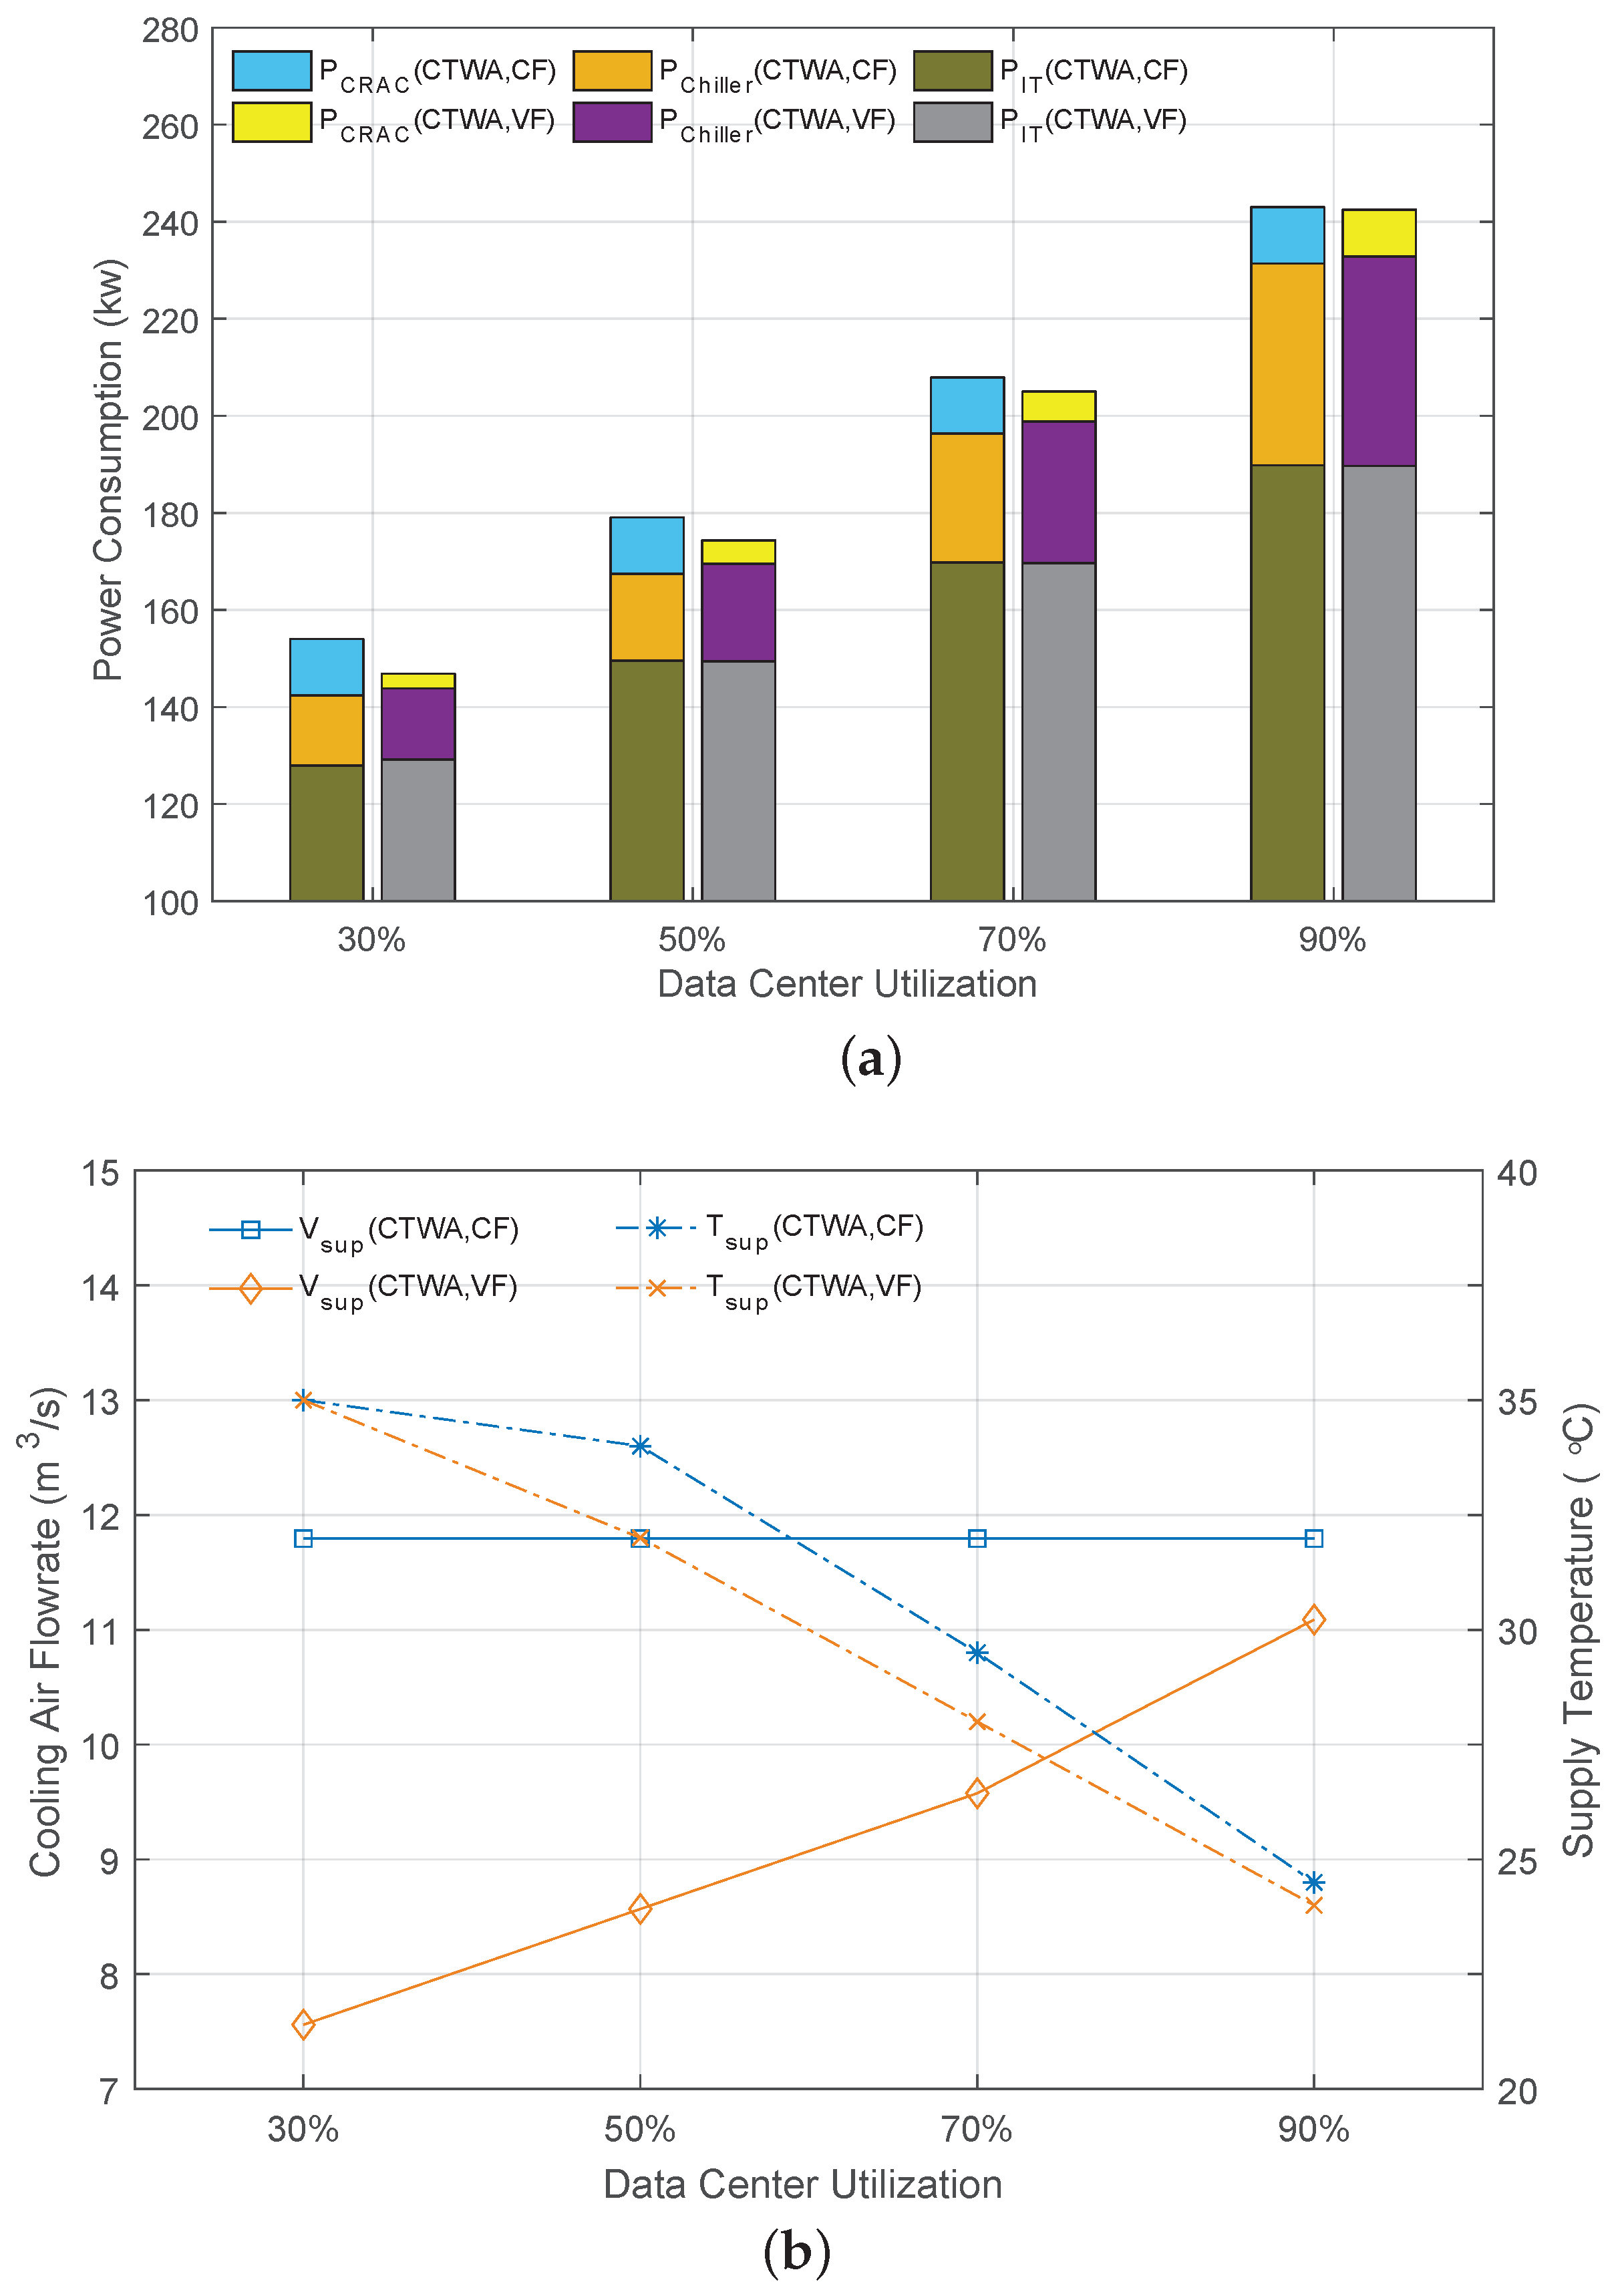
Figure 11 shows the power consumption and cooling parameters of data center achieved by the chip temperature-aware workload allocation strategy. We observed that, except for 90% utilization, the power consumption of data center under variable-flow cooling air supply is obviously lower than the corresponding case under constant-flow cooling air supply. For the cases of variable-flow cooling air supply with 30%, 50% and 70% utilizations, the chip temperature-aware workload allocation strategy achieves a significant reduction in CRAC power by optimizing the workload allocation. At the same time, compared to the data center with constant-flow cooling air supply, the increase of supply temperature in data center with variable-flow cooling air supply causes a increase in chiller power. As the utilization decreases, the data center under variable-flow cooling air supply achieves more energy saving. As shown in Figure 11b, the data center that uses variable-flow cooling air supply achieves more savings in CRAC power by reducing the supply of cooling air as utilization decreases.
Figure 12 presents the workload distributions achieved by the chip temperature-aware workload allocation strategy. In comparing cases of constant-flow and variable-flow cooling air supply, we observe that the chip temperature-aware workload allocation strategy tends to adjust workloads on servers as contributors and receivers of heat recirculation. For the cases with 30%, 50% and 70% utilizations, compared with the workload distributions under constant-flow cooling air supply, the workload distributions under variable-flow cooling air supply reduce workload from the servers that receive more recirculation heat (e.g., column 4, column5 and the top of racks). The reason is that the reduction of cooling air supply enhances the heat recirculation at these locations. At 90% utilization, the cases under constant-flow and variable-flow cooling air supply exhibit similar workload distributions since the effect of variation in cooling system is negligible.
4.3.3. Evaluation of Total Power Consumption and Energy Efficiency
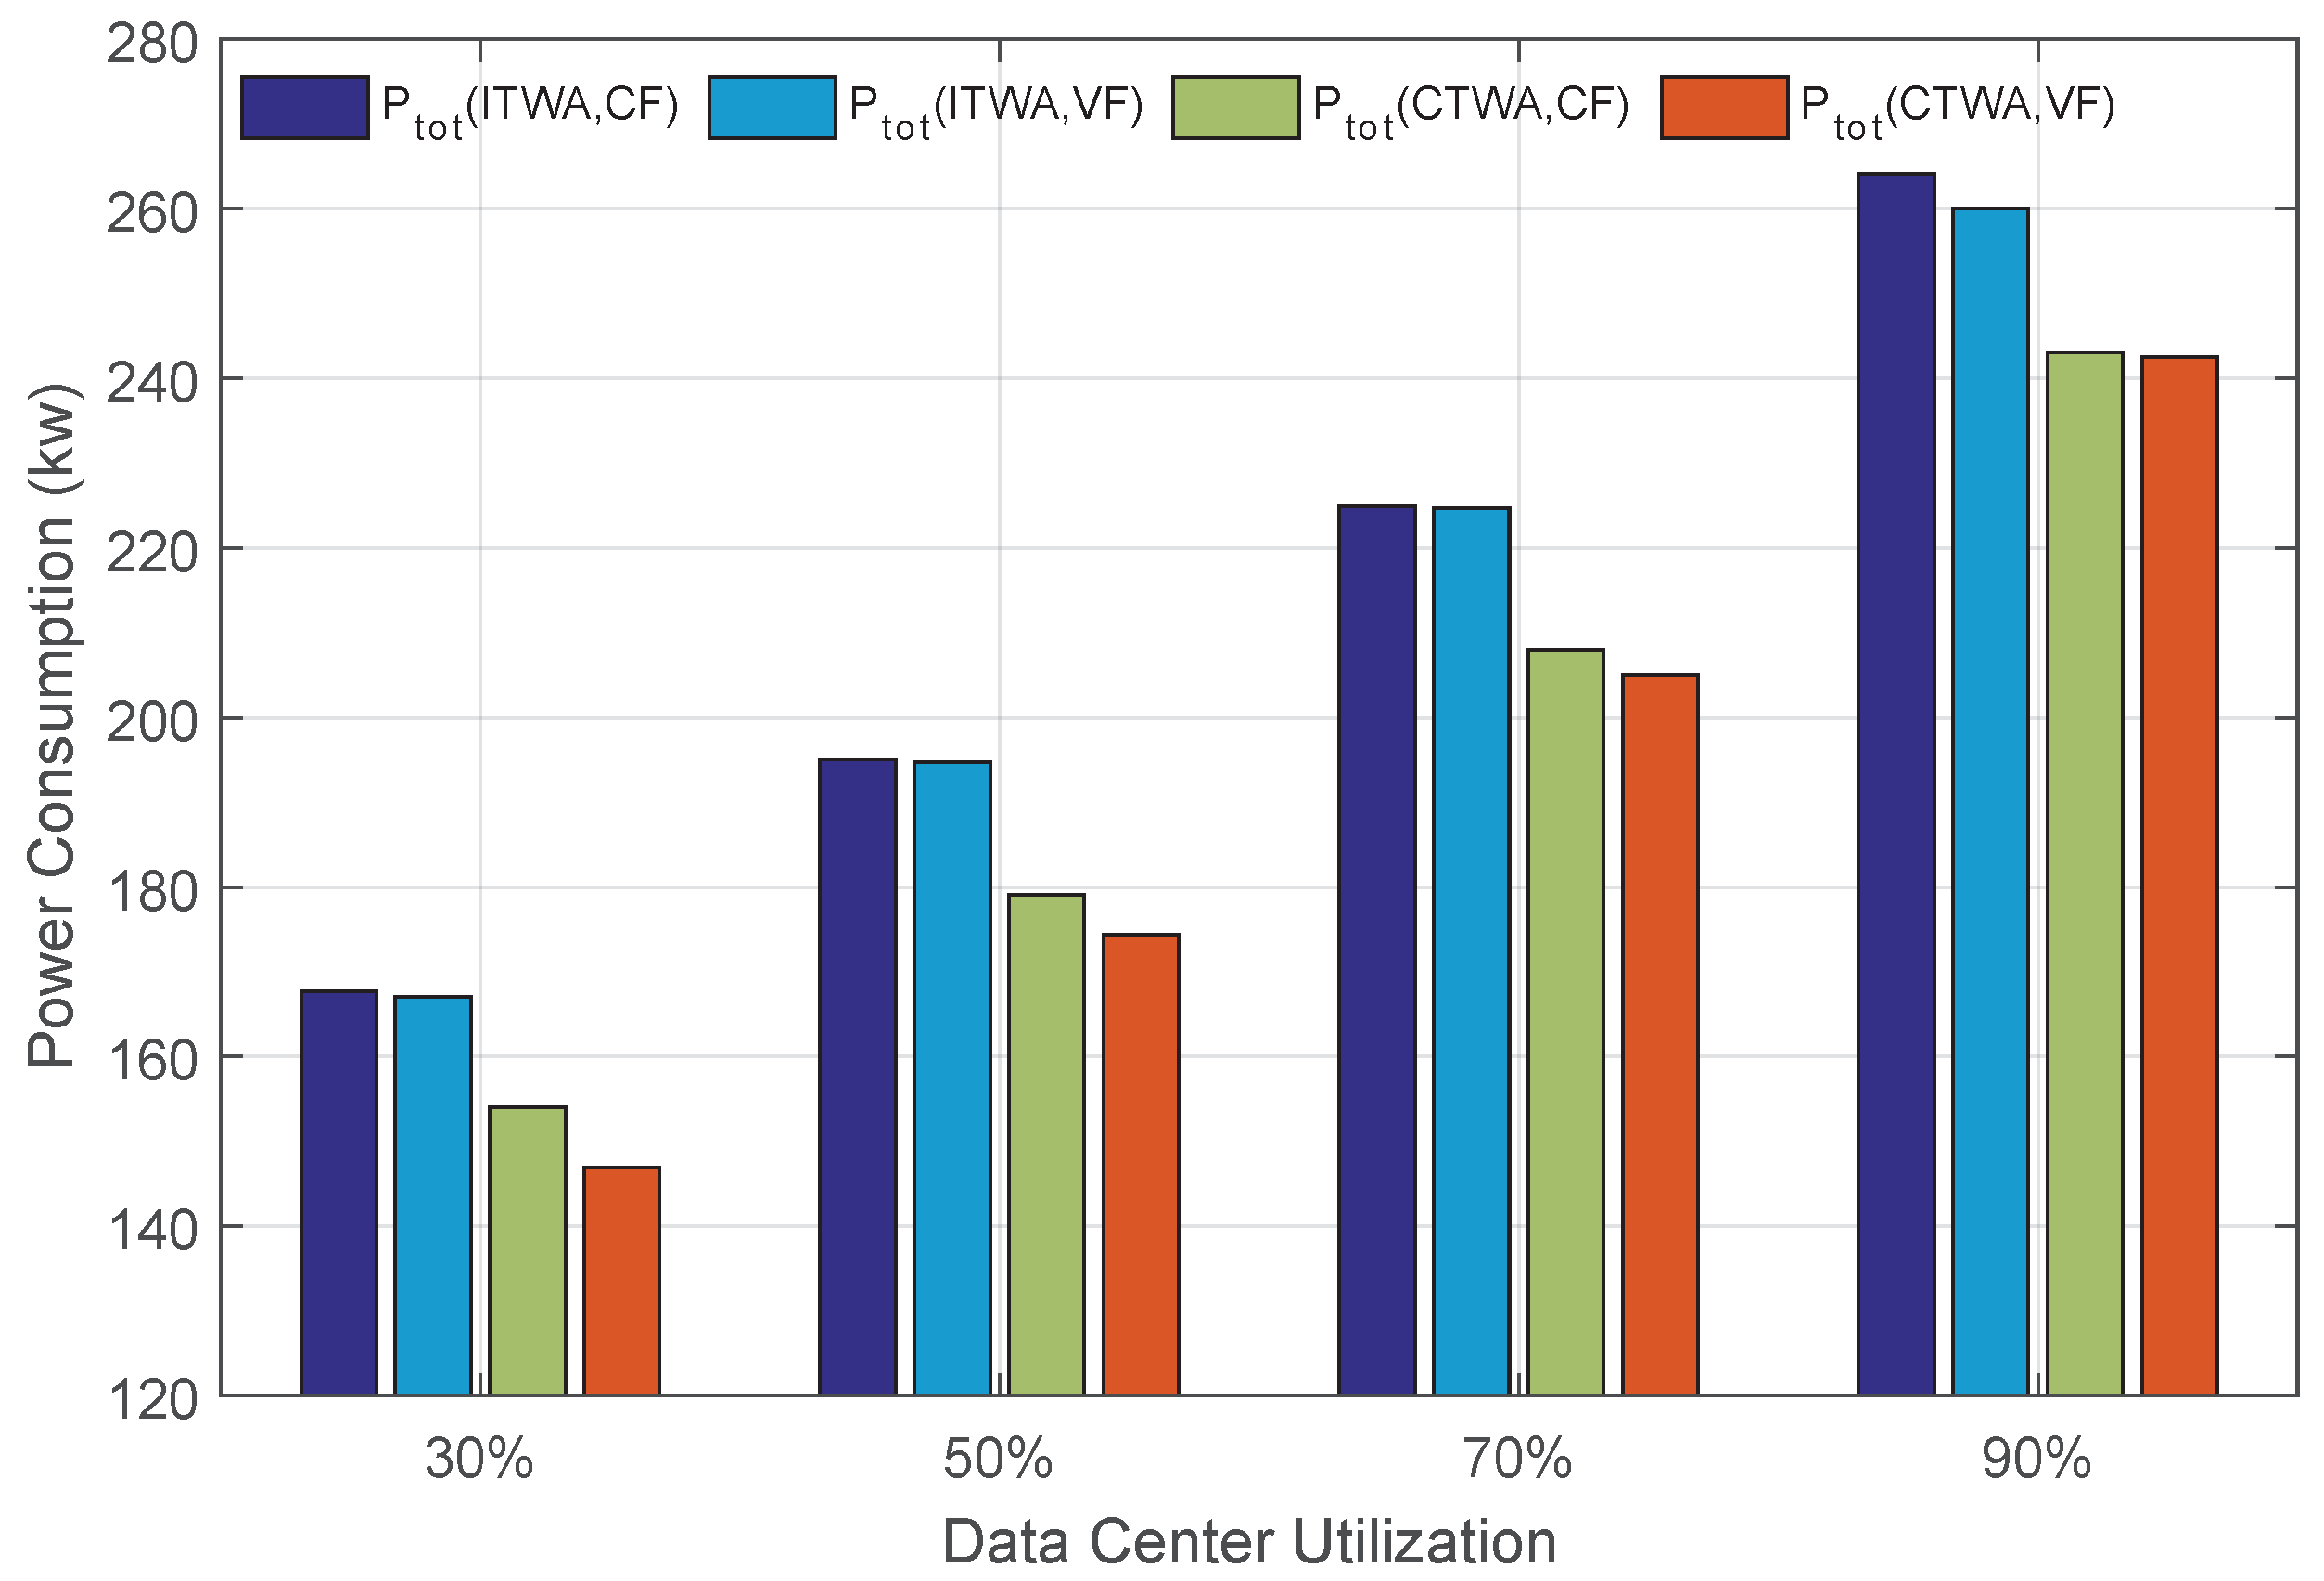
Figure 13 shows the total power consumption of data center for each case study. We observe that the power consumption of data center under variable-flow cooling air supply is always lower than the corresponding case under constant-flow cooling air supply, and the power consumption of data center optimized by the chip temperature-aware strategy is always lower than the corresponding case optimized by the inlet temperature-aware strategy. Compared with the inlet temperature-aware workload allocation strategy, the chip temperature-aware workload allocation strategy achieves energy savings of 7.5–8.2% and 6.7–12.1% for the data center under constant-flow and variable -flow cooling air supply, respectively.
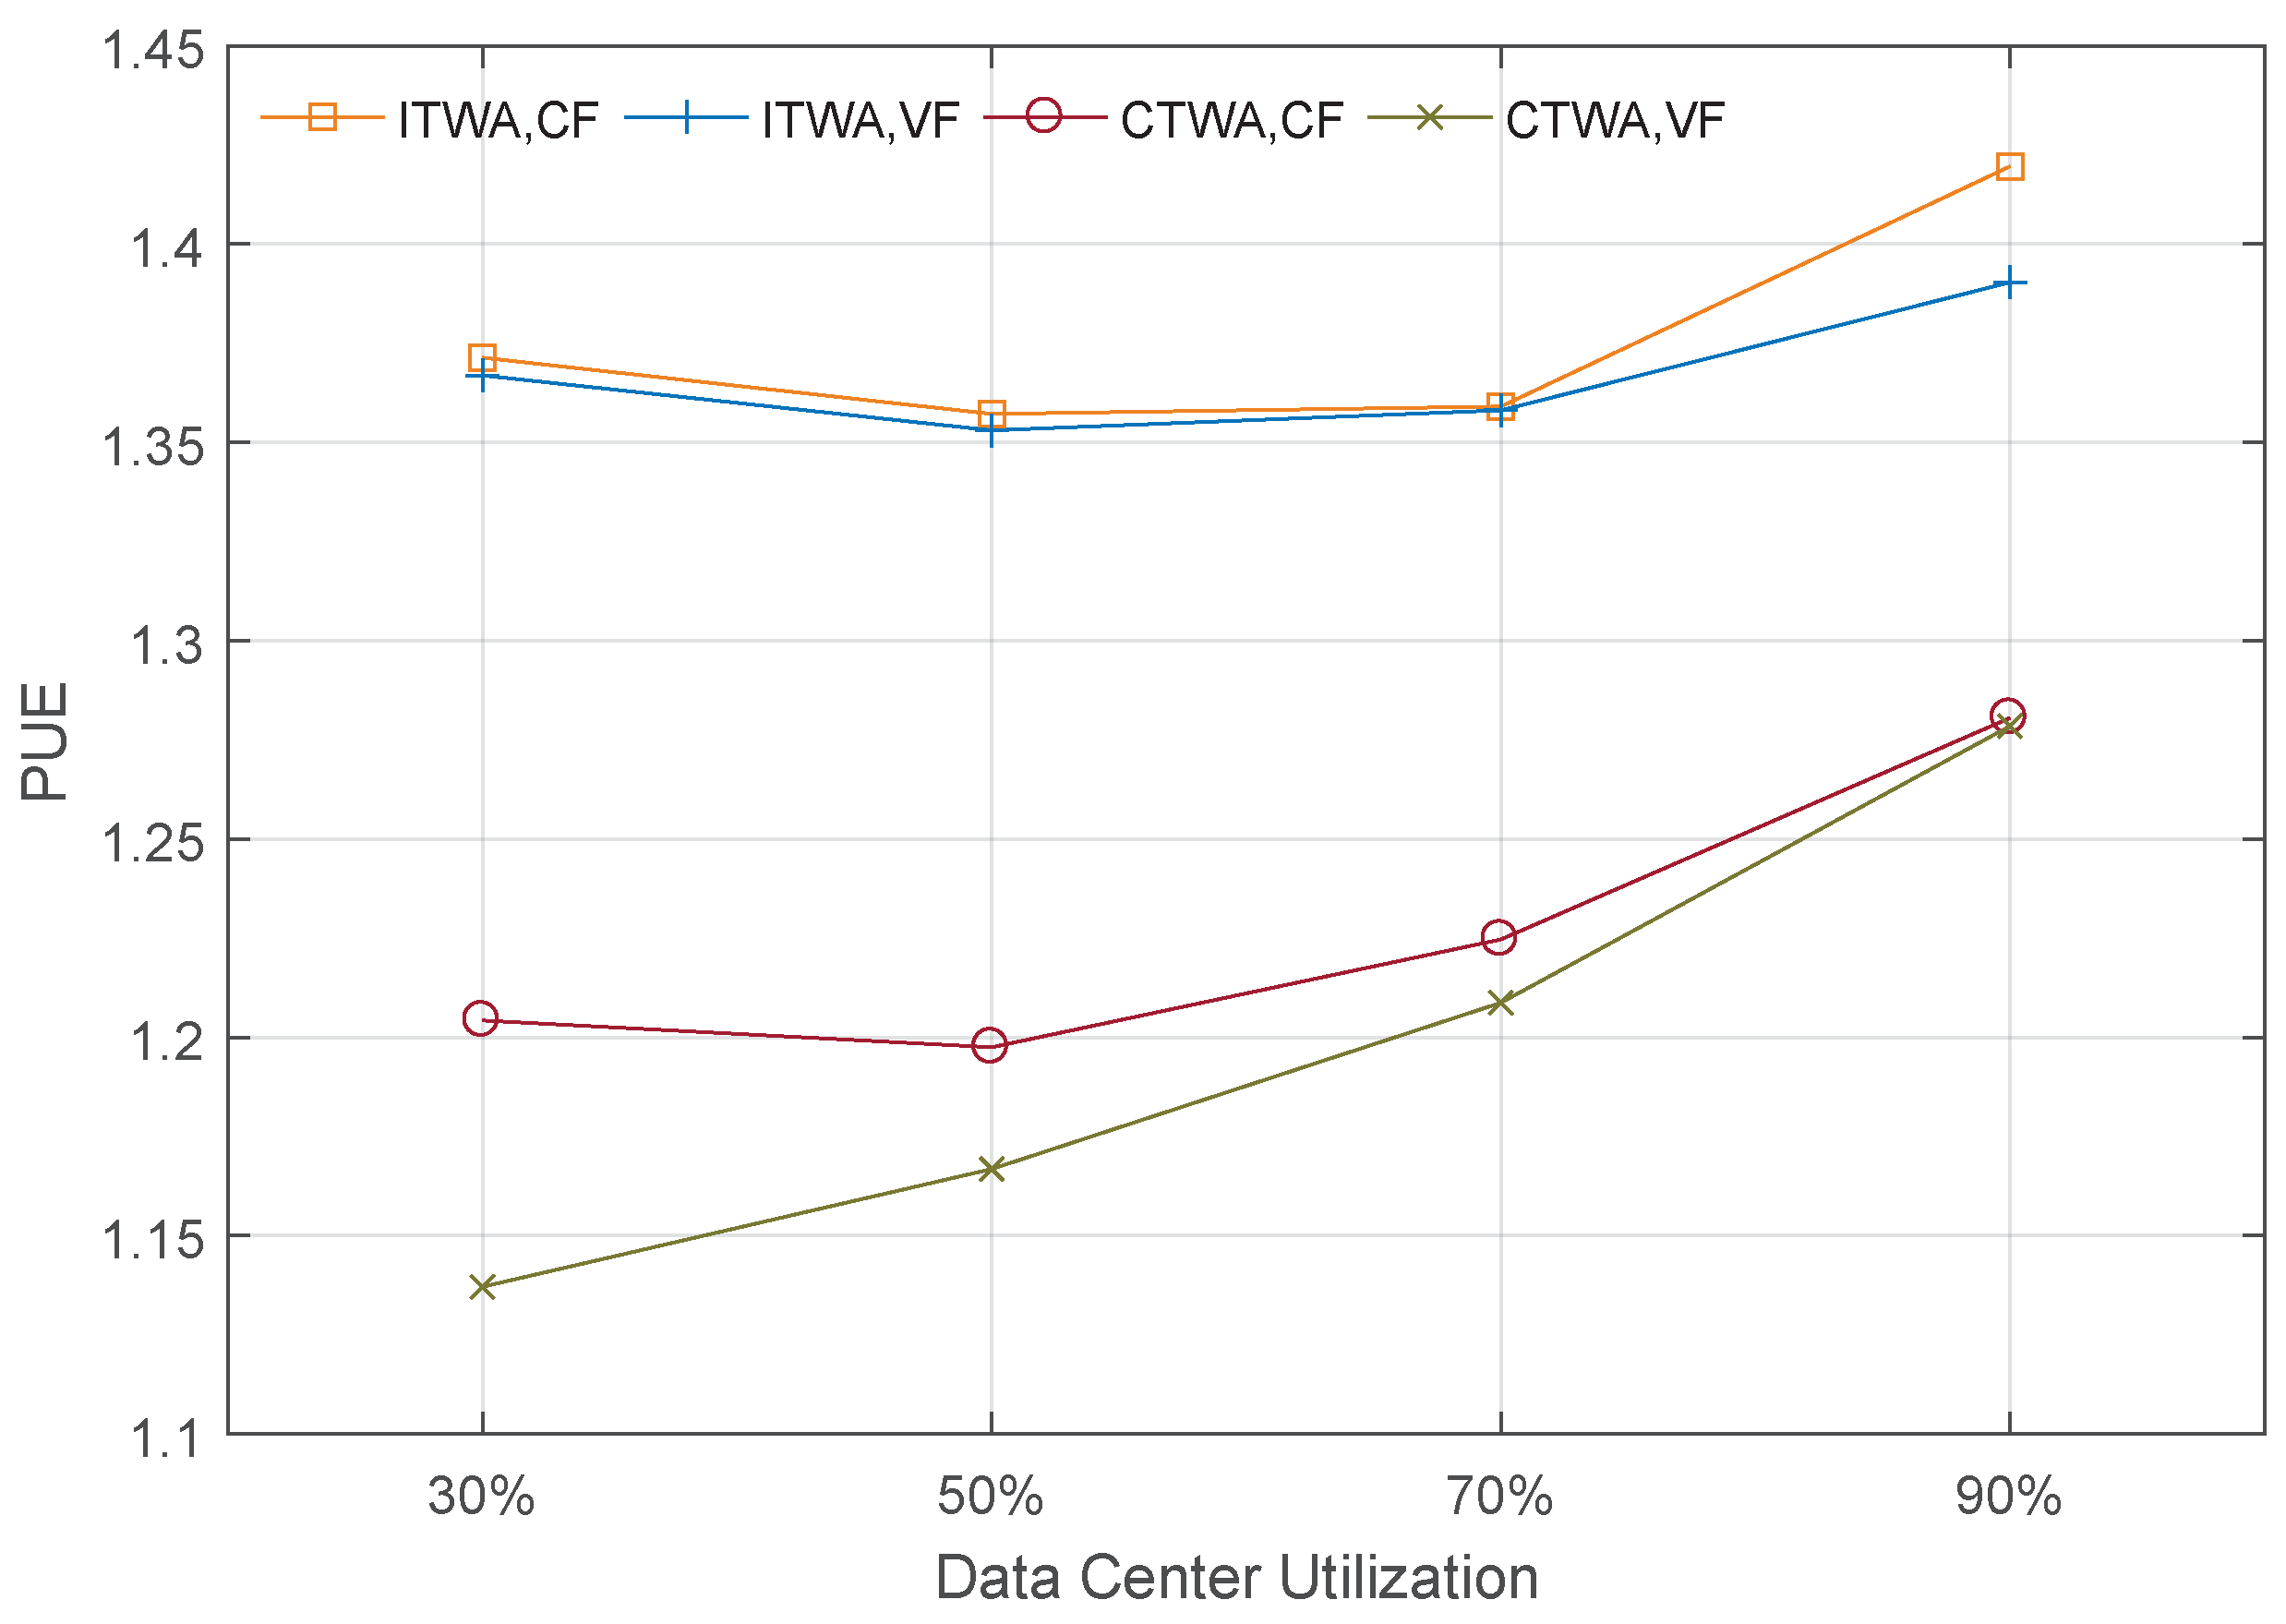
In present study, we adopt a popular metric, Power Usage Efficiency (PUE), to quantify the energy efficiency in data center. PUE is defined as the ratio of holistic power consumption in data center to the power consumption of IT equipment, which is expressed as
The energy efficiency of the data center enhances as its PUE declines. The ideal value for PUE is 1. Figure 14 shows the PUE of the sample data center for the case study. For both constant-flow and variable-flow cooling air supply, we observe that the PUE achieved by the chip temperature-aware workload allocation strategy is obviously lower than the corresponding case adopted the inlet temperature-aware workload allocation strategy. Compared with the inlet temperature-aware workload allocation strategy, the chip temperature-aware workload allocation strategy decreases the PUE of the case under constant-flow cooling air supply from 1.36–1.42 to 1.20–1.28 and decreases the PUE of the case under variable-flow cooling air supply from 1.36–1.39 to 1.14–1.28. Especially for the case of variable-flow cooling air supply under lower utilization, the chip temperature-aware workload distribution will further improve the energy efficiency of data center.
5. Conclusions
This paper utilized a POD-based heat recirculation model to evaluate the performance of the chip and inlet temperature-aware workload allocation strategies. These two different workload allocation strategies are implemented for the sample data center with constant-flow and variable-flow cooling air supply. In our study, the heat transfer in data center is characterized using an improved heat recirculation model, and the POD algorithm is used to reconstruct the cross-interference coefficients for different cooling air supply. The temperature-dependent leakage power is also considered in our work. To evaluate the performance of the chip and inlet temperature-aware workload allocation strategies, we apply the workload allocation methods to the sample data center with different utilization rates. The results show that, compared to the inlet temperature-aware workload allocation strategy, the chip temperature-aware workload allocation strategy avoids the server over-cooling and achieves a significant reduction in holistic power consumption of data center, especially for the case of variable-flow cooling air supply.
Acknowledgments
This work was supported by the Fundamental Research Funds for the Central Universities (2016XS41).
Author Contributions
Yan Bai conceived and designed the Yan Bai conceived and designed the study method mentality.; Lijun Gu performed the CFD simulations, thedata analysis and wrote the article. Xiao Qi revised the manuscript.
Conflicts of Interest
The authors declare no conflict of interest. The founding sponsors had no role in the design of the study; in the collection, analyses, or interpretation of data; in the writing of the manuscript; or in the decision to publish the results.
Abbreviations
The following abbreviations are used in this manuscript:
| IT | Information technology |
| CRAC | Computer room air condition |
| CFD | Computational fluid dynamics |
| POD | Proper orthogonal decomposition |
| COP | Coefficient of performance |
| ASHRAE | American Society of Heating Refrigeration and Air-conditioning Engineers |
| GA | Genetic algorithm |
| CTWA | Chip temperature-aware workload allocation |
| ITWA | Inlet temperature-aware workload allocation |
| CF | Constant-flow |
| VF | Variable-flow |
| PUE | Power Usage Efficiency |
References
- American Society of Heating, Refrigerating, and Air-Conditioning Engineers (ASHRAE). Thermal Guidelines for Data Processing Environments-Expanded Data Center Classes and Usage Guidance; Whitepaper Prepared by ASHRAE Technical Committee (TC) 9.9; ASHRAE: Atlanta, GA, USA, 2011. [Google Scholar]
- Chaudhry, M.T.; Ling, T.C.; Manzoor, A.; Hussain, S.A.; Kim, J. Thermal-aware scheduling in green data centers. ACM Comput. Surv. 2015, 47, 39. [Google Scholar] [CrossRef]
- Meijer, G.I. Cooling energy-hungry data centers. Science 2010, 328, 318–319. [Google Scholar] [CrossRef] [PubMed]
- Nada, S.A.; Said, M.A.; Rady, M.A. Effect of CRAC units layout on thermal management of data center. Appl. Therm. Eng. 2017, 98, 110–128. [Google Scholar] [CrossRef]
- Nada, S.A.; Said, M.A.; Rady, M.A. Numerical investigation and parametric study for thermal and energy management enhancements in data centers’ buildings. Appl. Therm. Eng. 2016, 98, 110–128. [Google Scholar] [CrossRef]
- Priyadumkol, J.; Kittichaikarn, C. Application of the combined air-conditioning systems for energy conservation in data center. Energy Build. 2014, 68, 580–586. [Google Scholar] [CrossRef]
- Skadron, K.; Abdelzaher, T.; Stan, M.R. Control-Theoretic Techniques and Thermal-RC Modeling for Accurate and Localized Dynamic Thermal Management. In Proceedings of the International Symposium on High-Performance Computer Architecture, Boston, MA, USA, 2–6 February 2002; pp. 17–28. [Google Scholar] [CrossRef]
- Cupertino, L.; Costa, G.D.; Oleksiak, A.; Piatek, W.; Pierson, J.M.; Salom, J.; Zilio, T. Energy-efficient, thermal-aware modeling and simulation of data centers. Ad Hoc Netw. 2015, 25, 535–553. [Google Scholar] [CrossRef] [Green Version]
- Sun, H.; Stolf, P.; Pierson, J.M.; Costa, G.D. Energy-efficient and thermal-aware resource management for heterogeneous datacenters. Sustain. Comput. Inform. Syst. 2014, 4, 292–306. [Google Scholar] [CrossRef] [Green Version]
- Sun, H.; Stolf, P.; Pierson, J.M. Spatio-temporal thermal-aware scheduling for homogeneous high-performance computing datacenters. Future Gener. Comput. Syst. 2017, 71, 157–170. [Google Scholar] [CrossRef]
- Tang, Q.; Gupta, S.K.S.; Stanzione, D.; Cayton, P. Thermal-Aware Task Scheduling to Minimize Energy Usage of Blade Server Based Datacenters. In Proceedings of the 2nd IEEE International Symposium on Dependable, Autonomic and Secure Computing, Indianapolis, IN, USA, 29 September–1 October 2006; pp. 195–202. [Google Scholar] [CrossRef]
- Tang, Q.; Mukherjee, T.; Gupta, S.K.; Cayton, P. Sensor-based fast thermal evaluation model for energy efficient high-performance datacenters. In Proceedings of the Fourth Inter-national Conference on Intelligent Sensing and Information Processing, Bangalore, India, 15 October–18 December 2006; pp. 203–208. [Google Scholar] [CrossRef]
- Khalaj, A.H.; Scherer, T.; Siriwardana, J.; Halgamuge, S.K. Multi-objective efficiency enhancement using workload spreading in an operational data center. Appl. Energy 2015, 138, 432–444. [Google Scholar] [CrossRef]
- Song, Z.; Murray, B.T.; Sammakia, B. Airflow and temperature distribution optimization in data centers using artificial neural networks. Int. J. Heat Mass Transf. 2013, 64, 80–90. [Google Scholar] [CrossRef]
- Demetriou, D.W.; Khalifa, H.E. Thermally aware, energy-based load placement in open-aisle, air-cooled data centers. J. Electron. Packag. 2013, 135, 030906. [Google Scholar] [CrossRef]
- Samadiani, E.; Joshi, Y. Proper orthogonal decomposition for reduced order thermal modeling of air cooled data centers. J. Heat Transf. 2010, 132, 271–291. [Google Scholar] [CrossRef]
- Samadiani, E.; Joshi, Y.; Allen, J.K.; Mistree, F. Adaptable robust design of multi-scale convective systems applied to energy efficient data centers. Numer. Heat Transf. A Appl. 2010, 57, 69–100. [Google Scholar] [CrossRef]
- Samadiani, E.; Joshi, Y. Multi-parameter model reduction in multi-scale convective systems. Int. J. Heat Mass Transf. 2010, 53, 2193–2205. [Google Scholar] [CrossRef]
- Ghosh, R.; Joshi, Y. Error estimation in POD-based dynamic reduced-order thermal modeling of data centers. Int. J. Heat Mass Transf. 2013, 57, 698–707. [Google Scholar] [CrossRef]
- Ghosh, R.; Joshi, Y. Rapid temperature predictions in data centers using multi-parameter proper orthogonal decomposition. Numer. Heat Transf. A Appl. 2014, 66, 41–63. [Google Scholar] [CrossRef]
- Fouladi, K.; Wemhoff, A.P.; Silva-Llanca, L.; Abbasi, K.; Ortega, A. Optimization of data center cooling efficiency using reduced order flow modeling within a flow network modeling approach. Appl. Therm. Eng. 2017, 124, 929–939. [Google Scholar] [CrossRef]
- Sirovich, L. Turbulence and the dynamics of coherent structures. Q. Appl. Math. 1987, 45, 561–571. [Google Scholar] [CrossRef]
- Sanghi, S.; Hasan, N. Proper orthogonal decomposition and its applications. Asia-Pac. J. Chem. Eng. 2015, 6, 120–128. [Google Scholar] [CrossRef]
- Ham, S.W.; Kim, M.H.; Choi, B.N.; Jeong, J.W. Simplified server model to simulate data center cooling energy consumption. Energy Build. 2015, 86, 328–339. [Google Scholar] [CrossRef]
- Wan, J.; Gui, X.; Zhang, R.; Fu, L. Joint cooling and server control in data centers: A cross-layer framework for holistic energy minimization. IEEE Syst. J. 2017, 99, 1–12. [Google Scholar] [CrossRef]
- Ranganathan, P.; Leech, P.; Irwin, D.; Chase, J. Ensemble-level Power Management for Dense Blade Servers. In Proceedings of the 33rd annual international symposium on Computer Architecture, Boston, MA, USA, 17–21 June 2006; Volume 34, pp. 66–77. [Google Scholar] [CrossRef]
- Hirokaw, T.; Hond, K.; Shibuy, T. Mercury and freon: Temperature emulation and management for server systems. ACM Sigplan Not. 2006, 41, 106–116. [Google Scholar] [CrossRef]
- Liu, Y.; Dick, R.P.; Shang, L.; Yang, H. Accurate temperature-dependent integrated circuit leakage power estimation is easy. In Proceedings of the Conference on Design, Automation and Test in Europe, Nice, France, 16–20 April 2007; pp. 1526–1531. [Google Scholar] [CrossRef]
- Moore, J.; Chase, J.; Ranganathan, P.; Sharma, R. Making scheduling “Cool”: Temperature-aware workload placement in data centers. In Proceedings of the Annual Conference on USENIX Annual Technical Conference, Anaheim, CA, USA, 10–15 April 2005; pp. 61–75. [Google Scholar] [CrossRef]
- Zapater, M.; Tuncer, O.; Ayala, J.L.; Moya, J.M.; Vaidyanathan, K.; Gross, K.; Coskun, A.K. Leakage-aware cooling management for improving server energy efficiency. IEEE Trans. Parallel Distrib. Syst. 2015, 26, 2764–2777. [Google Scholar] [CrossRef]
- Tang, Q.; Gupta, S.K.S.; Varsamopoulos, G. Energy-efficient thermal-aware task scheduling for homogeneous high-performance computing data centers: A cyber-physical approach. IEEE Trans. Parallel Distrib. Syst. 2008, 19, 1458–1472. [Google Scholar] [CrossRef]
- Jayaraman, B.; Finlayson, E.U.; Sohn, M.D.; Thatcher, T.L.; Price, P.N.; Wood, E.E.; Sextro, R.G.; Gadgil, A.J. Tracer gas transport under mixed convection conditions in an experimental atrium: Comparison between experiments and cfd predictions. Atmos. Environ. 2006, 40, 5236–5250. [Google Scholar] [CrossRef]
- Schall, D.; Harder, T. Energy-proportional query execution using a cluster of wimpy nodes. In Proceedings of the Ninth International Workshop on Data Management on New Hardware, New York, NY, USA, 24 June 2013; pp. 1–6. [Google Scholar] [CrossRef]
Figure 1.
Typical air cooling system in data center.

Figure 2.
Schematic of thermal cross-interference in data center.

Figure 3.
Schematic diagram of POD method for cross-interference coefficient prediction.

Figure 4.
Data center layout used in our study.

Figure 5.
Energy distribution of POD basis.

Figure 6.
(a) POD reconstruction of cross-interference matrix for = 8.19 m3/s. (b) Reconstruction error of cross-interference matrix for = 8.19 m3/s. (c) POD reconstruction of cross-interference matrix for = 10.71 m3/s. (d) Reconstruction error of cross-interference matrix for = 10.71 m3/s. (e) POD reconstruction of cross-interference matrix for = 13.23 m3/s. (f) Reconstruction error of cross-interference matrix for = 13.23 m3/s.

Figure 7.
Chip temperature distributions achieved by different strategies under constant-flow cooling air supply. (a) Chip temperature-aware workload allocation, 30% data center utilization. (b) Inlet temperature-aware workload allocation, 30% data center utilization. (c) Chip temperature-aware workload allocation, 50% data center utilization. (d) Inlet temperature-aware workload allocation, 50% data center utilization. (e) Chip temperature-aware workload allocation, 70% data center utilization. (f) Inlet temperature-aware workload allocation, 70% data center utilization. (g) Chip temperature-aware workload allocation, 90% data center utilization. (h) Inlet temperature-aware workload allocation, 90% data center utilization.


Figure 8.
Power consumption of data center under constant-flow cooling air supply.

Figure 9.
Power consumption and cooling parameters of data center achieved by inlet temperature-aware workload allocation strategy. (a) Power consumption under different data center utilization. (b) Cooling parameters under different data center utilization.
Figure 9.
Power consumption and cooling parameters of data center achieved by inlet temperature-aware workload allocation strategy. (a) Power consumption under different data center utilization. (b) Cooling parameters under different data center utilization.


Figure 10.
Workload distributions achieved by inlet temperature-aware workload allocation strategy. (a) Constant-flow cooling air supply, 30% data center utilization. (b) Variable-flow cooling air supply, 30% data center utilization. (c) Constant-flow cooling air supply, 50% data center utilization. (d) Variable-flow cooling air supply, 50% data center utilization. (e) Constant-flow cooling air supply, 70% data center utilization. (f) Variable-flow cooling air supply, 70% data center utilization. (g) Constant-flow cooling air supply, 90% data center utilization. (h) Variable-flow cooling air supply, 90% data center utilization.


Figure 11.
Power consumption and cooling parameters of data center achieved by chip temperature-aware workload allocation strategy. (a) Power consumption under different data center utilization. (b) Cooling parameters under different data center utilization.
Figure 11.
Power consumption and cooling parameters of data center achieved by chip temperature-aware workload allocation strategy. (a) Power consumption under different data center utilization. (b) Cooling parameters under different data center utilization.

Figure 12.
Workload distributions achieved by chip temperature-aware workload allocation strategy. (a) Constant-flow cooling air supply, 30% data center utilization. (b) Variable-flow cooling air supply, 30% data center utilization. (c) Constant-flow cooling air supply, 50% data center utilization. (d) Variable-flow cooling air supply, 50% data center utilization. (e) Constant-flow cooling air supply, 70% data center utilization. (f) Variable-flow cooling air supply, 70% data center utilization. (g) Constant-flow cooling air supply, 90% data center utilization. (h) Variable-flow cooling air supply, 90% data center utilization.

Figure 13.
Total power consumption of data center for the case study.

Figure 14.
Power Usage Effectiveness for case study.


Table 1.
Reference working condition of CRAC [24].
Table 1.
Reference working condition of CRAC [24].
| Item | Description | Value [Unit] |
|---|---|---|
| CRAC blower efficiency | 60% | |
| Reference air volume flowrate | 15.14 m3/s | |
| Static pressure drop across CRAC | 974 Pa |
Table 2.
Air materials properties in CFD simulation.
| Property | Value and Unit |
|---|---|
| Reference temperature | 25 °C |
| Reference pressure | 101,325 Pa |
| Specific heat capacity | 1004.4 J/kg·K |
| Density | 1.225 kg/m3 |
Table 3.
Temperature error of reconstruction case.
| Item | Case 1 | Case 2 | Case 3 |
|---|---|---|---|
| 8.19 m3/s | 10.71 m3/s | 13.23 m3/s | |
| Mean Error | 0.027 °C | 0.026 °C | 0.037 °C |
| Max Error | 0.101 °C | 0.172 °C | 0.249 °C |
© 2018 by the authors. Licensee MDPI, Basel, Switzerland. This article is an open access article distributed under the terms and conditions of the Creative Commons Attribution (CC BY) license (http://creativecommons.org/licenses/by/4.0/).
Share and Cite
MDPI and ACS Style
Bai, Y.; Gu, L.; Qi, X. Comparative Study of Energy Performance between Chip and Inlet Temperature-Aware Workload Allocation in Air-Cooled Data Center. Energies 2018, 11, 669. https://doi.org/10.3390/en11030669
AMA Style
Bai Y, Gu L, Qi X. Comparative Study of Energy Performance between Chip and Inlet Temperature-Aware Workload Allocation in Air-Cooled Data Center. Energies. 2018; 11(3):669. https://doi.org/10.3390/en11030669
Chicago/Turabian StyleBai, Yan, Lijun Gu, and Xiao Qi. 2018. "Comparative Study of Energy Performance between Chip and Inlet Temperature-Aware Workload Allocation in Air-Cooled Data Center" Energies 11, no. 3: 669. https://doi.org/10.3390/en11030669
Note that from the first issue of 2016, this journal uses article numbers instead of page numbers. See further details here.