Gasification Kinetics of Bituminous Coal Char in the Mixture of CO2, H2O, CO, and H2

Department of Energy and Resources Engineering, College of Engineering, Peking University, Beijing 100871, China
*
Author to whom correspondence should be addressed.
Energies 2019, 12(3), 496; https://doi.org/10.3390/en12030496
Submission received: 6 January 2019
/
Revised: 31 January 2019
/
Accepted: 31 January 2019
/
Published: 4 February 2019
Abstract
:The gasification kinetics of bituminous coal char was investigated in a mixture of CO2, H2O, CO, H2, and N2 under isothermal conditions. In addition, the impacts of gasification temperature, gasification time, and gas composition on the gasification process were analyzed. As the experimental results suggest, there is a significant increase of the carbon conversion degree of bituminous coal char not just when gasification temperature and time increase, but also when H2 and CO concentration decreases. The kinetics of bituminous coal char in the gasification process was successfully modeled as a shrinking unreacted core. It is concluded that the gasification of bituminous coal char is controlled by an internal chemical reaction in the early stage and diffusion in the later stage. The activation energies of bituminous coal char gasification for different stages were studied. Moreover, it is proposed for the first time, to our knowledge, that the diffusion-control step is significantly shortened with the decrease of the CO2/H2O ratio. As scanning-electron-microscopy results suggest, bituminous coal char gasified in CO2/H2O = 1/3 atmosphere has numerous inner pores (0–5 m). Therefore, in the process of gasification, the inner pores provide a gas channel that reduces the gas diffusion resistance and thus shortens the diffusion-control step. These results can serve as a reference for industrialized application of the technology of coal gasification direct reduced iron.
1. Introduction
China has established the World’s most enormous iron and steel industry in the last few decades [1]. However, China’s scrap resources are in short supply and the iron and steel industry has caused increasingly serious environmental pollution, contrary to China’s sustainable development strategy. Nowadays, the blast furnace (BF) iron-making process is the most important critical process for the iron and steel industry [2]. The BF iron-making process has several fatal weaknesses. First, the reduction of CO2 emissions from the iron and steel industry has a significant impact on global CO2 emission reduction [3,4]. Second, the tonnage energy consumption of steel enterprises is 600 kgce/t. In the case of the blast furnace, the consumption of coke has been reduced from 800 kg/t Hot Metal in the 1960s to 470 kg/t HM in the 2010s [5,6]. The total energy consumption of steel enterprises accounts for approximately 15% of the total energy consumption in China, and steel enterprises’ energy consumption cost accounts for 20–40% of total energy consumption. Therefore, energy conservation and emissions reduction in the steel industry are extremely urgent [7]. Further, iron smelting in BFs requires metallurgical coke. Coking coal resources are scarce, and the price of metallurgical coke is high, while the abundant non-coke energy resources cannot be utilized [8]. Last but not least, sinter and coking processes could cause different types of pollutants with higher pollution emissions, which accounts for 80% of the total pollution emissions in steel production, which contains CO2 NOX SOX Particulate matter Dioxins Metals and heavy metals and Polycyclic aromatic hydrocarbons [9]. Therefore, developing non-BF iron-making technology processes is very important.
Direct reduced iron (DRI) technology will emit less harmful gas and has higher energy efficiency, which will promote the development of China’s iron and steel industry [10,11,12]. DRI is the foundation of the short process of iron and steel production, and non-coking coal is the main energy source. DRI can avoid the pollution of harmful components in the production process. The DRI process can be divided into gas-based and coal-based processes [13]. The gas-based DRI process plays a leading role because of its advantages of high production capacity, low energy consumption, and low pollutant emission [14,15]. At present, the gas-based DRI production process comprises 80% of the World’s total DRI production. Moreover, natural gas is the absolutely dominant gaseous reducing agent applied in the gas-based direct-reduction process [16]. The shortage of natural gas resources is one of the major causes of the low production of direct reduction, and it has slowed the development of gas-based direct-reduction technology in China [16]. With the continuous improvement of direct-reduction technology, combined with available coal gasification technology, a new direct-reduction process in which coal-formed gas substitutes for natural gas serving as reducing agents, has been proposed, opening up an effective way to develop a gas-based direct-reduction process [17,18]. However, many key technological problems must be overcome in the course of implementation, especially the coal gasification technology [17,18,19,20].
Many researchers [21,22,23,24] have devised reaction models of char-carbon dioxide (CO2) and char-water vapor (H2O) separately to explore the coal gasification reaction mechanism. The kinetics of both char-CO2 and char-H2O gasification have also been studied in detail [25,26,27,28]. However, these studies, carried out in systems with a sole gasifying agent, could hardly be applied in systems where the mixtures of carbon dioxide, water vapor, carbon monoxide (CO), and hydrogen (H2) usually serve as gasifying agents in actual industry. Hence, coal gasification as a gasifying agent should also be studied under realistic gasification conditions.
Therefore, it is important to achieve a clear understanding of the gasification kinetics of coal gasification with compound gas as a gasifying agent. In addition, the effects of gasification temperature, gas composition, and gasification time of bituminous coal char were studied, and gasification kinetics were emphatically investigated using a mixture of carbon dioxide, water vapor, carbon monoxide, and hydrogen. The results lay a technical foundation for the industrialized application of coal gasification-DRI technology.
2. Materials and Methods
2.1. Preparation of Samples
CO2 (99.99% purity), CO (99.99% purity), H2 (99.99% purity), N2 (99.99% purity), and H2O from a vapor generator (under the control of a computer program) were the gases applied in the present study. Characteristic Western bituminous coal from a reservoir in Ordos, Xinjiang, China was selected for the solid coal samples. Table 1 shows the proximate and ultimate analyses of the bituminous coal. We pyrolyzed bituminous coal under a N2 atmosphere for nearly 240 min, and 1 atm and 1373 K were selected as the pyrolysis pressure and temperature, respectively. After pyrolysis, the sample was cooled to ambient temperature protected by N2 and then used for the gasification experiments. To ensure a uniform shape, we formed the bituminous coal char into Φ1.5 m ± 1.5 mm, 10.00 ± 0.01 g samples. Table 2 shows the proximate and ultimate analyses of the bituminous coal char. Compared with Table 1, it can be seen that the moisture and volatile matter of bituminous coal are significantly reduced after pyrolysis, and that the main components of bituminous coal char are ash and fixed carbon.
2.2. Experimental Process and Measurement Method
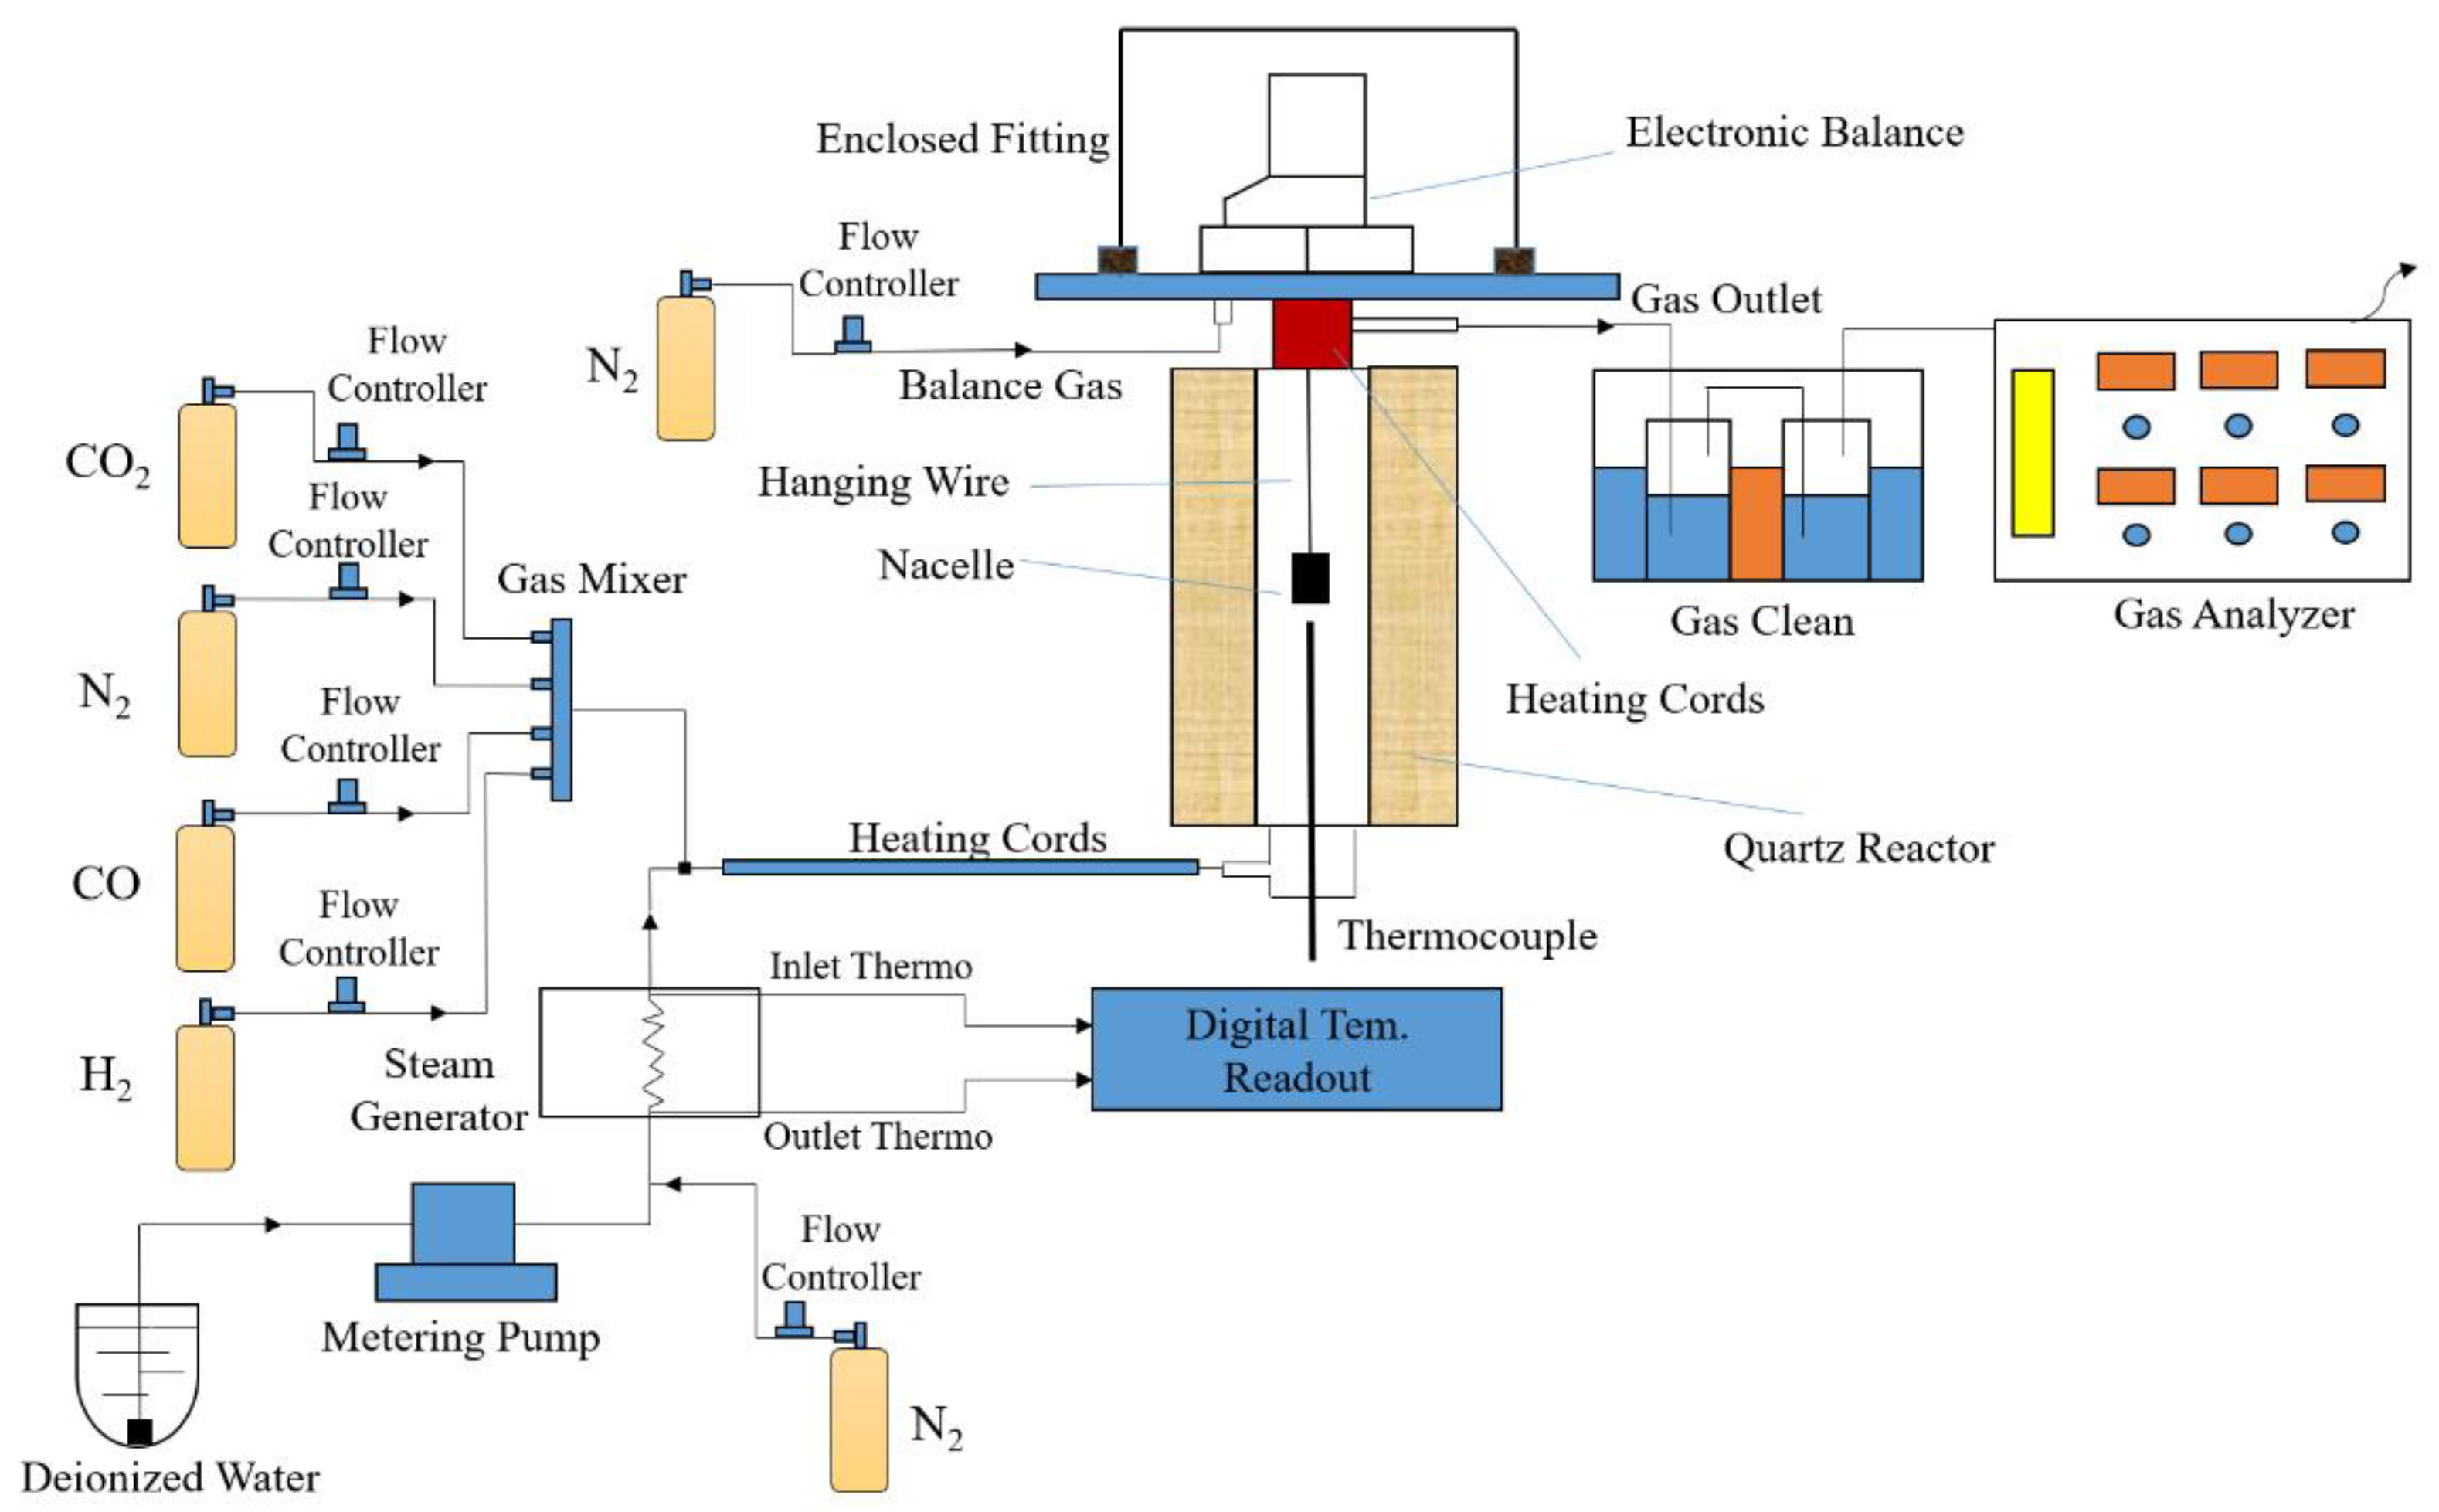
As shown in Figure 1, a self-designed device for the accurate measure of bituminous coal char’s gasification reaction under CO2, H2O, CO, H2, and N2 atmosphere was applied. First, 10 g of bituminous coal char was suspended under an electronic balance by hanging wires and a nacelle, and the electronic balance was then used to record the weight loss of the bituminous coal sample. A gasket made of silica gel was placed between the flanges of the quartz reactor to improve its air-tightness. The reactor diameter was 92 mm. The blind flange of the reactor was then closed. The inlet and exit pipes were connected with the quartz reactor, and the reactor was filled with N2 to check the air-tightness. Later, the quartz reactor power was turned on, the temperature program was settled down, and the heater was turned up. Selecting N2 as a protective gas, CO2, CO, H2, and N2 flow were controlled using a flow controller. A steam generator was used to heat the water to 773 K and a metering pump was used to control the water flow. In the entire heating process, the quartz reactor was heated at 10 K/min under a 2-L/min N2 atmosphere, and the reaction pressure was 1 atm. When the temperature reached the specified temperature, the electronic balance was turned on and began to record the data. The 2-L/min N2 was then replaced by CO2, H2O, CO, H2, and N2 to carry out the gasification. The reaction gas flowed into the bottom and out of the gas outlet when the reaction was completed. After the bituminous coal char was gasified for 120 min, the samples were cooled to ambient temperature under a N2 atmosphere. Finally, the samples were removed from the quartz reactor for later scanning-electron-microscopy (SEM) testing.
The carbon conversion degree of bituminous coal char can be calculated as follows:
where mt (units: g) denotes the weight of char at a given time, mash (units: g) the final weight of char, m0 (units: g) the weight of char just after loading the reactant gas, and X the carbon conversion degree.
2.3. Gasification Kinetics Model
The un-reacted shrinking-core model is used as the kinetic model in this study, including the processes of external diffusion of gaseous species, intrinsic chemical reactions, and the diffusion of gas species. In this study, under the experimental conditions, the external diffusion resistance of the gas can be neglected. Therefore, under the condition of the mixture of CO2, H2O, CO, H2, and N2 atmosphere, the total gasification time can be calculated according to Equation (2) below, which follows the un-reacted shrinking-core model. Therefore, the rate equations are yielded as shown below in Equations (3) and (4), according to which we can draw multiple diagrams to explore the actual rate-controlling step of the gasification process. The versus time should be drawn as a straight line when this process is controlled by internal chemical reactions. For the diffusion of gas species in the controlling step, the plot of versus time should be a straight line. In Equations (2)–(4), refers to the total gasification time (units: min); is the gasification rate constant (units: cm/min); and refer to gasification gas concentration at the granule surface and in equilibrium, respectively (units: mol/cm3); denotes the parameter constant, denotes the initial oxygen concentration in the bituminous coal char (units: mol/cm3); r0 denotes the characteristic initial radius of bituminous coal char (cm); and De is the effective diffusion coefficient (units: cm2/min).
3. Results and Discussion
3.1. Gasification Temperature
Figure 2 shows the gasification-process results for bituminous coal char isothermally gasified in a mixture of CO2, H2O, CO, H2, and N2 atmosphere. This experiment was conducted with a gasification gas flow of 8 L/min in the temperature range 1173–1373 K with intervals of 50 K. The gasification gas flow of 8 L/min was made up of 2 L/min CO2, 2 L/min H2O, 1.5 L/min CO, 1.5 L/min H2, and 1 L/min N2. Figure 2 shows that the carbon conversion degree of bituminous coal char increases when gasification temperature increases in the mixture of CO2, H2O, CO, H2, and N2 atmosphere. The carbon conversion degree reaches 63.97%, 73.01%, 79.99%, 86.92%, and 91.23% after the bituminous coal chars are gasified at 1173, 1223, 1273, 1323, and 1373 K, respectively, for 54 min. Specifically, the isothermal gasification curves are first steep and then slow, and finally barely vary with gasification time. Furthermore, the curves become steeper with increasing gasification temperature. Therefore, the carbon conversion degree reaches saturation faster as the gasification temperature increases. Gasification temperature is suggested to significantly impact the carbon conversion degree of bituminous coal char. Thus, the carbon conversion degree of bituminous coal char is accelerated with the reasonable increase of gasification temperature. In addition, due to the different thermal and physical properties of CO2 and H2O, they react differently with the bituminous coal char. Equations (5) and (6) present the major reactions of CO2 or H2O with bituminous coal char:
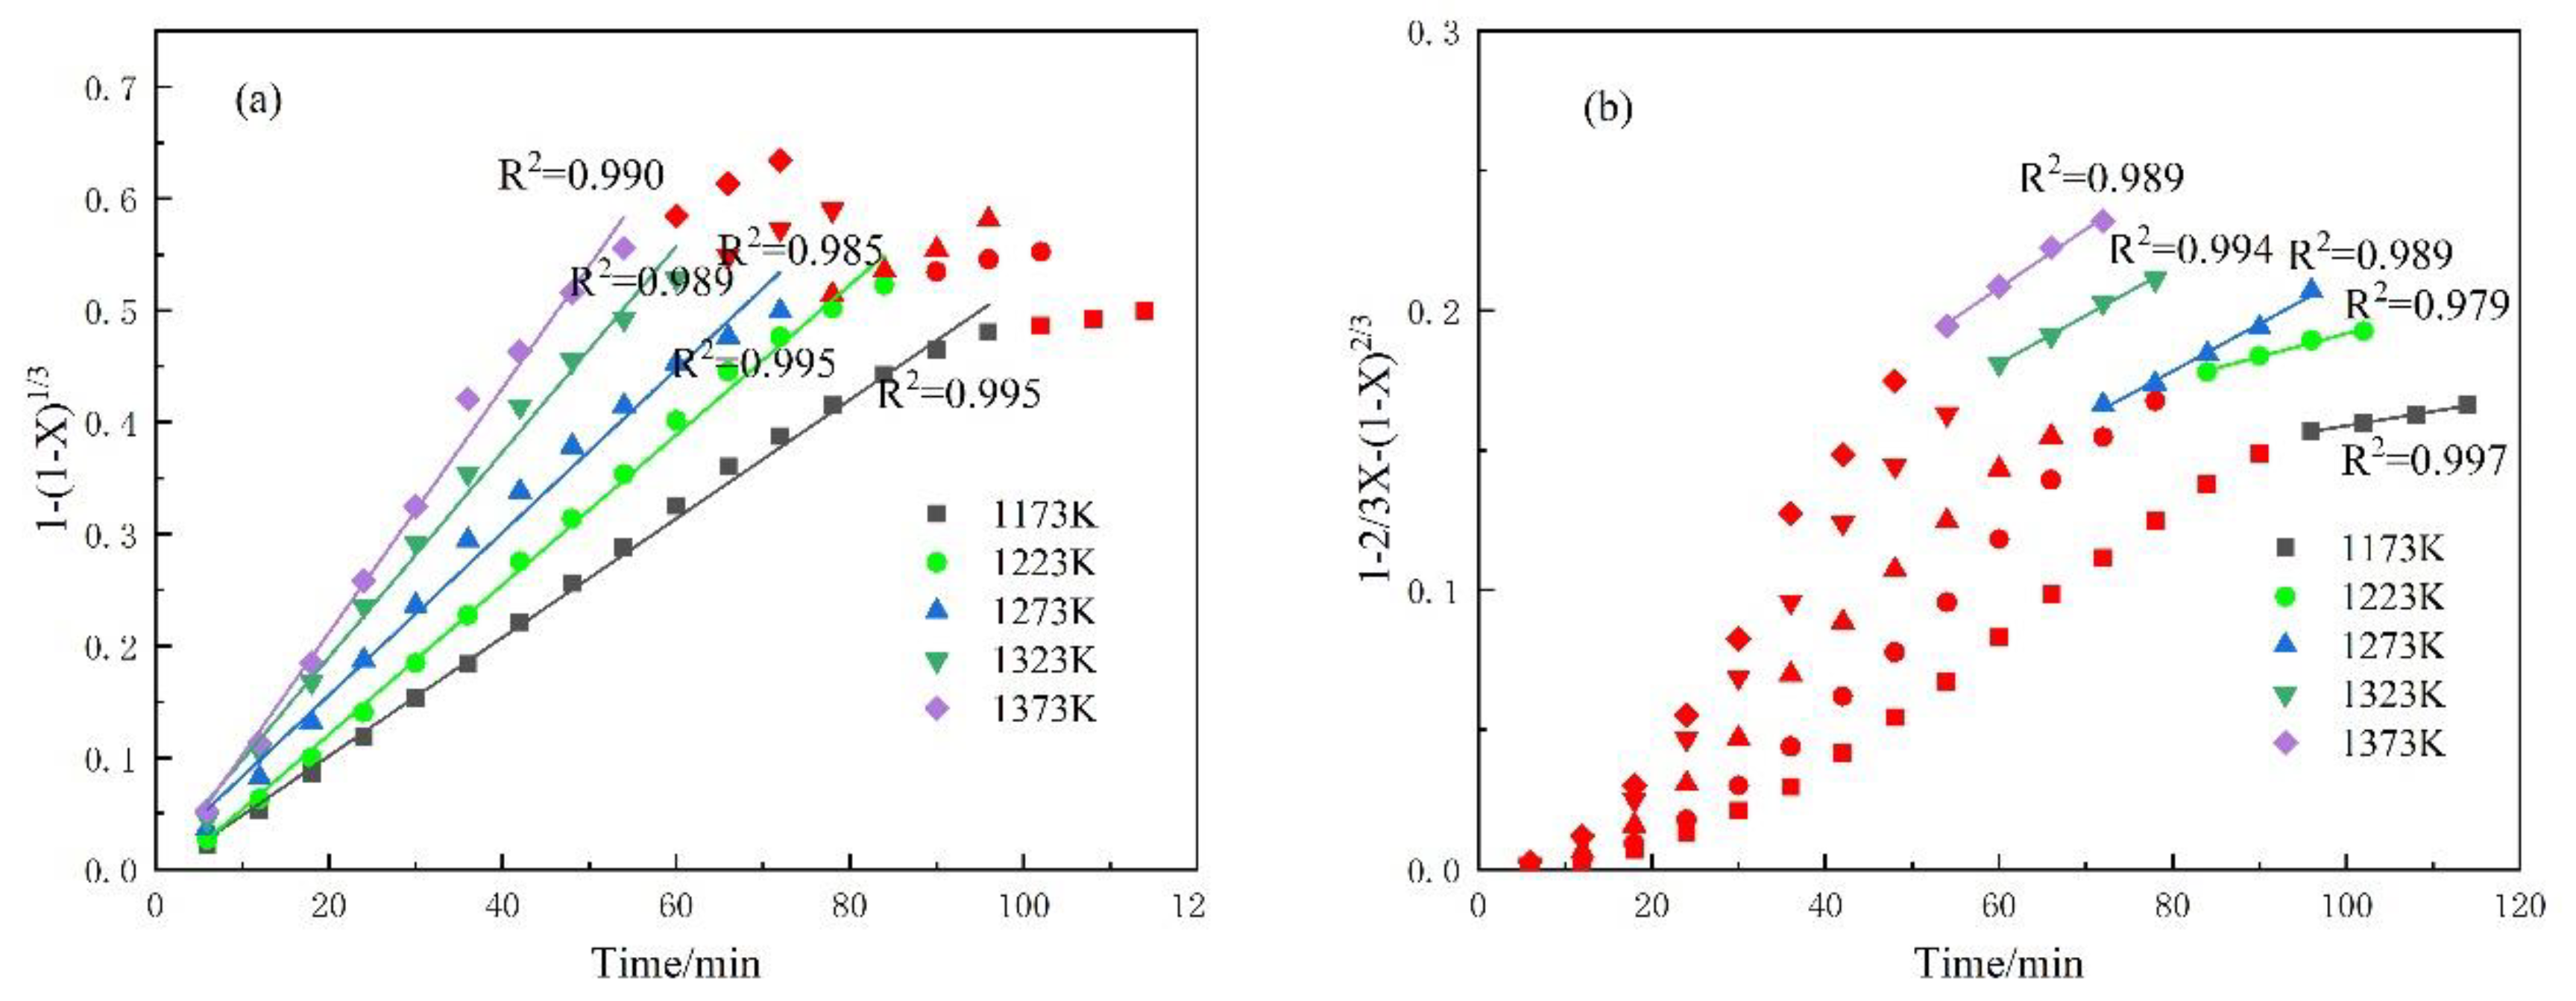
On the basis of Equations (3) and (4), Figure 3 shows the kinetic results of bituminous coal char gasification at different temperatures under the mixture of CO2, H2O, CO, H2, and N2 atmosphere. Obviously, the entire gasification process has two stages: the early stage and the later stage. At the early stage, the straight lines’ correlation coefficients (R2) for the above mixture components are 0.995, 0.995, 0.985, 0.989, and 0.990, respectively, while at the later stage, the straight lines’ correlation coefficients (R2) are 0.997, 0.979, 0.989, 0.994, and 0.989, respectively. Thus, from the linear relation, the early and later gasification processes are controlled by interfacial chemical reaction and diffusion, respectively. The values of the gasification rate constant of the two stages are presented in Table 3. It is suggested that the gasification rate constants of both the early and later stage increase with elevated temperature in the mixture. This reveals that increasing temperature can effectively improve the gasification process.
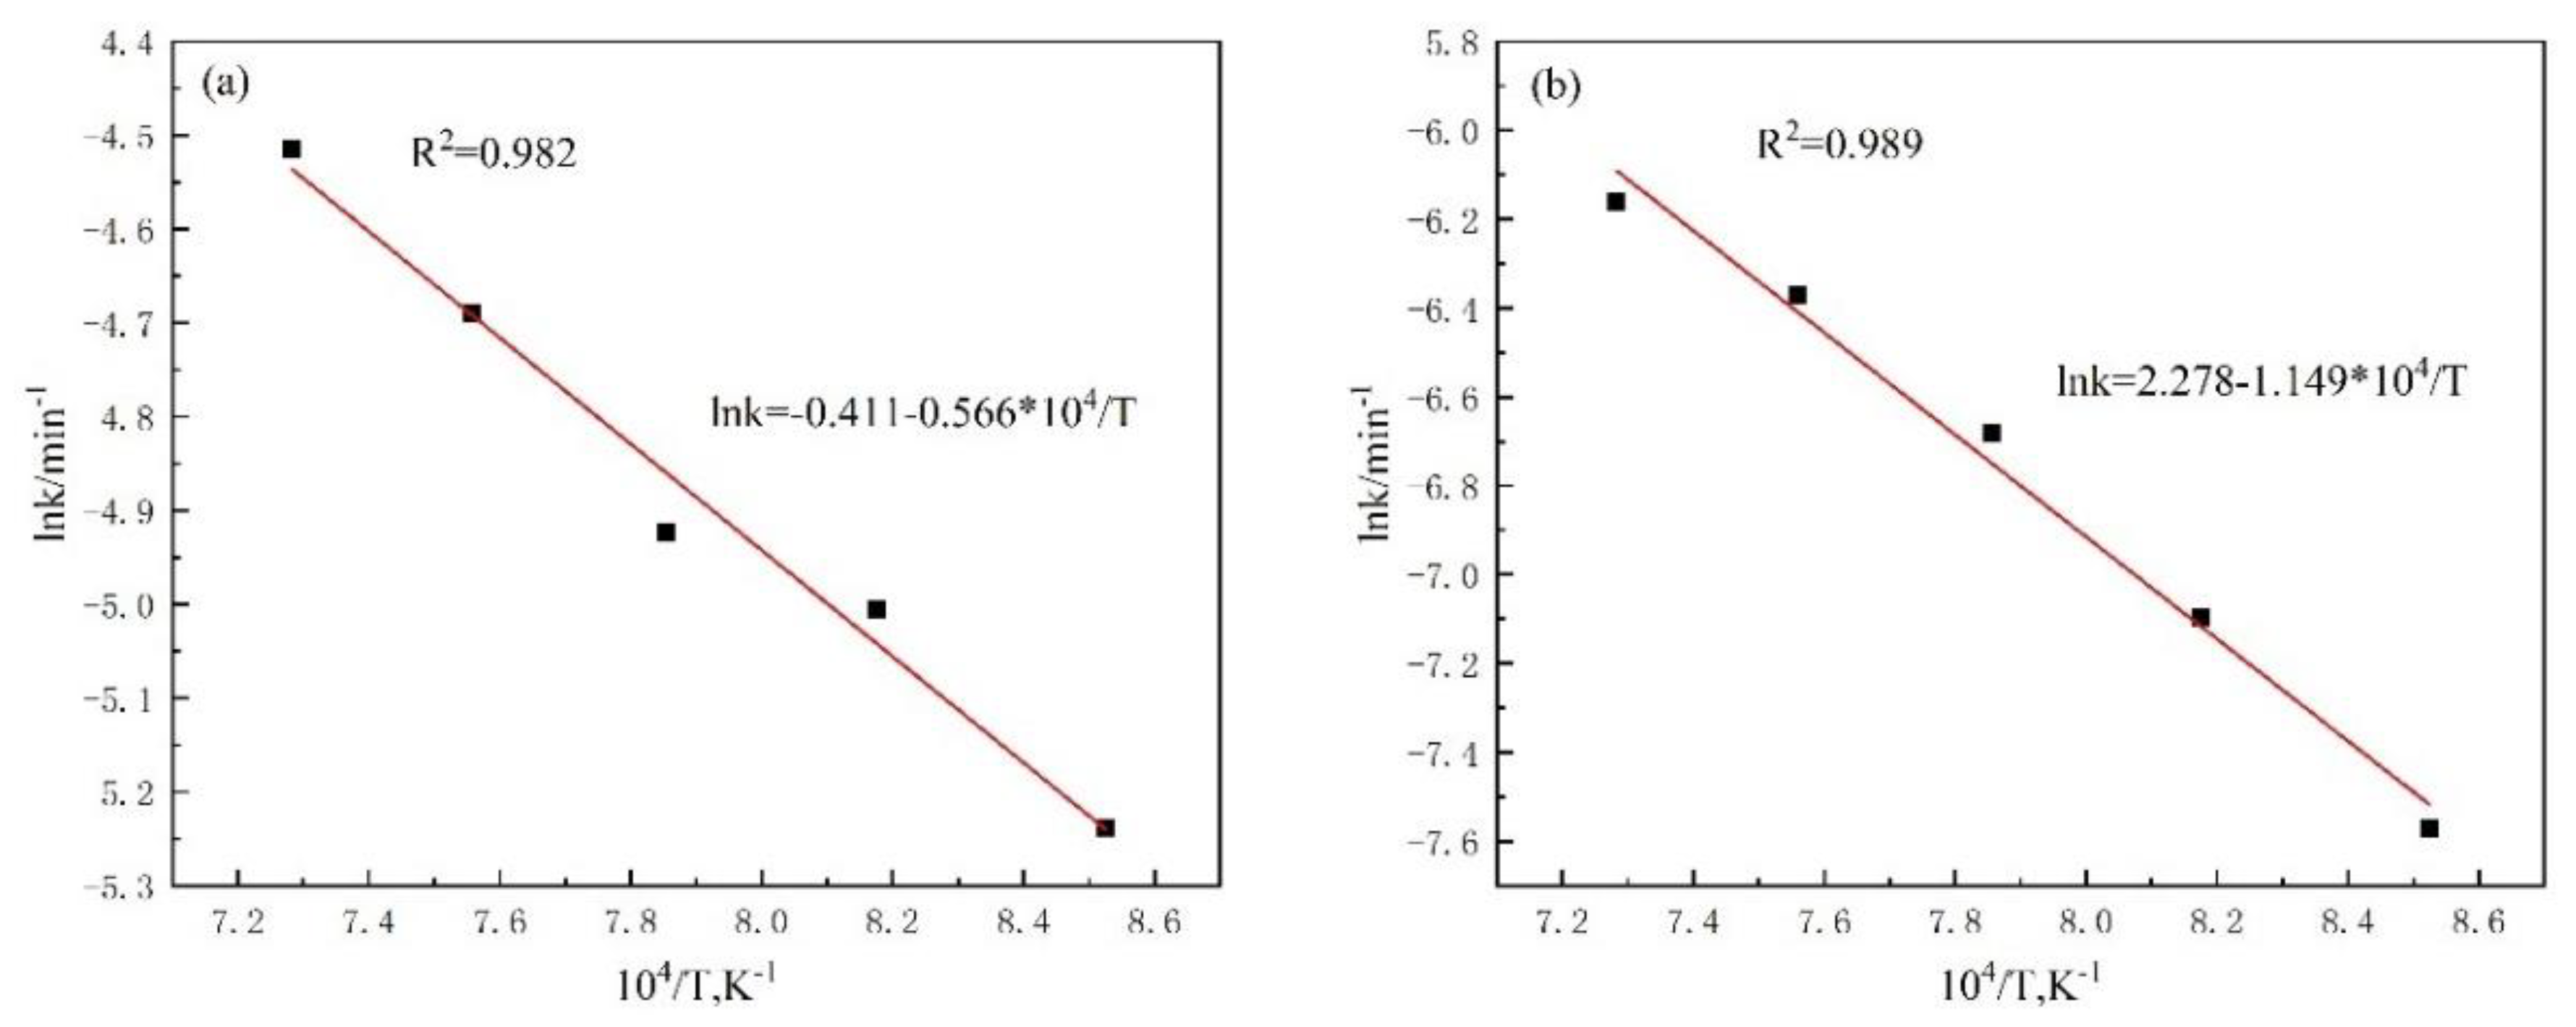
In line with the Arrhenius equation, the relationship between the gasification rate constant () and reaction temperature () is shown in Equation (7), in which k0 denotes the frequency factor and E the activation energy (units: kJ·mol−1):
Taking the natural logarithm of both sides in Equation (7),
A straight line can be yielded from the plot of versus 1/T, and the activation energy can be assessed from the slopes. Figure 4a,b presents the plots of vs 1/T. The data of Figure 4 and Equation (8) suggest that the activation energies of the intrinsic chemical reaction control stage and diffusion control stage are 47.06 and 95.53 kJ/mol, respectively. For the gasification of bituminous coal char, the activation energy value in the intrinsic chemical reaction control stage is lower than that in the diffusion control stage.
3.2. Effect of H2 on Char-H2O Gasification
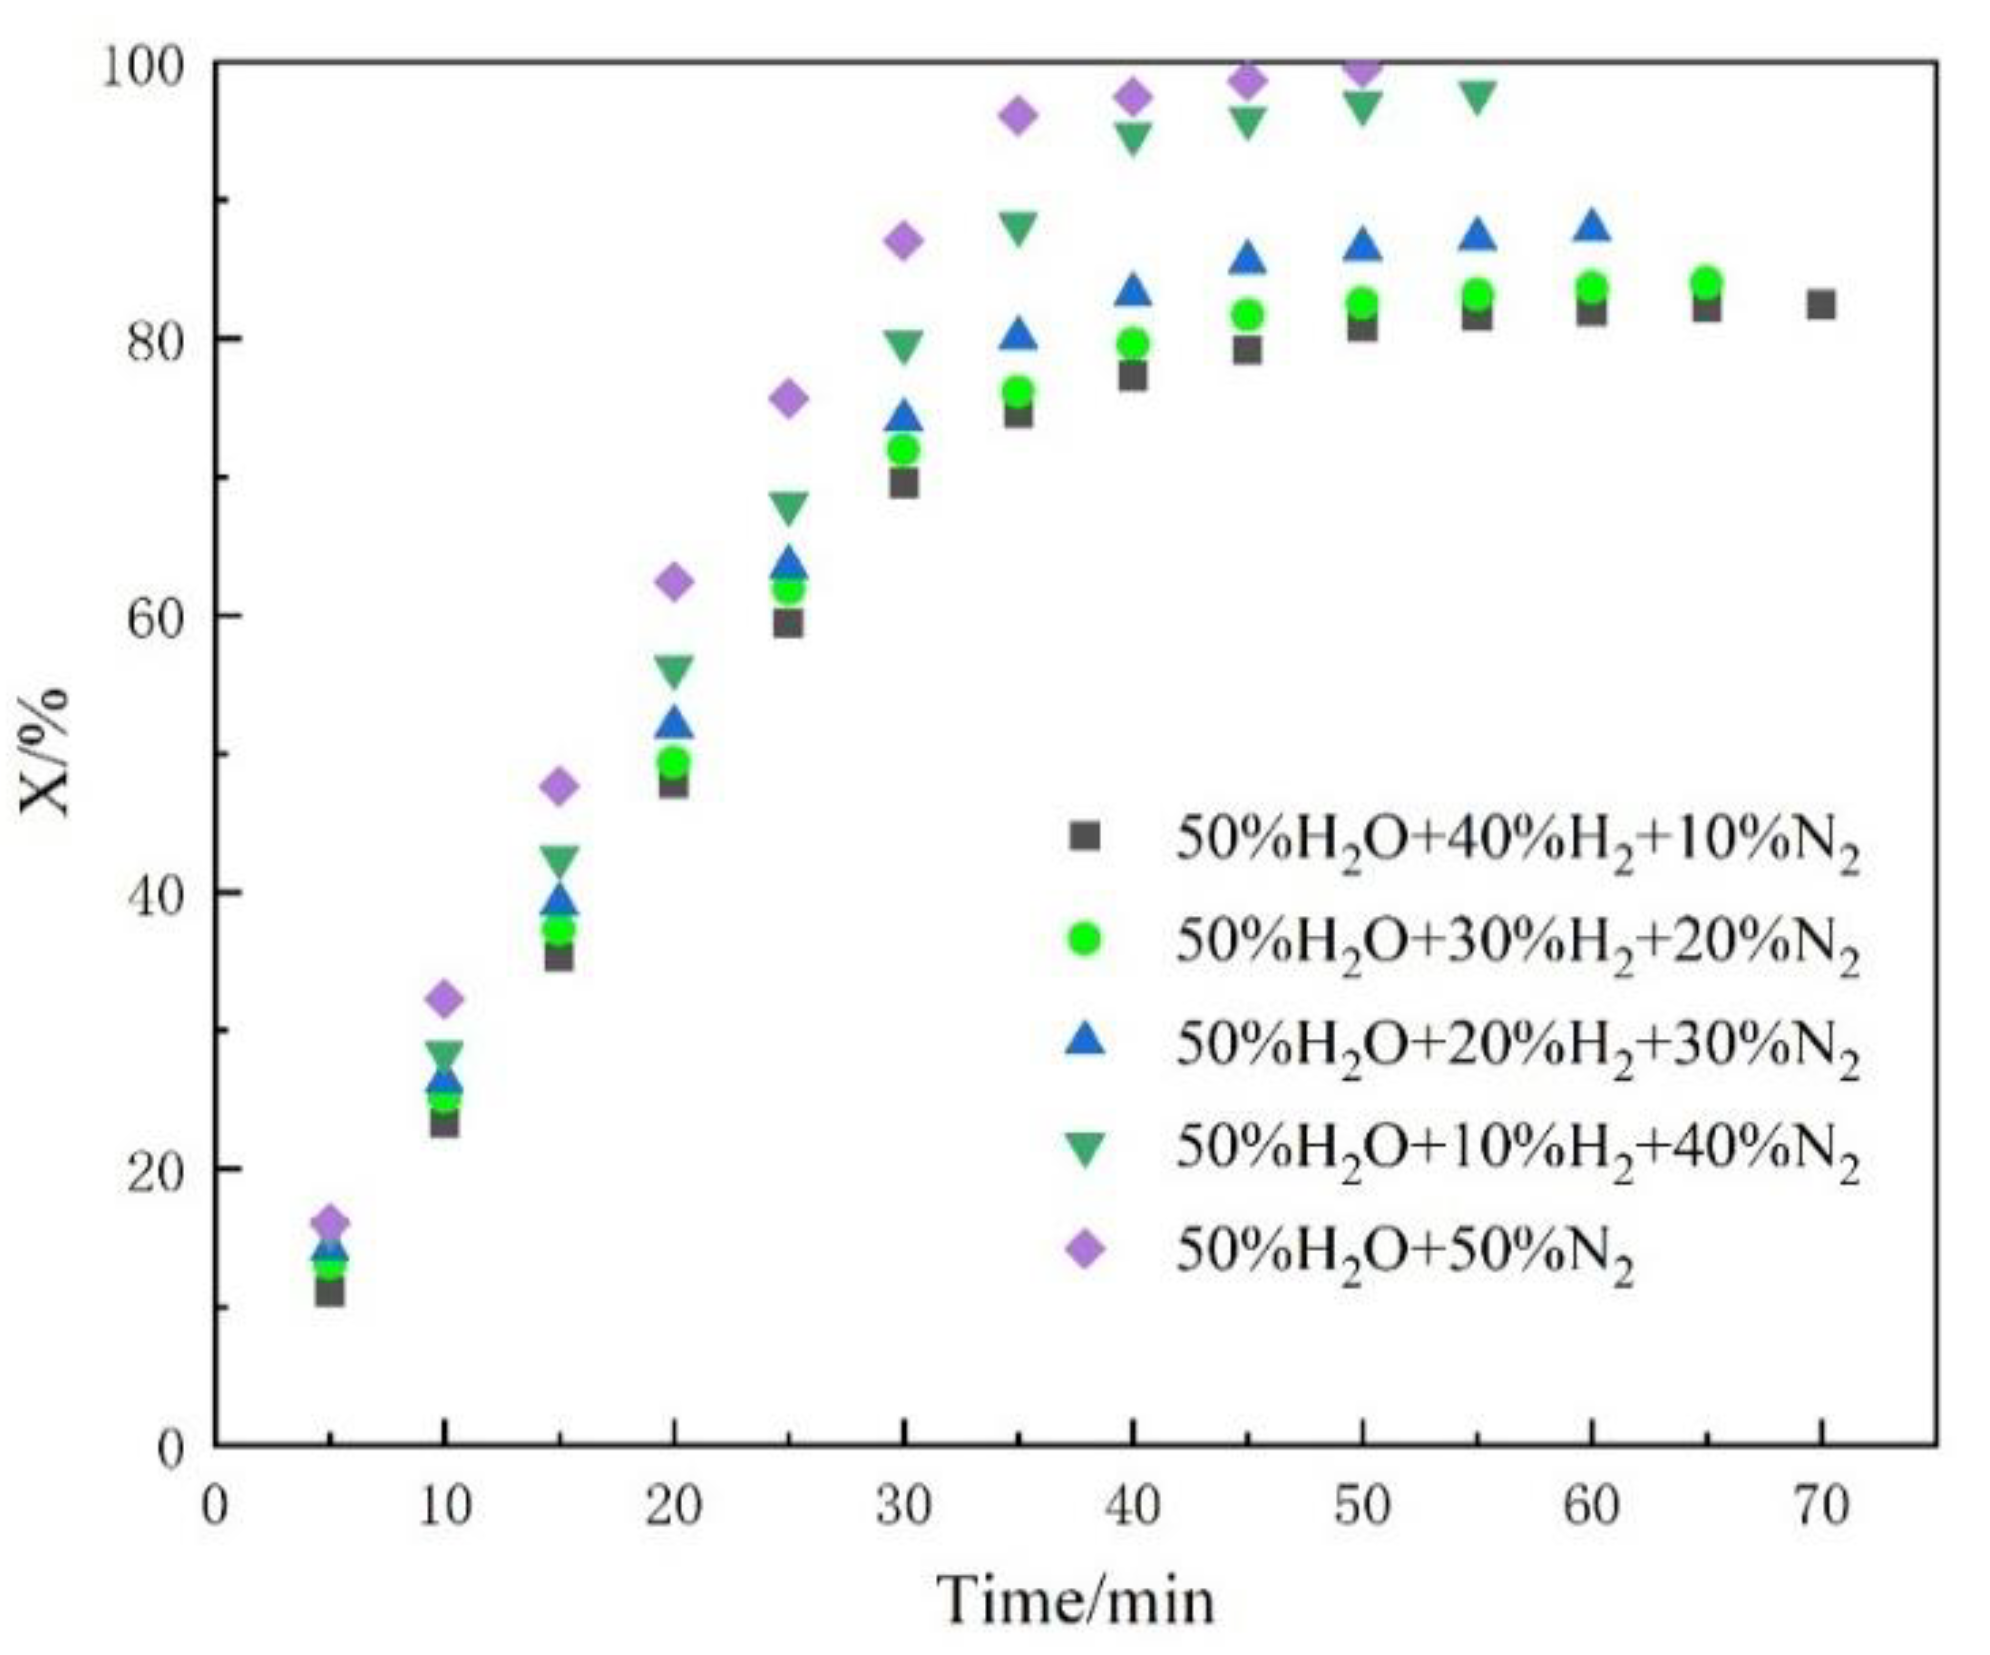
To investigate the effect of H2 on the gasification of bituminous coal char, experiments were carried out at 1273 K for 120 min with a gas flow of 8 L/min with different gas ratios of H2O, H2, and N2. The experimental conditions are listed in Table 4. The concentration of H2O was 50% and that of H2 varied from 0% to 40%. Figure 5 represents the carbon conversion degree versus time at 1273 K with various concentrations of H2. For gasifying under the concentration of 40% H2 for 30 min, the carbon conversion degree of bituminous coal char is only 69.54%. As the concentration of H2 decreased to zero, the carbon conversion degree of bituminous coal char increased to 87.06%. This indicates that the concentration of H2 can strongly influence the carbon conversion degree of bituminous coal char. It is also obvious that the gasification reaction rate is lower due to the presence of H2. As a result, the presence of H2 strongly inhibits the char-H2O gasification reaction.
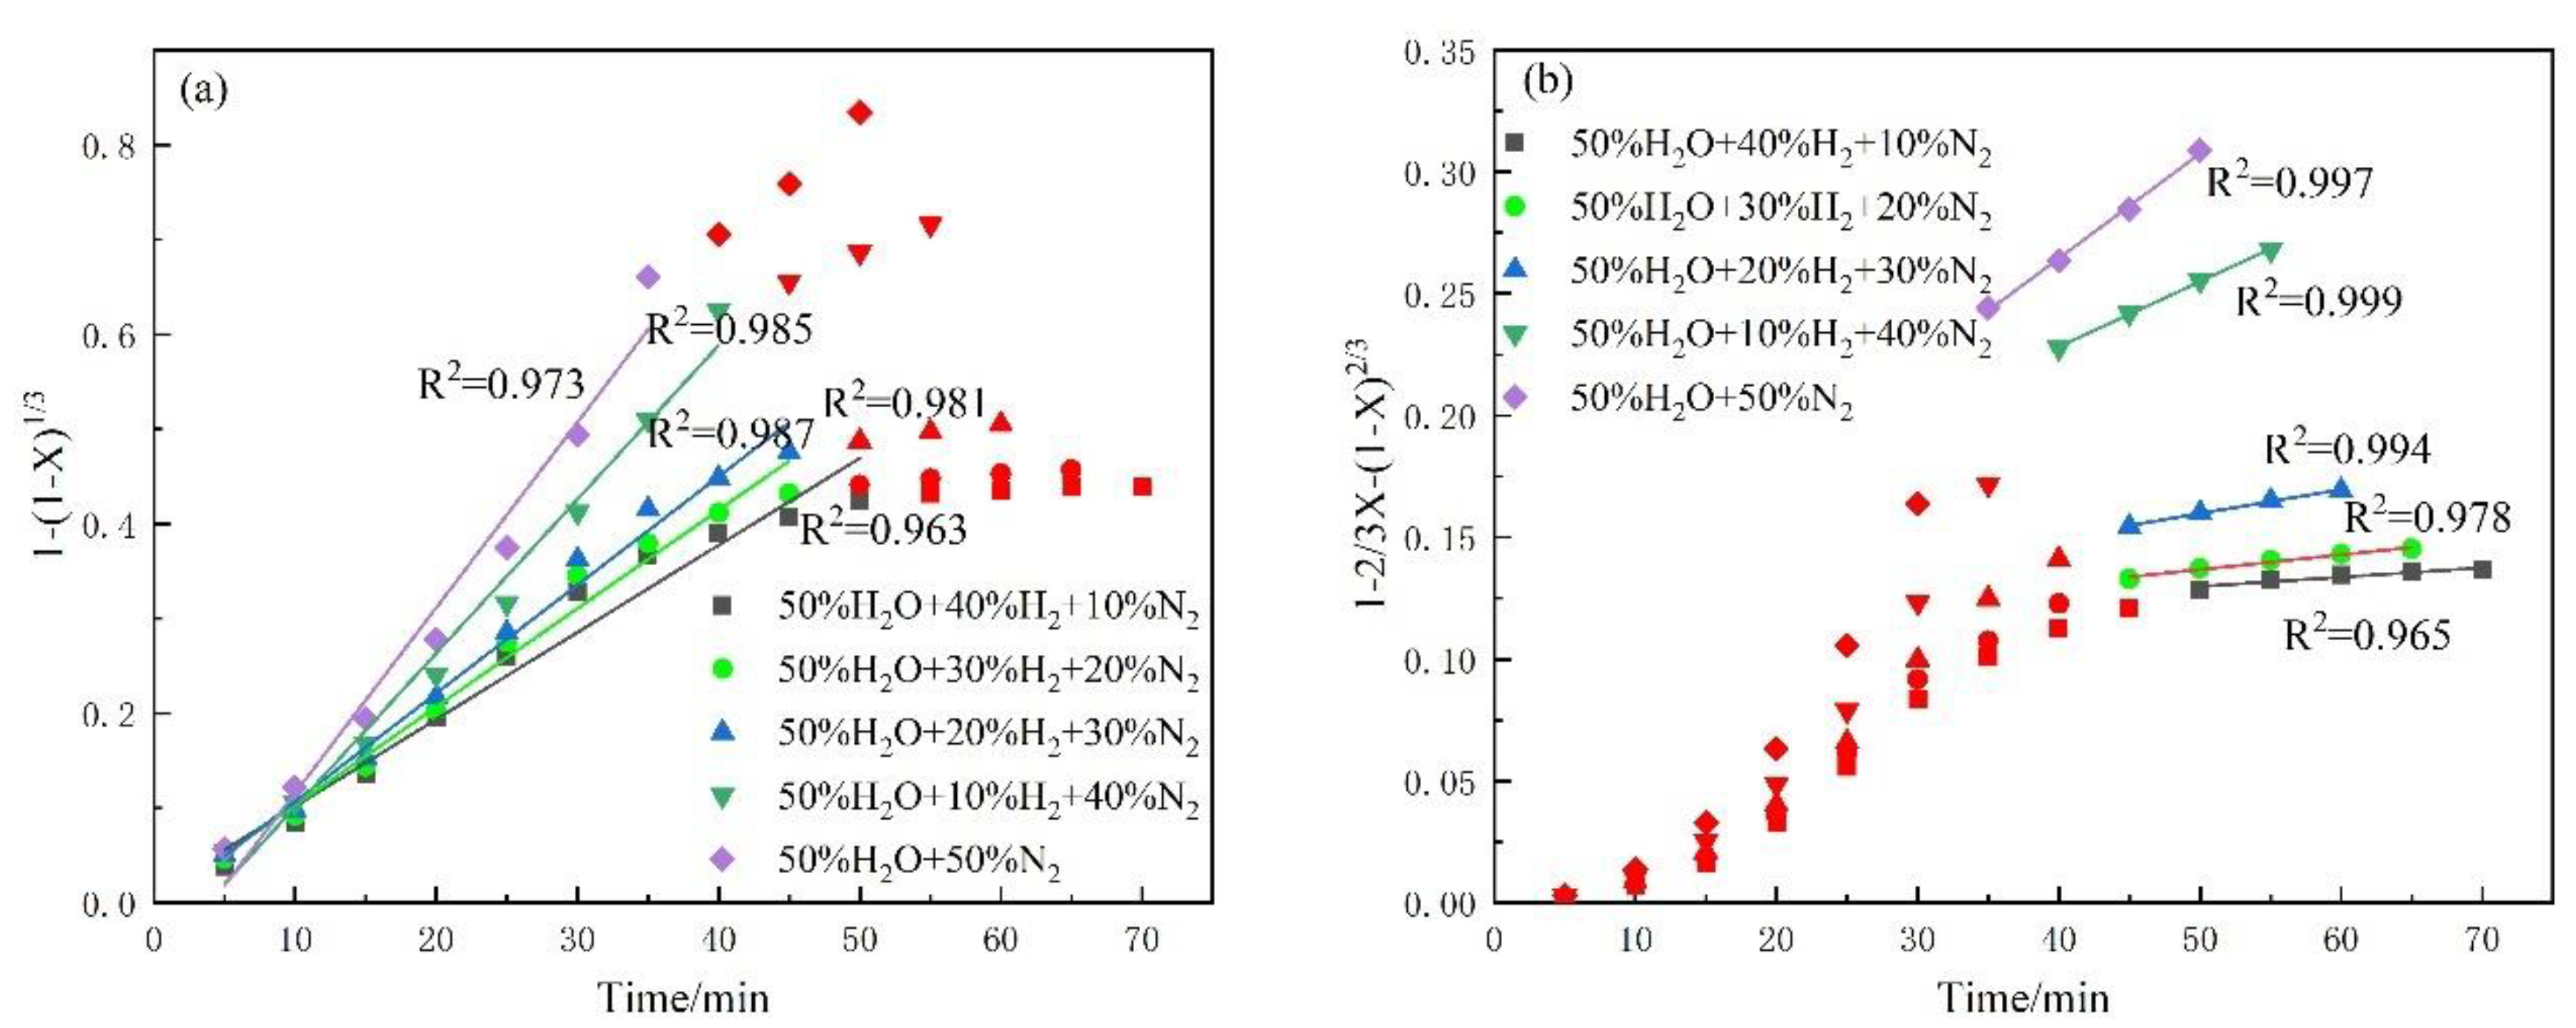
On the basis of Equations (3) and (4), the kinetic results of gasification are shown in Figure 6a,b. The figure clearly shows that there are also two stages in the gasification process: an early stage and a later stage. The correlation coefficients (R2) of the aforementioned straight lines are 0.963, 0.981, 0.987, 0.985, and 0.973, respectively, at the early stage, while they are 0.965, 0.978, 0.994, 0.999, and 0.997, respectively, at the later stage. Thus, these strong linear relationships indicate that the gasification processes of the early and later stages are controlled by the interface chemical reaction and diffusion, respectively. The values of the gasification rate constants of the two stages are presented in Table 5. The gasification rate constants of both the early and later stages increase with decreasing H2 concentration, indicating that a decreased H2 concentration can effectively improve the gasification process.
3.3. Effect of CO on Char-CO2 Gasification
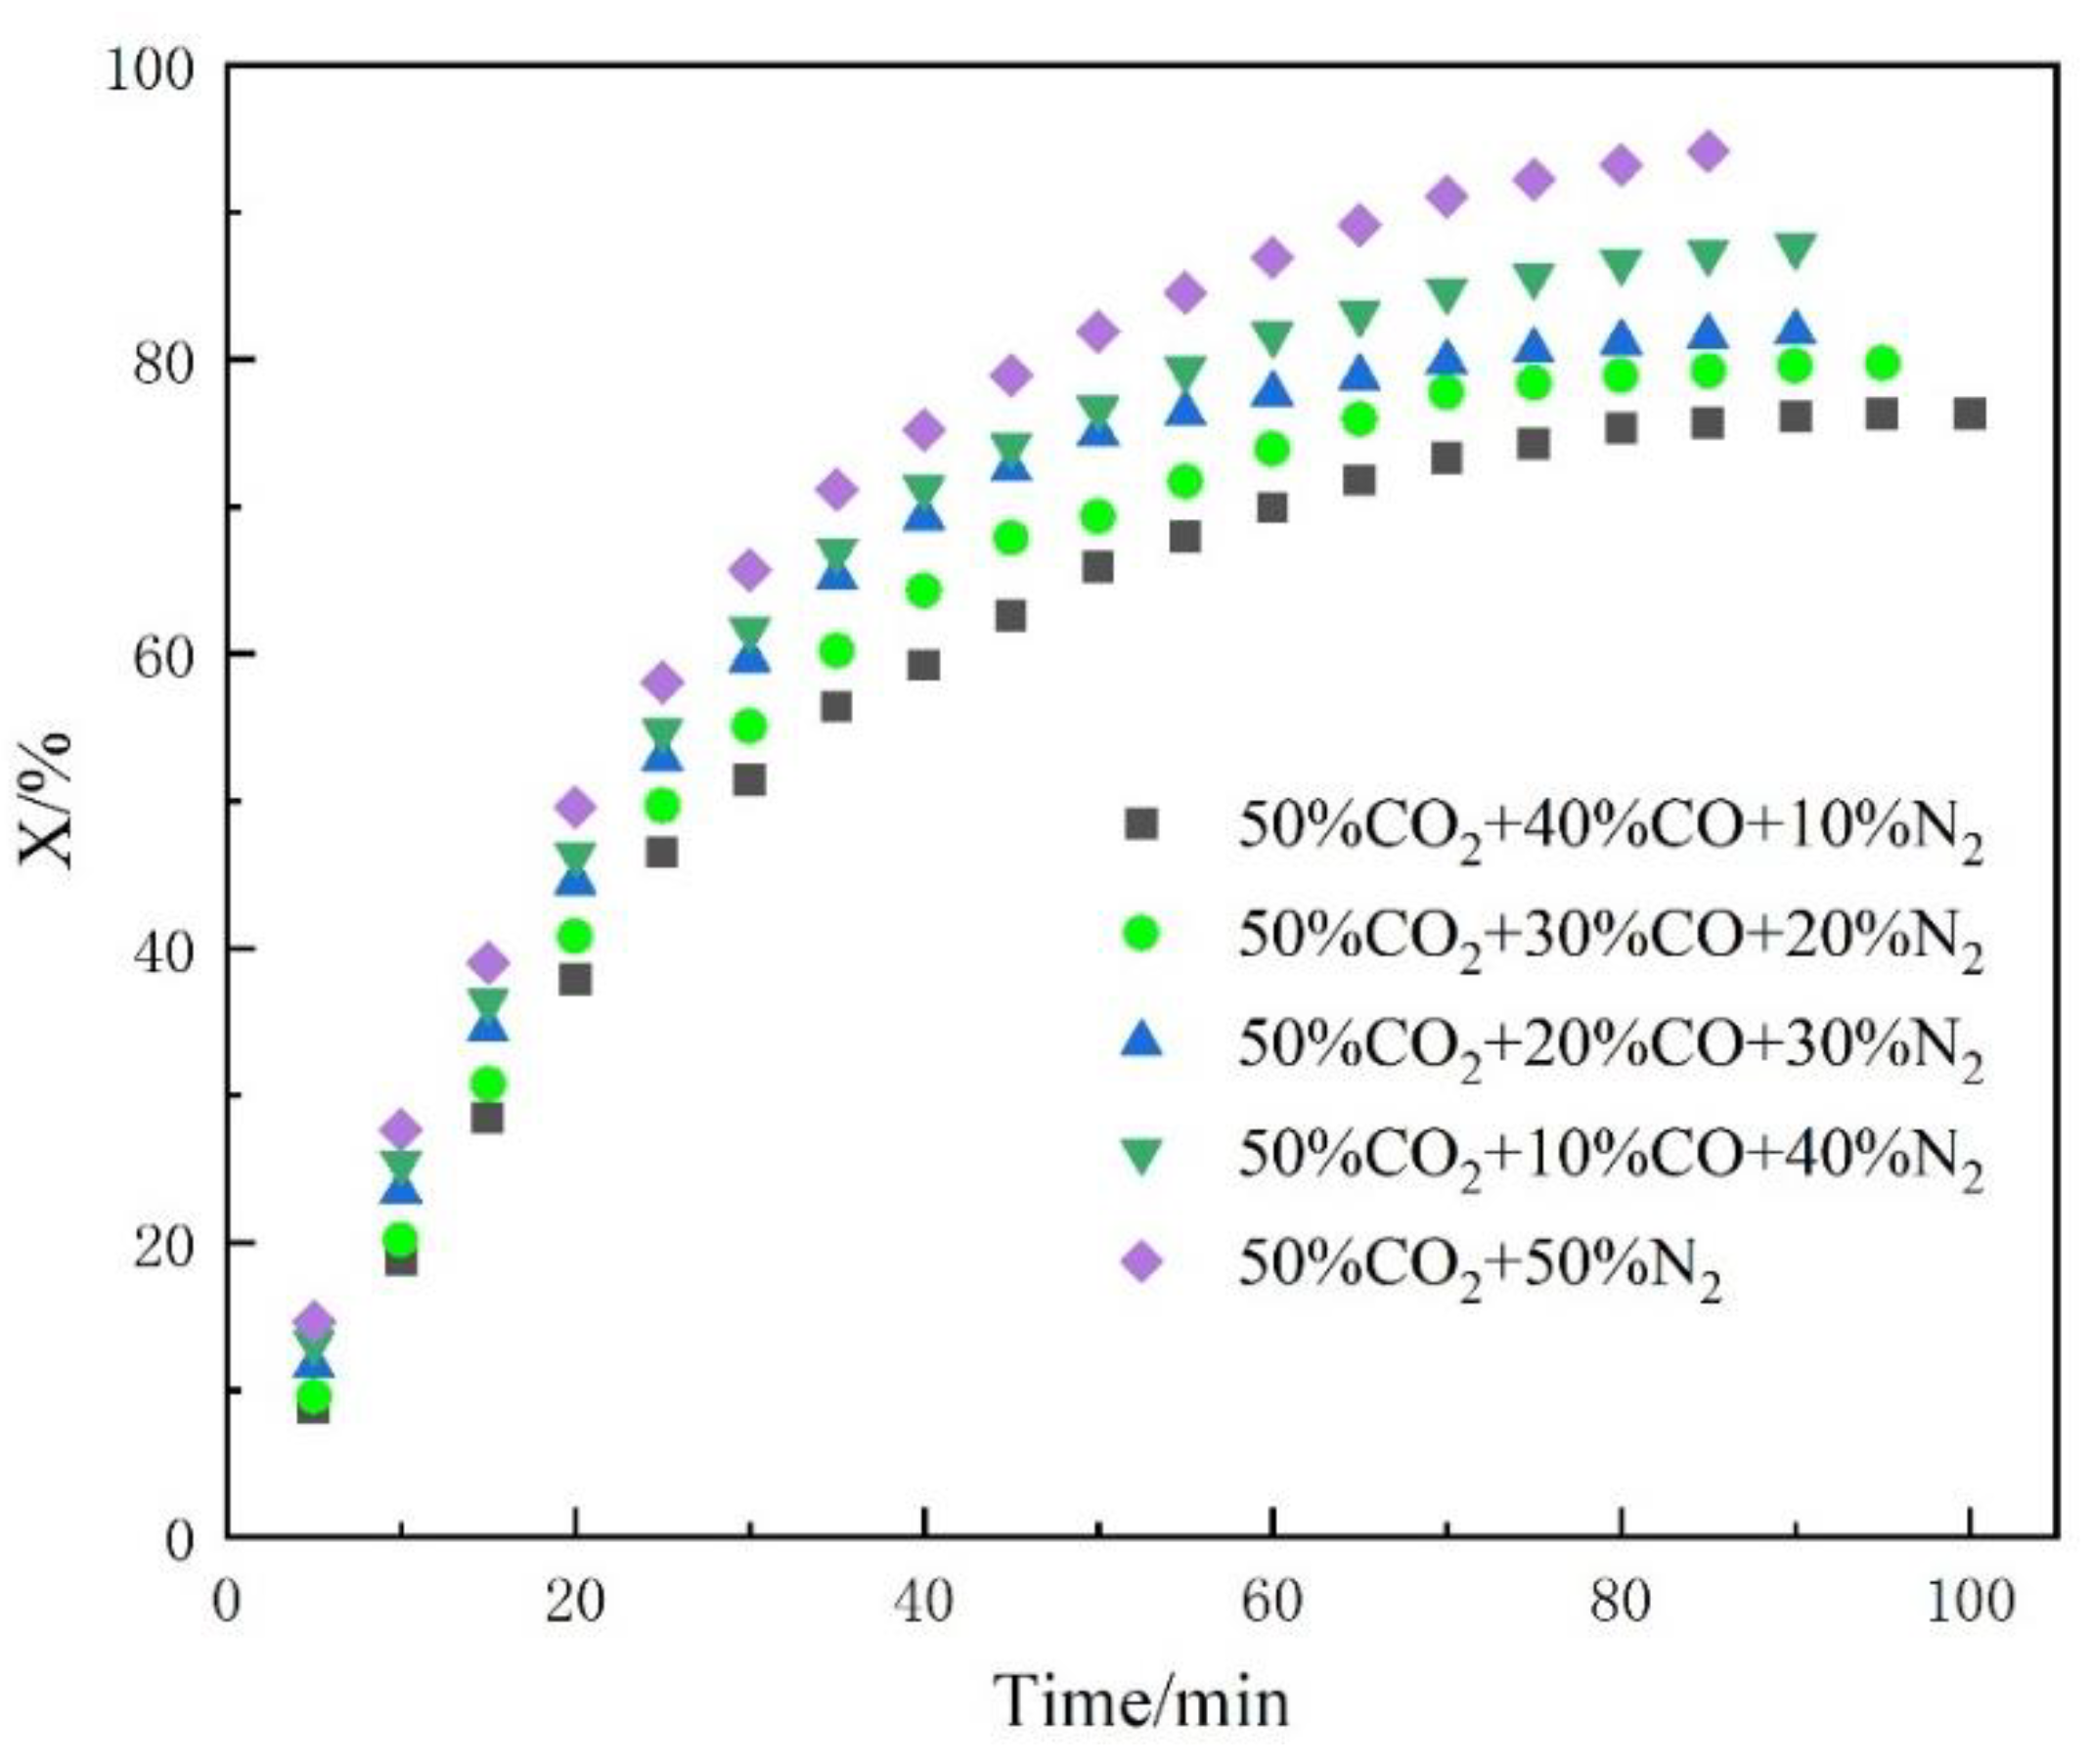
The char-CO2 reactions in the presence of CO were performed at 1273 K with varied concentrations of CO. The experimental arrangement is listed in Table 6 and the experimental results are shown in Figure 7. It can be seen that the carbon conversion degree of bituminous coal char gradually increased with reduction time. The carbon conversion degrees were 69.92%, 73.92%, 77.67%, 81.72%, and 86.93% for 60 min in the mixture of CO2, CO and N2 when the concentrations of CO were 40%, 30%, 20%, 10%, and 0%, respectively. It is obvious that the time for complete carbon conversion degree increased with increasing CO concentration, indicating that the inhibition effect of CO increases with CO concentration increases.
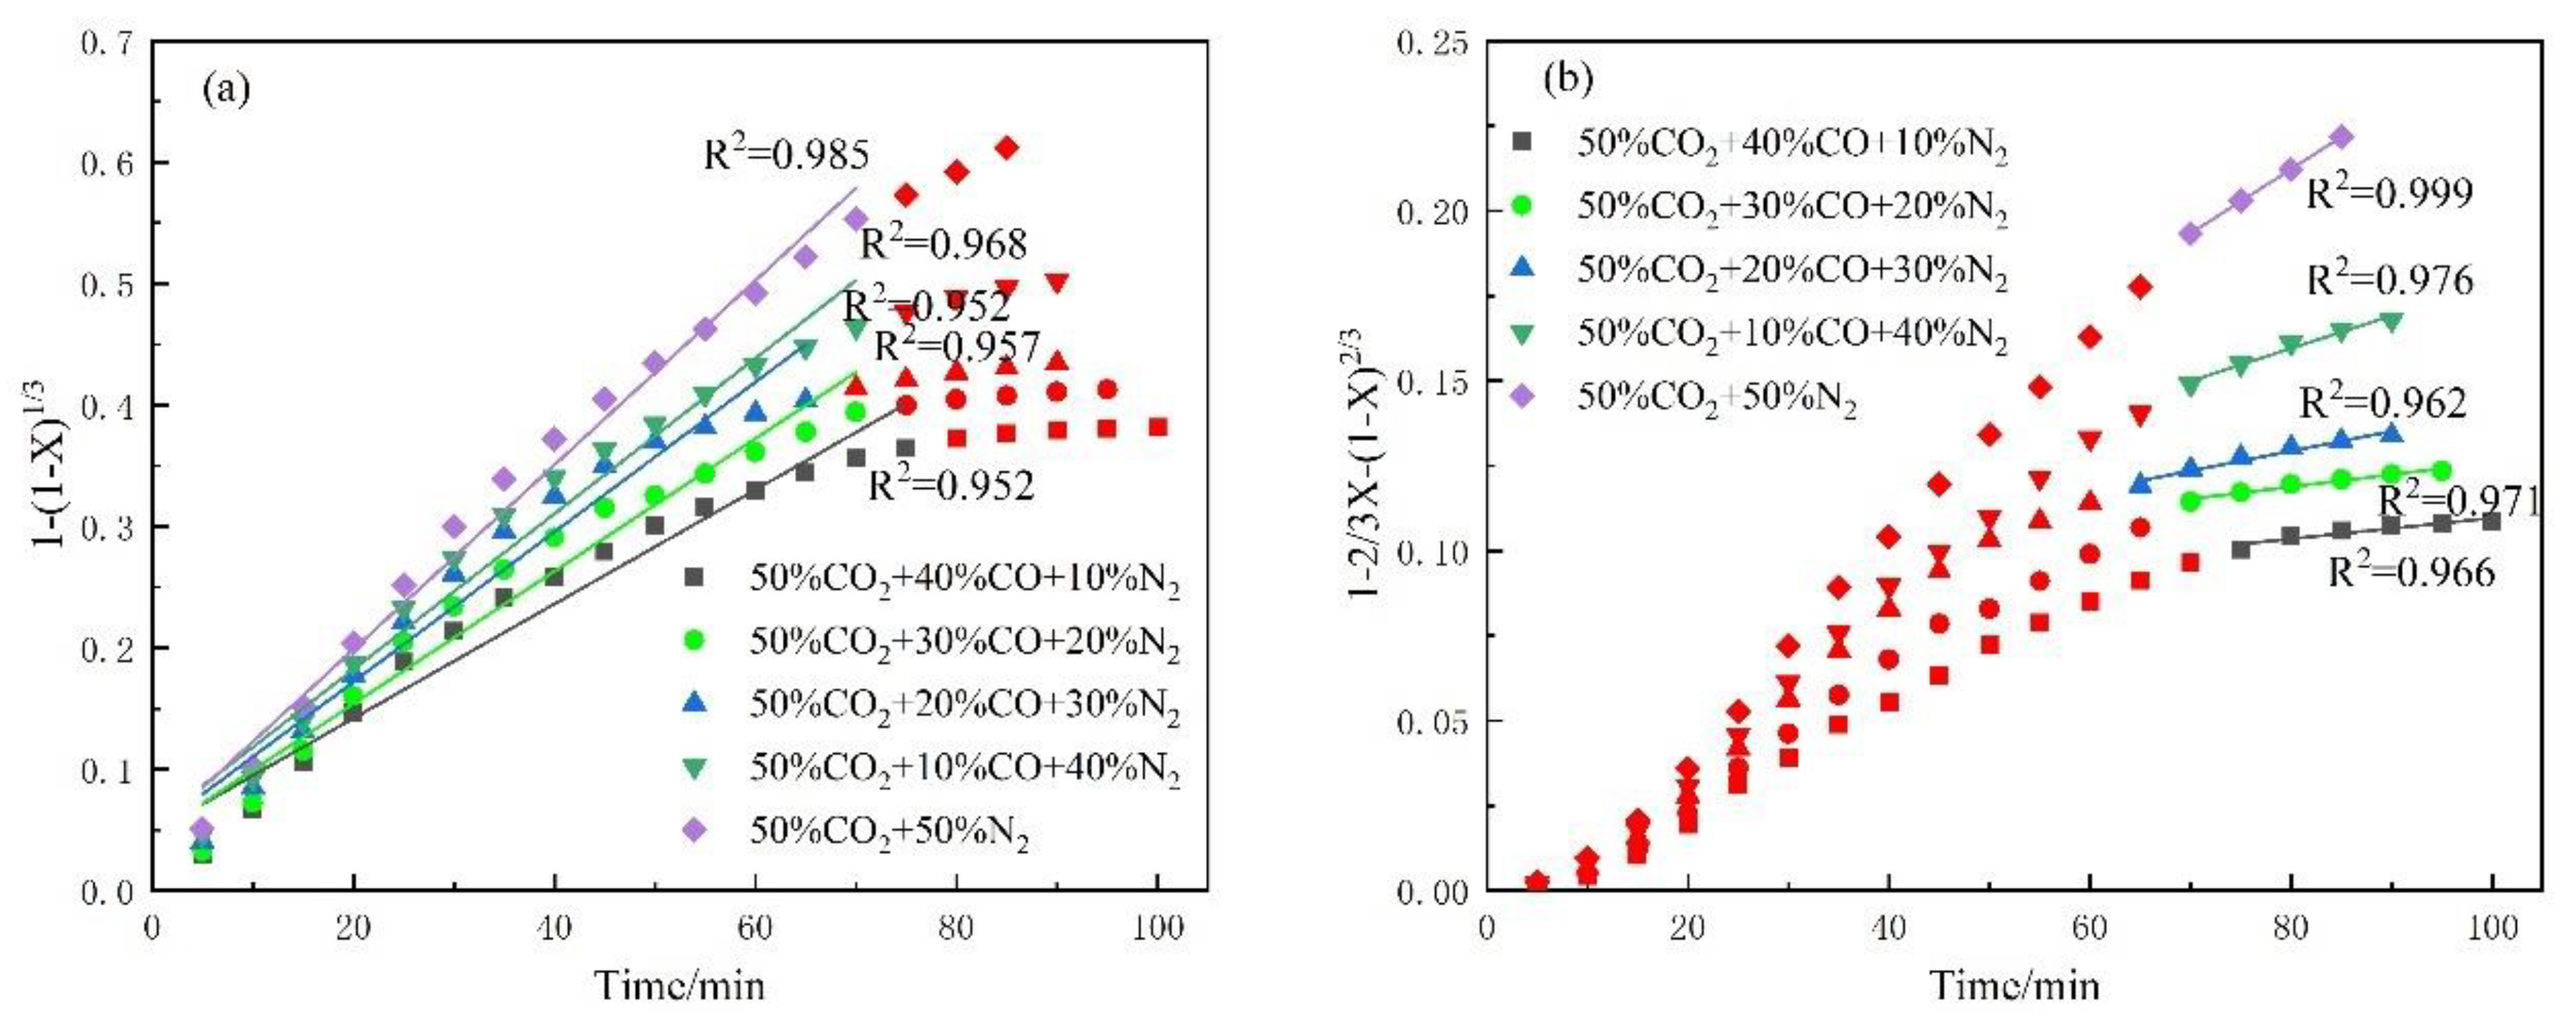
For the mixture of CO2, CO and N2 atmosphere, the curve versus time at the early stage also shows a better linear relationship—the straight lines’ correlation coefficients (R2) are 0.952, 0.957, 0.952, 0.968, and 0.985, respectively, as shown in Figure 8. Therefore, the initial gasification control step also comprises the interfacial chemical reactions. In the later stage of the gasification process, versus time shows quite a straight curve. Accordingly, diffusion controls the later stage of the gasification reaction. The values of the gasification rate constant are listed in Table 7, suggesting that the gasification rate constant increases with decreasing CO concentration. Accordingly, the gasification process can be improved by decreasing the proportion of CO.
3.4. Interactions by Char-H2O–CO2 in the Presence of H2 and CO
To investigate the effect of interactions by char-H2O-CO2 in the presence of H2 and CO on the gasification of bituminous coal char, experiments were carried out under a mixture of CO2, H2O, CO, H2, and N2 atmosphere at a gasification temperature of 1273 K with a gasification gas flow of 8 L/min. The experimental arrangement is given in Table 8. Figure 9 shows the impact of different proportions of CO2/H2O on the carbon conversion degree in the presence of H2 and CO. For gasification at the condition of CO2/H2O = 3/1 for 60 min, the carbon conversion degree of bituminous coal char is only 80.71%. When the ratio of CO2/H2O decreased to 1/3 for 60 min, the carbon conversion degree of bituminous coal char increased to 87.27%. It is thus found that the carbon conversion degree of bituminous coal char increases with a decreasing CO2/H2O ratio, revealing that the gasification ability of H2O is greater than that of CO2 at high temperatures. Moreover, when the ratios of CO2/H2O are 3/1 and 1/3, the part controlled by the chemical reaction step reaches 86.04% and 90.83%, respectively; that is, the diffusion-control step is remarkably shortened with a decreasing CO2/H2O ratio.
To determine the mechanisms of H2O’s shortened diffusion control step, SEM micrographs of bituminous coal char as well as its pore distribution were examined to detect the effect of gas type on the microstructure of bituminous coal char, as shown in Figure 10. Obviously, the structure of gasified coal char is looser than that of original coal char whether it was gasified in a CO2/H2O = 3/1 or CO2/H2O = 1/3 atmosphere: The pore-volume percentage of bituminous coal char was 11.96%, and it increased to 29.01% and 37.11% when coal char were gasified in a CO2/H2O = 3/1 and CO2/H2O = 1/3 atmosphere, respectively. Figure 10 (panels A and B) shows that coal char gasified in a CO2/H2O = 3/1 atmosphere has a tight grain structure with few channels in the grains, while that gasified in a CO2/H2O = 1/3 atmosphere has a loose structure with smaller pores in the coal char. As the pore-volume histogram also suggests, coal char gasified in a CO2/H2O = 1/3 atmosphere has a higher volume percentage of micropores (pore sizes of 0–5 and 5–10 μm) compared with those gasified in a CO2/H2O = 3/1 atmosphere. During gasification, micropores provide gas channels for gasification and decreased gas diffusion resistance. Moreover, as previous research has suggested, the molecular diameter of H2O is smaller than that of CO2, which may decrease gas diffusion resistance during gasification. Thus, gas diffusion resistance in the gasification process decreases when the CO2/H2O ratio decreases, which shortens the diffusion-control step.
4. Conclusions
Studies on bituminous coal char gasification were systematically carried out using a mixture of CO2, H2O, CO, H2, and N2 under isothermal conditions. The experimental results reveal that the carbon conversion degree increases significantly with increasing gasification temperature and gasification time, but also with decreasing H2 and CO concentration. In addition, the gasification process of bituminous coal char was successfully modeled as a shrinking unreacted core. As the kinetic studies suggest, an intrinsic chemical reaction controls the early stage of gasification, while the diffusion controls the gasification in the later stage. The activation energies for the gasification in the mixture of CO2, H2O, CO, H2, and N2 atmosphere are 47.06 and 95.53 kJ/mol for the early and later stages of gasification, respectively. The diffusion-control step was significantly shortened with a decreasing CO2/H2O ratio. SEM results show that the gasified bituminous coal char in CO2/H2O = 1/3 atmosphere has a large number of internal pores in the mineral particles. Its microstructure is looser than that of coal char gasified in CO2/H2O = 3/1 atmosphere. The inner bore reduces the gas diffusion resistance, thus shortening the process of diffusion control.
Author Contributions
Conceptualization, J.C.; Data curation, J.C. and Y.J.; Formal analysis, W.C.; Funding acquisition, X.W.; Investigation, J.C. and X.W.; Methodology, J.C.; Supervision, X.W.; Visualization, X.W.; Writing—original draft, J.C.; Writing—review & editing, W.C.
Funding
This research was funded by the ministry of land and resources public welfare industry research project, grant number 201511062-02.
Conflicts of Interest
The authors declare no conflict of interest.
References
- Duan, Y.; Li, N.; Mu, H.; Guo, S.S. Research on CO2 Emission Reduction Mechanism of China’s Iron and Steel Industry under Various Emission Reduction Policies. Energies 2017, 10, 2026. [Google Scholar] [CrossRef]
- Shen, F.; Bo, S.; Paulsson, K.; Kapilashrami, E.; Guo, W.; Chu, M.; Shen, Y. Industrial Practice of BiPCI Process of Pulverized Coal Injection for Blast Furnace Ironmaking at SSAB. Steel Res. Int. 2008, 79, 11–16. [Google Scholar] [CrossRef]
- Guo, Z.C.; Song, X.P.; Zhao, Y.H.; Duan, D.P. Preparation of direct reduction gas by combined gasification of coal-oxygen-water vapor-coke oven gas. Iron Steel 2003, 12, 56–61. [Google Scholar] [CrossRef]
- Duarte, P.E.; Becerra, J. Reducing greenhouse gas emissions with Energiron non-selective carbon-free emissions scheme. Stahl Und Eisen 2011, 131, S85–S86. [Google Scholar]
- Naito, M.; Takeda, K.; Matsui, Y. Ironmaking technology for the last 100 years: Deployment to advanced technologies form introduction of technological know-how, and evolution next-generation process. ISIJ Int. 2015, 55, 7–35. [Google Scholar] [CrossRef]
- Fernández-González, D.; Prazuch, J.; Ruiz-Bustinza, Í.; González-Gasca, C.; Piñuela-Noval, J.; Verdeja González, L. Iron Metallurgy via Concentrated Solar Energy. Metals 2018, 8, 873. [Google Scholar] [CrossRef]
- Hu, S.L.; Fu, S.H.; Gu, J.H. Comprehensive energy consumption analysis and control measures of tonnage steel of ma steel co. LTD. Met. Energy 2016, 35, 3–4. [Google Scholar] [CrossRef]
- Wang, Z.C.; Chen, S.Y.; Chu, M.S.; Liu, Z.G.; Zhang, J.W. Analysis of direct reduced iron production from coal gas-shaft furnace. China Met. 2013, 23, 20–25. [Google Scholar] [CrossRef]
- Fernández-González, D.; Ruiz-Bustinza, I.; Mochón, J.; González Gasca, C.; Verdeja, L.F. Iron Ore Sintering: Environment, Automatic, and Control Techniques. Miner. Process. Extr. Metall. Rev. 2017, 38, 238–249. [Google Scholar] [CrossRef]
- Neal, A.L.; Rosso, K.M.; Geesey, G.G.; Gorby, Y.A.; Little, B.J. Surface structure effects on direct reduction of iron oxides by Shewanella oneidensis. Geochim. Cosmochim. Acta 2003, 67, 4489–4503. [Google Scholar] [CrossRef]
- Parisi, D.R.; Laborde, M.A. Modeling of counter current moving bed gas-solid reactor used in direct reduction of iron ore. Chem. Eng. J. 2003, 104, 35–43. [Google Scholar] [CrossRef]
- Gong, F.Y.; Ye, T.Q.; Yuan, L.X.; Tao, K.; Torimoto, Y.; Yamamoto, M.; Li, Q.X. Direct reduction of iron oxides based on steam reforming of bio-oil: A highly efficient approach for production of DRI from bio-oil and iron ores. Green Chem. 2009, 11, 2001–2012. [Google Scholar] [CrossRef]
- Haruyasu, M.; Hidetoshi, T. Prospects for coal-based direct reduction process. Kobelco Technol. Rev. 2010, 29, 69–76. [Google Scholar]
- Huang, Z.C.; Yang, D.G.; Yi, L.Y. Effect of Thermal Charging of Iron Ore Pellets on the Reduction Rate and Compressive Strength in Gas-Based Reduction Process. Adv. Mater. Res. 2012, 532–533, 262–266. [Google Scholar] [CrossRef]
- Zervas, T.; Mcmullan, J.T.; Williams, B.C. Solid-based processes for the direct reduction of iron. Int. J. Energy Res. 1996, 20, 255–278. [Google Scholar] [CrossRef]
- Patel, S.K. Characteristics of indian non-coking coals and iron ore reduction by their chars for directly reduced iron production. Miner. Process. Extr. Metall. Rev. 2008, 29, 258–273. [Google Scholar] [CrossRef]
- Duan, T.H.; Lu, C.P.; Xiong, S.; Fu, Z.B.; Chen, Y.Z. Pyrolysis and gasification modelling of underground coal gasification and the optimisation of CO2 as a gasification agent. Fuel 2016, 183, 557–567. [Google Scholar] [CrossRef]
- Arumugam, S.; Thien, B.; Annamalai, K.; Sweeten, J. Feedlot Biomass Co-firing: A Renewable Energy Alternative for Coal-fired Utilities. Int. J. Green Energy 2005, 2, 409–419. [Google Scholar] [CrossRef]
- Wang, C.; Yan, J.Y. Feasibility Analysis of Wood Pellets Production and Utilization in China as a Substitute for Coal. Int. J. Green Energy 2005, 2, 91–107. [Google Scholar] [CrossRef]
- Dai, Z.; Gong, X.; Guo, X.; Liu, H.; Wang, F.; Yu, Z. Pilot-trial and modeling of a new type of pressurized entrained-flow pulverized coal gasification technology. Fuel 2008, 87, 2304–2313. [Google Scholar] [CrossRef]
- Bhatia, S.K.; Perlmutter, D.D. A random pore model for fluid-solid reactions: I. Isothermal, kinetic control. AIChE J. 1980, 26, 379–385. [Google Scholar] [CrossRef]
- Bhatia, S.K.; Perlmutter, D.D. A random pore model for fluid-solid reactions: II. Diffusion and transport effects. AIChE J. 1981, 27, 247–254. [Google Scholar] [CrossRef]
- Gavals, G.R. A random capillary model with application to char gasification at chemically controlled rates. AIChE J. 1980, 26, 577–585. [Google Scholar] [CrossRef]
- Wen, C.Y. Noncatalytic Heterogeneous Solid-Fluid Reaction Models. Ind. Eng. Chem. 1968, 60, 34–54. [Google Scholar] [CrossRef]
- Bliek, A.; Lont, J.C.; Van Swaaij, W.P.M. Gasification of coal-derived chars in synthesis gas mixtures under intraparticle mass-transfer-controlled conditions. Chem. Eng. Sci. 1986, 41, 1895–1909. [Google Scholar] [CrossRef]
- Kirtania, K.; Joshua, J.; Kassim, M.A.; Bhattacharya, S. Comparison of CO2 and steam gasification reactivity of algal and woody biomass chars. Fuel Process. Technol. 2014, 117, 44–52. [Google Scholar] [CrossRef]
- Ren, L.; Yang, J.; Gao, F.; Yan, J. Laboratory study on gasification reactivity of coals and pet cokes in CO2/steam at high temperatures. Energy Fuels 2013, 27, 5054–5068. [Google Scholar] [CrossRef]
- Jayaraman, K.; Gökalp, I.; Jeyakumar, S. Estimation of synergetic effects of CO2 in high ash coal-char steam gasification. Appl. Therm. Eng. 2017, 110, 991–998. [Google Scholar] [CrossRef]
Figure 1.
Schematic of gasification system.

Figure 2.
Isothermal gasification curves of bituminous coal char in the temperature range 1173–1373 K with intervals of 50 K in the mixture of CO2, H2O, CO, H2, and N2 atmosphere.
Figure 2.
Isothermal gasification curves of bituminous coal char in the temperature range 1173–1373 K with intervals of 50 K in the mixture of CO2, H2O, CO, H2, and N2 atmosphere.

Figure 3.
Plots of (a)
vs time and (b) vs time at 1173–1373 K in the mixture of CO2, H2O, CO, H2, and N2 atmosphere.
Figure 3.
Plots of (a)
vs time and (b) vs time at 1173–1373 K in the mixture of CO2, H2O, CO, H2, and N2 atmosphere.

Figure 4.
Arrhenius plots of gasification rate constant vs temperature: (a) intrinsic chemical reaction control step and (b) diffusion control step.
Figure 4.
Arrhenius plots of gasification rate constant vs temperature: (a) intrinsic chemical reaction control step and (b) diffusion control step.

Figure 5.
Carbon conversion degree curves of bituminous coal char at 1273 K in the mixture of H2O, H2 and N2.
Figure 5.
Carbon conversion degree curves of bituminous coal char at 1273 K in the mixture of H2O, H2 and N2.

Figure 6.
Plots of (a)
vs time and (b) vs time with various concentrations of H2 at 1273 K.

Figure 7.
Carbon conversion degree curves of bituminous coal char at 1273 K in the mixture of CO2, CO and N2.
Figure 7.
Carbon conversion degree curves of bituminous coal char at 1273 K in the mixture of CO2, CO and N2.

Figure 8.
Plots of (a)
vs time and (b) vs time with various concentrations of CO at 1273 K.

Figure 9.
Plots of (a)
vs time and (b) vs time in different proportions of CO2/H2O at 1273 K.

Figure 10.
SEM images of samples: (a) O, bituminous coal char; (b) A, bituminous coal char gasified in CO2/H2O=3/1 atmosphere; (c) B, bituminous coal char gasified in CO2/H2O = 1/3 atmosphere and (d) pore volume histogram.
Figure 10.
SEM images of samples: (a) O, bituminous coal char; (b) A, bituminous coal char gasified in CO2/H2O=3/1 atmosphere; (c) B, bituminous coal char gasified in CO2/H2O = 1/3 atmosphere and (d) pore volume histogram.


Table 1.
Proximate and ultimate analyses of Ordos bituminous coal.
| Proximate Analysis (wt.%, air-dried) | Ultimate Analysis (wt.%, air-dried) | |||||||
|---|---|---|---|---|---|---|---|---|
| Moisture | Ash | Volatile matter | Fixed carbon | C | H | N | S | O |
| 5.62 | 22.18 | 24.11 | 48.09 | 64.11 | 3.89 | 0.82 | 0.18 | 15.92 |
Table 2.
Proximate and ultimate analyses of bituminous coal char.
| Proximate Analysis (wt.%, air-dried) | Ultimate Analysis (wt.%, air-dried) | |||||||
|---|---|---|---|---|---|---|---|---|
| Moisture | Ash | Volatile matter | Fixed carbon | C | H | N | S | O |
| 1.42 | 24.98 | 1.09 | 72.52 | 76.47 | 0.517 | 0.322 | 0.13 | 3.241 |
Table 3.
Values of gasification rate constant at 1173–1373 K in the mixture of CO2, H2O, CO, H2, and N2 atmosphere.
Table 3.
Values of gasification rate constant at 1173–1373 K in the mixture of CO2, H2O, CO, H2, and N2 atmosphere.
| Temperature (K) | 1173 | 1223 | 1273 | 1323 | 1373 |
|---|---|---|---|---|---|
| Intrinsic chemical reaction control | 0.00531 | 0.0067 | 0.00728 | 0.00919 | 0.01094 |
| Diffusion control | 5.15 × 10⁻⁴ | 8.27 × 10⁻⁴ | 1.69 × 10⁻³ | 1.71 × 10⁻³ | 2.11 × 10⁻³ |
Table 4.
Experimental arrangement of bituminous char gasification in the mixture of H2O, H2, and N2.
Table 4.
Experimental arrangement of bituminous char gasification in the mixture of H2O, H2, and N2.
| Experimental No. | H2O (%) | H2 (%) | N2 (%) |
|---|---|---|---|
| 1 | 50 | 40 | 10 |
| 2 | 50 | 30 | 20 |
| 3 | 50 | 20 | 30 |
| 4 | 50 | 10 | 40 |
| 5 | 50 | 0 | 50 |
Table 5.
Values of gasification rate constant with various concentrations of H2 at 1273 K.
| H2 Concentration (%) | 40 | 30 | 20 | 10 | 0 |
|---|---|---|---|---|---|
| Intrinsic chemical reaction control | 0.00918 | 0.01038 | 0.01143 | 0.01624 | 0.01956 |
| Diffusion control | 3.82 × 10⁻⁴ | 6.09 × 10⁻⁴ | 9.85 × 10⁻⁴ | 0.00268 | 0.0043 |
Table 6.
Experimental arrangement of bituminous char gasification in the mixture of CO2, CO and N2.
| Experimental No. | CO2 (%) | CO (%) | N2 (%) |
|---|---|---|---|
| 6 | 50 | 40 | 10 |
| 7 | 50 | 30 | 20 |
| 8 | 50 | 20 | 30 |
| 9 | 50 | 10 | 40 |
| 10 | 50 | 0 | 50 |
Table 7.
Values of gasification rate constant with various concentrations of CO at 1273 K.
| CO Concentration (%) | 40 | 30 | 20 | 10 | 0 |
|---|---|---|---|---|---|
| Intrinsic chemical reaction control | 0.00471 | 0.00546 | 0.00617 | 0.00641 | 0.0076 |
| Diffusion control | 3.05 × 10⁻⁴ | 3.59 × 10⁻⁴ | 5.81 × 10⁻⁴ | 9.61 × 10⁻⁴ | 0.00189 |
Table 8.
Experimental arrangement of bituminous char gasification in the mixture of CO2, H2O, CO, H2, and N2.
Table 8.
Experimental arrangement of bituminous char gasification in the mixture of CO2, H2O, CO, H2, and N2.
| Experimental No. | CO2 (L/min) | H2O (L/min) | CO (L/min) | H2 (L/min) | N2 (L/min) |
|---|---|---|---|---|---|
| 11 | 3 | 1 | 1.5 | 1.5 | 1 |
| 12 | 1 | 3 | 1.5 | 1.5 | 1 |
© 2019 by the authors. Licensee MDPI, Basel, Switzerland. This article is an open access article distributed under the terms and conditions of the Creative Commons Attribution (CC BY) license (http://creativecommons.org/licenses/by/4.0/).
Share and Cite
MDPI and ACS Style
Chen, J.; Chen, W.; Jiao, Y.; Wang, X. Gasification Kinetics of Bituminous Coal Char in the Mixture of CO2, H2O, CO, and H2. Energies 2019, 12, 496. https://doi.org/10.3390/en12030496
AMA Style
Chen J, Chen W, Jiao Y, Wang X. Gasification Kinetics of Bituminous Coal Char in the Mixture of CO2, H2O, CO, and H2. Energies. 2019; 12(3):496. https://doi.org/10.3390/en12030496
Chicago/Turabian StyleChen, Junwei, Weibin Chen, Yang Jiao, and Xidong Wang. 2019. "Gasification Kinetics of Bituminous Coal Char in the Mixture of CO2, H2O, CO, and H2" Energies 12, no. 3: 496. https://doi.org/10.3390/en12030496
Note that from the first issue of 2016, this journal uses article numbers instead of page numbers. See further details here.