Influence on CO and PM Emissions of an Innovative Burner Pot for Pellet Stoves: An Experimental Study


1
Dipartimento di Ingegneria Meccanica ed Industriale, Università degli Studi di Brescia, via Branze 38, 25123 Brescia, Italy
2
AICO S.p.A., Via Kupfer 31, Palazzolo sull’Oglio, 25036 Brescia, Italy
*
Author to whom correspondence should be addressed.
Energies 2019, 12(4), 590; https://doi.org/10.3390/en12040590
Submission received: 10 December 2018
/
Revised: 28 January 2019
/
Accepted: 4 February 2019
/
Published: 13 February 2019
(This article belongs to the Special Issue Sustainable Energy Systems)
Abstract
:In this study, an extensive set of experiments has been performed to investigate how the emissions of carbon monoxide (CO) and particulate matter (PM) from wood pellet combustion are correlated with the different layout of air inlets in the two burner pots of pellet stoves. In particular, emissions generated using a “traditional” burner pot are compared with those produced with an innovative one. Tests were carried out on four pellet stoves (8–11 kW burning power). Tests show that CO emissions can be reduced close to zero using the innovative burner pot. PM emissions are also reduced, but not as much as those of CO. This phenomenon is explained assuming that CO reduction implies a reduction of the organic part of PM, but not of the inorganic matter. Experiments also show an apparent dependence of PM release on the time from ignition for both burner pot models: PM emissions increase and the color of PM deposited on filters varies over a wide range. It is argued that this effect is due to ash accumulation on the bottom of the burner pot and to its interaction with the primary air stream that flows over it.
1. Introduction
Presently, concern about greenhouse gas production caused by the intense exploitation of fossil fuels is shifting interest towards biomass fuels which are nominally carbon-neutral. Unfortunately, a poor exploitation of biomass can cause a significant generation of pollutants and particle emissions. It is generally acknowledged that aerosols are the cause of many diseases and premature death [1,2], hence the problem of reducing aerosols produced by biomass-fueled appliances is receiving increasing attention, and limits of emissions in international and national regulations are becoming more restrictive. Within the framework set by the EU Ecodesign Directive [3], for example, the limit of PM emission for pellet stoves has been fixed to 20 mg/Nm. This value will be enforced starting on 1 January 2022. In Italy, the public subsidies given to substitute an old heating appliance with a more efficient one are defined by “Conto Termico 2.0” [4], and are based on a classification that considers PM emissions: for example, the upper limit for the best class is 15 mg/Nm for pellet stoves and 10 mg/Nm for pellet boilers. Consequently, most pellet stove manufacturers are actively engaged in the development of low-emission appliances.
An overview on emissions due to biomass combustion can be found in several papers [5,6,7,8,9]. The flue gases downstream of an ideal combustion are nitrogen (N), oxygen (O), carbon dioxide (CO) and water vapor (HO), but in real combustion conditions other components are present besides particulate matter (PM): carbon monoxide (CO), nitrogen oxides (NO and NO), hydrogen (H), hydrocarbons (HC), polycyclic aromatic hydrocarbons (PAHs), and several others.
Emission of CO, PAHs, black carbon, and soot in general, are all results of incomplete combustion [7,10], then the measure of CO emissions can be considered to be a tracer of unburned gases. Improvements of the combustion process that entail a reduction of CO are expected to decrease emission of PM too.
Several studies have focused attention on chemical composition of volatile PM and ash from biomass combustions. In [11,12], aerosol formation processes are investigated and theoretical models regarding particle behavior (nucleation, coagulation and condensation) are presented. Other studies demonstrate that particles sizes from wood pellet combustion are mostly sub-micron with concentration peaks around 0.1 m and 0.9 m [13,14], composed by inorganic compounds of K, Na, Cl, Ca, Mg, P and S (KO, NaO, CaO, MgO, PO, SO) and by soot from incomplete combustion [11,13]. Inorganic ash chemical composition is analyzed in [14,15]; its results are composed mainly by Si, Al, Fe, Ca, K, and S compounds.
An important factor that influences PM emissions is the burner pot geometry. To reduce as much as possible PM emissions, different geometries of burner pots and different air ratios were analyzed by different authors. Optimized solutions were described in [16,17]: these biomass reactors are high cylinders with several stages of secondary and tertiary air flows that feed the combustion oxidizing all the combustible gases. Studies presented in [18,19] analyze the influence of primary and secondary air ratio on CO and PM emissions. A higher secondary air contribution allows fewer emissions.
The literature cited above analyzes combustion processes under controlled and steady laboratory conditions. The everyday use of combustion appliances is characterized by different combustion conditions, mainly unsteady. In [20,21] combustion processes are analyzed in realistic conditions, hence considering all combustion phases from ignition to extinguishing the flame: emissions from incomplete combustion have much higher values than in laboratory conditions and temperature of the flue gases can reach peaks up to 800 K, negatively influencing efficiency of combustion [22]. Flue gas temperature is important not only for stove efficiency, but also for safety issues, as shown by experimental and numerical studies investigating flue gas temperature in different stove installations to avoid roof fire problems [23,24].
The combustion of pellet has been addressed through numerical approach as well: in [25] it is presented a numerical model to simulate biomass combustion which consider two distinct phases (a drying phase and a combustion phase); in [26] it is illustrated a numerical model that describe combustion taking into consideration the different zones of the combustion chamber; in [27] another numerical model is developed in order to predict emission factors, emission rates and solid distribution of particulate matter during the combustion of solid biofuel in a stove with determined operating parameters, for example primary and secondary air fluxes; in [28] a mathematical tool for prediction of thermal performance is developed for stoves with unshielded burner pots: in this work is underlined the important role of the ratio of primary and secondary air inlet area in the performance of the appliance.
This paper reports results of a collaboration between AICO SpA, an Italian manufacturer, and the University of Brescia aimed to reduce CO and PM emissions of pellet stoves and boilers manufactured by AICO, through improvement of combustion conditions. In 2016 [29] AICO patented a new burner pot to be inserted in its stoves and boilers. The burner pot was designed to allow automation of de-ashing and to prevent clogging of primary air inlets by bottom ash accumulation. To this end shape and position of primary air inlets were substantially modified. Preliminary tests on stoves equipped with the newly designed burner pot indicated a reduction of both CO and PM emissions. Since under poor combustion conditions the soot component dominates in PM composition, the first goal of the research project was identified in verifying how much PM emission can be reduced upon improving the combustion. To this end a campaign of experimental tests on currently produced stove models and on improved new ones was undertaken to identify the appliance settings that optimize combustion in terms of efficiency and minimum CO production, then to verify whether this optimal configuration does minimize PM emissions as well.
Experimental tests reported here were carried out on four models of pellet stove: the four stoves had the same design and differed only in burning power and type of burner pot. Two stoves, A1 (8.0 kW) and A2 (11.1 kW), were equipped with a traditional burner pot, while the other two, B1 (8.6 kW) and B2 (10.1 kW), were equipped with the new burner pot.
Tests point out that with the new burner pot, CO emissions can be cut down dramatically and, at the same time, the improved combustion significantly reduces PM, but not as much as CO emissions.
However, there is an apparent dependence of PM released from the time passed from ignition with stoves B1 and B2. As time goes by PM emissions tend to increase. It is likely that this is a fluid mechanical effect caused by ash accumulation on the bottom of the burner pot and by its interaction with the primary air stream that flows over it.
2. Materials and Methods
2.1. Burner Pot and Stove Models
The experimental data reported in this paper have been collected at AICO Testing Lab during the development of new pellet stove models. In particular, four stoves will be considered here. They differ in burner pot type mounted and power. Two types of burner pot (denoted A and B) are tested and they generate different combustion conditions when the stoves are in operation.
The first two stoves tested will be denoted A1 and A2. They have nominal power of 8.0 kW and 11.1 kW, respectively. They are equipped with a “traditional” burner pot.
The other two stoves, B1 and B2, have nominal power of 8.6 kW and 10.1 kW, respectively. A “new” burner pot, developed and patented by AICO [29], is inserted in them.
Burner pot type A (mounted in stoves A1 and A2 and shown in Figure 1 on the left) is commonly adopted by most pellet stove manufacturers. Primary air enters through an array of holes in the bottom, then it feeds the combustion flowing through the bed of embers. Secondary air is supplied from holes in the upper part of the burner pot walls and impinges directly on the flame. The relative ratio between primary and secondary air inlet areas is designed to minimize CO emissions for a combustion period of 5–6 h. However, the ratio between primary and secondary air flow rates is not controlled and can vary during combustion. For example, when ash accumulates on the bottom of the pot partially obstructing or blocking the primary air flow, the amount of secondary air increases.
Stoves B1 and B2 are equipped with an innovative burner pot model developed by AICO and shown in Figure 1 on the right. A detailed description of this model can be found elsewhere [29], here we give only a brief description. It consists in a rectangular solid base: primary air is supplied through a meandering slit between the base and the sidewall. This air flow does not pass through the bed of embers, but along its side and over its surface. Secondary air is supplied at the top of the burner pot: it passes through several holes (not shown in Figure 1) and impinges on the flame. Also, in these stoves primary and secondary air flow rates are not directly controlled. Because of shape and position of primary air inlets, ash accumulation on the burner pot bottom does not obstruct the primary air flow for a longer time with respect to pots of type A. The number and size of secondary air holes have been determined in preliminary tests conducted during the development of the burner pot. Designs presented in the article have primary/secondary inlets ratios that minimize CO emissions for a combustion period of 5–6 h.
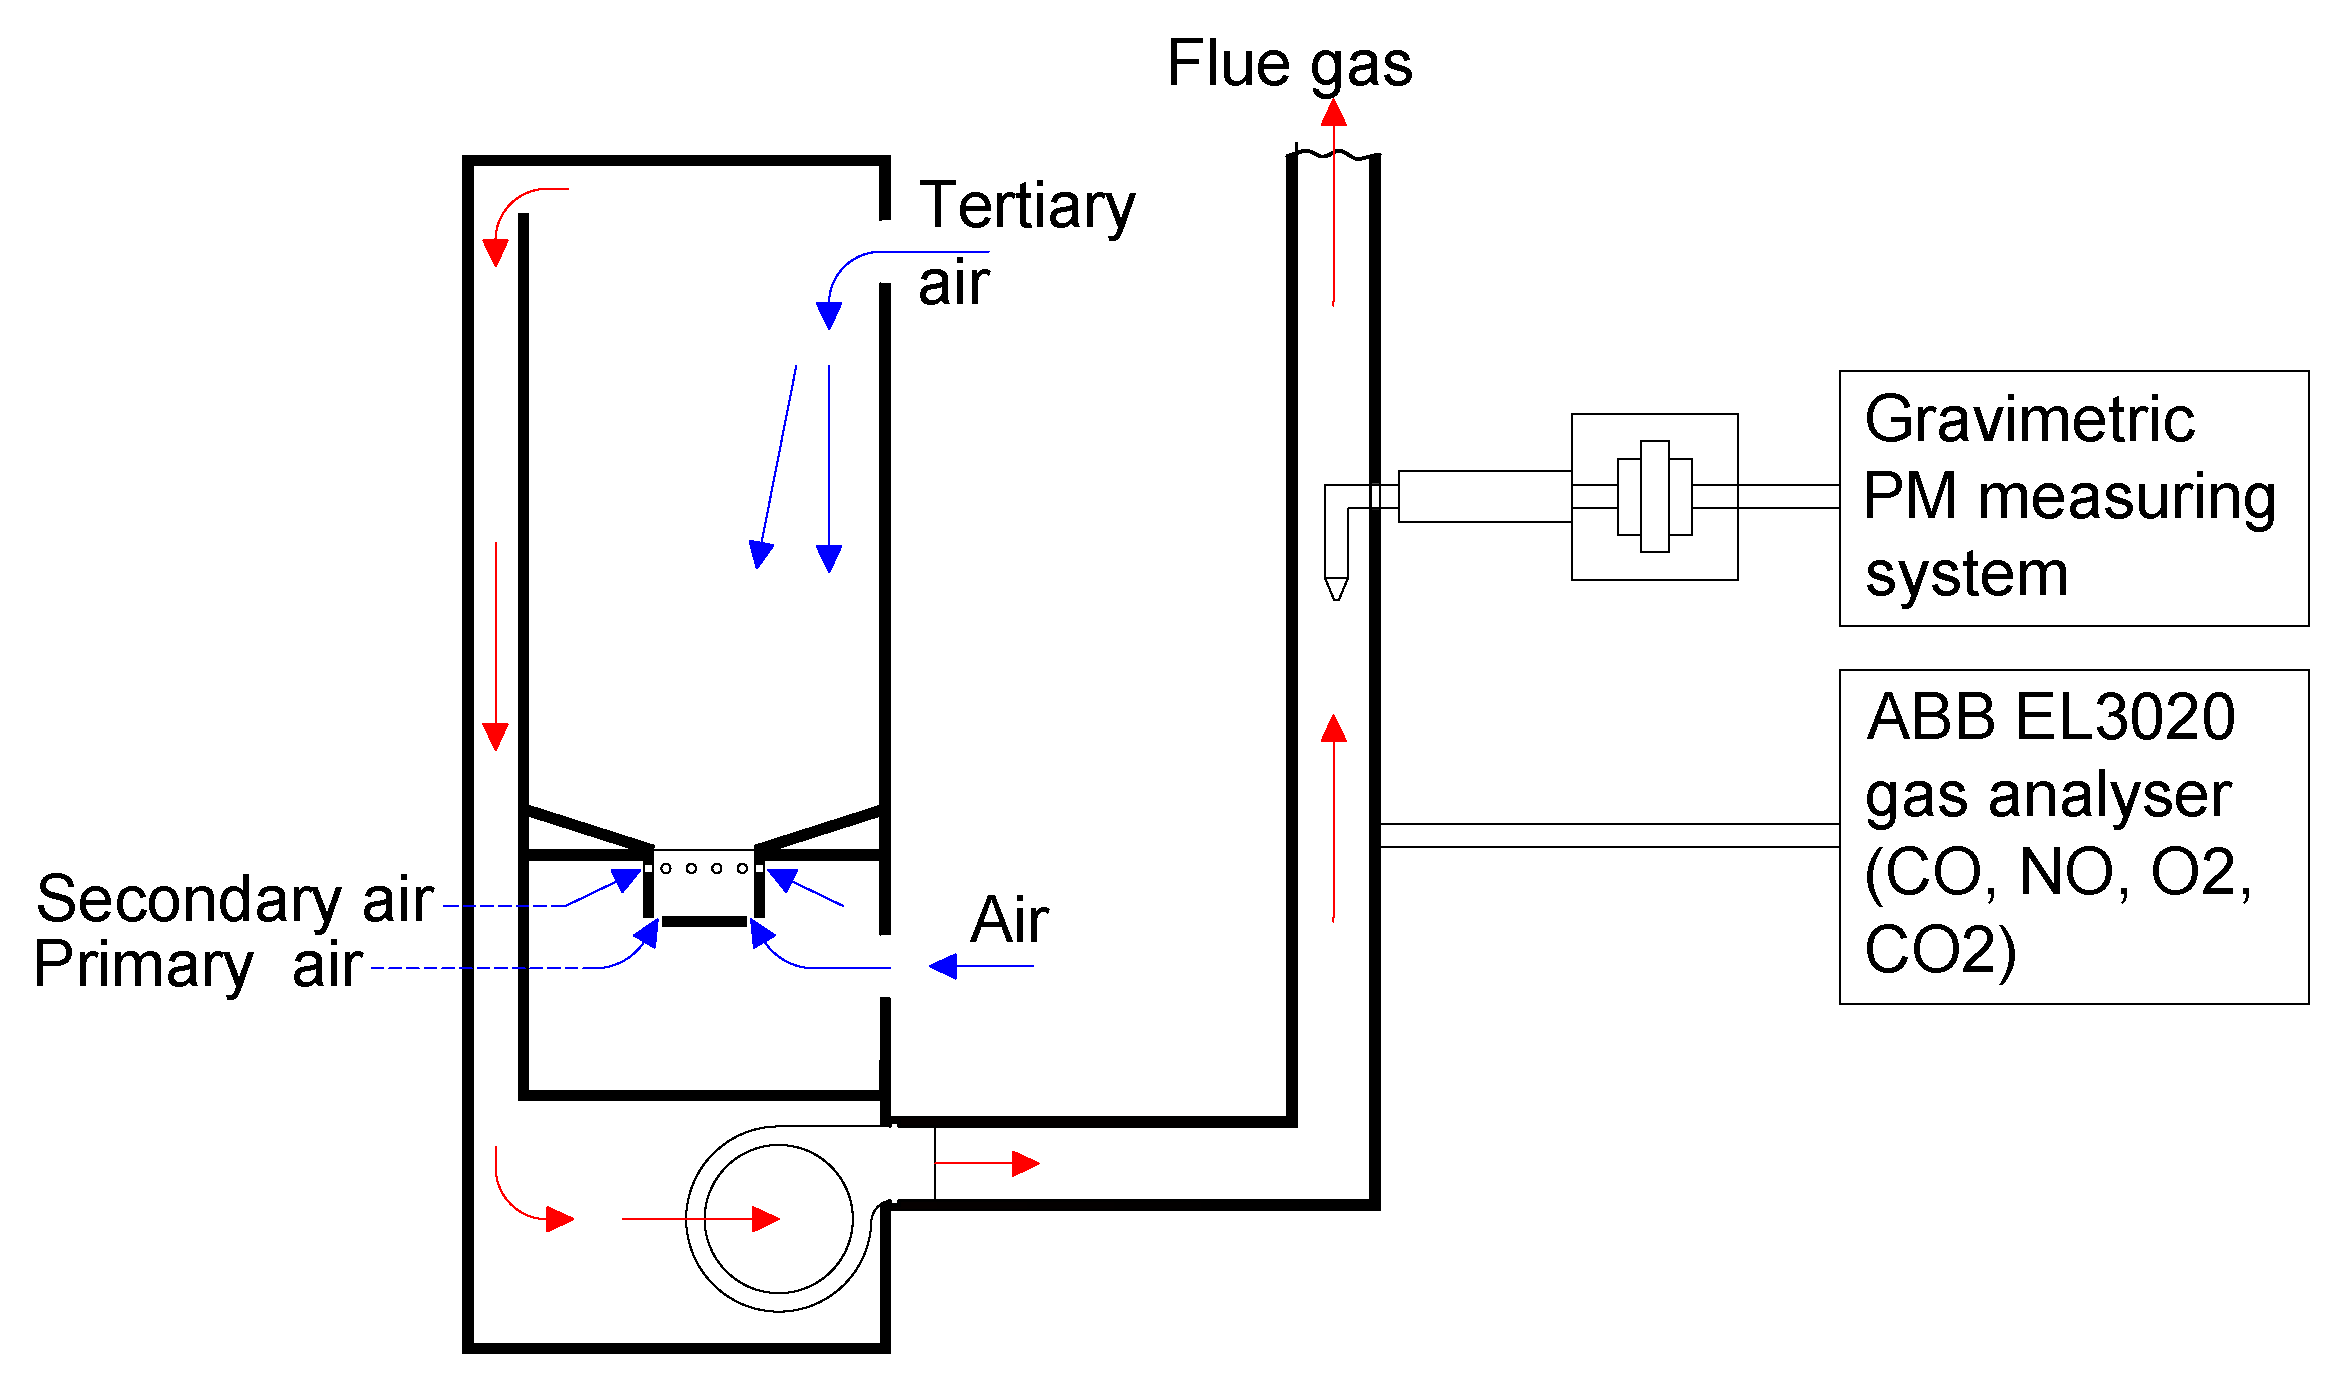
Stoves are equipped with tertiary air supply as well that keeps the glass door clean and feed the flame directly in the combustion chamber from the top. This inlet is independent by the burner pot adopted.
In Figure 2 a scheme of the stove with all air inlets is shown.
2.2. Experimental Setup and Testing Procedure
For all tests reported here, we used the experimental setup and followed the measuring procedure proposed by European Standards [31,32] and used by other authors [5,16]. Standard EN 14785 considers space heaters fired by wood pellets up to 50 kW. It provides requirements and test methods regarding design, manufacture, safety, and performance (efficiency and emissions). Standard EN 13284 describes a method for the determination of low range mass concentration of dust with a manual gravimetric method. It establishes the procedure of sampling and weighting the dust in the flue gases.
Details on the testing procedure followed in this study are specified here. Each stove required a few days of testing (each day of testing will be denoted as “test session”). A regular test session starts in the morning with the setting of operation parameters and the stove ignition: the burner pot, in particular, is emptied of all the residuals from the previous session. After about one hour from ignition, combustion reaches quasi-steady conditions, detected upon monitoring the flue gases temperature. At this point a sequence of tests is performed. Each test lasts 30 min and several tests are performed during a test session. Operation conditions during a test session are fixed. At the end of the test session (extinguishing stage) pellet feeding is switched off and combustion air flow rate is increased to burn quickly what is left in the burner pot. This stage lasts 15 min, approximately.
A schematic sketch of PM and flue gas sampling system used in this study is shown in Figure 2. The composition of flue gases is measured at the flue gas socket.
During a test CO, O, CO, and NO are measured and recorded every 5 s. At the end, average values over the 30-min test are computed. At the same time, PM is also measured by the filter-gravimetric method described in EN 13284: the sampling time being 30 min, i.e., the test duration. A time lag between two tests is necessary to replace the filter and calibrate the instrument and usually ranges between 15 and 30 min.
Although EN 14785 prescribes to take average values of CO, O and CO over at least three hours, here average values are calculated over 30 min to have results consistent with the collection of PM on the filter.
During tests the whole stove, including the hopper, is put on a platform scale to measure the burning rate.
The gas analyzers used is an ABB EL3020, equipped with cells to measure the concentration (volume fraction) of O and CO in dry gas, i.e., the flue gas without HO. Measurement accuracies are ±0.2% for O measures and ±2 ppm for CO measures.
The quartz fiber filter adopted has a retention efficiency of 99.998% of the particulate with 0.3 m diameter. Measurement accuracy of the balance adopted for measuring PM weight deposited on the filter is ±0.08 mg. The pump sucks flue gases at constant flow of 25 L/min and has an accuracy of ±2%, in accordance with the Standard [32].
To make a proper comparison of results, CO and PM are normalized at the same concentration of O, using the relationship (see [31,33]), where X is the actual (averaged or instantaneous) concentration of CO or PM in mg/Nm; O the actual (averaged or instantaneous) concentration of O in %; O, the reference concentration of oxygen, here 13%; X, the concentration of CO or PM at reference conditions, in mg/Nm. All data shown in Figures are normalized.
3. Results and Discussion
3.1. Comparison of Emissions from Different Burner Pots
The stoves tested exhibit different performance in term of CO and PM emissions and combustion efficiencies. This is particularly true when comparing stoves with different burner pots: the combustion seems to be strongly affected by primary air inlet geometry. Data reported here are divided in four groups that differ in burner pot model and nominal power. There are two different sizes for both burner pot models. Results obtained with the four stoves are shown in Table 2 and in Figure 3, they represent averages over a 30 min test.
Experimental data were collected in different days, with stoves set at similar nominal powers and combustion conditions. Stoves A1 and B1 have nominal powers between 7.4 and 8.8 kW, while stoves A2 and B2 have burning powers between 9.9 and 11.7 kW.
Air excess ratio is set to maintain as much as possible optimum combustion conditions that minimize CO emissions and it is regulated by a flue gas extractor. However, O content in the flue gases does not depend only by the flue gas extractor velocity, but also by air inlets surface, instantaneous burning rate, instantaneous temperatures of the fire and of the flue gases that vary continuously during the combustion. Actually, the mass of pellet varies at each release, depending on the number and total length of the grains released.
For each stove, the average values and standard deviations of all tests have been calculated. All the results are reported in Table 2 and in Figure 3.
As stated before, CO and PM emissions are affected by burner pot models. In tests performed on stoves A1 and A2, average PM emissions are in a range between 15.8 and 42.9 mg/Nm13% of O. Average value and standard deviation of PM of all tests performed with stove A1 are respectively 30.0 mg/Nm and 6.5 mg/Nm13% of O, while with stove A2 are respectively 21.1 mg/Nm and 4.2 mg/Nm13% of O. Average CO emissions are in a range between 34 and 165 mg/Nm13% of O. Average value and standard deviation of CO of all tests performed with the stove A1 are respectively 106 and 39 mg/Nm13% of O, while with the stove A2 are respectively 108 and 44 mg/Nm13% of O. Average combustion efficiencies of stoves A1 and A2 are in a range between 85.4 and 88.8%. Average value and standard deviation of efficiency of all tests performed with the stove A1 are respectively 86.7 and 0.7%, while with the stove A2 are respectively 87.2 and 1.1%. Average O concentrations of stoves A1 and A2 are in a range between 8.4 and 10.1%. Average value and standard deviation of O of all tests performed with the stove A1 are respectively 9.3 and 0.4%, while with the stove A2 are respectively 9.4 and 0.5%.
In tests performed on stoves B1 and B2, average PM emissions are in a range between 10.5 and 23.3 mg/Nm13% of O. Average value and standard deviation of PM of all tests performed with stove B1 are respectively 15.1 and 2.7 mg/Nm13% of O, while with stove B2 are respectively 14.8 and 3.7 mg/Nm13% of O. Average CO emissions are in a range between 5 and 62 mg/Nm13% of O. Average value and standard deviation of CO of all tests performed with the stove B1 are respectively 13 and 10 mg/Nm13% of O, while with the stove B2 are respectively 23 and 14 mg/Nm13% of O. Average combustion efficiencies of stoves B1 and B2 are in a range between 88.9 and 92.9%. Average value and standard deviation of efficiency of all tests performed with the stove B1 are respectively 91.3 and 1.3%, while with the stove B2 are respectively 91.1 and 0.5%. Average O concentrations of stoves B1 and B2 are in a range between 5.2 and 9.6%. Average value and standard deviation of O of all tests performed with the stove B1 are respectively 7.3 and 1.3%, while with the stove B2 are respectively 7.8 and 0.5%.
From the results described, stoves B are characterized by lower PM and CO emissions and higher combustion efficiency. Combustion efficiency is directly influenced by O concentration in the flue gases. Lower O concentration permits higher heat exchange, then higher combustion efficiency. Hence primary air inlet positions must be considered an important factor that influence combustion performance. Primary air coming from the bottom side does not directly invest the pellet in the bottom-center, hence that portion heats up with much less air than pellet on the side.
With burner pots B, CO emissions have been reduced near to zero and PM emissions have been reduced compared to PM emissions of burner pots A. Ember and pellets in the center of burner pots B are not directly invested by primary air, indeed there is less PM entrainment than with burner pots A.
These stove models do not have a control of performance of combustion during the process, then air excess is not directly controlled and can change continuously in a range. Hence O percentages in the flue gases change continuously. In stoves equipped with burner pot B, CO emissions are minimized for a wide range of O percentages in the flue gases. Instead, in stoves equipped with burner pot A, CO emissions are minimized only for small range of O percentages, as described in Section 3.3.
3.2. Time Dependence of PM Emissions
Results presented in Section 3.1 show that the two types of burner pots release very different amount of pollutants. We explain this difference in terms of different combustion dynamics and air-pellet-ash interaction in the two burner pot models.
In stoves A1 and A2, primary air enters from the bottom grid and passes directly through embers and pellets. Its mass flow rate is higher than the flow rate of secondary air. With this type of burner pot is not possible to increase the secondary/primary air ratio beyond a certain limit, because a minimum flow rate from the bottom grid is necessary to avoid accumulation of unburnt material and ash in the burner pot. On the other hand, primary air flow increases PM entrainment. Furthermore, the flow rate of primary air is strongly influenced by the quantity of pellets in the burner pot and this can cause instability of combustion. With time, especially when primary air flow rate is low, ash accumulates on the grid reducing inlet area for primary air. The consequence is that the secondary/primary air ratio increase, but the total amount of air decreases. This reduces the total excess air with time.
The combined effects of non-ideal distribution of air in the burner pot and entrainment of dust can justify the higher level of average PM released by stoves A1 and A2. A similar mechanism is described in [16]: they observed that fine PM released in the flue gas was maximum when the combustion was fed only by the primary air coming from the bottom.
Burner pot geometry of stoves B1 and B2 allows to get very low and stable levels of CO in flue gas, even less than 10 mg/Nm13% of O in some tests: it is possible to consider the combustion “quasi-ideal”.
In stoves of type B, consecutive tests within the same test session exhibit an increment of PM emissions. Furthermore, the color of particulate collected by the filter changes from test to test. At the beginning, the combustion releases a minimum quantity of PM, then PM emissions continue to increase with time. We explain this phenomenon as caused by a change in combustion conditions due to ash accumulation in the burner pot: as the ash level in the pot rises above a threshold, it interacts with the primary air, enhancing entrainment.
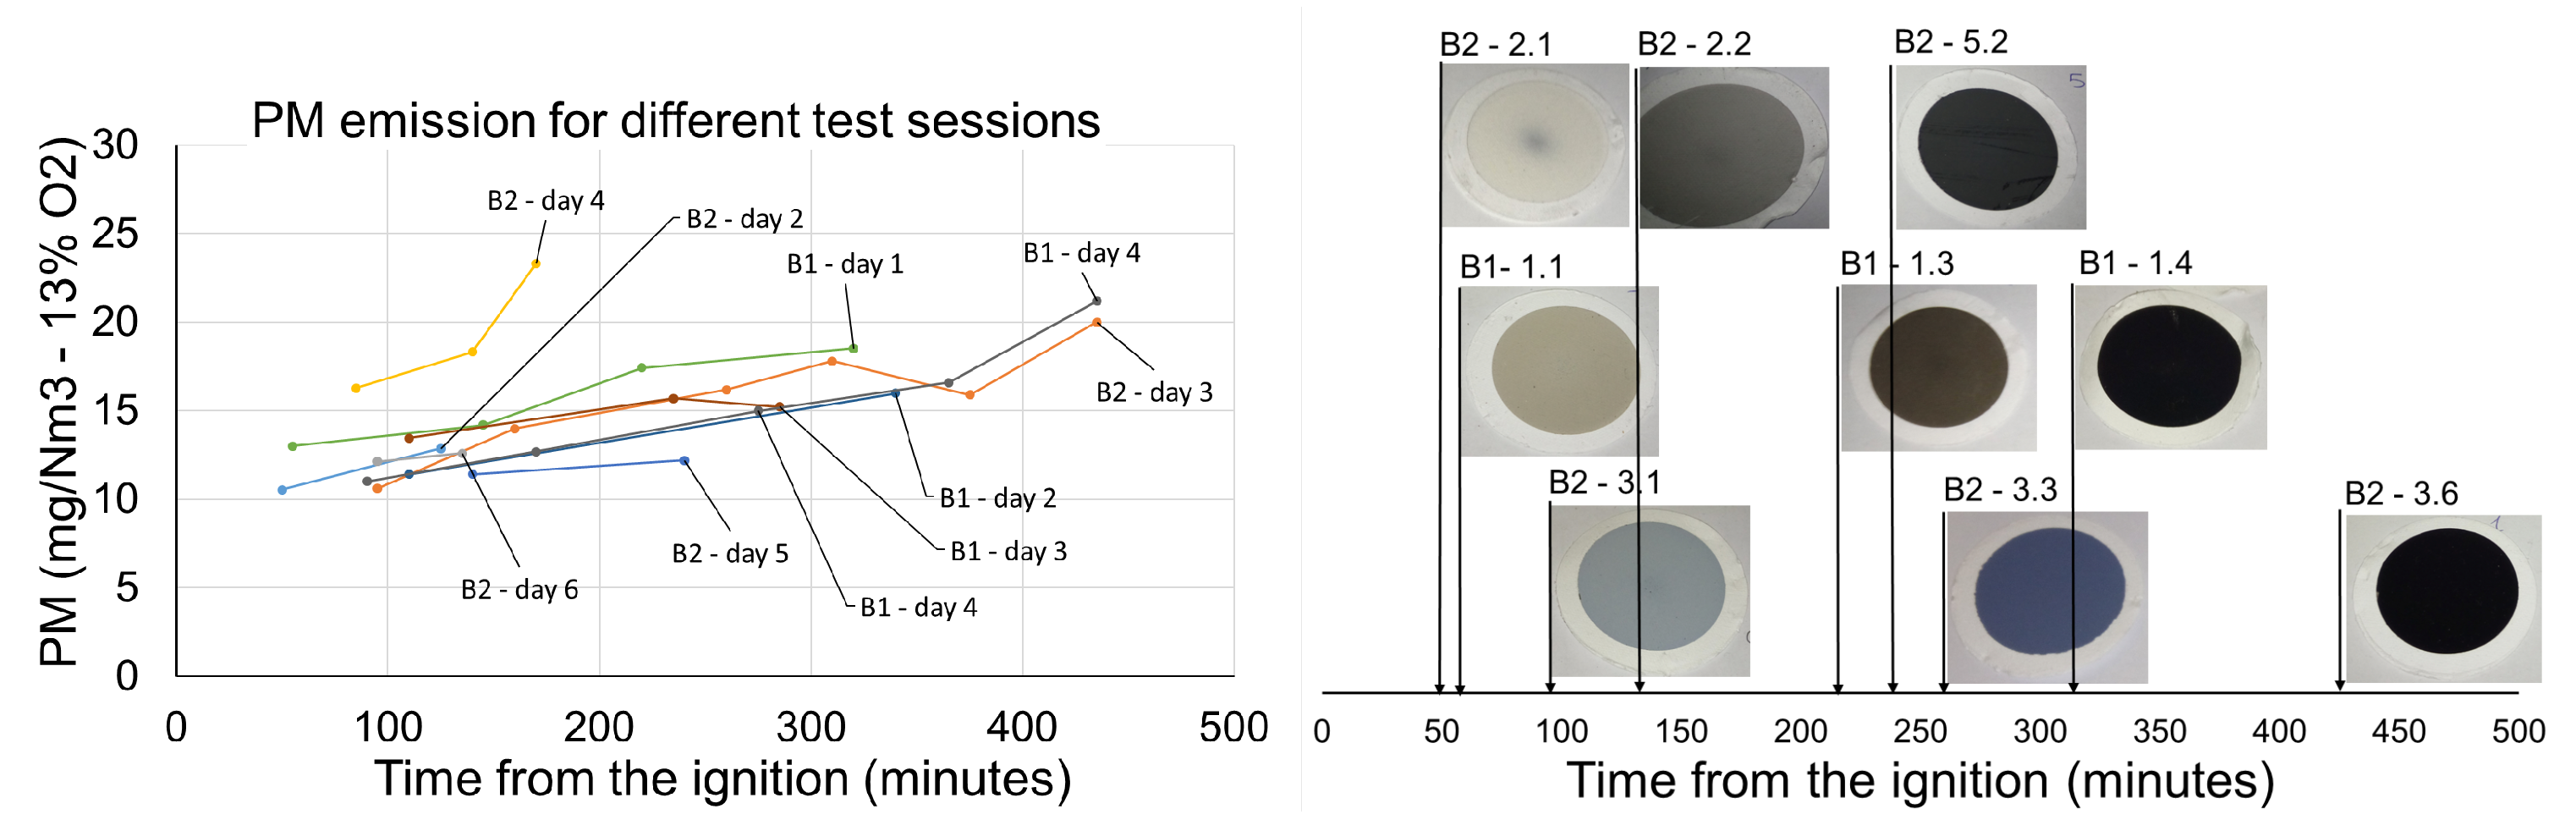
In Figure 4 on the left, we plot average PM measured during ten test sessions made in different days, using stoves B1 and B2. In each day there is an apparent trend: PM emissions tend to increase from the first to the last test of the session. For tests performed after 60–100 min from ignition, measured PM falls between 10 and 15 mg/Nm, while for tests performed after 300–450 min from ignition, PM falls between 15 and 24 mg/Nm.
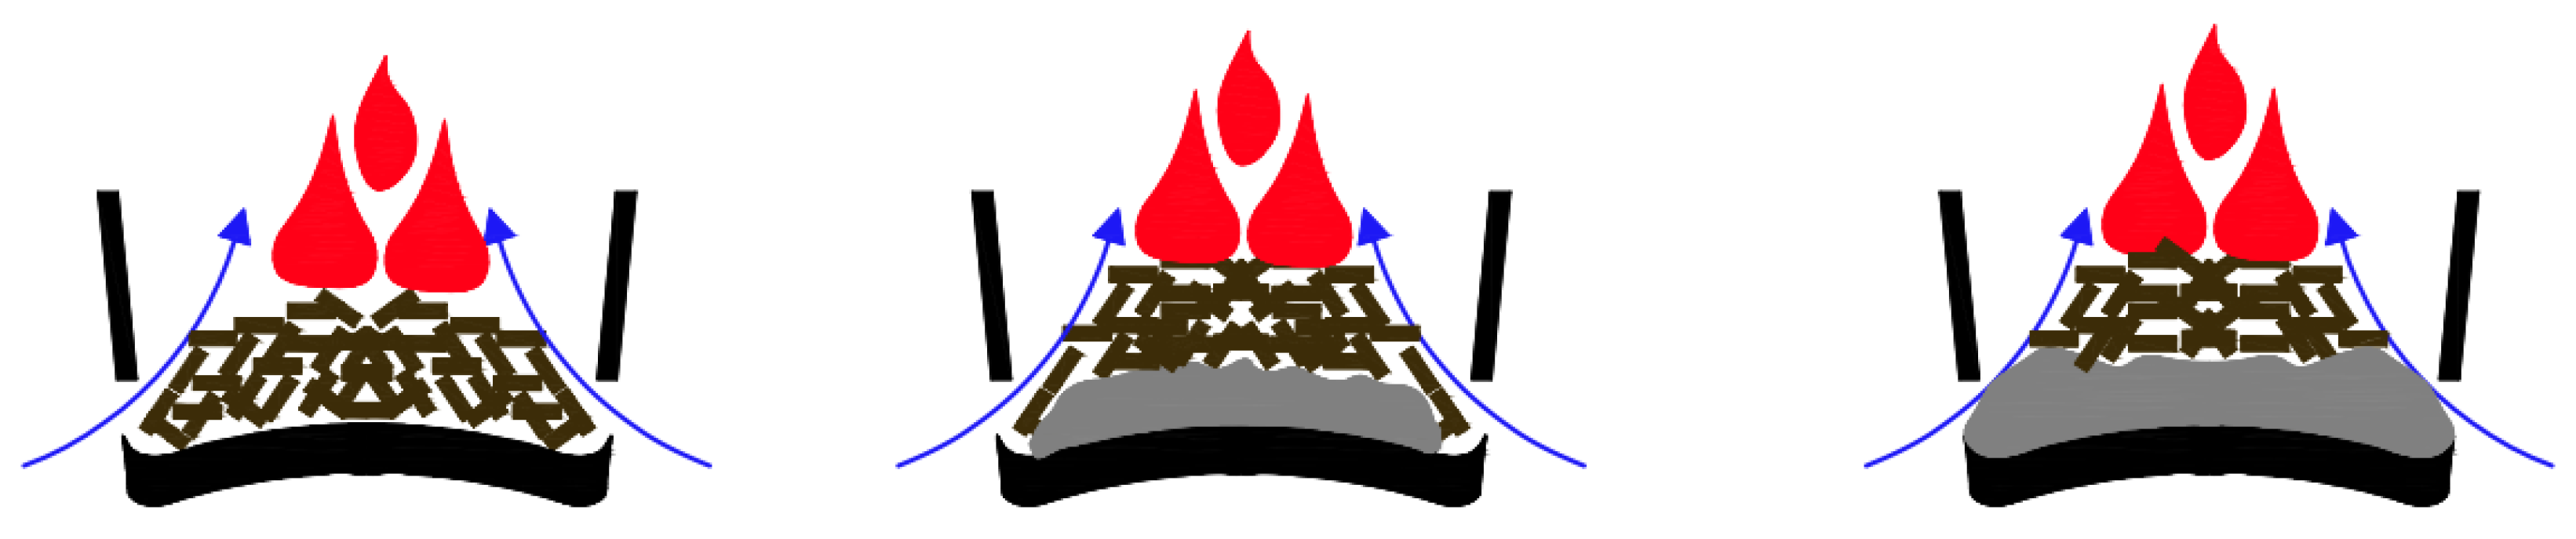
The evolution of the combustion conditions in the stoves of type B during a test session is suggested also by the change of colors of particulate collected on the filter. As shown in Figure 4 on the right, at the beginning of the combustion, between 50–100 min from ignition, PM colors vary between cream, pale brown, and pale blue. After 130–250 min from ignition approximately, PM colors change to grey or brown or blue. After 250–300 min, PM colors become dark grey or black. We try to explain it as shown in Figure 5 and as described here.
We divide the combustion process during a test session in three phases without considering the ignition and extinguishing phases:
- 1st phase: burner pot without ash;
- 2nd phase: burner pot with embers, pellets and ash;
- 3rd phase: burner pot with ash that influences primary air inlets.
During the 1st phase, there is a very low amount of ash in the burner pot, therefore the air, coming from the bottom side of the burner pot, passes over embers and pellets. Pellets in the center of the burner pot are heated in air-defect conditions. There is no entrainment effect of dust and PM because the negligible amount of ash in the burner pot is not hit by primary air. The PM released during the combustion process is minimum. This phase is represented in Figure 5 on the left.
During the 2nd phase, ash starts to deposit in the center of the burner pot. Ash, in this phase, does not influence combustion conditions, because primary air inlets are still totally free. Combustion conditions are the same as in the 1st phase, but entrainment is now present because primary air flows over ash in the burner pot and entrainment increases as the ash level in the burner pot rises. This phase lasts few hours and depends on the size of the burner pot and on the amount of burnt pellet. PM entrained in the flue gas grows with the quantity of ash in the burner pot. This phenomenon is represented in Figure 5 in the center.
During the 3rd phase, ash reaches the primary air inlet slits. Now primary air impinges directly on char, fresh pellets, and ash. This type of combustion is quite similar to combustion of stoves A. The level of PM in the flue gas reaches a higher level depending on the quantity of ash hit by primary air. This last phase is shown in Figure 5 on the right.
3.3. Relationship between Instantaneous PM and O Values
In a previous work [34], two of the authors reported plots of instantaneous CO values versus O and showed their usefulness. Instantaneous data collected over one limited time interval (from 30 min up to a few hours) can be as useful in reconstruction of the CO versus O dependence as average data collected in several days of testing. These plots allow determination of an O interval that minimize CO production (see, for example, Figure 6 and Figure 7 on the right) and are quite useful during the setup of the operating parameters of a new stove.
Here, we verify whether a similar approach can be useful for PM minimization. Preliminary results seem to exhibit differences related to the CO emissions level.
In type B stoves, CO emissions are close to zero, PM emissions are reduced, but not as much as those of CO. Furthermore, the amount of instantaneous PM has a weak dependence on O content: a linear increase of PM with O can be noticed when PM concentration, normalized at 13% of O, is plotted versus O (see Figure 6).
This relationship between PM and O is obtained in all tests with type B stoves that are characterized by quasi-zero CO levels. As shown in Figure 6, PM generation is reduced, but it never goes below 8 mg/Nm. This feature can be explained recalling that the combustion of pellets, with this burner pot, always releases a minimum amount of PM, composed mostly by inorganic compounds.
As already pointed out, there are two different types of PM in the flue gases: organic PM, which is caused by poor combustion and it can be considered low when CO is close to zero; inorganic PM that is continuously released during all the combustion process.
In Figure 6 on the right, the CO–O relationship for the same test is plotted. For O range between 6.0–10.0%, CO emissions are nearly zero. The test shown in Figure 6 on the right is B2 – 3.1. The average concentration of CO is 24 mg/Nm at 13% of O, while average concentration of PM is 10.6 mg/Nm at 13% of O.
In type A stoves, a different PM versus O behavior is observed, PM released in the flue gas is much higher. From the analysis of data collected in several tests, it appears that PM is correlated with O. PM versus O instantaneous curve is similar to CO versus O curve: both curves have a minimum of emission for the same range of O percentages, in this case between 9.0–10.0%. For O percentages out of this range, CO and PM emissions tend to increase, but with different trends, as shown in Figure 7. The test shown in Figure 7 is A2 – 2.2. The average concentration of CO is 62 mg/Nm at 13% of O, while the average concentration of PM is 15.9 mg/Nm at 13% of O.
4. Conclusions
This paper provides new elements in the understanding of PM generation during the combustion in wood pellet stoves. It shows that improvement ins emission reduction can be obtained through modification of the burner pot design.
In this study, two different burner pots and four stoves were analyzed: a traditional burner pot model with primary air passing through the bottom and an innovative model with primary air coming from slits between the side walls and the bottom of the burner pot. Stoves operate at different burning powers and different air excess.
The experimental results exhibited quite different PM levels in the flue gases from stoves equipped with different burner pots. Stoves of type A (burner pots with holes in the bottom) usually release higher amounts of PM than stoves of type B (burner pots with primary air coming from slits on the bottom side).
For stoves B, strong reduction to levels close to zero of CO emissions was recorded. However, PM emission reduction was not as much. This is due to the fact that PM generation does not depend only on combustion quality, but also on combustible quality, in particular ash content. There are two different PM components released in the flue gases: organic PM, which depends on the quality of combustion and can be largely removed when CO amount is close to zero; inorganic PM, which mainly depends on the intrinsic characteristics of the fuel and on entrainment effects and is not expect to reduce as CO tend to zero.
Furthermore, CO and PM emissions correspond to O percentage in the flue gas as well, i.e., on air excess ratio. There is an optimum O range that is related to both CO and PM emissions.
Another experimental evidence collected during tests on stoves B is that PM emissions tend to increase with time passed from ignition. At the beginning, about one hour after ignition, the quantity of PM is minimum; as time goes by, however, PM production grows significantly. The time dependence of PM production is pointed out also by the change of colors of the dust deposited on the filters at different time from ignition. At the beginning, colors are light, while after three or four hours they tend to dark grey or black. We explain this behavior as caused by the accumulation of ash in the burner pot and by its interaction with the primary air streams. The interaction changes the combustion conditions and the emissions of stoves B become more similar to emissions of stoves A.
The initial good performance of stoves B are likely due to air-defect conditions of the pellet in the center of the burner pot, because primary air coming from the bottom side does not directly invest the pellet in the center. Conversely, during the combustion of stoves A, primary air flows through pellets, embers, and ash and causes a direct combustion process.
Author Contributions
Conceptualization, L.F.P., D.P., S.P.P. and A.M.L.; methodology, L.F.P. and D.P.; formal analysis, L.F.P., D.P. and A.M.L.; investigation, L.F.P. and D.P.; resources, D.P. and S.P.P.; data curation, L.F.P., D.P. and A.M.L.; writing—original draft preparation, L.F.P.; writing—review and editing, D.P. and A.M.L.; visualization, L.F.P.; supervision, D.P. and A.M.L. All authors have read and approved the manuscript.
Funding
This research received no external funding.
Conflicts of Interest
The authors declare no conflict of interest.
References
- Prüss-Ustün, A.; Wolf, J.; Corvalan, C.; Bos, R.; Neira, M. Preventing Disease through Healthy Environments. Towards an Estimate of the Environmental Burden of Disease; World Health Organization: Geneva, Switzerland, 2016. [Google Scholar]
- Ambient Air Pollution: A Global Assessment of Exposure and Burden of Disease; World Health Organization: Geneva, Switzerland, 2016; ISBN 978-92-4151135-3.
- Directive 2012/27/EU of the European Parliament and of the Council; European Parliament: Brussels, Belgium, 2012.
- Decreto Ministeriale 16/02/2016; Ministero dello Sviluppo Economico (IT): Roma, Italy, 2016.
- Fernandes, U.; Costa, M. Formation of fine particulate matter in a domestic pellet-fired boiler. Energy Fuels 2013, 27, 1081–1092. [Google Scholar] [CrossRef]
- Monedero, E.; Portero, H.; Lapuerta, M. Combustion of poplar and pine pellet blends in a 50 kw domestic boiler: Emissions and combustion efficiency. Energies 2018, 11, 1580. [Google Scholar] [CrossRef]
- Keeley, L.B.; Langridge, S.; Zhou, J.L. Release of polycyclic aromatic hydrocarbons, carbon monoxide and particulate matter from biomass combustion in a wood-fired boiler under varying boiler conditions. Atmos. Environ. 2008, 42, 8863–8871. [Google Scholar]
- Tschamber, V.; Trouvé, G.; Leyssens, G.; Le-Dreff-Lorimier, C.; Jaffrezo, J.-L.; Genevray, P.; Dewaele, D.; Cazier, F.; Labbé, S.; Postel, S. Domestic Wood Heating Appliances with Environmental High Performance: Chemical Composition of Emission and Correlations between Emission Factors and Operating Conditions. Energy Fuels 2016, 30, 7241–7255. [Google Scholar] [CrossRef]
- Schmidl, C.; Marr, I.L.; Caseiro, A.; Kotianová, P.; Berner, P.; Bauer, H.; Kasper-Giebl, A.; Puxbaum, H. Chemical characterisation of fine particle emissions from wood stove combustion of common woods growing in mid-European Alpine regions. Atmos. Environ. 2008, 42, 126–141. [Google Scholar] [CrossRef]
- Long, C.M.; Nascarella, M.A.; Valberg, P.A. Carbon black vs. black carbon and other airborne materials containing elemental carbon: Physical and chemical distinctions. Environ. Pollut. 2013, 181, 271–286. [Google Scholar] [CrossRef] [Green Version]
- Fuller, A.; Maier, J.; Karampinis, E.; Kalivodova, J.; Grammelis, P.; Kakaras, E.; Scheffknecht, G. Fly ash formation and characteristics from (co-)combustion of an herbaceous biomass and a Greek lignite (low-rank coal) in a pulverized fuel pilot-scale test facility. Energies 2018, 11, 1581. [Google Scholar] [CrossRef]
- Wiinikka, H.; Gebart, R.; Boman, C.; Boström, D.; Nordin, A.; Öhman, M. High-temperature aerosol formation in wood pellets flames: Spatially resolved measurements. Combust. Flame 2006, 147, 278–293. [Google Scholar] [CrossRef]
- Wiinikka, H.; Gebart, R.; Boman, C.; Boström, D.; Öhman, M. Influence of fuel ash composition on high temperature aerosol formation in fixed bed combustion of woody biomass pellets. Fuel 2007, 86, 181–193. [Google Scholar] [CrossRef]
- Zellagui, S.; Trouvé, G.; Schönnenbeck, C.; Zouaoui-Mahzoul, N.; Brilhac, J.F. Parametric study on the particulate matter emissions during solid fuel combustion in a drop tube furnace. Fuel 2017, 189, 358–368. [Google Scholar] [CrossRef]
- Garra, P.; Maschowski, C.; Liaud, C.; Dieterlen, A.; Trouvé, G.; Calvé, S.L.; Jaffrezo, J.L.; Leyssens, G.; Schönnenbeck, C.; Kohler, S.; et al. Fluorescence microscopy analysis of particulate matter from biomass burning: Polyaromatic hydrocarbons as main contributors. Aerosol Sci. Technol. 2015, 49, 1160–1169. [Google Scholar] [CrossRef]
- Wiinikka, H.; Gebart, R. The influence of air distribution rate on particle emissions in fixed bed combustion of biomass. Combust. Sci. Technol. 2005, 177, 1747–1766. [Google Scholar] [CrossRef]
- Obernberger, I.; Mandl, C.; Brandt, J. Demonstration of a new ultra-low emission pellet and wood chip small-scale boiler technology. In Proceedings of the 24th European Biomass Conference and Exhibition, Amsterdam, The Netherlands, 6–9 June 2016; pp. 367–374. [Google Scholar]
- Regueiro, A.; Patiño, D.; Porteiro, J.; Granada, E.; Míguez, J. Effect of air staging ratios on the burning rate and emissions in an underfeed fixed-bed biomass combustor. Energies 2016, 9, 940. [Google Scholar] [CrossRef]
- Houshfar, E.; Løvås, T.; Skreiberg, Ø. Experimental investigation on NOx reduction by primary measures in biomass combustion: Straw, peat, sewage sludge, forest residues and wood pellets. Energies 2012, 5, 270–290. [Google Scholar] [CrossRef]
- Toscano, G.; Duca, D.; Amato, A.; Pizzi, A. Emission from realistic utilization of wood pellet stove. Energy 2014, 68, 644–650. [Google Scholar] [CrossRef]
- Venturini, E.; Vassura, I.; Zanetti, C.; Pizzi, A.; Toscano, G.; Passarini, F. Evaluation of non-steady state condition contribution to the total emissions of residential wood pellet stove. Energy 2015, 88, 650–657. [Google Scholar] [CrossRef]
- Neri, M.; Luscietti, D.; Fiorentino, A.; Pilotelli, M. Statistical approach to estimate the temperature in chimney roof penetration. Fire Technol. 2018, 54, 395–417. [Google Scholar] [CrossRef]
- Neri, M.; Pilotelli, M. Data on temperature-time curves measured at chimney-roof penetration. Data Brief 2018, 20, 306–315. [Google Scholar] [CrossRef]
- Neri, M.; Luscietti, D.; Bani, S.; Fiorentino, A.; Pilotelli, M. Analysis of the temperatures measured in very thick and insulating roofs in the vicinity of a chimney. J. Phys. Conf. Ser. 2015, 655, 012019. [Google Scholar] [CrossRef] [Green Version]
- Costa, M.; Massarotti, N.; Indrizzi, V.; Rajh, B.; Yin, C.; Samec, N. Engineering bed models for solid fuel conversion process in grate-fired boilers. Energy 2014, 77, 244–253. [Google Scholar] [CrossRef]
- Janajreh, I.; Shrah, M.A. Numerical and experimental investigation of downdraft gasification of wood chips. Energy Convers. Manag. 2013, 65, 783–792. [Google Scholar] [CrossRef]
- Patel, S.; Biswas, P. A simplified combustion model integrated with a particle growth dynamic model for top-lit updraft cookstoves. Energy 2018, 157, 658–668. [Google Scholar] [CrossRef]
- Kshirsagar, M.P.; Kalamkar, V.R. A mathematical tool for predicting thermal performance of natural draft biomass cookstoves and identification of a new operational parameter. Energy 2015, 93, 188–201. [Google Scholar] [CrossRef]
- AICO S.p.A. Self-Cleaning Burning Pot for Heating Appliances; AICO S.p.A.: Palazzolo sull’Oglio, Italy, 2016. (In Italian) [Google Scholar]
- ISO 17225. Solid Biofuels—Fuel Specifications and Classes—Part 1: General Requirements; ISO: Geneva, Switzerland, 2014. [Google Scholar]
- EN 14785. Residential Space Heating Appliances Fired by Wood Pellets. Requirements and Test Methods; EN: Geneva, Switzerland, 2006. [Google Scholar]
- EN 13284-1. Stationary Source Emissions—Determination of low range mass concentration of dust—Part 1: Manual Gravimetric Method; EN: Geneva, Switzerland, 2017. [Google Scholar]
- Petrocelli, D.; Lezzi, A.M. A note on calculation of efficiency and emissions from wood and wood pellet stoves. J. Phys. Conf. Ser. 2015, 655, 012021. [Google Scholar] [CrossRef] [Green Version]
- Petrocelli, D.; Lezzi, A.M. CO and NO emissions from pellet stoves: An experimental study. J. Phys. Conf. Ser. 2014, 501, 012036. [Google Scholar] [CrossRef]
Figure 1.
On the left: burner pot model adopted in stoves A; on the right: burner pot model adopted in stoves B.
Figure 1.
On the left: burner pot model adopted in stoves A; on the right: burner pot model adopted in stoves B.

Figure 2.
Sketch of PM and flue gas sampling system.

Figure 3.
Average PM–O–CO values for each test performed with stoves A1, A2, B1 and B2. CO – mg/Nm at 13% of O.
Figure 3.
Average PM–O–CO values for each test performed with stoves A1, A2, B1 and B2. CO – mg/Nm at 13% of O.

Figure 4.
Average PM versus time from ignition for different test sessions for stoves B1 and B2 (left); filter color in different tests versus time from ignition (right).
Figure 4.
Average PM versus time from ignition for different test sessions for stoves B1 and B2 (left); filter color in different tests versus time from ignition (right).

Figure 5.
Sketch of combustion evolution in the “new” burner pot model.

Figure 6.
PM–O correlation with very low CO level (left); CO–O correlation with very low CO level (right). CO and PM are referred at O 13%. Data plotted are the instantaneous values collected during test B2 – 3.1.
Figure 6.
PM–O correlation with very low CO level (left); CO–O correlation with very low CO level (right). CO and PM are referred at O 13%. Data plotted are the instantaneous values collected during test B2 – 3.1.

Figure 7.
PM–O correlation with high CO level (left); CO–O correlation with high CO level (right). CO and PM are referred at O 13%. Data plotted are the instantaneous values collected during test A2 – 2.2.
Figure 7.
PM–O correlation with high CO level (left); CO–O correlation with high CO level (right). CO and PM are referred at O 13%. Data plotted are the instantaneous values collected during test A2 – 2.2.


Table 1.
Characteristics of pellet adopted during tests.
| Element | wb (% m/m) |
|---|---|
| Carbon (C) | 48.12 |
| Hydrogen (H) | 5.70 |
| Oxygen (O) | 39.80 |
| Nitrogen (N) | 0.11 |
| Water (W) | 6.00 |
| Ash | 0.18 |
| Low Heating Value (LHV) | 17,371 kJ/kg |
Table 2.
Average CO–PM–O values for each test performed with stoves A1, A2, B1, and B2.
| Test Code | Power (kW) | Time from Ignition (min) | Efficiency (%) | O (%) | CO (mg/Nm13% O) | PM (mg/Nm13% O) | Test Code | Power (kW) | Time from Ignition (min) | Efficiency (%) | O (%) | CO (mg/Nm13% O) | PM (mg/Nm13% O) |
|---|---|---|---|---|---|---|---|---|---|---|---|---|---|
| A1 – 1.1 | 7.5 | 70 | 87.1 | 9.7 | 158 | 24.1 | A2 – 1.1 | 11.4 | 95 | 87.5 | 8.6 | 83 | 16.7 |
| A1 – 1.2 | 7.6 | 140 | 87.1 | 9.7 | 114 | 27.1 | A2 – 2.1 | 11.6 | 50 | 86.7 | 9.1 | 111 | 22.6 |
| A1 – 2.1 | 8.1 | 180 | 87.3 | 9.1 | 144 | 28.9 | A2 – 2.2 | 11.6 | 110 | 86.3 | 9.5 | 62 | 15.9 |
| A1 – 2.2 | 8.0 | 260 | 87.3 | 9.0 | 127 | 42.9 | A2 – 2.3 | 11.6 | 230 | 86.8 | 9.2 | 101 | 15.8 |
| A1 – 2.3 | 8.0 | 310 | 87.3 | 9.4 | 77 | 22.5 | A2 – 3.1 | 10.3 | 200 | 88.8 | 10.1 | 163 | 26.7 |
| A1 – 3.1 | 7.6 | 355 | 87.2 | 8.4 | 165 | 28.6 | A2 – 3.2 | 10.3 | 300 | 88.1 | 9.0 | 90 | 23.8 |
| A1 – 4.1 | 8.3 | 185 | 86.8 | 9.5 | 149 | 40.3 | A2 – 3.3 | 9.9 | 570 | 88.5 | 9.9 | 46 | 24.7 |
| A1 – 4.2 | 8.3 | 305 | 86.8 | 9.5 | 75 | 29.9 | A2 – 4.1 | 11.7 | 60 | 86.3 | 9.6 | 161 | 24.5 |
| A1 – 4.3 | 8.3 | 375 | 86.8 | 9.4 | 115 | 33.3 | A2 – 4.2 | 11.6 | 100 | 85.9 | 9.8 | 159 | 19.0 |
| A1 – 5.1 | 7.6 | 105 | 85.4 | 9.2 | 63 | 34.6 | |||||||
| A1 – 6.1 | 8.7 | 105 | 87.3 | 9.1 | 117 | 26.5 | |||||||
| A1 – 6.2 | 8.4 | 190 | 87.3 | 9.5 | 78 | 34.1 | |||||||
| A1 – 7.1 | 7.9 | 80 | 86.2 | 9.6 | 63 | 30.3 | |||||||
| A1 – 7.2 | 8.1 | 260 | 86.5 | 9.1 | 111 | 37.5 | |||||||
| A1 – 8.1 | 7.4 | 70 | 85.5 | 9.8 | 147 | 26.8 | |||||||
| A1 – 8.2 | 7.4 | 335 | 85.4 | 9.5 | 34 | 18.0 | |||||||
| A1 – 9.1 | 8.1 | 360 | 86.2 | 8.4 | 73 | 23.9 | |||||||
| Mean | 8.0 | / | 86.7 | 9.3 | 106 | 30.0 | Mean | 11.1 | / | 87.2 | 9.4 | 108 | 21.1 |
| St. Dev. | 0.4 | / | 0.7 | 0.4 | 39 | 6.5 | St. Dev. | 0.7 | / | 1.1 | 0.5 | 44 | 4.2 |
| B1 – 1.1 | 8.8 | 55 | 88.9 | 9.3 | 8 | 13.0 | B2 – 1.1 | 9.9 | 80 | 91.3 | 8.6 | 29 | 12.0 |
| B1 – 1.2 | 8.8 | 145 | 89.4 | 8.3 | 7 | 14.2 | B2 – 2.1 | 10.1 | 50 | 91.2 | 8.5 | 29 | 10.5 |
| B1 – 1.3 | 8.8 | 220 | 89.7 | 7.8 | 5 | 17.4 | B2 – 2.2 | 10.1 | 125 | 91.7 | 7.7 | 33 | 12.9 |
| B1 – 1.4 | 8.8 | 320 | 89.7 | 7.8 | 7 | 18.5 | B2 – 3.1 | 10.1 | 95 | 91.6 | 8.1 | 24 | 10.6 |
| B1 – 2.1 | 8.3 | 110 | 90.9 | 9.6 | 15 | 11.4 | B2 – 3.2 | 10.1 | 160 | 91.4 | 7.9 | 20 | 14.0 |
| B1 – 2.2 | 8.3 | 340 | 91.5 | 8.3 | 7 | 16.0 | B2 – 3.3 | 10.1 | 260 | 91.5 | 7.7 | 32 | 16.2 |
| B1 – 3.1 | 8.8 | 110 | 92.0 | 6.6 | 7 | 13.5 | B2 – 3.4 | 10.1 | 310 | 91.6 | 7.6 | 36 | 17.8 |
| B1 – 3.2 | 8.8 | 235 | 92.6 | 5.5 | 19 | 15.7 | B2 – 3.5 | 10.1 | 375 | 91.4 | 7.7 | 21 | 15.9 |
| B1 – 3.3 | 8.8 | 285 | 92.9 | 5.2 | 40 | 15.2 | B2 – 3.6 | 10.1 | 435 | 91.7 | 7.5 | 62 | 20.0 |
| B1 – 4.1 | 8.5 | 90 | 91.8 | 7.3 | 8 | 11.0 | B2 – 4.1 | 10.4 | 85 | 91.0 | 7.1 | 17 | 16.3 |
| B1 – 4.2 | 8.5 | 170 | 91.7 | 7.1 | 10 | 12.7 | B2 – 4.2 | 10.3 | 140 | 90.7 | 7.4 | 15 | 18.3 |
| B1 – 4.3 | 8.3 | 275 | 92.4 | 6.6 | 8 | 15.0 | B2 – 4.3 | 10.3 | 170 | 90.5 | 7.4 | 13 | 23.3 |
| B1 – 4.4 | 7.9 | 365 | 92.0 | 6.8 | 10 | 16.6 | B2 – 5.1 | 10.2 | 140 | 90.4 | 8.3 | 9 | 11.4 |
| B1 – 4.5 | 8.8 | 435 | 92.4 | 5.7 | 34 | 21.2 | B2 – 5.2 | 10.2 | 240 | 90.4 | 8.0 | 7 | 12.2 |
| B1 – 5.1 | 8.4 | 85 | 91.0 | 7.0 | 11 | 14.7 | B2 – 6.1 | 10.0 | 95 | 90.7 | 8.2 | 7 | 12.1 |
| B2 – 6.2 | 10.0 | 135 | 91.1 | 7.4 | 7 | 12.6 | |||||||
| Mean | 8.6 | / | 91.3 | 7.3 | 13 | 15.1 | Mean | 10.1 | / | 91.1 | 7.8 | 23 | 14.8 |
| St. Dev. | 0.3 | / | 1.3 | 1.3 | 10 | 2.7 | St. Dev. | 0.1 | / | 0.5 | 0.5 | 14 | 3.7 |
© 2019 by the authors. Licensee MDPI, Basel, Switzerland. This article is an open access article distributed under the terms and conditions of the Creative Commons Attribution (CC BY) license (http://creativecommons.org/licenses/by/4.0/).
Share and Cite
MDPI and ACS Style
Polonini, L.F.; Petrocelli, D.; Parmigiani, S.P.; Lezzi, A.M. Influence on CO and PM Emissions of an Innovative Burner Pot for Pellet Stoves: An Experimental Study. Energies 2019, 12, 590. https://doi.org/10.3390/en12040590
AMA Style
Polonini LF, Petrocelli D, Parmigiani SP, Lezzi AM. Influence on CO and PM Emissions of an Innovative Burner Pot for Pellet Stoves: An Experimental Study. Energies. 2019; 12(4):590. https://doi.org/10.3390/en12040590
Chicago/Turabian StylePolonini, Luigi F., Domenico Petrocelli, Simone P. Parmigiani, and Adriano M. Lezzi. 2019. "Influence on CO and PM Emissions of an Innovative Burner Pot for Pellet Stoves: An Experimental Study" Energies 12, no. 4: 590. https://doi.org/10.3390/en12040590
Note that from the first issue of 2016, this journal uses article numbers instead of page numbers. See further details here.