Analyzing Load Profiles of Energy Consumption to Infer Household Characteristics Using Smart Meters

Institute of Information Systems, Innopolis University, Innopolis 420500, Republic of Tatarstan, Russia
*
Author to whom correspondence should be addressed.
Energies 2019, 12(5), 773; https://doi.org/10.3390/en12050773
Submission received: 14 December 2018
/
Revised: 19 February 2019
/
Accepted: 20 February 2019
/
Published: 26 February 2019
Abstract
:The increasing penetration of smart meters provides an excellent opportunity to monitor and analyze energy consumption in residential buildings. In this paper, we propose a framework to process the observed profiles of energy consumption to infer the household characteristics in residential buildings. Such characteristics can be used for improving resource allocation and for an efficient energy management that will ultimately contribute to reducing carbon dioxide (CO) emission. Our approach is based on automated extraction of features from univariate time-series data and development of a model through a variant of the decision trees technique (i.e., ensemble learning mechanism) random forest. We process and analyzed energy consumption data to answer four primitive questions. To evaluate the approach, we performed experiments on publicly available datasets. Our experiments show a precision of 82% and a recall of 81% in inferring household characteristics.
1. Introduction
In recent decades, modern urbanization and human lifestyle increased the consumption of coal, oil, and natural gas. As a result, a large amount of CO is emitted and half of it remains in the atmosphere [1]. This causes the climate change and threatens the ecosystem of our planet. A significant portion of CO emissions comes from the energy consumption of buildings. For this reason, a number of studies have been performed to investigate abnormal behaviors [2]. According to [3], in developed countries, a huge amount of energy is consumed by buildings while 50∼65% of it is consumed in the form of electricity to power different devices. This consumption is related to various activities including electrical appliances, lightning, heating, and cooling systems. A large amount of energy is wasted in both residential and commercial buildings. If we know the occupants’ characteristics then an energy saving campaign can be beneficial for both energy providers as well as consumers. For instance, a residential building occupied by a working couple, in winter season, the heating system keeps the house warm all day even if nobody is inside before 18:00. If we know detailed household information then it is possible to optimize the heating usage. A system may turn off the thermostats during day-time and turn it on again a few hours before the couple arrive home. In this way, people do not experience any reduction of the temperature but only a significant saving. Such household characteristics can play an important role in reducing the energy consumption that will ultimately contribute to reducing the global warming of our planet. The household characteristics may project the demographic statistics of the population. Such information can be utilized to forecast the future demand of an area and to develop tailored policies. Similarly, using the household characteristics, it will be possible to compare similar profiles to suggest improvements in appliances usage. To provide household characteristics, a relevant amount of effort and money is required to perform surveys. It is very difficult to keep the information up-to-date due to changes in people’s behaviours and the number of family members. For instance, the United Kingdom Census faced criticism about outdated data and the time required to collect the data (i.e., at least two years) [4].
In contrast, it is possible to infer household characteristics automatically by analyzing the smart meter energy consumption logs. Smart meters are one of the easiest ways to collect energy consumption data in buildings and transfer the information to the smart grid/cloud infrastructure. It is an unobtrusive way to gather the energy consumption information without changing the internal infrastructure of the buildings. Around the globe, many countries including the UK, USA, China, Japan, Denmark, and Switzerland installed smart meters in both fields and laboratory environments [5,6]. We believe that in coming years, smart meters will be a popular technology to monitor energy consumption around the globe. Smart meters provide univariate time-series data streams about the energy consumption inside buildings. Processing univariate time-series data is more challenging than multivariate time-series data since there is no additional information from other data sources that can be used to train machine learning models [7]. Moreover, a huge amount of data is generated from these smart meters because the most recent versions are able to measure the energy consumption at very high resolution (i.e., every 6∼8 s) [8]. To analyze this data, a timeframe is defined to look inside the collected data logs. This analysis has four different levels: (i) long-term analysis (with a timeframe of years); (ii) medium-term (with a timeframe of months); (iii) short-term (with a timeframe of weeks); and (iv) very short-term (with a timeframe of days or hours). In this paper, we mainly focus on medium-term analysis; however, we expect that our framework can be used at all levels. The main reason to choose medium-term analysis is to reduce the computation cost of the data processing (detailed discussion in Section 3).
Our framework can provide unique insights of electricity consumption in residential buildings by revealing the information about household characteristics. These characteristics are related to a household’s socio-economic status. For instance, home appliances, number of inhabitants, employment status, etc. The result of this research can help to identify the relationship between energy consumption and household characteristics, predict future energy demands, demographics, and population statistics. Some researchers believe that household characteristics may lead to loss of privacy while others pointed out this issue as a matter of trust [9]. In contrast, telecommunication, retail, and finance section already process transactional data to provide higher-quality services to individuals and service providers [4]. We formulate the problem as a time-series data analysis without having the information about their identities. Each residential building has different energy usage patterns according to the inhabitant’s interaction with objects but contains similarities based on household characteristics. We processed and analyzed the energy consumption data to answer the following questions:
- Q1: How many inhabitants are there in the building?
- Q2: What is the employment status of the inhabitant(s)?
- Q3: How many electrical appliances are in the building?
- Q4: How many bedrooms are in the building?
The above questions provide high-level information to energy providers. The proposed questions are based on similar studies found in literature [4,10]. The objective of this paper is to predict the household characteristics based on the univariate time-series data of smart meter and reveal the complex relationships among them. The main contribution of this research is to develop an open-source framework [11] to impute the household characteristics to determine the energy consumption patterns at residential levels. We formulate our problem as follows.
Problem Formulation
Let be a set of n residential houses characterized by m-household characteristics . The energy consumption for each house is and logged by smart meter as . The data is segmented by defining a time window w over and extract d dimension features over a period of time t for each residential building. According to the household characteristics, the learning model is formulated as:
where F is a feature vector regardless of the specific house with c household characteristics information to compute it. We build a random forest based predictor to predict c from F based on the learned model that is described in Equation (1). We empirically evaluate different techniques (support vector machine, k nearest neighbours, and simple decision tree) and we have found out that the random forest provides better performance over the extracted feature vector F.
2. Related Work
The research community has already recognized a strong relationship between the household characteristics and household energy consumption [12,13,14]. To make inferences from the smart meter data, many researchers utilized the univariate time-series data to train machine learning models and compute household characteristics. These household characteristics are extracted from survey data collected during the installation of smart meters.
Ben Anderson et al. [4] assessed the viability of determining household characteristics based on electricity consumption using smart meters. Their findings help to summarize the key features of household load profiles and enable differentiation between residential buildings. Their approach is based on multi-level regression and coding of exploratory variables. In this case, a tremendous effort and domain expert knowledge is required to code the exploratory variables. They also conclude that statistics and machine learning models could be an alternative to estimate the features and predict the household characteristics.
Han et al. [15] addressed the importance of household characteristics for predicting the energy consumption. They developed a data-driven forecasting model to predict the household characteristics of residential buildings. They utilized random forest and their feature set includes the number of inhabitants, electrical appliances, employment status, etc. Their contribution is in the analysis of the collected dataset to determine the important features. It requires a deep domain knowledge and expertise to handcraft it.
Similarly, Viegas et al. [16] developed a method to classify new electricity customers based on surveys and smart metering data. They carefully extracted the features from the survey data as well as processed the smart meter data for working days only. They applied clustering techniques to group the data, then they used a decision tree to classify the new customers. They concluded that household characteristics play a crucial role to classify new customers during the classification as well as defining the policies for energy consumption.
An early work of Chicoo et al. [17] focused on clustering and self-organizing maps (SOM) techniques to classify the electricity customers based on their load pattern analysis. In the first phase, their technique utilizes the clustering mechanism and require user-defined thresholds to specify the clusters. After that, they applied the SOM method to provide the explanation of the clustering procedure. The drawback of this methodology is the need of user-defined thresholds for the identification of clusters and required post-processing of the results to form the clusters.
Carolina et al. [12] focused on the heating of Danish dwellings by analyzing the daily load profiles of energy consumption using k-means method. The obtained clusters have influenced the socio-economic characteristics. Furthermore, their study also concludes that such characteristics are important to support better methods for demand-side management.
Christian Beckel et al. [10] introduced a framework to automatically classify the socio-economic household’s characteristics using electricity consumption data. In their research, they defined comprehensive feature set including consumption, ratios of consumption, features related to temporal dynamics, statistical properties, and the first ten principal components of dimensionality reduction algorithm Principal Component Analysis (PCA). They also used four different types of classifiers: k-Nearest Neighbor (kNN), Linear Discriminant Analysis (LDA), Mahalanobis classifier and the Support Vector Machine (SVM). They achieved an accuracy of 50–80% to classify the household characteristics.
Our proposed architecture extends the current state of the art to infer household characteristics that are helpful for forecasting energy consumption loads as well as developing of strategies to reduce energy consumption. In our framework, problem is formulated into machine learning framework and extract household characteristic by processing the time-series data of smart meters. The proposed framework extracts features automatically without involving domain expertees or any knowledge about the domain.
3. Methods
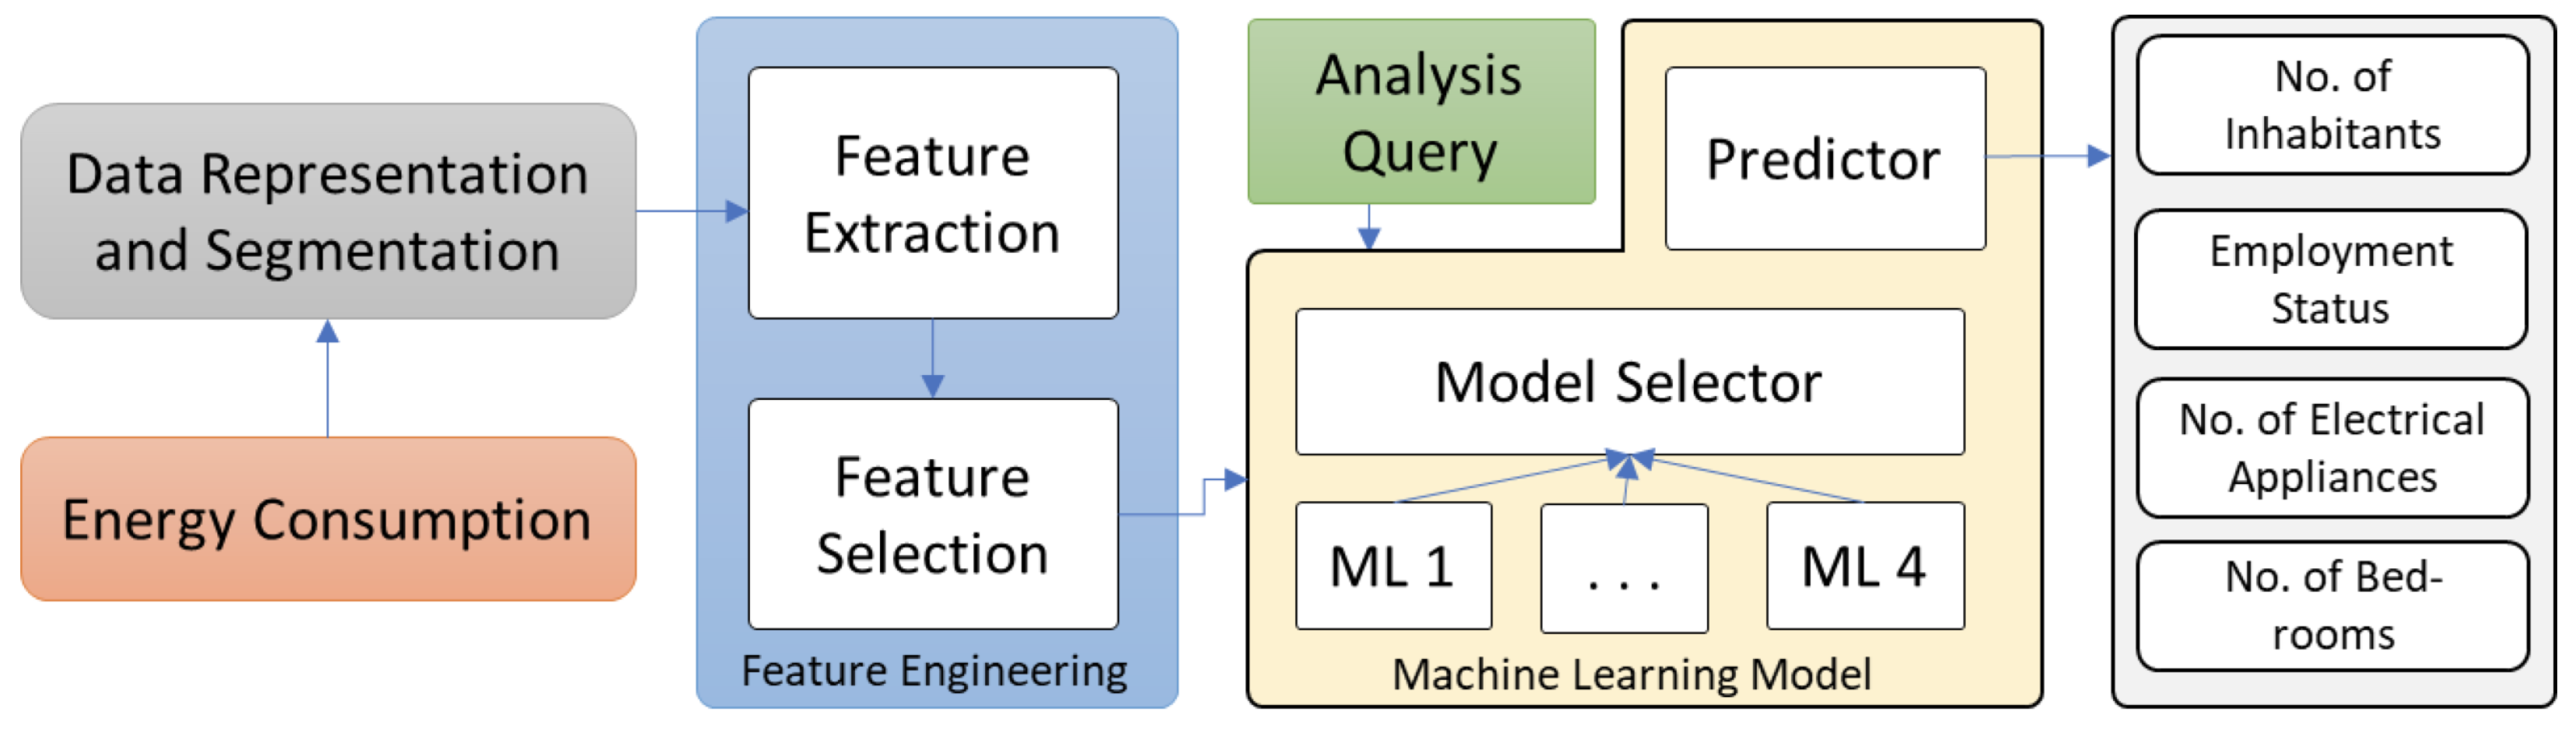
The proposed architecture of load profiles of energy consumption to infer household activities is illustrated in Figure 1, which includes four major components:
- Data Representation and Segmentation: collection and division of the time-series energy consumption observations from the smart meters.
- Features Engineering: extraction of the useful information to recognize the household characteristics.
- Analysis Query: a pre-defined user query to predict the household characteristics.
- Machine Learning Model: learning the load profiles during the training phase and inferring the household characteristics in the prediction phase.
The details of each component are described in the following sections.
3.1. Data Representation and Segmentation
Smart meters logged the energy consumption data as a sequence of a time-stamp and a number (i.e., amount of energy used in kwh). This is an enormous amount of data and required specific structure to obtain the underlying pattern. Figure 2 represents the order sequence of values logged by the smart meter over a sample rate of 6∼8 s for one month and the descriptive statistics are provided in Table 1.
In Table 1, the total number of instances (N) is about 0.4 million, collected over a period of one month. The data processing is a computationally intense task and it grows exponential with the size of the time frame considered [18]. The data representation window (also known as a segmentation window) is defined as 30 min. This segment is sufficient to compute the household characteristics over the energy consumption data.
3.2. Feature Engineering
The data representation step preserves the underlying structure of the time-series data and is able to process it further for extracting useful information. A feature engineering step transforms the data to have a better representation, which is non-linearly correlated and able to extract more complex relations with the households characteristics. In previous studies, researchers focused on calculating the statistical and descriptive properties manually (e.g., their descriptive statistics, temporal and consumption figures, etc.) [10,19]. Recently, automated calculation of a significant number of time-series features has been introduced and successfully applied in many application areas. Automated calculation explores all the possible features from the time-series data and performs the feature selection to extract the most influential one for the specific domain [20,21,22]. We used a time-series feature extraction library based on scalable hypothesis tests (also known as TSFRESH) that accelerates this process by combining 63-time-series characterization methods, which compute a total of 794 descriptive time-series features (from a simple mean to a power spectral density). Primary features are listed in Table 2 and the complete list of 794-descriptive features are available in [23].
Regarding energy feature, the extracted information is: absolute energy, ratios, and Fast Fourier Transformation (FFT) coefficients and its aggregate. The algorithm is able to find the quantitative characteristics of time-series data and indicates the dynamics of energy usage. In auto-correlation, a self association is extracted with a delayed copy of the signal using lag from 0 to 9 as well as partial auto correlation. Furthermore, the extracted features are entropy, auto-regressive coefficient, mean absolute estimation, number of crossings and peaks. A single feature is not adequate to predict the inhabitant characteristic and extracted features (i.e., Table 2) assist the machine learning model to predict the inhabitant’s characteristics.
After feature extraction, we also performed feature selection on the basis of automatically configured statistical hypothesis tests [23]. During this step, the feature space is reduced according to our energy consumption class labels and the most relevant ones are highlighted. This process allows our model to learn more efficiently.
3.3. Analysis Query
For the purpose of analysing the energy consumption data for extracting information, analysts pose high-level queries to understand the consumption patterns in different houses. These queries are based on our questions (Section 1) and details are provided in Table 3.
In Table 3, “couple with children” means “couple with one or two children”. Similarly, “family with grandparents” means “couple with one/two kids and grandparents”, therefore in total four adults and one/two kids. In all selected houses for analysis, only a single person is employed full-time while the others have no earnings.
3.4. Machine Learning Model
Learning the information from the training data and predicting the household characteristics is a challenging task. The selection of the machine learning model is critical to answer the analyst queries. Different supervised learning classifiers have been evaluated including: decision tree, support vector machine, random forest, and k-nearest neighbour. We have selected such methods because they are highly competitive in many application domains and used in many real-life applications [24,25]. Our findings show that random forest outperformed as compared to other classifiers. The random forest is an ensemble variant of the decision tree that add an addition layer of randomness to bagging [26]. This model can provide good results due to its property of generating many classifiers and fuse their results. To learn a generalized model, we combine the different residential buildings data which shared the same household characteristics. For instance, the residential houses A and B have two inhabitants, these houses features have been combined and set the household characteristic to couple. In this case, four different machine learning models are trained. Each model is trained on a single query under investigation (i.e., depicted in Table 3). For example: machine learning model one (ML1) is trained to predict the number of inhabitants in a residential building (as shown in Figure 1). During the prediction phase, the model selector selects an appropriate model according to the query and predicts the output. Training and prediction phases of the model are discussed as follows.
3.4.1. Training Phase
In this phase, the model is trained to learn the different household characteristics. The dataset has been split and the model has been trained on 70% of the dataset and tested over the remaining 30% of data. Figure 3 shows the training process of each individual model.
3.4.2. Prediction Phase
In the prediction module, the selection mechanism has been performed on the trained models according to the analyst query and predicted the household characteristics. Figure 4 presents the prediction phase of our proposed framework.
4. Results and Discussion
4.1. Dataset
The experiments are performed on an electrical load measurements dataset. This dataset includes the aggregate loads and individual appliance measurements over the interval of 8 s. It is collected over a period of two years from 20 houses in the United Kingdom and publicly available for the research community. The detail about the houses description is presented in appendix Table A1. These 20 houses are occupied by single people, couples, couples with children and families with grandparents. During the collection of the dataset, the occupants were conducting their usual routines. A detailed description of the dataset and the related meta data information can be found in [8]. We selected one month of smart meter data (i.e., January 2015) of five houses that contain the information about our analysis queries. These houses are house one, two, 11, 12, and 16 according to the dataset files. This dataset is imbalanced in terms of inhabitant characteristics prediction. It is imbalanced since there are many houses with only couples or families with kids. Considering all houses can bias the results and dominate the minor classes. We use an undersampling technique to deal with the class-imbalance problem and include every unique house in our analysis. The five selected houses covered all the variations in the dataset to predict the inhabitant behavior.
4.2. Performance Measures
Evaluating the framework has entailed using five standard standard metrics [27] (confusion matrix, precision, recall, F1-score and class-accuracy) as performance measures. In Table 4, a general confusion matrix is presented with a detailed breakdown of correct and incorrect predictions for each household characteristic.
4.3. Experiments
The experiments were performed independently for each of the household characteristics listed in Table 3. A comparison has been provided with decision tree, support vector machine and k-nearest neighbours methods and the performance is evaluated based on the defined evaluation metrics.
4.3.1. Results and Analysis of Query 1
The analysis query 1 is based on the number of inhabitants in the residential houses. We present the class accuracy of predicted household characteristic—single, couple, couple with one children/children and family with grandparents in Figure 5 followed by confusion matrix in Table 5.
In Table 5, the highest accuracy is achieved in case of couple follow by single inhabitant, while the overall accuracy is more than 79%. In Table 5, the result of the proposed framework is presented in a confusion matrix for our query 1. The number of inhabitants couple, single and couple with children are predicted with a minimum accuracy of 81%. The worst predictions are in the case of family with grand parents which was predicted with only 60% accuracy.
4.3.2. Results and Analysis of Query 2
The analysis query 2 is based on the employment status of the residents and categorized as full-time and retired. In the case of full-time employment prediction, the results are close to 100%, whereas retired is confused with full-time but accuracy is still 67%. The individual class accuracy is presented in Figure 6 and confusion matrix of employment status is presented in Table 6.
In Table 6, the number of instances for retired is small as compared to full-time. Due to this reason, the learner has insufficient amount of information to learn more accurately. In our implementation, we consider balanced variant of random forest but the amount of data of retired compared to full-time is still insufficient.
4.3.3. Results and Analysis of Query 3
This query is based on the number of appliances in the residential building and divided into three categories: low, medium, and high. Figure 7 presents the class accuracy of appliances and confusion matrix for the number of appliances in Table 7.
Our framework predicts the low and medium category of appliances with an average accuracy of 83%, while it gets worse results when the number of appliances in the house increases. The prediction is more than 50% correct in all cases of appliances. It mixes the rest of the instances with low and medium.
4.3.4. Results and Analysis of Query 4
This query analyzes the smart meter data for predicting the number of bedrooms inside a residential building. According to the provided information in the dataset, it contains 3-bedrooms, 4-bedrooms, and 5-bedrooms. The overall class accuracy achieved is 76%. In particular, 3-bedrooms are highly predicted (95%), while 5-bedrooms has the lowest prediction (51%). The detail of each class accuracy is presented in Figure 8 and in the confusion matrix in Table 8.
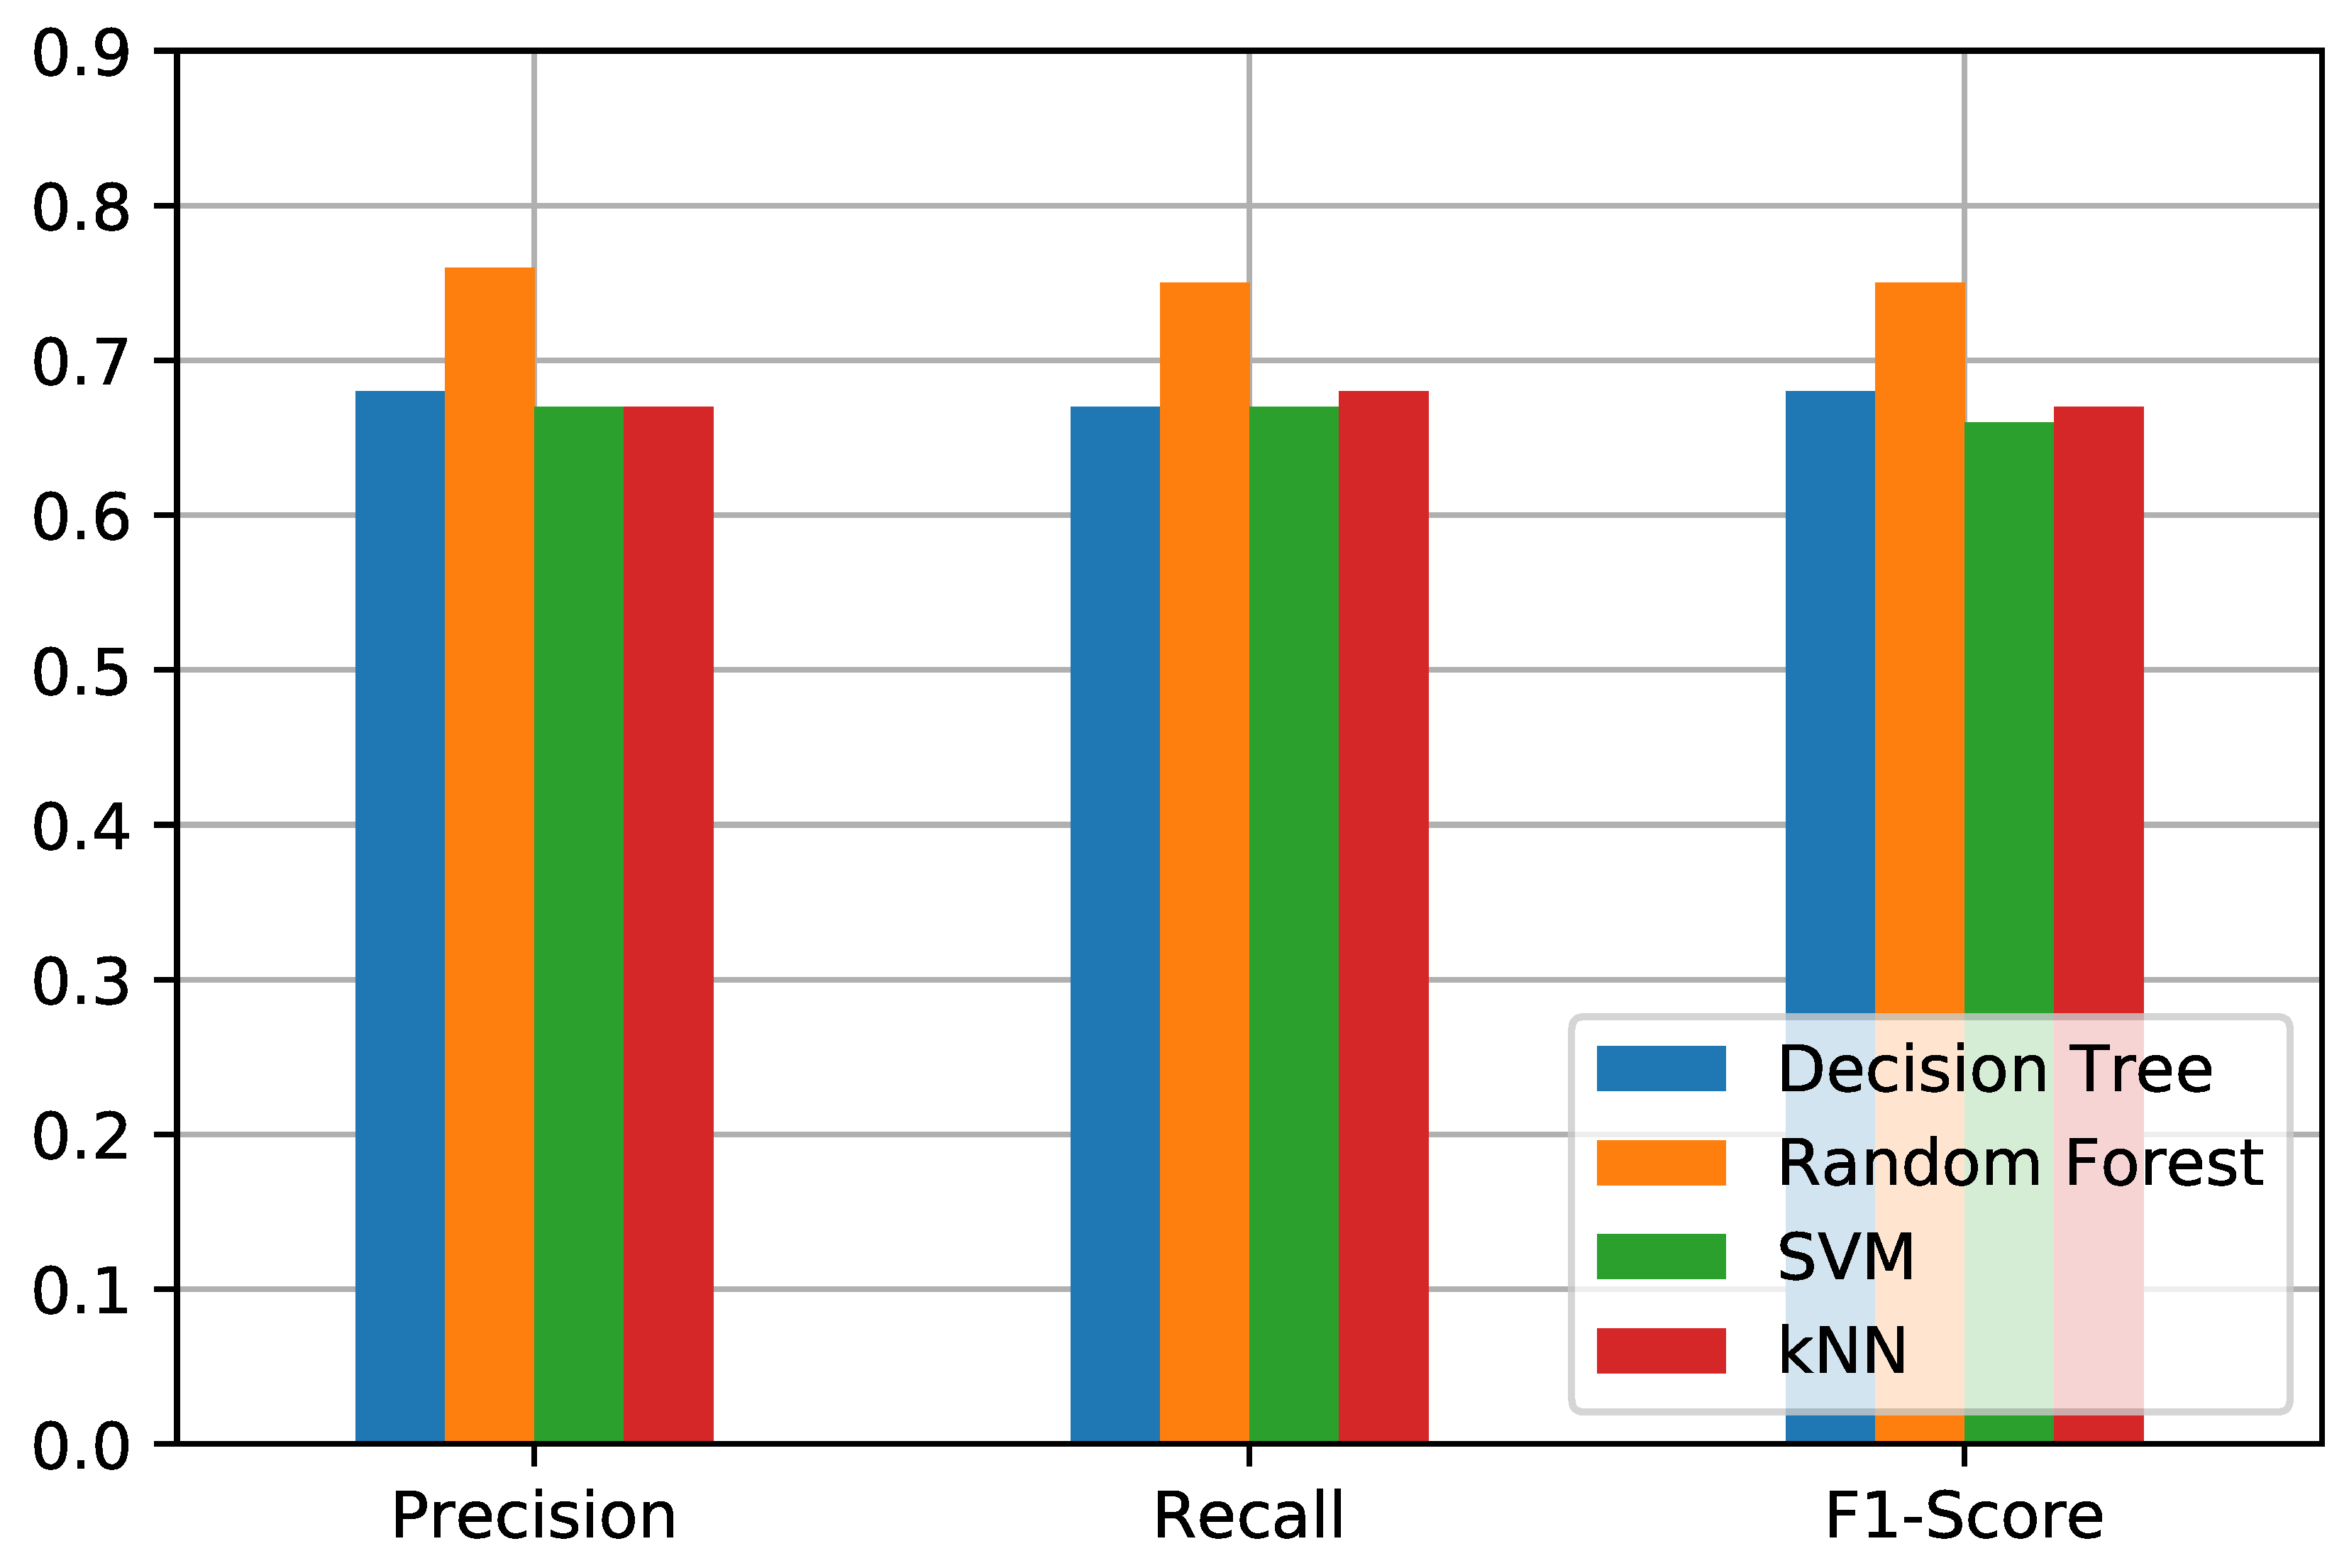
4.4. Comparison
The obtained results are highly accurate in case of small number of household characteristics in all queries to our framework. While lower performances are achieved when the number of characteristics increases. We also compared our framework prediction with the state-of-the-art methods such as decision tree, support vector machine, and k-nearest neighbour. Figure 9, Figure 10, Figure 11 and Figure 12 present the Precision, Recall, and F1-score for all the queries 1, 2, 3, and 4 respectively.
5. Conclusions
Energy consumption varies according to the household characteristics. The developed framework is able to infer the household characteristics by analyzing the energy consumption profiles. It is based on processing univariate time-series data of smart meters to predict the number of inhabitants with their employment status, electrical appliances, and number of bedrooms in residential buildings. The outcome of this research can be used to infer the population statistics and demographics of a particular area. Furthermore, the knowledge of household characteristics is extremely important to introduce energy-saving strategies in residential buildings. We evaluated the performance of our model using a publicly available data set of residential buildings. As discussed in the previous section, the obtained results are better compared to the state-of-the-art in some specific areas.
The next step in this work is to process high-resolution smart metering data for detecting the most energy hungry devices inside the residential buildings.
Author Contributions
M.F. is the principal researcher of this research. A.S. contributed to design the framework and draft the manuscript. Both authors contributed equally to finalize the manuscript.
Funding
This research received no external funding.
Conflicts of Interest
The authors declare no conflict of interest.
Appendix A
In this section, we present the publicly available detail description of houses icluding occupancy, construction year, electrical appliances, type and size in terms of bedrooms. The house number 14 is not present in the the table since it is missing in the meta data file of the dataset [8].

Table A1.
Detailed description of the houses including occupancy, construction year, appliances owned, type and size in terms of bedrooms.
Table A1.
Detailed description of the houses including occupancy, construction year, appliances owned, type and size in terms of bedrooms.
| House | Occupancy | Construction Year | Appliances Owned | Type | Size |
|---|---|---|---|---|---|
| 1 | 2 | 1975–1980 | 35 | Detached | 4 bed |
| 2 | 4 | - | 15 | Semi-detached | 3 bed |
| 3 | 2 | 1988 | 27 | Detached | 3 bed |
| 4 | 2 | 1850–1899 | 33 | Detached | 4 bed |
| 5 | 4 | 1878 | 44 | Mid-terrace | 4 bed |
| 6 | 2 | 2005 | 49 | Detached | 4 bed |
| 7 | 4 | 1965–1974 | 25 | Detached | 3 bed |
| 8 | 2 | 1966 | 35 | Detached | 2 bed |
| 9 | 2 | 1919–1944 | 24 | Detached | 3 bed |
| 10 | 4 | 1919–1944 | 31 | Detached | 3 bed |
| 11 | 1 | 1945–1964 | 25 | Detached | 3 bed |
| 12 | 3 | 1991–1995 | 26 | Detached | 3 bed |
| 13 | 4 | post 2002 | 28 | Detached | 4 bed |
| 15 | 1 | 1965–1974 | 19 | Semi-detached | 3 bed |
| 16 | 6 | 1981–1990 | 48 | Detached | 5 bed |
| 17 | 3 | mid 60s | 22 | Detached | 3 bed |
| 18 | 2 | 1965–1974 | 34 | Detached | 3 bed |
| 19 | 4 | 1945–1964 | 26 | Semi-detached | 3 bed |
| 20 | 2 | 1965–1974 | 39 | Detached | 3 bed |
| 21 | 4 | 1981–1990 | 23 | Detached | 3 bed |
References
- Mardiana, A.; Riffat, S. Building energy consumption and carbon dioxide emissions: Threat to climate change. J. Earth Sci. Clim. Chang. 2015, 1. [Google Scholar] [CrossRef]
- Fahim, M.; Sillitti, A. An Anomaly Detection Model for Enhancing Energy Management in Smart Buildings. In Proceedings of the 2018 IEEE International Conference on Communications, Control, and Computing Technologies for Smart Grids (SmartGridComm), Aalborg, Denmark, 29–31 October 2018. [Google Scholar]
- Gul, M.S.; Patidar, S. Understanding the energy consumption and occupancy of a multi-purpose academic building. Energy Build. 2015, 87, 155–165. [Google Scholar] [CrossRef] [Green Version]
- Anderson, B.; Lin, S.; Newing, A.; Bahaj, A.; James, P. Electricity consumption and household characteristics: Implications for census-taking in a smart metered future. Comput. Environ. Urban Syst. 2017, 63, 58–67. [Google Scholar] [CrossRef] [Green Version]
- Wang, Y.; Chen, Q.; Hong, T.; Kang, C. Review of smart meter data analytics: Applications, methodologies, and challenges. IEEE Trans. Smart Grid 2018. [Google Scholar] [CrossRef]
- Zufferey, T.; Ulbig, A.; Koch, S.; Hug, G. Forecasting of smart meter time series based on neural networks. In Proceedings of the International Workshop on Data Analytics for Renewable Energy Integration, Riva del Garda, Italy, 23 September 2016; Springer: Cham, Switzerland, 2016; pp. 10–21. [Google Scholar]
- Du Preez, J.; Witt, S.F. Univariate versus multivariate time series forecasting: An application to international tourism demand. Int. J. Forecast. 2003, 19, 435–451. [Google Scholar] [CrossRef]
- Murray, D.; Stankovic, L.; Stankovic, V. An electrical load measurements dataset of United Kingdom households from a two-year longitudinal study. Sci. Data 2017, 4, 160122. [Google Scholar] [CrossRef] [PubMed]
- Bugden, D.; Stedman, R. A synthetic view of acceptance and engagement with smart meters in the United States. Energy Res. Soc. Sci. 2019, 47, 137–145. [Google Scholar] [CrossRef]
- Beckel, C.; Sadamori, L.; Santini, S. Automatic socio-economic classification of households using electricity consumption data. In Proceedings of the Fourth International Conference on Future Energy Systems, Berkeley, CA, USA, 21–24 May 2013; pp. 75–86. [Google Scholar]
- Source Code (GitLab Link). Available online: https://gitlab.com/IU-CPSLab/dataanalysis/tree/master/Univariate%20Time%20Series%20Analysis (accessed on 25 February 2019).
- do Carmo, C.M.R.; Christensen, T.H. Cluster analysis of residential heat load profiles and the role of technical and household characteristics. Energy Build. 2016, 125, 171–180. [Google Scholar] [CrossRef]
- McLoughlin, F.; Duffy, A.; Conlon, M. Evaluation of time series techniques to characterise domestic electricity demand. Energy 2013, 50, 120–130. [Google Scholar] [CrossRef] [Green Version]
- Du, P.; Wood, A.; Stephens, B. Empirical operational energy analysis of downtown high-rise vs. suburban low-rise lifestyles: A Chicago Case Study. Energies 2016, 9, 445. [Google Scholar] [CrossRef]
- Han, Y.; Sha, X.; Grover-Silva, E.; Michiardi, P. On the impact of socio-economic factors on power load forecasting. In Proceedings of the 2014 IEEE International Conference on Big Data (Big Data), Washington, DC, USA, 27–30 October 2014; pp. 742–747. [Google Scholar]
- Viegas, J.L.; Vieira, S.M.; Melício, R.; Mendes, V.M.F.; Sousa, J.M. Classification of new electricity customers based on surveys and smart metering data. Energy 2016, 107, 804–817. [Google Scholar] [CrossRef] [Green Version]
- Chicco, G.; Napoli, R.; Piglione, F.; Postolache, P.; Scutariu, M.; Toader, C. Load pattern-based classification of electricity customers. IEEE Trans. Power Syst. 2004, 19, 1232–1239. [Google Scholar] [CrossRef]
- Thumim, J.; Wilcox, T.; Roberts, S. Managing and Mining Smart Meter Data-at Scale; Presentation Delivered at the CSE Project Showcase, 9 July 2013; Centre for Sustainable Energy: Bristol, UK, 2013. [Google Scholar]
- Abreu, J.M.; Pereira, F.C.; Ferrão, P. Using pattern recognition to identify habitual behavior in residential electricity consumption. Energy Build. 2012, 49, 479–487. [Google Scholar] [CrossRef]
- Koh, J.; Hong, D.; Gupta, R.; Whitehouse, K.; Wang, H.; Agarwal, Y. Plaster: An integration, benchmark, and development framework for metadata normalization methods. In Proceedings of the 5th Conference on Systems for Built Environments, Shenzen, China, 7–8 November 2018; pp. 1–10. [Google Scholar]
- LaCasse, P.M.; Otieno, W.; Maturana, F.P. A hierarchical, fuzzy inference approach to data filtration and feature prioritization in the connected manufacturing enterprise. J. Big Data 2018, 5, 45. [Google Scholar] [CrossRef]
- Medico, R.; Lambrecht, N.; Pues, H.; Ginste, D.V.; Deschrijver, D.; Dhaene, T.; Spina, D. Machine Learning Based Error Detection in Transient Susceptibility Tests. IEEE Trans. Electromagn. Compat. 2018, 99, 1–9. [Google Scholar] [CrossRef]
- Christ, M.; Braun, N.; Neuffer, J.; Kempa-Liehr, A.W. Time Series FeatuRe Extraction on basis of Scalable Hypothesis tests (tsfresh—A Python package). Neurocomputing 2018, 307, 72–77. [Google Scholar] [CrossRef]
- Wu, X.; Kumar, V.; Quinlan, J.R.; Ghosh, J.; Yang, Q.; Motoda, H.; McLachlan, G.J.; Ng, A.; Liu, B.; Philip, S.Y.; et al. Top 10 algorithms in data mining. Knowl. Inf. Syst. 2008, 14, 1–37. [Google Scholar] [CrossRef]
- Fahim, M.; Baker, T.; Khattak, A.M.; Shah, B.; Aleem, S.; Chow, F. Context Mining of Sedentary Behaviour for Promoting Self-Awareness Using a Smartphone. Sensors 2018, 18, 874. [Google Scholar] [CrossRef] [PubMed]
- Breiman, L. Random forests. Mach. Learn. 2001, 45, 5–32. [Google Scholar] [CrossRef]
- Alpaydin, E. Introduction to Machine Learning; MIT Press: Cambridge, MA, USA, 2009. [Google Scholar]
Figure 1.
The proposed architecture for analyzing the energy profiles. The energy consumption flows from smart meters to data representation and segmentation block, where continuous data is chunked. Later, we extracted the features and passed the selected features to a machine learning model for learning the household characteristics. Based on the query, the learned model will predict the household characteristics.

Figure 2.
The data representation of one month of energy consumption—January 2015.

Figure 3.
The model training mechanism to identify the different household characteristics.

Figure 4.
The model prediction to infer the household characteristics.

Figure 5.
The model prediction.

Figure 6.
The model prediction of employment status.

Figure 7.
The model prediction of number of appliances.

Figure 8.
The model prediction of number of bedrooms.

Figure 9.
Q1—Precision, Recall, and F1-Score to predict the number of inhabitants.

Figure 10.
Q2—Precision, Recall, and F1-Score to predict the employment status.

Figure 11.
Q3—Precision, Recall, and F1-Score to predict the number of electrical appliances.

Figure 12.
Q4—Precision, Recall, and F1-Score to predict the number of bedrooms.

Table 1.
Descriptive statistics for electricity consumption of one month—January 2015.
| Data | N | Mean | Std. Dev. | Min. | Max. | 25 Percentile | 50 Percentile | 75 Percentile |
|---|---|---|---|---|---|---|---|---|
| Jan. | 396,705 | 517.30 | 836.96 | 0.00 | 16,309.00 | 196.00 | 270.00 | 405.00 |
Table 2.
A subset of the extracted features.
| Feature | Feature Details |
|---|---|
| Energy | Absolute energy |
| Energy ratio | |
| FFT aggregate and coefficients | |
| Autocorrelation | Lag from 0∼9, mean median, and variance |
| Partial autocorrelation | |
| Linear trend intercept | Standard deviation, max, min, mean and variance |
| Wavelet | Continuous wavelet coefficients and peaks |
| Statistical | Entropy |
| Auto-regressive coefficient | |
| Mean absolute change | |
| Spectral density estimation | |
| Signal Symmetry | |
| Miscellaneous | Number of crossings |
| Number of peaks |
Table 3.
Analyst query to infer the household characteristics of residential buildings.
| No. | Query | Prediction |
|---|---|---|
| 1 | Number of inhabitant(s) | Single |
| Couple | ||
| Couple with children | ||
| Family with grandparents | ||
| 2 | Employment status | Full-time |
| Retired | ||
| 3 | Number of electrical appliances | Small (appliances = < 25) |
| Medium (25 < appliances = < 35) | ||
| High (appliances > 35) | ||
| 4 | Number of bedrooms | 3 |
| 4 | ||
| 5 |
Table 4.
Confusion matrix. TP = True Positives, TN = True Negatives, FP = False Positives, FN = False Negatives.
Table 4.
Confusion matrix. TP = True Positives, TN = True Negatives, FP = False Positives, FN = False Negatives.
| Predicted | |||
|---|---|---|---|
| Class A | Class B | ||
| True | Class A | TP | FN |
| Class B | FP | TN | |
Table 5.
The confusion matrix of number of inhabitant(s).
| Predicted | |||||
|---|---|---|---|---|---|
| Characteristics | Single | Couple | Couple with Children | Family with Grandparents | |
| True | Single | 92 | 15 | 0 | 4 |
| Couple | 7 | 160 | 0 | 17 | |
| Couple with children | 0 | 6 | 35 | 2 | |
| Family with grandparents | 14 | 43 | 8 | 99 | |
Table 6.
The confusion matrix of employment status of inhabitants.
| Predicted | |||
|---|---|---|---|
| True | Characteristics | Full-time | Retired |
| Full-time | 456 | 3 | |
| Retired | 14 | 29 | |
Table 7.
The confusion matrix of electrical appliances.
| Predicted | ||||
|---|---|---|---|---|
| Characteristics | Low | Medium | High | |
| True | Low | 112 | 19 | 14 |
| Medium | 14 | 170 | 9 | |
| High | 49 | 24 | 91 | |
Table 8.
The confusion matrix about the number of bedrooms.
| Predicted | ||||
|---|---|---|---|---|
| Characteristics | 3-Bedrooms | 4-Bedrooms | 5-Bedrooms | |
| True | 3-bedrooms | 215 | 3 | 9 |
| 4-bedrooms | 18 | 91 | 2 | |
| 5-bedrooms | 68 | 12 | 84 | |
© 2019 by the authors. Licensee MDPI, Basel, Switzerland. This article is an open access article distributed under the terms and conditions of the Creative Commons Attribution (CC BY) license (http://creativecommons.org/licenses/by/4.0/).
Share and Cite
MDPI and ACS Style
Fahim, M.; Sillitti, A. Analyzing Load Profiles of Energy Consumption to Infer Household Characteristics Using Smart Meters. Energies 2019, 12, 773. https://doi.org/10.3390/en12050773
AMA Style
Fahim M, Sillitti A. Analyzing Load Profiles of Energy Consumption to Infer Household Characteristics Using Smart Meters. Energies. 2019; 12(5):773. https://doi.org/10.3390/en12050773
Chicago/Turabian StyleFahim, Muhammad, and Alberto Sillitti. 2019. "Analyzing Load Profiles of Energy Consumption to Infer Household Characteristics Using Smart Meters" Energies 12, no. 5: 773. https://doi.org/10.3390/en12050773
Note that from the first issue of 2016, this journal uses article numbers instead of page numbers. See further details here.