Article

An Alternative Internet-of-Things Solution Based on LoRa for PV Power Plants: Data Monitoring and Management

by
José Miguel Paredes-Parra
1,
Antonio Javier García-Sánchez
2,
Antonio Mateo-Aroca
3 and
Ángel Molina-García
3,*
1
Technological Center for Energy and Environment (CETENMA), 30353 Cartagena, Spain
2
Department of Information and Communication Technologies, Universidad Politécnica de Cartagena, 30202 Cartagena, Spain
3
Department of Electronic Technology, Universidad Politécnica de Cartagena, 30202 Cartagena, Spain
*
Author to whom correspondence should be addressed.
Energies 2019, 12(5), 881; https://doi.org/10.3390/en12050881
Submission received: 12 January 2019 / Revised: 15 February 2019 / Accepted: 2 March 2019 / Published: 6 March 2019

Abstract

:
This paper proposes a wireless low-cost solution based on long-range (LoRa) technology able to communicate with remote PV power plants, covering long distances with minimum power consumption and maintenance. This solution includes a low-cost open-source technology at the sensor layer and a low-power wireless area network (LPWAN) at the communication layer, combining the advantages of long-range coverage and low power demand. Moreover, it offers an extensive monitoring system to exchange data in an Internet-of-Things (IoT) environment. A detailed description of the proposed system at the PV module level of integration is also included in the paper, as well as detailed information regarding LPWAN application to the PV power plant monitoring problem. In order to assess the suitability of the proposed solution, results collected in real PV installations connected to the grid are also included and discussed.

1. Introduction

In most countries, fossil fuel consumption has been drastically increasing along with enhancements in the quality of life and industrialization, and a growing world population [1]. This relevant fossil fuel consumption not only leads to an increase in the rate of diminishing fossil fuel reserves, but also has a significant adverse influence on the environment and the threat of global climate change. Actually, renewable integration issues have drawn attention in the scientific literature lately, and recent contributions have been focused on the institutional challenges [2]. Within the electricity sector, renewable and clean power generation alternatives will play a relevant role in future power supply (i) to attain global public awareness and sensibility of the need for environmental protection, and (ii) to achieve less dependence on fossil fuels for energy production [3]. Indeed, Mancarella et al. affirm that power systems are among the most critical infrastructures of modern societies, being crucially important to boost their resilience under severe weather conditions and any future challenges focused on climate change concerns [4]. As a result, most road maps and scenarios forecast a relevant resurgence of low-carbon generator units in the electricity supply side mix [5]. From the different renewable resources, wind and PV solar solutions are considered as relatively mature technologies, with a significant impact on current power systems [6]. However, certain technical problems have been discussed in the literature about high penetration of renewables, mainly focused on reliability, power quality, and stability [7]. In this way, the intermittent nature of such sources may increase the stress of the grid, mainly due to undesirable oscillations on the supply side [8], which may negatively affect the transmission system regulation [9]. Regarding PV power plants, their power generation is highly dependent on solar irradiance, ambient temperature, and other atmospheric parameters [10]. Consequently, fluctuations from grid-connected PV installations might lead to decreased grid reliability, compromising the demand–supply balance control [11]. Indeed, PV systems extensively integrated into low-voltage (LV) distribution grids may cause significant changes in feeder voltage profiles [12]. Consequently, it is very important to determine and monitor such weather parameters that can provide a more precise prediction of the PV power generated [13]. Therefore, the PV power plant integration into power systems must imply monitoring solutions. Moreover, Beránek et al. affirms that monitoring of PV system plants is an urgent and imperative activity for practical implementation of new ecologically clean solar plants [14].
Different solutions can be found in the specific literature to monitor PV power plants. Ramakrishna et al. affirm that the PV monitoring systems can be broadly classified as ground-based or space-based monitoring systems [15]. More specifically, some of these contributions are focused on monitoring locally PV data. In this way, Fuentes et al. describes a portable data logger based on standalone instruments [16]. LabVIEW has shown relevant characteristics for monitoring and communicating several devices simultaneously [17]. Bayrak et al. use a Labview data acquisition (DAQ) card for monitoring electrical measurement of a PV system [18]. Chouder et al. also present a detailed characterization of the performance and dynamic behavior of PV installations through LabVIEW real-time interface system [19]. Recently, a novel power line communication (PLC) method for a DC–DC power optimizer solution is proposed by Zhu et al. [20]. The data are modulated and then transmitted through the series-connected DC-power line to other DC–DC power optimizers. The parallel resonant coupling unit is used in [21] to monitor PV data into a high-frequency form to carry out the carrier communication. Wireless solutions to monitor PV installations at panel level have been also proposed by other authors. As an example, Ando et al. describes a complete wireless solution at panel level to estimate efficiency losses and anomalous aging of PV installations [22]. Similar contributions for individual monitoring of panels based on wireless technology can be found in [23]. An in–situ monitoring solutions for PV panels is proposed and evaluated by Papageorgas et al. in [24]. Moreno-García et al. presents an architecture of acquisition devices, including distributed wireless sensors, to monitor and supervise all the distributed devices in the plant [25]. An extension of this solution by detecting any failures or deviations in PV production can be found in [26]. A low-cost acquisition system to record data in micro SD card is presented by Fanourakis et al. in [27]. Regarding remote PV monitoring proposals, different contributions can be found in the specific literature. In this way, Zigbee technology has been proposed by different authors during recent years [28,29,30,31]. Li et al. also propose an on-line monitoring system based on Zigbee technology for Internet of Things purposes [32]. However, and according to [33], Zigbee technology is proven inefficient in large scale since it is not able to face up huge distances. A low cost IOT-based embedded system is described in [34]. This solution uses a GPRS module and a low cost microcontroller to send the power generated by a PV power plant. GSM voice channel for the communication of data has been also proposed, since the GSM network is readily available in rural areas [35]. As drawbacks, Pereira et al. affirm that this solution requires a SIM card with data transfer charging and can be installed only in places under phone coverage [36]. At residential level, an IoT solution based on Arduino with 3G connectivity technology is described and assessed in [37]. A comparison of different technologies—Ethernet, WiFi and ZigBee—for smart-house applications including RES is proposed in [38]. A user-friendly PV monitoring system based on a low-cost PLC is proposed by Han et al in [39]. A review focused on solutions for PV performance monitoring is discussed in [40].
From the Transmission and Distribution Network Operator point of view, a mass energy production coming from PV systems without the corresponding energy storage units and/or sufficient innovative electricity network architectures—such as micro-grids, smart-grids and web of cells—can cause severe disturbances [41]. In Europe, Mateo et al. contribute to overcome the barriers that hamper a large-scale integration of PV installations in the electricity distribution grids, being necessary the integration of advanced monitoring and operation systems [42]. As an additional example, in Germany, 90% of renewable system capacity is connected to distribution grids, and smart grid investments should be promoted by German DSOs [43]. Current power systems thus require modernization in terms of sensing, communication technologies, measurements, and automation technologies, and subsequently, smart power grids arise as a suitable solution [44,45].
Considering previous approaches, this work provides a step forward: a wireless low-cost open-source monitoring solution based on long-range (LoRa) technology able to communicate with remote PV power plants. The aim is thus to monitor in real time wide zones under study, covering long distances with minimum power consumption and maintenance. This study is in line with previous works of the authors focused on PV monitoring [46,47]; as well as in line with recent contributions where PLC and wireless are considered the best candidates for communication purposes [48], and wireless is poised to play a significant role in shaping the capabilities of future measurement systems [49]. Besides, the cost of open-source solutions is usually considerably lower than commercially available devices, with little loss of accuracy and precision [16]. Moreover, commercial solutions present some drawbacks, as can be found in recent PV monitoring system reviews [50]. The main contributions are summarized as follows:
  • Wide areas, referred to remote PV installations, are controlled via and communicated through a low-cost open-source solution based on LoRa technology.
  • Data are gathered from the PV installations in accordance with the current IEC-61724 standards and industrial, scientific, and medical (ISM) band use regulations.
  • The proposed solution is flexible to exchange data in real time among PV power plants in terms of power generation and weather parameters.
The rest of the paper is structured as follows: Section 2 describes wireless sensor network technology and particularly the LoRa approach. Section 3 gives detailed information regarding our proposed solution. Section 4 offers extensive results, evaluating the performance of our solution. To this end, different testing processes are conducted by the authors. Finally, conclusions are discussed in Section 5.

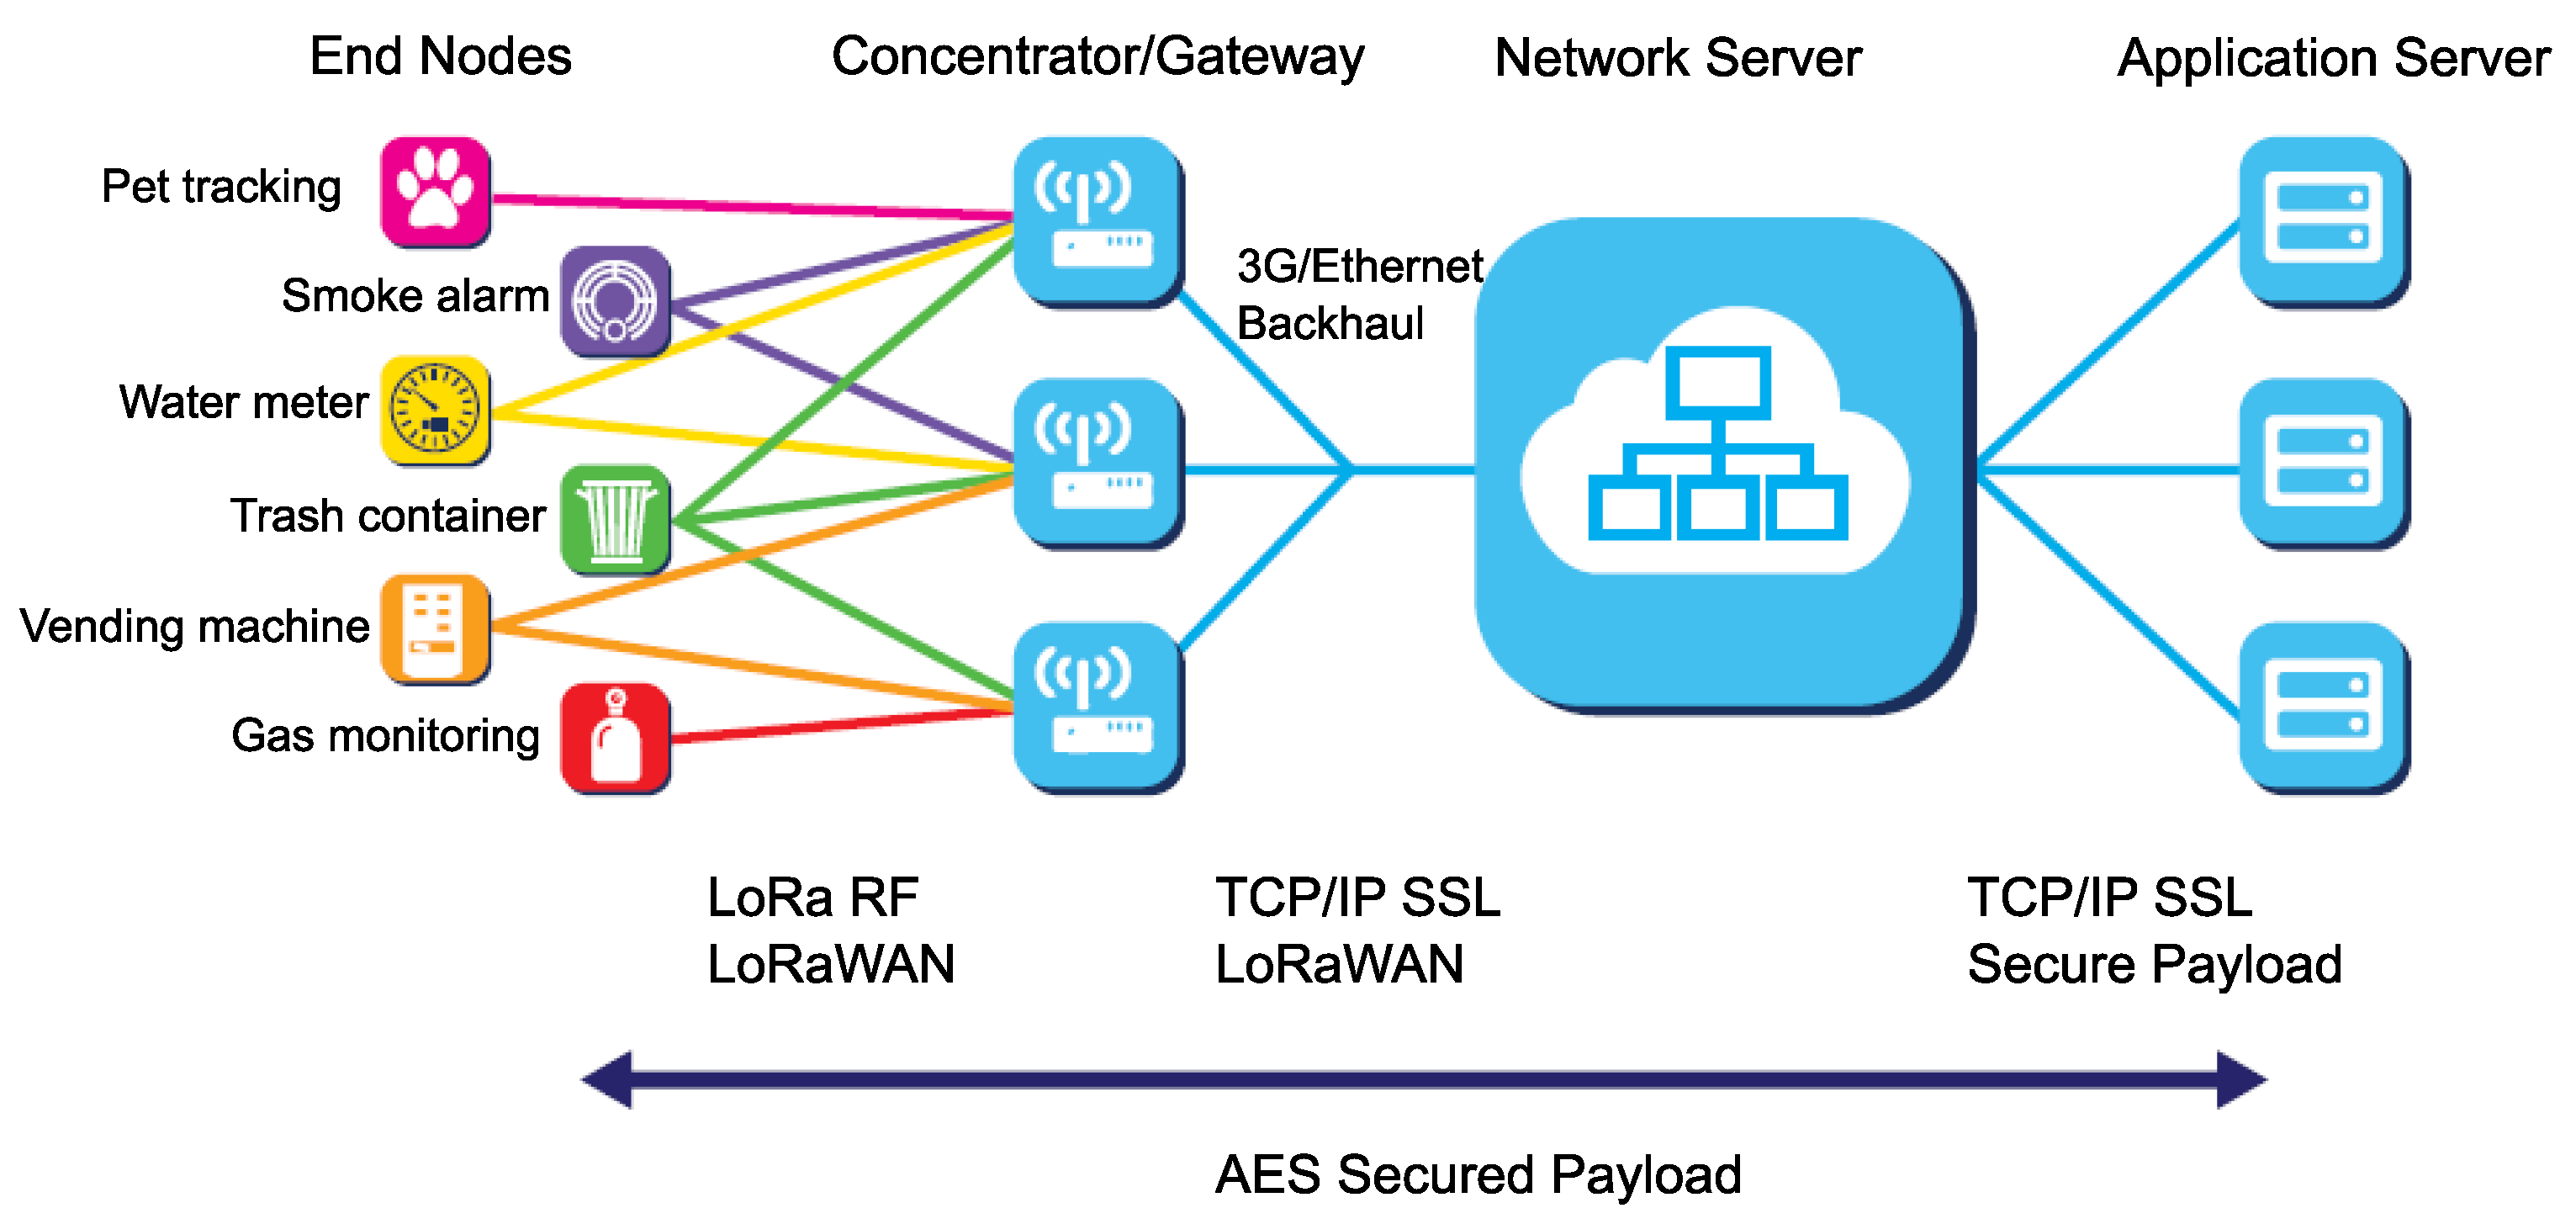
2. Wireless Sensor Network: LoRa Solution

Wireless sensor network (WSN) is a mature field in technology to sense physical parameters and transmit them wirelessly out of the coverage range of the measurement in situ. This is a potential area of interest for the scientific community, reinforcing some beliefs about the necessity for further research initiatives in a new wireless-network paradigm. In this context, the low-power wide-area network (LPWAN) is a recent WSN-based technology that emerged as an alternative wireless monitoring solution [51]. Different applications and contributions can be found, mainly focused on the industrial environment. In particular, this technology is currently drawing much attention for managing assets over wide areas, such as the monitoring and control of PV power plants and the operation of distributed energy systems. The main characteristics are its excellent long-range, low-power consumption and reduced computation capacity (like a long-range WSN). In fact, the operation of a distributed energy system usually requires flexible and reliable communication systems. However, cable-based communications are, in many cases, an infeasible solution due to their complex installation and maintenance. In distributed energy systems with high penetration of renewables and small generation units connected at different voltage levels, this wireless technology can help to overcome the lack of information in the performance and generation of these installations [52].
LPWAN is a generic term that encompasses a group of technologies, allowing wide area communications at lower cost points and reduced power consumption. LPWAN technologies have arisen in both licensed and unlicensed markets, such as LTE-M, Sigfox, long range (LoRa), and narrow band (NB)-IoT. Among them, LoRa and NB-IoT are the most prominent, though they clearly present technical differences [53]. Presently, LoRa is an LPWAN approach receiving relevant consideration in the literature, because it can operate efficiently in unlicensed bands. Unlike LoRa, an NB-IoT network must be set up within an existing cellular network. This makes LoRa a more flexible solution than NB-IoT to meet the requirements of outlying districts [54]. It is worth noting that LoRa is inarguably the main actor in the current LPWAN scene, used in an unlicensed spectrum below 1 GHz and supported by many worldwide technology leaders (Cisco, Microchip, IBM, HP, etc.) [55]. From a technological point of view, LoRa provides a proprietary chirp spread spectrum (CSS) modulation to achieve communication distances greater than 700 km [56]. What makes LoRa stand out from other modulation methods is its unique spread spectrum technique, which provides robustness against interference and a very low minimum signal-to-noise ratio (SNR) for the receiver to be able to demodulate the signal. LoRa is thus a suitable solution for applications that require a very long battery lifetime and reduced cost. Moreover, as it strengthens, LoRa allows tuning of several physical transmission properties: the bandwidth and central frequency of the communication, the coding rate (CR, the ratio between the length of the packet and the length of the error-correction code), the transmission power, and the spreading factor (SF, defined as the ratio between the symbol rate and chip rate). Higher SF values enhance the sensitivity and range of communication at the expense of increasing the over-the-air time of the packets, thus consuming more transmission duty cycles (TDCs).
In the past few years, the interest of monitoring smart industries has increasingly become LoRa [57] as one technology solution demanded by many researchers [58,59]. Most of the contributions have been focused on analyzing the advantages, disadvantages, capabilities, and limits of current developments/deployments in several scenarios: industrial environments [60], civil infrastructures such as bridges [61] and public transport [62], line-of-sight and obstructed communications [63], and surveillance tasks to combat poachers in wildlife reserves in Africa [64]. In addition, LoRa performance has been compared to other LPWAN solutions such as Sigfox [65] and Weightless [66], as well as licensed options such as NB-IoT [67]. Other studies have dealt with the real scalability of current LoRa networks [68,69], the performance of their different configurations [70] or the download traffic analysis of these types of networks [71]. LoRa defines the physical level and LoRaWAN encompasses the link layer of the protocol stack and the system architecture [72]. LoRaWAN uses long-range star architecture in which gateways are used to relay messages between the end nodes and a central core network (see Figure 1). In a LoRaWAN scenario, nodes are not associated with a specific gateway. Instead, data transmitted by a node are typically received by multiple gateways. Furthermore, LoRaWAN uses the adaptive data rate (ADR) algorithm to estimate the CR and SF parameters under specific channel conditions. Subsequently, each gateway forwards the received packet from the end node to the cloud-based network server via standard IP connections. Different disadvantages can be identified when LoRaWAN solutions are implemented, intrinsic to operating in any ISM band. In particular, current international laws require a stringent duty cycle of 1%. This means the radio channel cannot be occupied more than 36 s per hour. In fact, this value is denoted as the maximum TDC allowed by the nodes to operate in ISM channels. This is an important concern for nodes managing critical assets (such as those found in the proposed solution), where LoRa and LoRaWAN must be able to report critical events within seconds. Therefore, node duty cycles should be set with the goal of reporting critical events under the entire conditions. It is precisely this type of situation that drew our attention and a question arose: ’Is it possible to obtain communications using LoRa technology, considering its stringent duty cycle under critical conditions (i.e., given the criticality of the reported event)?’ Moreover, the end-node configuration is a crucial aspect for packet transmission purposes, since LoRa networks allow us to adjust not only frequency and power values, but also other parameters such as SF and CR, promoting robustness in the communications at the expense of increasing the packet over-the-air time.
To the best of the authors knowledge, contributions such as [73,74,75] use LoRa technology as the way of transmitting data collected by sensors in a PV Power Plant. In these contributions, authors installed a Lora communication module to dispatch packets to a Gateway including physical parameters such as current or temperature, without going into details about communication concerns. Unlike these works, we contribute with a solution which tackles these concerns more intensively than [73,74,75], ensuring the best performance for transmitting information from the PV installation to the Gateway and, consequently, increasing the system reliability. In this sense, and as will be discussed in Section 4, the transmission rate—bits per second—has been thoroughly tuned to achieve a suitable and acceptable RSSI (Received Signal Strength Indicator) and SNR figures in the proposed solution. For testing purposes, it has been considered the maximum SF allowed by the LoRa technology (SF12), with a CR value of 4/5 and below the maximum TDC.

3. Proposed Solution

3.1. General Overview: Topology

The proposed network architecture integrates LoRa–IoT infrastructure in a similar way to Figure 1. Therefore, by allowing for typical LoRa network topologies [76], a star topology including end devices, gateways, and a central network server is considered in the proposed solution. All selected sensors in charge of monitoring PV installations have to fulfill the IEC-61724 requirements. PV electrical data and weather parameters are gathered to estimate PV operating conditions and exchange meteorological and electrical data information. These data packets are sent to the LoRa gateway from the corresponding PV power plants. Subsequently, the received data are then forwarded to the network application via LAN connection. The design of the proposed system involves (i) end-node hardware selection, (ii) software-node configuration, and (iii) LoRa network server. These items are discussed in detail in the following.

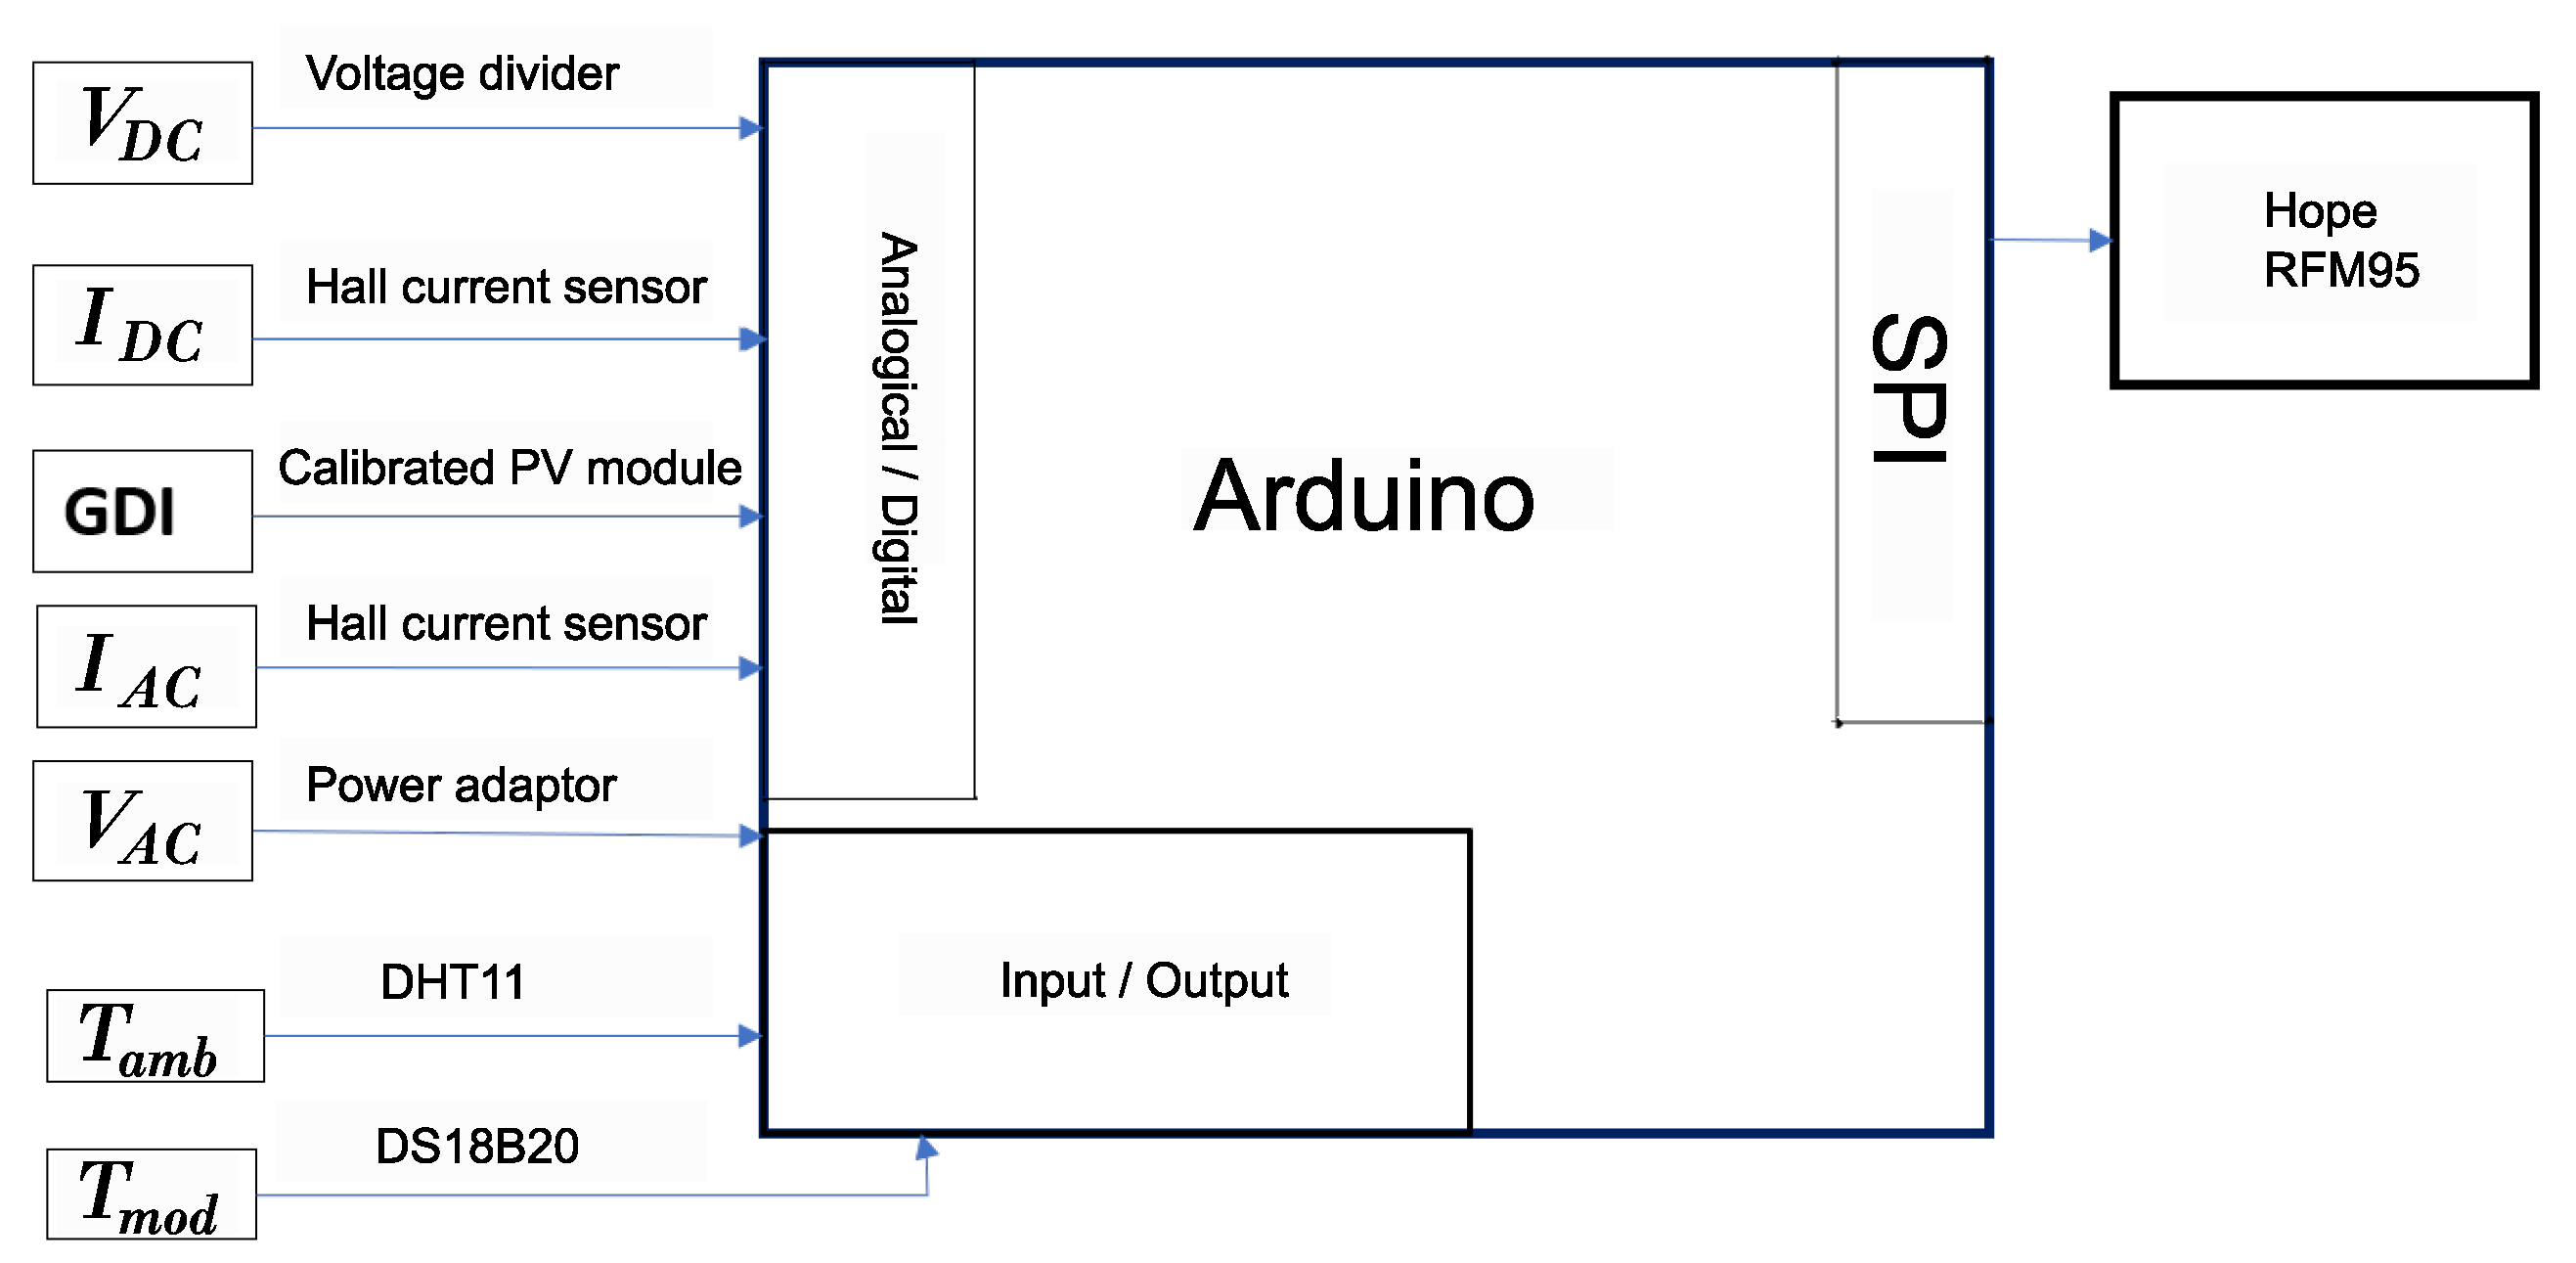
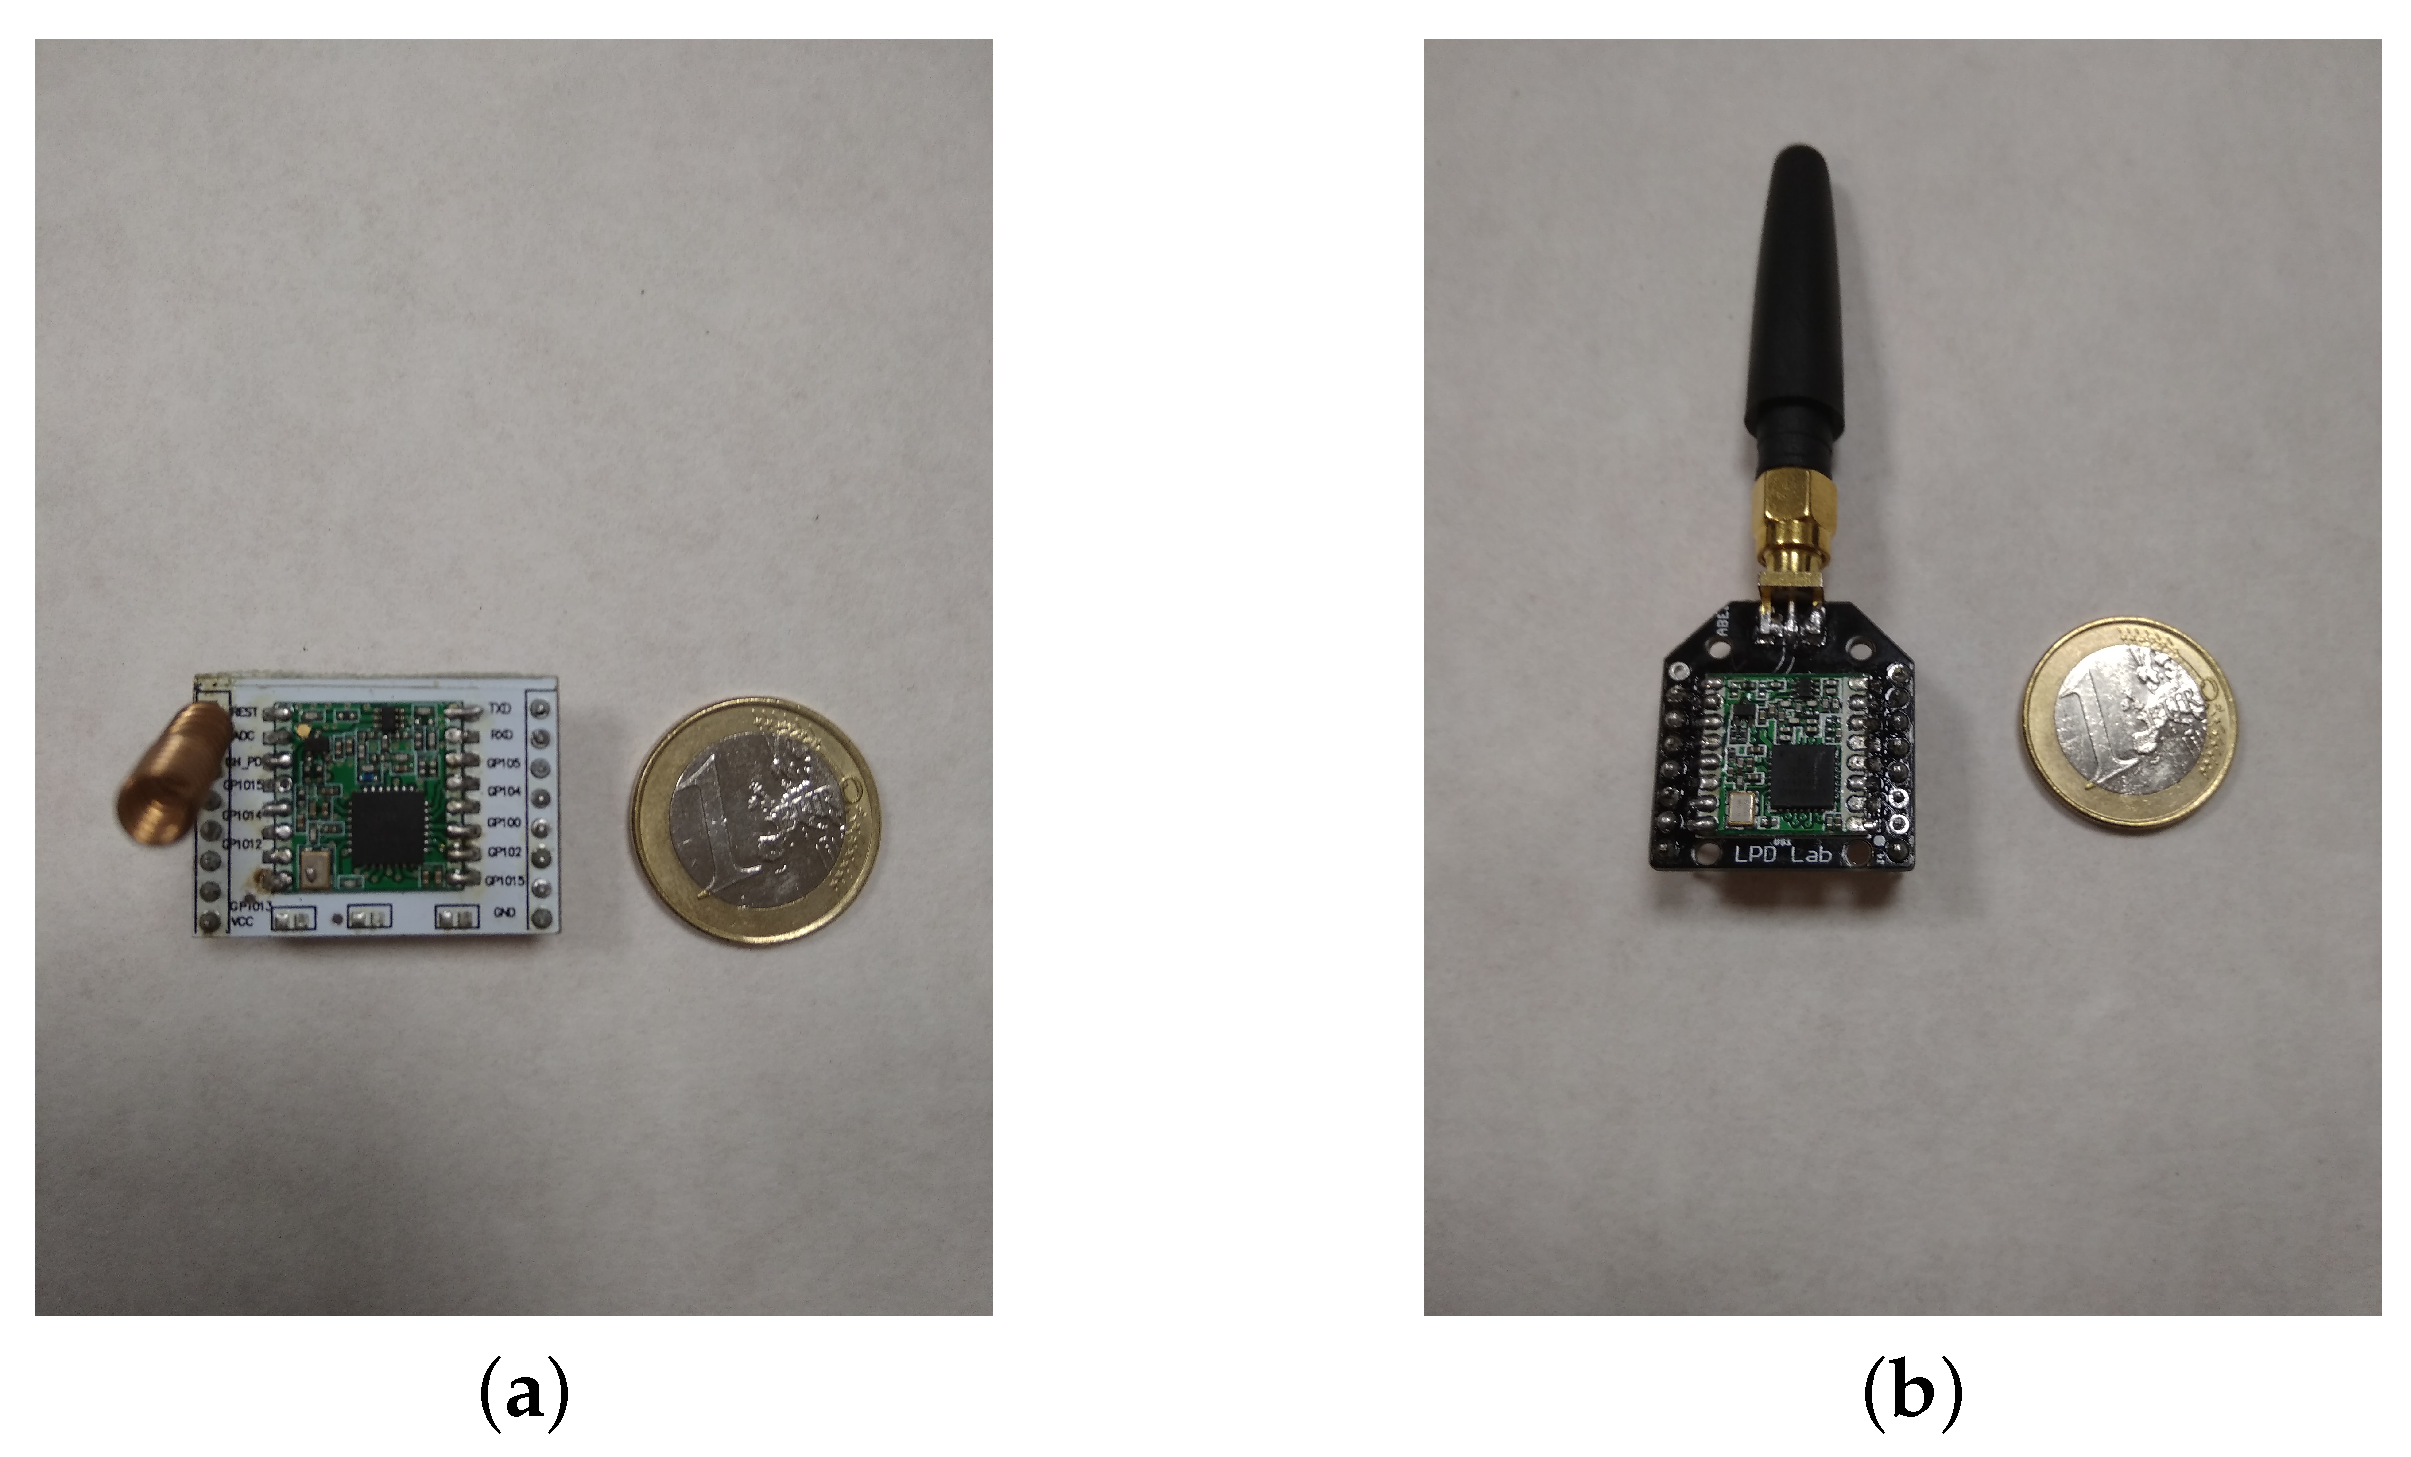
3.2. End-Node Hardware: Sensors and Communication

The end node is in charge of gathering PV electrical data and weather conditions. Data packets are subsequently sent to the gateway. The main requirements accomplished by the end node are the following:
  • Information from the PV module installed in the PV power plant is collected according to the current IEC-61724 standard requirements. These data provide relevant information for predictive maintenance purposes.
  • Flexible, low-cost, and open-source solutions are required to carry out a suitable integration of the proposed system into real PV power plants.
  • Nodes are able to run software, including a complete LoRa Class A. As mentioned, the end nodes operate under the license-exempt industrial, scientific, and medical (ISM) bands (EU 868 MHz/US 915 MHz) [77].
First, a hardware development platform was selected under the parameters of low cost and open-source software solutions. To this end, and taking into account previous experience, the Arduino platform [78], which offers a free development software environment to develop a prominent number of applications [79], was chosen. Other studies affirm the efficient reconfigurable security approach for WSN with Arduino-based systems [80]. Following these parameters, the Arduino One and Arduino Nano were considered as printed board platforms [81]. Both hardware solutions are based on ATmega328P with similar performance. As its main features, Arduino Uno comprises a 32 kB flash memory, 2 kB SRAM and 1 kB EEPROM, with 5 V operating voltage level and 14 digital I/O pins. The Arduino Nano is considered as a bridge between sensors and, for instance, a Raspberry Pi, which becomes it in a base station [82]. LoRa transceiver is also integrated in the device under the Arduino requirements [83].
Concerning the selected group of sensors, they have to be in line with the following requirements: they must (i) gather electrical PV parameters and weather conditions, and (ii) fulfill the IEC-61724 requirements. Moreover, the sensors are in accordance with previous works by the authors, where the same requirements were considered [16,84]. Local data collected by our proposed solution are thus able to estimate the PV module behavior and, in general, the PV installation performance. In terms of electrical data, AC and DC voltage and current variables are considered as parameters to be measured and collected for monitoring purposes. AC voltage measurement ( V A C ) is implemented by an AC–AC power adaptor. An isolation transformer gives a physical separation and a quasi-sinusoidal waveform as an output signal. This signal is adapted by a voltage divider and sent to the Arduino board as an analog input. In a similar way, DC voltage ( V D C ) is collected and adapted as an Arduino board analog input as well. For AC data ( I A C ), a noninvasive Hall-effect sensor is provided for the proposed solution [85]. An accurate, low-offset, linear Hall sensor is selected and implemented by the authors to measure the DC current ( I D C ) [86]. Both AC and DC sensors offer low-voltage output signals compatible with the Arduino input voltage range. With regard to weather parameters, the following variables are considered for monitoring purposes: solar irradiance, ambient temperature, and PV module temperature. To measure and gather solar irradiance, and assuming that the short-circuit current (ISC) is nearly proportional to the irradiance [87], it is measured in W/m 2 by a 5 Wp short-circuit encapsulated polycrystalline silicon module. A shunt resistance is chosen and implemented to adapt the voltage output within a suitable voltage range according to the Arduino analog input requirements. Calibration of this module was carried out by the authors through the CETENMA Solar TestBed, based on the global sunlight method available in [88]. Ambient temperature was measured near PV modules as an attempt to more accurately estimate the real environment of PV module conditions. A DHT22 temperature/humidity sensor with digital output was selected with this objective. The DHT22 sensor is directly supported by the Arduino IDE technology and, according to [89], it furnishes very accurate results with a fast refresh time. Other applications using the DHT22 sensor can be found in [90,91]. Most correlations in the scientific literature for PV electrical power as a function of the cell/module operating temperature and basic environmental variables are based on linear approaches [92]. Indeed, [93,94] affirm that PV module power output values depend linearly, but rather strongly, on the operating temperature. The authors note that the PV module temperature should be collected at the center of the back surface of the module and in the center of the array field location on the module, as pointed out by IEC-61829 method A [95]. In our proposed system, a low-cost solution employing the DS18S20 digital sensor is used with this goal. This digital thermometer achieves 9-bit Celsius temperature measurements, transferring them on a 1-wire bus [96]. A general diagram of the sensors and their connections with the Arduino board is depicted in Figure 2.
The communication system is in charge of dispatching data packets thanks to a transceiver integrated into the Arduino board and operating in the EU-868 band [72]. The selected transceiver is the RFM95W module, fabricated by HOPE RF and configured as a LoRa TM modem [97]. In fact, the RFM95W configured for LoRa communication via 4-wire SPI bus was successfully tested in [98]. The main characteristics of this LoRa TM module are high efficiency and significant sensitivity (around −148 dBm). To achieve these advantages, this module is composed of a 6-GPIO interface configurable by software and with different interruptions usually linked to the operation of the RFM95W [99], and is able to support different modulations such as FSK/OOK, GFSK, MSK, or GMSK. Due to the small size of the RFM95W module, an adapter is required to provide breakout pins and the antenna plug-ins (Figure 3). Finally, the RFM95W works at 3.3 V and thus it cannot be directly connected to the Arduino Uno or Nano (both operating at 5 V). A voltage adapter is thus required to give the operating voltage range.

3.3. End-Node Software Configuration

The end-node software configuration was subsequently conducted after selecting the end-node hardware solution along with the sensors. First, Arduino firmware was implemented and tested in order to obtain the PV power plant parameters and values under the IEC-61724 standard [100] and the ISM band-use regulations. The selected firmware was the nano-lmic-v1.51-F.ino, which was downloaded from the LoRa LMIC library [101]. The Arduino code follows activation-by-personalization (ABP) rules, available in the LMIC library [83]. SScripts to read the data format were also developed and the payload adjusted to contain full information gathered by the different sensors, following the format recommended by the IEC standard resolution. Please note that the payload has a length of 38 bytes, which has a relevant impact on the over-air time of the packets, as will be discussed in Section 4. The sampling period is another aspect to be considered in detail. In this sense, the IEC standard establishes that the sampling period of the different parameters under study varies proportionally to the solar irradiance. Under our operating conditions, parameters had to be sampled in intervals of 1 minute or less. On the other hand, in Europe, the duty cycle is regulated by the ETSI EN300.220 standard—Section 7.2.3—[102], which, as noted in Section 2, sets a duty cycle of 1%. Furthermore, from the spreadsheet developed and proposed by Matthijs Kooijman [103], the over-air time of the packets can be determined for different SFs. The over-air time corresponding to the worst case was then used to define our sampling rate. By considering our scenario, the duty cycle, and the over-air-time issue, data packets were sampled every 30 s. The parameters were then averaged and sent in time periods of 3 min. These values will be modified in a subsequent version to enforce the so-called ’Fair Access Policy’, which limits the uplink airtime to 30 s per day and per node [104]. The downlink messages were set to 10 messages per day and per node.

3.4. LoRa Gateway/LoRa Network Server

A single-channel LoRa gateway was designed and implemented with a Raspberry Pi board. The LoRa radio communication module we selected is the Dragino Arduino shield from a Semtech SX1276 chip [105]. The Dragino shield can be directly connected to the Raspberry Pi. SPI connectors belonging to Dragino (MISO, MOSI, CLK, and NSSEL), VCC and GND are attached to the corresponding pins on the Raspberry Pi (CE0 on the RPI for SPI, _ n S S E L and 3v3 for VCC). The operating system (OS) installed on the Raspberry Pi was Raspbian [106]. This single channel gateway software as well as its OS are supported by Thomas Telkamp at GitHub, and further information can be found in [107]. The single-channel LoRa gateway assembly and the coverage range are depicted in Figure 4. As described in Section 3.1, a LoRa network server is required to test the proposed application. With this aim, The Things Network (TTN) backend is used [108]. TTN is a community-driven project offering a free server to users; our proposed solution must connect the gateway to this free server. To this end, we created an account and registered the developed gateway. The gateway is located in Europe, selecting the European ISM band (868 MHz). After this setting process, the gateway is ready to be plugged in to the server. At this point, users can visualize the data packet transmission from the end nodes associated with this gateway, with a status of ‘connected at web’. In our case, two applications were developed: monitoring system testing and coverage range testing. Furthermore, the Arduino firmware implemented a different device address, ‘DEVADDR’, the network session key ‘NWSKEY’, and the application session key ‘APPSKEY’, which were developed and implemented before carrying out the corresponding validation tests discussed in detail in the following section.

3.5. Economic Evaluation: Cost-Effectiveness

Finally, and in terms of cost-effectiveness, the proposed monitoring system is in line with other contributions discussed in Section 1 and Section 2 based on non-commercial solutions. Our system is flexible to be configured in different locations and PV installations. With the aim of offering a low cost system, the different hardware components are based on open-source projects with a high cost effectiveness threshold. Table 1 gives the monitoring node cost, which is lower than other commercial solutions as was previously discussed. Moreover, these commercial solutions usually provide less information and a reduced number of parameters.

4. Results

This section summarizes the test bed conducted to evaluate the proposed system. System assembly, coverage range, and performance evaluation of the PV power plant are described with the goal of adding value to our proposal in terms of a sensing, monitoring, and data packet transmission solution in an IoT scenario.

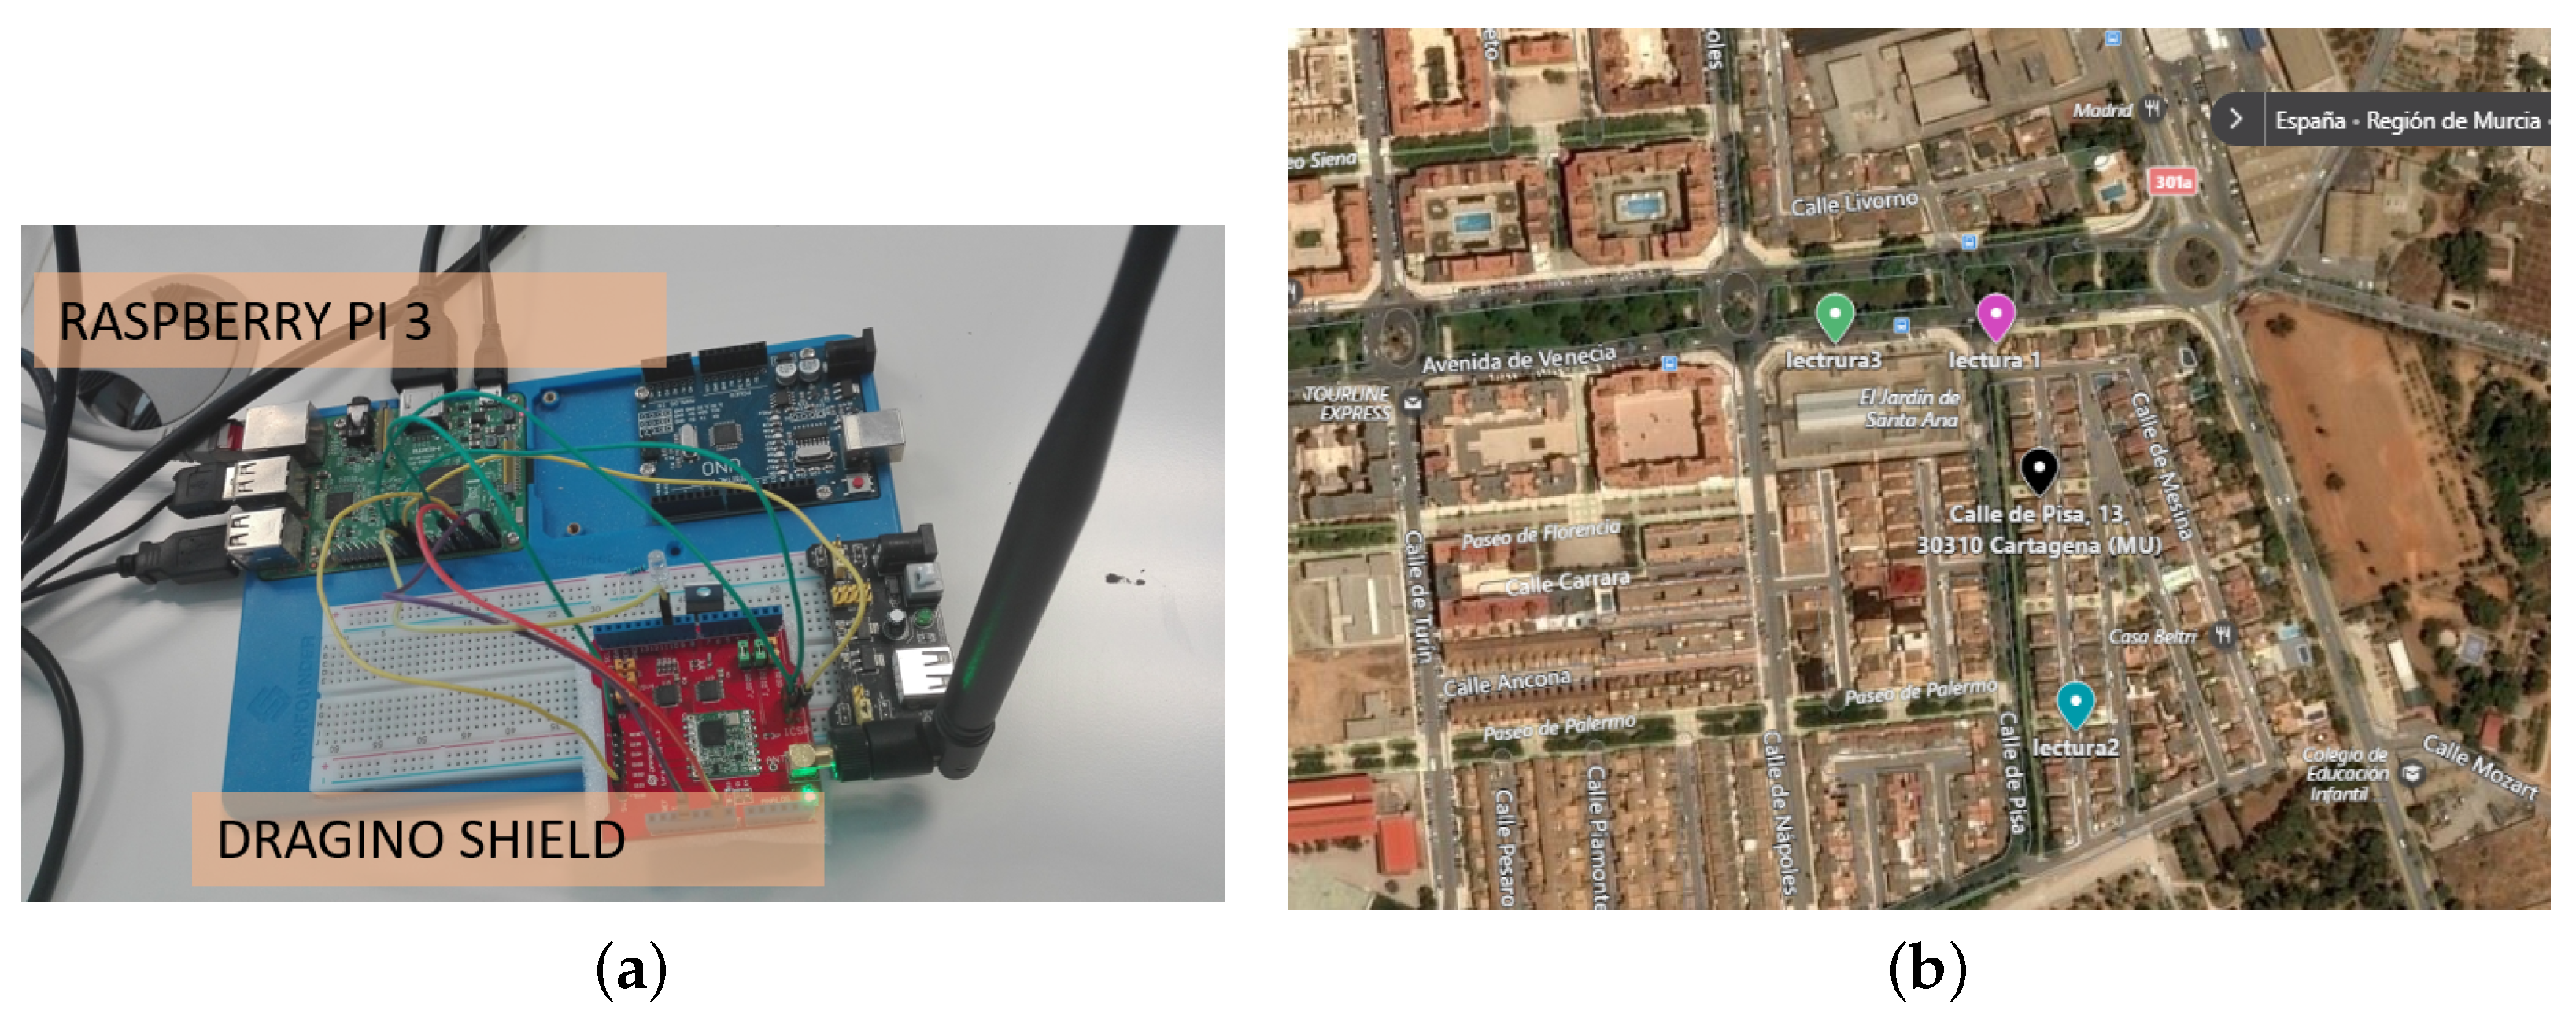
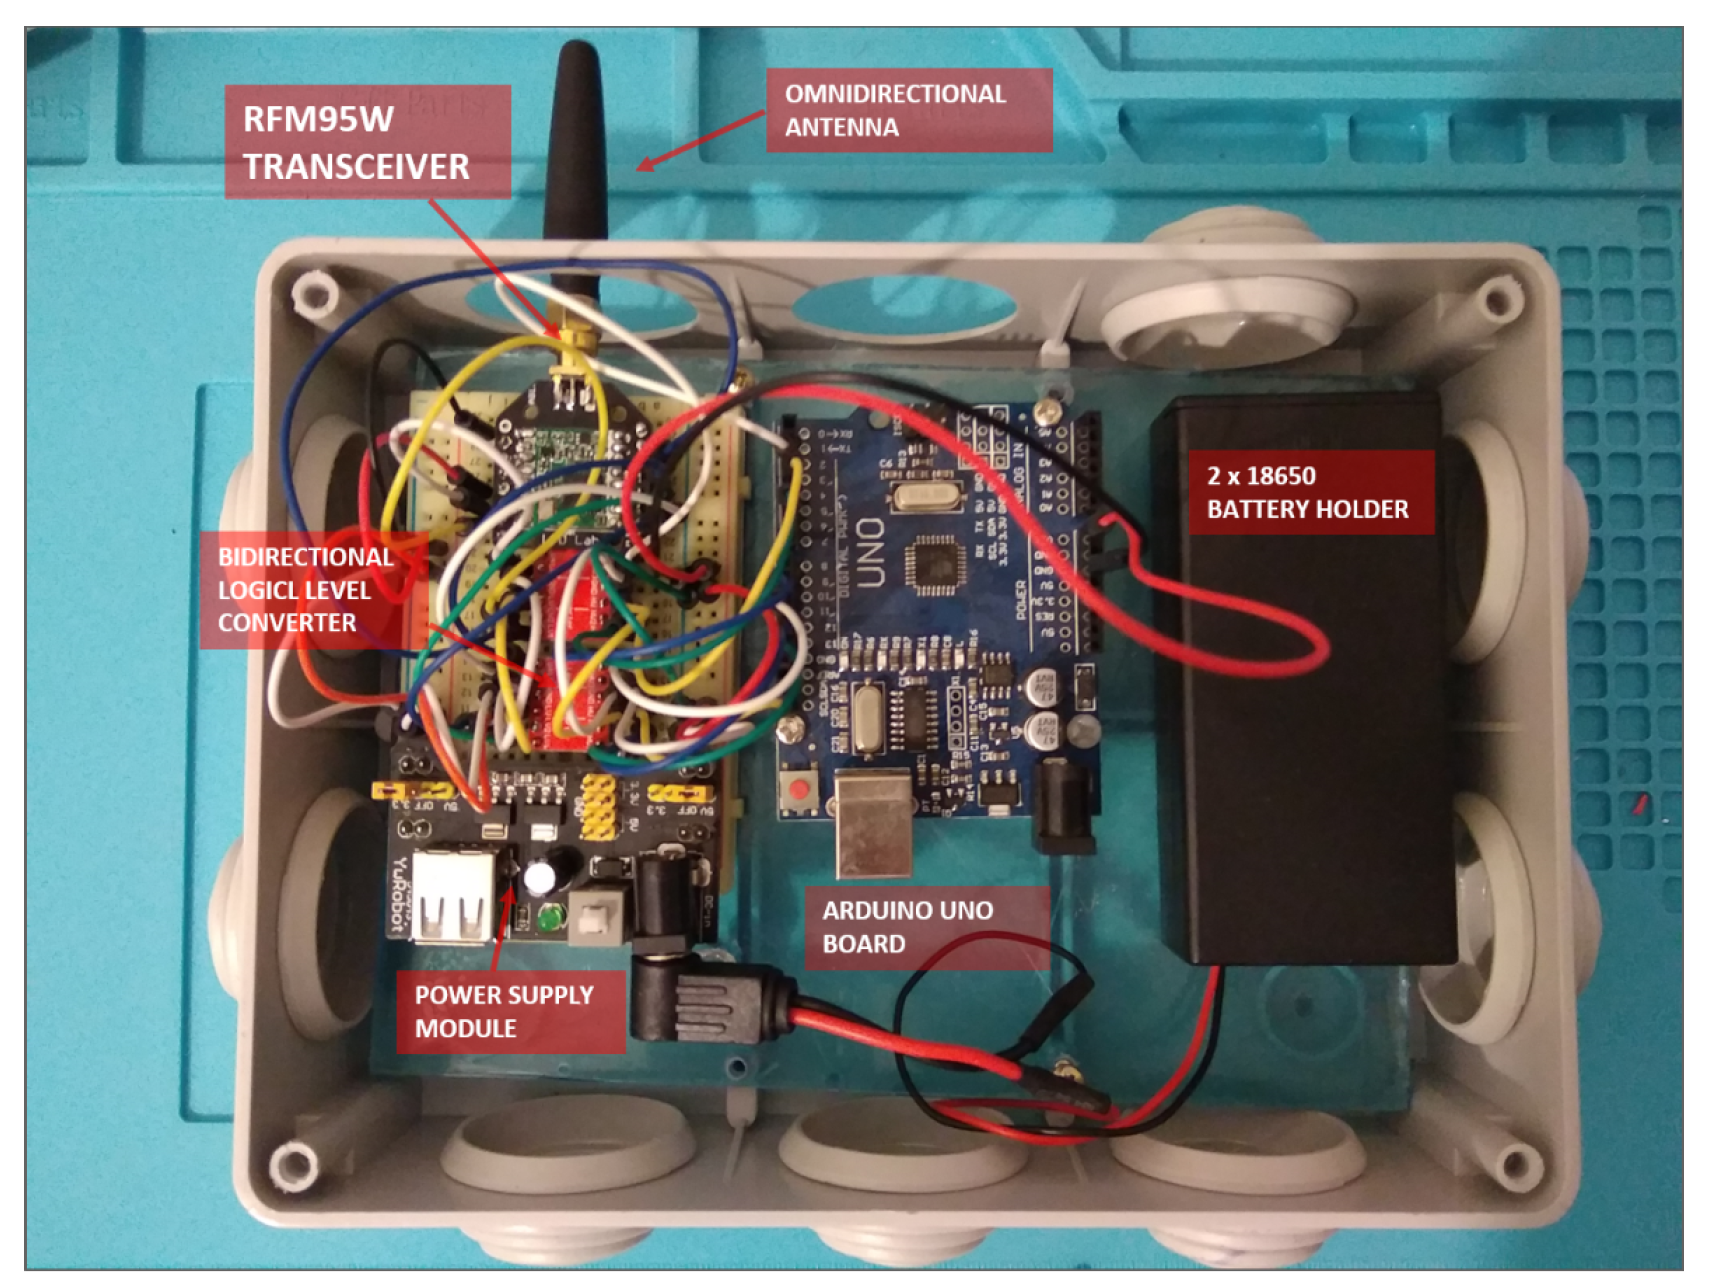
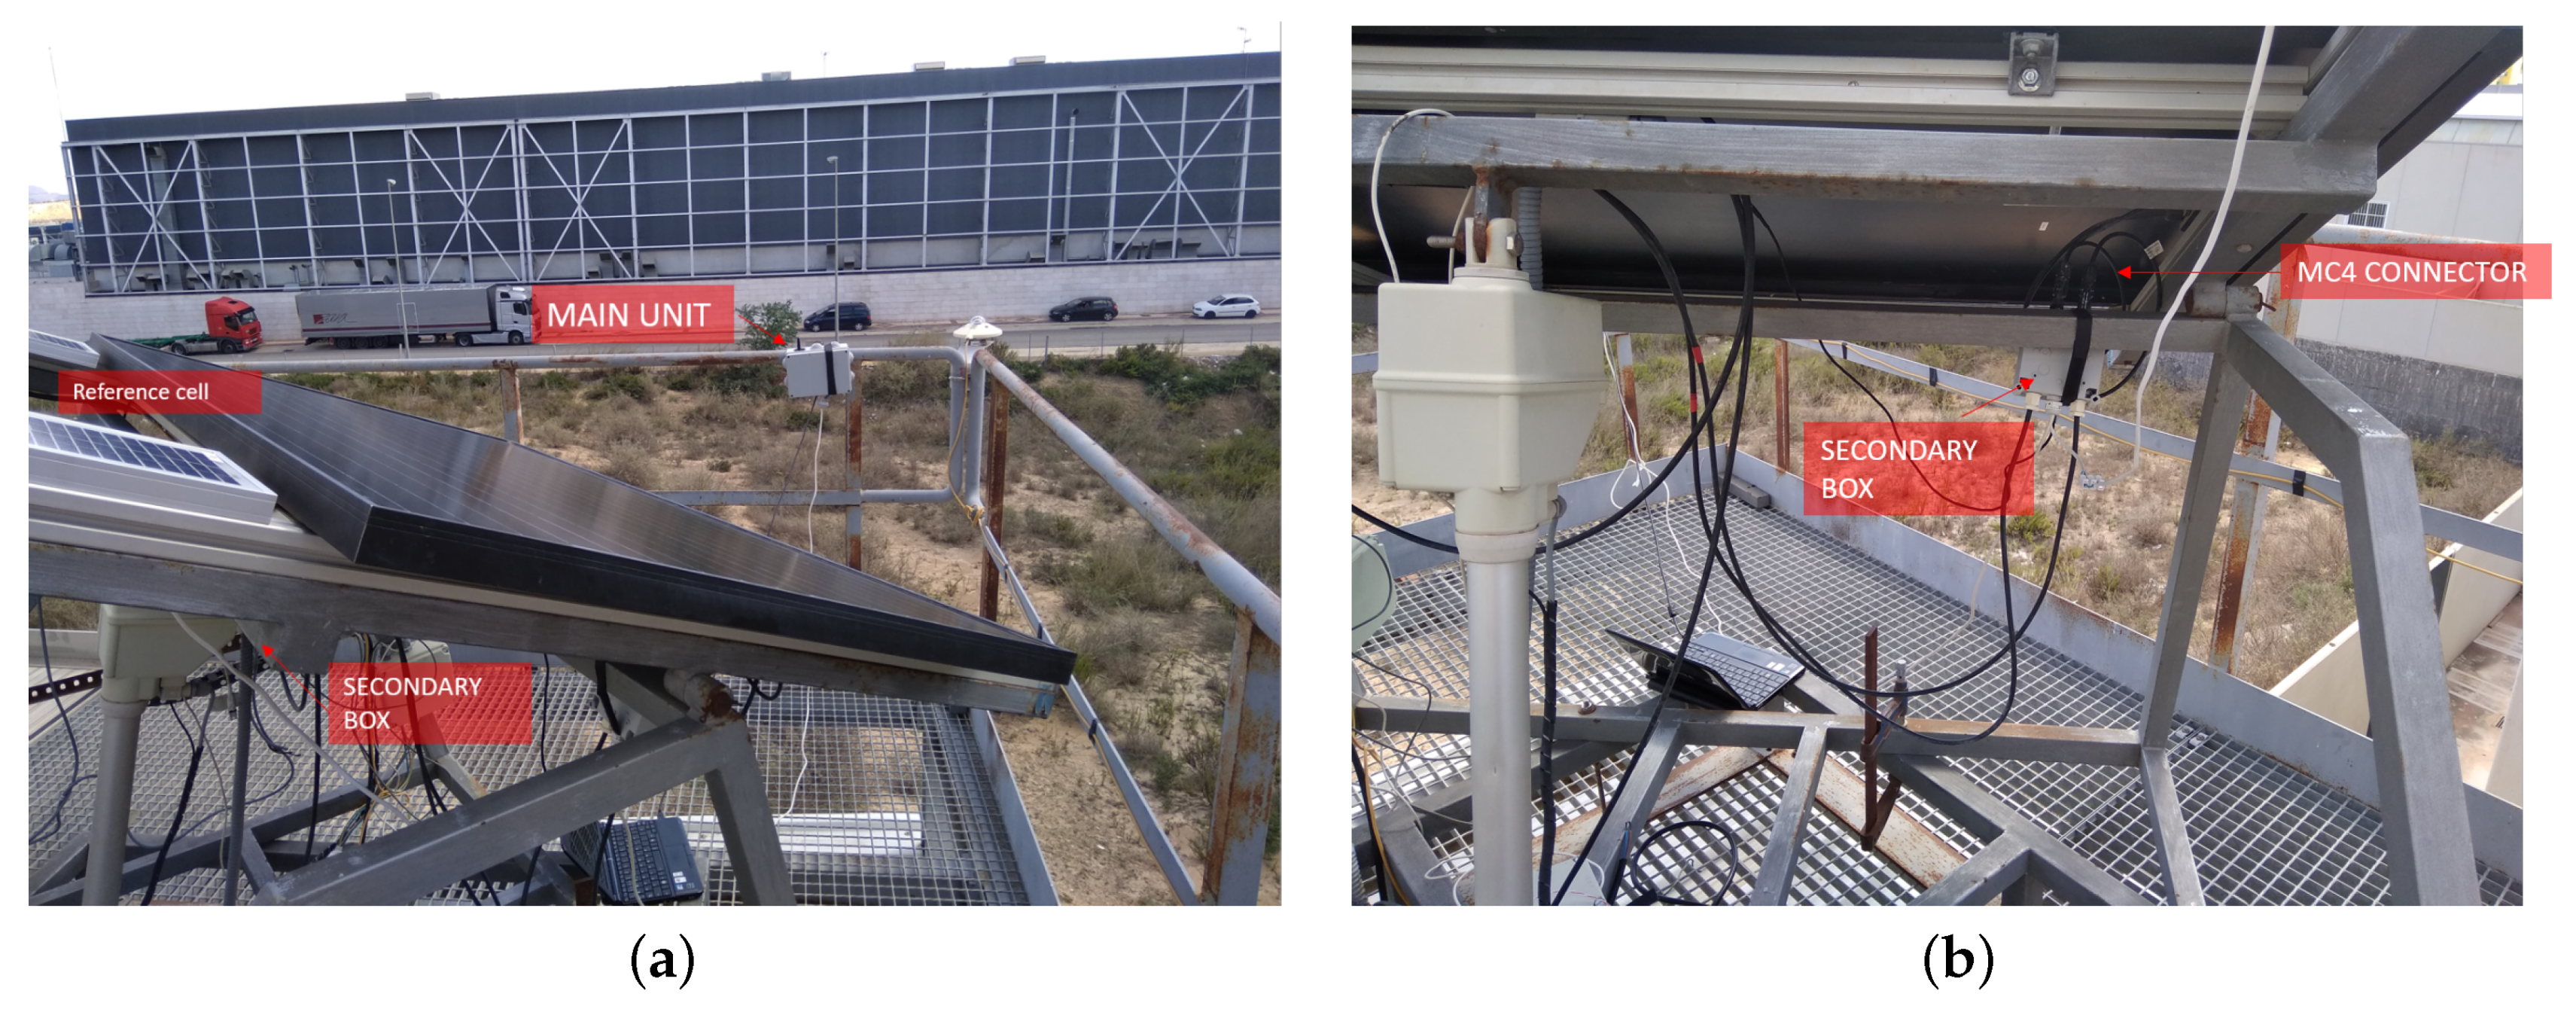
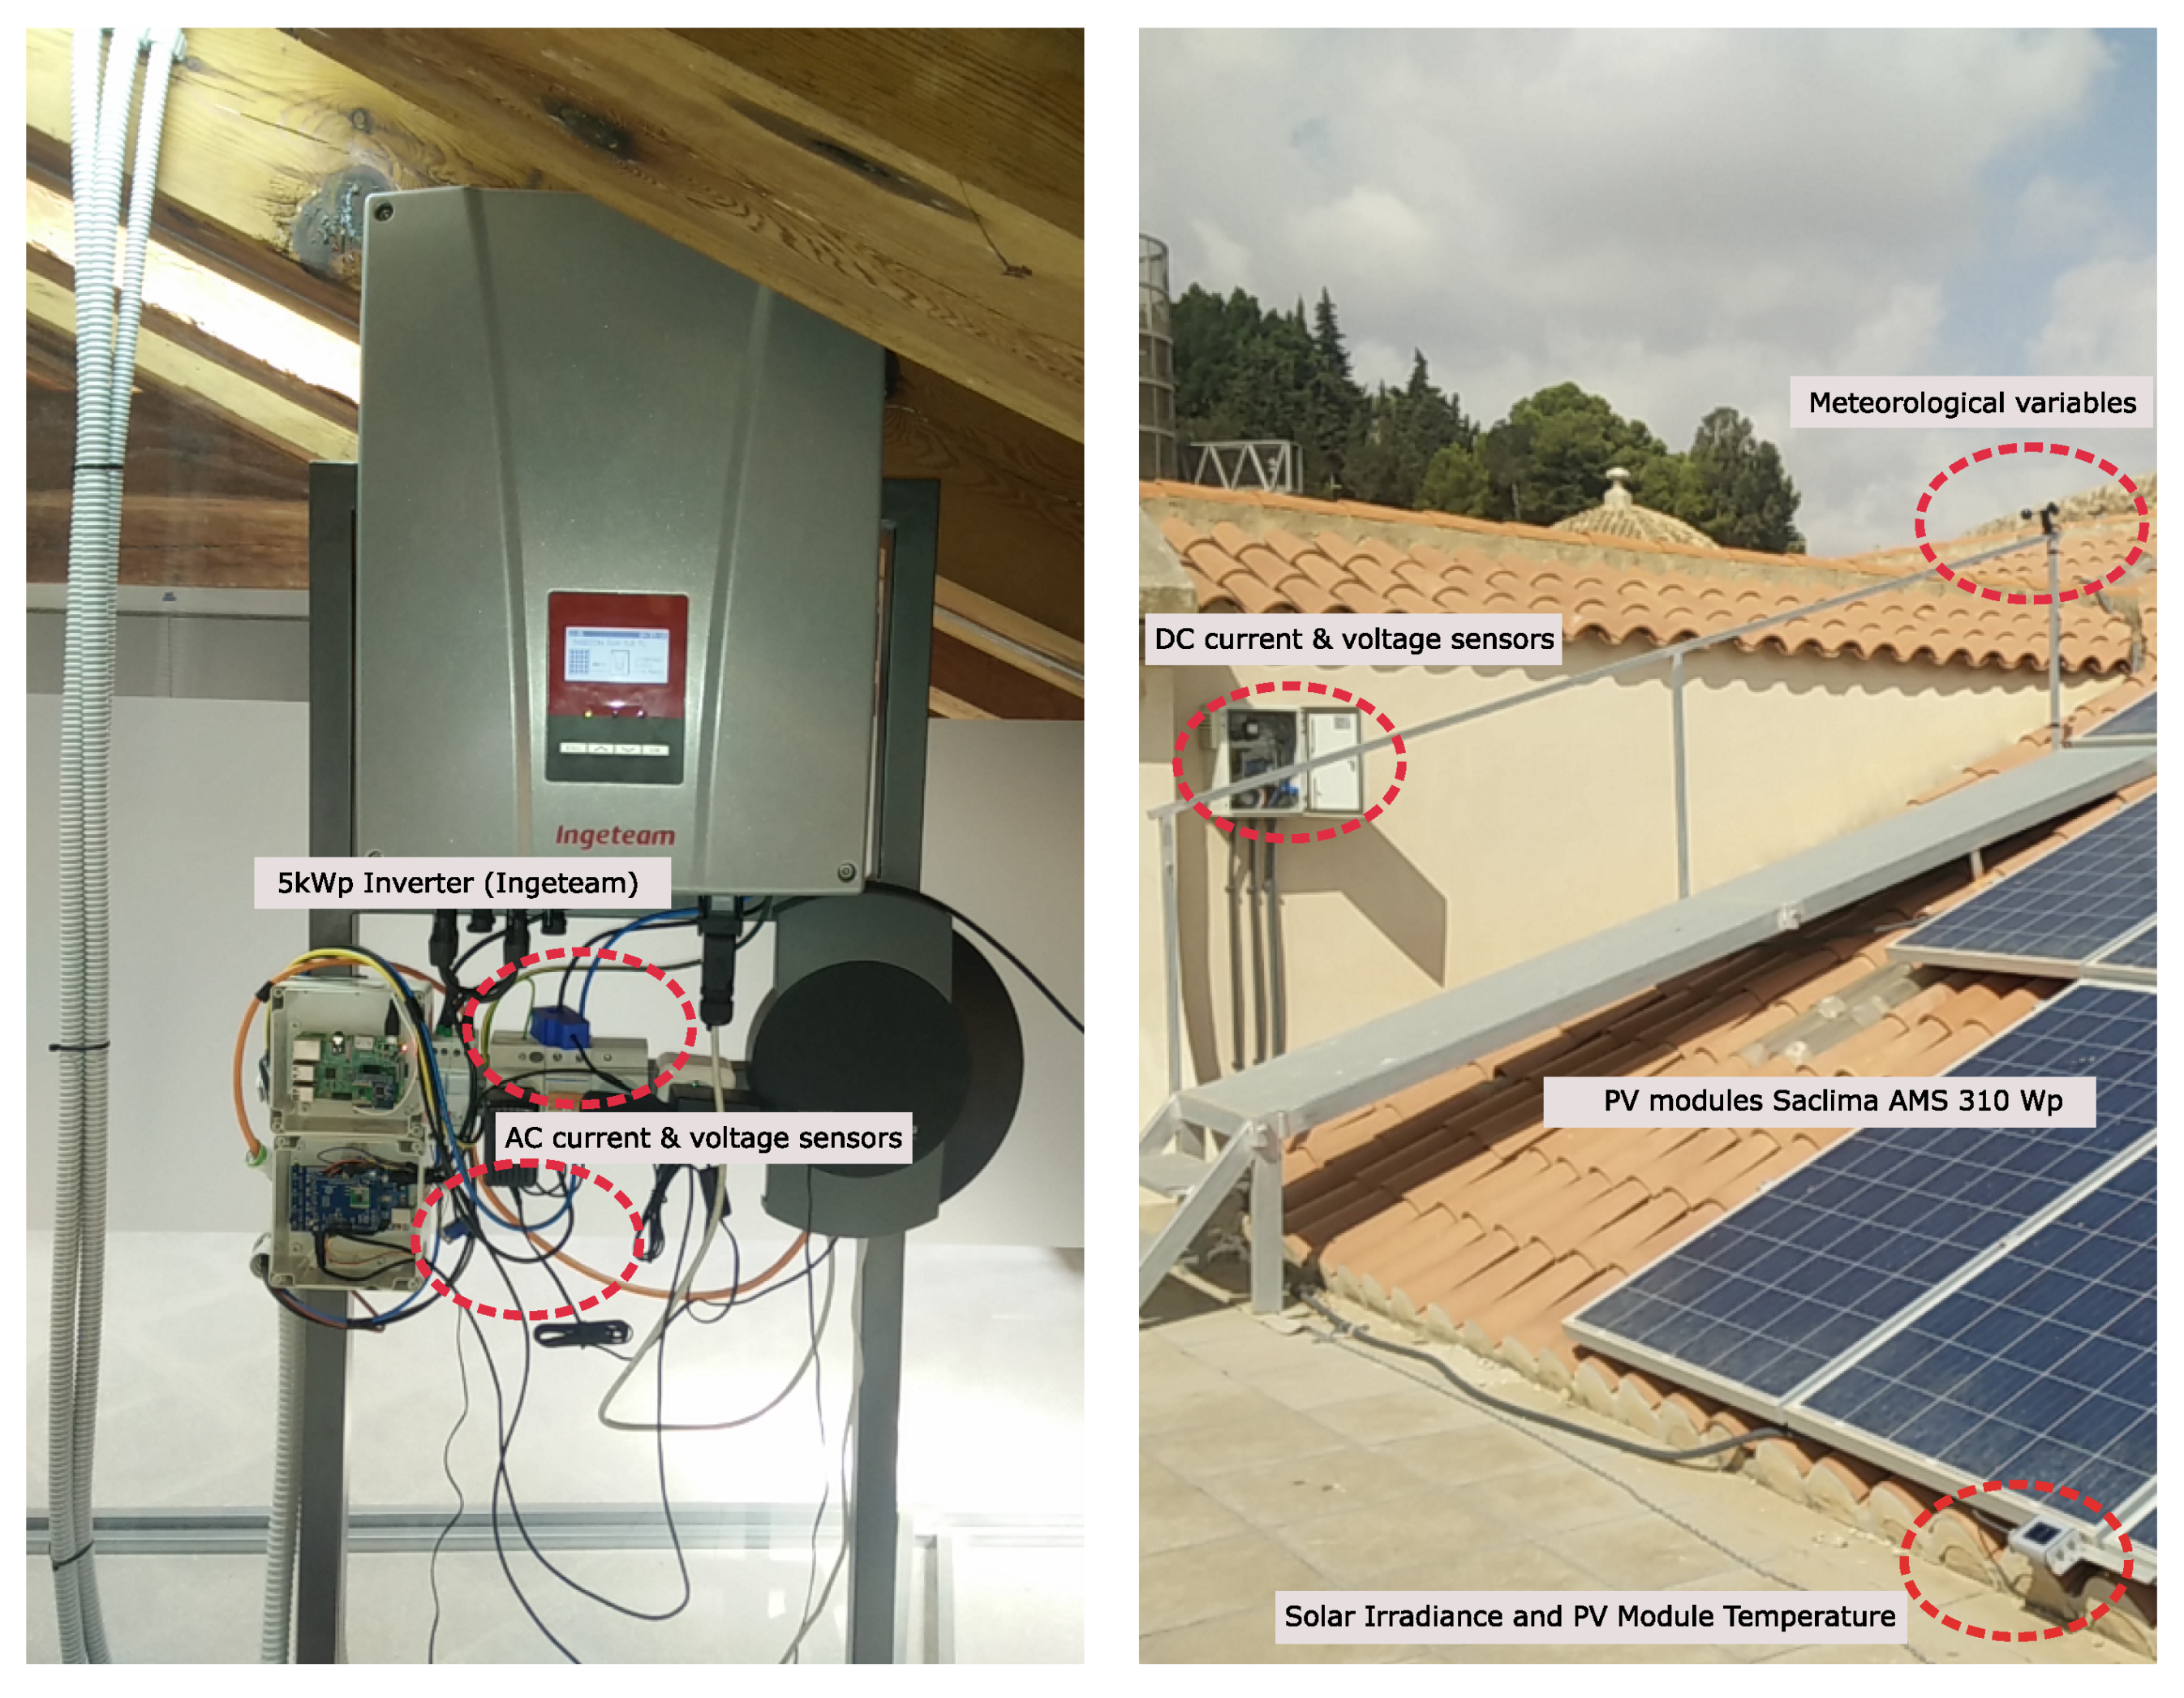
4.1. System Assembly

First, the selected hardware components and sensors (end nodes) were tested in a laboratory environment to evaluate their performance under controlled conditions. After this initial testing, components and sensors were connected and assembled to provide a feasible solution able to operate under real conditions. To facilitate the integration of the proposed monitoring system into real PV power plants, components and sensors corresponding to the end nodes were divided into two subnodes, including most connectors commonly used in real PV installations connected to the grid: (i) a principal subnode involving a main controller, a transceiver with the corresponding voltage level converter, and a set of batteries for power supply requirements (see Figure 5); (ii) a secondary subnode in charge of measuring and collecting PV module variables. To test the appropriateness of the global solution, these nodes were first deployed in the solar laboratory of CETENMA, located in the Industrial Park of Cartagena (southeast Spain). This facility includes measurement equipment to check the performance of PV power plants and modules. For testing purposes, a single 250 Wp monocrystalline PV module connected to an SF 250 W Soltec SolarFighter microinverter was used (see Figure 6).

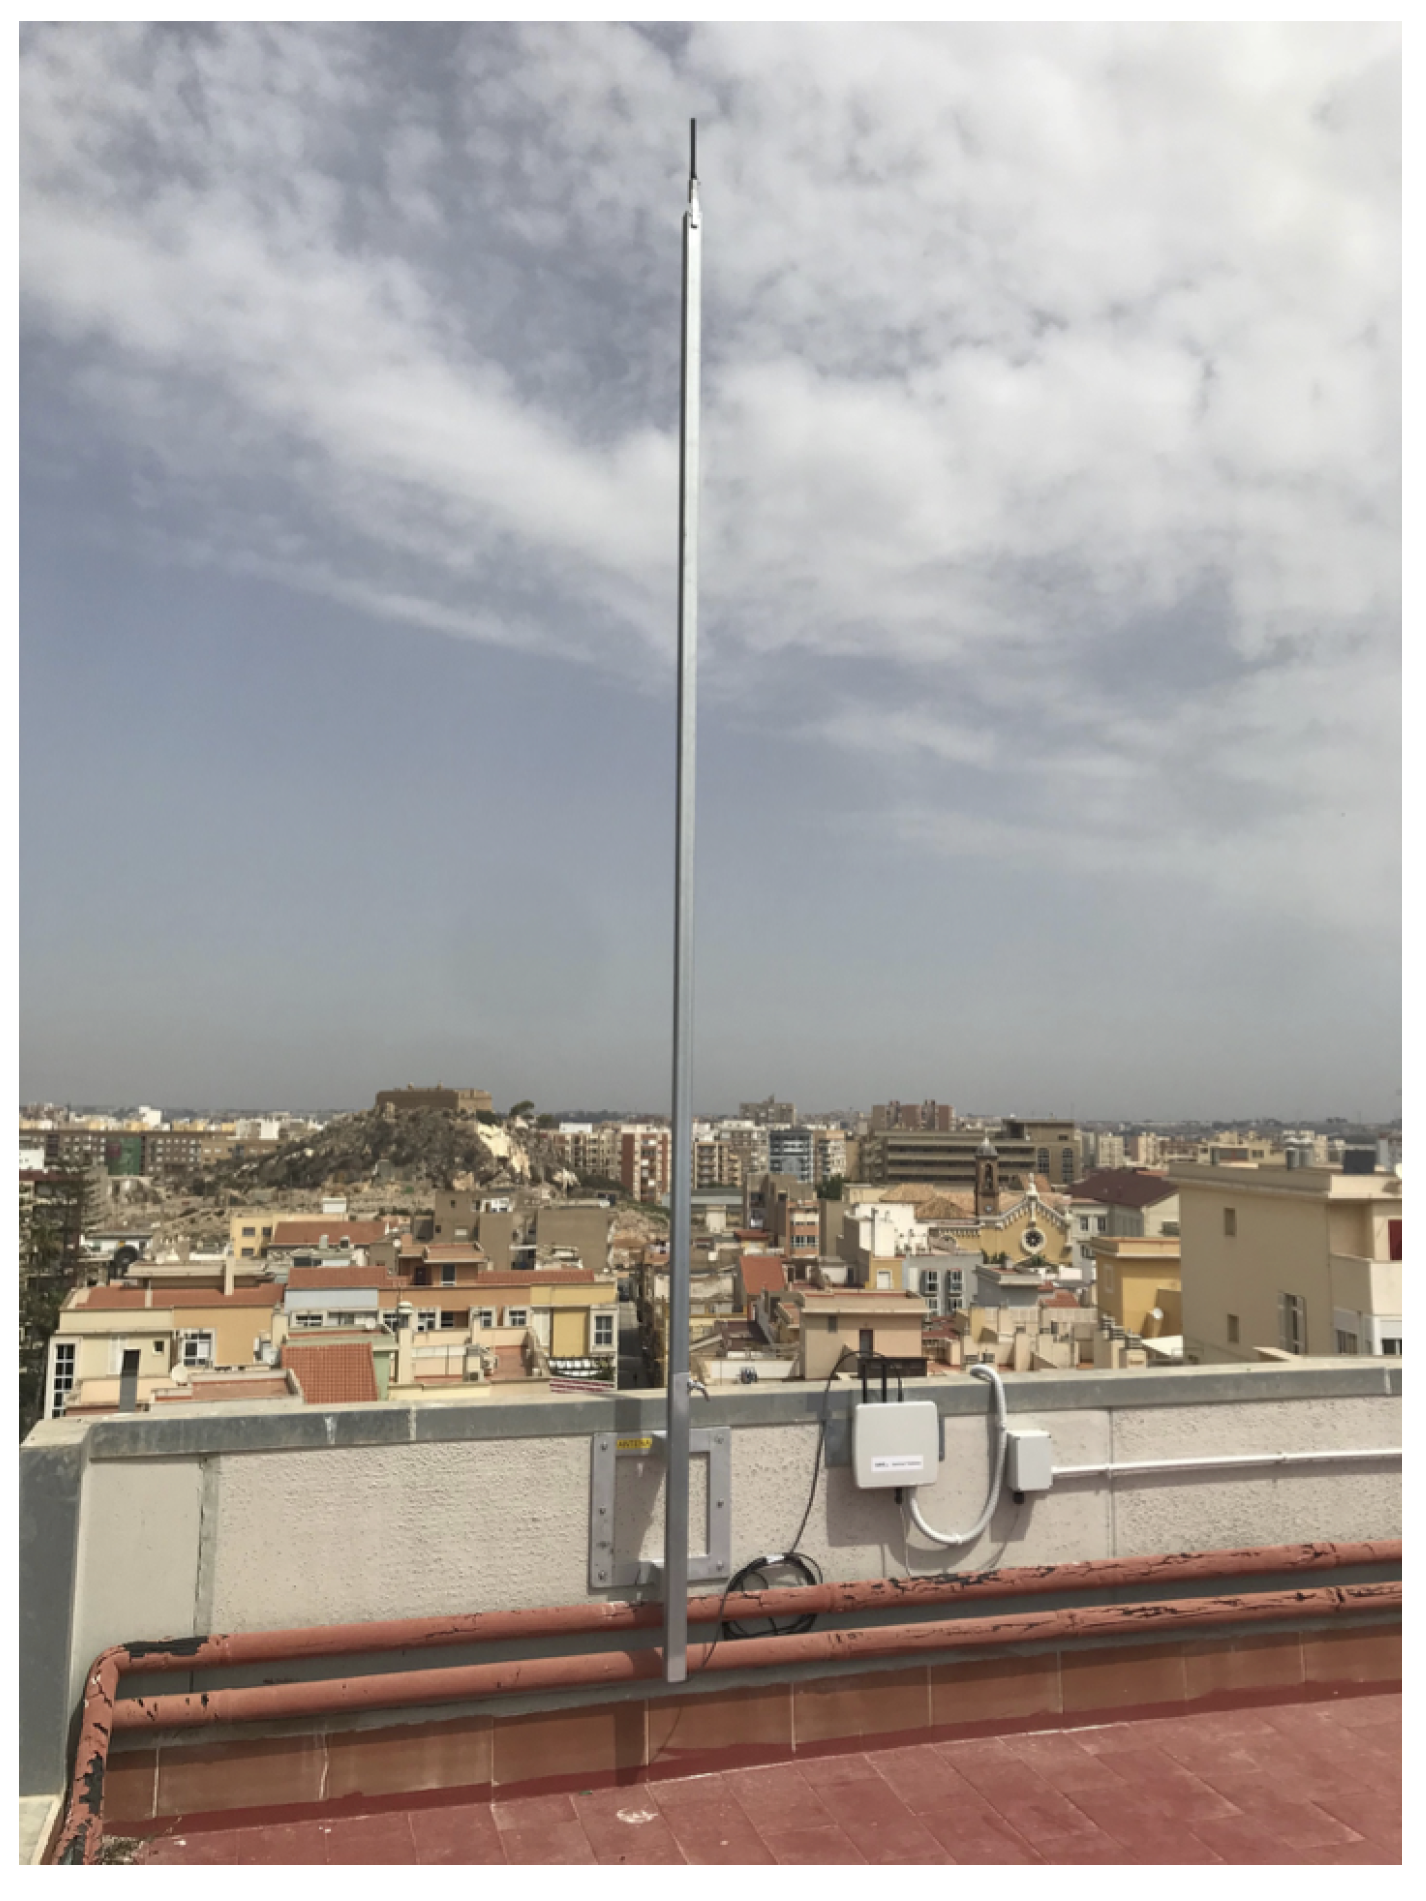
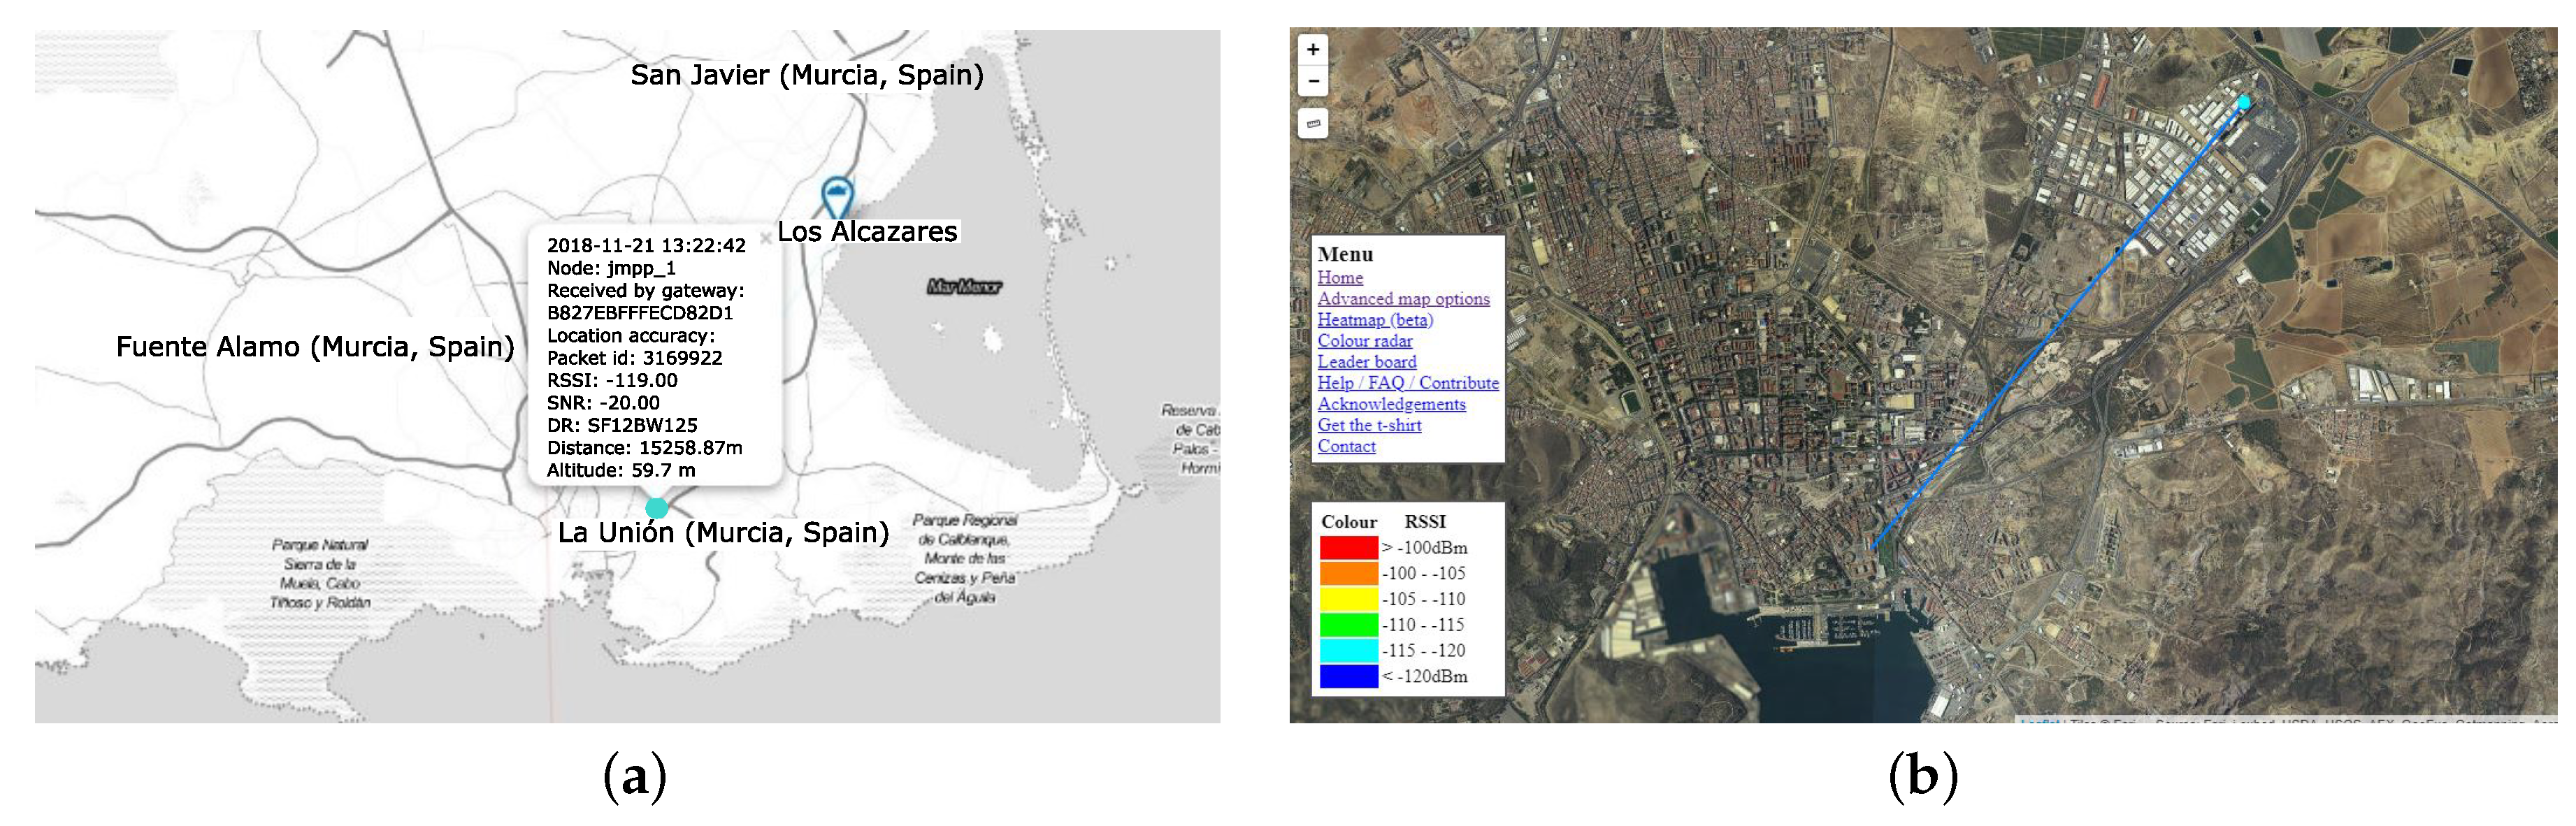
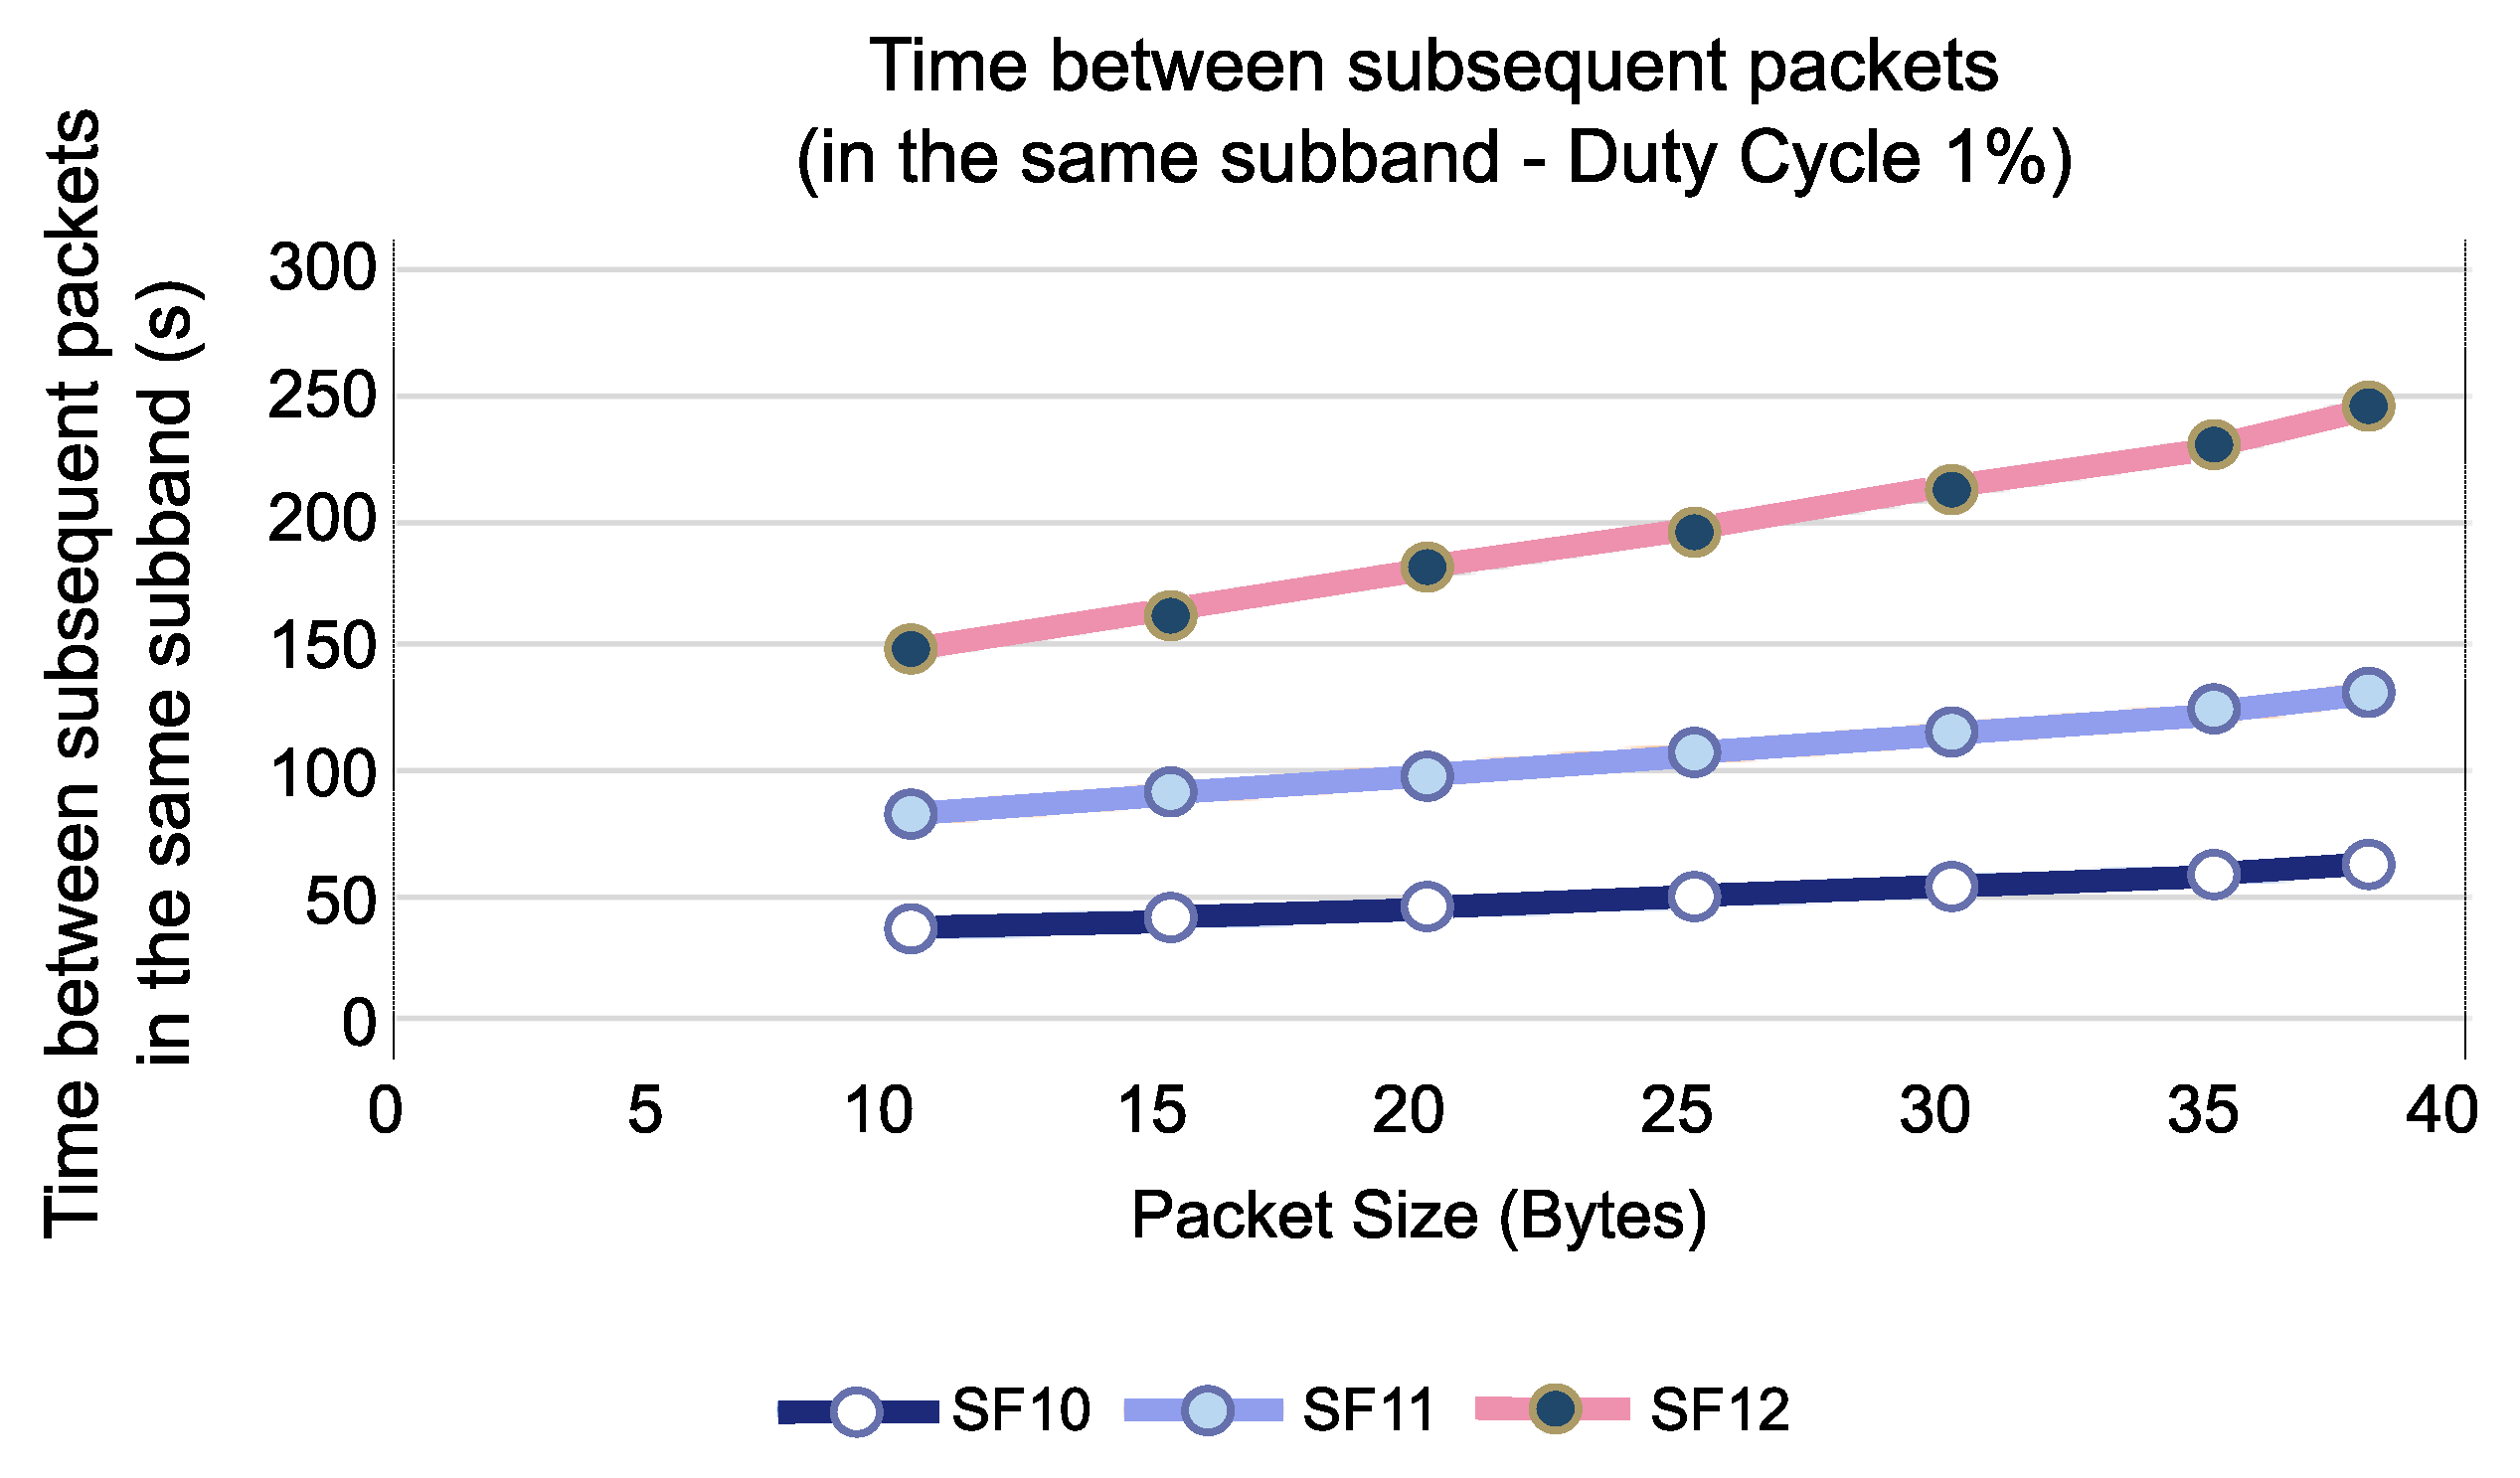
4.2. Coverage Range Characterization

A relevant objective of this work was to evaluate the suitability of the proposed solution to measure, collect, and send data from PV installations to a remote gateway. The coverage range of the initial gateway, discussed in Section 3.3, was not enough to achieve the objectives searched in the test bed. Indeed, the location and low performance of the antenna used for this gateway were likely the biggest drawbacks of the initial poor coverage range. To overcome this limitation, another gateway was implemented and installed at the Universidad Politecnica de Cartagena (Cartagena, Spain). This additional Gateway is called the TM RG186 Series LoRa-enabled gateway [109]. It is located on the roof of a researching building on the university campus (see Figure 7). The gateway was registered with TTN as well.
To ensure the communication of the proposed system, we conducted a test of the signal power and coverage range. To this end, a Global Positioning System (GPS) module was integrated into the end node to transmit the location coordinates. To visualize the position of each end node, the TTN Mapper software tool [110] was installed in the network server. This additional tool provides further information, such as RSSI and SNR. Furthermore, each end node was configured with a transmission power of 14 dBm and SF12 to carry out the set of tests. During these tests, a new gateway was identified 15 km from our installation in the solar laboratory of CETENMA. Figure 8 illustrates these results corresponding to the coverage testing process.

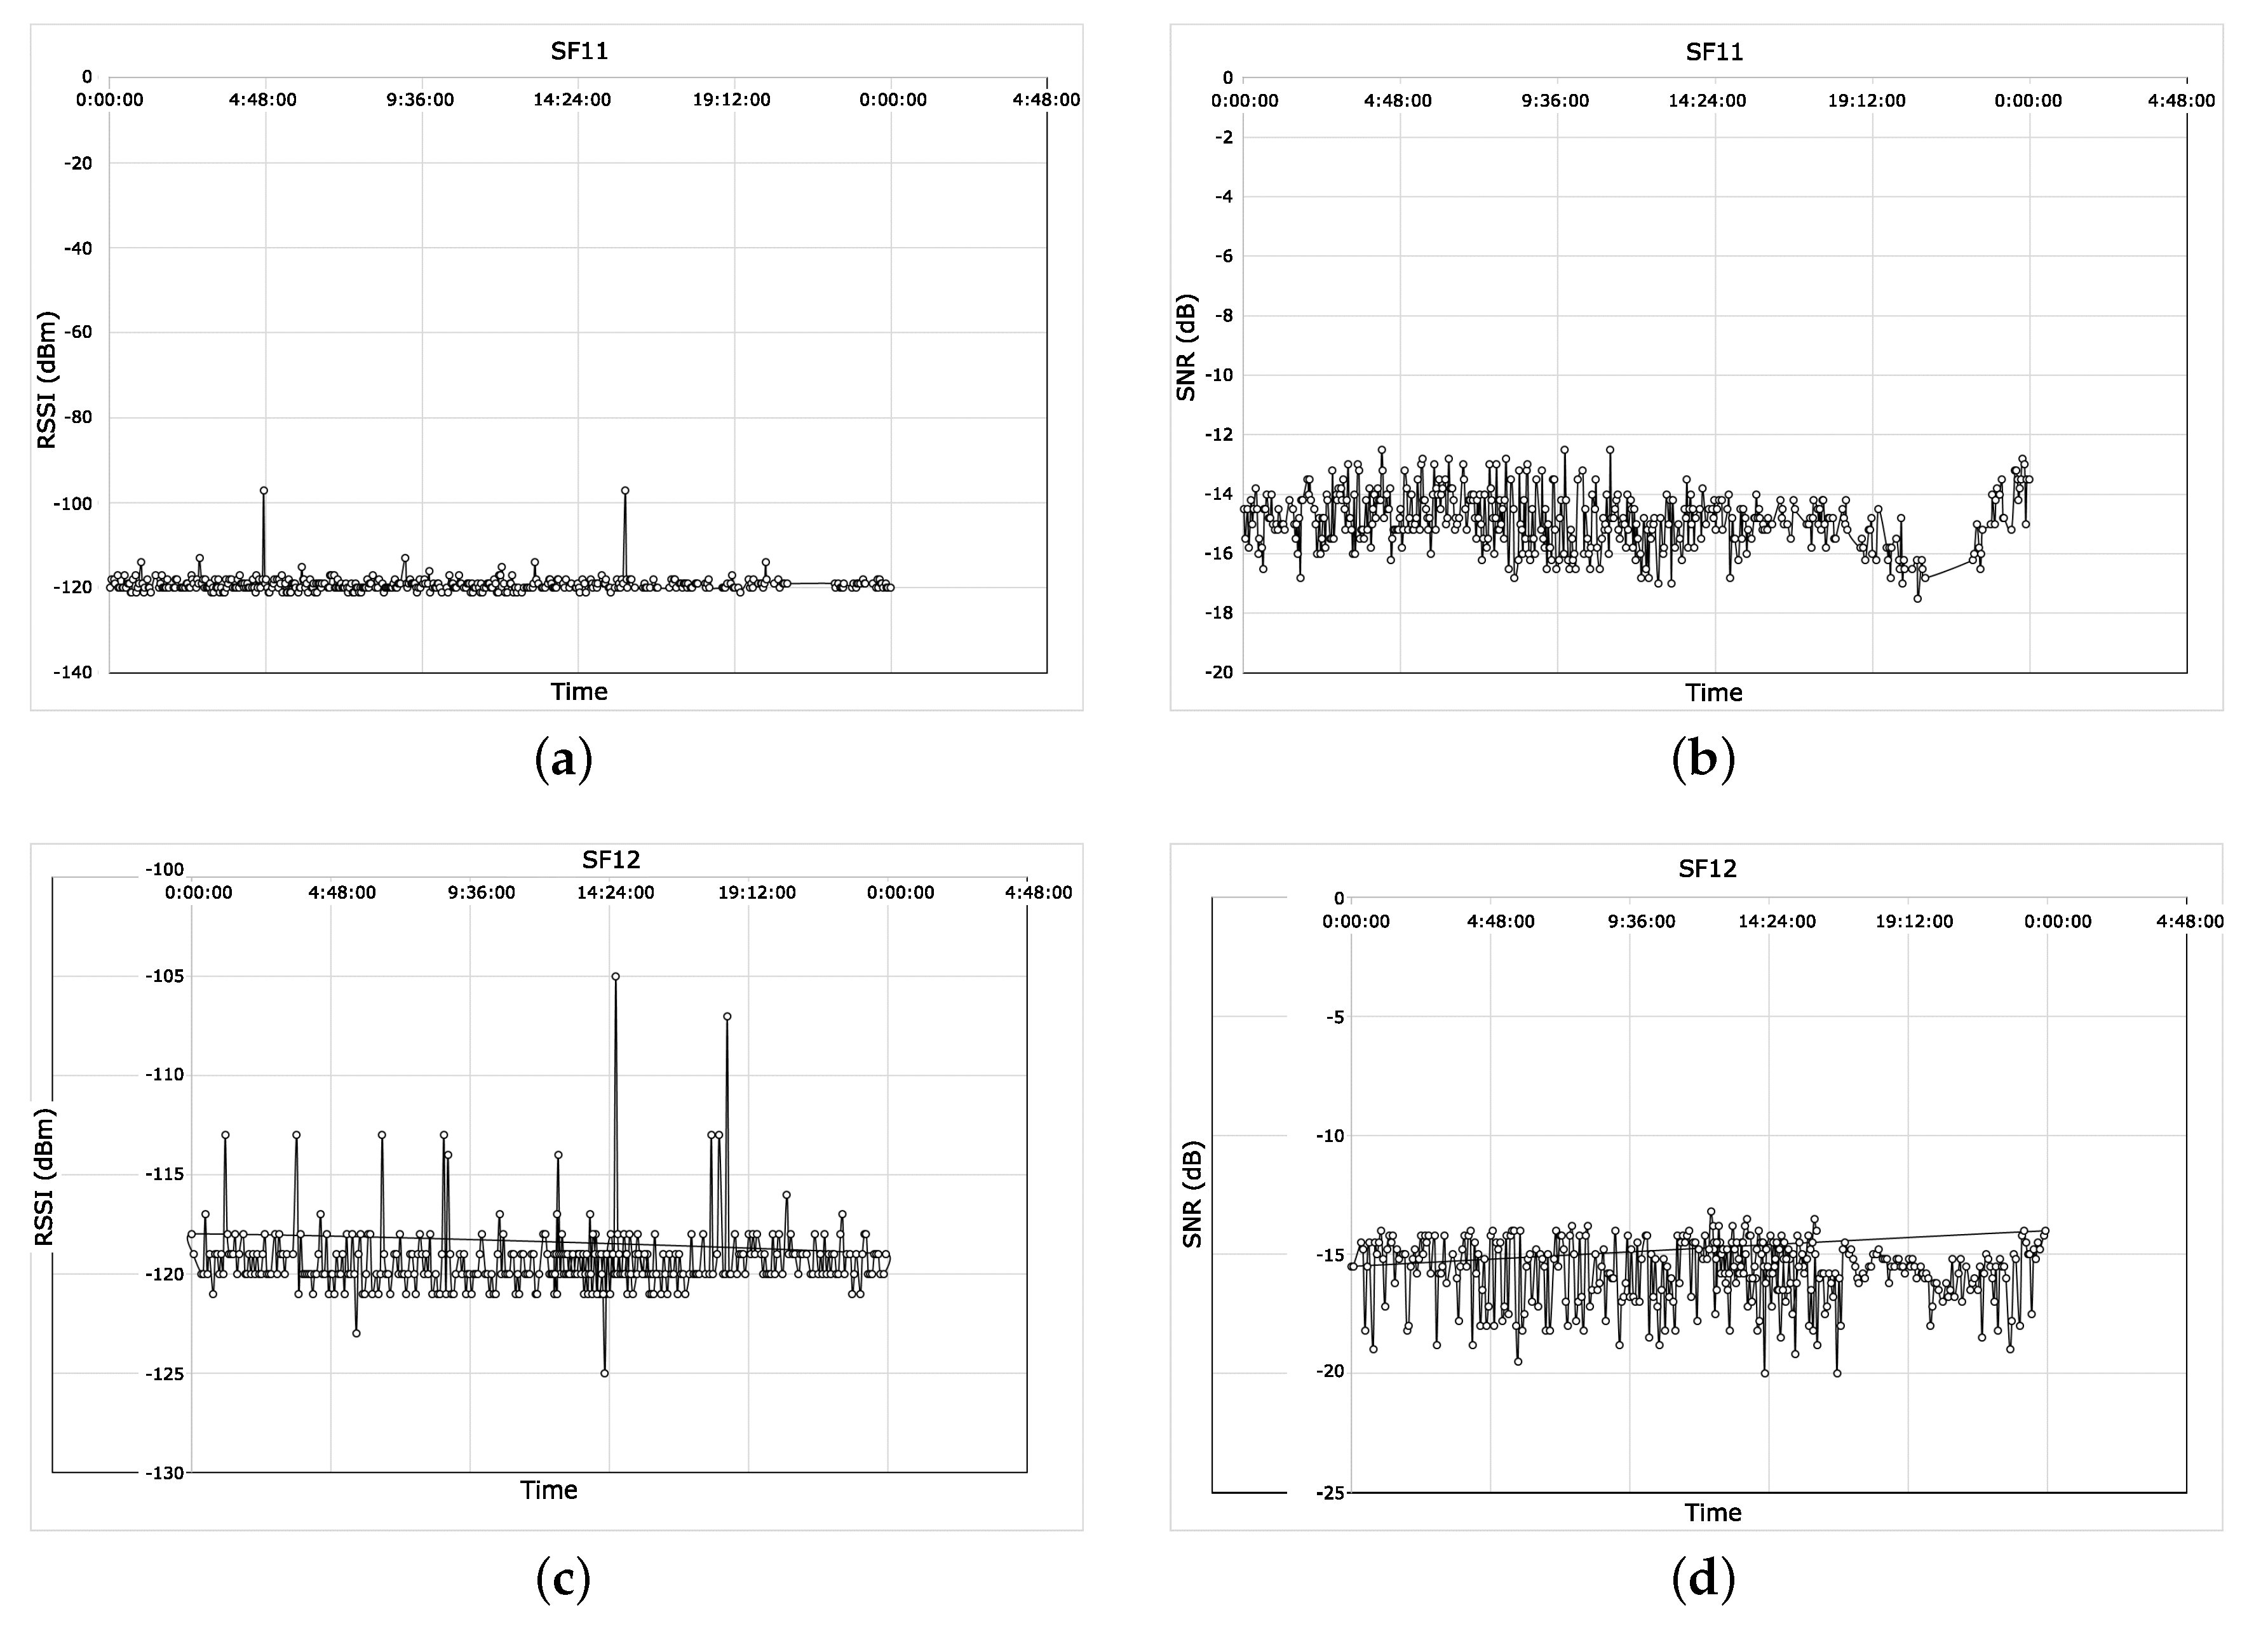
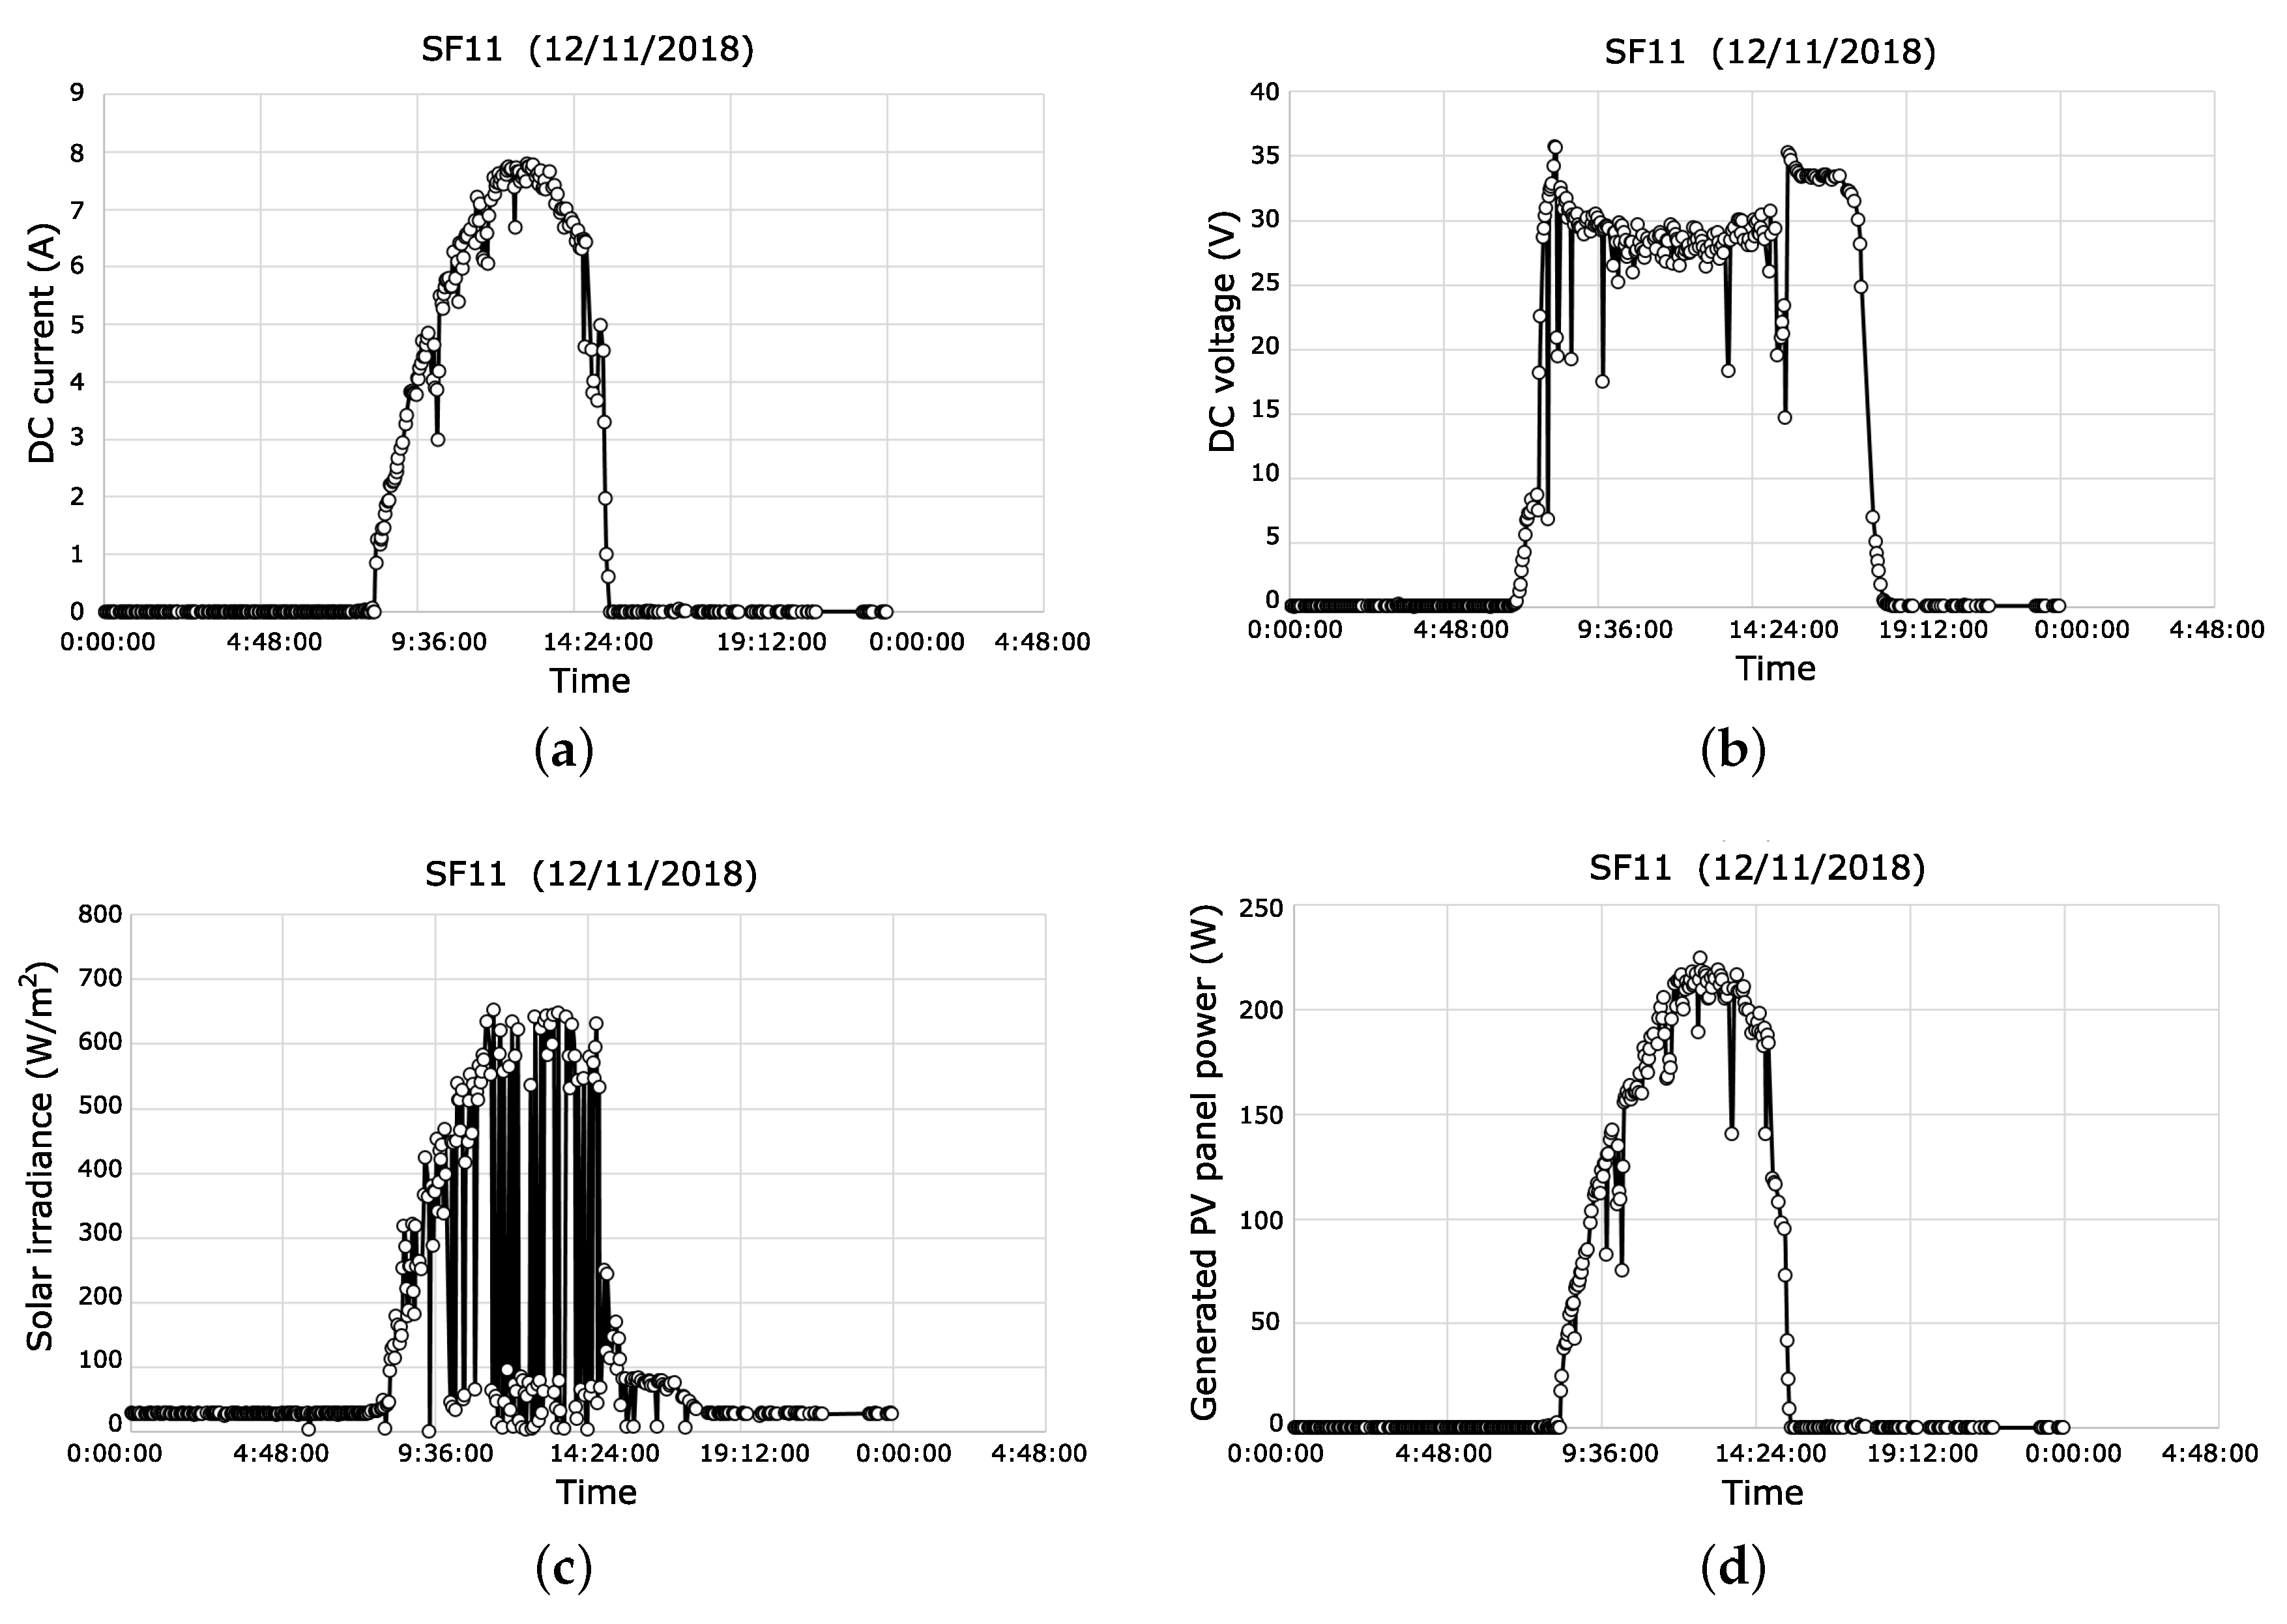
4.3. PV Power Plant Performance Evaluation

Considering the different coverage testing processes we previously carried out, discussed in Section 4.2, a 5 kW PV installation connected to the grid and located on the university campus was deployed to assess the PV monitoring properties of the proposed solution (see Figure 9). Electrical and environmental data were gathered from the PV power plant and sent to the gateway to be evaluated and discussed in subsequent analysis. Additional parameters such as encrypted payload, received signal strength indicator (RSSI), air time, signal-to-noise ratio (SNR), number of packets, and channel included in the LoRa packet are also available and can be downloaded from the TTN website.
A packet size of 38 bytes is considered enough to cover all the parameters for PV power plant monitoring purposes. The transmission power is 14 dBm and the SF metric is tuned from 10 to 12, which influences the data packet over-air time. Figure 10 shows the theoretical time on-air (ms) for each SF configuration depending on the payload length. These results allowed us to configure the sampling period for each SF: 60, 120, and 180 s for SF10, SF11, and SF12, respectively. Our test bed was conducted for 24 h. This time interval was enough to evaluate each SF configuration. It is relevant to point out that SF10 involves no reception of packets in the gateway, as a consequence of different concerns, such as (i) the limited over-air time due to the distance between the device and the gateway, around 4 km; (ii) the locations of end nodes; and (iii) the conditions of the signal propagation.
Figure 11 illustrates the RSSI and SNR results obtained in November 2018 for SF11 and SF12. Table 2 shows additional metrics also discussed in this work: packet delivery ratio and time intervals between different data packets (inter-arrival time). The packet delivery ratio is defined as the ratio between the packets successfully received and the total data packets sent by the end nodes. The inter-arrival time is determined by the time interval value corresponding to each packet received by the TTN web application. For SF11, our study reveals low RSSI and SNR values. As an example, the minimum signal strength in WiFi technology provides basic connectivity with reliable packet delivery around −80/−90 dBm. Concerning SF12, the RSSI and SNR metrics improved around 10%. However, the time interval between packets increased to 115 s, which is reasonable due to greater over-air time of the packets. In terms of the packet delivery ratio, SF11 showed poor performance, with most of the packets corrupted or completely lost. To overcome this drawback, it is necessary to increase the spreading factor (SF), which allows us to improve the metric sharply. It is remarkable that these outcomes are in line with recent contributions [111,112,113], which corroborates one of main advantages of using LoRa: its sensibility. In this respect, weak signals can stimulate the electronic communication of the LoRa device, resulting in successful packet delivery to the gateway. Finally, to verify that the payload is being decrypted correctly, data received by the TTN application are compared to the same data collected by a data logger of the test stand (see Figure 12). These results validate the feasibility and reliability of our proposal, as well as the accuracy of the implemented monitoring and communication solution.

5. Conclusions

A low-cost, open-source solution to monitor PV power plants was designed and evaluated. Our alternative system provides a powerful and straightforward solution, facilitating the integration of this renewable energy source into current power systems. As a novelty, long-range communication technology denoted as LoRa enables data transmission to a remote gateway, which allows us to evaluate the PV installation performance in real time. Extensive electrical and meteorological information is also available from the monitoring system. These data can be applied for predictive maintenance purposes. Moreover, these data have a remarkable impact on grid reliability and PV forecast accuracy.
A PV power plant connected to the grid (5 kW rate power) and located on the university campus (southeast Spain) was used to evaluate the monitoring system. Different field-test campaigns were conducted by the authors. From the results, it can be affirmed that aspects such as the distance between source and destination, the line-of-sight between source and destination, and propagation issues have a clear influence on the appropriate data reception process. Our study demonstrates that scenarios with a high spreading factor value (SF11 and SF12) satisfy an accurate reception of data packets. However, the corresponding over-air time considerably limits the number of transmissions. To overcome this drawback, the sampling time was adjusted in line with the packet air-time and according to the SF value. One of the main limitations of the LoRa solution is its restricted duty cycle (1%), which was taken into account for the testing process. Received data were also compared to data-logger equipment connected in situ in the PV installation. This comparison validates the electrical and meteorological variables gathered by different sensors, resulting in errors lower than 0.5%. Our proposed solution thus offers an alternative system to be implemented in remote PV power plants with the goal of monitoring and dispatching electrical and meteorological data.

Author Contributions

Data curation, J.M.P.-P.; Formal analysis, A.M.-G. and A.J.G.-S.; Funding acquisition, A.M.-A.; Investigation, A.J.G.-S.; Resources, J.M.P.-P.; Supervision, A.M.-G.; Visualization, A.M.-A.; Writing—original draft, A.M.-G.; Writing—review and editing, A.M.-G.

Funding

This work was partially supported by the Spanish agreement (2017) between the Institute for Development of the Region of Murcia (INFO) and the Technological Center for Energy and Environment (CETENMA). The paper includes results of activities conducted under the Research Program for Groups of Scientific Excellence at Region of Murcia (Spain), the Seneca Foundation, and the Agency for Science and Technology of the Region of Murcia (Spain). This work was also supported by project AIM, Ref. TEC2016-76465-C2-1-R (AEI/FEDER, UE).

Acknowledgments

The authors thank the staff of the Universidad Politécnica de Cartagena (Spain) for services and facilities provided.

Conflicts of Interest

The authors declare no conflict of interest.

Abbreviations

The following abbreviations are used in this manuscript:
ABPActivation-by-personalisation
ADRAdaptive data rate
CRCoding rate
CSSChirp spread spectrum
ISCShort-circuit current
LPWANLow-power wide-area networks
RSSIReceived signal strength indicator
SARIMASeasonal autoregressive integrated moving average
SFSpreading factor
SNRSignal-to-noise ratio
TDCTransmission duty cycle
TTNThe Things Networ
WSNWireless sensor network

References

  1. Panwar, N.; Kaushik, S.; Kothari, S. Role of renewable energy sources in environmental protection: A review. Renew. Sustain. Energy Rev. 2011, 15, 1513–1524. [Google Scholar] [CrossRef]
  2. Verzijlbergh, R.; Vries, L.D.; Dijkema, G.; Herder, P. Institutional challenges caused by the integration of renewable energy sources in the European electricity sector. Renew. Sustain. Energy Rev. 2017, 75, 660–667. [Google Scholar] [CrossRef]
  3. Nehrir, M.H.; Wang, C.; Strunz, K.; Aki, H.; Ramakumar, R.; Bing, J.; Miao, Z.; Salameh, Z. A Review of Hybrid Renewable/Alternative Energy Systems for Electric Power Generation: Configurations, Control, and Applications. IEEE Trans. Sustain. Energy 2011, 2, 392–403. [Google Scholar] [CrossRef]
  4. Mancarella, P.; Panteli, M. Influence of Extreme Weather and Climate Change on the Resilience of Power Systems: Impacts and Possible Mitigation Strategies. Electr. Power Syst. Res. 2015, 127, 259–270. [Google Scholar]
  5. Brouwer, A.S.; van den Broek, M.; Seebregts, A.; Faaij, A. Impacts of large-scale Intermittent Renewable Energy Sources on electricity systems, and how these can be modeled. Renew. Sustain. Energy Rev. 2014, 33, 443–466. [Google Scholar] [CrossRef]
  6. Liang, X.; Mazin, H.E.; Reza, S.E. Probabilistic generation and transmission planning with renewable energy integration. In Proceedings of the 2017 IEEE/IAS 53rd Industrial and Commercial Power Systems Technical Conference (ICPS), Niagara Falls, ON, Canada, 6–11 May 2017; pp. 1–9. [Google Scholar] [CrossRef]
  7. Kamaruzzaman, Z. Effect of grid-connected photovoltaic systems on static and dynamic voltage stability with analysis techniques—A review. Przegląd Elektrotechniczny 2015, 1, 136–140. [Google Scholar] [CrossRef]
  8. Hung, D.Q.; Shah, M.R.; Mithulananthan, N. Technical Challenges, Security and Risk in Grid Integration of Renewable Energy. In Smart Power Systems and Renewable Energy System Integration; Jayaweera, D., Ed.; Springer International Publishing: Cham, Switzerland, 2016; pp. 99–118. [Google Scholar] [CrossRef]
  9. Chiandone, M.; Sulligoi, G.; Massucco, S.; Silvestro, F. Hierarchical Voltage Regulation of Transmission Systems with Renewable Power Plants: An overview of the Italian case. In Proceedings of the 3rd Renewable Power Generation Conference, Naples, Italy, 24–25 September 2014. [Google Scholar] [CrossRef]
  10. Behera, M.K.; Majumder, I.; Nayak, N. Solar photovoltaic power forecasting using optimized modified extreme learning machine technique. Eng. Sci. Technol. Int. J. 2018, 21, 428–438. [Google Scholar] [CrossRef]
  11. Wang, F.; Zhen, Z.; Liu, C.; Mi, Z.; Hodge, B.M.; Shafie-khah, M.; Catalão, J.P. Image phase shift invariance based cloud motion displacement vector calculation method for ultra-short-term solar PV power forecasting. Energy Convers. Manag. 2018, 157, 123–135. [Google Scholar] [CrossRef]
  12. Petinrin, J.; Shaaban, M. Impact of renewable generation on voltage control in distribution systems. Renew. Sustain. Energy Rev. 2016, 65, 770–783. [Google Scholar] [CrossRef]
  13. Wolff, B.; Lorenz, E.; Kramer, O. Statistical Learning for Short-Term Photovoltaic Power Predictions. In Studies in Computational Intelligence Computational Sustainability; Springer: Berlin, Germany, 2016; Volume 645. [Google Scholar]
  14. Beránek, V.; Olsan, T.; Libra, M.; Poulek, V.; Sedlacek, J.; Dang, M.Q.; Tyukhov, I. New Monitoring System for Photovoltaic Power Plants’ Management. Energies 2018, 11, 2495. [Google Scholar] [CrossRef]
  15. Madeti, S.R.; Singh, S. Monitoring system for photovoltaic plants: A review. Renew. Sustain. Energy Rev. 2017, 67, 1180–1207. [Google Scholar] [CrossRef]
  16. Fuentes, M.; Vivar, M.; Burgos, J.; Aguilera, J.; Vacas, J. Design of an accurate, low-cost autonomous data logger for PV system monitoring using Arduino™ that complies with IEC standards. Sol. Energy Mater. Sol. Cells 2014, 130, 529–543. [Google Scholar] [CrossRef]
  17. Belhadj Ahmed, C.; Kassas, M.; Essamuddin Ahmed, S. PV-standalone monitoring system performance using LabVIEW. Int. J. Smart Grid Clean Energy 2014, 3, 44–50. [Google Scholar] [CrossRef]
  18. Bayarak, G.; Cebeci, M. Monitoring a grid connected PV power generation system with labview. In Proceedings of the 2013 International Conference on Renewable Energy Research and Applications (ICRERA), Madrid, Spain, 20–23 October 2013; pp. 562–567. [Google Scholar] [CrossRef]
  19. Chouder, A.; Silvestre, S.; Taghezouit, B.; Karatepe, E. Monitoring, modelling and simulation of PV systems using LabVIEW. Sol. Energy 2013, 91, 337–349. [Google Scholar] [CrossRef]
  20. Zhu, Y.; Wu, J.; Wang, R.; Lin, Z.; He, X. Embedding Power Line Communication in Photovoltaic Optimizer by Modulating Data in Power Control Loop. IEEE Trans. Ind. Electron. 2019, 66, 3948–3958. [Google Scholar] [CrossRef]
  21. Mao, W.; Zhang, X.; Cao, R.; Wang, F.; Zhao, T.; Xu, L. A Research on Power Line Communication Based on Parallel Resonant Coupling Technology in PV Module Monitoring. IEEE Trans. Ind. Electron. 2018, 65, 2653–2662. [Google Scholar] [CrossRef]
  22. Ando, B.; Baglio, S.; Pistorio, A.; Tina, G.; Ventura, C. Sentinella: Smart Monitoring of Photovoltaic Systems at Panel Level. IEEE Trans. Instrum. Meas. 2015, 64, 2188–2199. [Google Scholar] [CrossRef]
  23. Prieto, M.; Pernía, A.; Nuno, F.; Diaz, J.; Villegas, P. Development of a Wireless Sensor Network for Individual Monitoring of Panels in a Photovoltaic Plant. Sensors 2014, 14, 2379–2396. [Google Scholar] [CrossRef] [PubMed]
  24. Papageorgas, P.; Piromalis, D.; Antonakoglou, K.; Vokas, G.; Tseles, D.; Arvanitis, K. Smart Solar Panels: In-situ Monitoring of Photovoltaic Panels based on Wired and Wireless Sensor Networks. Energy Procedia 2013, 36, 535–545. [Google Scholar] [CrossRef]
  25. Moreno-García, I.; Palacios-García, E.; Pallares-López, V.; Santiago, I.; González-Redondo, M.; Varo-Martínez, M.; Real-Calvo, R. Real–Time Monitoring System for a Utility–Scale Photovoltaic Power Plant. Sensors 2016, 16, 770. [Google Scholar] [CrossRef]
  26. Moreno-García, I.M.; Palacios-García, E.J.; Santiago, I.; Pallares-López, V.; Moreno-Munoz, A. Performance monitoring of a solar photovoltaic power plant using an advanced real-time system. In Proceedings of the 2016 IEEE 16th International Conference on Environment and Electrical Engineering (EEEIC), Florence, Italy, 7–10 June 2016; pp. 1–6. [Google Scholar] [CrossRef]
  27. Fanourakis, S.; Wang, K.; McCarthy, P.; Jiao, L. Low-cost data acquisition systems for photovoltaic system monitoring and usage statistics. Earth Environ. Sci. 2017, 93, 012048. [Google Scholar] [CrossRef]
  28. Katsioulis, V.; Karapidakis, E.; Hadjinicolaou, M.; Tsikalakis, A. Wireless Monitoring and Remote Control of PV Systems Based on the ZigBee Protocol. In Technological Innovation for Sustainability; Camarinha-Matos, L.M., Ed.; Springer: Berlin/Heidelberg, Germany, 2011; pp. 297–304. [Google Scholar]
  29. Ben Belghith, O.; Lassaad, S. Remote GSM module monitoring and Photovoltaic system control. In Proceedings of the 2014 First International Conference on Green Energy ICGE, Sfax, Tunisia, 25–27 March 2014; pp. 188–192. [Google Scholar] [CrossRef]
  30. Zahurul, S.; Mariun, N.; Kah, L.; Hizam, H.; Othman, M.L.; Abidin, I.Z.; Norman, Y. A novel Zigbee-based data acquisition system for distributed photovoltaic generation in smart grid. In Proceedings of the 2015 IEEE Innovative Smart Grid Technologies—Asia (ISGT ASIA), Chengdu, China, 21–24 May 2015; pp. 1–6. [Google Scholar] [CrossRef]
  31. Shariff, F.; Rahim, N.A.; Hew, W.P. Zigbee-based data acquisition system for online monitoring of grid-connected photovoltaic system. Expert Syst. Appl. 2015, 42, 1730–1742. [Google Scholar] [CrossRef]
  32. Li, Y.F.; Lin, P.J.; Zhou, H.F.; Chen, Z.C.; Wu, L.J.; Cheng, S.Y.; Su, F.P. On-line monitoring system of PV array based on internet of things technology. Earth Environ. Sci. 2017, 93, 012078. [Google Scholar] [CrossRef]
  33. Adhya, S.; Saha, D.; Das, A.; Jana, J.; Saha, H. An IoT based smart solar photovoltaic remote monitoring and control unit. In Proceedings of the 2016 2nd International Conference on Control, Instrumentation, Energy Communication (CIEC), Kolkata, India, 28–30 January 2016; pp. 432–436. [Google Scholar] [CrossRef]
  34. Kekre, A.; Gawre, S.K. Solar photovoltaic remote monitoring system using IOT. In Proceedings of the 2017 International Conference on Recent Innovations in Signal processing and Embedded Systems (RISE), Bhopal, India, 27–29 October 2017; pp. 619–623. [Google Scholar] [CrossRef]
  35. Tejwani, R.; Kumar, G.; Solanki, C. Remote Monitoring for Solar Photovoltaic Systems in Rural Application Using GSM Voice Channel. Energy Procedia 2014, 57, 1526–1535. [Google Scholar] [CrossRef]
  36. Pereira, R.I.; Dupont, I.M.; Carvalho, P.C.; Jucá, S.C. IoT embedded linux system based on Raspberry Pi applied to real-time cloud monitoring of a decentralized photovoltaic plant. Measurement 2018, 114, 286–297. [Google Scholar] [CrossRef]
  37. López-Vargas, A.; Fuentes, M.; Vivar, M. IoT Application for Real-Time Monitoring of Solar Home Systems Based on Arduino™ With 3G Connectivity. IEEE Sens. J. 2019, 19, 679–691. [Google Scholar] [CrossRef]
  38. Ahmed, M.A.; Kang, Y.C.; Kim, Y.C. Communication Network Architectures for Smart-House with Renewable Energy Resources. Energies 2015, 8, 8716–8735. [Google Scholar] [CrossRef]
  39. Han, J.; Lee, I.; Kim, S. User-friendly monitoring system for residential PV system based on low-cost power line communication. IEEE Trans. Consum. Electron. 2015, 61, 175–180. [Google Scholar] [CrossRef]
  40. Hadjipanayi, M.; Koumparou, I.; Philippou, N.; Paraskeva, V.; Phinikarides, A.; Makrides, G.; Efthymiou, V.; Georghiou, G. Prospects of photovoltaics in southern European, Mediterranean and Middle East regions. Renew. Energy 2016, 92, 58–74. [Google Scholar] [CrossRef]
  41. Kyritsis, A.; Voglitsis, D.; Papanikolaou, N.; Tselepis, S.; Christodoulou, C.; Gonos, I.; Kalogirou, S. Evolution of PV systems in Greece and review of applicable solutions for higher penetration levels. Renew. Energy 2017, 109, 487–499. [Google Scholar] [CrossRef]
  42. Mateo, C.; Frías, P.; Cossent, R.; Sonvilla, P.; Barth, B. Overcoming the barriers that hamper a large-scale integration of solar photovoltaic power generation in European distribution grids. Sol. Energy 2017, 153, 574–583. [Google Scholar] [CrossRef]
  43. Matschoss, P.; Bayer, B.; Thomas, H.; Marian, A. The German incentive regulation and its practical impact on the grid integration of renewable energy systems. Renew. Energy 2019, 134, 727–738. [Google Scholar] [CrossRef]
  44. Colak, I.; Sagiroglu, S.; Fulli, G.; Yesilbudak, M.; Covrig, C.F. A survey on the critical issues in smart grid technologies. Renew. Sustain. Energy Rev. 2016, 54, 396–405. [Google Scholar] [CrossRef]
  45. Hancke, G.P.; Silva, B.; Hancke, G.P., Jr. The Role of Advanced Sensing in Smart Cities. Sensors 2013, 13, 393–425. [Google Scholar] [CrossRef] [PubMed]
  46. Molina-Garcia, A.; Campelo, J.C.; Blanc, S.; Serrano, J.J.; Garcia-Sanchez, T.; Bueso, M.C. A Decentralized Wireless Solution to Monitor and Diagnose PV Solar Module Performance Based on Symmetrized-Shifted Gompertz Functions. Sensors 2015, 15, 18459–18479. [Google Scholar] [CrossRef] [PubMed]
  47. Paredes-Parra, J.M.; Mateo-Aroca, A.; Silvente-Niñirola, G.; Bueso, M.C.; Molina-Garcia, A. PV Module Monitoring System Based on Low-Cost Solutions: Wireless Raspberry Application and Assessment. Energies 2018, 11. [Google Scholar] [CrossRef]
  48. Madeti, S.; Singh, S. Comparative analysis of solar photovoltaic monitoring systems. AIP Conf. Proc. 2017, 1859, 1–6. [Google Scholar] [CrossRef]
  49. Zahran, M.; Atia, Y.; Alhosseen, A.; El-Sayed, I. Wired and wireless remote control of PV system. WSEAS Trans. Syst. Control 2010, 5, 656–666. [Google Scholar]
  50. Rahman, M.M.; Selvaraj, J.; Rahim, N.; Hasanuzzaman, M. Global modern monitoring systems for PV based power generation: A review. Renew. Sustain. Energy Rev. 2018, 82, 4142–4158. [Google Scholar] [CrossRef]
  51. Usman, R.; Parag, K.; Mahesh, S. Low Power Wide Area Networks: An Overview. IEEE Commun. Surv. Tutor. 2017, 19, 855–873. [Google Scholar]
  52. Song, Y.; Lin, J.; Tang, M.; Dong, S. An Internet of Energy Things Based on Wireless LPWAN. Engineering 2017, 3, 460–466. [Google Scholar] [CrossRef]
  53. Sinha, R.S.; Wei, Y.; Hwang, S.H. A survey on LPWA technology: LoRa and NB-IoT. ICT Express 2017, 3, 14–21. [Google Scholar] [CrossRef]
  54. Migabo, E.; Djouani, K.; Kurien, A.; Olwal, T. A Comparative Survey Study on LPWA Networks: LoRa and NB–IoT. In Proceedings of the Future Technologies Conference (FTC), Vancouver, BC, Canada, 29–30 November 2017; pp. 1045–1051. [Google Scholar]
  55. LoRa-Alliance. The Internet of Things—An explosion of Connected Possibility. Available online: https://docs.wixstatic.com/ugd/eccc1ade5fda268ed945e885a43a39b38752 (accessed on 28 November 2018).
  56. LoRa-Alliance. The Internet of Things—An Explosion of Connected Possibility. LoRa-Alliance. Available online: https://www.thethingsnetwork.org/article/ground-breaking-world-record-lorawan-packet-received-at-702-km-436-miles-distance (accessed on 28 November 2018).
  57. LoRa. LoRa-Alliance. 2018. Available online: https://lora-alliance.org (accessed on 28 November 2018).
  58. Magrin, D.; Centenaro, M.; Vangelista, L. Performance evaluation of LoRa networks in a smart city scenario. In Proceedings of the IEEE International Conference on Communications (ICC), Kansas, MO, USA, 20–24 May 2017; pp. 1–7. [Google Scholar]
  59. Sorensen, R.; Kim, D.; Nielsen, J.; Popovski, P. Analysis of Latency and MAC–layer Performance for Class A LoRaWAN. IEEE Wirel. Commun. Lett. 2017, 6, 566–569. [Google Scholar] [CrossRef]
  60. Haxhibeqiri, J.; Karaagac, A.; den Abeele, F.V.; Joseph, W.; Moerman, I.; Hoebeke, J. LoRa indoor coverage and performance in an industrial environment: Case study. In Proceedings of the 22nd IEEE International Conference on Emerging Technologies and Factory Automation (ETFA), Limassol, Cyprus, 12–15 September 2017; pp. 1–8. [Google Scholar]
  61. Orfei, F.; Mezzetti, C.B.; Cottone, F. Vibrations powered LoRa sensor: An electromechanical energy harvester working on a real bridge. In Proceedings of the 2016 IEEE Sensors, Orlando, FL, USA, 30 October–3 November 2016; pp. 1–3. [Google Scholar]
  62. James, J.G.; Nair, S. Efficient, real–time tracking of public transport, using LoRaWAN and RF transceivers. In Proceedings of the TENCON 2017 IEEE Region 10 Conference, Penang, Malaysia, 5–8 November 2017; pp. 2258–2261. [Google Scholar]
  63. Rahman, A.; Suryanegara, M. The development of IoT LoRa: A performance evaluation on LoS and Non-LoS environment at 915 MHz ISM frequency. In Proceedings of the International Conference on Signals and Systems (ICSigSys), Bali, Indonesia, 16–18 May 2017; pp. 163–167. [Google Scholar]
  64. Rwanda Parks. Available online: https://www.theverge.com/2017/7/20/16002752/smart-park-rwanda-akagera-poaching-lorawan (accessed on 28 November 2018).
  65. Vejlgaard, B.; Lauridsen, M.; Nguyen, H.; Kovacs, I.; Mogensen, P.; Sorensen, M. Coverage and Capacity Analysis of Sigfox, LoRa, GPRS, and NB-IoT. In Proceedings of the IEEE 85th Vehicular Technology Conference (VTC Spring), Sydney, Australia, 4–7 June 2017; pp. 1–5. [Google Scholar]
  66. Goursaud, C.; Gorce, J. Dedicated networks for IoT: PHY–MAC state of the art and challenges. EAI Endorsed Transac. Int. Things 2015. [Google Scholar] [CrossRef]
  67. Persia, S.; Carciofi, C.; Faccioli, M. NB-IoT and LoRA connectivity analysis for M2M/IoT smart grids applications. In Proceedings of the AEIT International Annual Conference, Cagliari, Italy, 20–22 September 2017; pp. 1–6. [Google Scholar]
  68. Martin, B.; Utz, R.; Thiemo, V.; Juan, M.A. Do LoRa Low-Power Wide-Area Networks Scale? In Proceedings of the 19th ACM International Conference on Modeling, Analysis and Simulation of Wireless and Mobile Systems, Malta, 13–17 November 2016; pp. 59–67. [Google Scholar] [CrossRef]
  69. Georgiou, O.; Raza, U. Low Power Wide Area Network Analysis: Can LoRa Scale? IEEE Wirel. Commun. Lett. 2017, 6, 162–165. [Google Scholar] [CrossRef]
  70. Bor, M.; Roedig, U. LoRa Transmission Parameter Selection. In Proceedings of the 2017 13th International Conference on Distributed Computing in Sensor Systems (DCOSS), Ottawa, ON, Canada, 5–7 June 2017; pp. 27–34. [Google Scholar] [CrossRef]
  71. Alexandru-Ioan, P.; Usman, R.; Parag, K.; Mahesh, S. Does Bidirectional Traffic Do More Harm Than Good in LoRaWAN Based LPWA Networks? In Proceedings of the GLOBECOM 2017 IEEE Global Communications Conference, Singapore, 4–8 December 2017. [Google Scholar] [CrossRef]
  72. Alliance, L. What Is LoRaWAN; A Technical Overview; LoRaWAN: London, UK, 2015. [Google Scholar]
  73. Kraemer, F.; Ammar, D.; Bråten, A.; Tamkittikhun, N.; Palma, D. Solar Energy Prediction for Constrained IoT Nodes Based on Public Weather Forecasts. In Proceedings of the Seventh International Conference on the Internet of Things, Linz, Austria, 22–25 October 2017. [Google Scholar] [CrossRef]
  74. Shuda, J.; Rix, A.; Booysen, M.T. Towards Module-Level Performance and Health Monitoring of Solar PV Plants Using LoRa Wireless Sensor Networks. In Proceedings of the 2018 IEEE PES/IAS Power Africa, Cape Town, South Africa, 28–29 June 2018. [Google Scholar] [CrossRef]
  75. Choi, C.; Jeong, J.; Lee, I.; Park, W. LoRa based renewable energy monitoring system with open IoT platform. In Proceedings of the 2018 International Conference on Electronics, Information, and Communication (ICEIC), Honolulu, HI, USA, 24–27 January 2018; pp. 1–2. [Google Scholar] [CrossRef]
  76. De Carvalho Silva, J.; Rodrigues, J.; Alberti, A.; Solic, P.; Aquino, A. LoRaWAN—A Low Power WAN Protocol for Internet of Things: A Review and Opportunities. In Proceedings of the 2017 2nd International Multidisciplinary Conference on Computer and Energy Science (SpliTech), Split, Croatia, 12–14 July 2017. [Google Scholar]
  77. Nolan, K.E.; Guibene, W.; Kelly, M.Y. An evaluation of low power wide area network technologies for the Internet of Things. In Proceedings of the 2016 International Wireless Communications and Mobile Computing Conference (IWCMC), Paphos, Cyprus, 5–9 September 2016; pp. 439–444. [Google Scholar] [CrossRef]
  78. Arduino. Arduino.org. Available online: http://arduino.cc/ (accessed on 28 November 2018).
  79. Galadima, A.A. Arduino as a learning tool. In Proceedings of the 2014 11th International Conference on Electronics, Computer and Computation (ICECCO), Abuja, Nigeria, 29 September–1 October 2014; pp. 1–4. [Google Scholar] [CrossRef]
  80. Kabir, A.F.M.S.; Shorif, M.A.; Li, H.; Yu, Q. A study of secured wireless sensor networks with XBee and Arduino. In Proceedings of the 2014 2nd International Conference on Systems and Informatics (ICSAI 2014), Shanghai, China, 15–17 November 2014; pp. 492–496. [Google Scholar] [CrossRef]
  81. Arduino Manual. Arduino Microcontroller. Arduino.org. Available online: http://arduino.cc/en/Reference/HomePage (accessed on 28 November 2018).
  82. Deshmukh, A.D.; Shinde, U.B. A low cost environment monitoring system using raspberry Pi and arduino with Zigbee. In Proceedings of the 2016 International Conference on Inventive Computation Technologies (ICICT), Coimbatore, India, 26–27 August 2016; Volume 3, pp. 1–6. [Google Scholar] [CrossRef]
  83. Telkamp, T. IBM LMIC v1.5 (LoRaWAN in C) Adapted to Run under the Arduino Environment. Technical Report. 2016. Available online: https://github.com/things-nyc/testnode-arm-cortex-mbed-lmic-1.5 (accessed on 28 November 2018).
  84. Han, J.; Jeong, J.D.; Lee, I.; Kim, S.H. Low-cost monitoring of photovoltaic systems at panel level in residential homes based on power line communication. IEEE Trans. Consum. Electron. 2017, 63, 435–441. [Google Scholar] [CrossRef]
  85. YHDC. STC-013-000 Datasheet. Available online: https://datasheet4u.com/datasheet-pdf/YHDC/STC-013-000/pdf.php?id=1089416 (accessed on 28 November 2018).
  86. MicroSystems, A. ACS712–Datasheet. Available online: http://www.alldatasheet.com/datasheet-pdf/pdf/168326/ALLEGRO/ACS712.html (accessed on 28 November 2018).
  87. Vicente, E.M.; Moreno, R.L.; Ribeiro, E.R. MPPT Technique Based on Current and Temperature Measurements. Int. J. Photoenergy 2015, 1–9. [Google Scholar] [CrossRef]
  88. Harald, M.; Willem, Z.; Ewan, D.; Heinz, O. Calibration of photovoltaic reference cells by global sunlight method. Metrologia 2005, 42, 360. [Google Scholar] [CrossRef]
  89. Priya, C.G.; AbishekPandu, M.; Chandra, B. Automatic plant monitoring and controlling system over GSM using sensors. In Proceedings of the 2017 IEEE Technological Innovations in ICT for Agriculture and Rural Development (TIAR), Chennai, India, 7–8 April 2017; pp. 173–176. [Google Scholar] [CrossRef]
  90. Hulea, M.; Mois, G.; Folea, S.; Miclea, L.; Biscu, V. Wi-sensors: A low power Wi-Fi solution for temperature and humidity measurement. In Proceedings of the 39th Annual Conference of the IEEE Industrial Electronics Society, Vienna, Austria, 10–13 November 2013; pp. 4011–4015. [Google Scholar] [CrossRef]
  91. Saha, S.; Majumdar, A. Data centre temperature monitoring with ESP8266 based Wireless Sensor Network and cloud based dashboard with real time alert system. In Proceedings of the 2017 Devices for Integrated Circuit (DevIC), Kalyani, India, 23–24 March 2017; pp. 307–310. [Google Scholar] [CrossRef]
  92. Skoplaki, E.; Palyvos, J. On the temperature dependence of photovoltaic module electrical performance: A review of efficiency/power correlations. Sol. Energy 2009, 83, 614–624. [Google Scholar] [CrossRef]
  93. Dubey, S.; Sarvaiya, J.N.; Seshadri, B. Temperature Dependent Photovoltaic (PV) Efficiency and Its Effect on PV Production in the World—A Review. Energy Procedia 2013, 33, 311–321. [Google Scholar] [CrossRef]
  94. Skoplaki, E.; Boudouvis, A.; Palyvos, J. A simple correlation for the operating temperature of photovoltaic modules of arbitrary mounting. Sol. Energy Mater. Sol. Cells 2008, 92, 1393–1402. [Google Scholar] [CrossRef]
  95. Emery, K.; Smith, R. Monitoring System Performance; Technical Report; National Renewable Energy Laboratory (NREL): Golden, CO, USA, 2011.
  96. Maxim Integrated Products, Inc. DS18S20 DATASHEET. Available online: https://datasheets.maximintegrated.com/en/ds/DS18S20.pdf (accessed on 28 November 2018).
  97. Electronic, H. RFM Datasheet. Available online: http://www.hoperf.com/upload/rf/RFM95969798W.pdf (accessed on 28 November 2018).
  98. Van den Bossche, A.; Dalcé, R.; Val, T. OpenWiNo: An open hardware and software framework for fast-prototyping in the IoT. In Proceedings of the 2016 23rd International Conference on Telecommunications (ICT), Thessaloniki, Greece, 16–18 May 2016; pp. 1–6. [Google Scholar] [CrossRef]
  99. Wendt, T.; Volk, F.; Mackensen, E. A benchmark survey of long range (LoRaTM) spread-spectrum-communication at 2.45 GHz for safety applications. In Proceedings of the 2015 IEEE 16th Annual Wireless and Microwave Technology Conference (WAMICON), Cocoa Beach, FL, USA, 13–15 April 2015; pp. 1–4. [Google Scholar] [CrossRef]
  100. IEC 61724, Photovoltaic System Performance Monitoring-Guidelines for Measurement, Data Exchange, and Analysis. 2017. Available online: https://ci.nii.ac.jp/naid/10019072640/ (accessed on 28 November 2018).
  101. IBM. IBM LMIC Framework. Arduino Port of the LMIC (LoraWAN-in-C, Formerly LoraMAC-in-C) Framework Provided by IBM. Available online: http://www.research.ibm.com/labs/zurich/ics/lrsc/lmic.html (accessed on 28 November 2018).
  102. ETSI. EN300.220 Short Range Devices (SRD) Operating in the Frequency Range 25 MHz to 1000 MHz; Part 1 Technical Characteristics and Methods of Measurement. Available online: https://www.etsi.org/deliver/etsi_en/300200_300299/30022001/03.01.01_60/en_30022001v030101p.pdf (accessed on 28 November 2018).
  103. Kooijman, M. LoRa(WAN) Airtime Calculator. Available online: https://docs.google.com/spreadsheets/d/1voGAtQAjC1qBmaVuP1ApNKs1ekgUjavHuVQIXyYSvNc/edit?usp=sharing (accessed on 28 November 2018).
  104. Adelantado, F.; Vilajosana, X.; Tuset-Peiro, P.; Martinez, B.; Melià-Seguí, J.; Watteyne, T. Understanding the limits of LoRaWAN. IEEE Commun. Mag. 2017, 55, 48–54. [Google Scholar] [CrossRef]
  105. Dragino. LoRa Wireless Products Family. Available online: http://wiki.dragino.com/index.php?title=Main_Page#LoRa_Wireless_Products_Family (accessed on 28 November 2018).
  106. Foundation, R.P. Raspbian. Available online: https://www.raspberrypi.org/downloads/raspbian/ (accessed on 28 November 2018).
  107. Telkamp, T. Single Channel LoRaWAN Gateway. Available online: https://github.com/tftelkamp/single_chan_pkt_fwd (accessed on 28 November 2018).
  108. Network, T.T. Learn How to Grow the Network and Connect All Things. Available online: https://www.thethingsnetwork.org/docs/ (accessed on 28 November 2018).
  109. Product Brief—Sentrius RG1xx Series Gateway. Available online: https://www.mouser.es/datasheet/2/223/Product%20Brief%20-%20Sentrius%20RG1xx%20Series%20Gateway-1113271.pdf (accessed on 28 November 2018).
  110. Meijers, J. TTN Mapper. Available online: http://ttnmapper.org (accessed on 28 November 2018).
  111. Sanchez-Iborra, R.; Sanchez-Gomez, J.; Ballesta-Vinas, J.; Skarmeta, A. Performance Evaluation of LoRa Considering Scenario Conditions. Sensors 2018, 19, 772. [Google Scholar] [CrossRef] [PubMed]
  112. Augustin, A.; Yi, J.; Clausen, T.; Townsley, W. A Study of LoRa: Long Range & Low Power Networks for the Internet of Things. Sensors 2016, 16, 1466. [Google Scholar] [CrossRef]
  113. SemTech. SemTech Manual Online. Available online: http://semtech.force.com/lora/LC_Answers_Questions?id=90644000000PmGvAAK (accessed on 28 November 2018).
Figure 1. General overview of long-range (LoRa)/LoRa wireless area network (WAN) architecture.
Energies 12 00881 g001
Figure 2. General diagram of sensors and Arduino connections.
Energies 12 00881 g002
Figure 3. Dispatching data packets: implemented transceivers. (a) RFM95 with an ESP8266 module adapter. (b) HOPE RFM95W transceiver with breakout board and 868 MHz antenna.
Energies 12 00881 g003
Figure 4. Single-channel gateway. (a) Gateway assembly. (b) Gateway coverage range.
Energies 12 00881 g004
Figure 5. Detail of the system assembly. Principal subnode.
Energies 12 00881 g005
Figure 6. Testing system located at the CETENMA SolarLab (Spain). (a) SolarLab outdoor test site details. (b) Secondary box details.
Energies 12 00881 g006
Figure 7. TM RG186 series LoRa-enabled gateway (Universidad Politecnica de Cartagena, Spain).
Energies 12 00881 g007
Figure 8. Coverage testing analysis. (a) Gateway identification map. (b) Coverage testing results on The Things Network (TTN) Mapper website.
Energies 12 00881 g008
Figure 9. End nodes of 5 kWp PV installation monitoring.
Energies 12 00881 g009
Figure 10. Theoretical time-on-air (ms) for different tested SF configurations.
Energies 12 00881 g010
Figure 11. Coverage range tests. (a) Received signal strength indicator (RSSI) data (SF11). (b) Signal-to-noise ratio (SNR) results (SF11). (c) RSSI data (SF12). (d) SNR results (SF12).
Energies 12 00881 g011
Figure 12. PV example of collected data (12 November 2018). (a) DC current data. (b) DC voltage data. (c) Solar irradiance data. (d) Generated active power.
Energies 12 00881 g012
Table 1. PV monitoring node cost.
DescriptionNumberUnit Price (Euro)Total Price (Euro)
PV module (5 Wp, 22 V, 30 W)18.758.75
Cement resistance 5 W 10 Ω 10 R 5%10.130.13
AC-AC power supply adapter14.954.95
Non-invasive AC–sensor14.314.31
5 V DC-USB power adapter12.402.40
2.54 mm PCB screw connector60.171.02
Aluminium electrolytic capacitor 400 V20.020.04
Metal film resistance 1 M 1.2 M 1.5 M 2 M 2.2 M Ω 60.050.30
Prototype PCB universal board10.350.35
Outdoor enclosure and wiring13.503.50
RFM95 LoRa Breakout + SMA connector antenna15.955.95
HOPE RFM9514.054.05
DS12820 temperature sensor10.990.99
DHT temperature and humidity sensor12.522.52
Total cost 39.26
Table 2. Packet delivery rate and inter-arrival time metrics. SF, spreading factor.
SFPacket Data SentPacket Data ReceivedPacket Delivery RateAverage Time between Packets (s)Inter-Arrival Time (s)
1155930755%190.85131.00
1240236491%273.13246.00

