Article

Two-Stage Pretreatment to Improve Saccharification of Oat Straw and Jerusalem Artichoke Biomass

by
Urszula Dziekońska-Kubczak
*,
Joanna Berłowska
,
Piotr Dziugan
,
Piotr Patelski
,
Maria Balcerek
,
Katarzyna Pielech-Przybylska
and
Katarzyna Robak
Institute of Fermentation Technology and Microbiology, Faculty of Biotechnology and Food Sciences, Lodz University of Technology, Wolczanska 171/173, 90-924 Lodz, Poland
*
Author to whom correspondence should be addressed.
Energies 2019, 12(9), 1715; https://doi.org/10.3390/en12091715
Submission received: 18 April 2019 / Revised: 29 April 2019 / Accepted: 2 May 2019 / Published: 7 May 2019
(This article belongs to the Special Issue Fuels of the Future)

Abstract

:
Pretreatment is a necessary step when lignocellulosic biomass is to be converted to simple sugars; however single-stage pretreatment is often insufficient to guarantee full availability of polymeric sugars from raw material to hydrolyzing enzymes. In this work, the two-stage pretreatment with use of acid (H2SO4, HNO3) and alkali (NaOH) was applied in order to increase the susceptibility of Jerusalem artichoke stalks (JAS) and oat straw (OS) biomass on the enzymatic attack. The effect of the concentration of reagents (2% and 5% w/v) and the order of acid and alkali sequence on the composition of remaining solids and the efficiency of enzymatic hydrolysis was evaluated. It was found that after combined pretreatment process, due to the removal of hemicellulose and lignin, the content of cellulose in pretreated biomass increased to a large extent, reaching almost 90% d.m. and 95% d.m., in the case of JAS and OS, respectively. The enzymatic hydrolysis of solids remaining after pretreatment resulted in the formation of up to 45 g/L of glucose, for both JAS and OS. The highest glucose yield was achieved after pretreatment with 5% nitric acid followed by NaOH, and 90.6% and 97.6% of efficiency were obtained, respectively for JAS and OS.

1. Introduction

Biomass is one of the most abundant carbon sources on the Earth, and the most often used raw material for bioenergy production, as it is highly available and renewable. The use of lignocellulosic biomass, which includes energy crops, perennial grasses, agro-residues, and residues from the forest industry, has gained worldwide attention in recent years, as it is cheap, available and does not compete with the food industry [1]. A wide range of biofuels and value-added chemicals can be obtained from this kind of biomass including bioethanol [2,3], biogas [4,5], hydrogen [6,7], butanol [8,9], as well as succinic acid [10], furfural [11] and 3-hydroxypropionic acid [12]. Lignocellulosic materials, however, have a complex structure consisting of cellulose, hemicellulose and lignin, and for that reason they are very recalcitrant and resist enzymatic attack. To overcome this problem, different pretreatment methods are applied in order to enhance the enzymatic digestibility by increasing the surface area and porosity of cellulose as well as by releasing carbohydrates from the lignin matrix [13].
Many pretreatment methods have been developed, including mechanical (comminution, ultrasounds, microwaves), chemical (acids, alkalis, ozone, solvents), physicochemical (steam explosion, liquid hot water), and biological (bacteria, fungi) [14,15]. The application of dilute acid is one of the most preferred ways of biomass pretreatment as it is low cost and efficient in hemicellulose removal. Typically, sulfuric acid is involved, but also another inorganic (nitric, phosphoric, hydrochloric) and organic (maleic, oxalic, fumaric) acids were applied, but in a lesser extent. In general, acid pretreatment cleaves glucosidic bonds of polysaccharides leading to the formation of oligo- and monomers with less impact on lignin removal and is usually carried out at concentration up to 5% (w/w), temperature ranging from 120 °C and 210 °C for a few minutes to two hours. The main drawback of acid methods is the formation of inhibitory compounds that affect enzymatic hydrolysis and fermentation process [16,17]. Alkaline pretreatment, in turn, is used to remove lignin from biomass, which results in increasing the of reactivity of cellulose and hemicellulose. In this method, the degradation of ester and glucosidic bonds occur, along with the removal of acetyl and uronic acid substitution from hemicellulose. Pretreatment with the use of alkali leads to the formation of fewer inhibitors as compared to acid treatment methods [13,18,19]. However, using single pretreatment process, it is often difficult to achieve the appropriate biomass decomposition, hence the above-mentioned methods are combined to increase the yield of the process [14,15]. There are several reports on the application of two-stage pretreatment with the use of alkaline and acidic reagents on various lignocellulosic biomass. The most common approach is the use of H2SO4 and NaOH at various concentration and reaction time. Li et al. [20] proved that when using sulfuric acid (0.5–2.0%) and latter sodium hydroxide (0.5–2.0%), the saccharification yield was significantly higher when compared with the single-stage pretreatment of sweet sorghum fibre. Kim et al. [21] obtained 84 g/L of glucose after enzymatic hydrolysis of acid/alkali-treated empty palm fruit bunch fibre while after enzymatic hydrolysis of non-treated biomass resulted in 28 g/L of glucose. Almost all literature report that combined effect of acid and alkaline treatment significantly improve enzymatic digestibility, however Guilherme et al. [22], when testing different pretreatment approaches (combined acid and alkaline, combined hydrothermal and alkaline, alkaline, and peroxide pretreatment), obtained the highest glucose and xylose yield after alkaline treatment alone.
Among lignocellulosic biomass, agricultural residues and energy crops are considered as the most important and promising raw materials for bioenergy production. So far, most attention has been paid to the use of such agro-residues as corn stover [23], wheat straw [5] and rice straw [7], and such dedicated energy crops as Miscanthus [24], reeds [25] and switchgrass [9]. Much less attention has been paid to the use of Jerusalem artichoke stems (JAS) or oat straw (OS). Oat (Avena sativa L.) is one of the major crops produced in the EU after wheat, maize and barley. Oat grains are rich in unsaturated fatty acids, crude protein, β-glucan and B-group vitamins. Moreover, oat is almost gluten-free, which makes it suitable for people with the coeliac disease [26]. The production of oat in the EU reached more than 11 million tonnes, which is more than one-third of world production [27]. It is estimated that straw-to-grain ratio, in the case of oat, is 1.1:1, which gives a large quantity of straw to be used to the utmost extent [28]. Some part of oat straw is used for livestock bedding and feed because of its high nutritional value, as compost for mushrooms or as a cover for vegetables during winter storage, however, most of the farmers still burn the remaining straw or plough it directly on the field [29,30].
Jerusalem artichoke (Helianthus tuberosus L.) is considered to be the energy crop and gains continuous attention recently. Its cultivation is low cost while high yields of biomass are obtained, it can tolerate a wide range of climate conditions (including drought, frost), it can grow on margin soil where other food crops cannot grow and is resistant to most of diseases and pests [31,32]. Mostly, Jerusalem artichoke is cultivated for their rich in inulin tubers, which can be further processed to fructose, oligofructose and fructooligosaccharides. Inulin is also categorized as a prebiotic [33]. Much attention has also been put into the conversion of tuber inulin into biofuels, including ethanol [34] and butanol [35], while the usage of JAS as a substrate for second-generation bioethanol production is still being examined by researchers [36,37,38].
In this study, JAS and OS were used, as a raw material with great potential, to evaluate the effect of two-stage acid-alkali and alkali-acid pretreatment with use of sulfuric acid/ or nitric acid, and sodium hydroxide, in comparison with the single-stage pretreatment. Our previous research [39], showed that nitric acid is very effective in the pretreatment of JAS, thus we wanted to evaluate if its combination with second alkaline pretreatment would further improve the efficiency of enzymatic hydrolysis step. Additionally, the most commonly used acid, H2SO4 along with NaOH was applied to pretreatment as a reference. To the best knowledge of the authors, this is the first report concerning the use of nitric acid during two-stage pretreatment of lignocellulosic biomass.

2. Materials and Methods

2.1. Raw Materials

OS was obtained from a local farm in Lodz voivodship in Central Poland. JAS was obtained from organic ’Zen-szen’ breeding plant (Kalinówka, Poland). Both raw materials were air-dried and chopped into approx. 0.5 mm particles.

2.2. Pretreatment Conditions

Pretreatments were conducted with the use of three chemicals, namely sulfuric acid (H2SO4, further referred to as SA), nitric acid (HNO3, NA) and sodium hydroxide (NaOH, SH). The milled OS and JAS were subjected to two-stage pretreatment processes in two configurations: first acid then alkali pretreatment, and first alkali then acid pretreatment. In both configurations, in the first stage biomass was mixed with 2% or 5% (w/v) acid (SA or NA) or alkali (SH) at 10% solids loading (30 g of raw material was mixed with the appropriate reagent to reach the final volume of 300 mL), and heated in an autoclave at 121 °C for 1 h. Afterwards, biomass was collected by filtration and washed with distilled water until the neutral pH of resulting filtrate was obtained. The liquid fraction was collected to high performance liquid chromatography (HPLC) analysis, while the solid fraction was subjected to the second stage of pretreatment, under the same reaction conditions. Samples were once again filtered, the liquid fraction after the second stage was taken to HPLC analysis, and solid (after washing) were subjected to enzymatic hydrolysis. Moreover, samples of solids after both stages of pretreatment were collected for compositional analysis.

2.3. Enzymatic Hydrolysis

Enzymatic hydrolysis of pretreated samples was conducted at 5% solids loading in 0.05 M citric buffer (pH 4.8). The applied enzyme was Cellic CTec2 (Novozymes A/S, Basgsværd, Denmark) in dose of 10 FPU/g cellulose (based on cellulose content in pretreated biomass), and the mixture of antibiotics (penicillin 50 U/mL and streptomycin 50 µg/mL, both from Sigma Aldrich, St. Louis, MO, USA) was added to prevent bacterial contamination. Enzymatic hydrolysis was carried at 50 °C for 72 h, and then the liquid hydrolysates were analyzed by HPLC.

2.4. Analytical Methods

The composition of raw and pretreated biomass, including cellulose, hemicellulose, acid insoluble lignin (AIL) and acid-soluble lignin (ASL) was determined according to National Renewable Energy Laboratory (NREL) standard protocols and expressed in percent of dry matter (% d.m.) [40]. The concentration of sugars (celobiose, glucose, xylose, arabinose) and inhibitors (formic acid, acetic acid, hydroxymethylfurfural /HMF/, furfural) was determined by high-performance liquid chromatography as described previously [39]. The glucose yield (GY) was calculated based on glucose concentration (g/L) in hydrolysate and initial cellulose content (g/L) in pretreated biomass. The anhydro correction factor (0.9) was included to convert the mass of glucose to cellulose. Solids recovery was calculated based on the dry weight of the sample subjected to pretreatment and the ones collected after pretreatment.

2.5. Statistical Analysis

All experiments were performed in triplicate, and results are expressed as mean ± standard deviation. Statistical analysis was done with the use of Statistica Software (ver. 10.0, Tibco Software, Palo Alto, CA, USA) by two-way ANOVA followed by Tukey’s post-hoc test (p < 0.05). When the composition of raw JAS and OS was compared, one-way ANOVA was used.

3. Results and Discussion

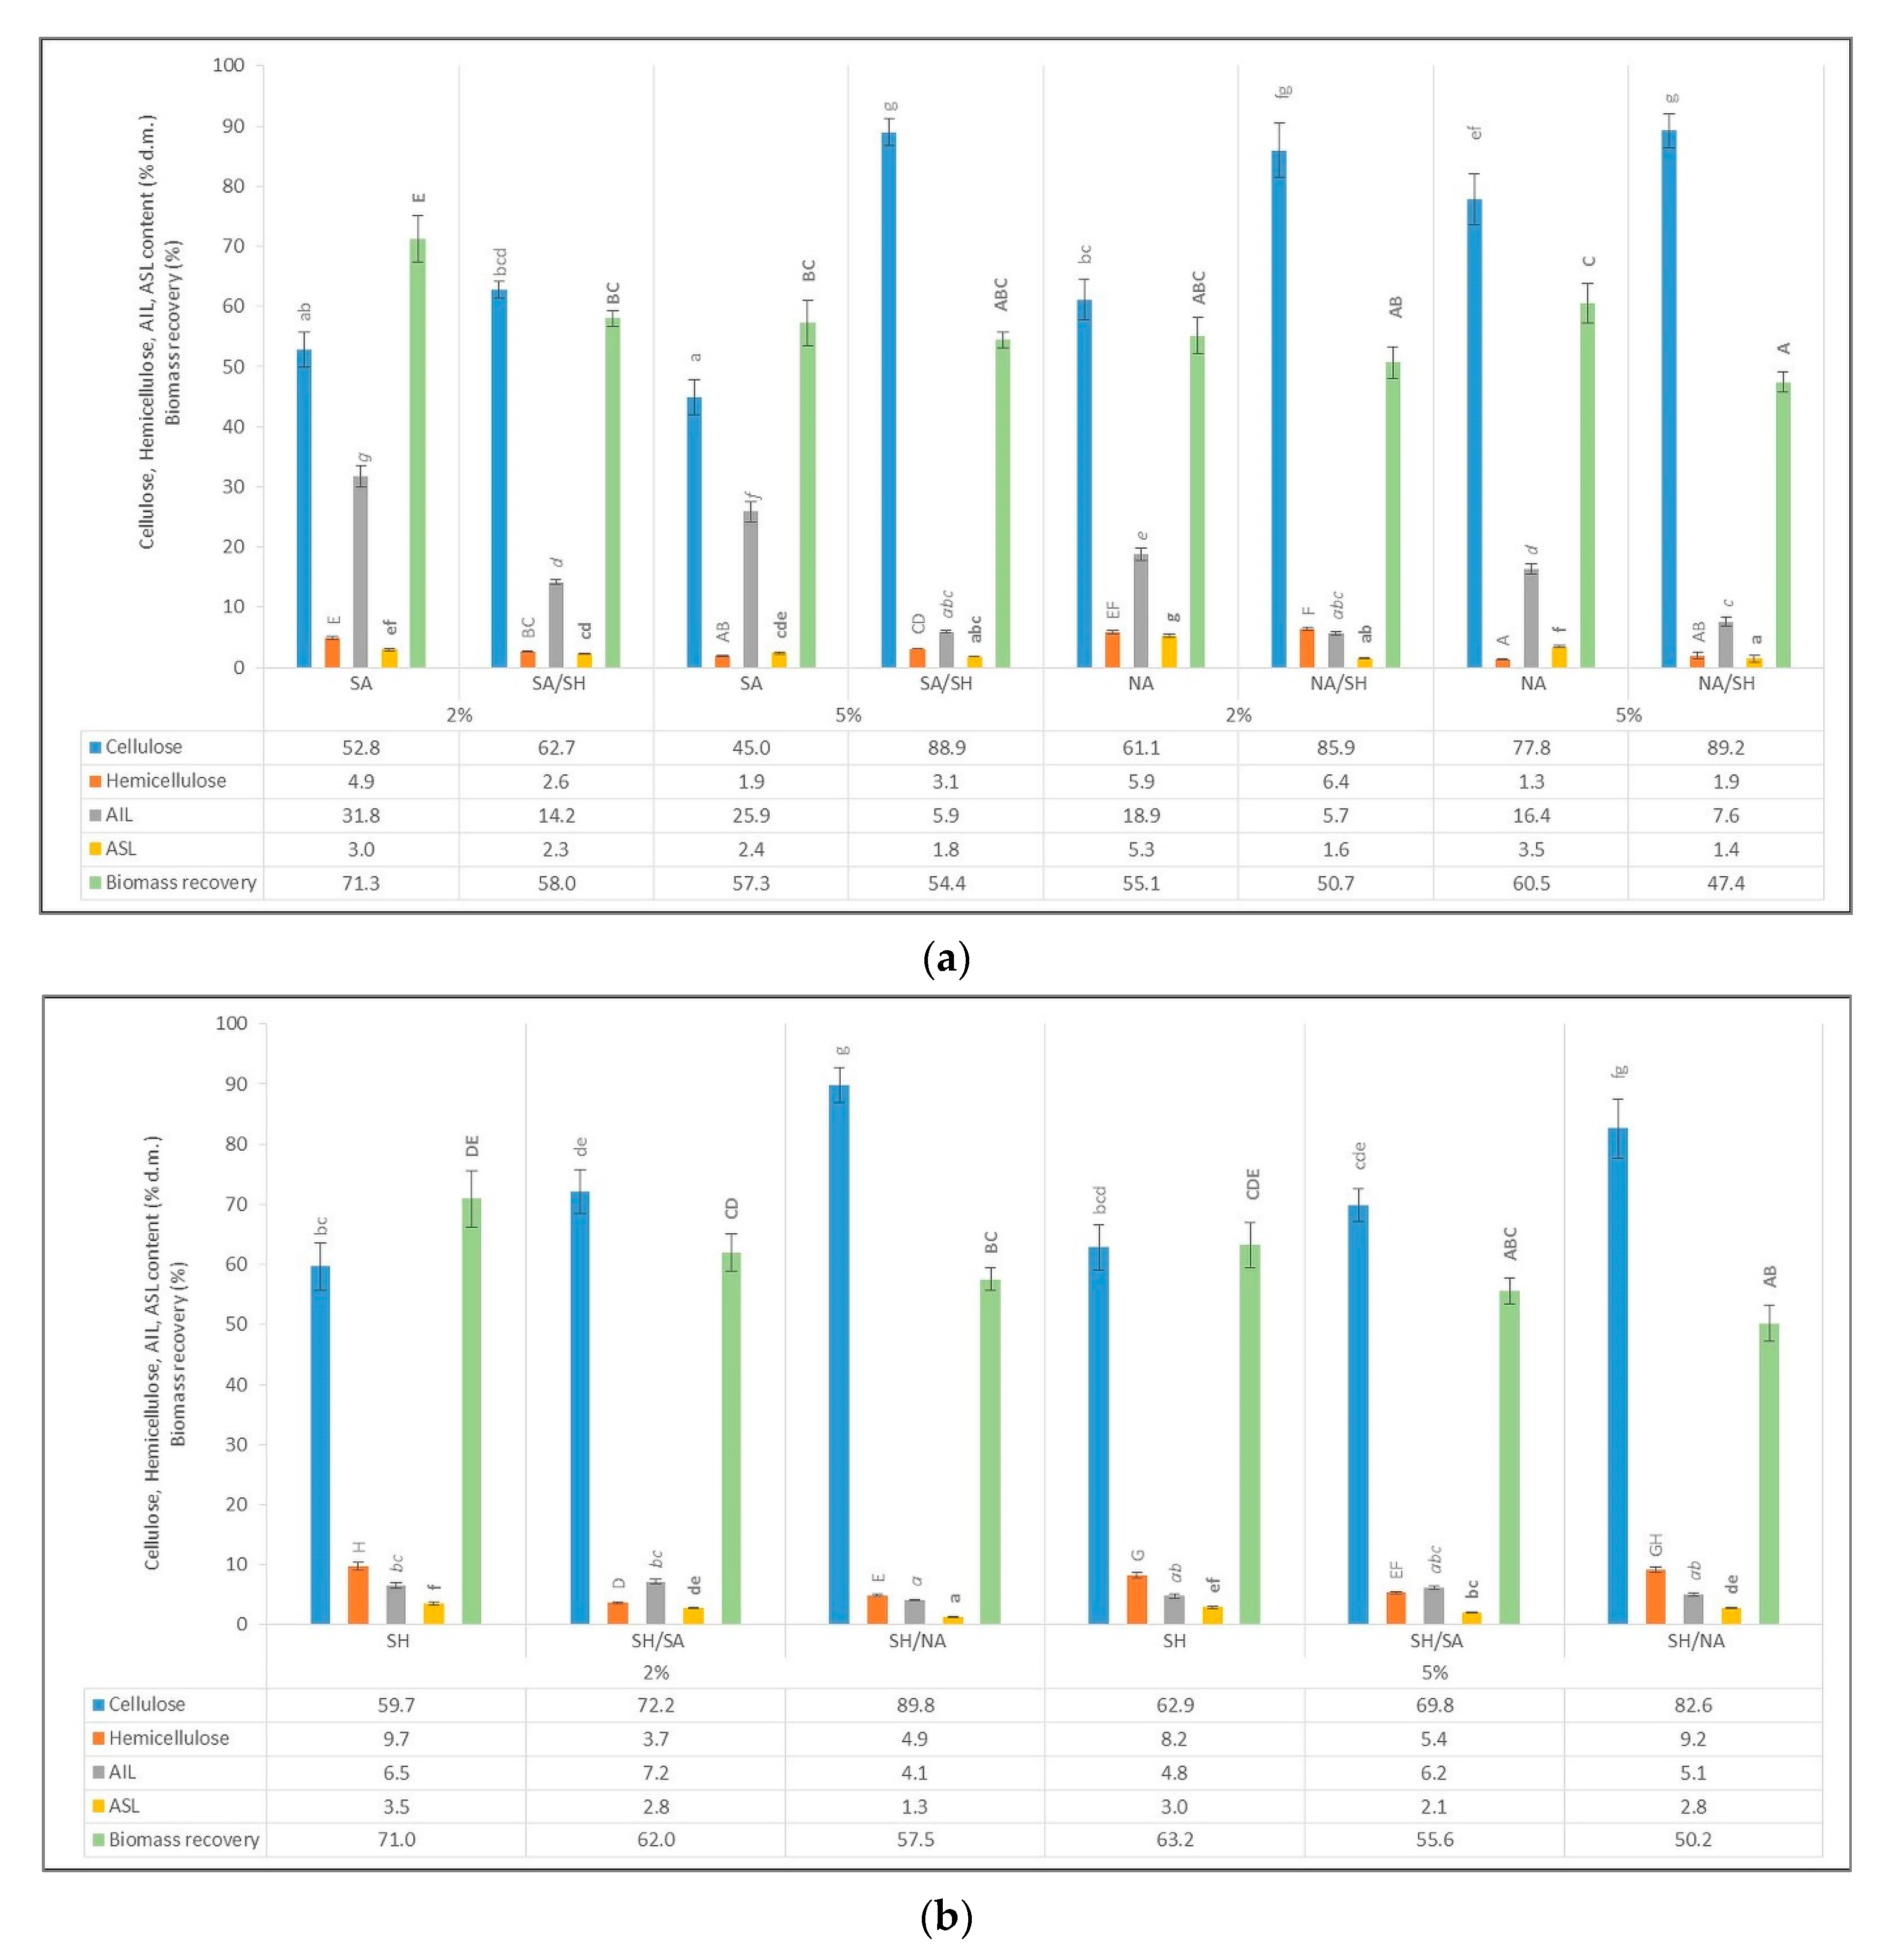
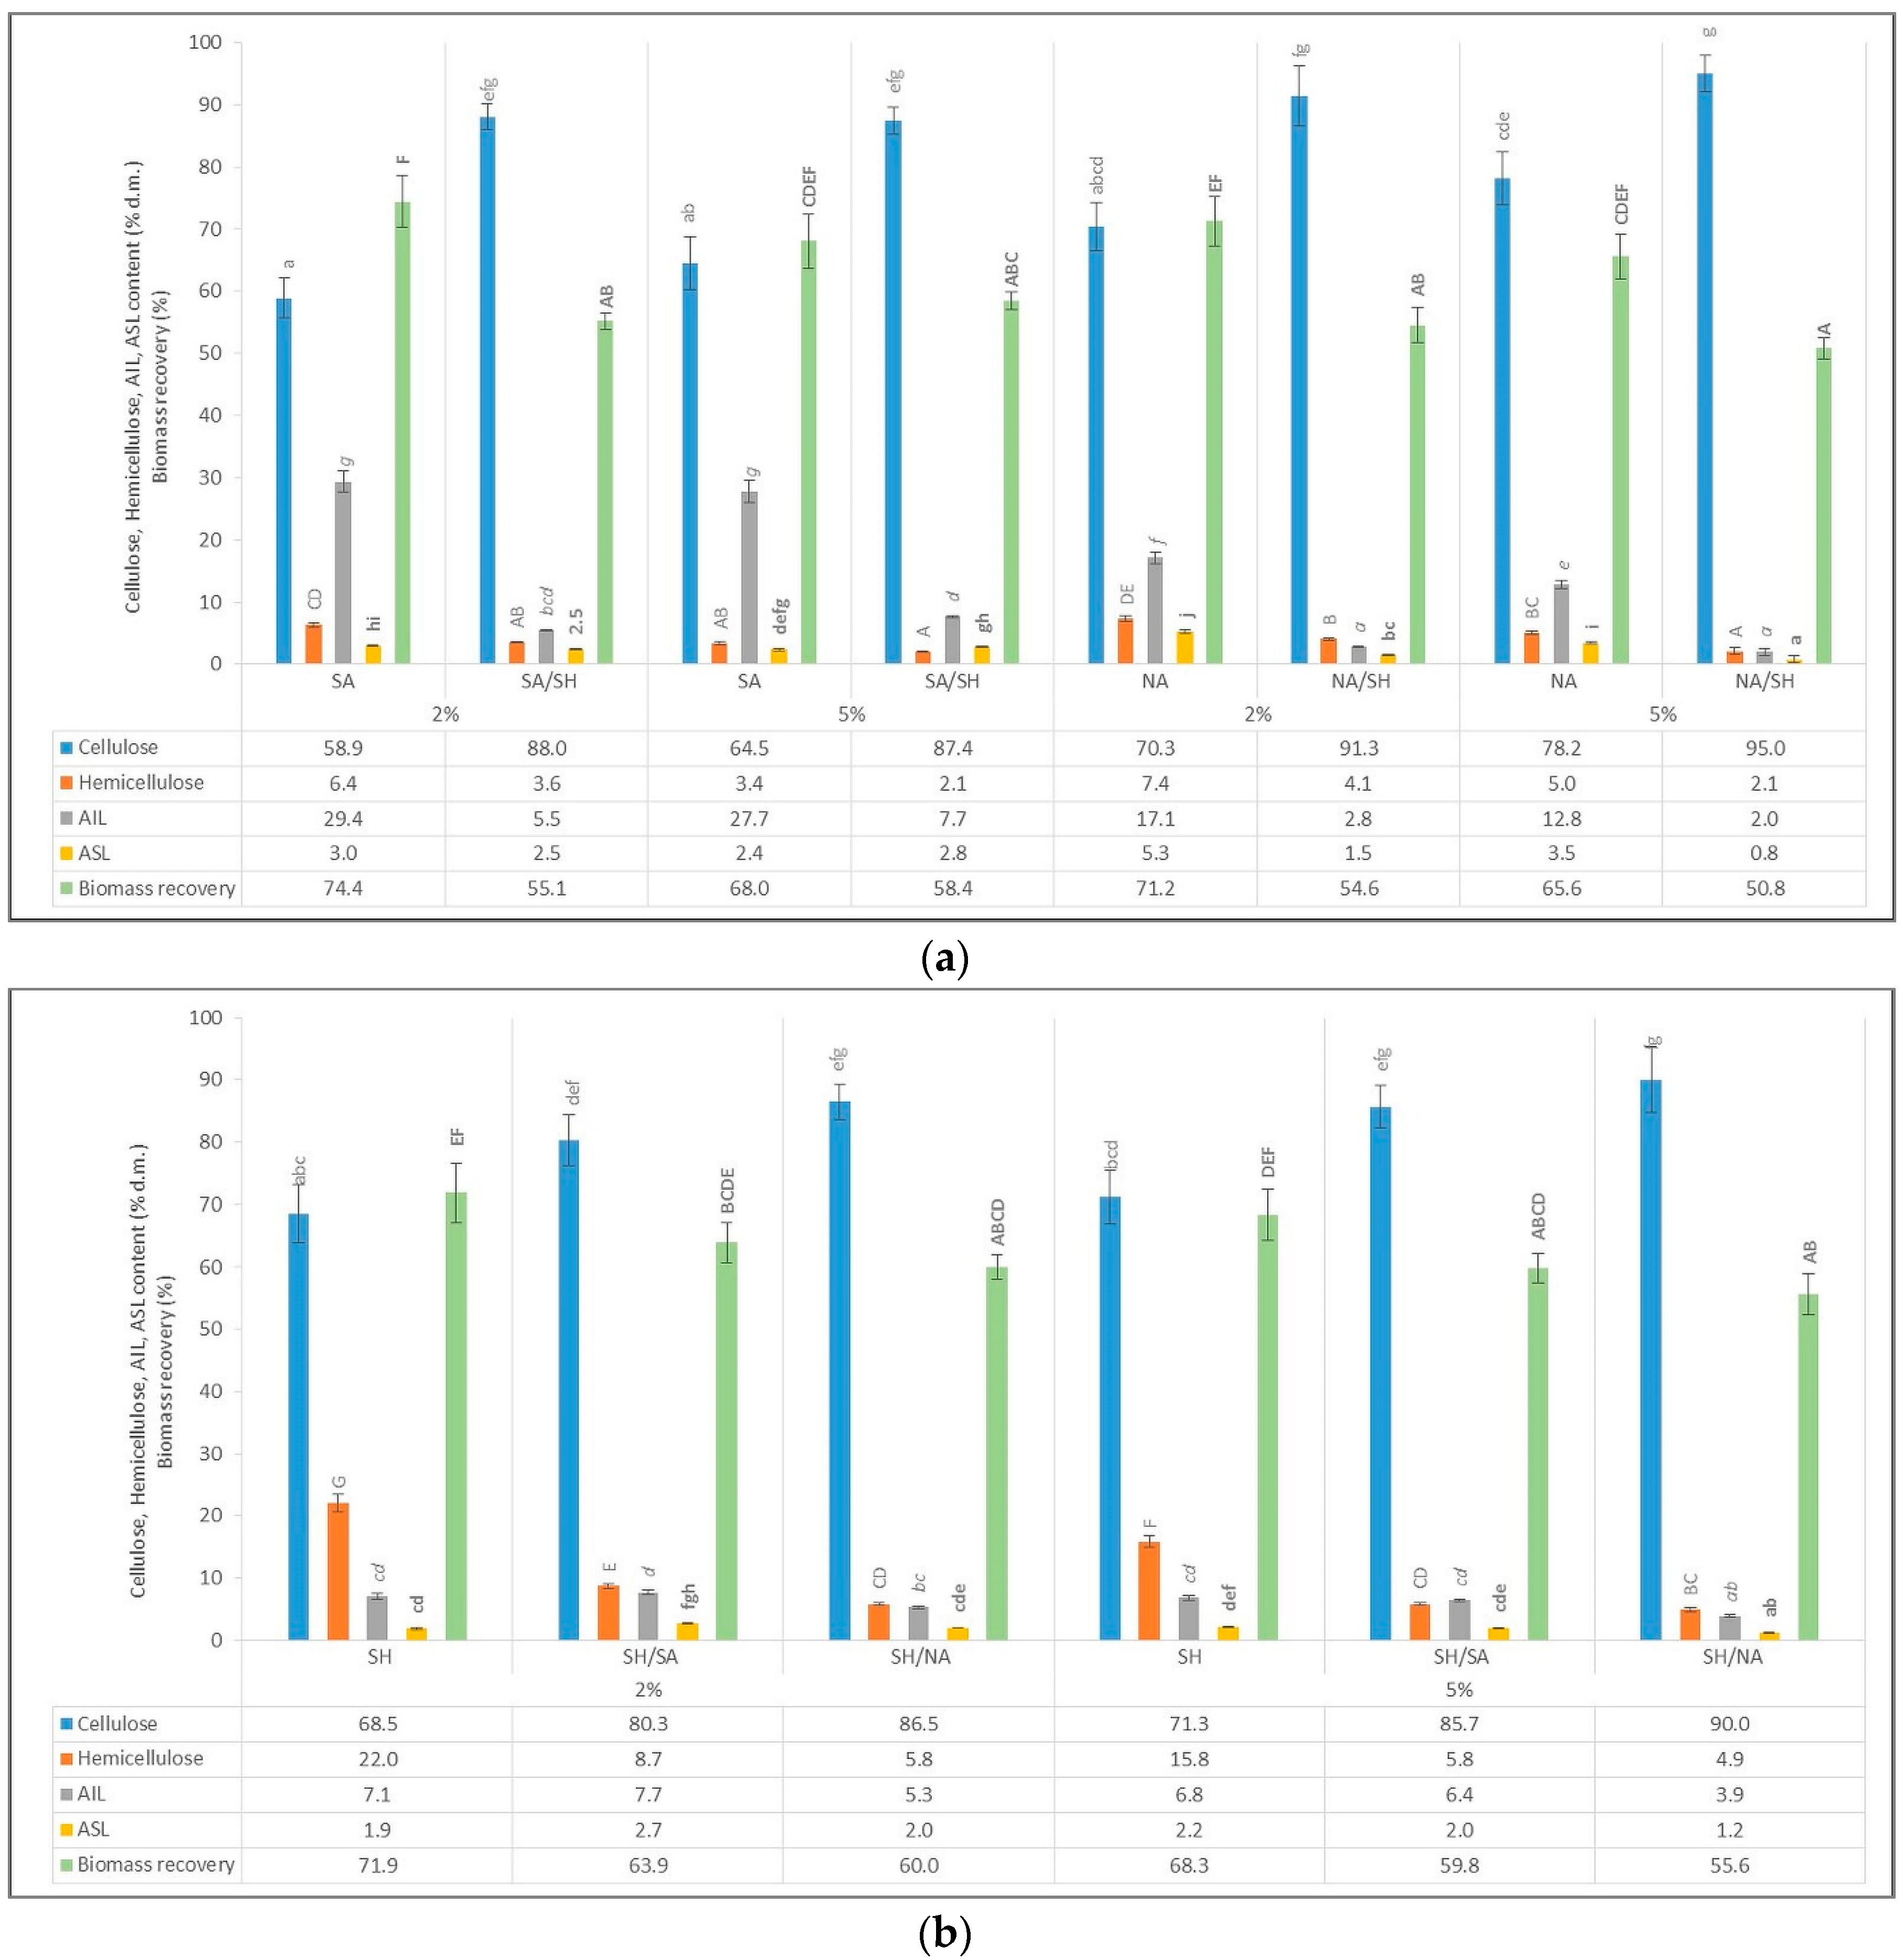
3.1. Compositional Analysis of Raw and Pretreated Biomass

Chemical composition of raw materials tested in this study is given in Table 1. Both materials were analyzed for cellulose, hemicellulose, AIL and ASL, as these are the major components. As can be seen, the biomass of OS has a significantly higher content of almost all analyzed component except ASL. The polysaccharide fraction (cellulose and hemicellulose) of JAS constitutes 42.6% of its dry biomass, which makes JAS a good candidate for being used as a source of sugars in subsequent processes (e.g., fermentation). However, the sum of lignin (ASL and AIL) is at a high level (26.0%), what can be problematic, because high lignin content in biomass hinders enzymatic hydrolysis by increasing its recalcitrance on enzymatic attack [13]. The total amount of lignin in OS is at the similar level as in JAS, however a difference in the proportion between AIL and ASL occurs—a higher amount of AIL and lower ASL can be observed (p < 0.05). OS has also higher content of structural polysaccharides—38.3% of cellulose and 22.4% of hemicellulose. The chemical composition of tested raw materials falls within the broad range reported in the literature. Khatun et al. [36] reported that JAS consists of 39.4% cellulose, 14.9% hemicellulose and 18.1% lignin, while biomass analyzed by Negro et al. [41] contained 18.9% cellulose, 6.5% hemicellulose and 14.6% lignin. In the case of OS, smaller differences were observed between the presented data, especially when cellulose (29.9–37.1% d.m.) and hemicellulose (23.3–30.1% d.m.) are taken into consideration. However, the content of lignin varies greatly among different studies—reported data are from 5% d.m. to 21.3% d.m. [42,43].
One of the most important factors indicating the effectiveness of the applied pretreatment method on biomass is its chemical composition after the process. JAS and OS biomass were subjected to two-stage pretreatment with the use of acid in the first stage and alkali in second, or with use of alkali in the first stage and acid in the second. Pretreatment was conducted at 121 °C for 1 h, and the chemicals used were sulfuric and nitric acid (as acidic reagents), and sodium hydroxide (as alkaline reagent), at a concentration of 2% or 5% (w/v). After each pretreatment process, biomass was analyzed in terms of its cellulose, hemicellulose and lignin content (ASL and AIL), as well as the percentage of biomass recovery, was calculated. Moreover, the composition of biomass after each step of pretreatment was evaluated. The results are presented in Figure 1 and Figure 2. After single pretreatment process of JAS, both acid and alkali, the cellulose content increased to 45.0–77.8% d.m. depending on the reagent used, with the highest amount noted when nitric acid was used, and the lowest for sulfuric acid. This is due to the removal of other biomass components during pretreatment. When only acid pretreatment was applied, the content of hemicelluloses decreased to 4.9–5.9% d.m. at 2% acid, and to 1.3–1.9% d.m. at 5% acid concentration. However, the lignin content was high, especially when sulfuric acid was used (ASL up to 31.8% d.m.). The alkaline treatment led to greater lignin removal than acid treatment (p < 0.05)—after single pretreatment step with 5% NaOH, only 3.0% d.m. of ASL and 4.8% d.m. of AIL was present. This is due to the fact that dilute alkali treatment causes swelling of biomass, increases its porosity and disrupt lignin structure by cleaving ester bond cross-linking lignin and xylan [1]. The recovery of biomass was higher after alkaline treatment as compared with acid; however, high biomass yield was also obtained when 2% sulfuric acid was used (p > 0.05). Considering the effect of single-stage acid pretreatment on OS, it can be seen that hemicelluloses removal was most effective when sulfuric acid was used at both examined concentration (i.e., 2% and 5% w/v) (p < 0.05). The cellulose content reached 78.2% d.m., and a similar tendency was observed as in the case of JAS—the content of cellulose in biomass pretreated with different reagents increased in order H2SO4 < NaOH < HNO3. The amount of ASL and AIL was similar as in JAS, was the lowest in NaOH-treated biomass; however, AIL was found to be highest in H2SO4-treated biomass while AIL in HNO3-treated biomass. The statistical analysis showed that the recovery of solid after pretreatment was at the same level (p > 0.05) regardless of the reagent used as well as its concentration.
To further increase the accessibility of cellulose fraction for enzymes, the second step of pretreatment was performed. To do so, biomass obtained after each acid (sulfuric and nitric) and alkali pretreatment was subjected to analogous pretreatment with the opposite reagent, and the resulting biomass was analyzed. After the second stage of pretreatment, the significant increase (p < 0.05) in cellulose content was observed for all tested configuration, including the type of raw material, type of reagent and its concentration, as well as the order of pretreatments (i.e., acid-alkali or alkali-acid) as compared to analogous single-stage pretreatment. The cellulose content was found to be in the range 62.7–89.8% d.m. in biomass of JAS, and 80.3–95.0% d.m. in biomass of OS. When acid pretreatment was followed by alkaline, the amount of AIL decreased significantly (p < 0.05) in both tested raw materials, with the highest drop for JAS at 5% SA/SH configuration, and for OS at 2% NA/SH (decrease by 77% and 84%, respectively). In case of both, JAS and OS, there was no significant difference in the cellulose content in biomass pretreated with acid-alkali and alkali-acid configuration (p > 0.05) when using the same acidic reagent. The content of hemicellulose was also significantly lower after two-stage pretreatment than single-stage. In the acid-alkali configuration, lower hemicellulose content was observed when a higher concentration of acids was used (p < 0.05), but among the same concentration, there was no difference if sulfuric or nitric acid was applied (p > 0.05). On the other hand, in alkali-acid configuration both, the type and concentration of the reagent seemed to have an impact on hemicellulose removal. The percentage of biomass recovery after the second stage of pretreatment decreased significantly (p < 0.05). While the recovery of solid after single-stage pretreatment was in range of 55.1–71.3% for JAS and 68.0–74.4% for OS, the application of two-stage pretreatment resulted in the percentage of biomass recovery between 47.4–62.0% for JAS and 50.8–63.9% for OS, with the lowest value obtained when nitric acid and sodium hydroxide were used sequentially at concentration of 5% (w/v) (47.4% for JAS and 50.8% for OS).
The effect of two-stage pretreatment on changes in the composition of a different kind of biomass was investigated by several authors. Romani et al. [43] examined the effect of combined action of hydrothermal and lime pretreatments on oat straw with use of different severity parameters of autohydrolysis and constant parameters of lime pretreatment (0.4 g/g, 121 °C, 1 h). The authors obtained the biomass composed of 55.8–70.0% of glucan, 1.9–9.6% of xylan and 18.6–23.9% of Klason lignin, with a solid yield of 57.0–85.0%, depending on the severity of hydrothermal pretreatment. Li et al. [20], used sweet sorghum bagasse as a raw material to assess the effect of two-stage pretreatment with 0.25–1% H2SO4 and NaOH at two configurations: acid-alkali and alkali-acid pretreatment. They obtained, under best conditions (1% concentration of both reagents), the biomass with a cellulose content of 55.3% and 59.1% for acid-alkali and alkali-acid, respectively, with the solid recovery of 35.2–41.1%. Additionally, Kim et al. [44], applied two-stage acid-alkali pretreatment on JAS biomass. The conditions used in pretreatment were as follows: 0.5% H2SO4/1 M NaOH, 121 °C for 1 h, an afterwards they obtained biomass with 58.6% cellulose, 8.5% hemicellulose and 8.3% lignin (biomass recovery 55.1%).

3.2. The Effect of Pretreatments on the Composition of the Liquid Fraction

After each stage of pretreatment, besides the compositional analysis of solid fraction, the analysis of liquid fraction was also performed. The aim of this assay was to evaluate the effect of each kind of pretreatment on the release of di- and monosaccharides from biomass as well as on the formation of inhibitory compounds. The liquids collected after single- and two-stage pretreatment processes were analyzed by HPLC method and the concentration of glucose, xylose, arabinose, cellobiose, formic acid, acetic acid, furfural and HMF was measured. The results are given in Table 2 and Table 3.
Taking into consideration JAS biomass, in the liquid fraction obtained after single-stage pretreatment, glucose and cellobiose were detected in concentrations of 2.00–6.28 g/L and 0.54–2.08 g/L, respectively (Table 2). Higher concentrations were found in acid-treated samples than in alkaline-treated, which is related to partial degradation of cellulose under acidic conditions [45]. Additionally, the concentration of xylose in acid-treated samples was significant. The detected xylose concentration ranged between 6.46 and 13.58 g/L, with higher amounts found in liquids after 2% acid than 5% (p < 0.05). This is probably caused by further degradation of xylose to furfural, which occurs in an acidic environment at elevated temperature [19] and indeed, the concentration of furfural is higher (p < 0.05) in samples treated with 5% acids than 2% (both sulfuric and nitric). The HMF was detected only in acid-treated samples (0.02–2.12 g/L). Contrary to the above-mentioned compounds, the concentration of formic and acetic acid was higher in alkali-treated samples. In samples obtained after acid treatment 0.25–1.09 g/L of formic acid and 1.78–2.37 g/L of acetic acid was detected, while in samples after single NaOH treatment, this concentration was 2.75–3.69 g/L and 3.91–4.08 g/L, respectively. Formic acid in alkaline liquids is a result of peeling reactions and endwise degradation of polysaccharides, while acetic acid is formed by saponification of acetyl groups in hemicellulose [19].
When two-stage pretreatment was applied, the liquid fraction after the second pretreatment contained significantly fewer sugars than were found after the single process. The only exception is xylose in the case of alkaline pretreatment. In liquid after single SH treatment, the xylose concentration was low (up to 0.94 g/L—5% SH), while the second stage of the process resulted in the formation of 1.98–2.60 g/L of xylose as a result of hemicellulose hydrolysis. Considering the number of inhibitors, it can be seen that when 2% acid (both SA and NA) was applied, the concentration of formic acid increased after the second stage of pretreatment, which was not observed at 5% concentration of those acids. Additionally, in samples treated only with SA, no furan aldehydes were detected, and the second stage of pretreatment resulted in its formation in concentration up to 0.05 g/L.
The liquid fraction after single-stage acid pretreatment of OS, just as it was observed in case of JAS, contained a higher amount of sugars than alkaline. The use of NA in a single process led to the release of a very high amount of glucose and xylose, i.e., 5.92–11.04 g/L and 18.20–20.98 g/L, respectively (Table 3). These concentrations are significantly higher (p < 0.05) than the one obtained after SA treatment (3.32–3.43 g/L of glucose and 7.34–8.60 g/L of xylose). As regard to formic and acetic acids, there was no strict dependence between the type of reagent used and their concentration, as in the case of JAS. The liquid after second stage pretreatment contained a lesser concentration of cellobiose and arabinose than corresponding liquids after the first stage. When acid-alkali configuration was applied, after the second stage lower concentrations of glucose, xylose and furan aldehydes were detected, and a higher concentration of formic acid, while in alkali-acid configuration the reverse tendency was observed.

3.3. The Effect of Two-Stage Pretreatment on Enzymatic Hydrolysis

The process of pretreatment is applied in order to increase the susceptibility of lignocellulosic biomass to enzymatic hydrolysis by degrading its structure, which makes native biomass recalcitrant [19]. It is accomplished mostly by solubilization of lignin and/or hemicellulose with use of different reagent. To fully assess the effect of applied pretreatment, it is necessary to perform enzymatic hydrolysis of the obtained biomass and evaluate the amount of released sugars, as well as the process efficiency. Therefore, the biomass pretreated with 2% or 5% (w/v) sulfuric or nitric acid and sodium hydroxide, in both configurations i.e., acid-alkali and alkali-acid, was subjected to enzymatic hydrolysis for 72 h. After this time, the obtained hydrolysates were analyzed by HPLC to measure the monosaccharides (glucose, xylose, arabinose) and cellobiose content. Based on the glucose concentration after hydrolysis, and the available cellulose in the pretreated biomass (g/L), the yield of hydrolysis was calculated.
The concentration of glucose in two-stage pretreated JAS was in the range from 18.60 g/L to 45.30 g/L depending on the configuration used (Table 4). Higher glucose concentration was found in samples pretreated with 5% reagent concentration than in those where 2% acid or alkali was used. Additionally, except for hydrolysates pretreated with 2% NA and SH, there were no significant differences (p > 0.05) in glucose content in acid-alkali and alkali-acid sequence. When nitric acid and sodium hydroxide were applied at 2% concentration, in alkali-acid configuration the concentration of released glucose was 35% lower compared to acid-alkali. Taking into consideration the efficiency of enzymatic hydrolysis (expressed as glucose yield), strict correlation can be noticed. When 2% reagent was applied, the higher yield was obtained in acid-alkali configuration, while using 5% concentration of reagents, the higher yield was noted for alkali-acid sequence. Among all tested methods, the highest yield was obtained with the use of NA and SH reaching 91.5% and 97.6%, respectively for acid-alkali and alkali-acid. Arabinose was detected only in hydrolysate obtained after 5% SH/NA pretreatment (0.18 g/L), and the concentration of cellobiose was low (0.02–0.53 g/L), that indicates the high activity of β-glucosidase in used enzymatic preparation. The xylose concentration was found higher in samples pretreated with 2% concentration of reagents than in 5%, as well as was higher in alkali-acid than acid-alkali configuration. This can be related to higher hemicellulose content in biomass after alkali-acid sequence than in corresponding acid-alkali-treated samples (Figure 1). In our previous work [39], we obtained 89% efficiency of single-stage pretreatment of JAS with 5% NA.
The composition of hydrolysates based on OS after various two-stage pretreatment methods is given in Table 5. As it was in case of JAS, no arabinose was detected in samples, while cellobiose concentration was higher but still below 1 g/L. Similarly to JAS, more xylose was found in alkali-acid configuration than in acid-alkali as well as in samples pretreated with 2% reagent than with 5% reagent concentration. The amount of glucose was in a range from 33.09 g/L to 45.28 g/L, with higher concentrations detected when nitric acid was employed as an acidic reagent. The order of pretreatments (acid-alkali or alkali-acid) had no significant effect (p > 0.05) on the concentration of glucose when compared to analogous samples (same reagent and concentration). When comparing the glucose yield, higher values were obtained in hydrolysates pretreated with 5% reagents than with 2%, it applies to the type of acid and configuration used. Additionally, the type of acidic reagent had an impact on GY. When sulfuric acid was used, the yield of hydrolysis was in the range of 67.6–86.3%, while nitric acid resulted in 77.5–90.6% efficiency.
Li et al. [20] after the hydrolysis of sweet sorghum bagasse pretreated with a combination of sulfuric acid and sodium hydroxide, obtained 7.5 g/L and 8.7 g/L of glucose when the mildest conditions, i.e., 0.25% acid and 0.25% alkali were used, respectively for acid-alkali and alkali-acid configuration. When the concentration of H2SO4 and NaOH was increased to 1%, the concentration of released glucose reached 35.5 g/L and 36.9 g/L what corresponds to 86.7% and 83.2% of cellulose conversion for acid-alkali and alkali-acid sequence, respectively. The biomass of JAS was also subjected to two-stage pretreatment with the use of 0.5% H2SO4 followed by 1M NaOH [44]. Authors obtained maximum glucose concentration of 57.5 g/L with glucose yield of 88%; however, high enzyme dose (80 FPU/g biomass) needed to be applied to achieve this result. Wang et al. [46] obtained 92.3% glucose yield from corn stover pretreated with a two-stage process (1% H2SO4/10% NaOH), which was significantly higher than when single acid or alkaline pretreatment was applied, respectively 45.6% and 78.3%.

4. Conclusions

The application of two-stage pretreatment was found to have a significant impact on lignocellulosic biomass. Because of the removal of hemicelluloses as well as delignification, the content of cellulose in pretreated biomass increased to a large extent; however, the biomass recovery was relatively low. In the liquid fraction obtained after second stage pretreatment, the concentration of inhibitors was at a low level, which could indicate their successful removal from biomass during washing. The enzymatic hydrolysis resulted in the highest glucose yield (97.6% and 90.6% for JAS and OS, respectively) when biomass was previously treated with 5% nitric acid and sodium hydroxide in the alkali-acid configuration.

Author Contributions

Conceptualization, U.D.-K., J.B. and P.D.; Formal analysis, U.D.-K. and K.P.-P.; Funding acquisition, J.B. and P.D.; Investigation, U.D.-K., P.P. and K.R.; Methodology, U.D.-K. and P.P.; Project administration, J.B. and P.D.; Resources, U.D.-K., J.B. and P.D.; Supervision, J.B.; Validation, U.D.-K. and K.R.; Visualization, M.B.; Writing—original draft, U.D.-K. and K.P.-P.; Writing—review & editing, U.D.-K. and M.B.

Funding

This research was partially funded by the Polish National Center for Research and Development under grant number BIOSTRATEG2/296369/5/NCBR/2016.

Conflicts of Interest

The authors declare no conflicts of interest.

References

  1. Mood, S.H.; Golfeshan, A.H.; Tabatabaei, M.; Jouzani, G.S.; Najafi, G.H.; Gholami, M.; Ardjmand, M. Lignocellulosic biomass to bioethanol, a comprehensive review with a focus on pretreatment. Renew. Sust. Energy Rev. 2013, 27, 77–93. [Google Scholar] [CrossRef]
  2. Sahu, S.; Pramanik, K. Evaluation and optimization of organic acid pretreatment of cotton gin waste for enzymatic hydrolysis and bioethanol production. Appl. Biochem. Biotechnol. 2018, 186, 1047–1060. [Google Scholar] [CrossRef] [PubMed]
  3. Sritrakul, N.; Nitisinprasert, S.; Keawsompong, S. Evaluation of dilute acid pretreatment for bioethanol fermentation from sugarcane bagasse pith. Agric. Nat. Resour. 2017, 51, 512–519. [Google Scholar] [CrossRef]
  4. Domański, J.; Marchut-Mikołajczyk, O.; Polewczyk, A.; Januszewicz, B. Ozonolysis of straw from Secale cereale L. for anaerobic digestion. Bioresour. Technol. 2017, 245, 394–400. [Google Scholar] [CrossRef]
  5. Taherdanak, M.; Zilouei, H.; Karimi, K. The influence of dilute sulfuric acid pretreatment on biogas production form wheat plant. Int. J. Green Energy 2016, 13, 1129–1134. [Google Scholar] [CrossRef]
  6. Gonzales, R.R.; Kim, J.S.; Kim, S.H. Optimization of dilute acid and enzymatic hydrolysis for dark fermentative hydrogen production from the empty fruit bunch of oil palm. Int. J. Hydrog. Energy. 2018, 44, 2191–2202. [Google Scholar] [CrossRef]
  7. Dong, L.; Cao, G.; Zhao, L.; Liu, B.; Ren, N. Alkali/Urea pretreatment of rice straw at low temperature for enhanced biological hydrogen production. Bioresour. Technol. 2018, 267, 71–76. [Google Scholar] [CrossRef] [PubMed]
  8. Guan, W.; Xu, G.; Duan, J.; Shi, S. Acetone–Butanol–Ethanol production from fermentation of hot-water-extracted hemicellulose hydrolysate of pulping woods. Ind. Eng. Chem. Res. 2018, 57, 775–783. [Google Scholar] [CrossRef]
  9. Guan, W.; Shi, S.; Blersch, D. Effects of Tween 80 on fermentative butanol production from alkali-pretreated switchgrass. Biochem. Eng. J. 2018, 135, 61–70. [Google Scholar] [CrossRef]
  10. Kuglarz, M.; Alvarado-Morales, M.; Dąbkowska, K.; Angelidaki, I. Integrated production of cellulosic bioethanol and succinic acid from rapeseed straw after dilute-acid pretreatment. Bioresour. Technol. 2018, 265, 191–199. [Google Scholar] [CrossRef]
  11. Bizzi, C.A.; Santos, D.; Sieben, T.C.; Motta, G.V.; Mello, P.A.; Flores, E.M. Furfural production from lignocellulosic biomass by ultrasound-assisted acid hydrolysis. Ultrason. Sonochem. 2019, 51, 332–339. [Google Scholar] [CrossRef]
  12. Matsakas, L.; Hrůzová, K.; Rova, U.; Christakopoulos, P. Biological production of 3-hydroxypropionic acid: An update on the current status. Fermentation 2018, 4, 13. [Google Scholar] [CrossRef]
  13. Loow, Y.L.; Wu, T.Y.; Jahim, J.M.; Mohammad, A.W.; Teoh, W.H. Typical conversion of lignocellulosic biomass into reducing sugars using dilute acid hydrolysis and alkaline pretreatment. Cellulose 2016, 23, 1491–1520. [Google Scholar] [CrossRef]
  14. Chen, H.; Liu, J.; Chang, X.; Chen, D.; Xue, Y.; Liu, P.; Li, H.; Han, S. A review on the pretreatment of lignocellulose for high-value chemicals. Fuel Process. Technol. 2017, 160, 196–206. [Google Scholar] [CrossRef]
  15. Solarte-Toro, J.C.; Romero-García, J.M.; Martínez-Patiño, J.C.; Ruiz-Ramos, E.; Castro-Galiano, E.; Cardona-Alzate, C.A. Acid pretreatment of lignocellulosic biomass for energy vectors production: A review focused on operational conditions and techno-economic assessment for bioethanol production. Renew. Sust. Energy Rev. 2019, 107, 587–601. [Google Scholar] [CrossRef]
  16. Xu, Z.; Fang, H. Pretreatment methods for bioethanol production. Appl. Biochem. Biotechnol. 2014, 174, 43–62. [Google Scholar] [CrossRef]
  17. Chiranjeevi, T.; Mattam, A.J.; Vishwakarma, K.K.; Uma, A.; Peddy, V.R.; Gandham, S.; Ravindra Velankar, H. Assisted single-step acid pretreatment process for enhanced delignification of rice straw for bioethanol production. ACS Sustain. Chem. Eng. 2018, 6, 8762–8774. [Google Scholar] [CrossRef]
  18. Bensah, E.C.; Mensah, M. Chemical pretreatment methods for the production of cellulosic ethanol: Technologies and innovations. Int. J. Chem. Eng. 2013, 719607. [Google Scholar] [CrossRef]
  19. Jönsson, L.J.; Martín, C. Pretreatment of lignocellulose: Formation of inhibitory by-products and strategies for minimizing their effects. Bioresour. Technol. 2016, 199, 103–112. [Google Scholar] [CrossRef] [Green Version]
  20. Li, P.; Cai, D.; Zhang, C.; Li, S.; Qin, P.; Chen, C.; Wang, Y.; Wang, Z. Comparison of two-stage acid-alkali and alkali-acid pretreatments on enzymatic saccharification ability of the sweet sorghum fiber and their physicochemical characterizations. Bioresour. Technol. 2016, 221, 636–644. [Google Scholar] [CrossRef]
  21. Kim, S.; Park, J.M.; Seo, J.W.; Kim, C.H. Sequential acid-/alkali-pretreatment of empty palm fruit bunch fiber. Bioresour. Technol. 2012, 109, 229–233. [Google Scholar] [CrossRef]
  22. Guilherme, A.A.; Dantas, P.V.F.; Santos, E.S.; Fernandes, F.A.N.; Macedo, G.R. Evaluation of composition, characterization and enzymatic hydrolysis of pretreated sugar cane bagasse. Braz. J. Chem. Eng. 2015, 32, 23–33. [Google Scholar] [CrossRef]
  23. Yuan, W.; Gong, Z.; Wang, G.; Zhou, W.; Liu, Y.; Wang, X.; Zhao, M. Alkaline organosolv pretreatment of corn stover for enhancing the enzymatic digestibility. Bioresour. Technol. 2018, 265, 464–470. [Google Scholar] [CrossRef]
  24. Kärcher, M.A.; Iqbal, Y.; Lewandowski, I.; Senn, T. Efficiency of single stage-and two stage pretreatment in biomass with different lignin content. Bioresour. Technol. 2016, 211, 787–791. [Google Scholar] [CrossRef]
  25. Lemões, J.S.; e Silva, C.F.L.; Avila, S.P.F.; Montero, C.R.S.; e Silva, S.D.D.A.; Samios, D.; Peralba, M.D.C.R. Chemical pretreatment of Arundo Donax L. for second-generation ethanol production. Electron. J. Biotechnol. 2018, 31, 67–74. [Google Scholar] [CrossRef]
  26. Butt, M.S.; Tahir-Nadeem, M.; Khan, M.K.I.; Shabir, R.; Butt, M.S. Oat: Unique among the cereals. Eur. J. Nutr. 2008, 47, 68–79. [Google Scholar] [CrossRef]
  27. Eurostat: Agriculture, Forestry and Fishery Statistics. 2017. Available online: http://ec.europa.eu/eurostat/statistics-explained/index.php/Agricultural_production_-_animals#Livestock_population (accessed on 11 April 2019).
  28. Kahr, H.; Wimberger, J.; Schürz, D.; Jäger, A. Evaluation of the biomass potential for the production of lignocellulosic bioethanol from various agricultural residues in Austria and Worldwide. Energy Procedia 2013, 40, 146–155. [Google Scholar] [CrossRef]
  29. Finch, S.; Samuel, A.; Lane, G.P. Lockhart and Wiseman’s Crop Husbandry Including Grassland, 9th ed.; Elsevier: Amsterdam, The Netherlands, 2014. [Google Scholar]
  30. Masłowski, M.; Miedzianowska, J.; Strąkowska, A.; Strzelec, K.; Szynkowska, M.I. The use of rye, oat and triticale straw as fillers of natural rubber composites. Polym. Bull. 2018, 75, 4607–4626. [Google Scholar] [CrossRef] [Green Version]
  31. Johansson, E.; Prade, T.; Angelidaki, I.; Svensson, S.-E.; Newson, W.R.; Gunnarsson, I.B.; Hovmalm, H.P. Economically viable components from Jerusalem artichoke (Helianthus tuberosus L.) in a biorefinery concept. Int. J. Mol. Sci. 2015, 16, 8997–9016. [Google Scholar] [CrossRef]
  32. Long, X.H.; Shao, H.B.; Liu, L.; Liu, L.P.; Liu, Z.P. Jerusalem artichoke: A sustainable biomass feedstock for biorefinery. Renew. Sustain. Energy Rev. 2016, 54, 1382–1388. [Google Scholar] [CrossRef] [Green Version]
  33. Yang, L.; He, Q.S.; Corscadden, K.; Udenigwe, C.C. The prospects of Jerusalem artichoke in functional food ingredients and bioenergy production. Biotechnol. Rep. 2015, 5, 77–88. [Google Scholar] [CrossRef]
  34. Wang, Y.Z.; Zou, S.M.; He, M.L.; Wang, C.H. Bioethanol production from the dry powder of Jerusalem artichoke tubers by recombinant Saccharomyces cerevisiae in simultaneous saccharification and fermentation. J. Ind. Microbiol. Biotechnol. 2015, 42, 543–551. [Google Scholar] [CrossRef] [PubMed]
  35. Sarchami, T.; Rehmann, L. Optimizing enzymatic hydrolysis of inulin from Jerusalem artichoke tubers for fermentative butanol production. Biomass Bioenergy 2014, 69, 175–182. [Google Scholar] [CrossRef]
  36. Khatun, M.M.; Li, Y.H.; Liu, C.G.; Zhao, X.Q.; Bai, F.W. Fed-batch saccharification and ethanol fermentation of Jerusalem artichoke stalks by an inulinase producing Saccharomyces cerevisiae MK01. RSC Adv. 2015, 5, 107112–107118. [Google Scholar] [CrossRef]
  37. Song, Y.; Wi, S.G.; Kim, H.M.; Bae, H.-J. Cellulosic bioethanol production from Jerusalem artichoke (Helianthus tuberosus L.) using hydrogen peroxide-acetic acid (HPAC) pretreatment. Bioresour. Technol. 2016, 214, 30–36. [Google Scholar] [CrossRef]
  38. Li, K.; Qin, J.C.; Liu, C.G.; Bai, F.W. Optimization of pretreatment, enzymatic hydrolysis and fermentation for more efficient ethanol production by Jerusalem artichoke stalk. Bioresour. Technol. 2016, 221, 188–194. [Google Scholar] [CrossRef]
  39. Dziekońska-Kubczak, U.; Berłowska, J.; Dziugan, P.; Patelski, P.; Pielech-Przybylska, K.; Balcerek, M. Nitric acid pretreatment of Jerusalem artichoke stalks for enzymatic saccharification and bioethanol production. Energies 2018, 11, 2153. [Google Scholar] [CrossRef]
  40. Sluiter, A.; Hames, B.; Ruiz, R.; Scarlata, C.; Sluiter, J.; Templeton, D.; Crocker, D. Determination of Structural Carbohydrates and Lignin in Biomass; Technical Report No. NREL/TP-510-42618; NREL: Golden, CO, USA, 2012.
  41. Negro, M.J.; Ballesteros, I.; Manzanares, P.; Oliva, J.M.; Sáez, F.; Ballesteros, M. Inulin containing biomass for ethanol production: Carbohydrate extraction and ethanol fermentation. Appl. Biochem. Biotechnol. 2006, 132, 922–932. [Google Scholar] [CrossRef]
  42. Zhao, Y.; Sun, F.; Yu, J.; Cai, Y.; Luo, X.; Cui, Z.; Hu, Y.; Wang, X. Co-digestion of oat straw and cow manure during anaerobic digestion: Stimulative and inhibitory effects on fermentation. Bioresour. Technol. 2018, 269, 143–152. [Google Scholar] [CrossRef]
  43. Romaní, A.; Tomaz, P.D.; Garrote, G.; Teixeira, J.A.; Domingues, L. Combined alkali and hydrothermal pretreatments for oat straw valorization within a biorefinery concept. Bioresour. Technol. 2016, 220, 323–332. [Google Scholar] [CrossRef] [Green Version]
  44. Kim, S.; Park, J.M.; Kim, C.H. Ethanol production using whole plant biomass of Jerusalem artichoke by Kluyveromyces marxianus CBS1555. Appl. Biochem. Biotechnol. 2013, 169, 1531–1545. [Google Scholar] [CrossRef] [PubMed]
  45. Jönsson, L.J.; Björn, A.; Nilvebrant, N.O. Bioconversion of lignocellulose: Inhibitors and detoxification. Biotechnol. Biofuels 2013, 6, 16. [Google Scholar] [CrossRef] [PubMed]
  46. Wang, H.S.; Gao, H.L.; Li, B.; Mu, X.D. Acid-alkaline two-stage pretreatments of corn stover for enhancing enzymatic saccharification. Adv. Mater. Res. 2013, 724–725, 207–211. [Google Scholar] [CrossRef]
Figure 1. Effect of single and two-stage acid-alkali (a) and alkali-acid (b) pretreatment on the chemical composition of pretreated JAS and biomass recovery. SA—sulfuric acid; NA—nitric acid; SH—sodium hydroxide; AIL—acid insoluble lignin; ASL—acid-soluble lignin. Different lower-case letters indicate significant differences (p < 0.05) between the mean values of the cellulose content (two-way ANOVA, Tukey’s post-hoc test). Different capital letters indicate significant differences (p < 0.05) between the mean values of the hemicellulose content (two-way ANOVA, Tukey’s post-hoc test). Different lower-case letters in italic, indicate significant differences (p < 0.05) between the mean values of the AIL content (two-way ANOVA, Tukey’s post-hoc test). Different lower-case letters in bold, indicate significant differences (p < 0.05) between the mean values of the ASL content (two-way ANOVA, Tukey’s post-hoc test). Different capital letters in bold, indicate significant differences (p < 0.05) between the mean values of the biomass recovery (two-way ANOVA, Tukey’s post-hoc test).
Energies 12 01715 g001
Figure 2. Effect of single and two-stage acid-alkali (a) and alkali-acid (b) pretreatment on the chemical composition of pretreated OS and biomass recovery. SA—sulfuric acid; NA—nitric acid; SH—sodium hydroxide; AIL—acid insoluble lignin; ASL—acid-soluble lignin. Different lower-case letters indicate significant differences (p < 0.05) between the mean values of the cellulose content (two-way ANOVA, Tukey’s post-hoc test). Different capital letters indicate significant differences (p < 0.05) between the mean values of the hemicellulose content (two-way ANOVA, Tukey’s post-hoc test). Different lower-case letters in italic, indicate significant differences (p < 0.05) between the mean values of the AIL content (two-way ANOVA, Tukey’s post-hoc test). Different lower-case letters in bold, indicate significant differences (p < 0.05) between the mean values of the ASL content (two-way ANOVA, Tukey’s post-hoc test). Different capital letters in bold, indicate significant differences (p < 0.05) between the mean values of the biomass recovery (two-way ANOVA, Tukey’s post-hoc test).
Energies 12 01715 g002
Table 1. Chemical composition of raw JAS and OS.
Component (% d.m.)JASOS
Cellulose29.0 ± 1.6 a 138.3 ± 2.1 b
Hemicellulose13.6 ± 0.7 a22.4 ± 1.2 b
AIL17.9 ± 1.0 a22.3 ± 1.2 b
ASL8.1 ± 0.4 b5.5 ± 0.3 a
1 a, b—Different lower-case letters in the columns indicate a significant difference (p < 0.05), as analyzed by the one-way ANOVA followed by Tukey’s post-hoc test; AIL—acid insoluble lignin; ASL—acid-soluble lignin.
Table 2. Concentration of sugars, organic acids and furan compounds (g/L) in liquids after single and two-stage pretreatment of JAS.
Pretreatment GlucoseCellobioseXyloseArabinoseFormic acidAcetic acidFurfuralHMF
2% SA2.86 ± 0.14 d 11.43 ± 0.07 e13.58 ± 0.66 fn.d. 20.25 ± 0.01 ab2.37 ± 0.12 d0.07 ± 0.00 d 2.12 ± 0.10 d
2% SA/SH0.47 ± 0.02 ab0.18 ± 0.01 b0.18 ± 0.01 ab0.41 ± 0.02 c1.39 ± 0.07 g1.11 ± 0.05 bn.d.n.d.
5% SA2.03 ± 0.08 c0.93 ± 0.03 d6.46 ± 0.24 d0.63 ± 0.02 d1.09 ± 0.04 ef1.78 ± 0.07 c0.21 ± 0.01 e0.81 ± 0.03 c
5% SA/SH0.46 ± 0.02 ab0.12 ± 0.00 ab0.05 ± 0.00 ab0.27 ± 0.01 b0.75 ± 0.03 d0.35 ± 0.01 an.d.n.d.
2% NA2.90 ± 0.16 d1.02 ± 0.06 d13.22 ± 0.73 f0.74 ± 0.04 e0.56 ± 0.03 cd1.83 ± 0.10 c0.01 ± 0.00 a0.27 ± 0.01 b
2% NA/SH0.56 ± 0.03 ab0.18 ± 0.01 b0.16 ± 0.01 ab0.20 ± 0.01 b1.27 ± 0.07 fg1.13 ± 0.06 bn.d.n.d.
5% NA6.28 ± 0.31 f2.08 ± 0.10 f10.71 ± 0.54 e1.31 ± 0.07 f0.99 ± 0.05 e2.29 ± 0.11 d0.03 ± 0.00 b0.02 ± 0.00 a
5% NA/SH0.17 ± 0.01 a0.16 ± 0.01 b0.04 ± 0.00 ab0.01 ± 0.00 a0.56 ± 0.03 cd0.33 ± 0.02 an.d.n.d.
2% SH2.00 ± 0.10 c0.54 ± 0.03 cn.d.0.80 ± 0.04 e 3.69 ± 0.18 i4.08 ± 0.20 e n.d.n.d.
2% SH/SA0.11 ± 0.00 an.d.2.60 ± 0.12 c0.07 ± 0.00 a0.36 ± 0.02 bc0.12 ± 0.01 an.d.0.01 ± 0.00 a
2% SH/NA0.10 ± 0.00 a0.03 ± 0.00 a2.11 ± 0.10 c0.03 ± 0.00 a0.03 ± 0.00 a 0.05 ± 0.00 a0.01 ± 0.00 a0.03 ± 0.00 a
5% SH3.70 ± 0.26 e0.65 ± 0.05 c0.94 ± 0.07 b1.25 ± 0.09 f2.75 ± 0.20 h3.91 ± 0.28 en.d.n.d.
5% SH/SA0.34 ± 0.02 ab0.12 ± 0.01 ab2.10 ± 0.11 c0.04 ± 0.00 a0.36 ± 0.02 bc0.11 ± 0.01 an.d.0.03 ± 0.00 a
5% SH/NA0.26 ± 0.01 ab0.02 ± 0.00 a1.89 ± 0.10 cn.d. 0.03 ± 0.00 a0.07 ± 0.00 a 0.05 ± 0.00 c0.04 ± 0.00 a
SA—sulfuric acid; NA—nitric acid; SH—sodium hydroxide; HMF—hydroxymethylfurfural; 1 a–i—Different lower-case letters in the columns indicate a significant difference (p < 0.05), as analyzed by the two-way ANOVA followed by Tukey’s post-hoc test; 2—n.d.—not detected.
Table 3. Concentration of sugars, organic acids and furan compounds (g/L) in liquids after single and two-stage pretreatment of OS.
Pretreatment GlucoseCellobioseXyloseArabinoseFormic acidAcetic acidFurfuralHMF
2% SA3.43 ± 0.17 d 10.11 ± 0.01 bcd8.60 ± 0.42 dn.d. 20.10 ± 0.00 ab1.01 ± 0.05 e0.11 ± 0.00 dn.d.
2% SA/SH0.06 ± 0.00 a0.03 ± 0.00 ab0.01 ± 0.00 a0.02 ± 0.00 b1.01 ± 0.05 i0.56 ± 0.03 d0.02 ± 0.00 bn.d.
5% SA3.32 ± 0.12 d0.09 ± 0.00 bc7.34 ± 0.27 dn.d.0.25 ± 0.01 de0.05 ± 0.00 ab0.27 ± 0.01 en.d.
5% SA/SH0.11 ± 0.00 a0.04 ± 0.00 ab n.d.n.d.0.69 ± 0.03 h0.21 ± 0.01 c0.02 ± 0.00 bn.d.
2% NA5.92 ± 0.33 e1.97 ± 0.11 e18.20 ± 1.00 en.d.0.69 ± 0.04 h1.96 ± 0.11 g0.02 ± 0.00 b0.13 ± 0.01 c
2% NA/SH0.13 ± 0.01 a0.09 ± 0.00 bc0.04 ± 0.00 a0.03 ± 0.00 c1.07 ± 0.06 i0.66 ± 0.04 a0.01 ± 0.00 an.d.
5% NA11.04 ± 0.55 f0.04 ± 0.00 ab20.98 ± 1.05 fn.d.1.39 ± 0.07 j2.50 ± 0.12 h0.01 ± 0.00 a0.02 ± 0.00 b
5% NA/SH0.13 ± 0.01 a0.06 ± 0.00 abcn.d.n.d.0.67 ± 0.03 g0.18 ± 0.01 bcn.d. n.d.
2% SH0.48 ± 0.02 ab0.19 ± 0.01 d0.26 ± 0.01 a0.12 ± 0.01 d0.57 ± 0.03 f1.34 ± 0.07 fn.d.n.d.
2% SH/SA1.15 ± 0.06 c0.02 ± 0.00 a3.57 ± 0.17 bn.d.0.01 ± 0.00 a0.01 ± 0.00 a0.02 ± 0.00 b0.01 ± 0.00 ab
2% SH/NA0.97 ± 0.04 bc0.04 ± 0.00 ab5.22 ± 0.23 cn.d.0.20 ± 0.01 cd0.07 ± 0.00 abcn.d.n.d.
5% SH0.41 ± 0.02 a0.13 ± 0.01 cd0.09 ± 0.00 a0.01 ± 0.00 a0.33 ± 0.02 e1.10 ± 0.06 en.d.n.d.
5% SH/SA0.97 ± 0.07 bcn.d.2.45 ± 0.17 bn.d.0.02 ± 0.00 a0.01 ± 0.00 a0.05 ± 0.00 c0.01 ± 0.00 ab
5% SH/NA1.31 ± 0.07 cn.d.3.12 ± 0.16 bn.d.0.14 ± 0.00 bc0.06 ± 0.00 abcn.d.n.d.
SA—sulfuric acid; NA—nitric acid; SH—sodium hydroxide; HMF—hydroxymethylfurfural; 1 a–j—Different lower-case letters in the columns indicate a significant difference (p < 0.05), as analyzed by the two-way ANOVA followed by Tukey’s post-hoc test; 2 —n.d.—not detected.
Table 4. The concentration of glucose, xylose, arabinose and cellobiose (g/L) in hydrolysates and glucose yield (%) after hydrolysis of two-stage pretreated JAS.
PretreatmentGlucoseCellobioseXyloseArabinoseGY (%)
g/L
2% SA/SH18.70 ± 0.89 a 10.16 ± 0.01 d1.35 ± 0.06 bn.d. 253.64 ± 1.32 b
5% SA/SH22.88 ± 0.91 ab0.02 ± 0.00 a0.59 ± 0.02 an.d.46.31 ± 0.67 a
2% NA/SH40.03 ± 2.08 d0.11 ± 0.01 c3.87 ± 0.20 efn.d.83.86 ± 0.25 d
5% NA/SH45.30 ± 2.65 e0.35 ± 0.02 e1.75 ± 0.10 cn.d.91.55 ± 2.83 e
2% SH/SA18.60 ± 0.64 a0.11 ± 0.00 c3.18 ± 0.11 dn.d.46.40 ± 0.72 a
2% SH/NA25.72 ± 1.36 b0.07 ± 0.00 b4.25 ± 0.23 fn.d.66.69 ± 0.79 c
5% SH/SA25.87 ± 1.29 b0.10 ± 0.00 bc1.35 ± 0.07 bn.d.51.69 ± 1.06 b
5% SH/NA44.81 ± 2.25 e0.53 ± 0.03 f3.68 ± 0.18 e 0.18 ± 0.01 a97.65 ± 1.02 f
SA—sulfuric acid; NA—nitric acid; SH—sodium hydroxide; GY—glucose yield; 1 a–f—Different lower-case letters in the columns indicate a significant difference (p < 0.05), as analyzed by the two-way ANOVA followed by Tukey’s post-hoc test; 2—n.d.—not detected.
Table 5. The concentration of glucose, xylose, arabinose and cellobiose (g/L) in hydrolysates and glucose yield (%) after hydrolysis of two-stage pretreated OS.
PretreatmentGlucoseCellobioseXyloseArabinoseGY (%)
g/L
2% SA/SH33.09 ± 1.34 a 10.40 ± 0.02 b0.96 ± 0.04 an.d.267.65 ± 1.19 a
5% SA/SH41.91 ± 2.08 cde0.70 ± 0.03 d0.94 ± 0.05 an.d.86.32 ± 2.12 de
2% NA/SH39.31 ± 2.06 bcd0.43 ± 0.02 b2.06 ± 0.11 bn.d.77.48 ± 0.11 b
5% NA/SH44.42 ± 2.76 de0.52 ± 0.03 c1.36 ± 0.08 an.d.84.14 ± 2.86 cd
2% SH/SA35.73 ± 1.72 ab0.32 ± 0.02 a6.59 ± 0.32 dn.d.80.07 ± 0.15 bc
2% SH/NA40.75 ± 1.82 bcde0.44 ± 0.02 b7.37 ± 0.33 dn.d.78.54 ± 1.22 b
5% SH/SA37.39 ± 2.05 abc0.32 ± 0.02 a3.26 ± 0.18 cn.d.84.76 ± 0.99 d
5% SH/NA45.28 ± 1.69 e0.70 ± 0.03 d3.78 ± 0.14 cn.d.90.61 ± 2.01 e
SA—sulfuric acid; NA—nitric acid; SH—sodium hydroxide; GY—glucose yield; 1 a–e—Different lower-case letters in the columns indicate a significant difference (p < 0.05), as analyzed by the two-way ANOVA followed by Tukey’s post-hoc test; 2—n.d.—not detected.

