Eco-Efficient Resource Management in HPC Clusters through Computer Intelligence Techniques


Departamento de Informática, Universidad de Oviedo, 33204 Gijón, Spain
*
Authors to whom correspondence should be addressed.
Energies 2019, 12(11), 2129; https://doi.org/10.3390/en12112129
Submission received: 29 April 2019
/
Revised: 26 May 2019
/
Accepted: 28 May 2019
/
Published: 3 June 2019
(This article belongs to the Special Issue Model Coupling and Energy Systems)
Abstract
:High Performance Computing Clusters (HPCCs) are common platforms for solving both up-to-date challenges and high-dimensional problems faced by IT service providers. Nonetheless, the use of HPCCs carries a substantial and growing economic and environmental impact, owing to the large amount of energy they need to operate. In this paper, a two-stage holistic optimisation mechanism is proposed to manage HPCCs in an eco-efficiently manner. The first stage logically optimises the resources of the HPCC through reactive and proactive strategies, while the second stage optimises hardware allocation by leveraging a genetic fuzzy system tailored to the underlying equipment. The model finds optimal trade-offs among quality of service, direct/indirect operating costs, and environmental impact, through multiobjective evolutionary algorithms meeting the preferences of the administrator. Experimentation was done using both actual workloads from the Scientific Modelling Cluster of the University of Oviedo and synthetically-generated workloads, showing statistical evidence supporting the adoption of the new mechanism.
1. Introduction
High Performance Computing Clusters (HPCCs) are the core infrastructure of modern supercomputers (see Top500 (http://www.top500.org/) and The Green500 (http://www.top500.org/green500)), given both the availability of tools for distributed and parallel computing, and the performance/price ratio of modern commodity microprocessors [1]. Nevertheless, the economical and environmental impact of these computing infrastructures is a growing concern. First, HPCCs have high power consumptions due to both their computing resources and their support equipment, such as its cooling systems [2,3]. It is estimated that, in the United States alone, data centres consumed 70 billion kWh in 2014, which amounts to approximately 1.8% of the total U.S. electricity consumption [4]. These large power consumptions lead to high direct operating costs [5,6]. Secondly, there are indirect costs associated to the life cycle of equipment as a result of replacements due to degradation and obsolescence in either computing or support systems [7]. Thirdly, there are substantial environmental-related impacts such as the greenhouse gases emitted over the HPCC’s entire life cycle: from the carbon footprint of the manufacturing process to that associated with the generation of the large amount of electricity consumed during operation. These environmental impacts are, in fact, equivalent to that of the aviation industry, as HPCCs are accountable for a carbon footprint of 100 million metric tons of every year [8].
These factors accurately depict the magnitude of the problem at hand. Both legislators, supporting policies to improve the energy efficiency of data centres [2,9], and key players in the industry, implementing measures to reduce their power use and energy waste [10,11,12], are well aware of this issue.
Lastly, adaptive resource cluster consists of an automatic reconfiguration of the cluster resources to fit the workload at every moment by switching on or off its compute nodes, thus saving energy whenever these are idle.
This technique has been applied to load-balancing clusters [13,14,15,16,17,18], and in VMware vSphere (VMware Distributed Power Management Concepts and Use, http://www.vmware.com/files/pdf/Distributed-Power-Management-vSphere.pdf) and Citrix XenServer (Citrix XenServer—Efficient Server Virtualization Software, http://www.citrix.com/products/xenserver/overview.html hypervisors. Recently, various software tools implementing this technique in HPC clusters have also been developed [19,20,21,22].
In recent years, many efforts have been made to achieve an energy-efficient cluster computing, following both static and dynamic approaches. Static approaches focus on the development of hardware to maximise the FLOPS/watt ratio as opposed to solely absolute performance. On the other hand, dynamic approaches seek to adapt the cluster to the current demand by down-speeding underused resources or by shutting them down altogether. Examples of these techniques are the dynamic adjustment of CPU frequency and voltage (Dynamic Voltage and Frequency Scaling, DVFS) [23,24,25,26,27,28,29,30], the development of energy-efficiency software [31,32,33,34,35], the thermal-aware methods [36,37] and the energy-efficient job schedulers [38,39].
This work, however, focuses on adaptive resource clusters, a method that consists of automatically reshaping the cluster resources to fit the current demand by powering on or off its compute nodes, thus saving energy whenever these are underused. This method has already been applied to load-balancing clusters [13,14,15,16,17,18], in virtual data centres running VMware vSphere (VMware Distributed Power Management Concepts and Use, http://www.vmware.com/files/pdf/Distributed-Power-Management-vSphere.pdf and Citrix XenServer (Citrix XenServer— Efficient Server Virtualization Software, http://www.citrix.com/products/xenserver/overview.html hypervisors, and also in HPC clusters [19,20,21,22].
Notwithstanding this, these proposals only target the high operating costs and carbon footprints of HPCCs as consequence of their high power consumptions, and do not address the life cycle-related effects. Moreover, the workload consolidation achieved with some energy optimisation techniques negatively affects the reliability of the equipment, increasing the wear-and-tear of server components due to thermal stressing and frequent power cycling [40,41,42,43,44]. As a result, when these techniques are applied regardless of the equipment’s life-cycle characteristics, the hardware degradation incurred may lead to an increased indirect costs and environmental impacts, which potentially outmatch the direct savings achieved from reduced power consumptions.
On account of this, we believe an holistic solution to this problem should entail two stages in order to jointly optimise the direct power-related costs and indirect life cycle-related costs of HPCCs. First, the optimal amount of logical resources for the cluster must be determined to balance service quality and energy savings. This can be done following either the proposals of other authors [19,20,21] or our previously proposed reactive [45] and proactive strategies [46]. Given the better results achieved with our proposed strategies in terms of flexibility, service quality compliance, and direct energy savings, we use these in this paper. Secondly, the new logical resource count computed in the preceding stage must be translated to a set of specific server reconfiguration commands. In other authors’ prior works as well as in ours, simple heuristics are used to prioritise servers according to a predetermined metric such as their power efficiency. However, these metrics are unaware of the life cycle-related costs of the servers, thus inherently limiting the potential overall savings.
Because of this, we introduce a novel mechanism to optimise hardware allocation, implemented by means of a genetic fuzzy system tailored to the underlying equipment of the HPCC, explicitly accounting for its power efficiency and reliability. The both direct and indirect cost-consciousness of this new mechanism allows it to achieve noticeable additional savings in real world heterogeneous HPCCs. Is it noteworthy that this proposal is intended primarily for heterogeneous clusters. In scenarios where all servers share the same reliability specifications and have been used evenly for the same amount of time, a simple power-efficiency sorting heuristic may suffice, since the indirect costs of all servers would likely be the same, and thus additional savings would not be attainable on account of indirect costs, but rather solely to reduced direct energy consumptions. However, according to our experience, this scenario is infrequent in real world HPCCs as the entirety of their computing resources is unlikely to be replaced all at once, but rather progressively, leading into a growing heterogeneity over time.
The remainder of the paper is as follows. Section 2 explains the architecture of the HPCCs that are addressed in this paper along with the metrics used to assess the eco-efficiency of an HPCC. Section 3 explains the architecture of the EECluster software tool. Section 4 summarises the first stage of the decision-making mechanism. Section 5 explains the node allocation algorithm proposed. Section 7 shows the experimental results. Section 8 concludes the paper.
2. System Overview
The systems under study in this paper are the High Performance Computing Clusters (HPCCs), a type of computing system consisting of multiple commodity-hardware standalone computers interconnected by high-bandwidth and low-latency networks, running a software middleware that allows them to work as a single computing resource [1]. The main purpose of these systems is to address computationally demanding problems, such as cancer detection and therapies, semiconductors or drugs design, sequestration, cardiovascular engineering, new combustion systems, new materials, etc. [47].
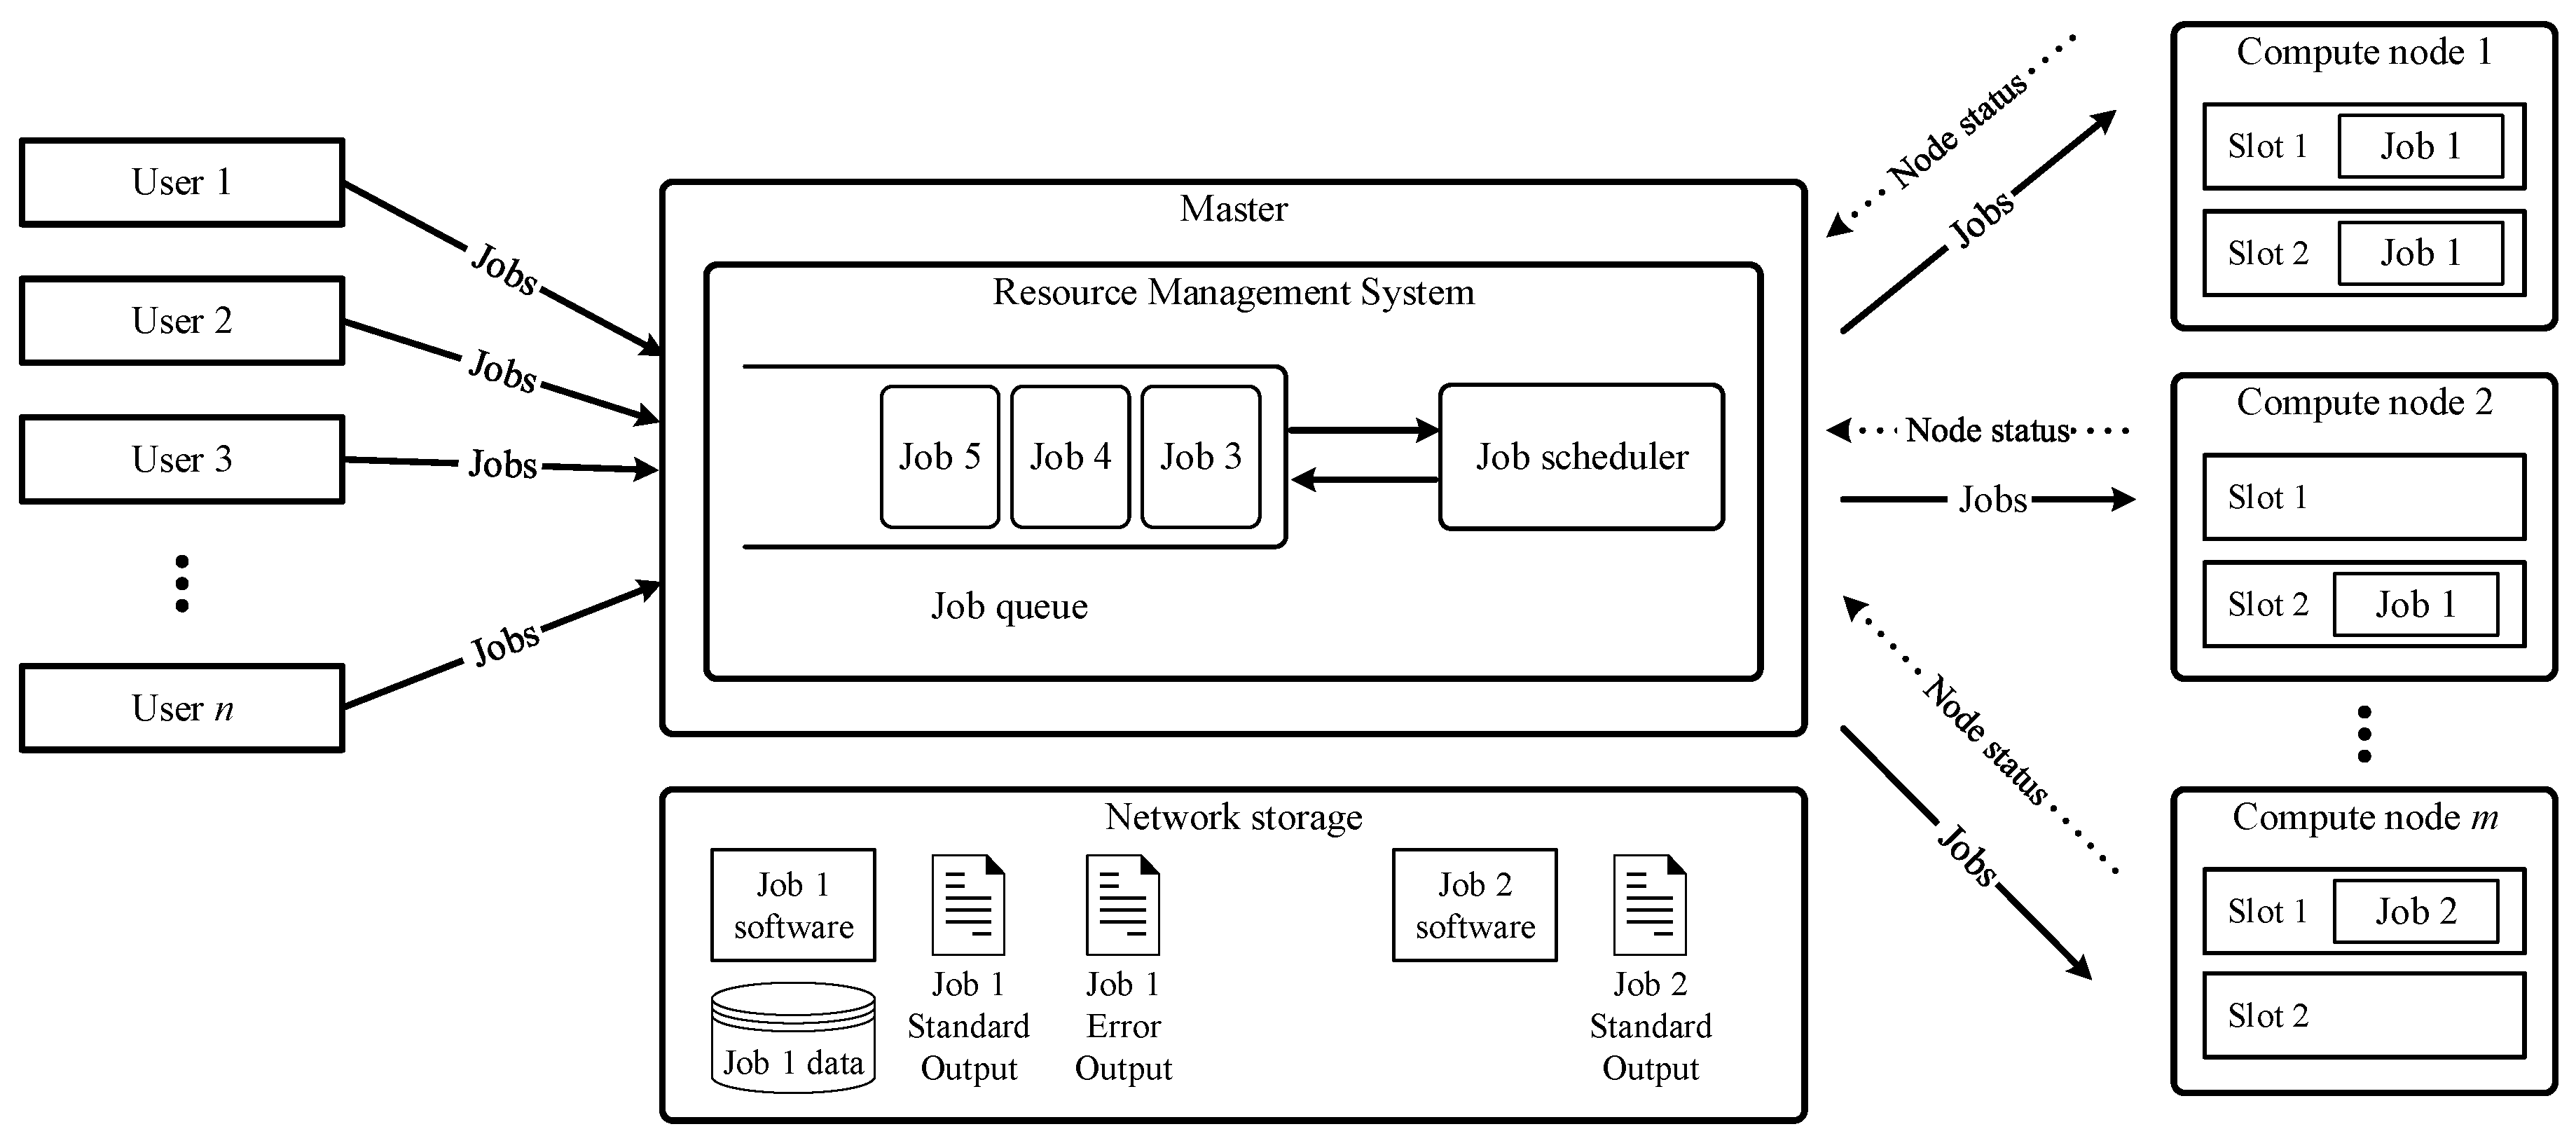
The architecture of HPCCs is composed of one or more master nodes and several compute nodes interconnected and sharing network storage space (see Figure 1 for a representation of a typical RMS). The master nodes are the core component of the infrastructure, as they are the only nodes accessed by the users and are responsible for managing the cluster resources. They do this through the Resource Management System (RMS), a software layer that presents the cluster to the users as a unified computing system composed of logical slots by abstracting them from the cluster underlying hardware of the compute nodes. The RMS also allows users to submit resource requests to run software programs supplied by them (hereafter denoted as jobs). Once jobs are submitted, the RMS first gathers them in an internal queue, then runs a scheduling algorithm to determine the best matching between resource requests and available slots, and finally assigns computing slots and dispatches the jobs to the corresponding compute nodes. It must be noted that the granularity of the compute resources provided to the users is configured in the RMS by determining what each slot represents, whether it is a single core, a CPU, or an entire host. Finally, shared network storage through network file systems or storage area networks are leveraged to transmit data and results between the nodes in the cluster.
Traditionally, these computing systems have only focused on the Quality of Service (QoS) delivered to the end user, which relies solely on the amount of computing power made available to the clusters users. However, as environmental and economic impacts grow larger in importance to the cluster operators, the focus in HPCCs is moving to improve their eco-efficiency, having this concept represented by the relation between QoS and the economic and environmental footprint of the cluster operation [48].
To explicitly assess the eco-efficiency of an HPCC, we have extended the model introduced in [49] by defining a series of metrics that accurately depict the service quality of the cluster along with its direct and indirect operating costs measured in both monetary and environmental terms. Specifically, we measure the direct operating cost as the amount of energy consumed by the compute nodes measured in Kilowatts-hour (kWh) along with equivalent figures in terms of carbon footprint (kg ) and monetary cost (EUR). On the other hand, indirect costs are measured in terms of manufacturing costs of hardware replacements according to estimated failures rates under simulated stress conditions and power-on/off cycles, as these are known to be the main factors affecting servers and disks reliability [40,41]. To estimate the effective failure rates of both the computes nodes as a whole and their hard disk drives, the models described in [41,42,44] are used to approximate the effect of temperature rise and thermal cycling in processors, and increased disks start/stop frequencies.
Assuming that the QoS in an HPCC depends only on the waiting time of the jobs before their requested resources are assigned, as jobs cannot be interrupted once its execution start, and that the jobs may have great disparity in running times, the waiting time of a job is not directly measured in seconds but rather divided by the job execution time. Let us suppose that there are n jobs and the jth job () is scheduled to start at time tsch but it actually starts at ton and stops at time toff. QoS is defined as follows [45]:
where is the cardinality of the set A. It is remarked that the 90th percentile is used instead of average, because outliers are possible.
Let c be the number of nodes, let state be 1 if the ith node () is powered on at time t and 0, otherwise let power be the power consumption of the ith node at time t. Lastly, let the time scale be the lapse between tini = and tend = , then the overall cluster power consumption is measured by adding the power consumption of every compute node:
The direct operating costs measured in both monetary units and carbon footprint are computed by multiplying the overall cluster power consumption by a translation factor according to the energy mix of the cluster power supply. Let be the amount of kg of emitted per kWh generated, and the electricity charge measured in euros per kWh, then the direct cost are calculated as:
The indirect operating costs for each compute node are approximated by multiplying the probability of failure for the node and its disks during the simulation time lapse by their manufacturing cost (monetary and carbon footprint), and by the remaining useful life of the device. These partial results are then added to estimate the costs for the whole cluster:
where is the remaining percentage of useful life for the ith node before it would be replaced anyway due to its obsolescence. and are the simulation failure rates for the ith node and for one of its disks, and represent the estimated probability of failure of these devices during the simulation time lapse. / and / are, respectively, the manufacturing costs in euros and carbon footprint for the ith node and for one of its disks. is the number of disks of the ith node.
The effective failure rates during the simulation for the ith compute node as a whole are approximated by:
where
and
where is the number of hours the ith node has been powered on during the simulation, is the effective mean time to failure of the node representing the estimated number of hours until failure, the baseline mean time to failure reported by the hardware manufacturer prior to the simulation, is 1 if the ith node is at high load at time t and 0 otherwise. is the acceleration factor for CPU degradation between the higher CPU temperature when the server is at high load () compared with the CPU temp when it is idle (), as described in [41,42] and based on the time-to-fail model of the Arrhenius equation. is the reduction in the mean time to failure due to node power-on/off cycles (thermal cycling) and is calculated as described in [41,42] where and are the average CPU temperatures before and after the power-on/off cycle, q is the Coffin-Mason exponent taking the value and is the ambient temperature [42].
The effective disk failure rates for the ith node are estimated as:
being the effective mean time to failure of the disk representing the estimated number of hours until failure, H the number of hours in a year (8760), and the reduction in the mean time to failure of the disk due to node power-on/off cycles. is the baseline disk spindle start/stop frequency (in times per month) prior to any node power-on/off cycle, is the increment in the disk start/stop frequency due to node power-on/off cycles, is the number of discontinuities of the function in the time interval , and is the number of months the ith node has been powered on during the simulation. Ultimately, is a function that quantifies the disk Annualised Failure Rate (AFR) based on its spindle start/stop frequency. Following Xie and Sun [44], is .
3. Architecture
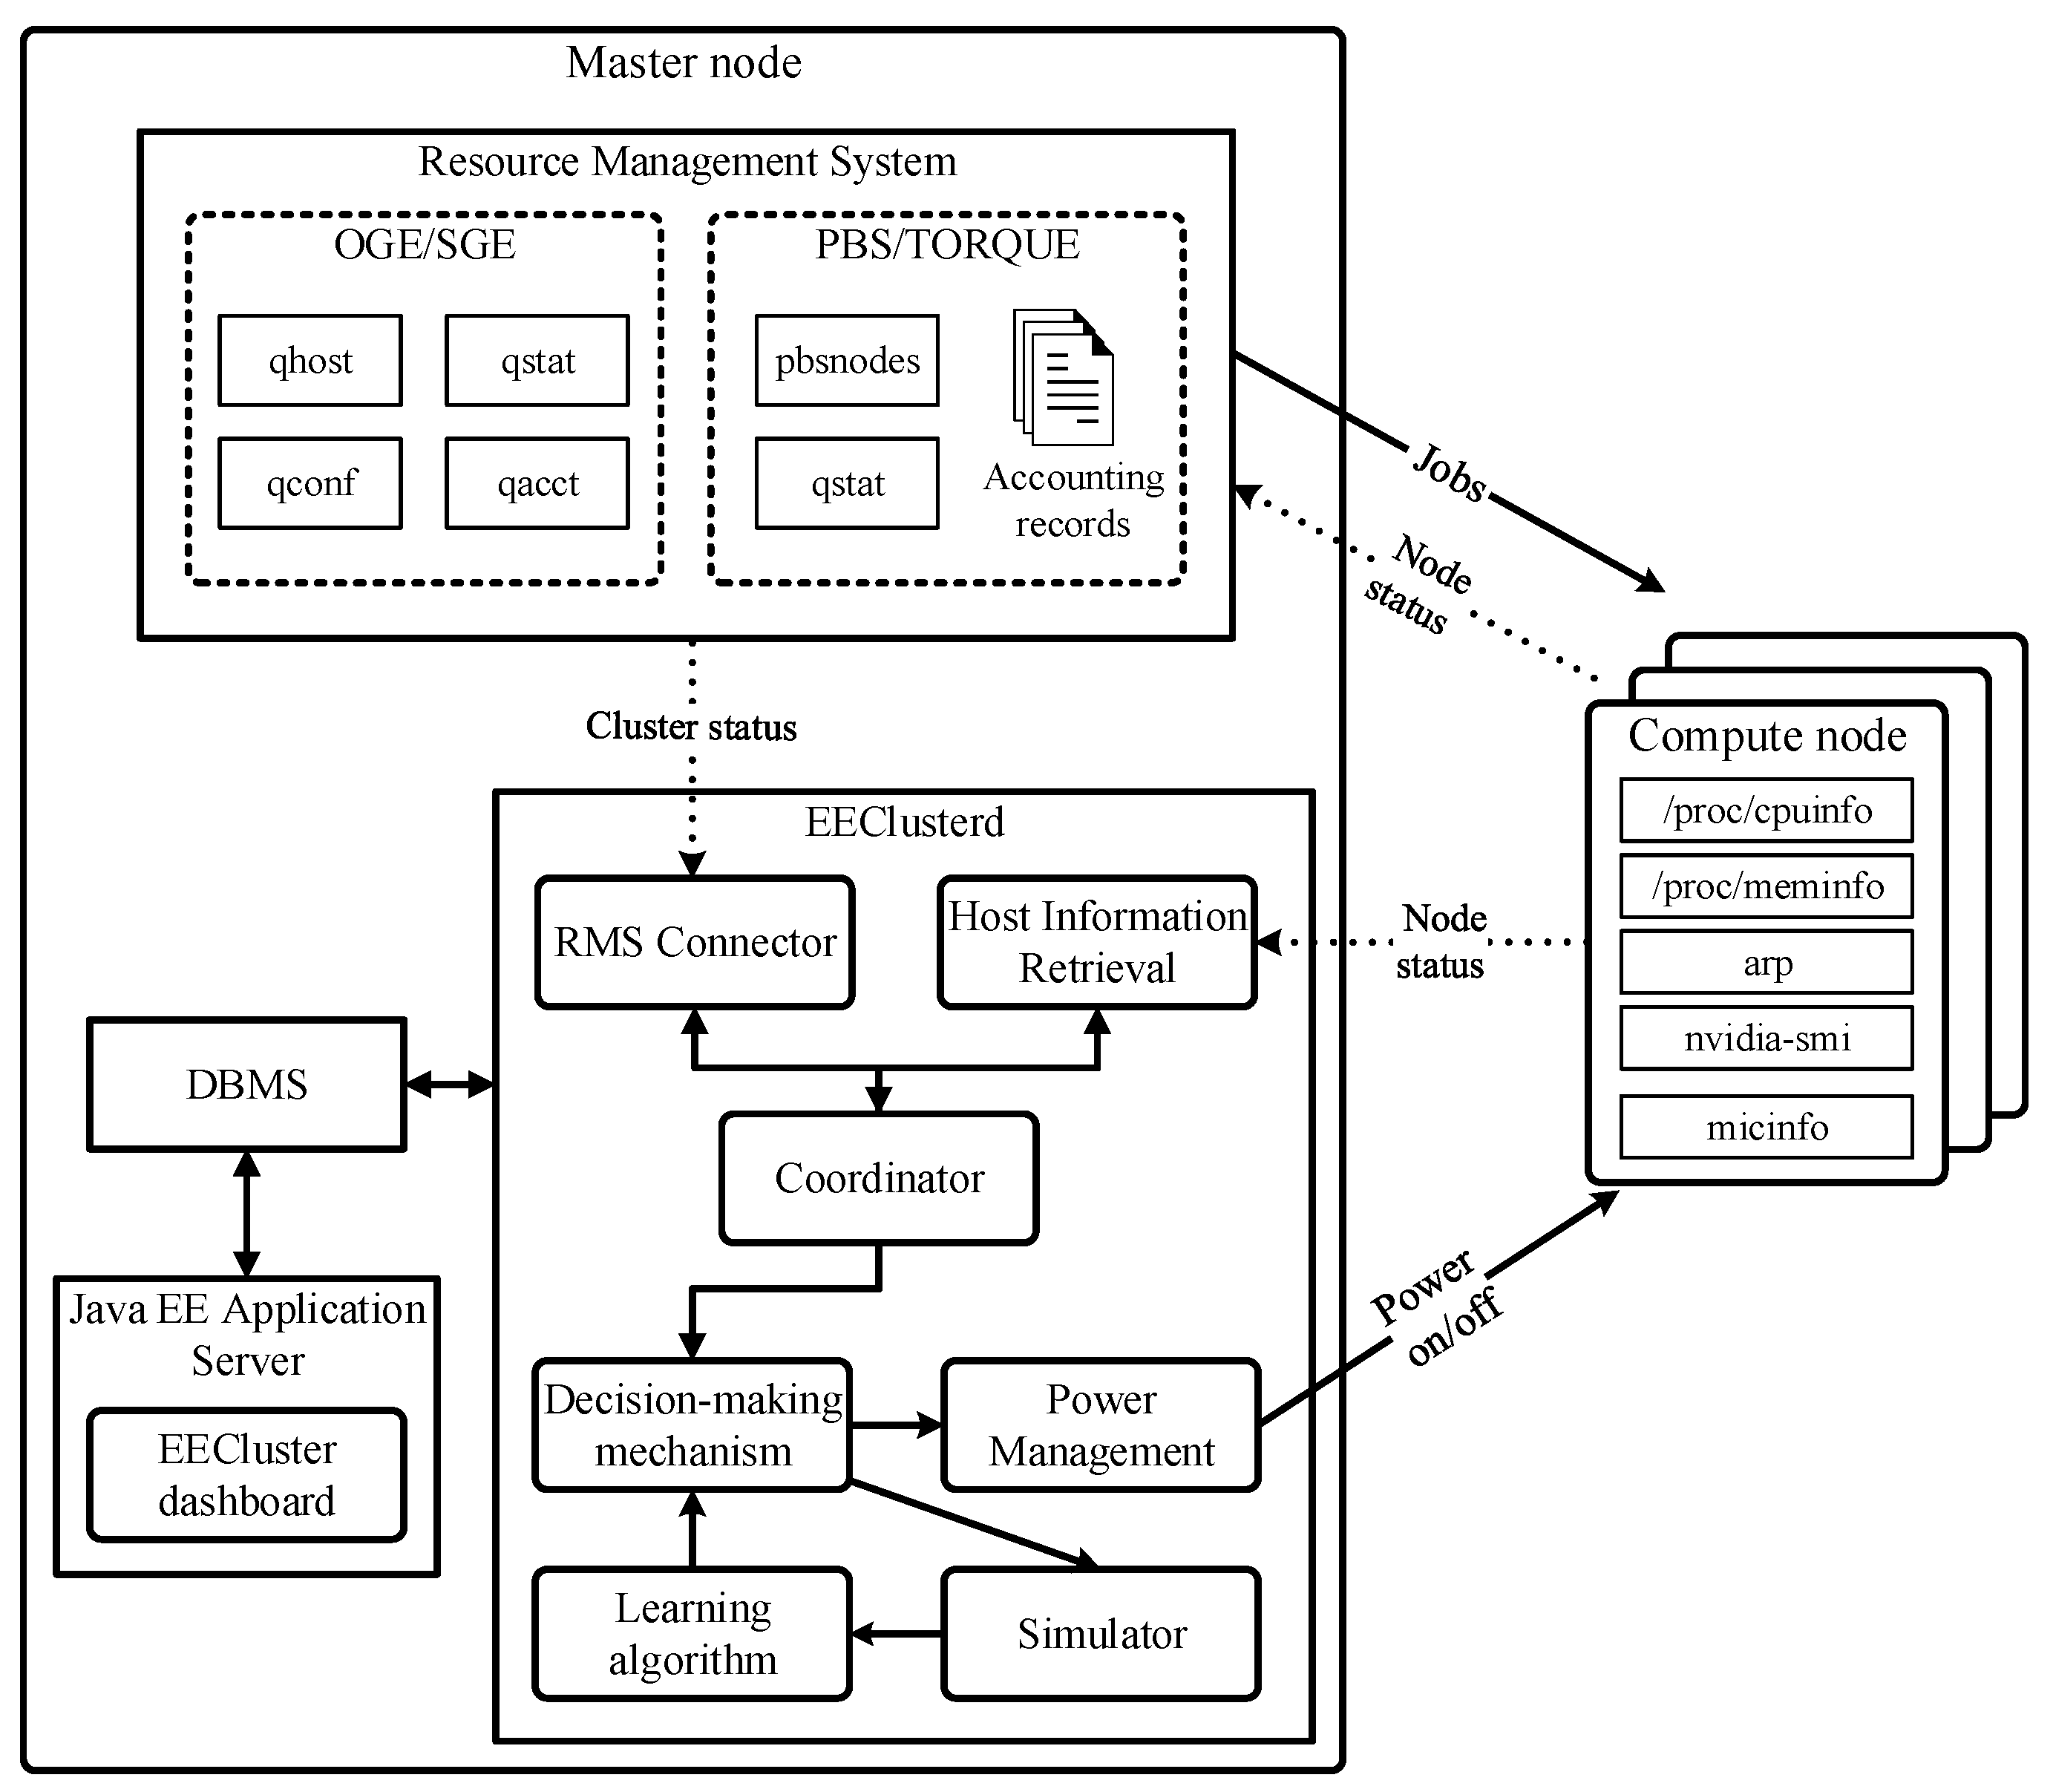
EECluster is proposed as a software solution to convert HPCCs running open-source RMS such as OGE/SGE and PBS/TORQUE (EECluster features two out-of-the-box connectors for PBS/TORQUE and OGE/SGE and given the wide adoption of these RMS in HPC infrastructures [50]) into adaptive resource clusters capable of dynamically reshaping its computing resources to suit the HPC workload without impact on QoS, minimising idle resources and thus improving its eco-efficiency by reducing operational and environmental costs whenever the cluster is underused.
The architecture of this solution is depicted in Figure 2. Its main component is the daemon eeclusterd deployed on the master node of the cluster, which keeps an updated record of the cluster status, its resources and its workload, and then runs a decision-making mechanism that issues power-on/off commands to the compute nodes through a power interface. A learning algorithm and simulator are provided to tune the behaviour of the solution in accordance to the preferences of the cluster administrator. In addition, a web-based administration dashboard allows the administrator to access the information on the cluster status, resources, job records, etc. retrieved by the daemon, as well as manually reconfiguring compute nodes and choosing the parameters that rule the decision-making mechanism. A detailed description of the architecture of EECluster and its modules can be found in Reference [22].
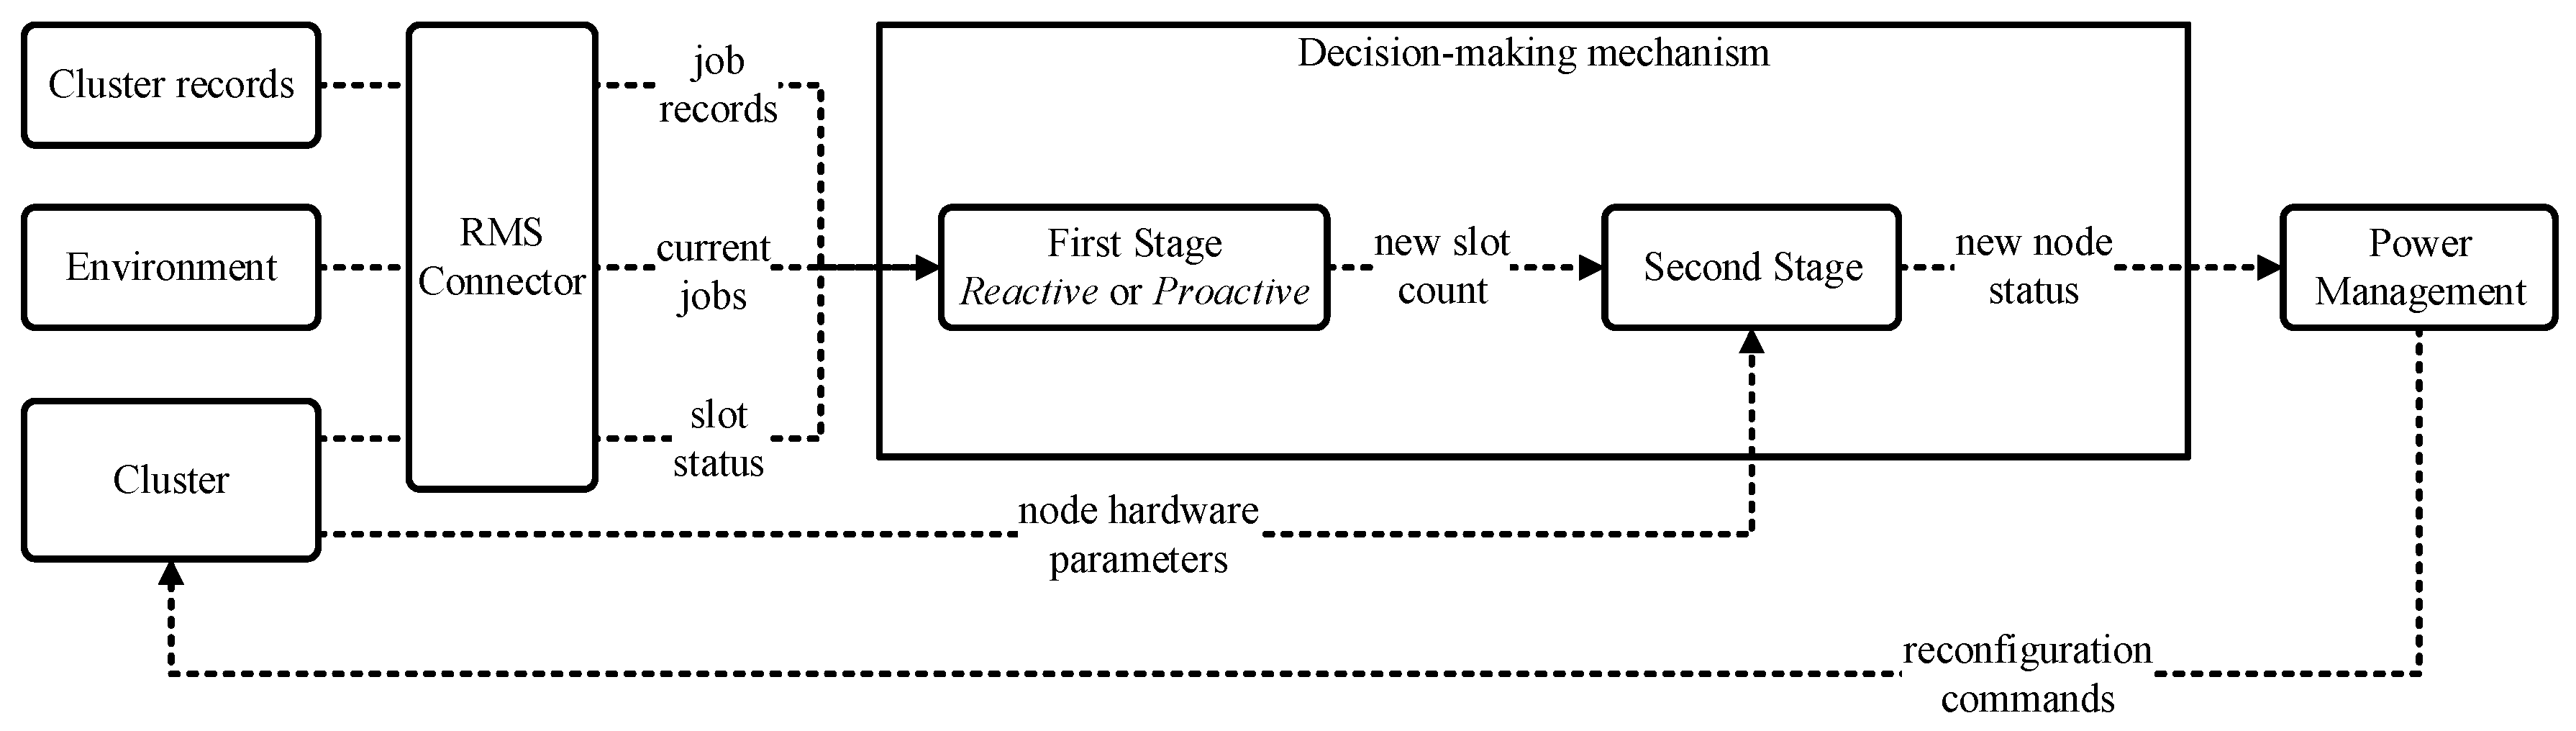
The control cycle of EECluster used to dynamically reshape its compute resources is represented in Figure 3 and consists of four steps:
- Synchronise EECluster’s internal records with the system current status and workload.
- Run the first stage of the decision-making mechanism to determine the optimal number of slots that should be on at the current time
- Run the second stage of the decision-making mechanism to select the target compute nodes to be powered on or off.
- Issue power-on/off commands to the selected nodes through the power management module.
As can be noted, the key element in the solution is the decision-making mechanism, which is responsible for automatically optimising the compute resources in accordance to the cluster status while strictly complying with the administrator preferences. This element works in two stages that produce two consecutive decisions in order to reconfigure the cluster. The first stage is hardware-agnostic, relying on a purely logical view of the cluster slots, since its goal is to determine the minimum number of slots that are required to keep on in order to maximise overall saving while meeting the QoS penalty constraints allowed by the cluster administrator. The second stage is the one that translates the number of slots determined by the previous stage into a series of specific compute nodes to be powered on or off. This is done by taking into account the key characteristics of the underlying hardware that drives the economic costs and environmental impacts defined in Section 2 in order to optimise the overall eco-efficiency of the cluster. In other words, the first stage logically optimises the resource allocation to appropriately meet the demand while the second stage explicitly optimises the eco-efficiency of the hardware resources in the cluster. The following sections explain in greater detail how these stages are implemented.
4. Optimising Slot Allocation
Given the complexity of finding the optimal amount of slots at every moment in a cluster architecture prone to sharp changes in the workload patterns, both reactive and proactive strategies are introduced in our previous works [45,46]. In this section, we include a brief summary of these strategies.
4.1. Reactive Strategy
The reactive strategy is introduced in Reference [45], and consists in determining the optimal number of cluster slots relying on information from current and past records of the cluster and thus reacting to the changes in the workload patterns after they manifest.
The starting point of this control strategy is a suboptimal but safe Knowledge Base (KB) described in Reference [19]. In this KB, the number of active slots is increased when the average waiting time or the number of jobs in the queue is too high, and reduced in the opposite case. There is a minimum number of always-on slots. The thresholds (high waiting time, too many jobs in queue, etc.) are selected by hand according to the experience of the operator. The linguistic definition of the KB is as follows:
- ifthen power on slots
- if or then power on 1 slot
- if or then power off 1 slot
where /
| = number of slots currently running | |
| = number of slots currently starting | |
| = number of slots that are at least required to run any of the jobs currently queued | |
| = average waiting time of the jobs in the queue | |
| = maximum average waiting time for the jobs in the queue | |
| = minimum average waiting time for the jobs in the queue | |
| = maximum number of queued jobs | |
| = minimum number of queued jobs |
In addition to this KB, a set of fuzzy rules learnt from past data is set to speed up the process of starting or shutting down compute slots. This process, which was done one slot at a time by the initial “safe” KB, is improved when fuzzy rules are introduced, because the fuzzy KB is designed to use a set of soft thresholds for defining the maximum waiting time for each slot. The intuitive idea under the soft thresholds is that the degree of truth of the assert “the ith slot must be switched off” is no longer binary, but a real value between 0 and 1. Rules that are only partially true cannot be used to decide whether a slot must be switched on or off. On the contrary, the degrees of truth of all rules are combined first and then the total number of active slots is determined from this aggregated value [45].
The linguistic description of the second KB comprises the following N rules for each of the s slots. If the idle time of the hth slot is called , the KB is as follows:
- if is then off
- if is then off
- if⋯then⋯
- if is then off
are fuzzy sets with triangular membership functions, which form a fuzzy partition of the input variable [51]. The aggregation of the degrees of truth of the different fuzzy rules associated to the hth compute slot is
The number of slots in the whole cluster that are switched off is computed by adding the outputs of the fuzzy model for every value of :
4.2. Proactive Strategy
The proactive strategy is introduced in Reference [46] to better adapt to volatile scenarios with stationary patterns of cluster activity, whose prediction may be leveraged to further improve the results obtained with the reactive strategy. This proactive strategy consists in finding the optimal number of slots to meet the expected cluster demand over a temporal horizon. It does this by running a cluster simulation with an incoming workload that is forecast using a prediction model built from past cluster records, and choosing the number of slots that is best valued by a machine-learned utility function that models the administrator preferences. Therefore, this strategy proactively reshapes the cluster in accordance with its current and expected future demand.
At the beginning of every control interval, the cluster state is monitored so that all valid slot reconfiguration options are identified and tested in a simulation over a temporal horizon bound to the current control interval. The simulation takes as input: (1) a given slot reconfiguration option; (2) the current cluster status; and (3) the expected job arrivals in the current interval. The latter is forecast by generating a synthetic workload Monte Carlo simulation method with adjusted probability distributions of each of the three parameters that describe a job: its arrival delay after the previous job, its requested slots and its runtime. Every simulation result is then scored by a utility function implemented through a fuzzy model taking as input values the average waiting time of the jobs during the simulated temporal horizon, the slot count of the reconfiguration option, and the number of slots that were reconfigured as a result of implementing the reconfiguration. The chosen slot reconfiguration option is the one that scores the highest value in the aforementioned utility function.
The specific details on the proactive mechanism can be found in Reference [46].
5. Optimising Cluster Eco-Efficiency
As mentioned above, the first stage of the decision-making mechanism only determines how many slots should be available at any given time, but does not identify the precise compute nodes to be reconfigured. This translation is done at the second stage of the mechanism.
Hitherto, in the proposals of other authors as well as in ours, simple heuristics are used to sort the nodes according to a predetermined metric, such as the power efficiency of the node or the amount of time that has been active (see, for example, References [19,20,21,46]). Nevertheless, relying on simple heuristics derived from expert knowledge inherently limits the eco-efficiency of the node allocation stage, since they are not tailored to the specific underlying hardware of the cluster.
To improve the eco-efficiency of the node allocation stage, computational intelligence or soft computing techniques are leveraged to learn a custom priority function that can optimally rank the compute nodes according to their reconfiguration preference at any given time, accounting explicitly for the key hardware factors that drive the direct and indirect operating costs and environmental impacts of the cluster. In particular, genetic fuzzy systems [52] are used to elicit a knowledge base comprised of a set of fuzzy rules building a zero-order TSK model [51,53]. The input variables of this model are , and .
represents the power efficiency of the ith node, computed as the relation between the performance of the node (measured using a metric, for example the SPEC CPU benchmark [54]) and the average power consumption:
is the indirect cost of the ith node computed over the time lapse defined between the deployment of EECluster or beginning of the simulation (), and the current time at which a reconfiguration is to be performed ():
is the reconfiguration command, whether it consists in switching on or off a compute node:
The structure of the TSK fuzzy model: is as follows:
- if is and is and is then value
- if is and is and is then value
- if is and is and is then value
- if is and is and is then value
- if⋯then⋯
- if is and is and is then value
- if is and is and is then value
- if is and is and is then value
- if is and is and is then value
- if⋯then⋯
- if is and is and is then value
- if is and is and is then value
and are fuzzy sets with triangular memberships in the form of a fuzzy partition [51] of the domain of the variables “” and “”, respectively, and is a crisp set with only possible values (0 for switching off and 1 for switching on). are the weights of the R rules, with values in the interval, and depicting the priority of choosing the ith node for reconfiguration. Note that the partition has linguistic terms and has .
The priority value for the selection of the ith node at time is given by the defuzzification function computing the model output:
Finally, let , and be as defined in Section 4.1, let be the number slots currently executing a job, let be the optimal slot count issued by the first stage of the decision-making mechanism, let be the number of slots in the ith compute node and let be 1 if the ith node is executing a job and 0 otherwise. Then, the reconfiguration algorithm can be expressed as displayed in Algorithm 1. This algorithm makes a decision between switching on new nodes (“if” clause, Lines 3–9) or switching off unneeded nodes (“else” clause, Lines 11–17). The efficiency and the indirect cost of the nodes are computed on Lines 5 and 13 as mentioned in Equations (6) and (7), and the fuzzy rule-based system assigns a priority to each of the nodes according to its efficiency, its cost and the requested action (power on/off). On Lines 7–9, the nodes with the highest priority among those that are powered off are selected, and the reciprocal operation is performed on Lines 15–17, where the eligible nodes with highest priority are switched off.
| Algorithm 1 Node reallocation algorithm. |
| input:, , , , 1: if and then 2: if then 3: ▹ Power on slots 4: for each do 5: Compute and 6: 7: while do 8: Power on 9: 10: else if then 11: ▹ Power off slots 12: for each do 13: Compute and 14: 15: while and do 16: Power off 17: 18: else 19: Do nothing 20:else 21: Do nothing |
6. Learning Algorithm
The decision-making mechanism described to reshape the cluster resources is sufficiently flexible to meet the requirements and preferences of the administrator. Nevertheless, to achieve such compliance, the KBs and the parameters that rule the behaviour of the first and second stage must be tuned. According to the the description of these stages in the preceding sections, a valid EECluster policy adopting the reactive strategy in the first stage is defined by the following parameters:
and as follows if the proactive strategy is used:
Given that the large search space and the presence of multiple conflicting objectives render an exhaustive search infeasible, multiobjective evolutionary algorithms (MOEAs) are used to learn a set of non-dominated configurations (also known as Pareto-efficient frontier) for the decision-making mechanism from which the cluster administrator can select the preferred one.
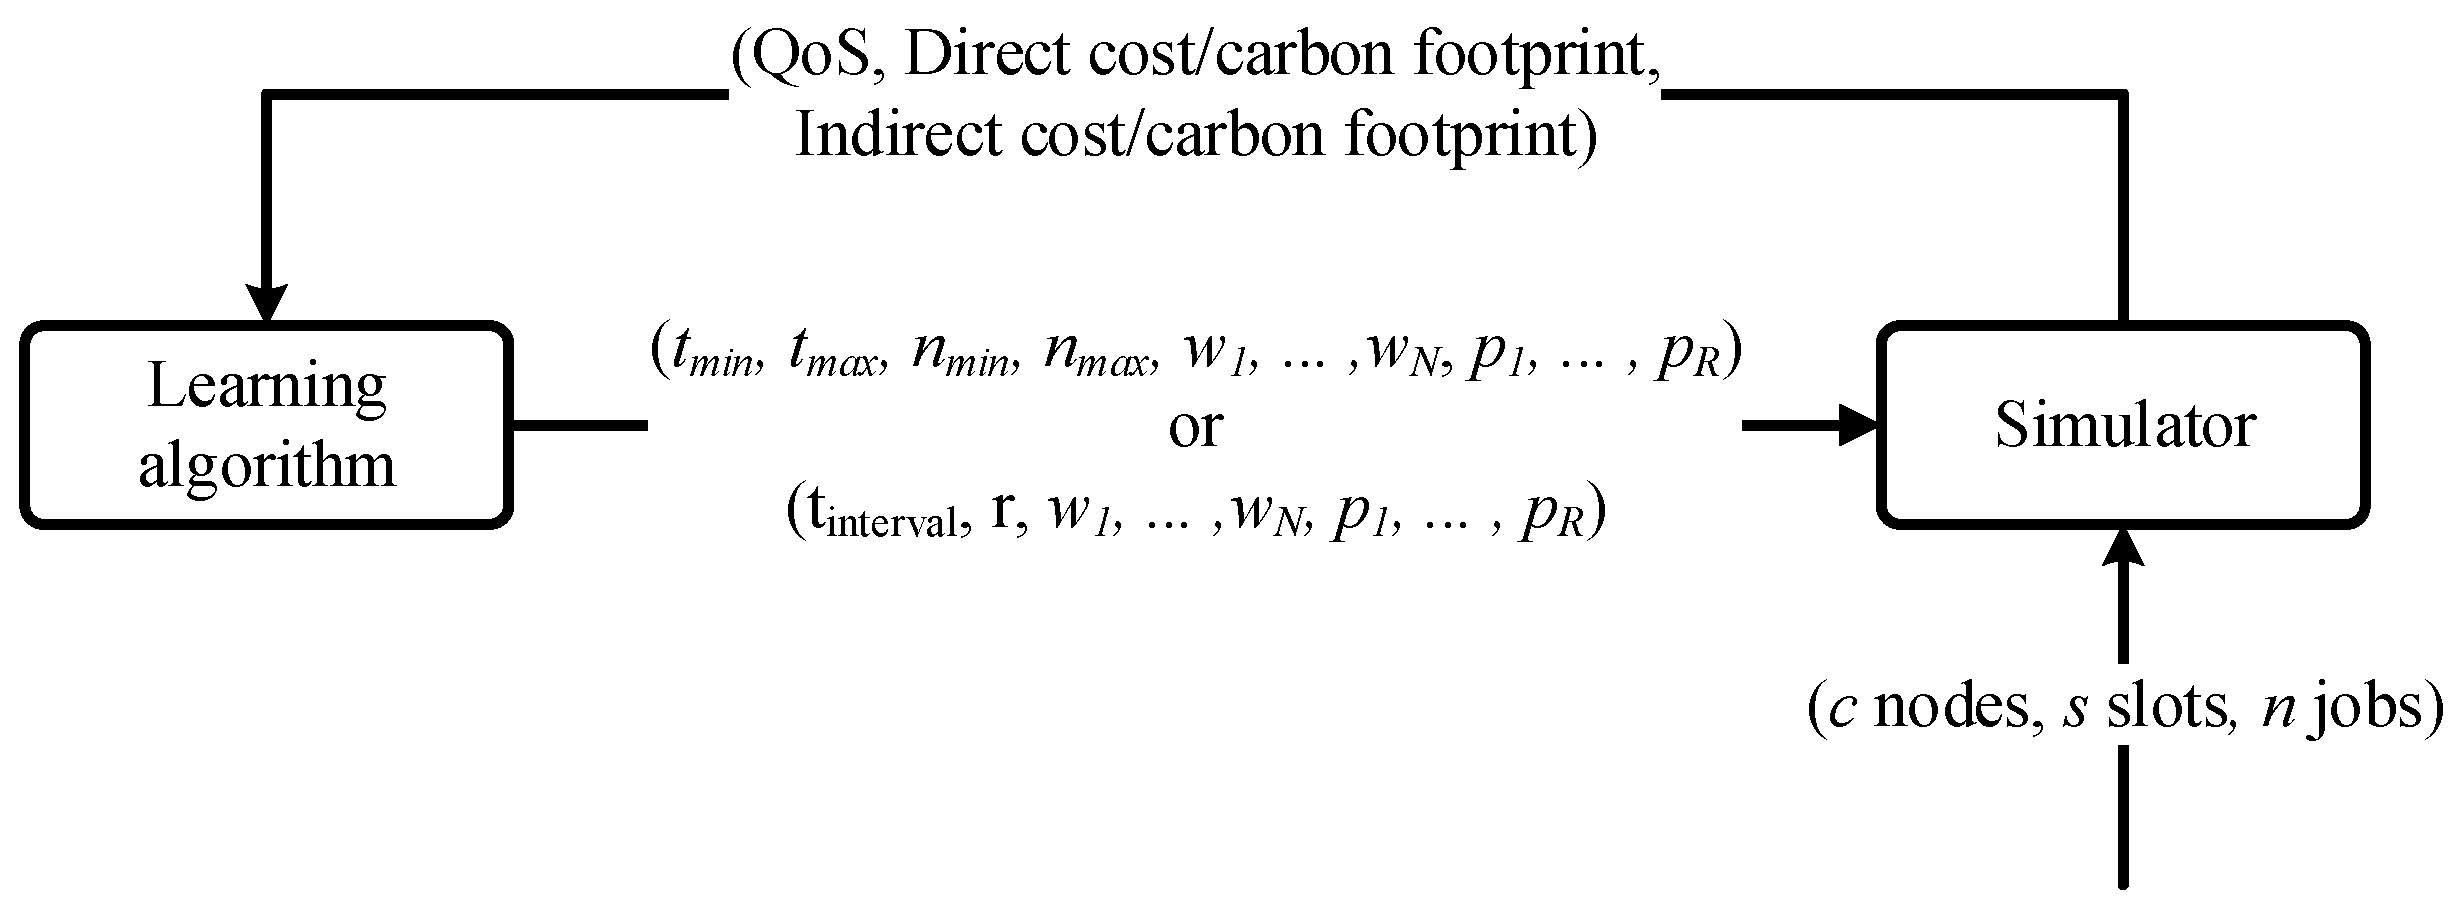
In particular, learning is done using the Non-Sorting Genetic Algorithm II (NSGA-II) [55] in a distal supervised learning approach [56], as shown in Figure 4. This is done by computing the fitness for each individual in the population (recall Equations (9) and (10)) by running a cluster simulation characterised by n jobs, s slots and c compute nodes, which play the role of the training set. The fitness function consists of three components: the quality of service (as defined in Equation (1)), the direct operating cost (using either Equation (2) or Equation (3)) and the indirect operating cost (using either Equation (4) or Equation (5)). The NSGA-II employed in the experiments described in Section 7 was the MOEA Framework [57] implementation using binary tournament selection with replacement, a population comprising 100 individuals, a maximum of 150,000 fitness evaluations and 64 seeds (random points of initialisation). The remaining parameters were assigned their default values in accordance to the MOEA Framework specifications.
It is also remarked that the membership functions used in either stage () are not adjusted, but uniform partitions are defined instead. The reason is to simplify the learning process given that using uniform partitions does not present a fundamental limitation since changes in the membership functions may be compensated by modifying the consequent of the rules.
7. Experimental Results
To evaluate the solution proposed for an improved compute node allocation in a real world environment, measuring its effect in terms of the eco-efficiency metrics defined in Section 2, an experiment was done simulating a reference 33-node cluster under different workloads to better assess its performance under different activity scenarios. These scenarios include both actual workloads from the Scientific Modelling Cluster of the University of Oviedo (CMS) (further information of this HPC cluster can be found at http://cms.uniovi.es) with a total of 2907 jobs spanned over 22 months and displaying frequent activity patterns in production HPCCs, and synthetically-generated workloads depicting four 24-month scenarios with an increasing degree of variation in the job arrival patterns. Specifically, the synthetic workloads were built from a series of jobs whose arrivals follow a Poisson process with the rates detailed in Table 1 and whose runtimes were exponentially distributed with a rate s. As for the hardware characteristics of the cluster, its nodes were characterised by the parameters detailed in Table 2. The hardware parameters used in the experiment were adopted from actual hardware characteristics of a subcluster at the CMS, as provided by its administrators, and were meant to represent the most frequent casuistic in real world clusters where there was a noticeable and overtime-growing heterogeneity in their computing equipment.
The same cluster simulator was used for both training and testing, and the fitness function used to assess each solution was composed of the QoS (Equation (1)), the direct operating monetary cost (Equation (2)), the indirect operating monetary cost (Equation (4)), the total monetary cost (sum of (Equations (2) and (4)), and the total carbon footprint (sum of Equations (3) and (5)).
Five different solutions were tested in the experiments to implement the node allocation algorithm (second stage of the decision-making mechanism), while sharing the same implementation for the first stage in the form of the reactive strategy described in Section 4.1. Note that it is not the point of these experiments to assess the results of the slot allocation, as this has already been tested in previous works (see [45,46,49]). In particular, four node-ordering heuristics proposed in Reference [19] were tested along with our proposal:
- An alphabetical node-ordering heuristic (labelled “Alphabetical heuristic”) consisting in selecting the nodes to switch on or off according to an alphabetical sort of the name of the node, powering off the nodes starting from the beginning of the list and powering on nodes starting from the end.
- A randomised node-ordering heuristic (labelled “Random heuristic”) consisting in randomly selecting the nodes to switch on or off.
- An efficiency-based node-ordering heuristic (labelled “Efficiency heuristic”) consisting in sorting the nodes to switch on or off according to a precomputed priority based on their power efficiency, as given by Equation (6), so that the least efficient nodes are powered off and the most efficient nodes are powered on.
- A balanced node-ordering heuristic (labelled “Balanced heuristic”) consisting in sorting the nodes according to the amount of time that each node has been active, so that the nodes that have been active for a longer period of time are powered off, and the nodes that have been inactive for longer are powered on.
- The GFS-based algorithm proposed in Section 5 (labelled “GFS-based allocation”) with three linguistic terms in the first partition () and two in the second one ().
All solutions were learnt using the learning algorithm described in Section 6, and the criteria adopted for selecting a single instance from the Pareto-efficient frontier consisted of choosing the one that achieved the lowest total monetary cost with no service quality impact (), as the overall goal was to minimise the operating cost of the cluster. The holdout method was used in all cases for validation, with a 50%–25%–25% split in training, validation and test, respectively.
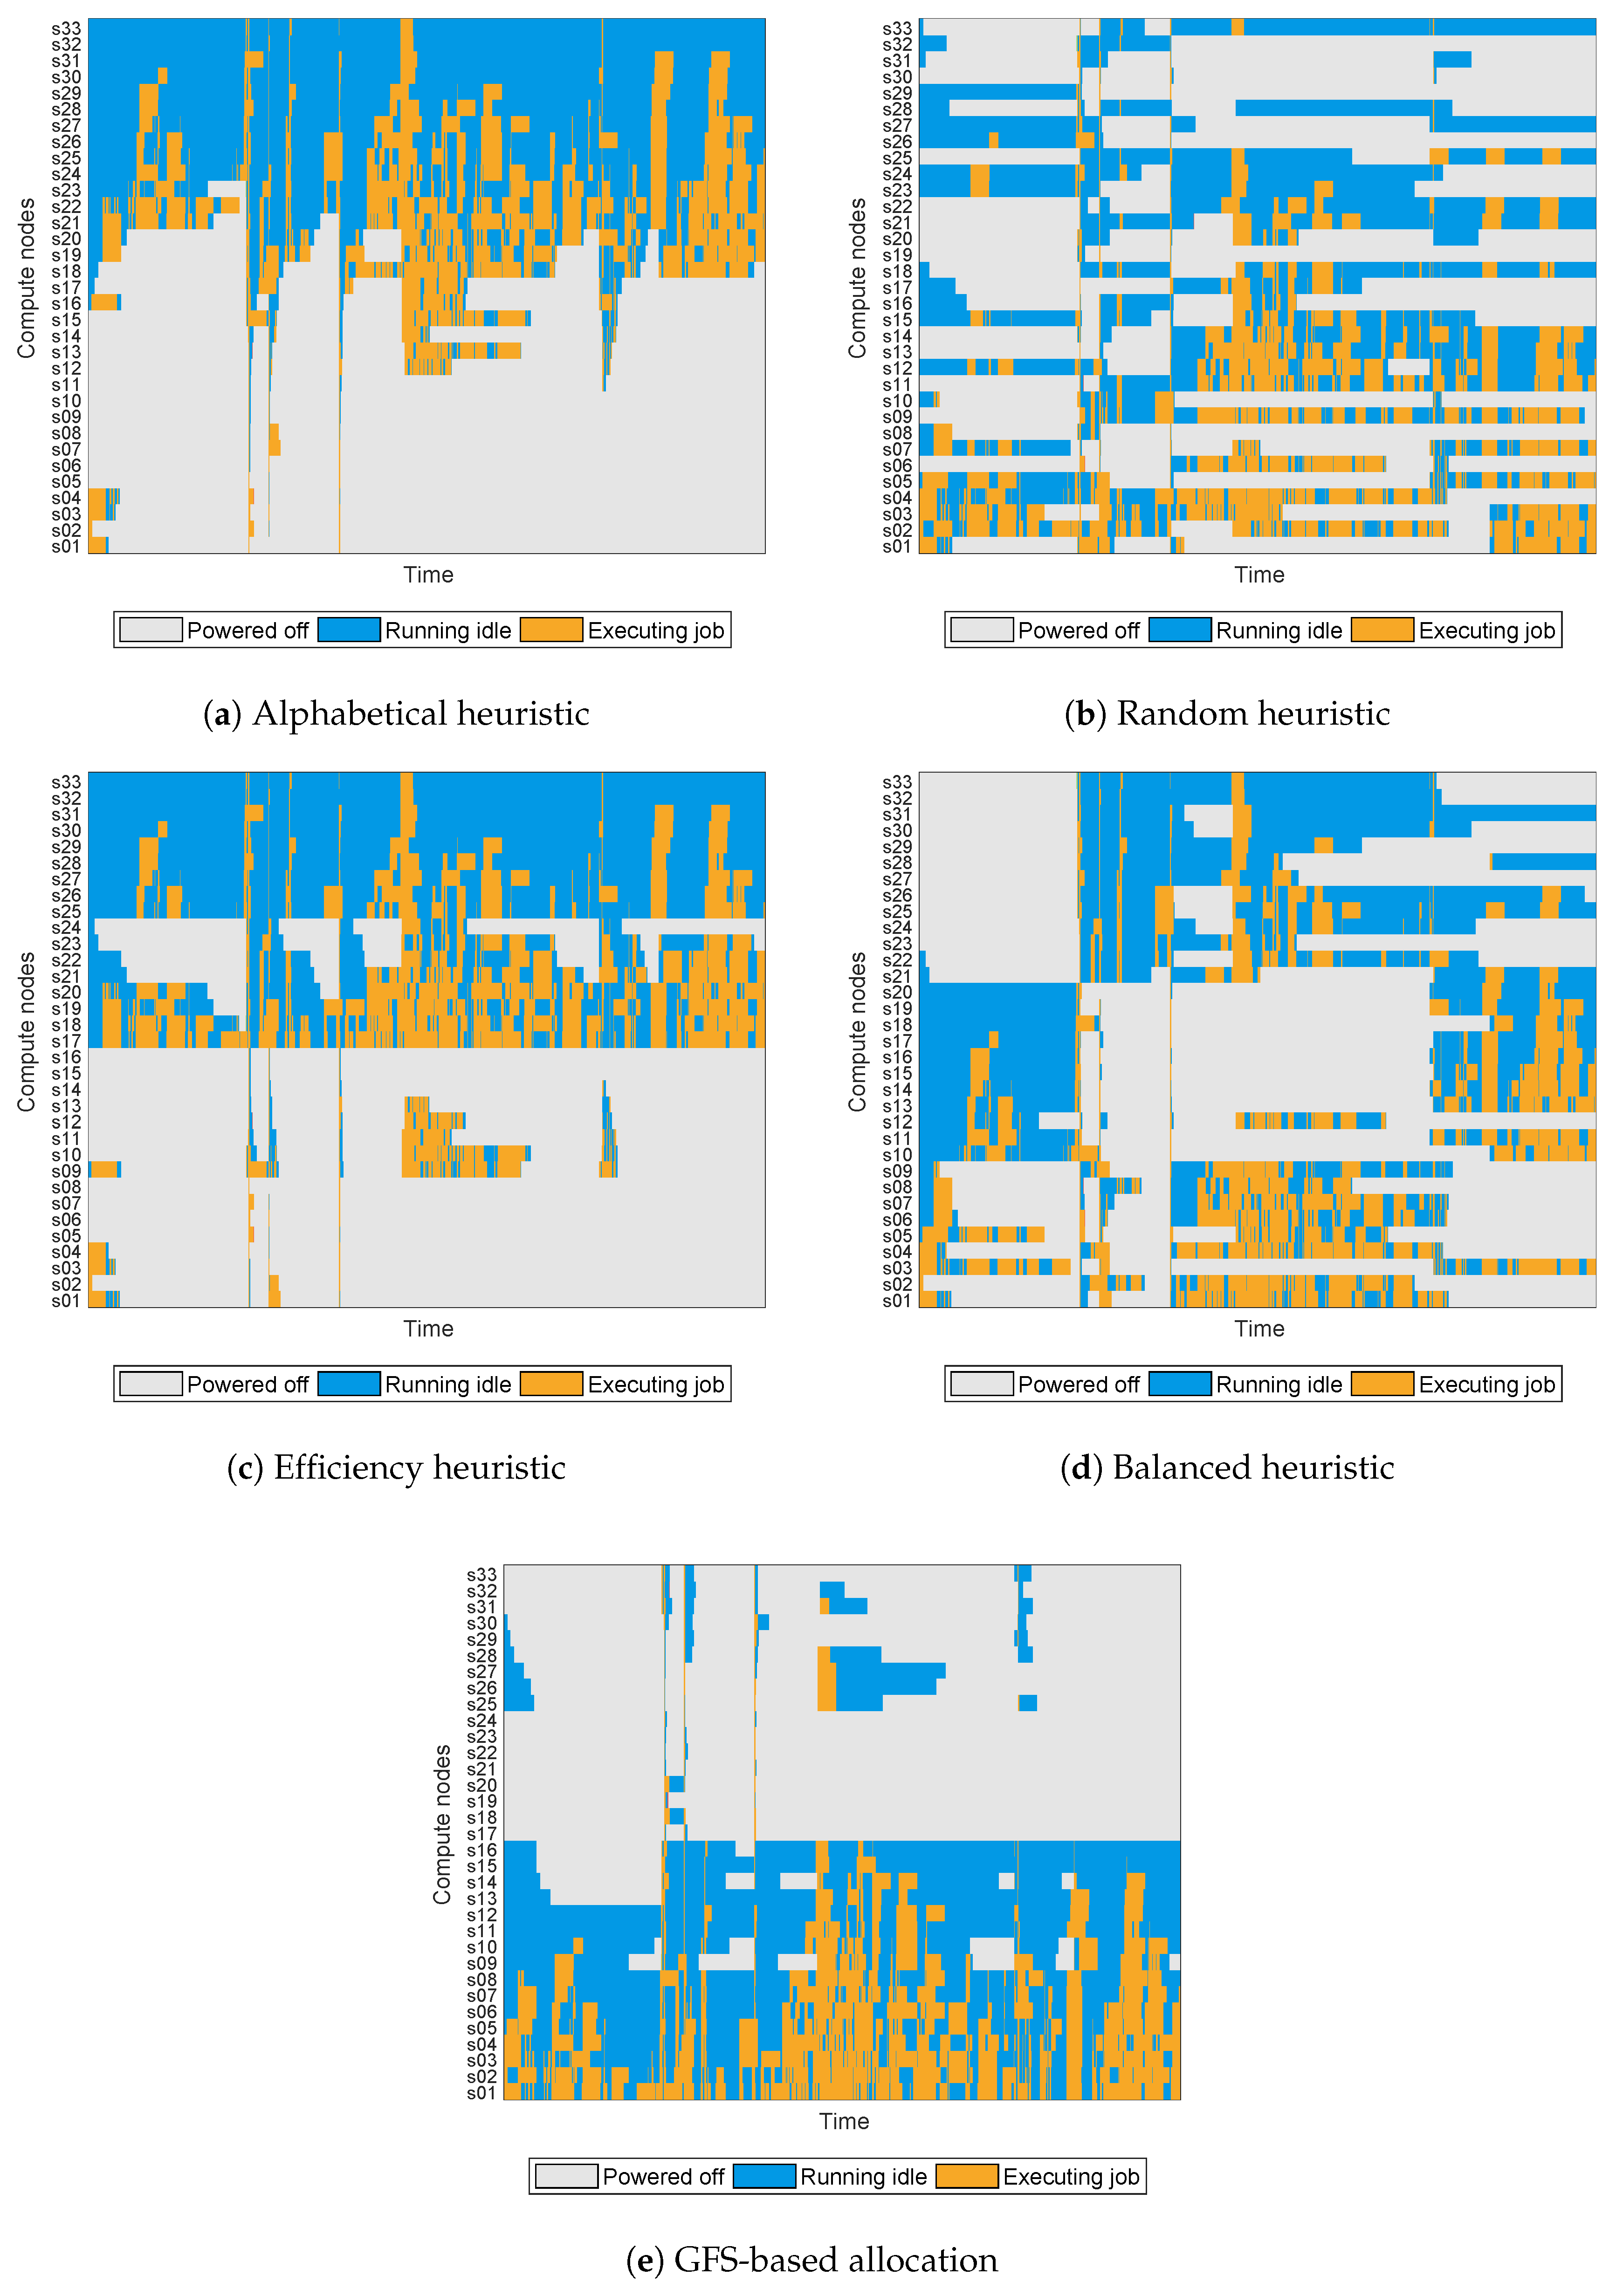
The experiment results obtained for the test set of each workload scenario are shown in the following tables. In particular, results for Scenario 1 are displayed in Table 3, Scenario 2 in Table 4, Scenario 3 in Table 5 and Scenario 4 in Table 6. Lastly, results for the recorded workloads of the CMS cluster are shown in Table 7 and Figure 5 presents the status over time for every node of the cluster under each tested solution. Given that all tested solutions achieved no penalty in service quality, QoS values are omitted in Table 3, Table 4, Table 5, Table 6 and Table 7 since all were equal to . Best results for each column are boldfaced.
As described in the experimental setup, the cluster includes a variety of nodes with different hardware characteristics in regard to their remaining useful life, expected failure rates and power consumptions. Right away, it can be appreciated that the latest nodes in the cluster were noticeably more power-efficient, and thus a lower direct operating cost should be expected if those nodes were used more often than the older ones. This was observed in the results of the experiments, where the “Efficiency heuristic” achieved the best direct operating costs, given that it consistently chose the newer nodes since those were most efficient ones. The “Alphabetical heuristic” also selected those nodes, albeit only due to the criteria used in the naming of the nodes, having the newer ones placed as the last resources of the cluster from an alphabetical standpoint. Nevertheless, these two heuristics were also the ones that incurred the highest indirect costs. The reason for this is that, although the baseline MTTF of the newer nodes was higher than that of the oldest ones, their longer remaining productive life penalised their indirect costs to a greater degree than it did the older nodes.
On the other hand, the “Random heuristic” and the “Balanced heuristic” both distributed the amount of active time among all nodes evenly, which led to increased direct costs compared to the other two heuristics because of using older nodes, but also reduced indirect costs, leading to overall better results in terms of total monetary cost and carbon footprint.
It is noteworthy that, with the exception of the “Efficiency heuristic”, which did take into account one key driver of the operating costs (the power consumption of the nodes), the other heuristics did not. In fact, none of them relied on any driver of the indirect costs to select the target nodes to reconfigure, which inherently limited the optimality of their node allocation decisions. Moreover, their lack of configuration parameters denied the opportunity to tune their behaviour to better match a certain hardware scenario. Given this, the GFS-based allocation algorithm achieved superior results in all workload scenarios by leveraging its tailored KB to better optimise the overall operating cost of the cluster. In particular, the GFS-based allocation exhibited in these experiments a tendency to select older nodes to minimise the replacement costs, as these have a greater influence in the total operating cost compared to the direct costs due to power consumption.
8. Concluding Remarks
Over the last years, many solutions have been proposed in response to the high operating costs and environmental impacts of HPCCs. It is well known that adaptive resource clusters are capable of reducing their power consumption whenever they are underused, thus improving the cost and carbon footprint derived from the cluster operation. Nevertheless, to provide a sound solution for eco-efficient HPCCs, both the direct and indirect costs must be addressed. Given so, a two-stage holistic optimisation mechanism has been designed to improve the eco-efficiency of HPCCs by jointly optimising both power-related and indirect life cycle-related costs and carbon footprints through a dynamic reallocation of its compute resources. The first stage defines the optimal amount of logical resources for the cluster at every given time, following either reactive or proactive strategies, while meeting all QoS-related preferences and/or constraints. The second stage translates the logical resources defined at the previous stage into a specific hardware reallocation decision, taking into account the efficiency and reliability of the equipment by means of a genetic fuzzy system modelling the hardware selection criteria. Both stages are learned through multiobjective evolutionary algorithms under the distal supervised learning setup. Experimental results based on both actual workloads from the Scientific Modelling Cluster of the University of Oviedo and synthetically-generated workloads provide empirical evidence of the eco-efficiency improvements achieved with the proposed mechanism in real world clusters.
Author Contributions
Conceptualisation, A.C.-F., L.S. and J.R.; Data curation, A.C.-F.; Formal analysis, A.C.-F. and E.S.J.G.; Funding acquisition, L.S. and J.R.; Investigation, A.C.-F. and E.S.J.G.; Methodology, A.C.-F. and L.S.; Project administration, L.S. and J.R.; Resources, L.S.; Software, A.C.-F. and J.R.; Supervision, L.S. and J.R.; Validation, A.C.-F. and J.R.; Visualisation, A.C.-F. and E.S.J.G.; Writing—original draft, A.C.-F. and E.S.J.G.; and Writing—review and editing, L.S. and J.R.
Funding
This research was funded by the Ministry of Economy, Industry and Competitiveness from Spain/FEDER under grants TIN2017-84804-R and RTI2018-098085-B-C44, and by the Regional Ministry of the Principality of Asturias under grant FC-GRUPIN-IDI/2018/000226.
Conflicts of Interest
The authors declare no conflict of interest.
Abbreviations
The following abbreviations are used in this manuscript:
| HPC | High Performance Computing |
| HPCCs | High Performance Computing Clusters |
| RMS | Resource Management System |
| OGE | Oracle Grid Engine/Open Grid Engine |
| SGE | Sun Grid Engine/Son of Grid Engine |
| PBS | Portable Batch System |
| TORQUE | Terascale Open-source Resource and QUEue Manager |
| QoS | Quality of Service |
| AFR | Annualised Failure Rate |
| SFR | Simulation Failure Rates |
| MTTF | Mean Time To Failure |
| DBMS | Database Management System |
| HGFS | Hybrid Genetic Fuzzy System |
| TSK | Tagaki–Sugeno–Kang |
| NSGA-II | Non-dominated Sorting Genetic Algorithm-II |
| MOEAs | MultiObjective Evolutionary Algorithms |
References
- Yeo, C.S.; Buyya, R.; Pourreza, H.; Eskicioglu, R.; Graham, P.; Sommers, F. Cluster Computing: High-Performance, High-Availability, and High-Throughput Processing on a Network of Computers. In Handbook of Nature-Inspired and Innovative Computing; Zomaya, A., Ed.; Springer: Boston, MA, USA, 2006; pp. 521–551. [Google Scholar] [CrossRef]
- Avgerinou, M.; Bertoldi, P.; Castellazzi, L. Trends in Data Centre Energy Consumption under the European Code of Conduct for Data Centre Energy Efficiency. Energies 2017, 10, 1470. [Google Scholar] [CrossRef]
- Ni, J.; Bai, X. A review of air conditioning energy performance in data centers. Renew. Sustain. Energy Rev. 2017, 67, 625–640. [Google Scholar] [CrossRef]
- Shehabi, A.; Smith, S.; Sartor, D.; Brown, R.; Herrlin, M.; Koomey, J.; Masanet, E.R.; Horner, N.; Azevedo, I.L.; Lintner, W. United States Data Center Energy Usage Report | Energy Technologies Area; Technical report; Environmental and Energy Impact Division, Lawrence Berkeley National Laboratory: Berkeley, CA, USA, 2016.
- Ebbers, M.; Archibald, M.; da Fonseca, C.F.F.; Griffel, M.; Para, V.; Searcy, M. Smarter Data Centers: Achieving Greater Efficiency; Technical report; IBM Redpaper: Research Triangle Park, NC, USA, 2011. [Google Scholar]
- The Economist Intelligence Unit. IT and the Environment a New Item on the CIO’s Agenda? Technical report; The Economist: London, UK, 2007. [Google Scholar]
- Whitehead, B.; Andrews, D.; Shah, A. The life cycle assessment of a UK data centre. Int. J. Life Cycle Assess. 2015, 20, 332–349. [Google Scholar] [CrossRef]
- Gartner. Gartner Estimates ICT Industry Accounts for 2 Percent of Global CO2 Emissions; Gartner: Stamford, CT, USA, 2007. [Google Scholar]
- EU Science Hub. Code of Conduct for Energy Efficiency in Data Centres. Available online: https://ec.europa.eu/jrc/en/energy-efficiency/code-conduct/datacentres (accessed on 31 May 2019).
- Google. Efficiency: How We Do It. Available online: https://www.google.com/about/datacenters/efficiency/internal/ (accessed on 31 May 2019).
- Amazon Web Services. AWS & Sustainability. Available online: https://aws.amazon.com/about-aws/sustainability/ (accessed on 31 May 2019).
- Facebook. Open Sourcing PUE/WUE Dashboards. Available online: https://code.fb.com/data-center-engineering/open-sourcing-pue-wue-dashboards/ (accessed on 31 May 2019).
- Pinheiro, E.; Bianchini, R.; Carrera, E.V.; Heath, T. Load Balancing and Unbalancing for Power and Performance in Cluster-Based Systems; Workshop on Compilers and Operating Systems for Low Power: Barcelona, Spain, 2001; Volume 180, pp. 182–195. [Google Scholar]
- Elnozahy, E.N.; Kistler, M.; Rajamony, R. Energy-efficient Server Clusters. In Proceedings of the 2nd International Conference on Power-Aware Computer Systems, Cambridge, MA, USA, 2 February 2002; Springer: Berlin/Heidelberg, Germany, 2003; pp. 179–197. [Google Scholar]
- Das, R.; Kephart, J.O.; Lefurgy, C.; Tesauro, G.; Levine, D.W.; Chan, H. Autonomic Multi-agent Management of Power and Performance in Data Centers. In Proceedings of the 7th International Joint Conference on Autonomous Agents and Multiagent Systems: Industrial Track, Estoril, Portugal, 12–16 May 2008; International Foundation for Autonomous Agents and Multiagent Systems: Richland, SC, USA, 2008; pp. 107–114. [Google Scholar]
- Berral, J.L.; Goiri, Í.; Nou, R.; Julià, F.; Guitart, J.; Gavaldà, R.; Torres, J. Towards energy-aware scheduling in data centers using machine learning. In Proceedings of the 1st International Conference on Energy-Efficient Computing and Networking—E-Energy ’10, Passau, Germany, 13–15 April 2010; ACM Press: New York, NY, USA, 2010; p. 215. [Google Scholar] [CrossRef]
- Lang, W.; Patel, J.M.; Naughton, J.F. On energy management, load balancing and replication. ACM SIGMOD Rec. 2010, 38, 35. [Google Scholar] [CrossRef]
- Cocaña-Fernández, A.; Rodríguez-Soares, J.; Sánchez, L.; Ranilla, J. Improving the energy efficiency of virtual data centers in an IT service provider through proactive fuzzy rules-based multicriteria decision making. J. Supercomput. 2019, 75, 1078–1093. [Google Scholar] [CrossRef]
- Dolz, M.F.; Fernández, J.C.; Iserte, S.; Mayo, R.; Quintana-Ortí, E.S.; Cotallo, M.E.; Díaz, G. EnergySaving Cluster experience in CETA-CIEMAT. In Proceedings of the 5th Iberian GRID Infrastructure conference, Santander, Spain, 8 June 2011. [Google Scholar]
- Alvarruiz, F.; de Alfonso, C.; Caballer, M.; Hernández, V. An Energy Manager for High Performance Computer Clusters. In Proceedings of the 2012 IEEE 10th International Symposium on Parallel and Distributed Processing with Applications, Leganes, Spain, 10–13 July 2012; pp. 231–238. [Google Scholar] [CrossRef]
- Kiertscher, S.; Zinke, J.; Gasterstadt, S.; Schnor, B. Cherub: Power Consumption Aware Cluster Resource Management. In Proceedings of the 2010 IEEE/ACM International Conference on Green Computing and Communications International Conference on Cyber, Physical and Social Computing, Hangzhou, China, 18–20 December 2010; pp. 325–331. [Google Scholar] [CrossRef]
- Cocaña-Fernández, A.; Sánchez, L.; Ranilla, J. A software tool to efficiently manage the energy consumption of HPC clusters. In Proceedings of the 2015 IEEE International Conference on Fuzzy Systems (FUZZ-IEEE), Istanbul, Turkey, 2–5 August 2015; pp. 1–8. [Google Scholar] [CrossRef]
- Hsu, C.H.; Kremer, U. The design, implementation, and evaluation of a compiler algorithm for CPU energy reduction. ACM SIGPLAN Not. 2003, 38, 38. [Google Scholar] [CrossRef]
- Hsu, C.H.; Feng, W.c. A Power-Aware Run-Time System for High-Performance Computing. In Proceedings of the ACM/IEEE SC 2005 Conference (SC’05), Seattle, WA, USA, 12–18 November 2005; p. 1. [Google Scholar] [CrossRef]
- Freeh, V.W.; Lowenthal, D.K.; Pan, F.; Kappiah, N.; Springer, R.; Rountree, B.L.; Femal, M.E. Analyzing the Energy-Time Trade-Off in High-Performance Computing Applications. IEEE Trans. Parallel Distrib. Syst. 2007, 18, 835–848. [Google Scholar] [CrossRef]
- Lim, M.; Freeh, V.; Lowenthal, D. Adaptive, Transparent Frequency and Voltage Scaling of Communication Phases in MPI Programs. In Proceedings of the ACM/IEEE SC 2006 Conference (SC’06), Tampa, FL, USA, 11–17 November 2006; p. 14. [Google Scholar] [CrossRef]
- Cheng, Y.; Zeng, Y. Automatic Energy Status Controlling with Dynamic Voltage Scaling in Power-Aware High Performance Computing Cluster. In Proceedings of the 2011 12th International Conference on Parallel and Distributed Computing, Applications and Technologies, Gwangju, Korea, 20–22 October 2011; pp. 412–416. [Google Scholar] [CrossRef]
- Ge, R.; Feng, X.; Feng, W.c.; Cameron, K.W. CPU MISER: A Performance-Directed, Run-Time System for Power-Aware Clusters. In Proceedings of the 2007 International Conference on Parallel Processing (ICPP 2007), Xi’an, China, 10–14 September 2007; p. 18. [Google Scholar] [CrossRef]
- Huang, S.; Feng, W. Energy-Efficient Cluster Computing via Accurate Workload Characterization. In Proceedings of the 2009 9th IEEE/ACM International Symposium on Cluster Computing and the Grid, Shanghai, China, 18–21 May 2009; pp. 68–75. [Google Scholar] [CrossRef]
- Chetsa, G.L.T.; Lefrvre, L.; Pierson, J.M.; Stolf, P.; Da Costa, G. A Runtime Framework for Energy Efficient HPC Systems without a Priori Knowledge of Applications. In Proceedings of the 2012 IEEE 18th International Conference on Parallel and Distributed Systems, Singapore, 17–19 December 2012; pp. 660–667. [Google Scholar] [CrossRef]
- Alonso, P.; Badia, R.M.; Labarta, J.; Barreda, M.; Dolz, M.F.; Mayo, R.; Quintana-Orti, E.S.; Reyes, R. Tools for Power-Energy Modelling and Analysis of Parallel Scientific Applications. In Proceedings of the 2012 41st International Conference on Parallel Processing, Pittsburgh, PA, USA, 10–13 September 2012; pp. 420–429. [Google Scholar] [CrossRef]
- Schubert, S.; Kostic, D.; Zwaenepoel, W.; Shin, K.G. Profiling Software for Energy Consumption. In Proceedings of the 2012 IEEE International Conference on Green Computing and Communications, Besancon, France, 20–23 November 2012; pp. 515–522. [Google Scholar] [CrossRef]
- Freeh, V.W.; Lowenthal, D.K. Using multiple energy gears in MPI programs on a power-scalable cluster. In Proceedings of the Tenth ACM SIGPLAN Symposium on Principles and Practice of Parallel Programming—PPoPP ’05, Chicago, IL, USA, 15–17 June 2005; ACM Press: New York, NY, USA, 2005; p. 164. [Google Scholar] [CrossRef]
- Li, D.; Nikolopoulos, D.S.; Cameron, K.; de Supinski, B.R.; Schulz, M. Power-aware MPI task aggregation prediction for high-end computing systems. In Proceedings of the 2010 IEEE International Symposium on Parallel & Distributed Processing (IPDPS), Atlanta, GA, USA, 19–23 April 2010; pp. 1–12. [Google Scholar] [CrossRef]
- Xian, C.; Lu, Y.H.; Li, Z. A programming environment with runtime energy characterization for energy-aware applications. In Proceedings of the 2007 International Symposium on Low Power Electronics and Design—ISLPED ’07, Portland, OR, USA, 27–29 August 2007; ACM Press: New York, NY, USA, 2007; pp. 141–146. [Google Scholar] [CrossRef]
- Bash, C.; Forman, G. Cool Job Allocation: Measuring the Power Savings of Placing Jobs at Cooling-efficient Locations in the Data Center. In Proceedings of the 2007 USENIX Annual Technical Conference on Proceedings of the USENIX Annual Technical Conference, Santa Clara, CA, USA, 17–22 June 2007; USENIX Association: Berkeley, CA, USA, 2007; pp. 291–296. [Google Scholar]
- Tang, Q.; Gupta, S.K.S.; Varsamopoulos, G. Energy-Efficient Thermal-Aware Task Scheduling for Homogeneous High-Performance Computing Data Centers: A Cyber-Physical Approach. IEEE Trans. Parallel Distrib. Syst. 2008, 19, 1458–1472. [Google Scholar] [CrossRef]
- Zong, Z.; Ruan, X.; Manzanares, A.; Bellam, K.; Qin, X. Improving Energy-Efficiency of Computational Grids via Scheduling. In Handbook of Research on P2P and Grid Systems for Service-Oriented Computing; Antonopoulos, N., Exarchakos, G., Li, M., Liotta, A., Eds.; IGI Global: Hershey, PA, USA, 2010; Chapter 22. [Google Scholar] [CrossRef]
- Zong, Z.; Nijim, M.; Manzanares, A.; Qin, X. Energy efficient scheduling for parallel applications on mobile clusters. Clust. Comput. 2007, 11, 91–113. [Google Scholar] [CrossRef]
- Guenter, B.; Jain, N.; Williams, C. Managing cost, performance, and reliability tradeoffs for energy-aware server provisioning. In Proceedings of the 2011 Proceedings IEEE INFOCOM, Shanghai, China, 10–15 April 2011; pp. 1332–1340. [Google Scholar] [CrossRef]
- Deng, W.; Liu, F.; Jin, H.; Liao, X.; Liu, H.; Chen, L. Lifetime or energy: Consolidating servers with reliability control in virtualized cloud datacenters. In Proceedings of the 4th IEEE International Conference on Cloud Computing Technology and Science Proceedings, Taipei, Taiwan, 3–6 December 2012; pp. 18–25. [Google Scholar] [CrossRef]
- Srinivasan, J.; Adve, S.V.; Bose, P.; Rivers, J.A. Lifetime reliability: Toward an architectural solution. IEEE Micro 2005, 25, 70–80. [Google Scholar] [CrossRef]
- Chen, Y.; Das, A.; Qin, W.; Sivasubramaniam, A.; Wang, Q.; Gautam, N. Managing Server Energy and Operational Costs in Hosting Centers. In Proceedings of the 2005 ACM SIGMETRICS International Conference on Measurement and Modeling of Computer Systems, Banff, AB, Canada, 6–10 June 2005; ACM: New York, NY, USA, 2005; pp. 303–314. [Google Scholar] [CrossRef]
- Xie, T.; Sun, Y. Sacrificing Reliability for Energy Saving: Is it worthwhile for disk arrays? In Proceedings of the 2008 IEEE International Symposium on Parallel and Distributed Processing, Miami, FL, USA, 14–18 April 2008; pp. 1–12. [Google Scholar] [CrossRef]
- Cocaña-Fernández, A.; Ranilla, J.; Sánchez, L. Energy-efficient allocation of computing node slots in HPC clusters through parameter learning and hybrid genetic fuzzy system modeling. J. Supercomput. 2014, 71, 1163–1174. [Google Scholar] [CrossRef]
- Cocaña-Fernández, A.; Sánchez, L.; Ranilla, J. Leveraging a predictive model of the workload for intelligent slot allocation schemes in energy-efficient HPC clusters. Eng. Appl. Artif. Intell. 2016, 48, 95–105. [Google Scholar] [CrossRef]
- National Science Foundation. Advisory Committee for Cyberinfrastructure Task Force on Grand Challenges; Technical report; National Science Foundation: Arlington, VA, USA, 2011.
- Hendrik, A.; Bidwell, V.R. Measuring Eco-Efficiency: A Guide to Reporting Company Performance; World Business Council for Sustainable Development: Geneva, Switzerland, 2000. [Google Scholar]
- Cocaña-Fernández, A.; Sánchez, L.; Ranilla, J. Improving the Eco-Efficiency of High Performance Computing Clusters Using EECluster. Energies 2016, 9, 197. [Google Scholar] [CrossRef]
- Cacheiro, J. Analysis of Batch Systems; Technical report; CESGA: Santiago de Compostela, Spain, 2014. [Google Scholar]
- Ishibuchi, H.; Nakashima, T.; Nii, M. Classification and Modeling with Linguistic Information Granules: Advanced Approaches to Linguistic Data Mining (Advanced Information Processing); Springer: Berlin/Heidelberg, Germany, 2004. [Google Scholar]
- Cordón, O.; Herrera, F.; Hoffmann, F. Genetic Fuzzy Systems: Evolutionary Tuning and Learning of Fuzzy Knowledge Bases; World Scientific: London, UK, 2001. [Google Scholar]
- Takagi, T.; Sugeno, M. Fuzzy identification of systems and its applications to modeling and control. IEEE Trans. Syst. Man Cybern. 1985, SMC-15, 116–132. [Google Scholar] [CrossRef]
- Standard Performance Evaluation Corporation. SPEC CPU® 2017. Available online: https://www.spec.org/cpu2017/ (accessed on 31 May 2019).
- Deb, K.; Pratap, A.; Agarwal, S.; Meyarivan, T. A fast and elitist multiobjective genetic algorithm: NSGA-II. IEEE Trans. Evol. Comput. 2002, 6, 182–197. [Google Scholar] [CrossRef] [Green Version]
- Jordan, M.; Rumelhart, D.E. Forward models: Supervised learning with a distal teacher. Cognit. Sci. 1992, 16, 307–354. [Google Scholar] [CrossRef]
- MOEA Framework, a Java Library for Multiobjective Evolutionary Algorithms. Available online: http://moeaframework.org/ (accessed on 31 May 2019).
Figure 1.
Resource management system components using only one master node.

Figure 2.
EECluster components overview.

Figure 3.
EECluster control cycle.

Figure 4.
EECluster distal supervised learning algorithm.

Figure 5.
Compute node status over time for the test set of the CMS workload.


Table 1.
Poisson process of job arrivals in each scenario.
| Scenario | Day of Week | Hour Range | Week of Year | Value |
|---|---|---|---|---|
| 1 | All | All | All | s |
| 2 | Monday–Friday | 8:00–20:00 | All | s |
| Satday–Sunday | 8:00–20:00 | All | s | |
| Monday–Sunday | 20:00–8:00 | All | s | |
| 3 | Monday–Friday | 8:00–20:00 | s | |
| s | ||||
| s | ||||
| s | ||||
| s | ||||
| Monday–Sunday | 20:00–8:00 | All | s | |
| Monday–Friday | 8:00–20:00 | All | s | |
| 4 | Monday–Friday | 8:00–20:00 | s | |
| s | ||||
| s | ||||
| s | ||||
| s | ||||
| Monday–Sunday | 20:00–8:00 | All | s | |
| Monday–Friday | 8:00–20:00 | All | s |
Table 2.
Hardware parameters of the compute nodes used in the simulation.
| Parameter/Node | Value | Unit | |||
|---|---|---|---|---|---|
| s01–s08 | s09–s16 | s17–s24 | s25–s33 | ||
| 0.15 | €/kWh | ||||
| 0.37 | kg /kWh | ||||
| Power at idle | 200 | 190 | 180 | 175 | Watts |
| Power at high load | 500 | 475 | 425 | 400 | Watts |
| 90 | 75 | 15 | 5 | % | |
| 3800 | 4200 | 5000 | 5500 | € | |
| 9536 | kg | ||||
| 109,500 | 146,000 | 219,000 | 292,000 | h | |
| 22 | °C | ||||
| 24 | °C | ||||
| 50 | °C | ||||
| 65 | °C | ||||
| 50 | °C | ||||
| 150 | € | ||||
| 238.41 | kg | ||||
| 4 | HDDs | ||||
| 146,000 | h | ||||
| f | 350 | times/month | |||
Table 3.
Experiment results for the test set of Scenario 1.
| Node-Selection Algorithm | Scenario 1 Test Set | |||
|---|---|---|---|---|
| Direct Cost | Indirect Cost | Total Cost | Carbon Footpr. | |
| (EUR) | (EUR) | (EUR) | (Mt ) | |
| Alphabetical heuristic | 6080.89 | 4086.56 | 10,167.45 | 22.70 |
| Random heuristic | 6349.58 | 3105.76 | 9455.34 | 21.72 |
| Efficiency heuristic | 6080.89 | 4065.68 | 10,146.57 | 22.67 |
| Balanced heuristic | 6305.56 | 3244.51 | 9550.07 | 21.83 |
| GFS-based allocation | 6471.63 | 2506.75 | 8978.39 | 20.92 |
Table 4.
Experiment results for the test set of Scenario 2.
| Node-Selection Algorithm | Scenario 2 Test Set | |||
|---|---|---|---|---|
| Direct Cost | Indirect Cost | Total Cost | Carbon Footpr. | |
| (EUR) | (EUR) | (EUR) | (Mt ) | |
| Alphabetical heuristic | 2680.29 | 2068.65 | 4748.94 | 10.31 |
| Random heuristic | 2929.01 | 1254.27 | 4183.28 | 9.64 |
| Efficiency heuristic | 2679.92 | 2062.77 | 4742.70 | 10.29 |
| Balanced heuristic | 2926.20 | 1251.53 | 4177.73 | 9.62 |
| GFS-based allocation | 3135.42 | 528.28 | 3663.70 | 8.94 |
Table 5.
Experiment results for the test set of Scenario 3.
| Node-Selection Algorithm | Scenario 3 Test Set | |||
|---|---|---|---|---|
| Direct Cost | Indirect Cost | Total Cost | Carbon Footpr. | |
| (EUR) | (EUR) | (EUR) | (Mt ) | |
| Alphabetical heuristic | 4685.53 | 2528.33 | 7213.86 | 16.28 |
| Random heuristic | 4835.08 | 1968.35 | 6803.43 | 15.71 |
| Efficiency heuristic | 4678.91 | 2530.06 | 7208.97 | 16.27 |
| Balanced heuristic | 4825.33 | 2017.22 | 6842.55 | 15.76 |
| GFS-based allocation | 4932.14 | 1555.20 | 6487.34 | 15.24 |
Table 6.
Experiment results for the test set of Scenario 4.
| Node-Selection Algorithm | Scenario 4 Test Set | |||
|---|---|---|---|---|
| Direct Cost | Indirect Cost | Total Cost | Carbon Footpr. | |
| (EUR) | (EUR) | (EUR) | (Mt ) | |
| Alphabetical heuristic | 4494.20 | 2442.23 | 6936.43 | 15.64 |
| Random heuristic | 4649.38 | 1837.98 | 6487.36 | 15.00 |
| Efficiency heuristic | 4493.77 | 2442.15 | 6935.92 | 15.64 |
| Balanced heuristic | 4647.97 | 1890.62 | 6538.60 | 15.09 |
| GFS-based allocation | 4710.18 | 1515.60 | 6225.78 | 14.60 |
Table 7.
Experiment results for the test set of the CMS cluster workloads.
| Node-Selection Algorithm | CMS Cluster Test Set | |||
|---|---|---|---|---|
| Direct Cost | Indirect Cost | Total Cost | Carbon Footpr. | |
| (EUR) | (EUR) | (EUR) | (Mt ) | |
| Alphabetical heuristic | 2760.07 | 1927.10 | 4687.17 | 10.29 |
| Random heuristic | 2975.89 | 1129.52 | 4105.41 | 9.54 |
| Efficiency heuristic | 2759.22 | 1920.07 | 4679.29 | 10.28 |
| Balanced heuristic | 2952.79 | 1242.47 | 4195.26 | 9.65 |
| GFS-based allocation | 3084.11 | 615.89 | 3700.00 | 8.94 |
© 2019 by the authors. Licensee MDPI, Basel, Switzerland. This article is an open access article distributed under the terms and conditions of the Creative Commons Attribution (CC BY) license (http://creativecommons.org/licenses/by/4.0/).
Share and Cite
MDPI and ACS Style
Cocaña-Fernández, A.; San José Guiote, E.; Sánchez, L.; Ranilla, J. Eco-Efficient Resource Management in HPC Clusters through Computer Intelligence Techniques. Energies 2019, 12, 2129. https://doi.org/10.3390/en12112129
AMA Style
Cocaña-Fernández A, San José Guiote E, Sánchez L, Ranilla J. Eco-Efficient Resource Management in HPC Clusters through Computer Intelligence Techniques. Energies. 2019; 12(11):2129. https://doi.org/10.3390/en12112129
Chicago/Turabian StyleCocaña-Fernández, Alberto, Emilio San José Guiote, Luciano Sánchez, and José Ranilla. 2019. "Eco-Efficient Resource Management in HPC Clusters through Computer Intelligence Techniques" Energies 12, no. 11: 2129. https://doi.org/10.3390/en12112129
Note that from the first issue of 2016, this journal uses article numbers instead of page numbers. See further details here.