Design of the Smart Grid Architecture According to Fractal Principles and the Basics of Corresponding Market Structure


TU Wien—Institute of Energy Systems and Electrical Drives, 1040 Vienna, Austria
Energies 2019, 12(21), 4153; https://doi.org/10.3390/en12214153
Submission received: 7 October 2019
/
Revised: 25 October 2019
/
Accepted: 28 October 2019
/
Published: 31 October 2019
(This article belongs to the Special Issue Advanced Approaches, Business Models, and Novel Techniques for Management and Control of Smart Grids)
Abstract
:Nowadays, there is a dramatic upsurge in the use of renewable energy resources, ICT and digitalization that requires more than the straightforward refinements of an established power system structure. New solutions are required to perform dynamic optimizations in real time, closed loops and so on, taking into account the high requirements on data privacy and cyber security. The LINK-paradigm was designed to meet these requirements. It was developed on the basis of the bottom-up method that can lead to misinterpretations or wrong conclusions. This work mainly deals with the verification of the authenticity and correctness of LINK. Fractal analysis is used to identify the unique and independent elements of smart grids required for the design of an architectural paradigm. The signature of the fractal structure, the so-called fractal pattern, is founded and referred to as electrical appliances (ElA). The latter has proven to be the key component of the architectural LINK paradigm. The definition of the LINK paradigm is finally validated: It consists of unique and independent elements that avoid misinterpretation or the need for any changes in its definition. Additionally, the fractal analysis indicates two fractal anomalies in the existing power system structure, while the fractal dimension calculation insinuates the highest complexity in the fractal level of electrical devices. The LINK-based holistic architecture is given a finishing touch. A compact presentation of the control chain strategy is provided that should facilitate its practical implementation. The basis for the harmonization of the market structure with the grid link arrangements is established. The processes of demand response and conservation voltage reduction are presented under the new findings.
1. Introduction
In the last 15 years many papers and books developed to investigate and design smart grids have been written. For the most part, concepts are introduced and various models are developed that lead to extremely ramified and complex schemas. Various projects are focused on certain parts of power systems without considering the integrity of smart grids. As a result, all efforts remain to the level of prototypes or isolated model regions.
So, what is the problem? “An extremely diverse and complex topic” is the answer. “... Each time we get into this logjam of too much trouble, too many problems, it is because the methods that we are using are just like the ones we have used before …” teaches us Richard Feynman, the greatest [1]. This means the problem may be in is in the origin, in the definitions of the circulating smart grid concepts. Without elaborate concepts or paradigms characterized by unique and independent elements, serious design flaws and unclear operating procedures may result [2].
1.1. Literature Review on the Popular Concepts of Smart Grids
The traditional structure of power systems became questionable at the beginning of the liberalization; the market rules overcome the technical. Several blackouts and electricity crises were the consequence [3]. After the blackout that plagued the United States and Canada, on August 14th 2003, the term “smart grid” was introduced. It was mostly related to the increase of the transmission capacity and level of automation in the grid [4]. The electricity crisis in California (2000–2001) gave the rise of distributed generation (DG) a major boost [5]. The installation of the small photo voltaic (PV) plants on house roofs transformed consumers during the day into electricity producers. A new category of customers appeared: The prosumers. The meaning of the term smart grids have evolved and now stands for the modernization of power systems and meeting all the requirements of the time. According to [6], the scope of smart grids covers the entire power system (high, medium and low voltage level, HV, MV and LV, respectively) right down to the individual electrical appliances in customer plants (CP).
The need to design smart grids has brought onstage various smart grid concepts: Virtual power plants (VPP), microgrids, cellular approach (CA), web of cells (WoC).
The VPP concept as an aggregation of a number of distributed generators (DG) was first introduced in 2001 [7,8] to enable their participation in the electricity market. It soon turned out that an adaptation was necessary to take into account the voltage and frequency performance [9]. VPP optimization focuses on internal energy dispatch and external market participation [10]. The definition of VPP, in particular its technical aspect, continues to be in discussion [11,12,13,14]. The basic cell controller architecture [15] uses the VPP concepts. It has a layered control hierarchy that uses distributed agent technology. It defines three control modules: Local, regional and enterprise, requiring a tremendous amount of data to be exchanged between its modules [16]. Market researches focus on details of how they function, such as the development of different participation models in the balancing market [17] or the provision of secure market products [18], but not on the harmonization of the market structure with the power grid architecture.
Microgrids were developed with a focus on the technical issues of DG integration [19,20]. They lead to very complex architectures, setting the microgrids, nanogrids, etc., according to the Matryoshka-doll principle [21]. The detailed definition of microgrids is still under discussion in technical forums [22]. It focuses on distribution level and includes non-unique and undefined elements. “Load” is an important component of the microgrid definition that according to [23] has an ambiguous meaning. It can present the consumption of a device, a part of the grid or the total active and/or reactive power consumed by all devices of the power system. The scope of “the host power system” is undefined. All this complicates the definition of the size of microgrids and consequently the design of clear and standardized structures. The lack of a definitive definition gives to any project or initiative the opportunity to adapt the basic definition to their specific needs and develop individual processes. The latter cannot guarantee financial revenue streams, cannot be reliably audited, impedes pooling of multiple microgrid projects into a financial asset class and does not allow for wide-spread and attractive microgrid and distributed energy resource project deployment, [24].
CA can be seen as an attempt to further develop the microgrid concept taking into account the distribution and transmission grid. It is a self-controlled small microgrid, which is integrated with a modular smart grid ICT infrastructure [25]. The CA-architecture is based on five different energy cell types: Residential, commercial and industrial-plant, -area and –park. The distribution grid is considered through “connection corridors” while the transmission grid through “transmission corridors” [26,27].
WoC is the latest concept introduced into the landscape of the smart grid concepts. The cell definition has evolved very dynamically in a short time [28,29,30,31,32], is generic and does not appear unique in the literature [31,32]. In the cell-based decentralized control framework WoC, cells are defined as “non-overlapping topological subsets of a power system associated with a scale-independent operational responsibility” [31] without specifying the criteria for the practical definition of its size. The design of market structure is handled separately, not in combination with the technical architecture to enable their harmonization [32,33,34]. There are also attempts to design the architecture of smart grids without using a particular concept [35,36].
As a result all architectures based on the VPP, microgrids or their combinations with VPP, CA and WoC are very complex and hardly practicable. The harmonization of the technical smart grid architectures with the market structures does not seem to be in focus yet.
An ultra-large scale comprehensive control framework is needed to avoid the growing and unmanageable patchwork of grid implementations that are not sustainable on a large scale [37]. LINK-paradigm enables the holistic consideration of the power system (HV, MV and LV levels) and CP [38] and of the market [39]. However, it was developed on the basis of the bottom-up method that can lead to misinterpretations or wrong conclusions. The goal of this paper is the verification of the authenticity and correctness of LINK. The identification of unique and independent construction elements of smart grids is done using fractality principles.
1.2. Literature Review on the Use of Fractal Analysis in Smart Grids
In the past few years, fractality is increasingly being used to describe complex structures in nature [40]. It has recently been considered as a useful tool for analyzing, understanding and designing smart grids. According to [41] the scale-invariant properties of power grids are due to their design. Self-similarity is already identified in load flow characteristics [42,43], power demand behaviour [44], fault diagnostics [45,46], and protective relays [47,48]. Similarities have also been discovered in blackouts of interconnected power grids and their sub grids [49]. Fractal principles have been studied in grid structures and fractal dimensions have been calculated for different grids [50,51] to develop a cluster power system philosophy with cluster network structure [52,53]. Other authors have organized a smart grid based on a fractal model and have associated it with the holonic concept and holarchy [54]. Others consider fractals as an instrument that facilitates the realization of smart grids in a decentralized fashion [55]. However, the identification of a fractal pattern describing smart grids in its entirety has not yet been a research focus.
Section 2 gives an overview of the methodology used in this work. The in-depth investigation of the fractality features throughout the smart grid structure, including the calculation of fractal dimension, is presented in Section 3.1. The identified signature of the fractal structure, the so-called fractal pattern, in smart grids constitutes the foundation of the LINK-paradigm and of the holistic model, described in Section 3.2. Section 3.3 presents the holistic architecture and some applications of the LINK-solution, including a compact presentation of the control chain strategy and some applications as the harmonization of the technical architecture with the market structure, demand response, etc. Finally, some concluding remarks are summarized.
2. Methodology
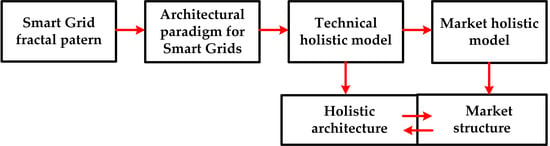
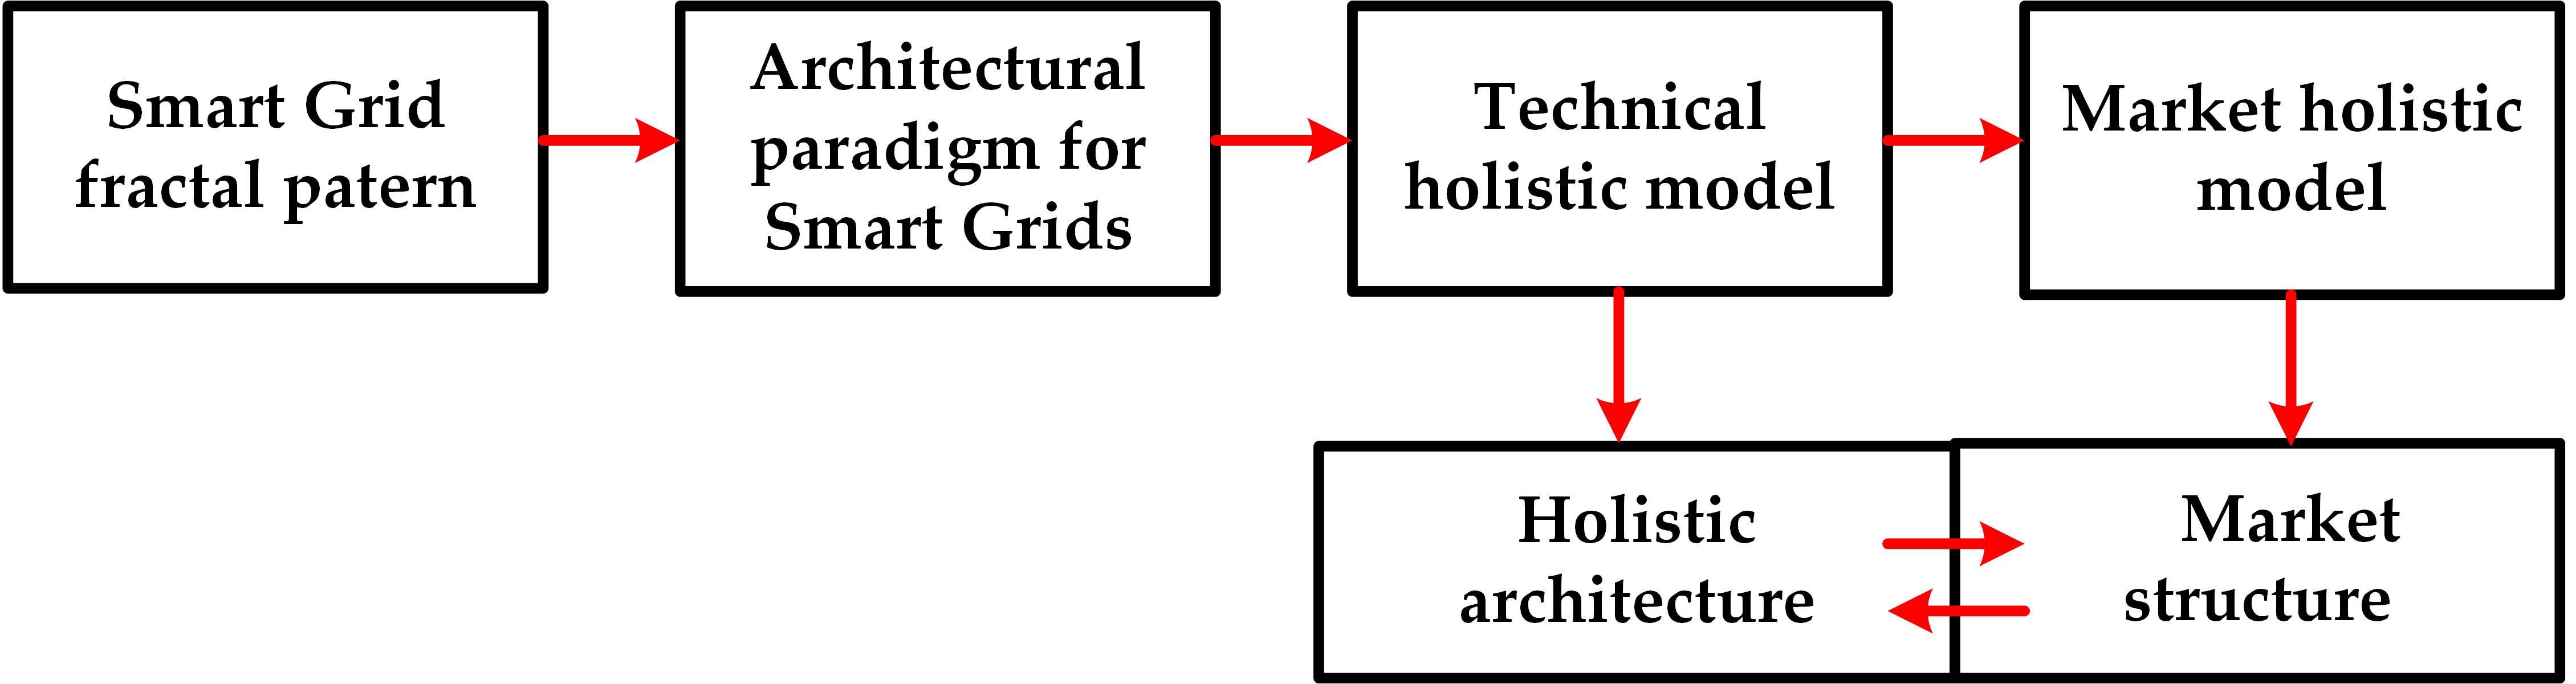
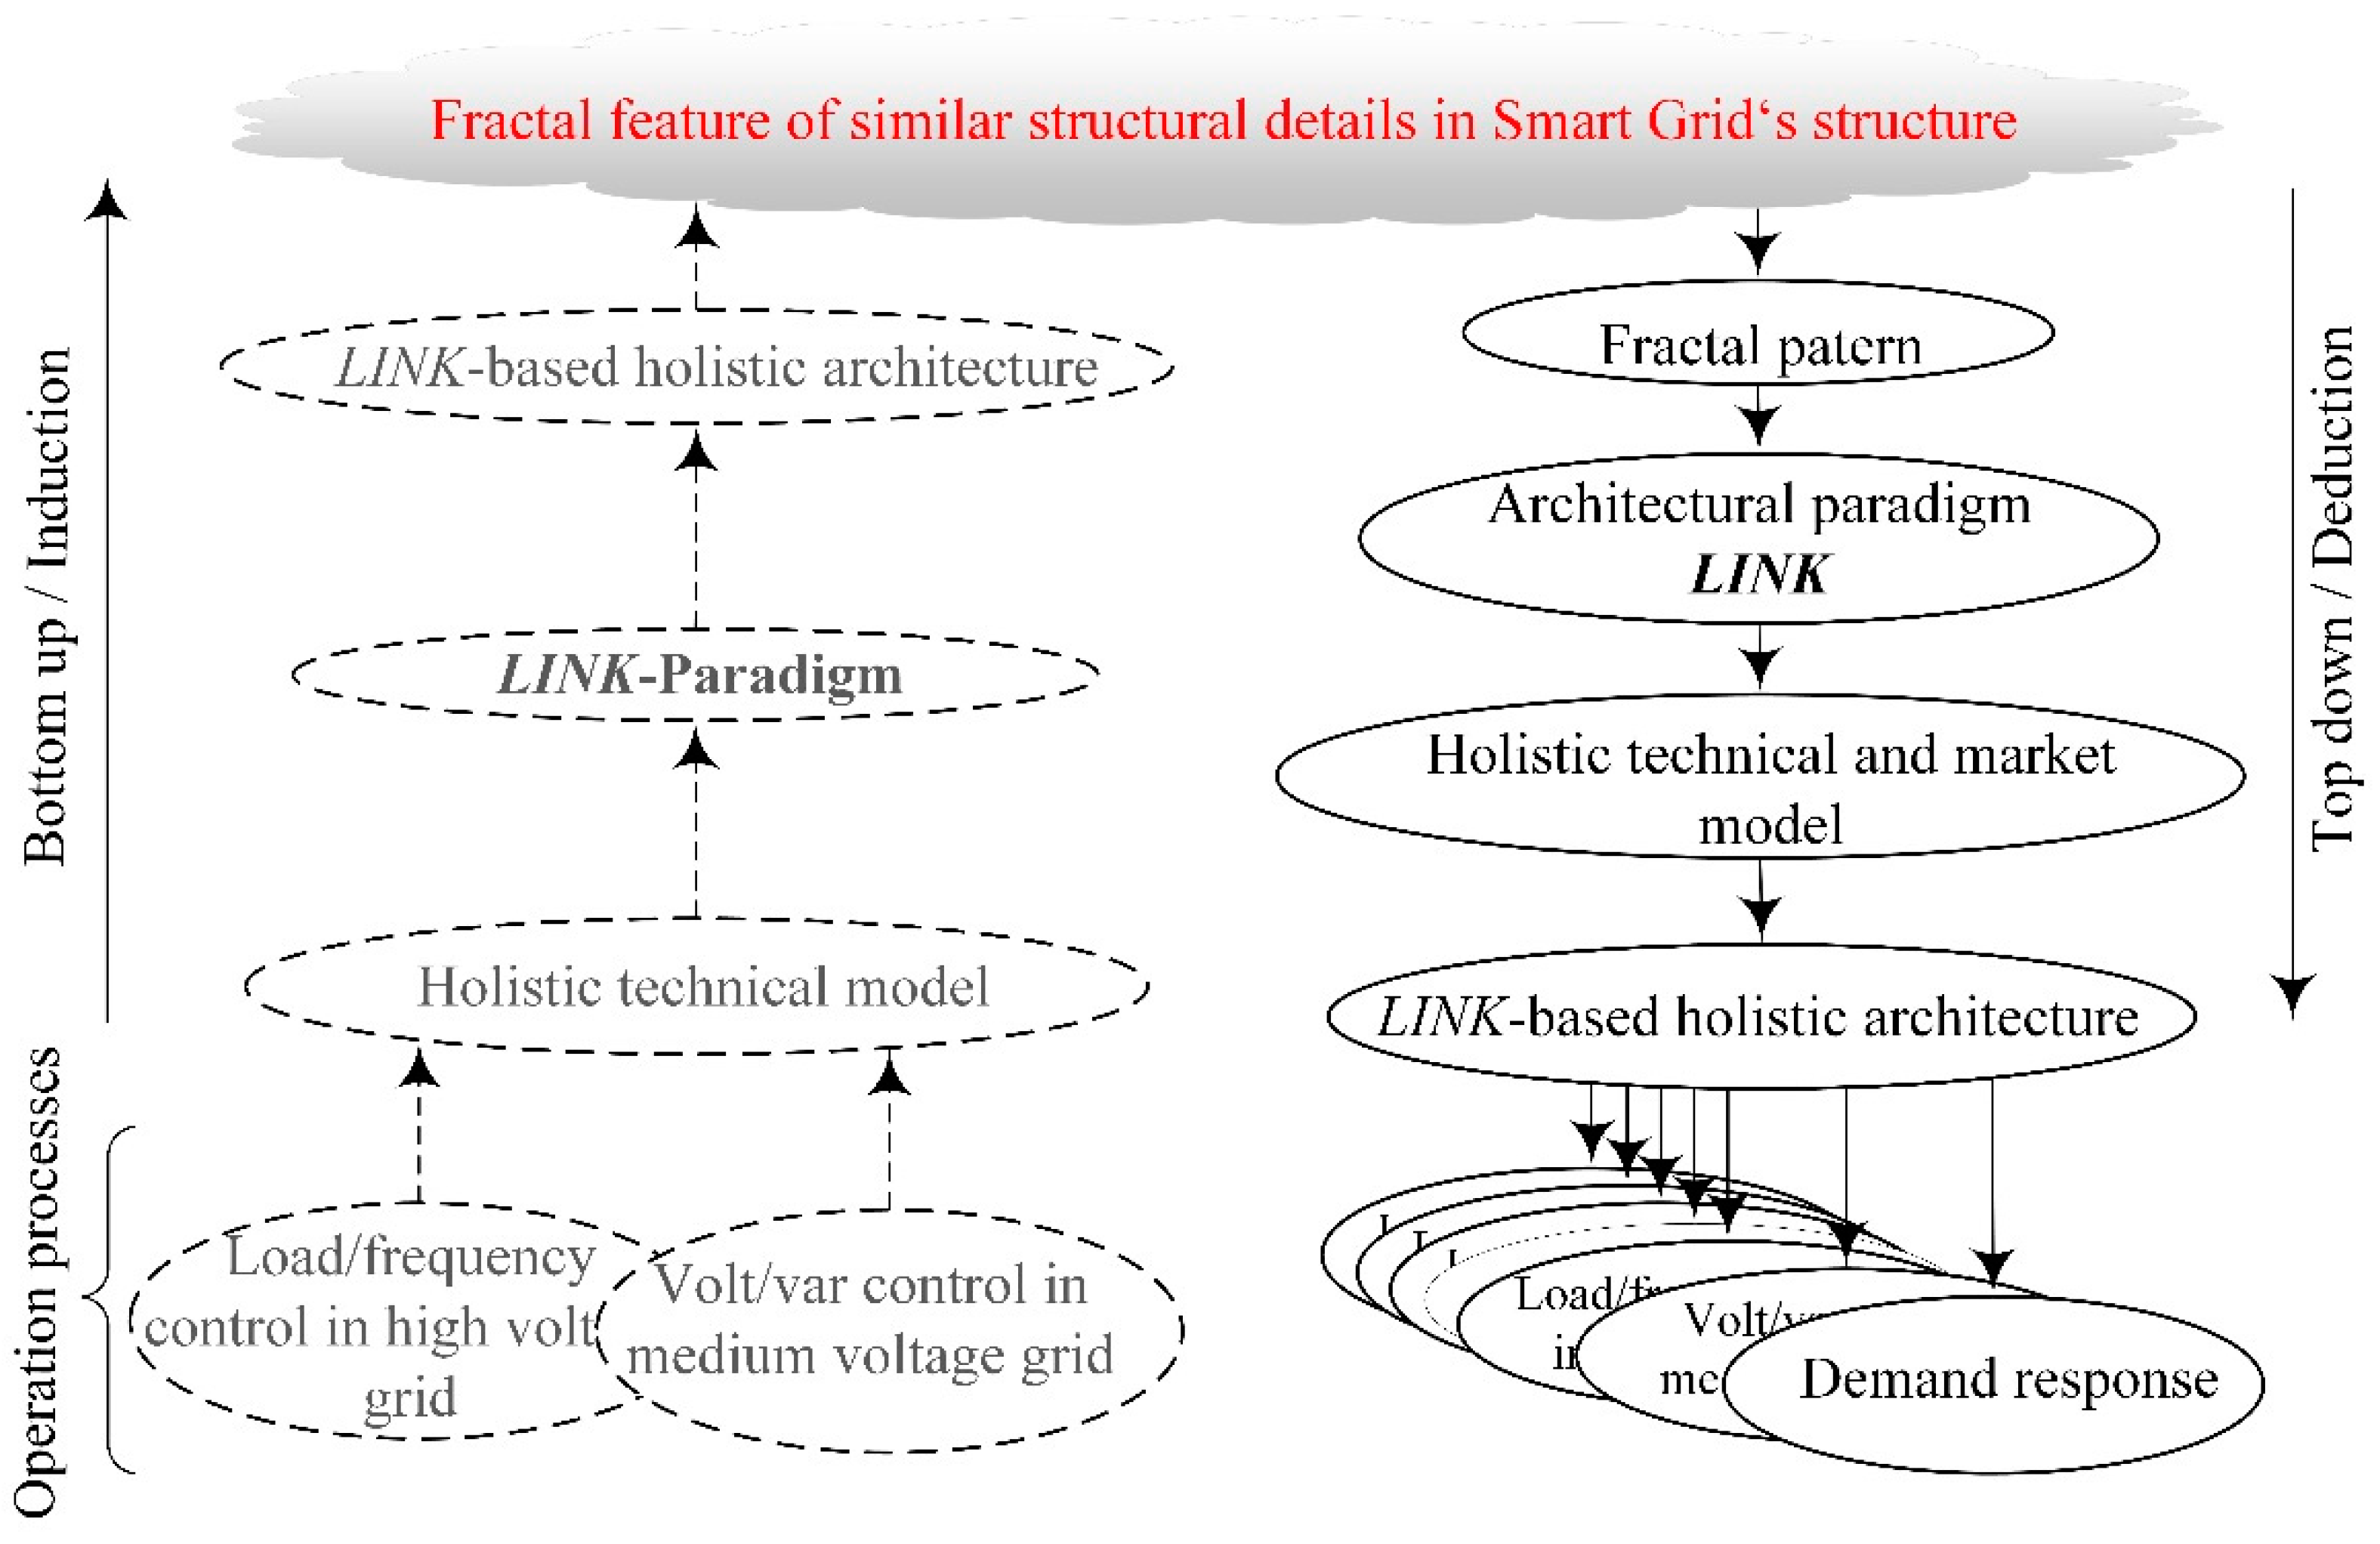
Figure 1 shows the methodology used to design the smart grid architecture. In the first phase a superordinate connection between some well-known operation processes as “volt/var control in medium voltage grids” was established and the holistic technical model was predicted [38]. According to the prediction, the holistic technical model should include the entire power system, i.e., high, medium and low voltage levels and the customer plants. The bottom-up or induction method was initially used to derive the paradigm of smart grids “LINK” and the corresponding holistic architecture. The latter have shown the fractality feature of similar structural details.
The definition of the architectural paradigm of smart grids should be clear and contain unambiguous elements so that experts or users cannot make different interpretations [2]. Since misinterpretations or wrong decisions are preprogrammed in the bottom-up method, the top-down or the deduction method is used to verify the authenticity of the paradigm LINK and to exclude any suspicion or misinterpretation. After a detailed analysis, the fractal pattern of smart grids is revealed. The architectural LINK-paradigm is confirmed: Among others, it consists of the fractal pattern. Thereafter, the holistic technical and market model and the LINK-based holistic architecture have been given a finishing touch. The new architecture enables the description and realization of all processes required for the operation of smart grids, such as demand response, load/generation balance and so on.
3. Results
3.1. Fractality in Smart Grids
Fractals are constructs characterized by a cascade of similar structural details that appear on all levels [40]. The cascade is never-ending in theoretical mathematical cases. However, in our study, we are restricted to an ending cascade starting with the highest voltage level and ending with the customer device level, as shown in Table 1. This means that we consider the power system holistically, regardless of the voltage levels, equipment sizes and technologies used.
3.1.1. Fractal Pattern
The fractal of the entire power system (including the customer devices sporadically connected to the mains) is conceived as five fractal levels shown in Table 1. To effectively meet the ever-increasing demand for electricity, power engineers have designed and developed power systems based on different voltage levels. The electrical appliances connected in each of the three voltage levels, high, medium and low (HV, MV and LV, respectively) grids, are contained in fractal levels 1, 2 and 3, respectively. The electrical appliances connected in the CP grid correspond to level 4. Level 5 takes into account all internal elements of the electrical devices that are connected by wires/conducting media. Power system appliances are categorized in two groups: The grid itself and active power appliances (APAs).
The grid is a construction that provides the connections amongst the points of power production and consumption. The relevant grid elements are wires, transformers and reactive power devices (RPDs) [56]. It is a fact that power, whether using alternating or direct current, needs wires to conduct it from the point of production to one of consumption. Thus, conductors are present in all fractal levels. In level 1, the high voltage level, they are called lines, while in the medium and low voltage levels, levels 2 and 3, they are more commonly referred to as feeders. High voltage lines are the longest, ranging from 100 to 2000 km. The world’s longest power transmission line is the 600 kV direct current Rio Madeira transmission link in Brazil [57], with a length of 2385 km. Feeders in medium voltage grids are long, ranging from a few km to 70 km, while in low voltage grids they are short and range between several tens of meters and two kilometers. The CPs included in level 4 have short wires installed in building walls. They range between a few to several tens of meters.
Electrical devices connected to the customer plant grid have internal small/tiny wires that range from a few to several tens of centimeters. Thus, as the fractal level increases, the wire length decreases. The same trend also characterizes the wire diameters. The wire length and diameter repeatedly become smaller in the branches from level 1 upwards. Thus, wires are constructs that repeat themselves at progressively smaller scales.
The use of different voltage levels in the power system design dictated the introduction of transformers as connecting elements. Very large, large and medium sized transformers are used in HV, MV and LV (or fractal levels 1, 2 and 3), respectively. Transformers do not exist at the CP level, the gray elements in Table 1. Thus, the fractal structure presented in Table 1 shows a design anomaly in level 4. This anomaly may indicate further optimization potential of the power system structure. In the past, losses were one of the key optimization criteria in the power system design process. Only in the 1970s was it discovered that supplying a load using lower voltages reduces demand and energy consumption [58]. Since then, many studies based on conservation voltage reduction (CVR) have been conducted to assess the effectiveness of the implementation [59]. The current CVR implementation is based on controlling the voltage through distribution grids. Apart from the fact that its implementation in wide areas carries the risk of exposing some customers to unacceptable under-voltage conditions, the radial structures in distribution grids are subject to decreasing voltage profiles. The latter means that not all customers can be supplied with the lowest permitted voltage. This can be solved by installing 1:1 transformers with voltage control ability at the CP level, as indicated in the fractal structure given in Table 1. Their adjustment can guarantee the end customer’s supply with the lowest possible voltage, thus ensuring maximum load reduction and energy savings. Additionally, this may lead to the liberalization of the voltage limits in super-ordinate grids, which in turn would make operation of the entire power system more efficient. However, basic economic studies are needed to substantiate this hypothesis. Tiny transformers exist in several customer devices (level 5). As in the wires case, the transformer size decreases with voltage level, meaning that it decreases with increasing fractal level. Transformers are thus constructs that repeat themselves at progressively smaller scales.
RPDs are mainly locally controlled (LC). They are widely used in the high and medium voltage grids to control the voltage. Very large and large sized RPDs are used in HV and MV (fractal levels 1 and 2), respectively. RPDs are not present in the LV level. The fractal structure presented in Table 1 thus shows a design anomaly in level 3, the gray element. In contrast, in level 4, the table is already filled, because with the integration of rooftop PVs, associated inverters are used to support the voltage control in low voltage grids by providing reactive power (almost purely inductive) [60]. Studies have shown that the use of customers’ own devices to control the voltage on low voltage grids is technically not effective [61,62] and can lead to social problems [63]. The use of distribution system operators’ (DSOs) reactive power sinks to control the voltage in LV grids is found to be more effective [61]. Thus, level 3 of the fractal structure table can be filled by DSOs and customer inverters should be used only to compensate for their reactive power requirements [62]. Tiny RPDs exist in several customer devices (level 5). The RPD size follows the same trend as discussed above; it decreases with increasing fractal level. RPDs are constructs that repeat themselves at progressively smaller scales.
APAs are appliances that mainly produce, consume or store active power (rotating machines, photo voltaic, batteries, etc.). Very large sized APAs present in hydro, nuclear, etc., power plants as well as in pumped hydro power plants (storage) are connected to HV grids (level 1). With the emergence of distributed energy resources, large, medium and small sized APAs are already connected in MV and LV grids and in CPs (levels 2, 3 and 4), respectively. Moreover, several devices such as computers have tiny APAs in the form of batteries (level 5). The column of APAs in Table 1 is completely filled. The APA size follows the same trend as discussed above; it decreases with increasing fractal level. Thus, APAs are constructs that repeat themselves at progressively smaller scales.
As a result, although very heterogeneous, the construction of smart grids is self-similar. Figure 2 shows its fractal pattern. Both groups of self-similar constructs (grid and APA) are figuratively wrapped in an ellipse, see Figure 2a.
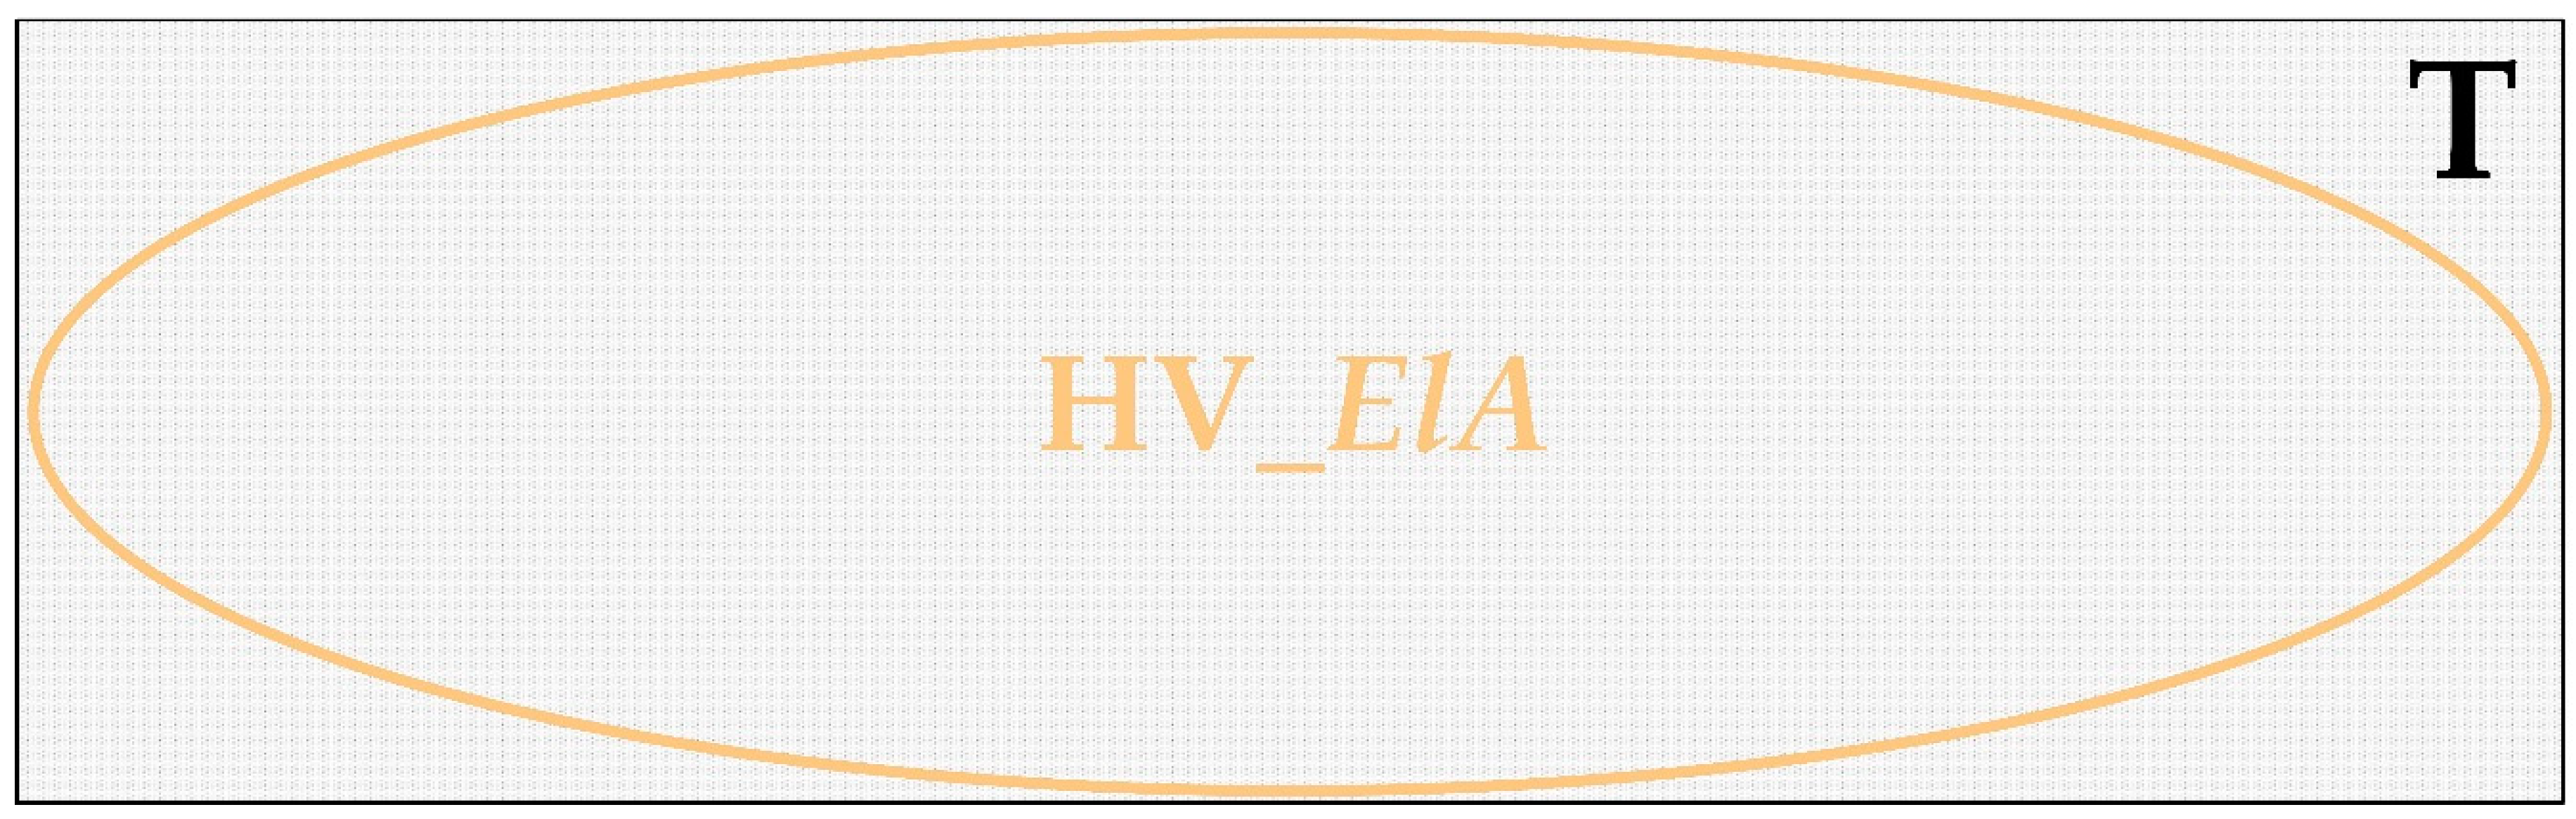
By definition, the fractal pattern of the power system consists of electrical appliances (ElA) designed for a pre-defined level.
Each ElA-ellipse denotes a separate chain link. It includes the grid of a specific level and all APAs connected to it. Figure 2b illustrates ElA in different levels: HV-ElA, MV-ElA, LV-ElA, CP-ElA and Dev-ElA for levels 1, 2, 3, 4 and 5, respectively. Figure 2c magnifies the CP- and Dev-ElA patterns.
3.1.2. Fractal-Set of Smart Grids
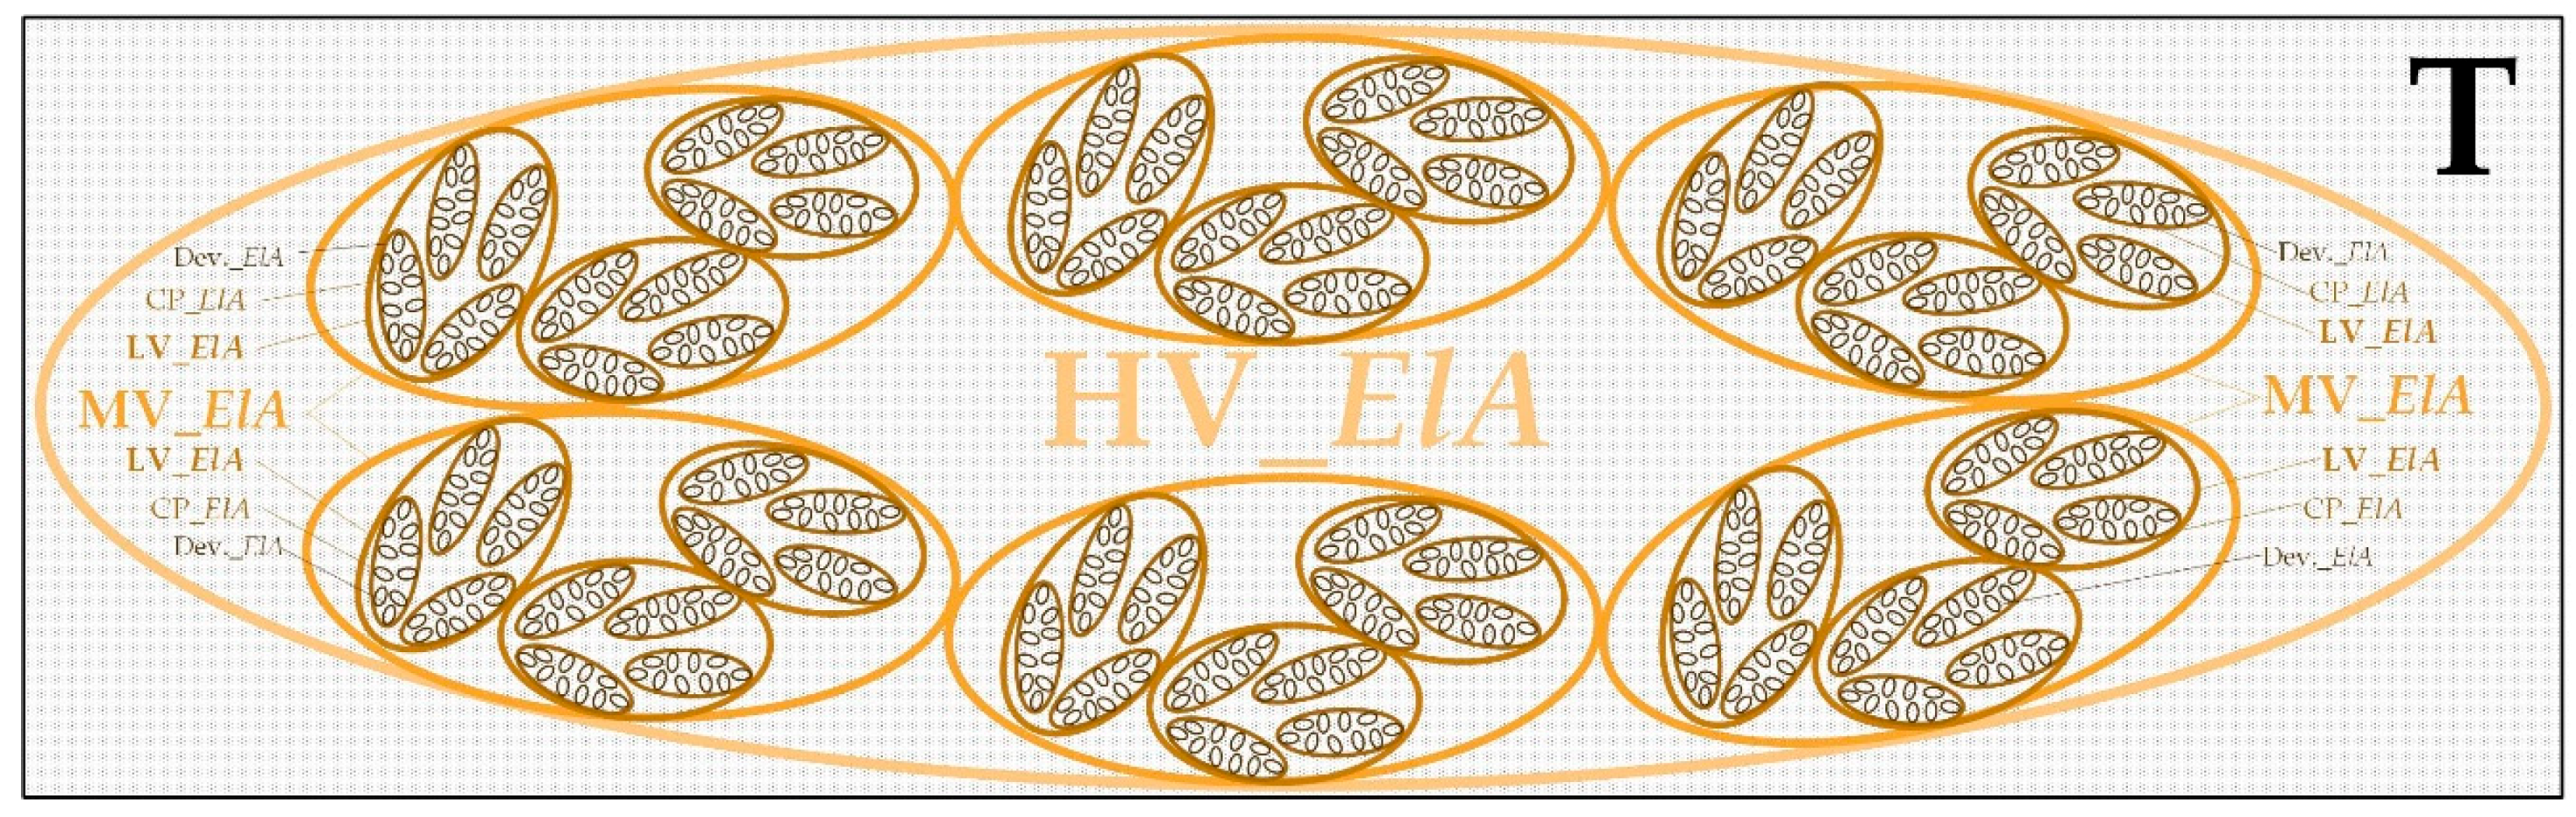
From the bird’s-eye view, all identified fractal levels are in the same territory, T. The overall pattern of level 1, HV-ElA, spreads over the entire T of a country or of a part of it, Figure 3. The patterns of the higher fractal levels propagate in smaller areas of the same territory T, repeating themselves many times. The repeating number of patterns in different fractal levels is derived from the relationship between different zones of power systems in real conditions and the number of appliances comprised in each of them. Table 2 shows a structural overview of the power system in real conditions and of its fractal.
Since the MV and LV grids have radial structures, the number of MV and LV zones are defined by the number of suppling substations (HV/MV) and distribution transformers (MV/LV), respectively.
A real European power system, operated by one transmission system operation (TSO), have about 300 supplying and 100,000 distribution substations to supply about 4 million customer plants.
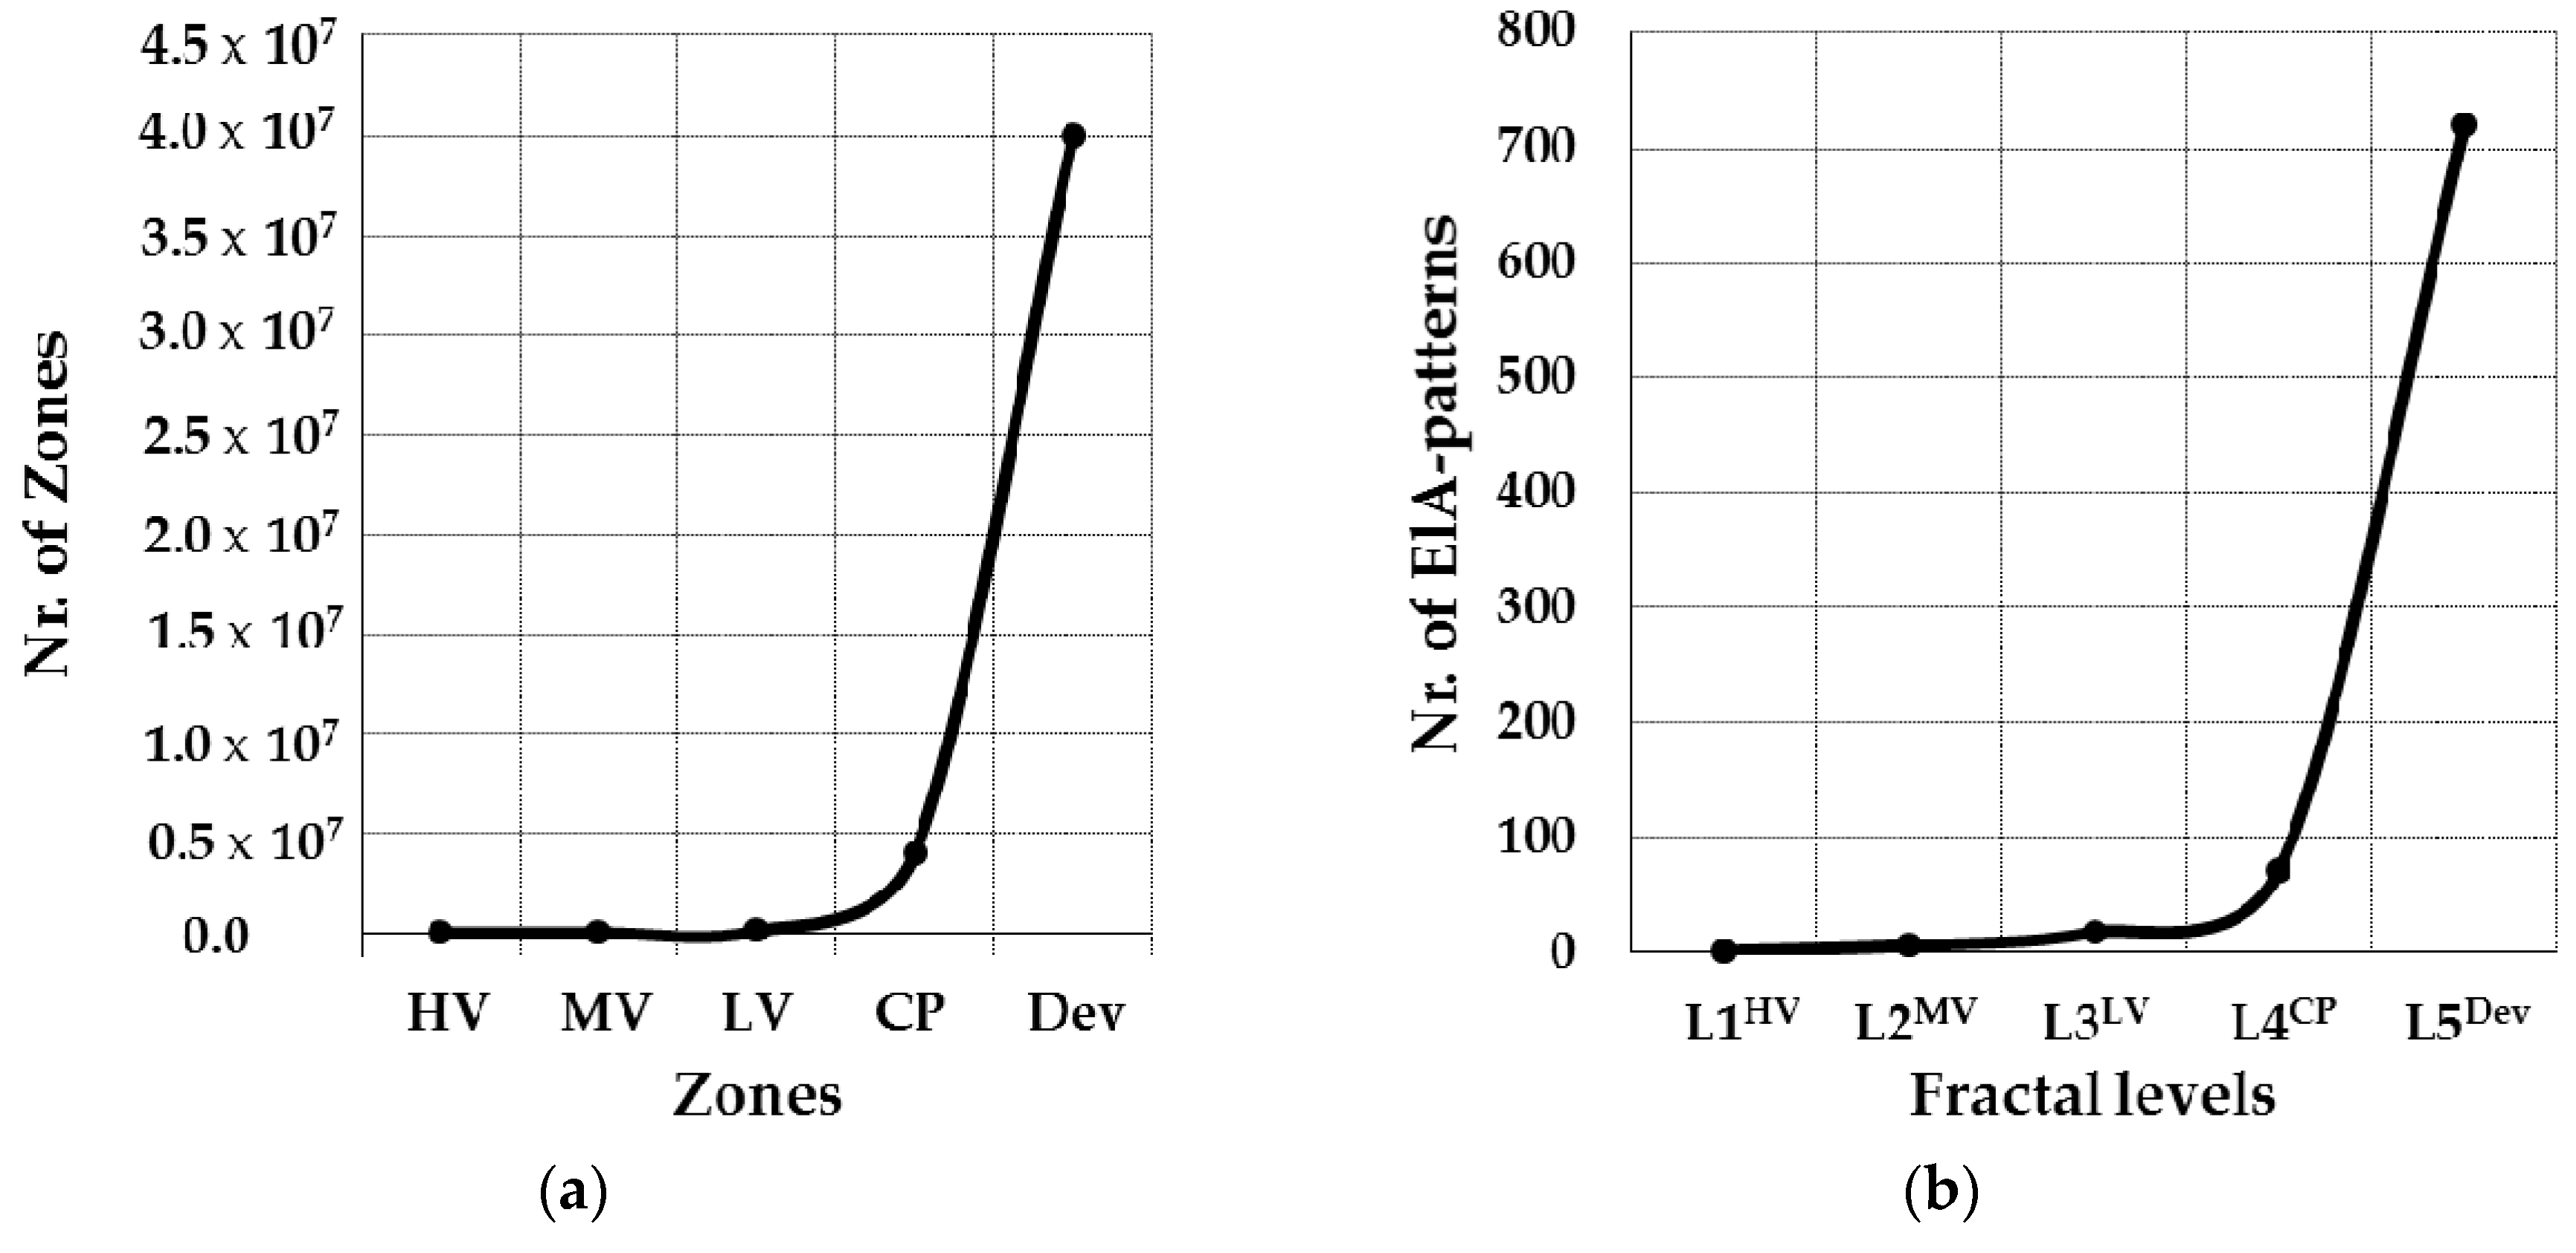
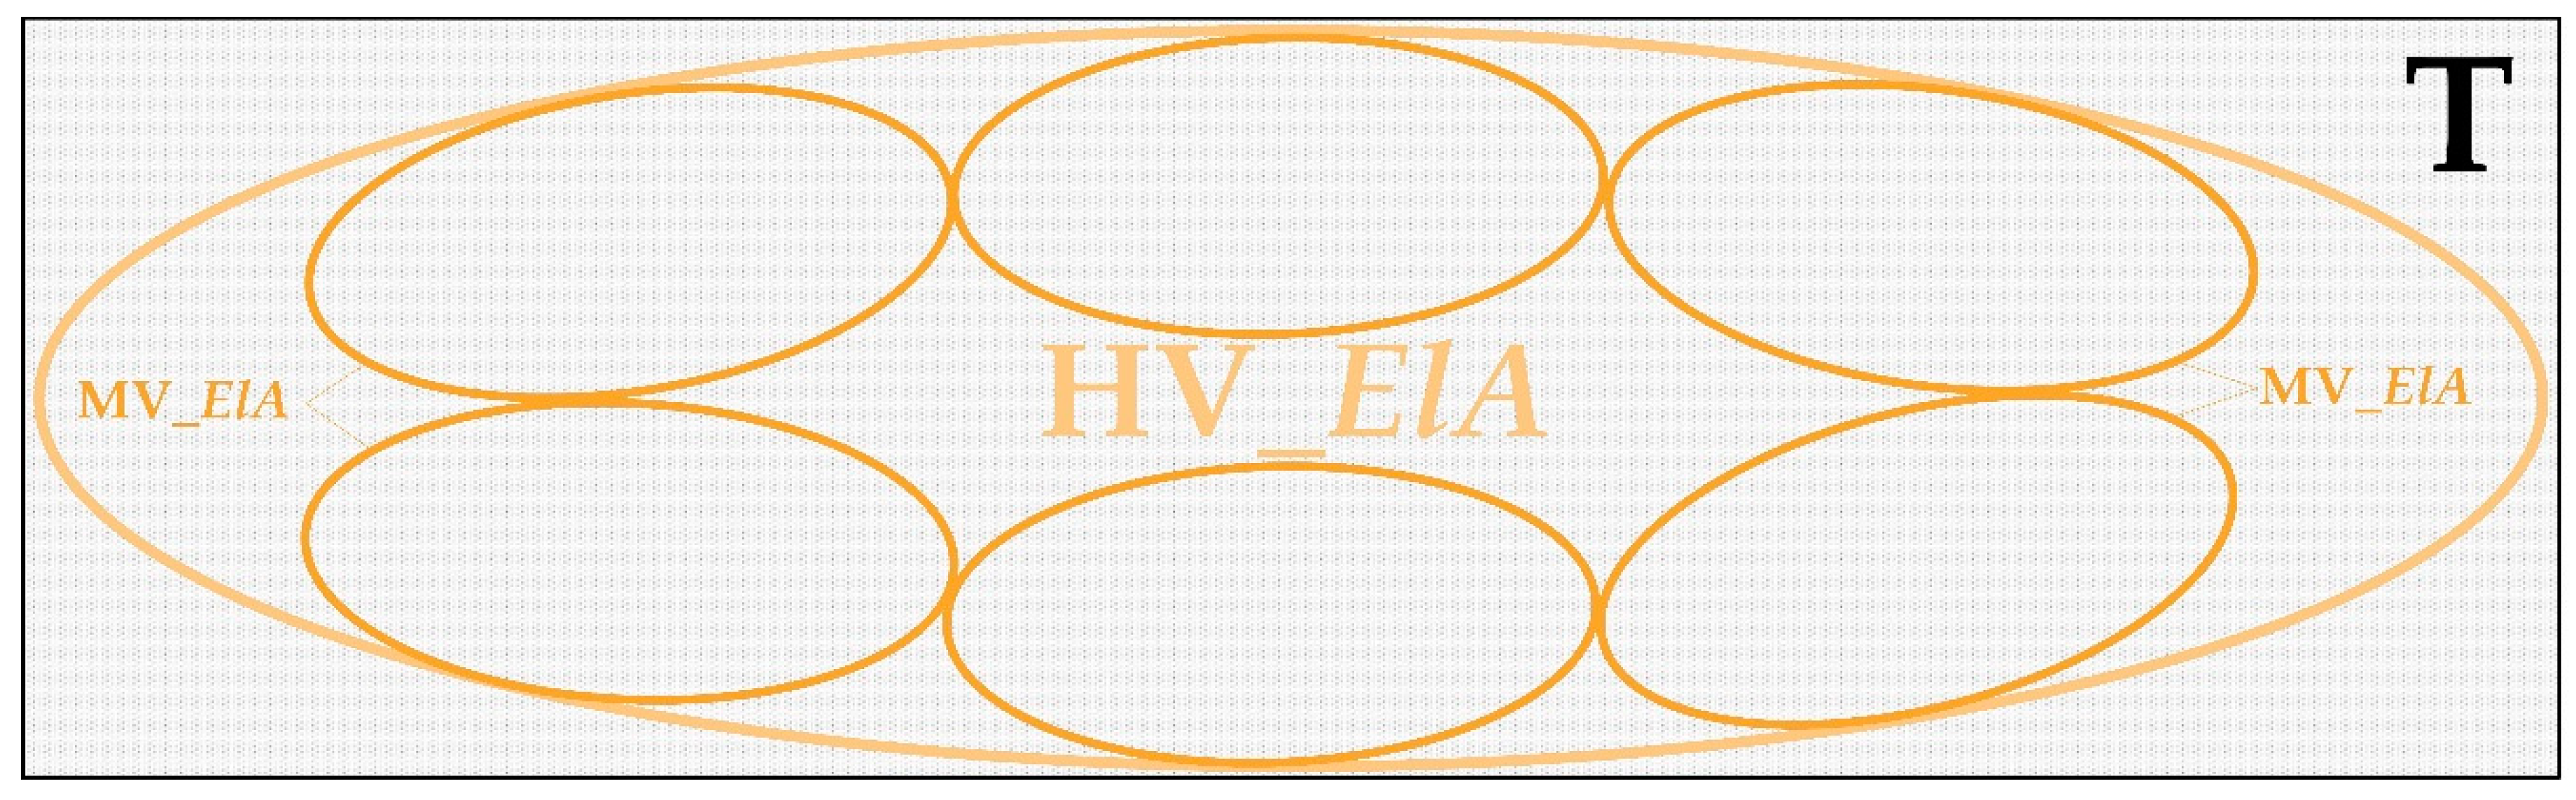
It is assumed that each distribution substation supplies on average about 40 customer plants [64]. Additionally, it is assumed that in each customer plant exists on average for ten electrical devices. Figure 4a shows a graphical overview of the structure of smart grids. The graph increases exponentially as the number of customer plants, 4 million, increases drastically compared to the number of the HV zones, that is one. Thus, the fractal set cannot be assembled using only one scaling factor, because the number of zones in different levels is very different. In Table 2 are shown the different scaling factors used to define the number of ElAs for each fractal level and the derived numbers of ElAs used. The scaling factor for level 1 is set to one, while for levels 2 and 3 they are set to 50 and 5,555.56, respectively. The same scaling factor of 55,555.56 is used for levels 4 and 5 because the number of zones included in them differs only by a factor of ten. Figure 4b shows a graphical overview of the structure of the fractal set. The graph behaves similarly to the one of the power system in real conditions, Figure 4a. Using this approach, each of the six MV-ElAs touches the single HV-ElA at one point and tangentially to each other, Figure 5.
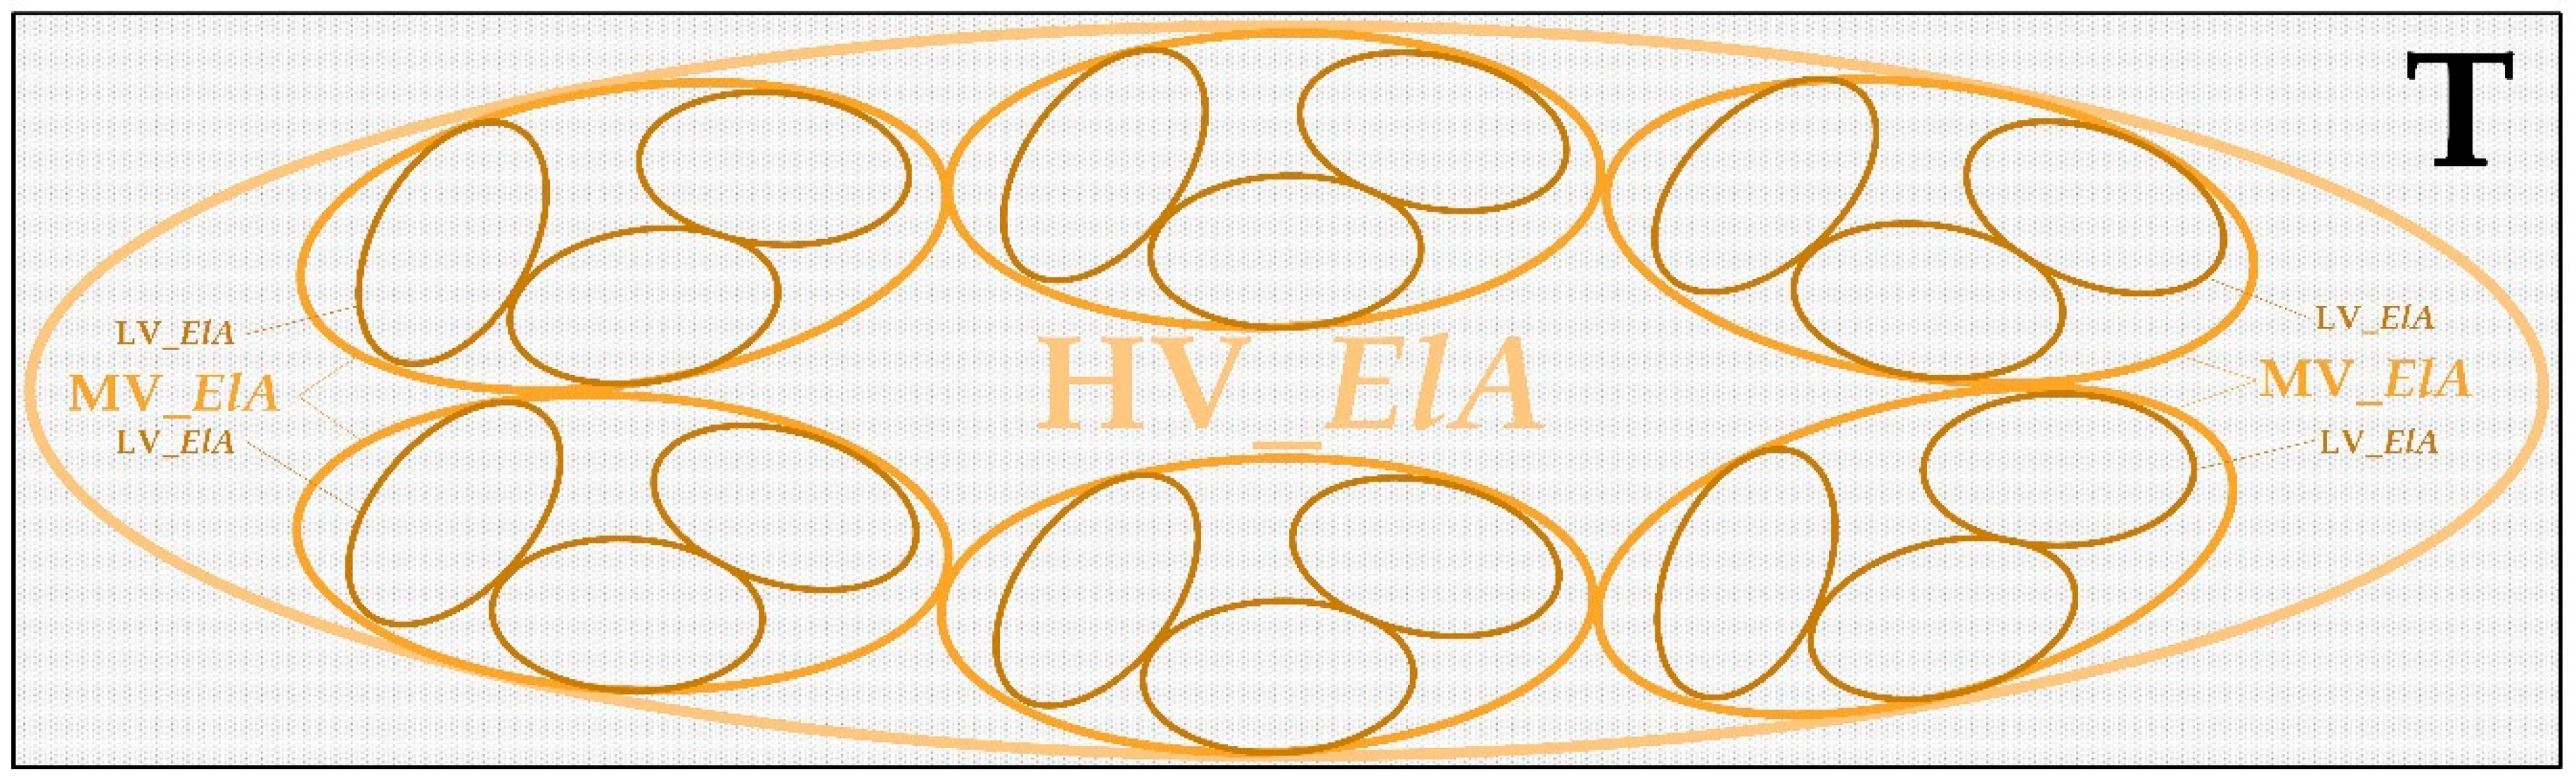
The latter symbolizes the tie switches (normally open points) connecting feeders of different MV-subsystems. For the 18 LV-ElAs is used the same principle as for MV-ElAs, Figure 6.
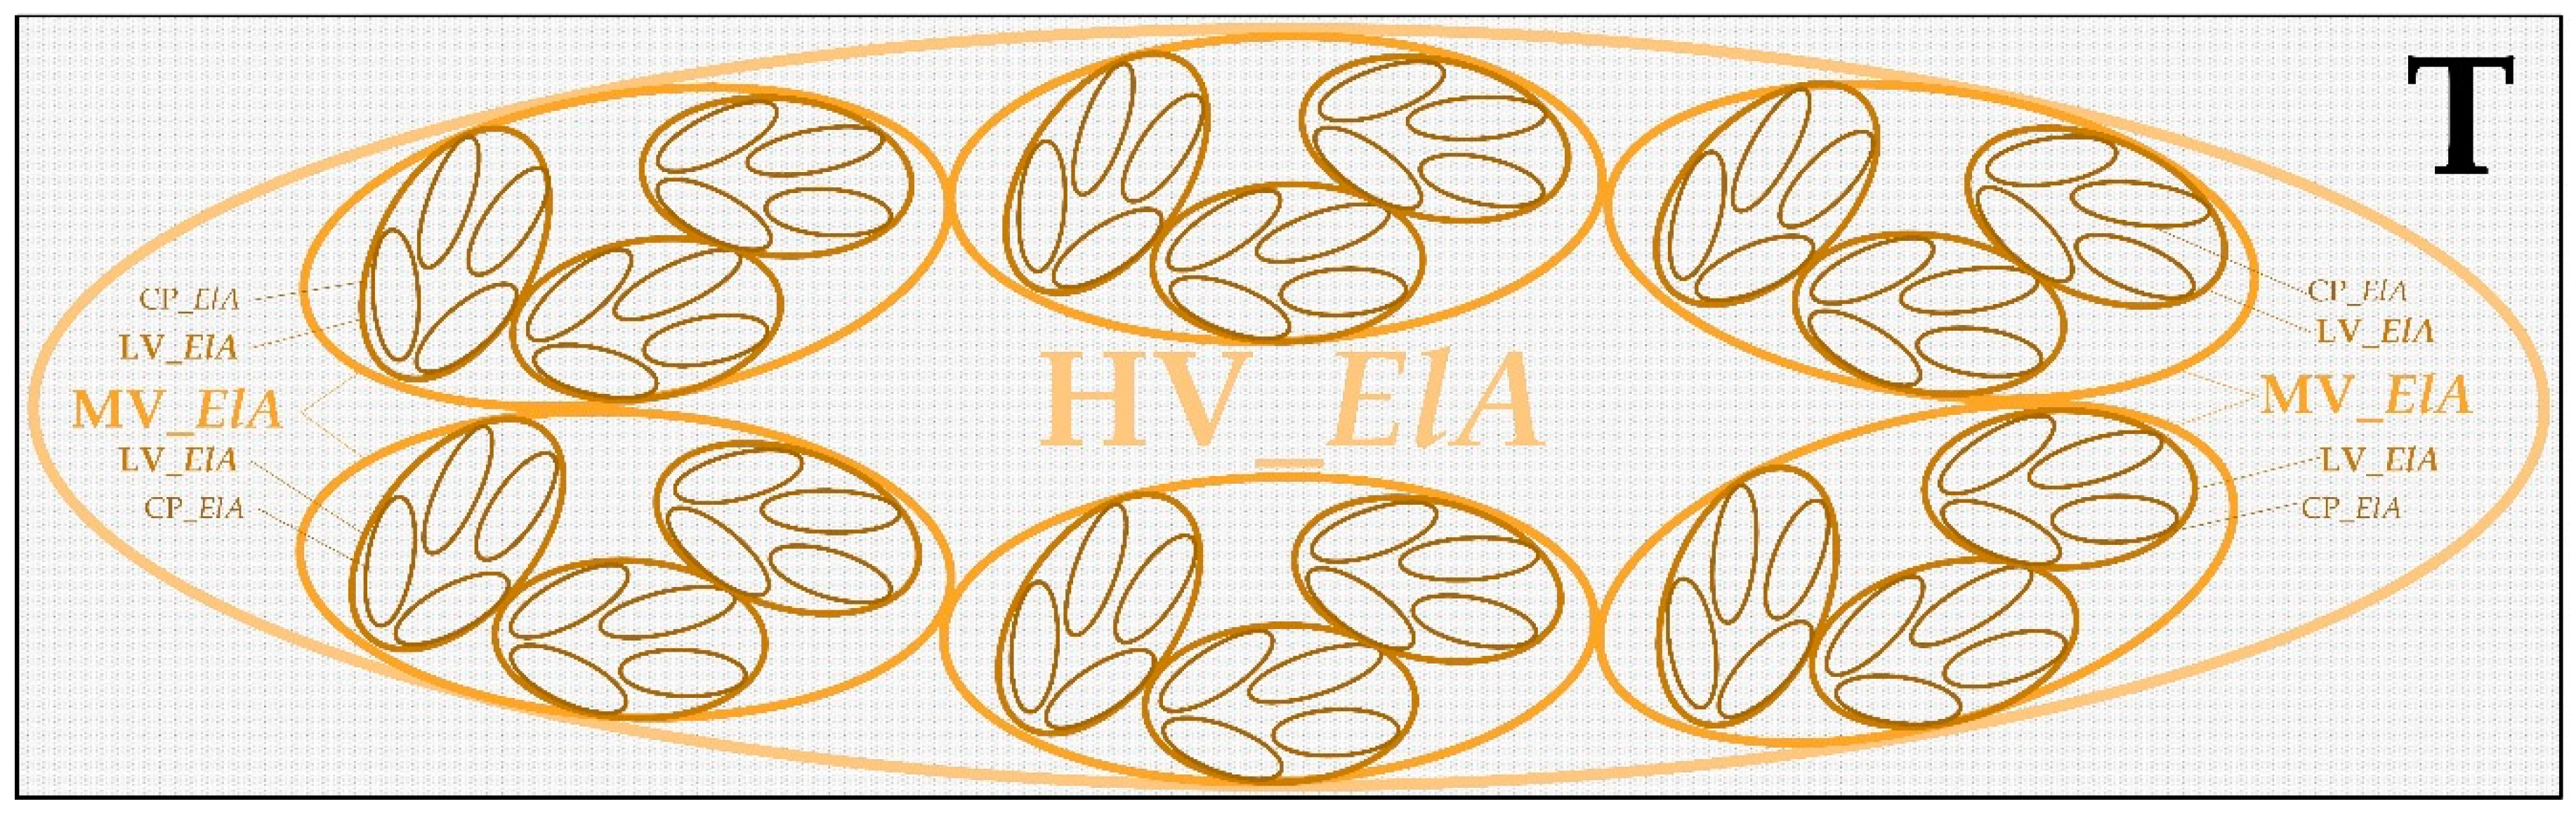
Four CP-ElAs are added into every LV-ElA, each touching only one point of the LV-ElA pattern (every customer plant has one electrical connection point with the LV grid and no connection with each other), Figure 7.
The same principle is used to add the ten Dev-ElAs into every CP-ElA, Figure 8. The fractal pattern ElA of different levels is assembled in a common fractal set; a link chain fractal limited to five interlinks.
The significance of the fractal set of smart grids is verified by the calculation of the fractal dimension. It contains information about the geometrical structure at multiple scales reflecting the complexity of the fractal set: The greater the complexity, the larger the fractal dimension.
3.1.3. Fractal-Dimension
Fractals can be characterized by the fractal dimension D. For a fractal located in a bi-dimensional space, D is larger than 1 and less than 2,
The larger D, the greater the fractal complexity.
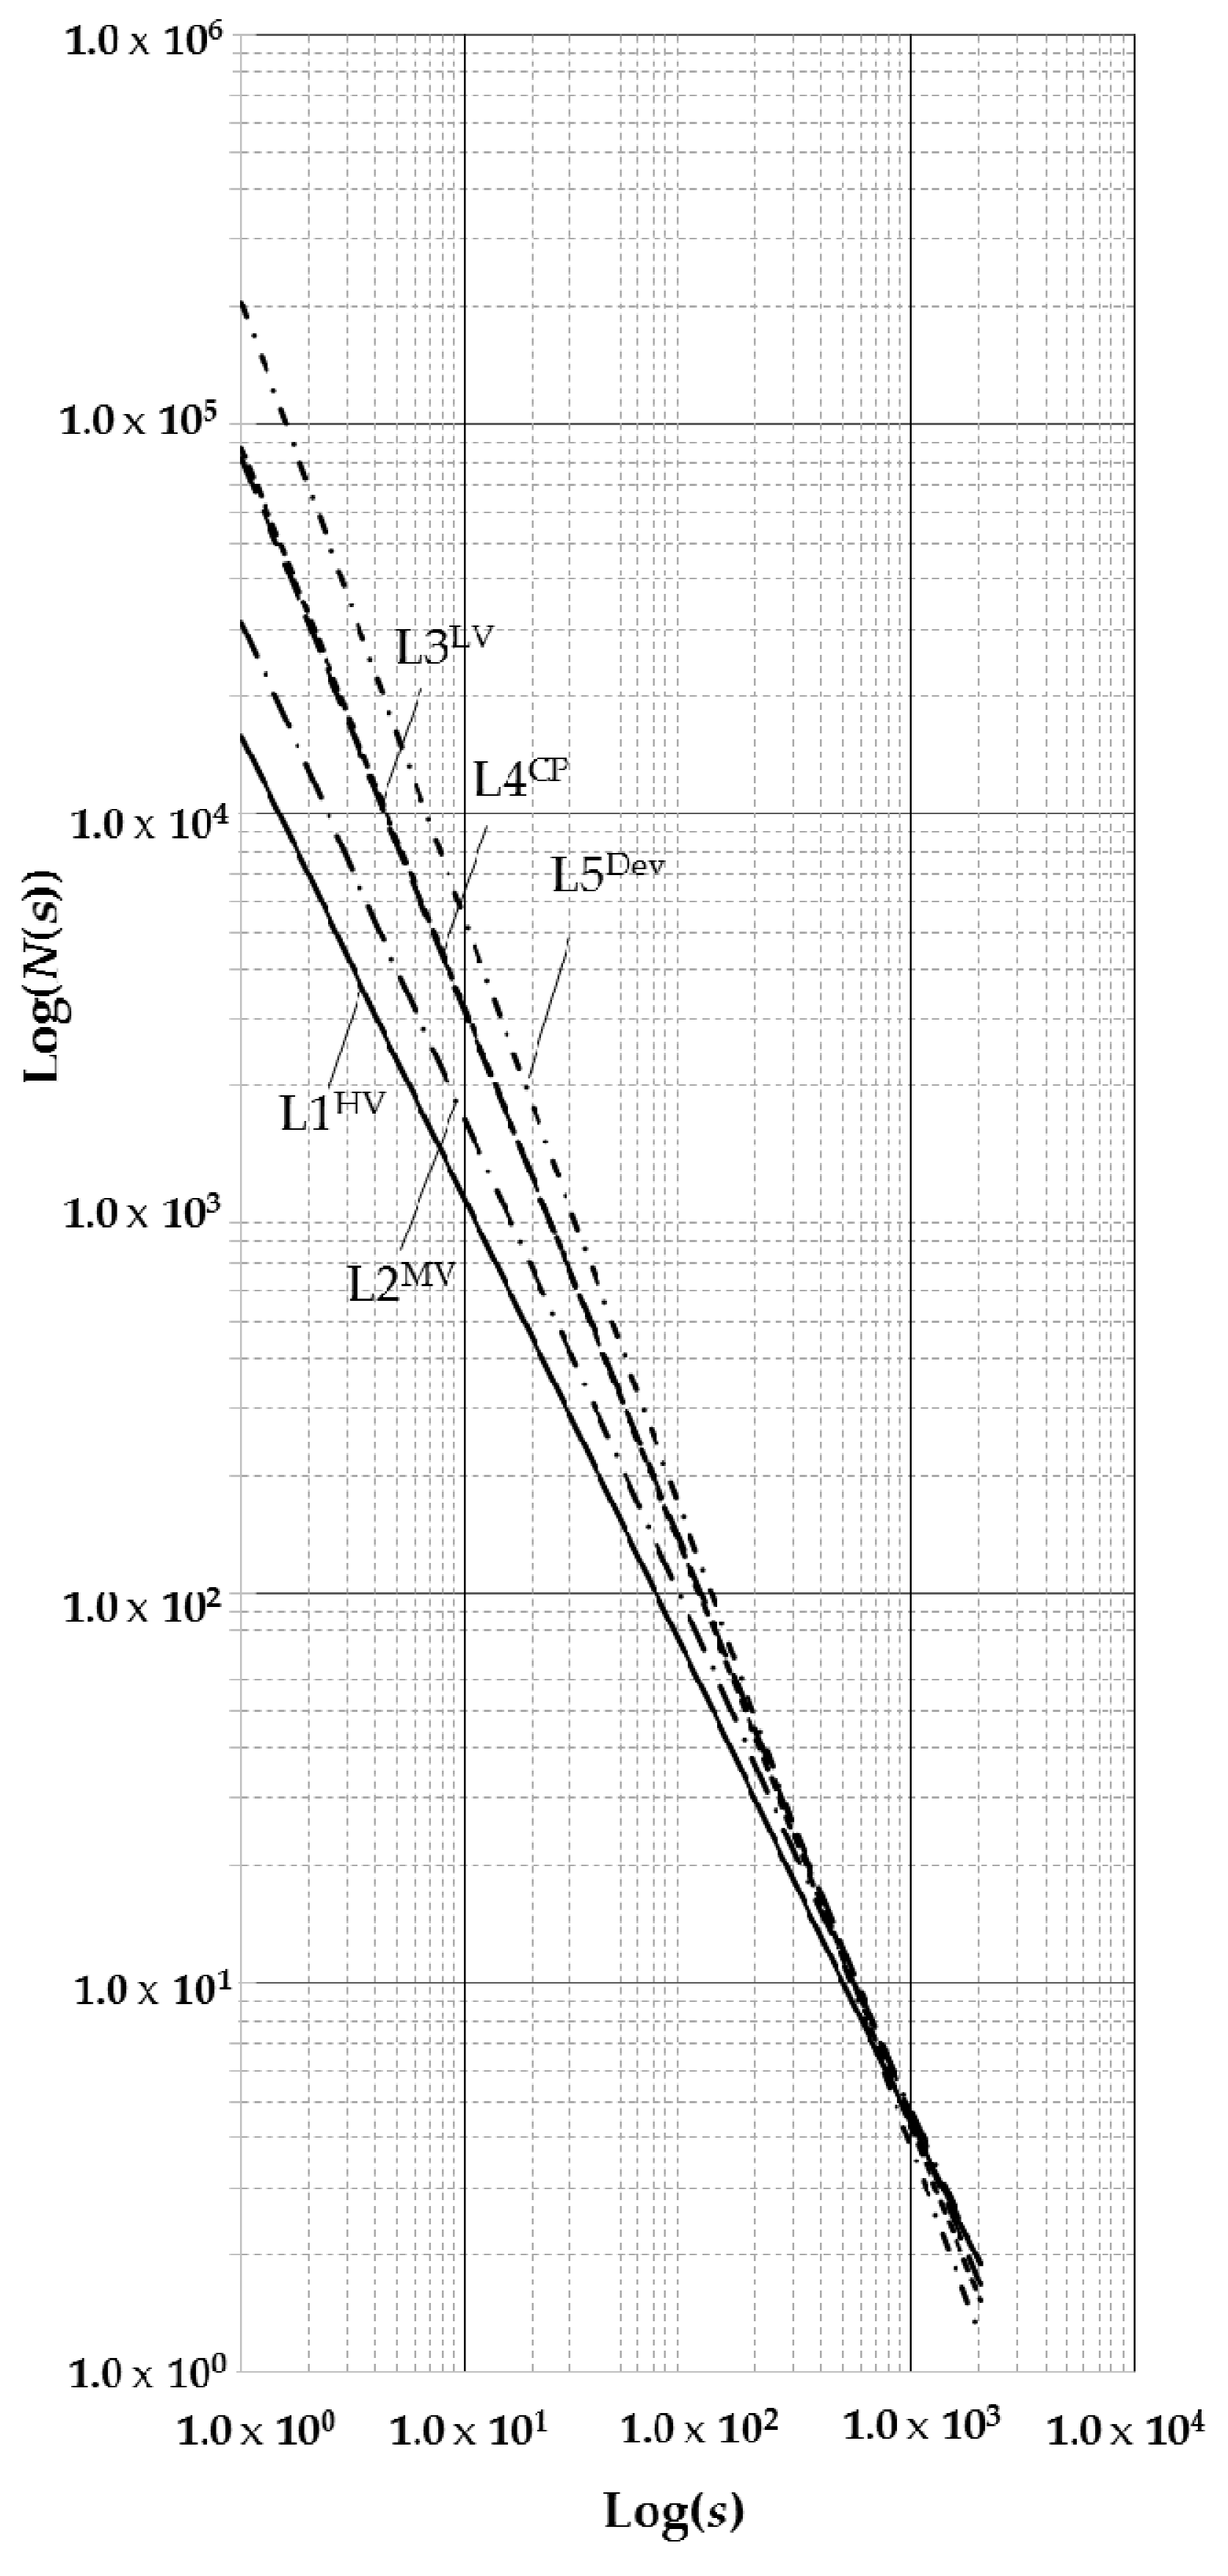
D is calculated using the box-counting method, which is based on the counting of boxes (of side length (s) occupied by the fractal. The number of occupied boxes, N, increases by making the grid finer (s → 0). D is estimated as the exponent of a power low as follows:
The software Fractalyse 2.4 [65] is used to calculate the fractal dimension of the entire power system, customer plants and electrical devices. The fractal dimension is obtained by using a logarithmic linear regression to fulfil the following objective function
where C is the equation constant.
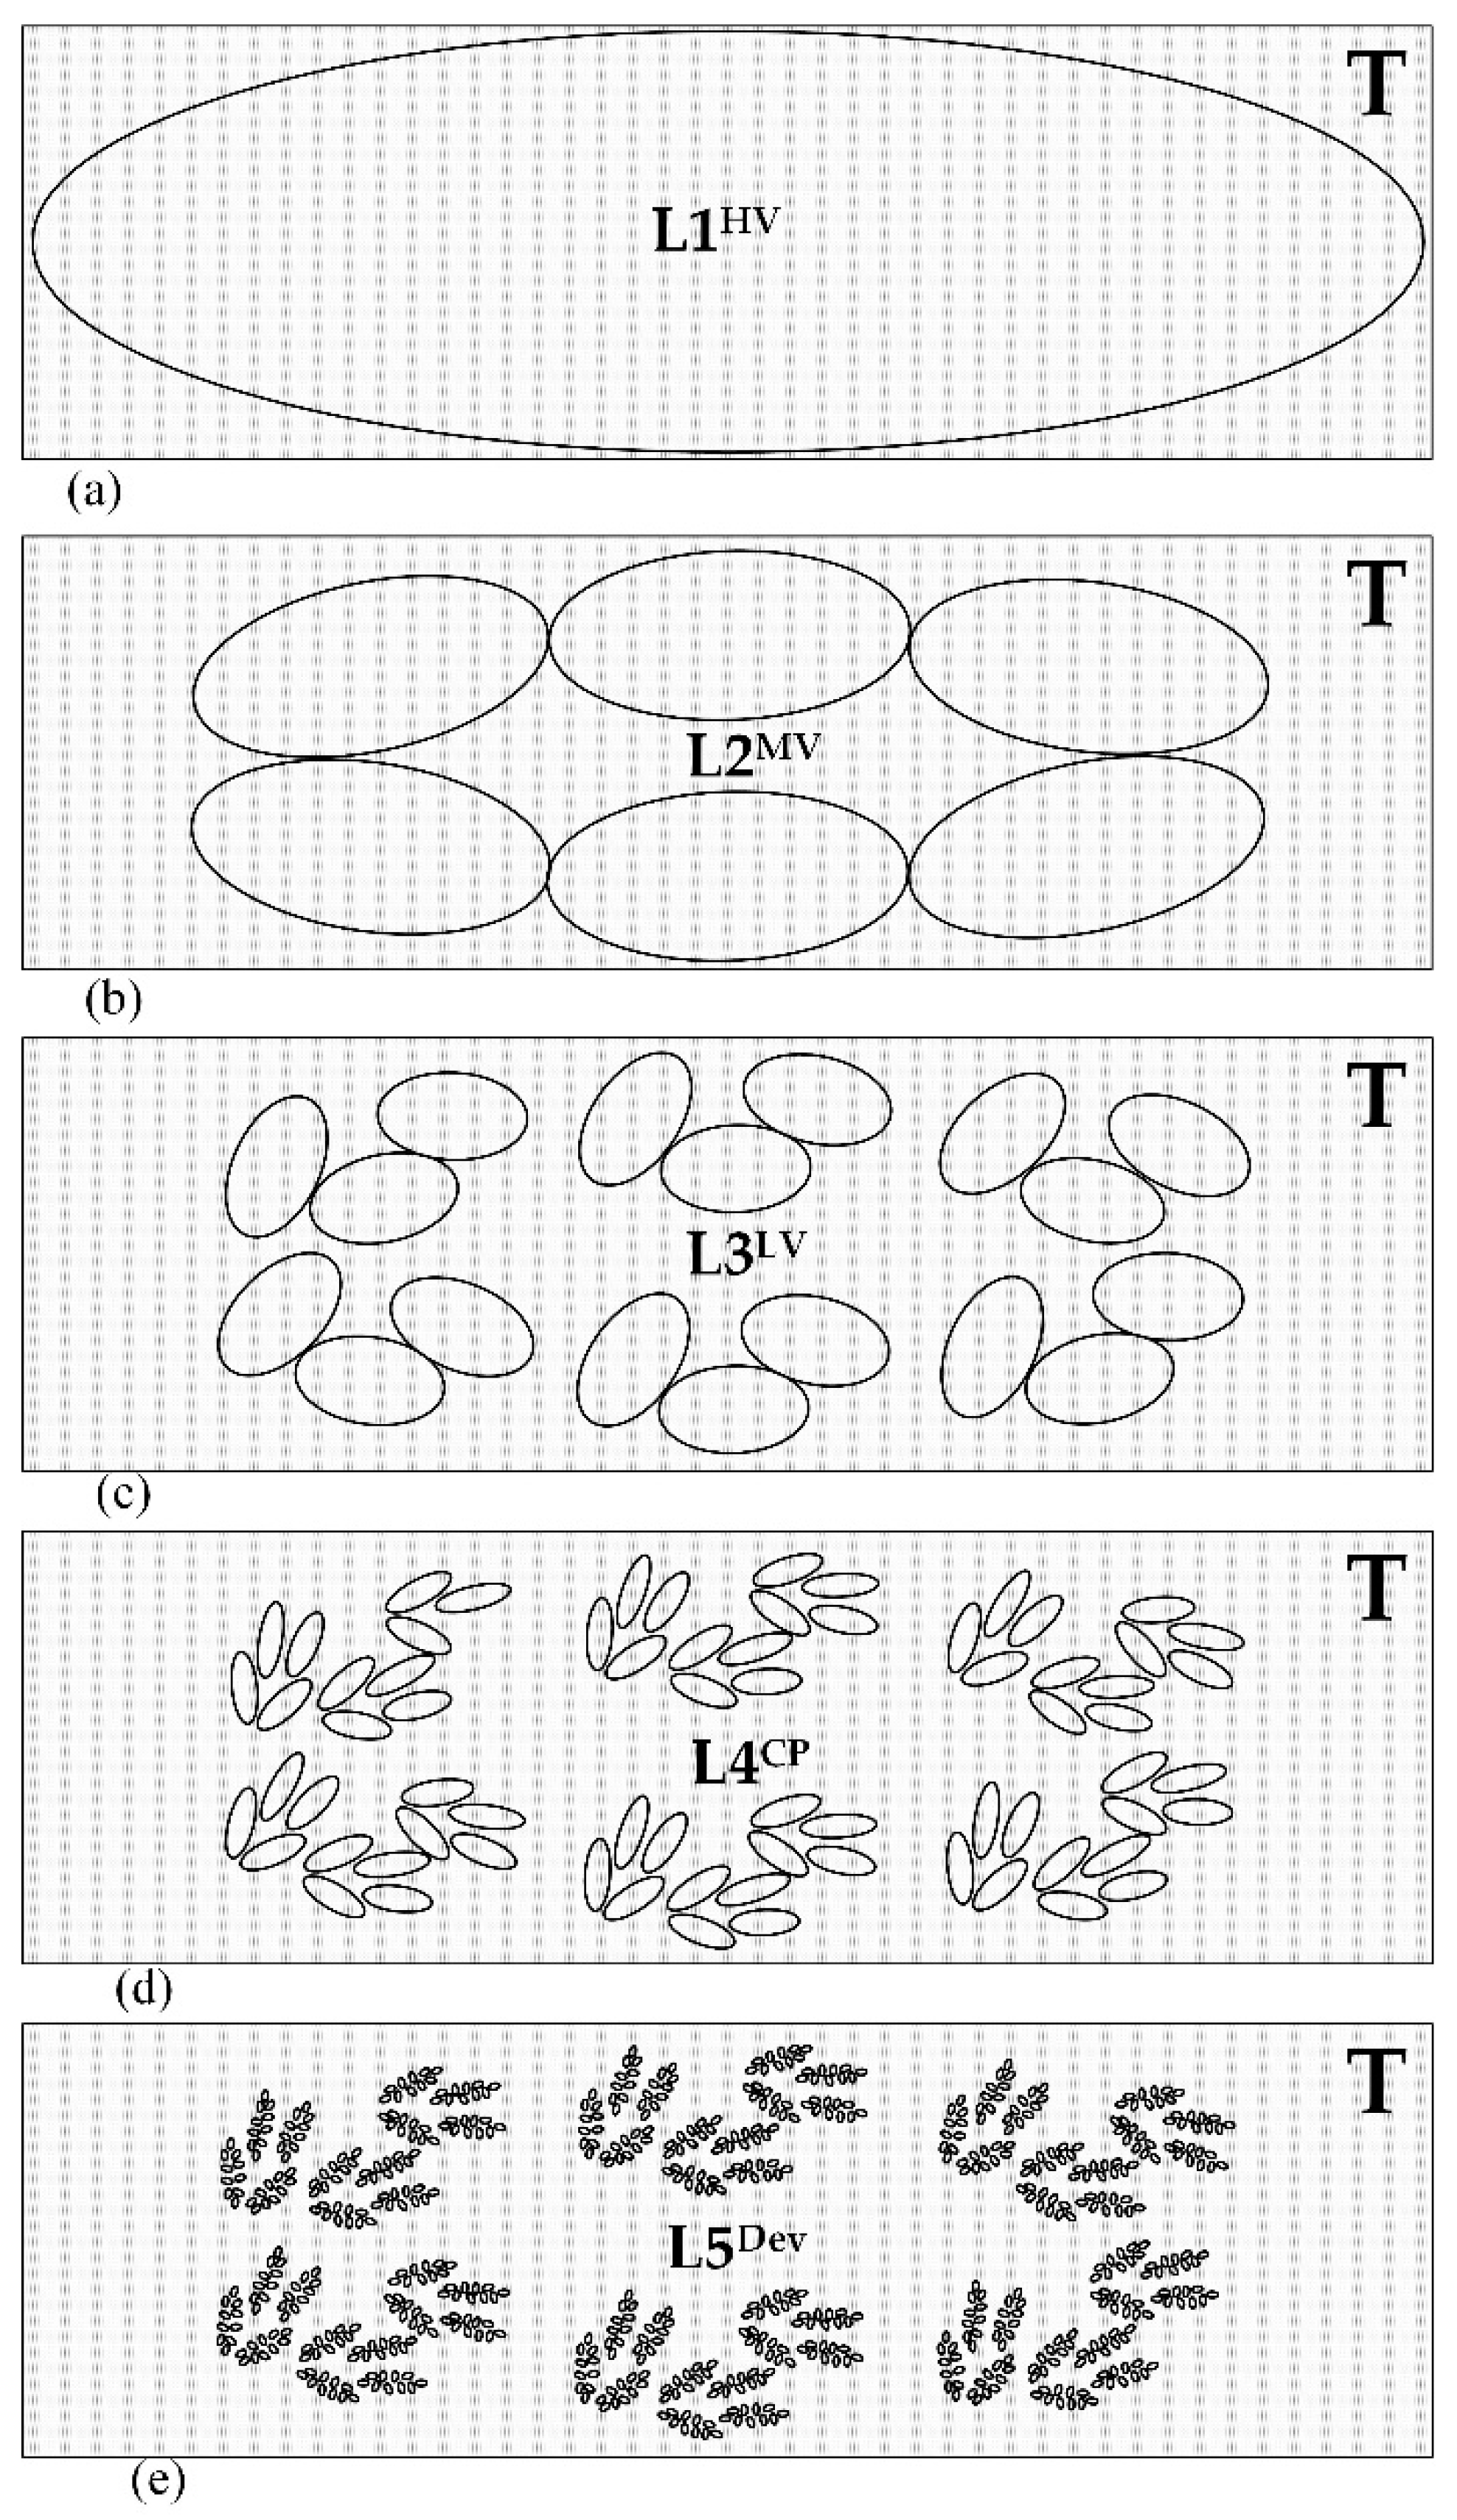
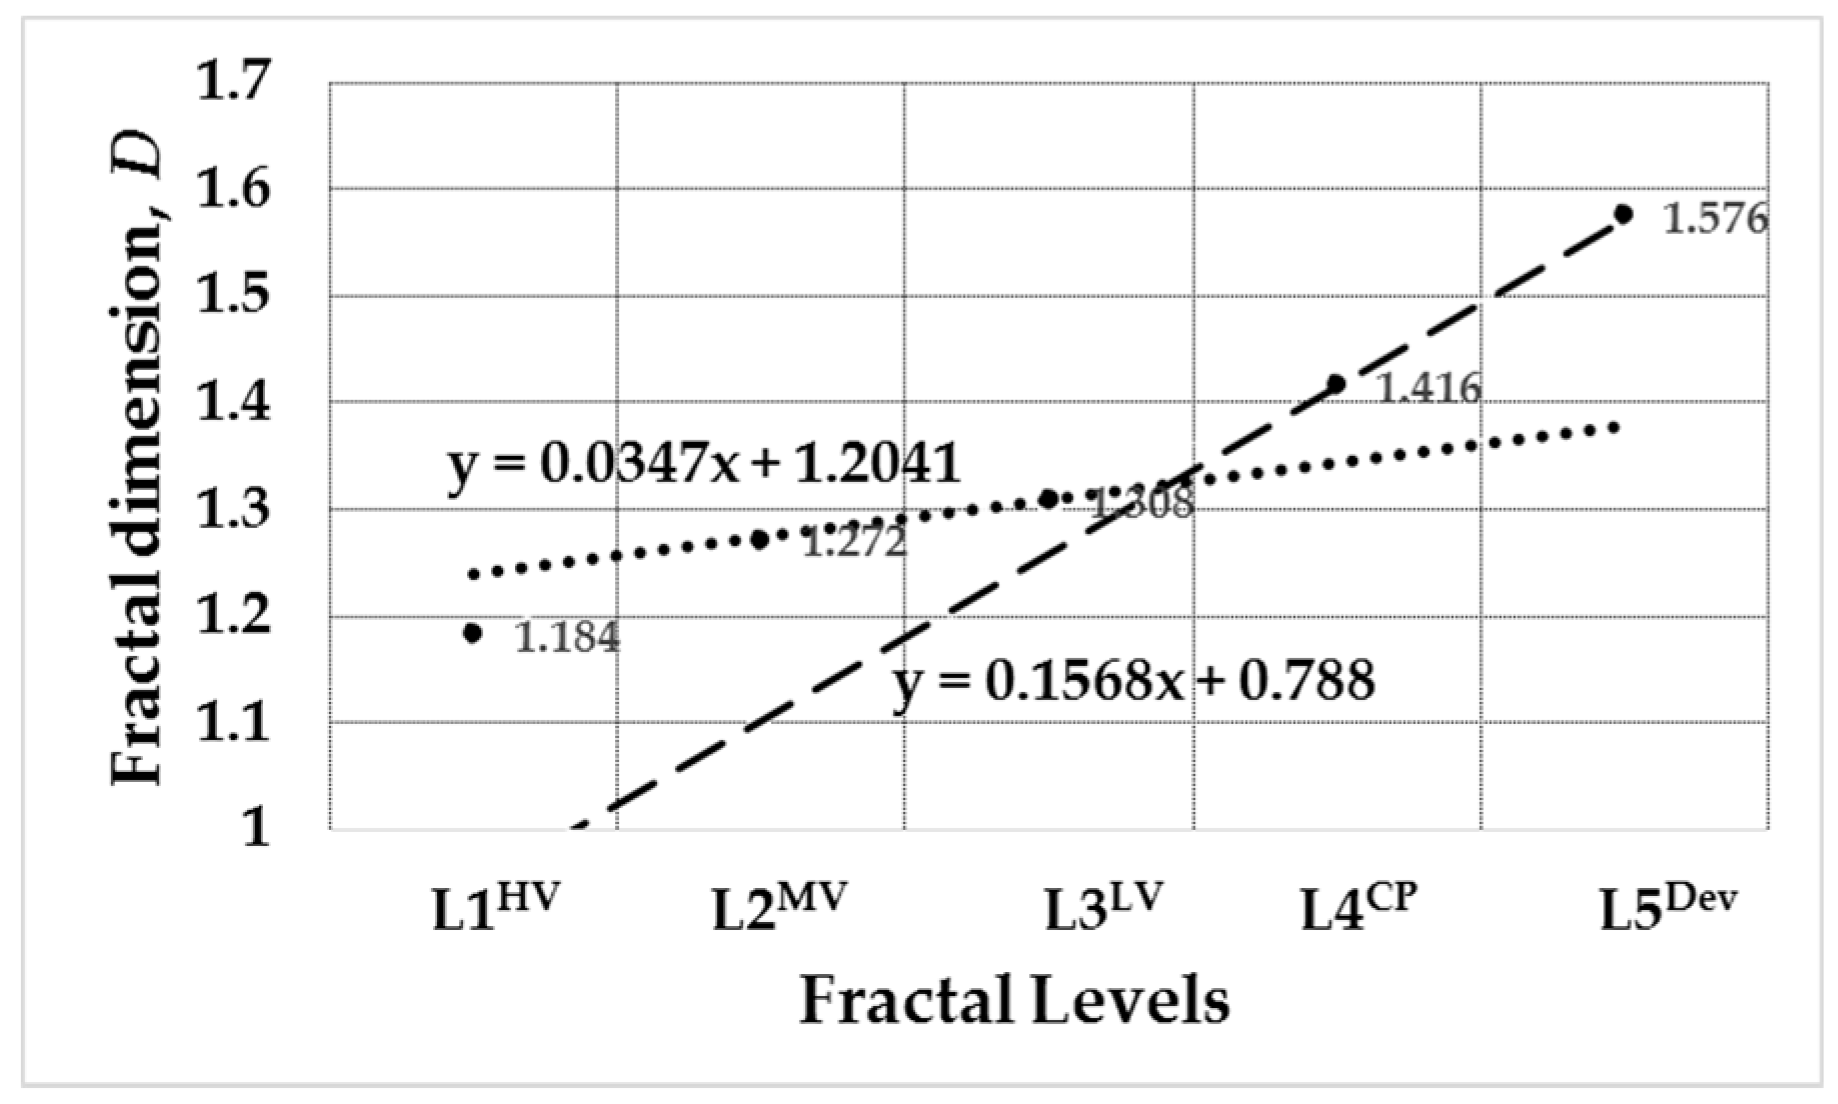
Figure 9 shows the separate fractal sets of smart grids in different levels. While the logarithm diagram for measuring D of each level is shown in Figure 10. The segments’ slope increases steadily with increasing fractal level. Figure 11 shows the fractal dimension D for different separate fractal levels. D increases from 1184 for level 1 (HV) to 1272 and 1308 for the levels 2 and 3 (MV and LV), respectively. The D-increase from level 1 to level 2 is significant (∆DL1→L2 = 0.088), which means that the complexity of smart grids at MV level increases dramatically compared to the HV level. Another significant D-increase, even bigger than the previous one, is observed between levels 3 (LV) and 4 (CP), (∆DL3→L4 = 0.108). The complexity of smart grids at the CP level increases considerably compared to the LV level. The slope of the trend line of levels 4 and 5 (dashed line) is clearly bigger than in the case of the trend line for levels 2 and 3 (dotted line), 0.156 and 0.0347, respectively.
The increase in complexity at the level of electrical device compared to the customer plant is stronger than that between the LV and MV levels.
Usually, the resources required to develop and purchase the different parts of a complex system are proportional to their complexity. The fractal dimension analysis indicates that, to realize smart grids, the highest global resources should be provided for the development and purchase of electrical devices, followed by a continuous reduction in resources for CPs, LV and MV up to the lowest resource allocation for the HV level.
3.2. LINK-Paradigm and the Associated Holistic Model
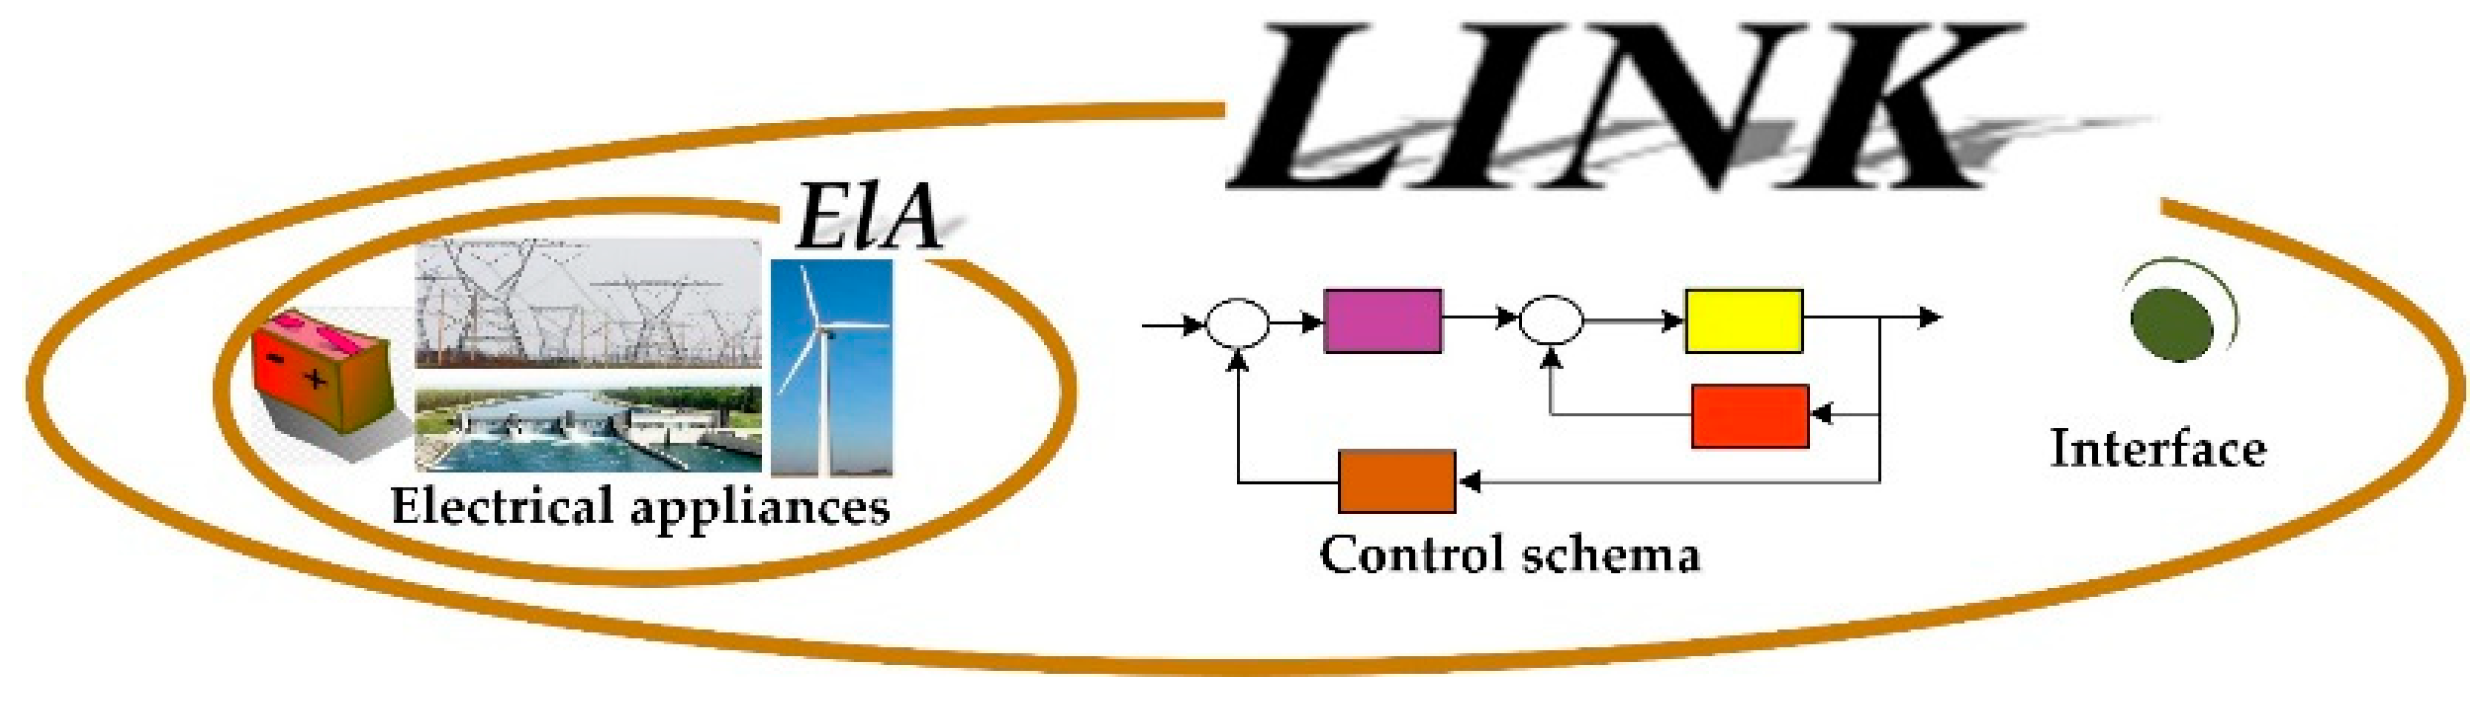
The realization of smart grids is related to a growing demand for more sensors, more communication, more computation and more control [66]; these represent an ever-growing cornucopia of new technologies [67,68]. Therefore, the ElA fractal pattern is combined with control schemes and interfaces to create the smart grid paradigm, Figure 12.
By definition, the LINK-paradigm is a set of one or more ElAs, i.e., a grid part, storage device or a producer device, the controlling schema and the interface.
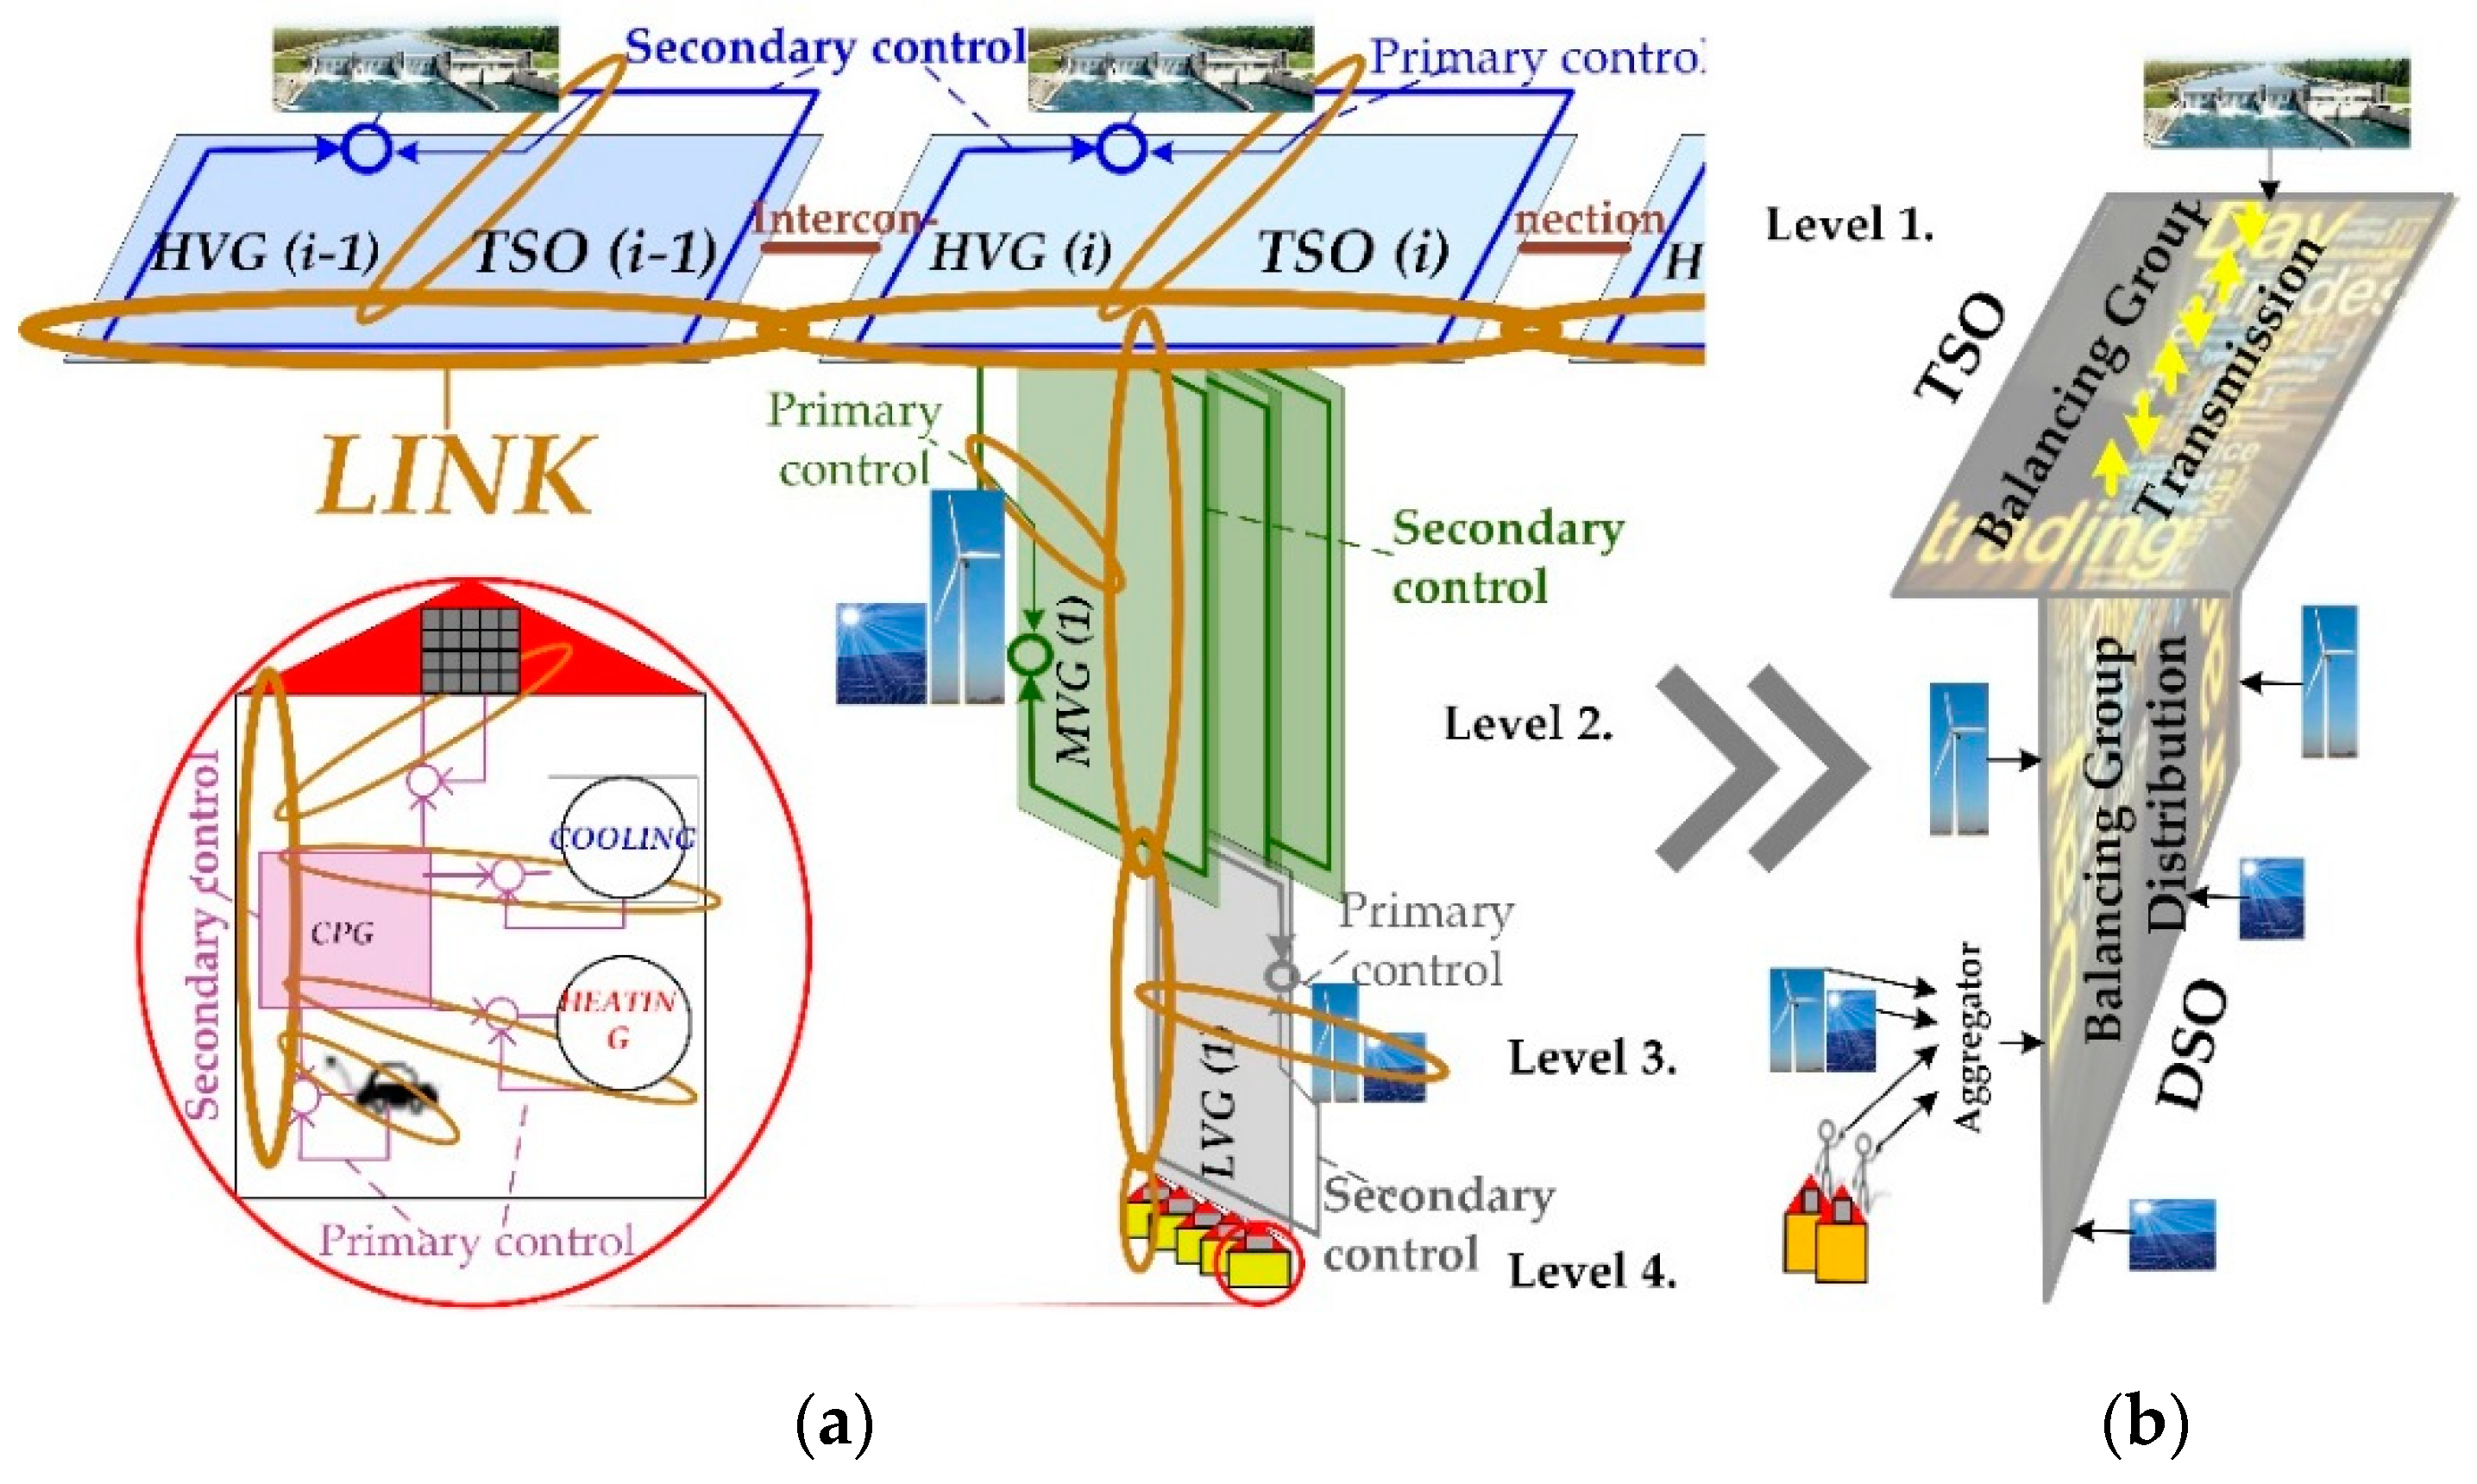
The LINK-paradigm is used as an instrument to design a LINK-based holistic architecture. It facilitates modelling of the entire power system from high to low voltage levels, including CPs and includes the description of all power system operation processes such as load-generation balance, voltage assessment, dynamic security, price and emergency driven demand response, etc. [69]. The LINK-paradigm is the fundament of the holistic, technical and market-related model of smart power systems with large distributed energy resource (DER) shares. Figure 13a shows the technical holistic model (the “energy supply chain net”), which extends to fractal level 4. It illustrates the links’ compositions and their relative position in space, both horizontally and vertically. In the horizontal axis, the interconnected high voltage grids (HVGs) are arranged. They are actually owned and operated by TSOs. The medium and low voltage grids (MVGs and LVGs, respectively) and the customer plant grids (CPGs) are arranged on the vertical axis. MVGs and LVGs are actually owned and operated by the DSOs, while CPGs are operated by customers.
By definition, an “energy supply chain net” is a set of automated power grids intended for chain links (abbreviated as links), which fit into one another to establish a flexible and reliable electrical connection. Each individual link or link bundle operates autonomously and has contractual arrangements with other relevant boundary links or link bundles [70].
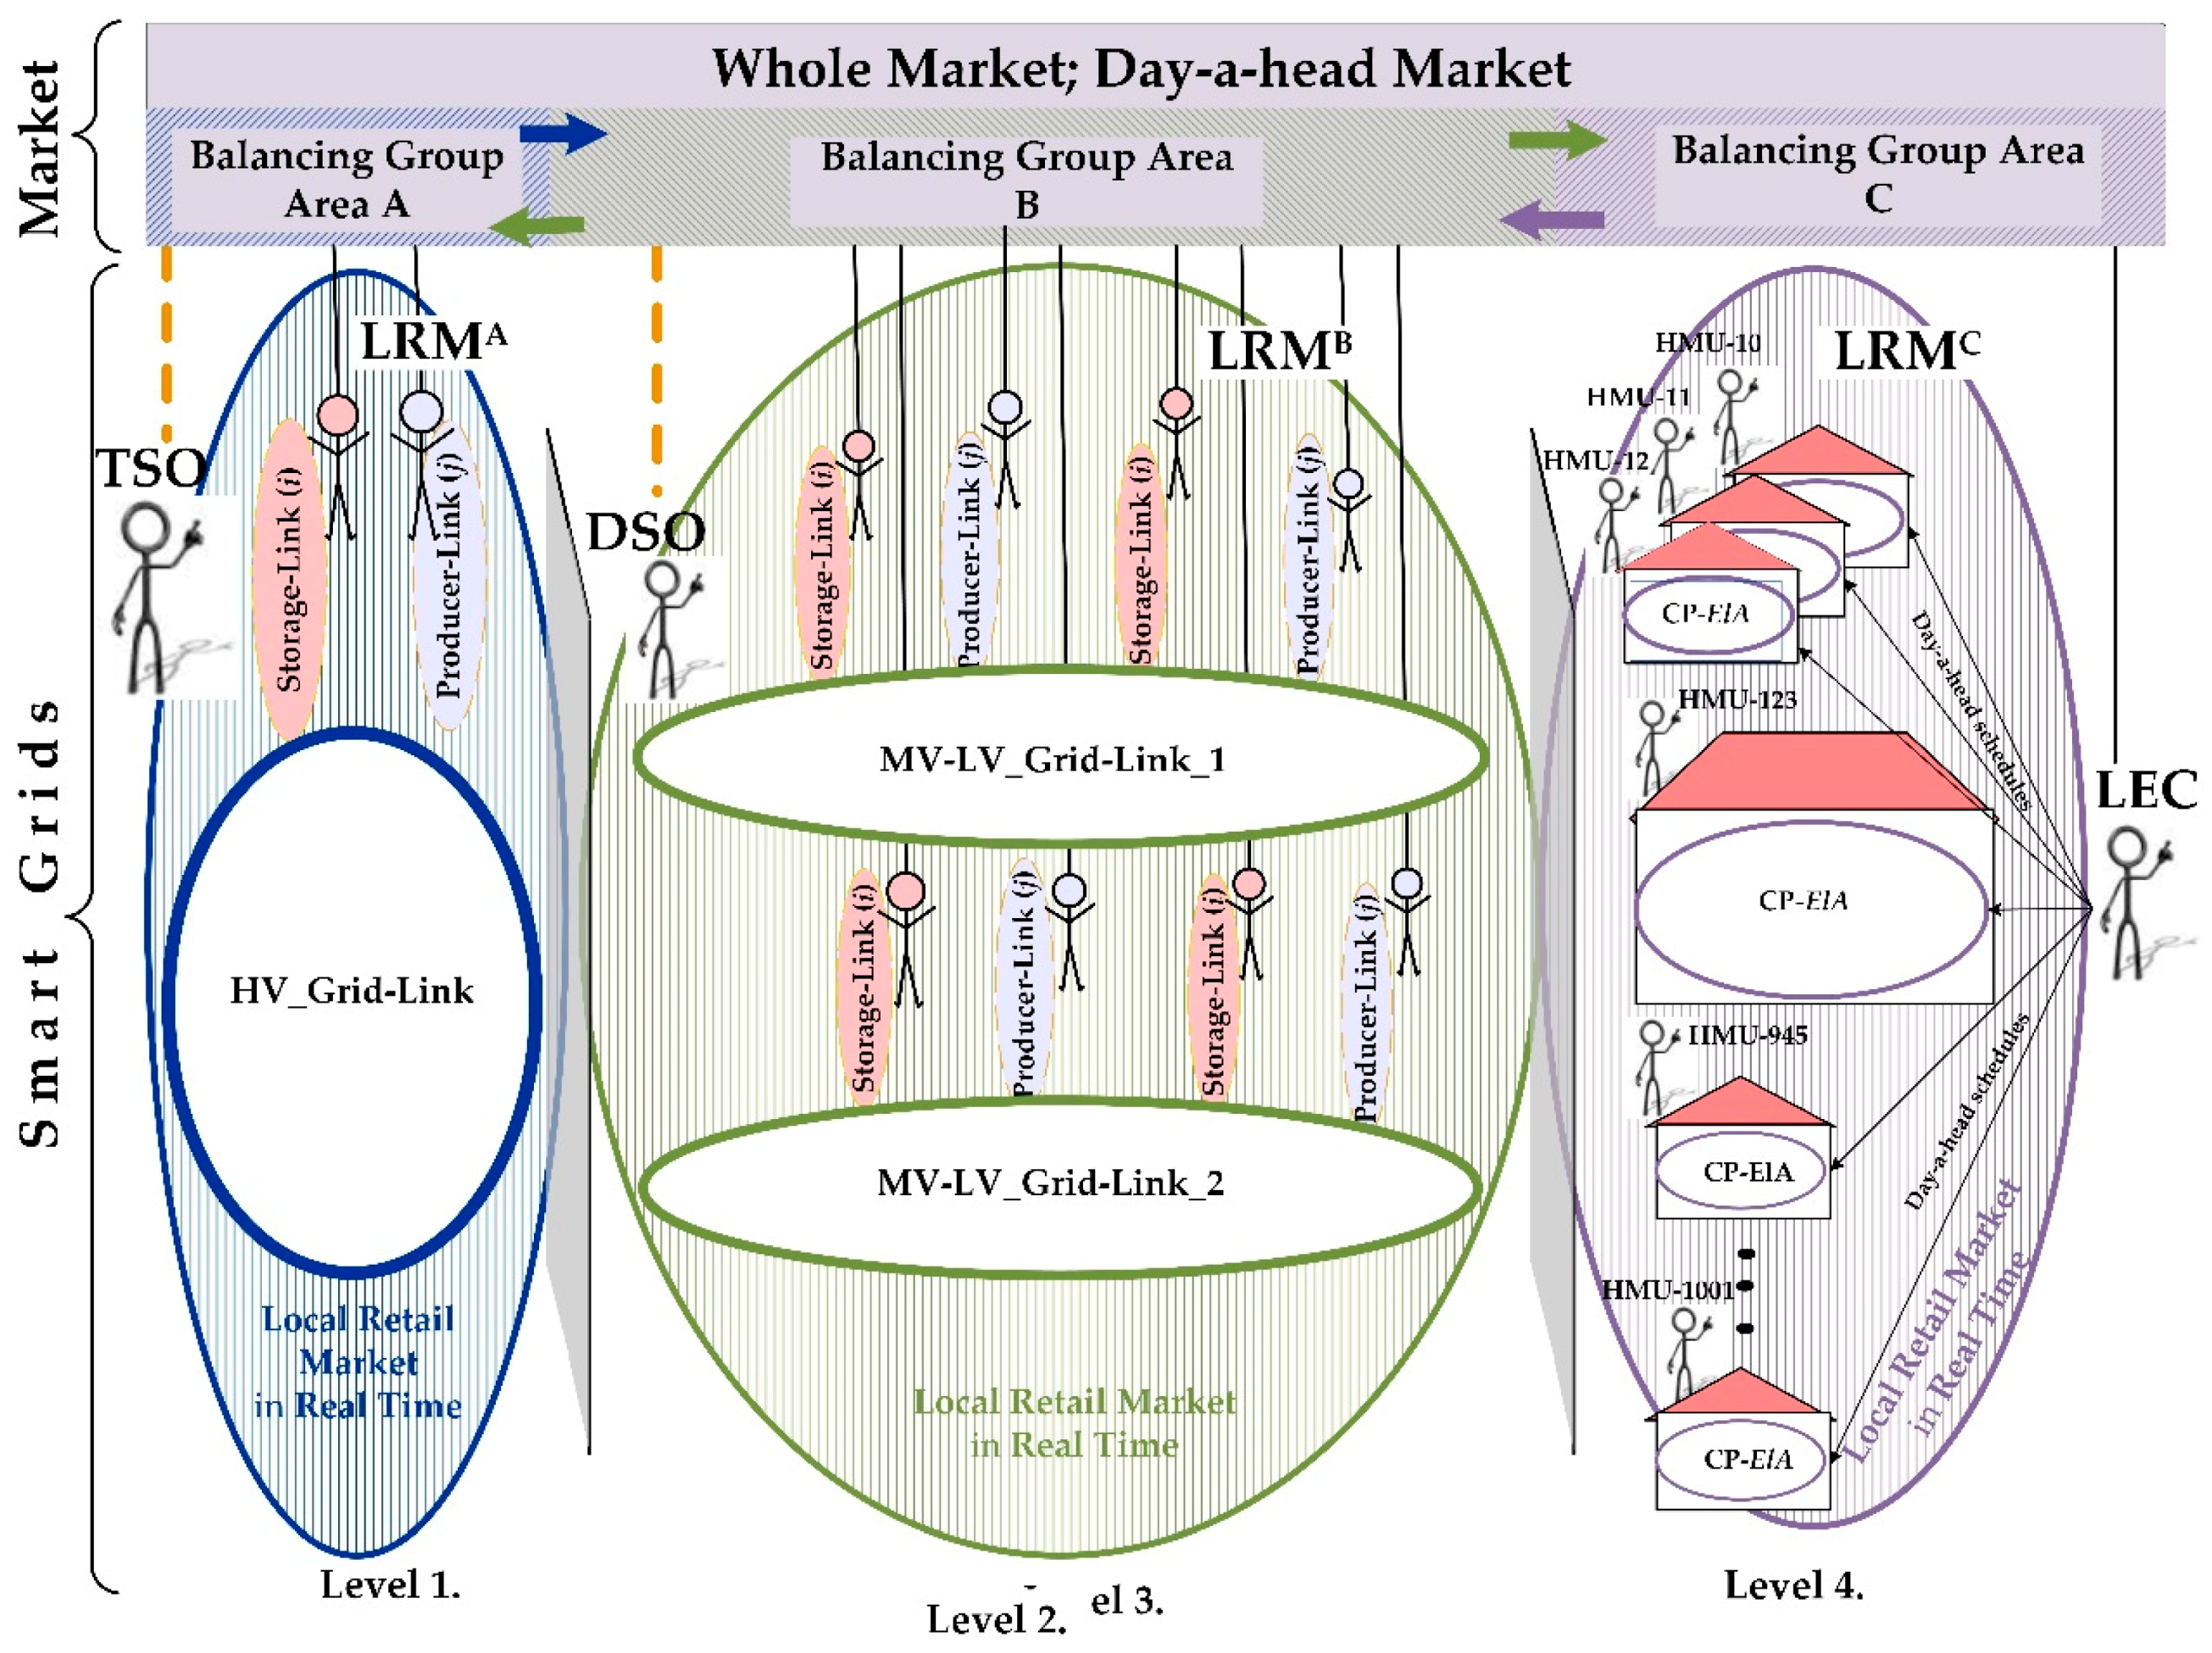
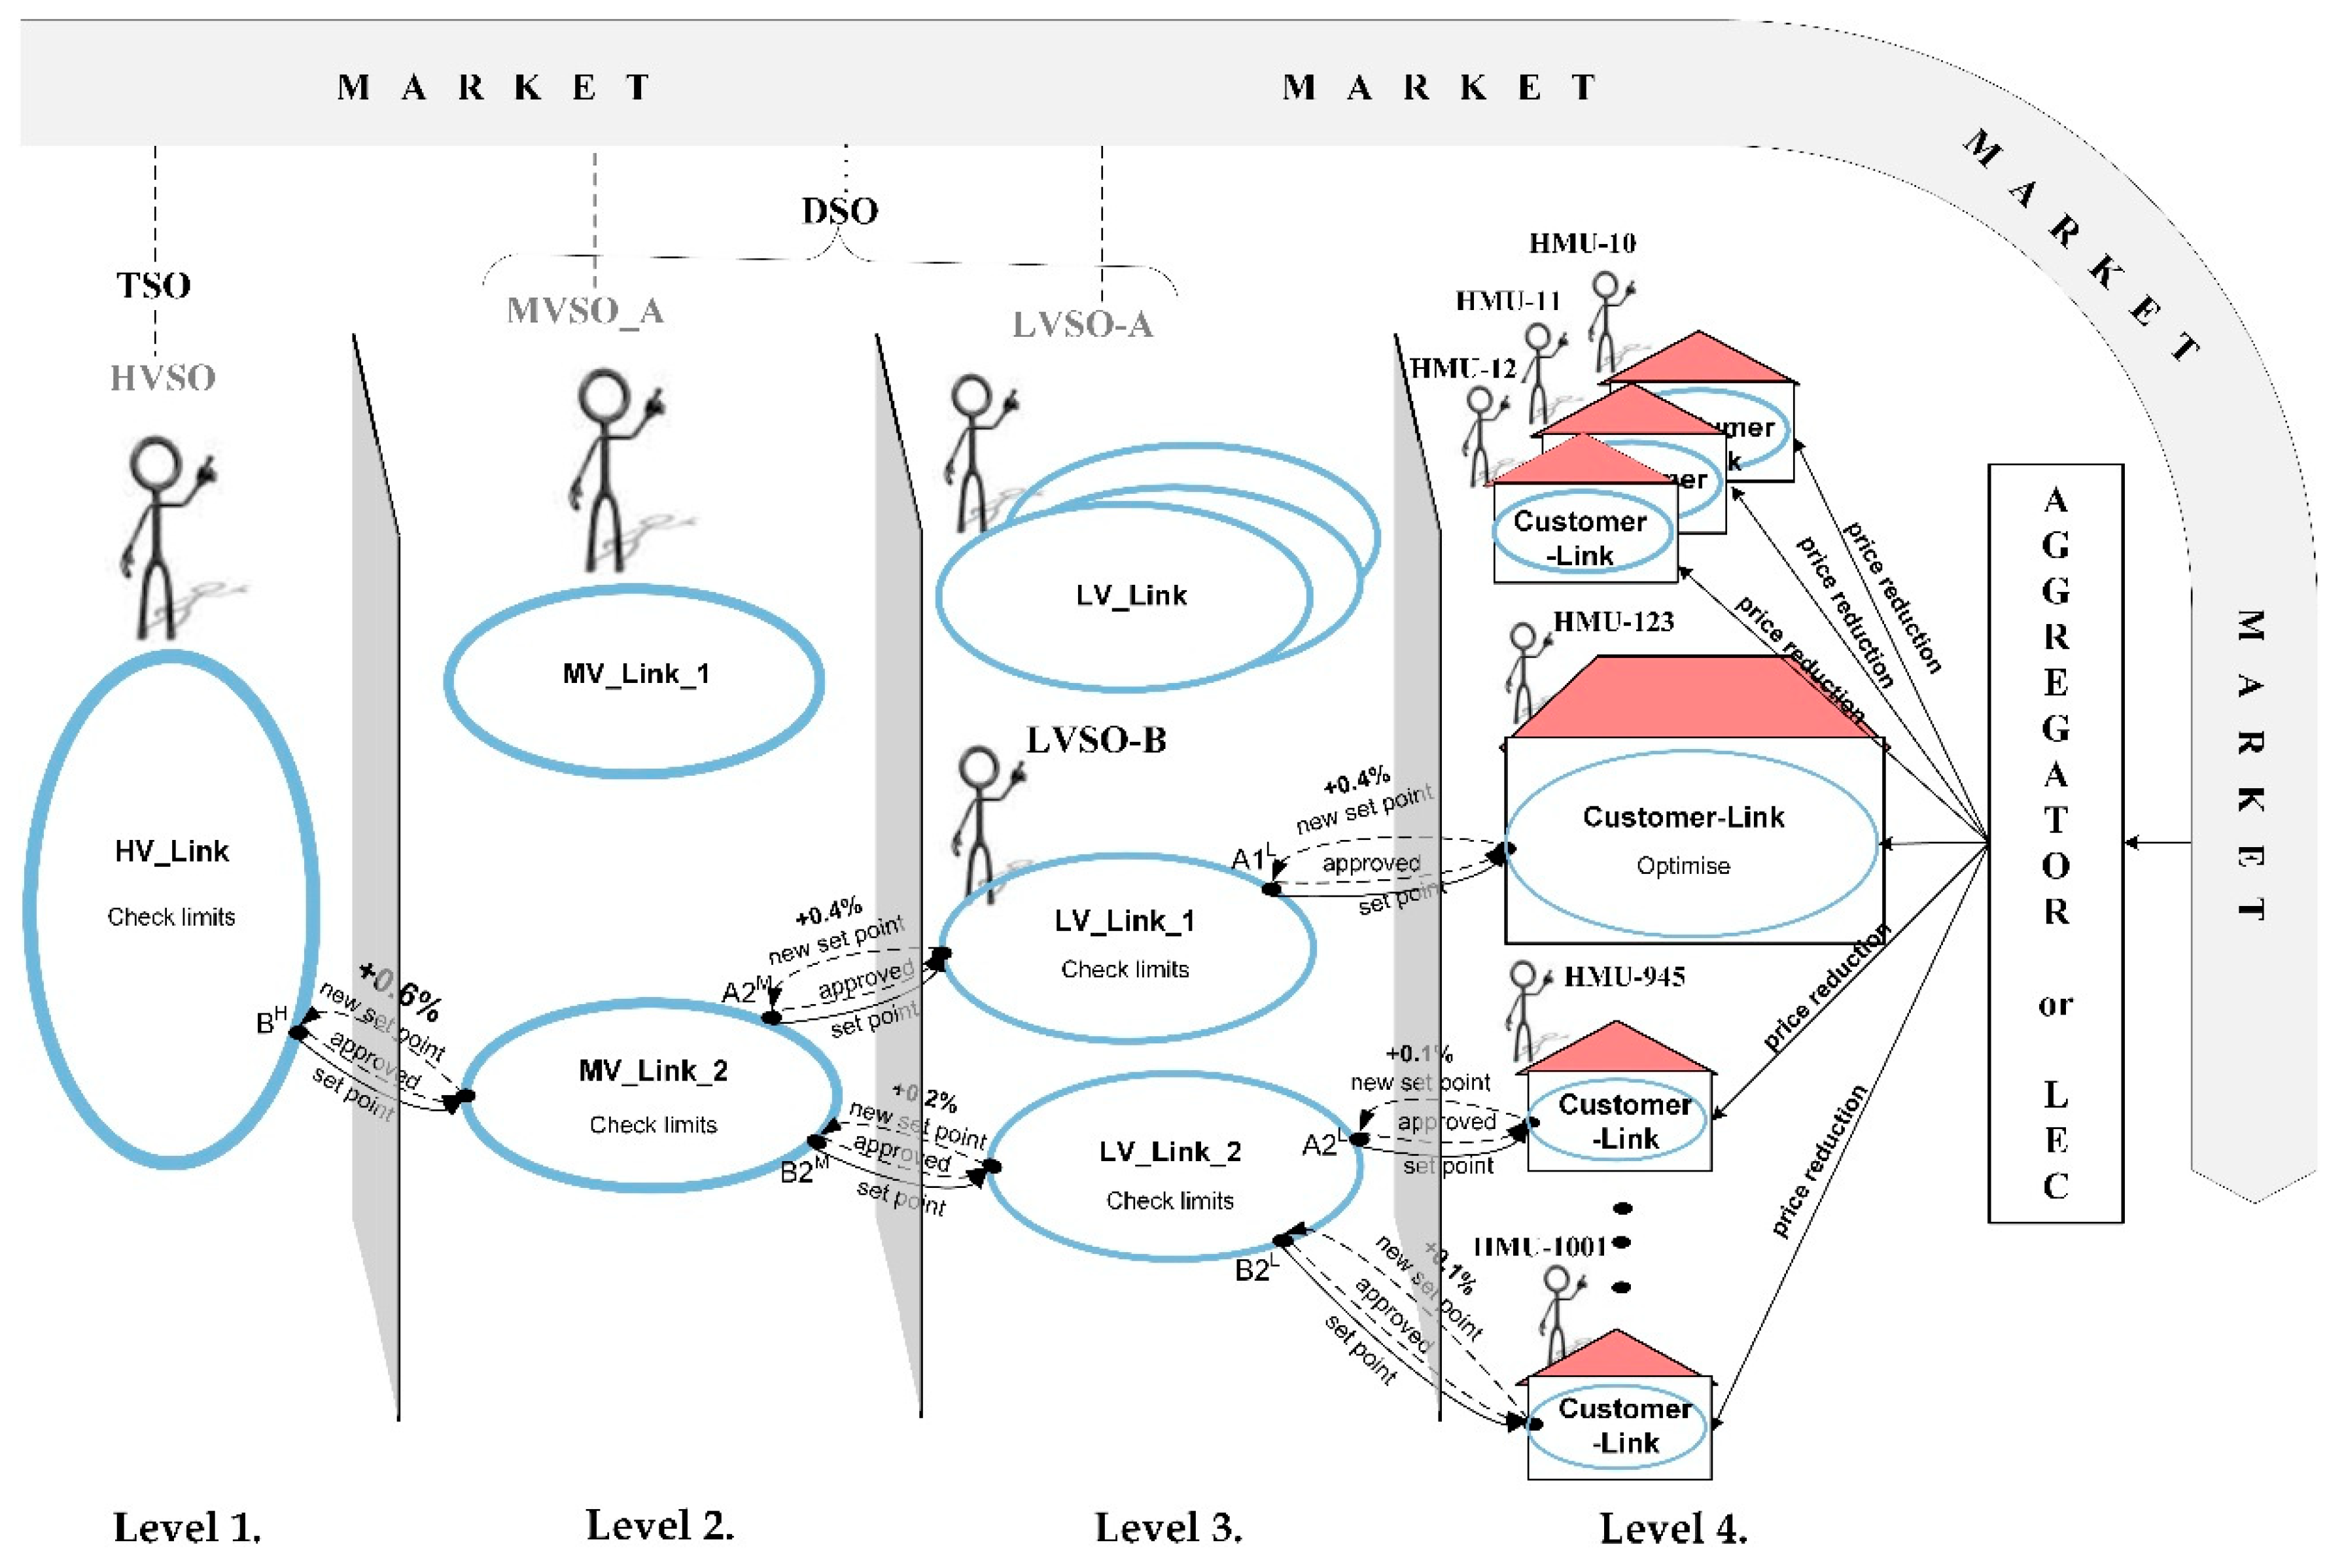
The holistic model associated with the energy market is derived from the technical holistic model, the “energy supply chain net”, as shown in Figure 13b. The whole energy market consists of coupled market areas (balancing groups) at the horizontal and vertical axes. TSOs operate on the horizontal axis of the holistic market model, while DSOs operate on the vertical. Based on this model, not only TSOs but also DSOs will communicate directly with the whole market to ensure a congestion-free distribution grid operation and to take over the task of load-production balance. The owner of the distributed energy resources as well as the prosumers (producers and consumers of electricity) may participate directly in the market or may do so via aggregators or local energy communities (LECs) [71]. The creation of the local retail markets (LRM) attracts the demand response bids and stimulates investment in the LEC areas (see Section 3.3.2).
3.3. LINK-Based Holistic Architecture
When the structure of electricity supply changes radically because of many DG units, each with the possibility of interfering with the system operation at all voltage levels, then a new architecture is needed to utilize this added flexibility so that power system operation can remain reliable. The new operational architecture of power systems should guarantee that it performs as expected by unifying their whole structure and by systematizing the execution of operational tasks. The basis for the design of the LINK-based holistic architecture is in its definition [39,72]:
Definition: A holistic power system architecture is an architecture in which all relevant components of the power system are merged into one single structure. These components could consist of the following: Electricity producer (regardless of technology or size, e.g., large power plants, DGs, etc.); electricity storage (regardless of technology or size, e.g., pumped power plants, batteries, etc.); electricity grid (regardless of voltage level, e.g., high, medium and low voltage grids); customer plants and electricity market.
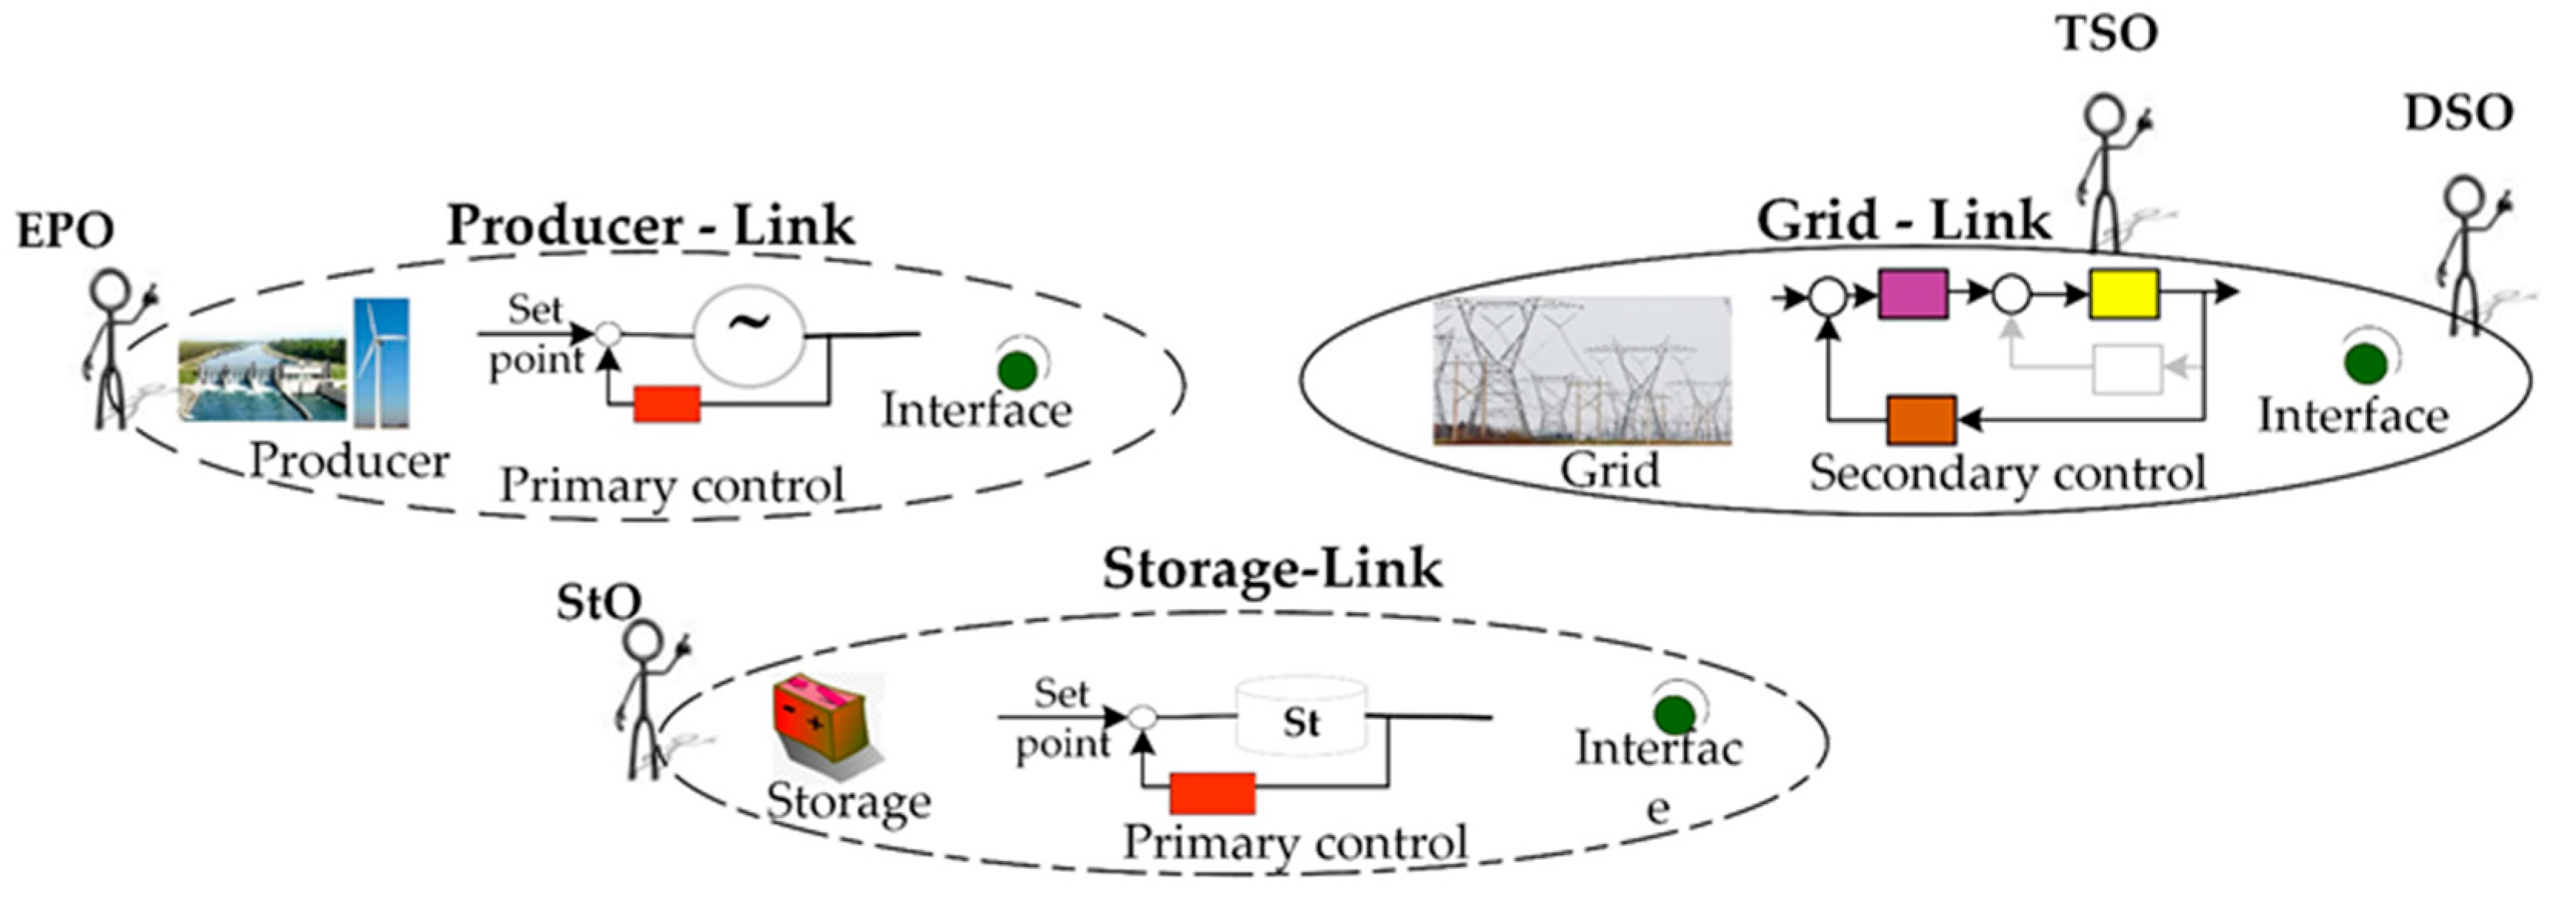
Fleshing out the holistic model into a schematic holistic architecture requires specification of the main independent architecture elements, Figure 14. There exist three independent main power system components, i.e., producer, storage and grid, which are the three basic elements of the architecture and create the basis for the definition of the architecture elements. They are defined as follows:
- Producer link is a composition of an electricity production facility, be it a generator, photovoltaic, etc., its primary control (PC) or the producer interface. Primary control refers to control actions that are done locally (device level) based on predefined set-points. The actual values are measured locally and deviations from the set-points results in a signal that influences the valves, excitation current, transformer steps, etc. in a primary-controlled power plant, transformer, etc., such that the desired power is delivered or the desired voltage is reached;
- Storage link is a composition of a storage facility, be it the generator of a pump power plant, batteries, etc., its PC and the storage interface;
- Grid link is a composition of a grid part, called a link grid, with the corresponding secondary control (SC) and link interfaces. SC refers to control actions that are calculated based on the grid link control area. It fulfils a predefined objective function by respecting the dynamic grid constraints on the grid link boundaries and the static constraints of electrical appliances (PQ diagrams of generators, transformer rating, etc.). Dynamic grid constraints are the reactive and active power exchange on the grid link boundaries that are agreed from the corresponding grid link operators [73]. The grid link contains SCs for both major entities of power systems—frequency and voltage. The SC algorithm fulfils technical issues and calculates the set points by respecting the dynamic constraints, which are necessary for stable and reliable operation. The link grid size is variable and is defined from the area where the secondary control is set up. Thus, a link grid may apply to a customer plant or even to a large high voltage grid area.
To overcome data privacy and cyber security challenges, a distributed LINK-based holistic architecture is chosen [38]. Its key principle is to prohibit access to all resources by default, allowing access only to a minimum of data. Each link has its own operator. Based on the architecture elements, operators can be classified into three types:
- (1)
- The producer link operator operates each power plant regardless of technology and size (excluding very small power plants, for example PVs, installed on the customer side);
- (2)
- The storage link operator operates each storage regardless of technology and size (excluding very small storage, for example batteries, installed on the customer side);
- (3)
- The grid link operator operates the grid regardless of voltage level (excluding the customer grid). Customers themselves are responsible for the operation of all their home elements.
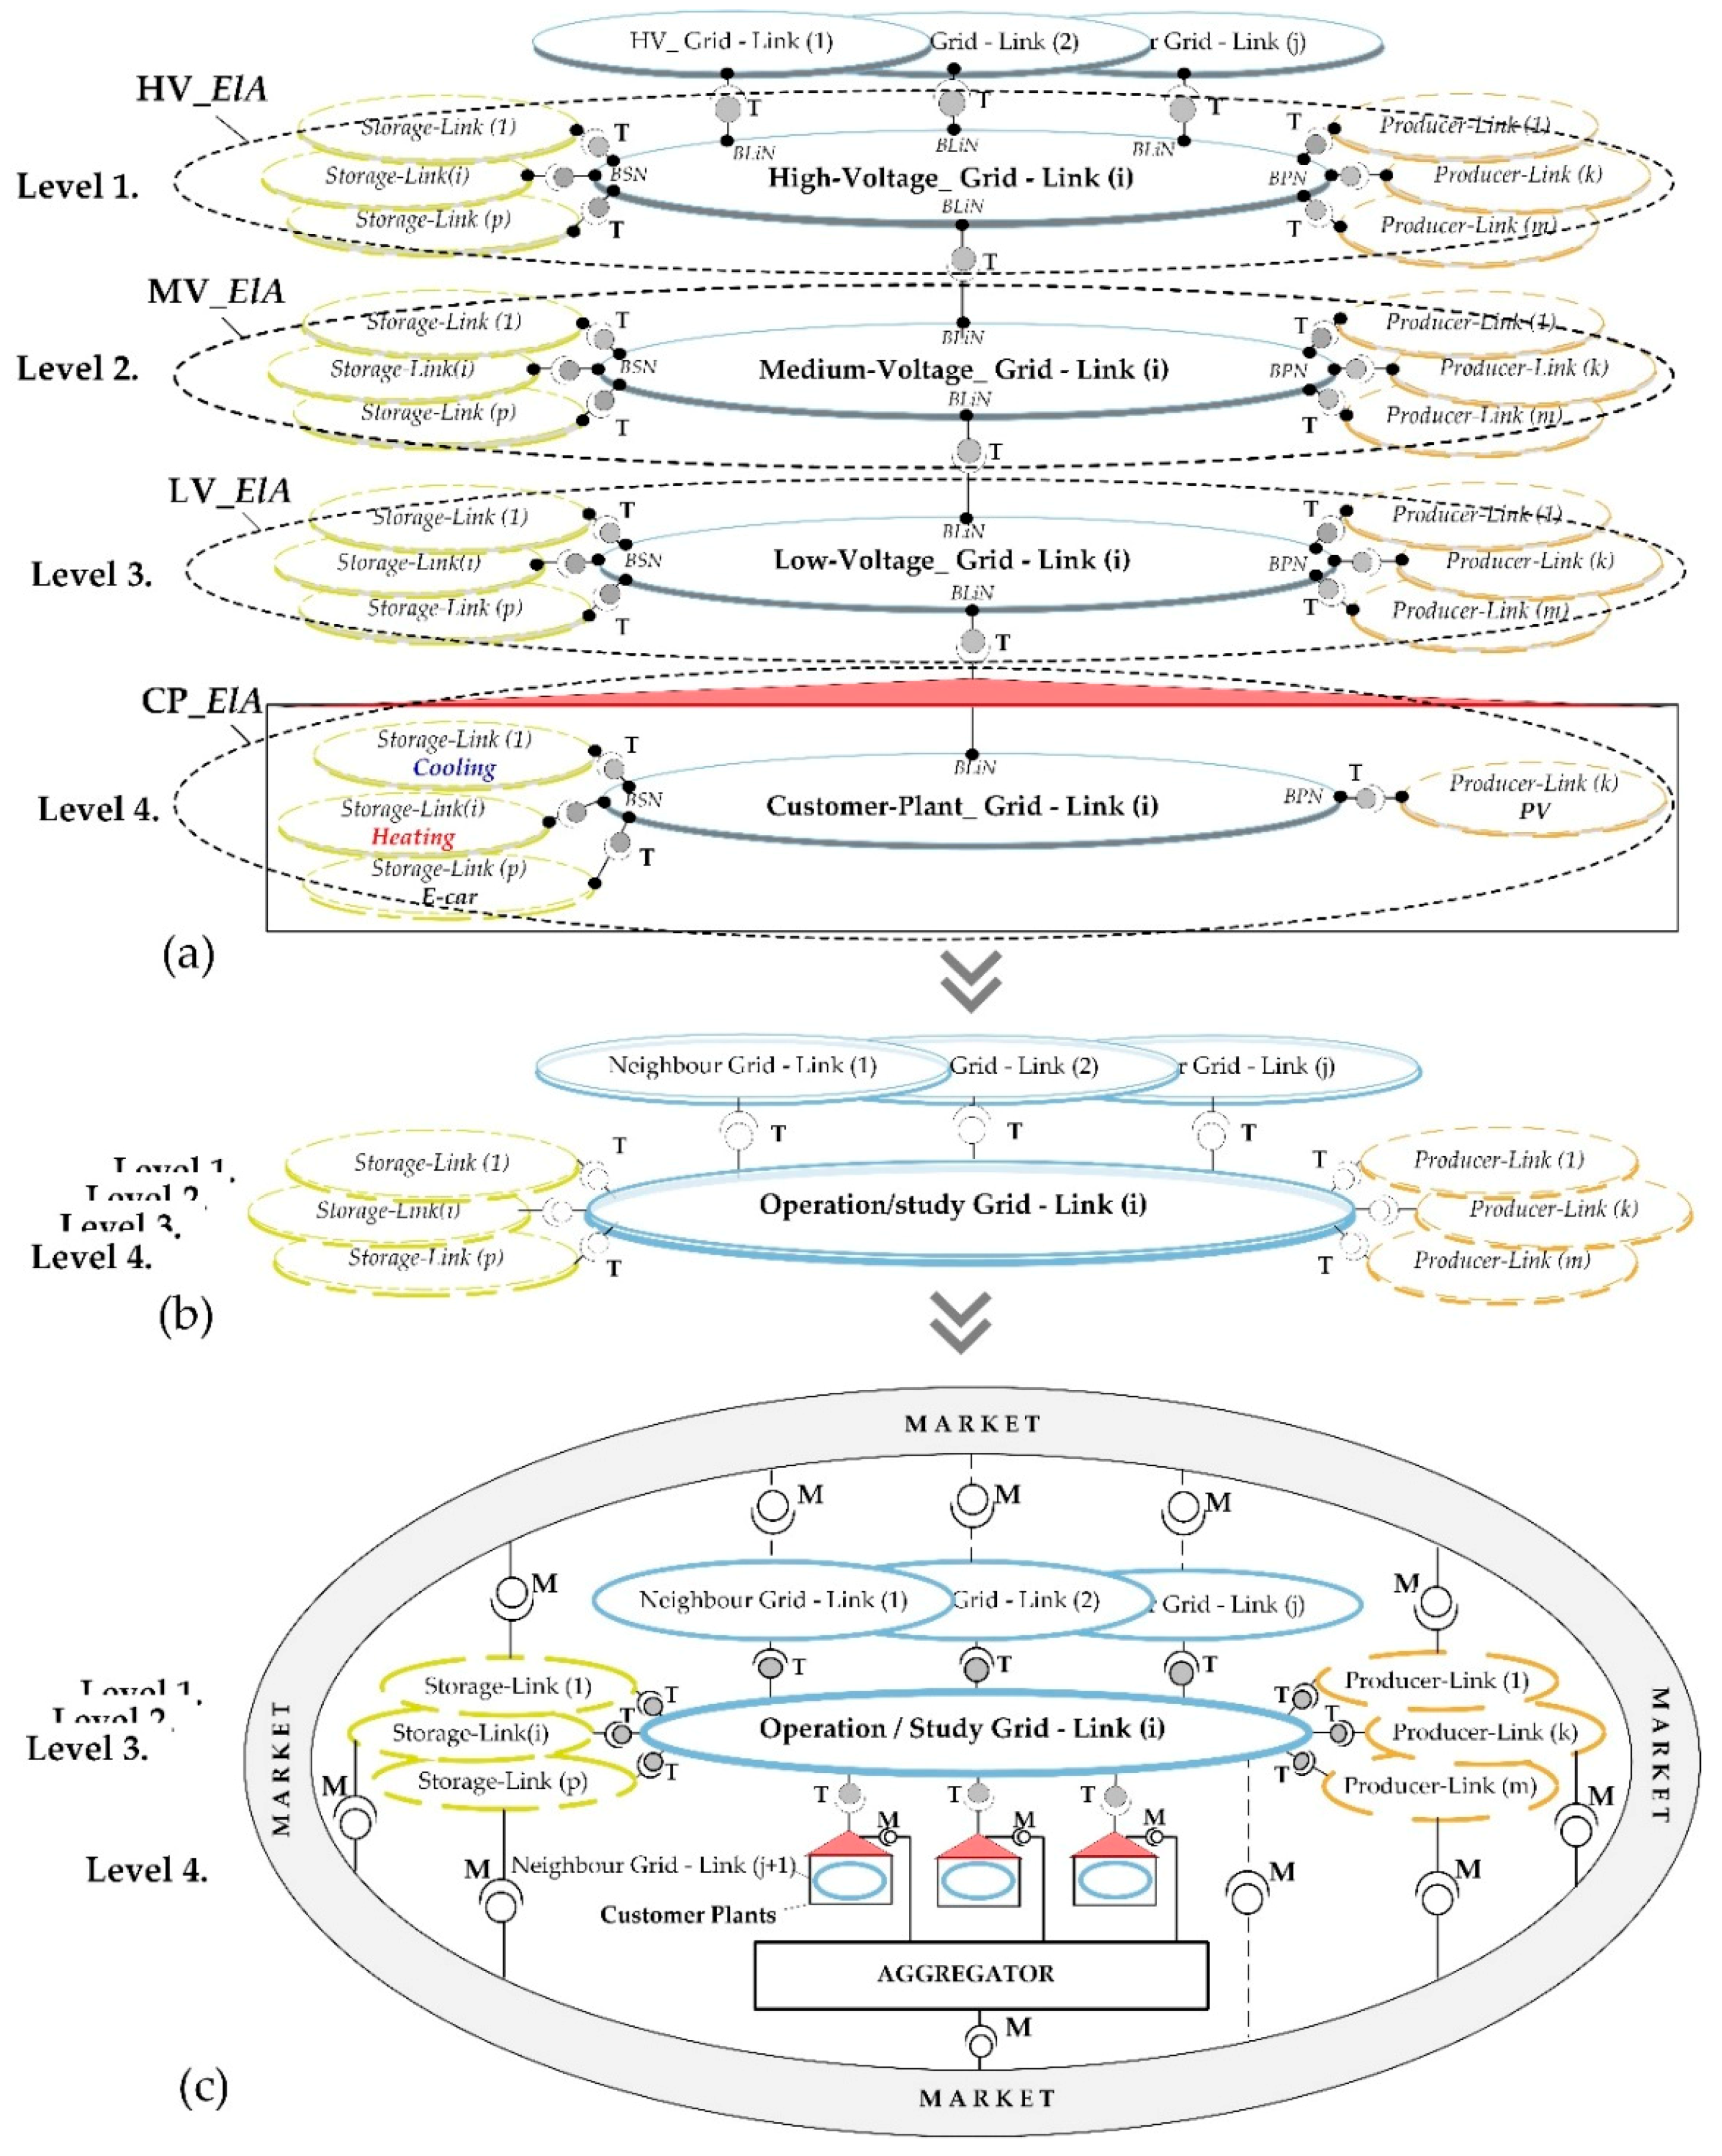
The technical/functional stage includes the conjunction of all three architecture elements in the four fractal levels (Figure 15a)) and a standardized architecture structure encompasses the four fractal levels. The different links communicate with each other via well-defined technical interfaces [38] “T”. This is a detailed architecture level facilitating all technical/functional processes, which are needed to reliably and economically operate the decentralized power system. All processes can be described by using the unified modelling language (UML) diagrams (see Section 3.3.3). Additionally, it enables the step into the level of management systems, i.e., the application level, to develop concrete applications, (see details in the “Methods” section). The standardized structure of the technical/functional architecture allows the transition to the generalized architecture level (Figure 15b), where the four fractal levels are represented very compactly. The generalized architecture is the core of the LINK-based holistic architecture (Figure 15c). The market surrounds it and communicates with it through the market interfaces, “M”, by exchanging aggregated meter readings, external schedules, etc. [39]. At the holistic level, the grid links of customer plants are removed from the generalized presentation because they are too small to participate directly in the whole market. They may participate in the common market through aggregators or through energy communities [71]. For the sake of privacy and cyber security, the technical interfaces “T” are designed apart from the market interfaces “M”. The new designed holistic architecture facilitates two operating modes: (1) Autonomous—each individual link or link bundle operates independently by respecting the contractual arrangements with other relevant boundary links or link bundles. All links are connected together creating a large power system; (2) autarkic or self-sufficient—an optional operating mode, which may be applied in any link bundle that consists of at least one grid link and one producer link or storage link as long as it is self-sufficient and self-sustaining without any dependency on electricity imports. Restoration—an option of the autarkic operating mode, which may be applied after a blackout during the restoration process to supply electricity to at least the communication appliances. In order to successfully switch the operating mode from autonomous to autarkic, a familiar resynchronization process should be established, where each grid link has a secondary control on active and reactive power that supports the synchronization process. Depending on the properties of the links, the resynchronization with other links may be automatic or manual. However, resynchronization philosophies should be initially investigated to determine the most appropriate approach.
Operators are responsible for safe, reliable and efficient operation of the power grid at all times. The LINK-based holistic architecture supports them to achieve these goals, facilitating the execution of a set of functions and tasks that are encapsulated in various technical/functional operational processes, such as: Monitoring, generation-load balance [38], voltage assessment and var management [67], static and dynamic security [38], emergency [38], price driven demand response (see Section 3.3.3), etc. Some applications in the context of the holistic architecture are given in the following.
3.3.1. Compact Representation of the Control-Chain Strategy
The standardized architecture of LINK-based architecture enables a compact and clear representation of the control strategy, which is designed as a chain net. According to Section 3.2, the latter is conceived on the X- and Y-axes. The different units of secondary control form a chain, which is expressed below in terms of volt/var control (VVC) chain.
The VVC chain in the X-axis extends to very HV and HV grids and is presented by the following generalized equation:
where calculates:
- the voltage set-point for each transformer included on the HV link grid that has an on-load tap changer (OLTC);
- the var set point or the switch position of for all RDs connected on the HV link grid;
- the var set point for all generators connected on the HV link grid;
- the var set point for all neighbour HV, MV or LV grid links when available.
While, the VVC chain in the Y-axis extends to HV, MV and LV grids and CP. It is presented by the following generalized equation:
where calculates:
- the voltage set-point for the supplying transformer and for other transformers included on the MV link grid (e.g., 34.5 kV/11 kV, etc.) that have OLTC;
- the var set point or the switch position of for all RDs connected on the MV link grid;
- the var set point for all DGs connected on the MV link grid;
- the var set point for all neighbour MV or LV grid links when required, while respecting the var constraint on the border with HV .
calculates:
- the var set point for all RDs connected on LV link grid;
- the var set point for all DGs connected on LV link grid;
- the var set point for all neighbour CP grid links when required, while respecting the var constraint on the border with MV .
calculates:
- the var set point of the inverter connected on CP link grid; while respecting the var constraint on the border with LVSome practical applications of Equation (5) are shown in Section 3.3.4 and in reference [74].
3.3.2. Smart Grid and Market Harmonized Structures
The large-scale DER integration increases the efficiency of the power grid and helps with its decarburization. In addition, their existence contributes to the LRM design, enabling their market-based control, which in turn stimulates investment in the LEC areas.
The market-based control must take into account the technical behaviour of the smart grids and support their safe reliable and resilient operation, while at the same time attracting the demand response bids. This is illustrated below by describing the harmonization and coordination of the market structure with the grid link arrangement, Figure 16. The implementation of LRMs requires the creation of balancing group areas (BGA) within the whole market, the day-a-head market that harmonizes with the grid links as follows:
- BGA is a geographical area consisting of one or more grid links with common market rules and has the same price for imbalance in the day-a-head market. In general, a TSO grid includes one grid link, while the grid of a DSO may include several grid links. Additionally, all grid links included in one BGA should be operated by one DSO (not by several DSOs).
- The geographic boundaries of BGA may vary considerably and are defined by the external boundaries of grid links contained in the BGA. Grid links may have two types of boundaries: external and internal. The external boundaries exist between different links, which have different owners or operators i.e., between TSO and DSO. They are subject to the data security and privacy because of the data exchanges between two different companies. Internal interfaces are set between different links, which have the same owner or operator, e.g., the same DSO. They are subject only to the data security [73].
- All electricity producers, storages and consumer, that are electrically connected to the grid links belonging to the BGA participate in the same balancing group.
- The grid link operators (GLO may be a TSO, DSO or LEC) should act as neutral market facilitators having the responsibility to control and independently balance power flow fluctuations in their own area and for the secure and reliable operation of the grid. Moreover, each GLO provides ancillary services to the neighbor grid link areas to ensure the reliability of the electricity supply.
The electricity market is thus similar to the physical reality of power flows, as neighboring grids links are physically connected anyway and electricity always takes the shortest route from producer to consumer—across grid links and market area boundaries. The rules and methods for LRM operation should be in line with national policies and are therefore the subject of other studies.
The harmonized electricity market structure facilitates the introduction of the demand response process in large scale as follows.
3.3.3. Demand Response Process
This is illustrated below by describing the process of price driven demand response. The activation of residential, commercial and small business sectors, which join the real-time pricing demand response through already concluded contracts, may be triggered at any time. Their degree of participation in the demand response process may be different depending on the time of the day, duration interval, price value, etc. In the case of a surplus of electricity in the market, the electricity price decreases. All market participants and market operators will be notified to allow them the possibility to act on time. Figure 17 shows the information flow during price driven demand response. This enables residential, commercial and small business sectors to perceive transparent energy prices and to contribute in the reliable and efficient operation of electric power systems.
3.3.4. Conservation Voltage Reduction in MV Level
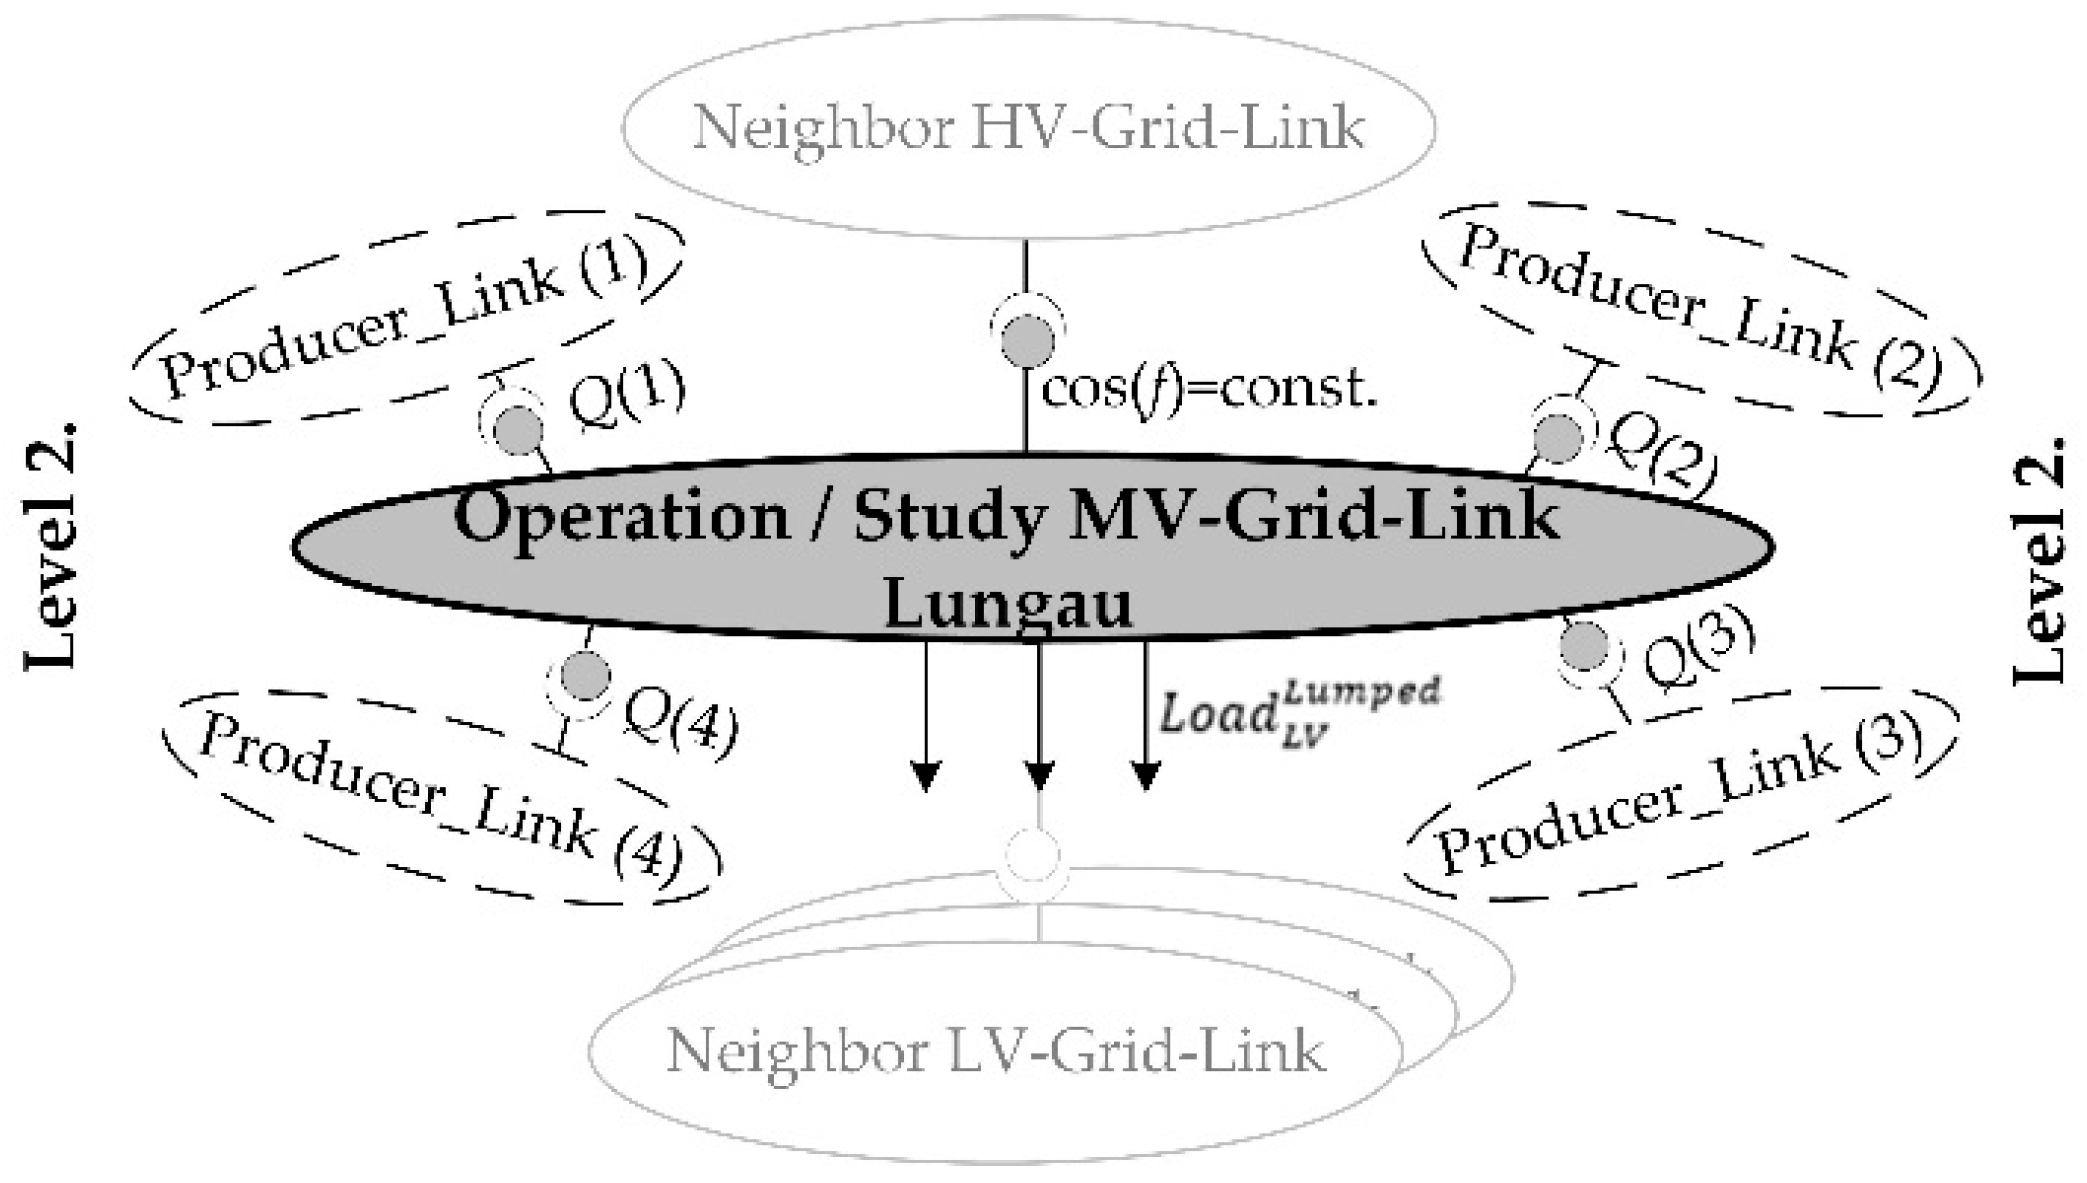
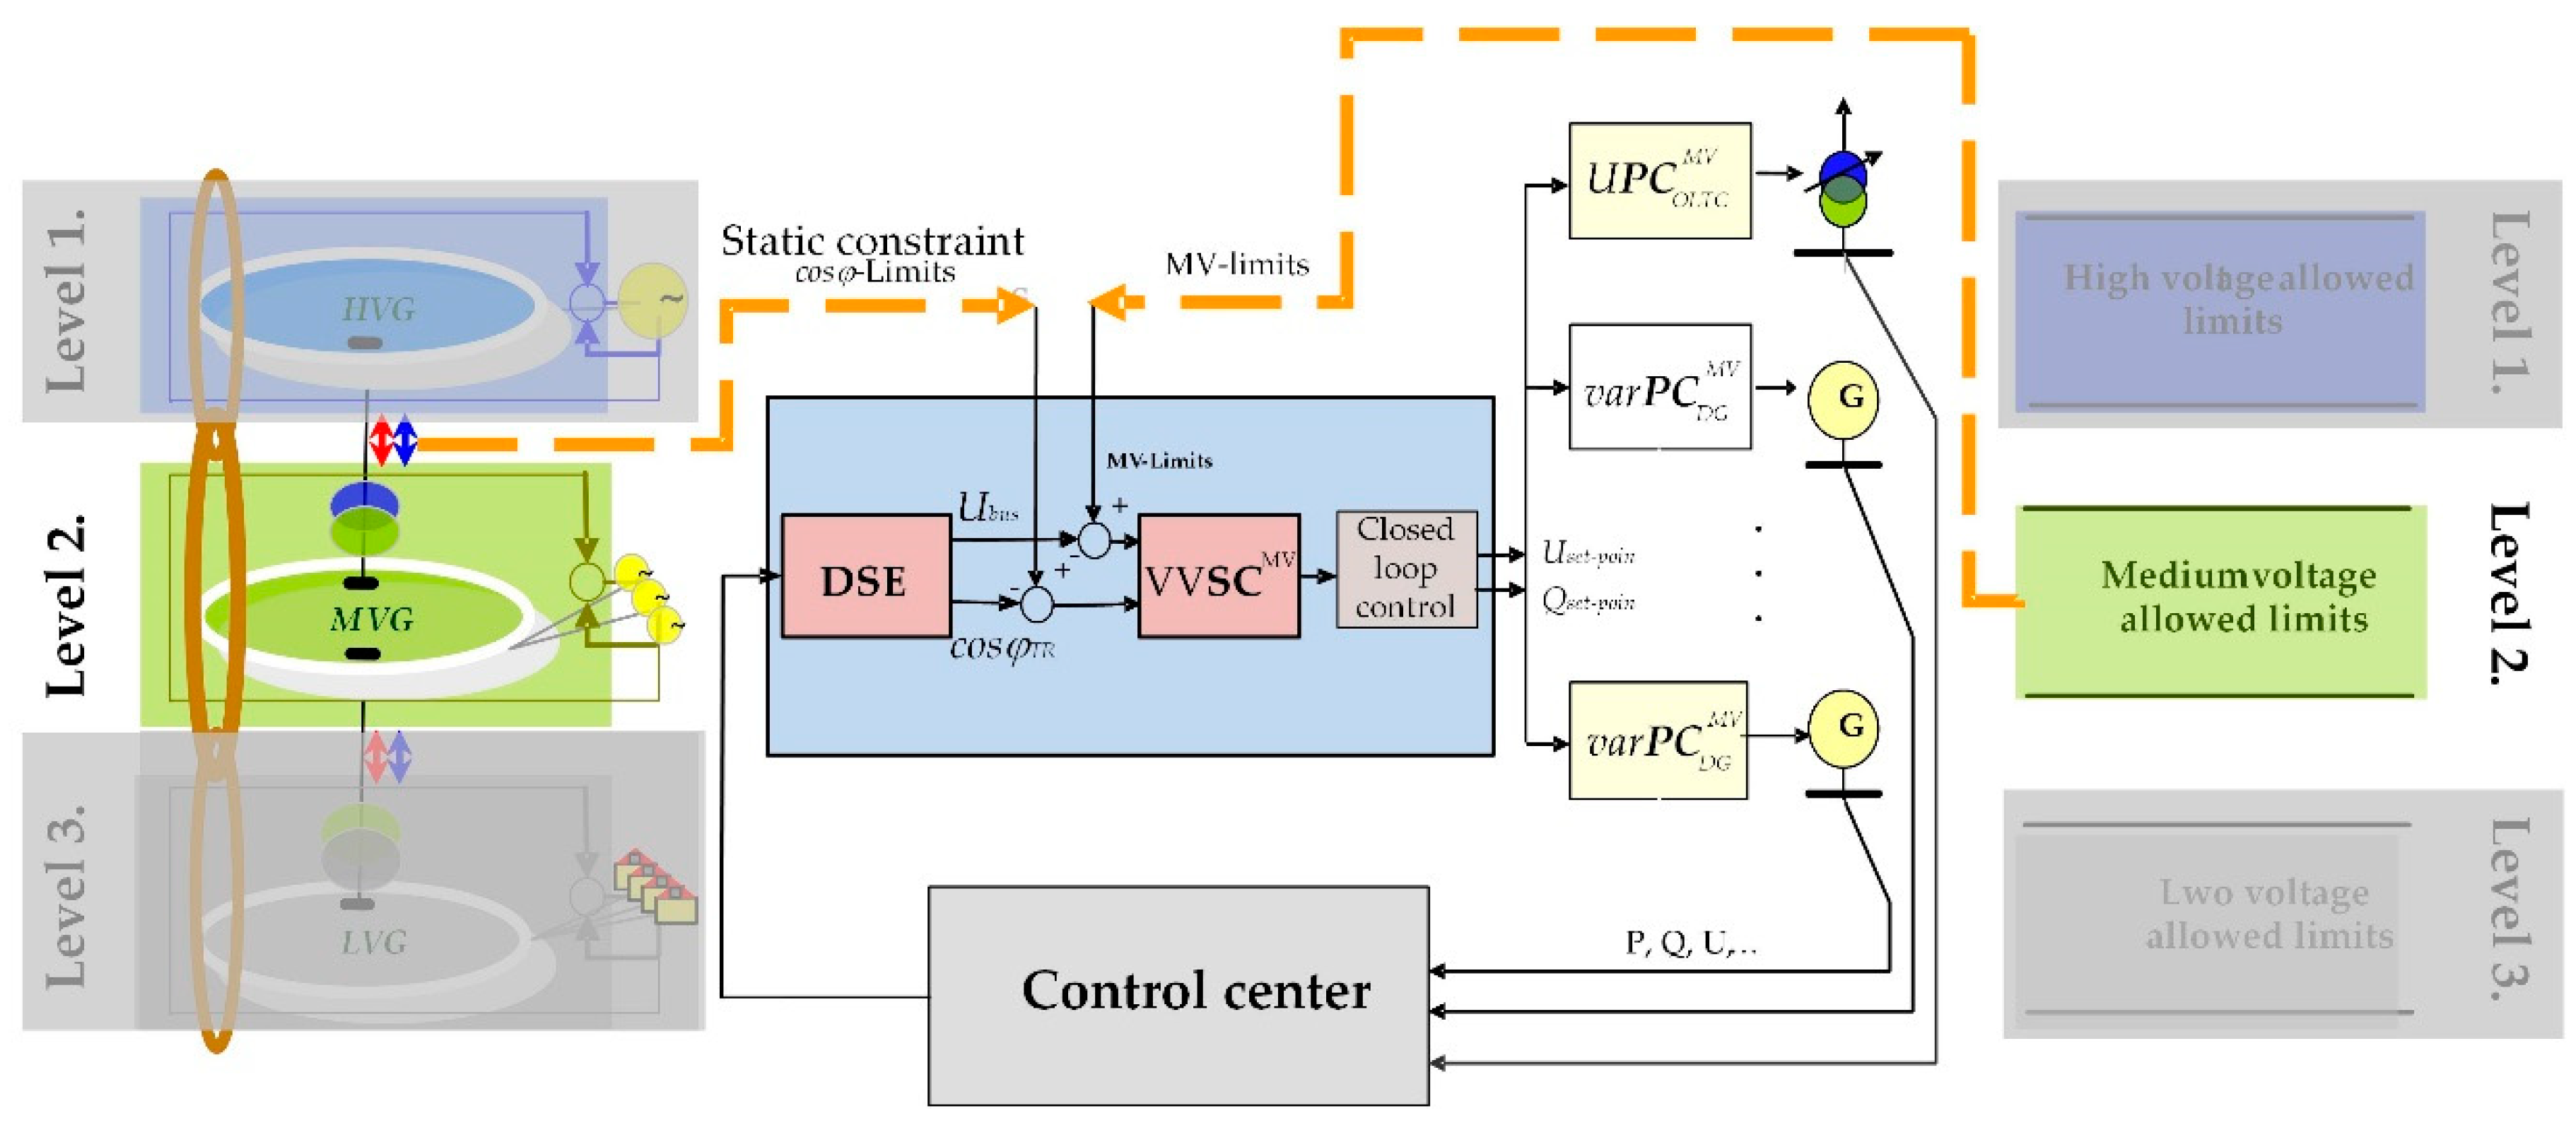
The proof of the concept is performed in the frame of the industrial research project ZUQDE (central volt/var control in presence of DGs), Salzburg, Austria, based on one of the major entities of power systems, the voltage [75,76]. The scope was fractal level 2 (MV), where the secondary control link was realized by means of the volt/var control, Figure 18.
The applied algorithm calculated the set points by respecting the constraint, which was set to the HV/MV transformers by means of a constant cosΦ. The set points, reactive power Q and voltage, were sent to all four “run of river” distributed generators (DG) and to the feeder head bus bar, respectively, Figure 19. All relevant generators were upgraded along with the primary control, thus building up the producer component. All distributed transformers were modelled loads. As a result, the voltage in the Lungau region was automatically controlled and the grid was dynamically optimized in real time for more than one year.
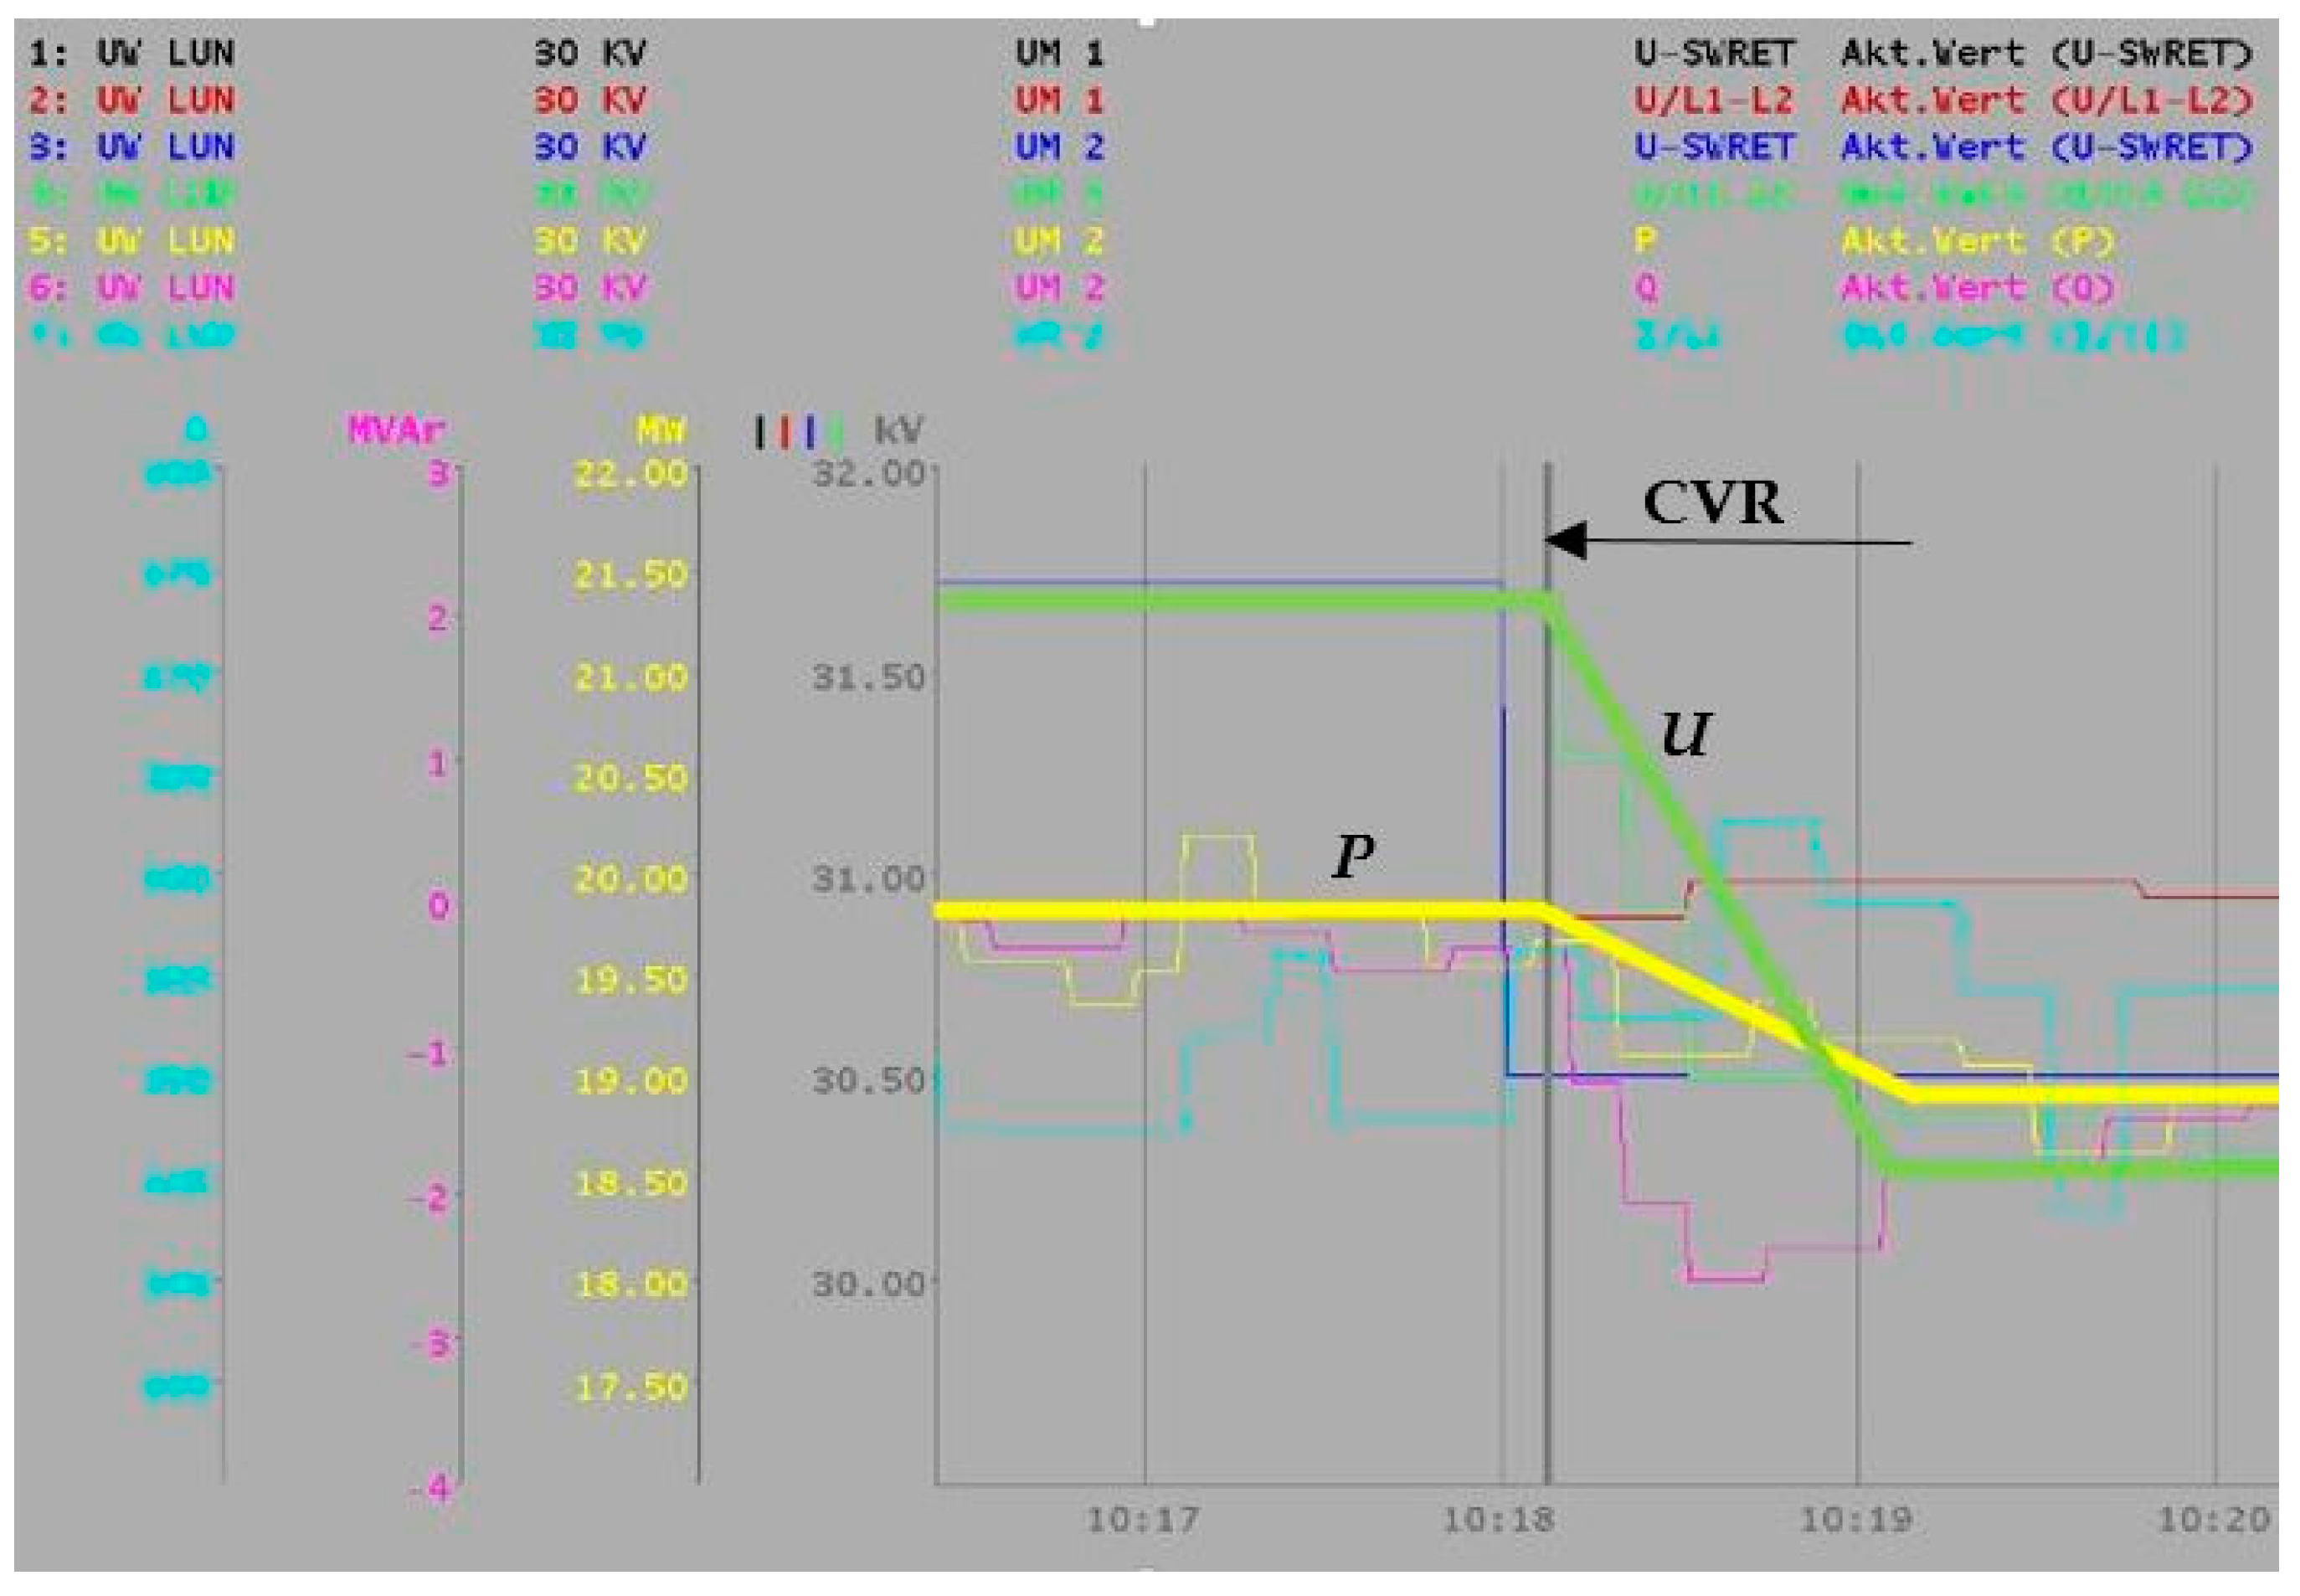
The voltages, power and current during the CVR switching process are shown in Figure 20. The snapshot is made on the SCADA system of the control center. The curves of voltage in one of the 30 kV bus bars and of the active, measured on the supplying transformer level, are highlighted.
Significant in the consideration are the curves shown in blue, green and yellow. The blue curve shows the voltage set point on the 30 kV side of the supplying transformer. At 10:18 a.m., the VVC set in the CVR mode calculated new set points for the 30 kV bus voltage calculated new set points for the 30 kV bus voltage and the reactive power of DGs. The voltage set point changed from 31.7 kV to 30.5 kV. This corresponds to an adjustment of the on-load tap changer by two steps. The green curve shows the measured voltage on the 30 kV bus bar. Due to the reaction time of the OLTC, the new voltage set point was reached after about one minute. The yellow curve shows the active power, which decreases from 19.9 MW to 19.0 MW. This corresponds to a reduction of the active power by 4.7%. The light blue or turquoise curve shows that the voltage reduction results in a slight increase of the current.
4. Conclusions
The definition of the architectural paradigm LINK is finally validated by the fractal analysis: It consists of unique and independent elements that avoid misinterpretation or the need for any changes in its definition. Its use allows the convergence of the results of various scientific works and the implementation of smart grids on a large scale.
The fractal analysis is a suitable instrument for characterizing the heterogeneity of the smart grid structure, as it is capable of characterizing the spatial differences within the smart grid. Based on fractal analysis, two fractal anomalies are identified in the existing power system structure. Firstly, 1:1 transformers with voltage control capability are missing in fractal level 4. Their presence could contribute to increased energy savings, which is a key objective under actual climatic conditions. However, fundamental studies are needed to assess this change in the current power grid structure. Secondly, reactive devices are missing in fractal level 3. Studies have shown that eliminating this anomaly produces essential benefits. The fractal dimension analysis indicates that to realize smart grids, the highest global resources should be provided for the development and purchase of electrical devices, followed by a continuous reduction in resources for CPs, LV and MV up to the lowest resource allocation for the HV level.
The LINK-based holistic architecture reflects the principles of the fractal. Repeating the same structures in ever smaller dimensions greatly improves the practical relevance of the LINK solution. The compact and clear representation of the control strategy, which is designed as a chain net, is straightforward und understandable for every electrical engineer. The LINK-based holistic architecture considers the entire power system from high, medium and low voltage levels, including customer plants and the market. It facilitates the description of all power system operation processes such as load-generation balance, voltage assessment, dynamic security processes, etc. It enables the large-scale DER implementation, respecting data privacy and minimizing cyber security risks. The new market structure harmonizes with the grid link arrangement, facilitating the demand response process. The CVR process is also easy to implement.
The realization of significant processes required for the operation of smart grids, such as demand response and load/generation balance need further investigation to show the effectiveness using the proposed architectural LINK-paradigm.
Funding
This research received no external funding.
Acknowledgments
Open Access Funding by TU Wien.
Conflicts of Interest
The author declare no conflict of interest.
References
- Feynman, R.P. The Character of Physical Law; Modern Library: New York, NY, USA, 1994. [Google Scholar]
- Maier, M.W.; Rechtin, E. The Art of Systems Architecting; CRC Press, Taylor & Francis Group: Boca Raton, FL, USA, 2009; ISBN 9781420079135. [Google Scholar]
- Wolak, F.A. Diagnosing the California Electricity Crisis. Electr. J. 2003, 16, 11–37. [Google Scholar] [CrossRef] [Green Version]
- Burr, M.T. Reliability demands will drive automation investments. Fortnightly Magazine. 1 November 2003, pp. 1–4. Available online: https://www.fortnightly.com/fortnightly/2003/11/technology-corridor (accessed on 3 May 2016).
- Owens, B. The Rice of Distributed Power; General Electric Company: New York, NY, USA, 2014; Volume 47, Available online: https://www.ge.com/sites/default/files/2014%2002%20Rise%20of%20Distributed%20Power.pdf (accessed on 20 November 2018).
- Myrda, P. Smart Grid Enabled Asset Management; Report 1017828; EPRI: Paolo Alto, CA, USA, 2009. [Google Scholar]
- Hendschin, E.; Uphaus, F.; Wiesner, T.H. The Integrated Service Network as a Vision of the Future Distribution Systems. In Proceedings of the International Symposium on Distributed Generation: Power System and Market Aspects; Royal Institute of Technology: Stockholm, Sweden, 2001. [Google Scholar]
- Stothert, A.; Fritz, O.; Sutter, M. Optimal Operation of a Virtual Utility. In Proceedings of the International Symposium on Distributed Generation: Power System and Market Aspects; Royal Institute of Technology: Stockholm, Sweden, 2001. [Google Scholar]
- Dielmann, K.; Veiden, A. Virtual power plants (VPP)—A new perspective for energy generation? In Proceedings of the 9th International Scientific and Practical Conference of Students, Post-Graduates Modern Techniques and Technologies, Tomsk, Russia, 7–11 April 2003; pp. 18–20. [Google Scholar]
- Zhang, G.; Jiang, C.; Wang, X. Comprehensive review on structure and operation of virtual power plant in electrical system. IET Gener. Transm. Distrib. 2019, 13, 145–156. [Google Scholar] [CrossRef]
- Bignucolo, F.; Caldon, R.; Prandoni, V.; Spelta, S.; Vezzola, M. The Voltage Control on MV Distribution Networks with Aggregated DG Units (VPP). In Proceedings of the 41st International Universities Power Engineering Conference, Newcastle-upon-Tyne, UK, 6–8 September 2006; Volume 1, pp. 187–192. [Google Scholar] [CrossRef]
- Pudjianto, D.; Ramsay, C.; Strbac, G. Virtual power plant and system integration of distributed energy resources. IET Renew. Power Gener. 2007, 1, 10–16. [Google Scholar] [CrossRef]
- Morais, H.; Kadar, P.; Cardoso, M.; Vale, Z.A.; Khodr, H. VPP operating in the isolated grid. In Proceedings of the IEEE Power and Energy Society General Meeting—Conversion and Delivery of Electrical Energy in the 21st Century, Pittsburgh, PA, USA, 20–24 July 2008; pp. 1–6. [Google Scholar]
- Saboori, H.; Mohammadi, M.; Taghe, R. Virtual Power Plant (VPP), definition, Concept, Components and Types. In Proceeding of the Asia-Pacific Power and Energy Engineering Conference (APPEEC), Wuhan, China, 25–28 March 2011. [Google Scholar]
- Lund, P. The Danish cell project—Part 1: Background and general approach. In Proceeding of the IEEE Power Engineering Society General Meeting, Tampa, FL, USA, 24–28 June 2007; pp. 24–28. [Google Scholar]
- Cherian, S.; Keogh, B.; Pacific, O. Dynamic distributed power grid control system. WO Patent 2012/008979, 19 January 2012. [Google Scholar]
- Mazzi, N.; Trivella, A.; Morales, J.M. Enabling Active/Passive Electricity Trading in Dual-Price Balancing markets. IEEE Trans. Power Syst. 2019, 34, 1980–1990. [Google Scholar] [CrossRef]
- Candra, D.I.; Hartmann, K.; Nelles, M. Economic Optimal Implementation of Virtual Power Plants in the German Power market. Energies 2018, 11, 2365. [Google Scholar] [CrossRef]
- Lasseter, B. Microgrids [distributed power generation]. In Proceedings of the IEEE Power Engineering Society Winter Meeting, Columbus, OH, USA, 28 January–1 February 2001; Volume 1, pp. 146–149. [Google Scholar]
- Lasseter, B. Microgrids. In Proceedings of the IEEE Power Engineering Society Winter Meeting, New York, NY, USA, 27–31 January 2002; Volume 1, pp. 305–308. [Google Scholar]
- Soshinskaya, M.; Crijns-Graus, W.H.; Guerrero, J.M.; Vasquez, J.C. Microgrids: Experiences, barriers and success factors. Renew. Sustain. Energy Rev. 2014, 40, 659–672. [Google Scholar] [CrossRef] [Green Version]
- Olivares, D.E.; Mehrizi-Sani, A.; Etemadi, A.H.; Cañizares, C.A.; Iravani, R.; Kazerani, M.; Hajimiragha, A.H.; Gomis-Bellmunt, O.; Saeedifard, M.; Palma-Behnke, R.; et al. Trends in microgrid control. IEEE Trans. Smart Grid 2014, 5, 1905–1919. [Google Scholar] [CrossRef]
- IEEE Task Force on Load Representation for Dynamic Performance. Load representation for dynamic performance analyses. IEEE Trans. Power Syst. 1993, 8, 472–482. [Google Scholar] [CrossRef]
- Stadler, M.; Naslé, A. Planning and implementation of bankable microgrids. Electr. J. 2019, 32, 24–29. [Google Scholar] [CrossRef]
- Kleineidam, G.; Krasser, M.; Reischböck, M. The cellular approach: Smart energy re-gion Wunsiedel. Testbed for smart grid, smart metering and smart home solutions. Electr. Eng. 2016, 4, 335–340. [Google Scholar] [CrossRef]
- Kießling, A. Beiträge von moma zur Transformation des Energiesystems für Nachhaltigkeit, Beteiligung, Regionalität und Verbundheit. Modellstadt Mannheim (moma). Projekt Abschlussbericht; MVV Energie: Mannheim, Germany, 2013. [Google Scholar]
- Benz, T.; Dickert, J.; Erbert, M.; Erdmann, N.; Johae, C.; Katzenbach, B.; Glaunsinger, W. The Cellular Approach. VDE-Study. 2015. Available online: https://shop.vde.com/de/copy-of-vde-studie-der-zellulare-ansatz (accessed on 16 February 2017).
- Morch, A.Z.; Jakobsen, S.H.; Visscher, K.; Marinelli, M. Future control architecture and emerging observability needs. In Proceedings of the IEEE 5th International Conference on Power Engineering, Energy and Electrical Drives, Riga, Latvia, 11–13 May 2015; pp. 234–238. [Google Scholar]
- Syed, M.H.; Burt, G.M.; Kok, J.K. Ancillary Service Provision by Demand Side Management: A Real-Time Power Hardware-in-the loop Co-simulation Demonstration. In Proceedings of the International Symposium on Smart Electric Distribution Systems and Technologies (EDST), Vienna, Austria, 8–11 September 2015. [Google Scholar] [CrossRef]
- D’hulst, R.; Fernandez, J.M.; Rikos, E.; Kolodziej, D.; Heussen, K.; Geibelk, D.; Temiz, A.; Caerts, C. Voltage and frequency control for future power systems: The ELECTRA IRP proposal. In Proceedings of the International Symposium on Smart Electric Distribution Systems and Technologies (EDST), Vienna, Austria, 8–11 September 2015; pp. 245–250. [Google Scholar] [CrossRef]
- Hu, J.; Lan, T.; Heussen, K.; Marinelli, M.; Prostejovsky, A.; Lei, X. Robust Allocation of Reserve Policies for a Multiple-cell Based Power System. Energies 2018, 11, 381. [Google Scholar] [CrossRef]
- Bobinaite, V.; Obushevs, A.; Oleinikova, I.; Morch, A. Economically Efficient Design of market for System Services under the Web-of-cells Architecture. Energies 2018, 11, 729. [Google Scholar] [CrossRef]
- Wang, Q.; Zhang, C.; Ding, Y.; Xydis, G.; Wang, J.; Østergaard, J. Review of real-time electricity markets for integrating Distributed Energy Resources and Demand Response. Appl. Energy 2015, 138, 695–706. [Google Scholar] [CrossRef]
- Lüth, A.; Zepter, M.J.; del Granado, P.C.; Egging, R. Local electricity market designs for peer-to-peer trading: The role of battery flexibility. Appl. Energy 2018, 229, 1233–1243. [Google Scholar] [CrossRef] [Green Version]
- Moslehi, K.; Kumar, R. A Reliability Perspective of the smart grid. IEEE Trans. Smart Grid. 2010, 1, 57–64. [Google Scholar] [CrossRef]
- Grijalva, S.; Tariq, M.U. Prosumer-based smart grid architecture enables a flat, sustainable electricity industry. In Proceedings of the Innovative Smart Grid Technologies Conference (ISGT), Anaheim, CA, USA, 17–19 January 2011. [Google Scholar]
- Taft, J.; Martini, P.D.; Geiger, R. Ultra Large-Scale Power System Control and Coordination Architecture, A Strategic Framework for Integrating Advanced Grid Functionality; U.S. Department of Energy: Washington, DC, USA, 2014.
- Ilo, A. Link—The smart grid Paradigm for a Secure Decentralized Operation Architecture. Electr. Power Syst. Res. 2016, 131, 116–125. [Google Scholar] [CrossRef]
- Ilo, A. Demand response process in context of the unified LINK-based architecture. In Bessède, Jean-Luc. Eco-Design in Electrical Engineering Eco-Friendly Methodologies, Solutions and Example for Application to Electrical Engineering; Springer: Berlin/Heidelberg, Germany, 2017; ISBN 978-3-319-58171-2. [Google Scholar]
- Mandelbrot, B. The Fractal Geometry of Nature; Freeman and Company: Dallas, TX, USA, 1983; ISBN 0716711869. [Google Scholar]
- Le, T.; Retière, N. Exploring the Scale-Invariant Structure of smart grids. IEEE Syst. J. 2017, 11, 1612–1621. [Google Scholar] [CrossRef]
- Thorp, J.S.; Naqavi, S.A. Load flow fractals. In Proceedings of the 28th IEEE Conference on Decision and Control, Tampa, FL, USA, 13–15 December 1989; Volume 2, pp. 1822–1827. [Google Scholar] [CrossRef]
- Thorp, J.S.; Naqavi, S.A.; Chiang, N.D. More load flow fractals. In Proceedings of the 29th IEEE Conference on Decision and Control, Honolulu, HI, USA, 5–7 December 1990; Volume 6, pp. 3028–3030. [Google Scholar] [CrossRef]
- Degaudenzi, M.E.; Arizmendi, M. Wavelet Based fractal Analysis of Electrical Power Demand. Fractals 2000, 8, 239–245. [Google Scholar] [CrossRef]
- Huang, S.J.; Lin, J.M. Application of box counting method based fractal geometry technique for disturbance detection in power systems. In Proceedings of the IEEE Power Engineering Society General Meeting, Toronto, ON, Canada, 13–17 July 2003; Volume 3, pp. 1604–1608. [Google Scholar] [CrossRef]
- Mamishev, A.V.; Russell, C.D.; Benner, L. Analysis of High Impedance Faults Using fractal Techniques. IEEE Trans. Power Syst. 1996, 11, 435–440. [Google Scholar] [CrossRef]
- Ma, J.; Wang, Z. Application of Grille fractal in Identification of Current Transformer Saturation. Power Syst. Technol. 2007, 31, 84–88. [Google Scholar]
- Wang, Z.; Ma, J.A. Novel Method to Identify Inrush Current Based on Grille fractal. Power Syst. Technol. 2007, 31, 63–68. [Google Scholar]
- Wang, F.; Li, L.; Li, C.; Wu, Q.; Cao, Y.; Zhou, B.; Fang, B. Fractal Characteristics Analysis of Blackouts in Interconnected Power grid. IEEE Power Eng. Lett. 2018, 33, 1085–1086. [Google Scholar] [CrossRef]
- Hou, H.; Tang, A.; Fang, H.; Yang, X.; Dong, Z. Electric power network fractal and its relationship with power system fault. Tehn. Vjesn. 2015, 22, 623–628. [Google Scholar] [CrossRef]
- Viswanadh, S.R.; Raju, V.B. Application of fractals to power system networks. IJSETR 2016, 5, 2547–2553. [Google Scholar]
- Sanduleac, M.; Pop, R.; Borza, P. Smart grid. Patterns of fractality. Energetica 2012, 60, 188–191. [Google Scholar]
- Ortjohann, E.; Wirasanti, P.; Schmelter, A.; Saffour, H.; Hoppe, M.; Morton, D. Cluster fractal model—A flexible network model for future power systems. In Proceedings of the International Conference on Clean Electrical Power, Alghero, Italy, 11–13 June 2013; pp. 293–297. [Google Scholar] [CrossRef]
- Florea, G.; Chenaru, O.; Popescu, D.; Dobrescu, R. A fractal model for Power smart grids. In Proceedings of the IEEE 20th International Conference on Control Systems and Science, Bucharest, Romania, 27–29 May 2015; pp. 572–577. [Google Scholar]
- Miller, C.; Martin, M.; Pinney, D.; Walker, G. Achieving a Resilient and Agile Grid; The National Rural Electric Cooperative Association: Arlington, VA, USA, 2014; pp. 1–78. [Google Scholar]
- COMMISSION REGULATION (EU) 2017/1485. Establishing a Guideline on Electricity Transmission System Operation. Available online: https://eur-lex.europa.eu/legal-content/EN/TXT/PDF/?uri=CELEX:32017R1485&from=EN (accessed on 10 October 2018).
- Gupta, A. The World’s Longest Power Transmission Lines. Power Technology. 2014. Available online: https://www.power-technology.com/features/featurethe-worlds-longest-power-transmission-lines-4167964 (accessed on 9 June 2016).
- Preiss, R.F.; Warnock, V.J. Impact of Voltage Reduction on Energy and Demand. IEEE Trans. Power Appar. Syst. 1978, 97, 1665–1671. [Google Scholar] [CrossRef]
- Schneider, K.P.; Fuller, J.C.; Tuffner, F.K.; Singh, R. Evaluation of Conservation Voltage Reduction (CVR) on a National Level; Pacific Northwest National Laboratory: Richland, WA, USA, 2010; pp. 1–114.
- Bollen, M.H.J.; Sannino, A. Voltage control with inverter-based distributed generation. IEEE Trans. Power Deliv. 2005, 20, 519–520. [Google Scholar] [CrossRef]
- Ilo, A.; Schultis, D.L.; Schirmer, C. Effectiveness of Distributed vs. Concentrated Volt/Var Local Control Strategies in Low-Voltage grids. Appl. Sci. 2018, 8, 1382. [Google Scholar] [CrossRef]
- Ilo, A.; Schultis, D.L. Low-voltage grid behaviour in the presence of concentrated var-sinks and var-compensated customers. Electr. Power Syst. Res. 2019, 171, 54–65. [Google Scholar] [CrossRef]
- Schultis, D.L.; Ilo, A.; Schirmer, C. Overall performance evaluation of reactive power control strategies in low voltage grids with high prosumer share. Electr. Power Syst. Res. 2019, 168, 336–349. [Google Scholar] [CrossRef]
- Ilo, A.; Reischböck, M.; Jaklin, F.; Kirschner, W. DMS impact on the technical and economic performance of the distribution systems. In Proceedings of the CIRED 2005–18th International Conference and Exhibition on Electricity Distribution, Turin, Italy, 6 June 2005; pp. 1–5. [Google Scholar]
- Frankhauser, P.; Tannier, C.; Vuidel, G.; Fractalyse 2.4. Research Centre ThéMA. Available online: http://www.fractalyse.org/en-home.html (accessed on 13 October 2018).
- Bose, A. Smart Transmission grid Applications and Their Supporting Infrastructure. IEEE Trans. Smart Grid 2010, 1, 11–19. [Google Scholar] [CrossRef]
- Marris, E. Upgrading the grid. Nature 2008, 454, 570–573. [Google Scholar] [CrossRef]
- Amin, M. The smart grid solution. Nature 2013, 499, 145–147. [Google Scholar] [CrossRef]
- Vaahedi, E. Practical Power System Operation; John Wiley & Sons: Hoboken, NJ, USA, 2014. [Google Scholar]
- Ilo, A. The Energy Supply Chain Net. Energy Power Eng. 2013, 5, 384–390. [Google Scholar] [CrossRef] [Green Version]
- Ilo, A.; Prata, R.; Iliceto, A.; Strbac, G. Embedding of Energy Communities in the Unified LINK-Based Holistic Architecture; CIRED: Madrid, Spain, 2019; pp. 1–5. [Google Scholar]
- ETIP SNET. White Paper Holistic Power Systems Architectures. 2019. Available online: https://www.etip-snet.eu/white-paper-holistic-architectures-future-power-systems/ (accessed on 12 March 2019).
- Ilo, A. Effects of the Reactive Power Injection on the grid—The Rise of the Volt/var Interaction Chain. Smart Grid Renew. Energy 2016, 7, 217–232. [Google Scholar] [CrossRef]
- Schultis, D.L.; Ilo, A. Behaviour of Distribution grids with the Highest PV Share Using the Volt/Var Control Chain Strategy. Energies 2019, 12, 3865. [Google Scholar] [CrossRef]
- Ilo, A.; Schaffer, W.; Rieder, T.; Dzafic, I. Dynamische Optimierung der Verteilnetze—Closed loop Betriebergebnisse. In Proceedings of the VDE Kongress, Stuttgart, Germany, 5–6 November 2012; pp. 1–6. [Google Scholar]
- ZUQDE-project, Final Report, 1–111. 2012. Available online: https://www.energieforschung.at/assets/project/final-report/ZUQDE.pdf (accessed on 10 January 2013).
Figure 1.
The methodology used to design the smart grids architecture and the market structure.

Figure 2.
Link chain fractal of power systems: (a) The fractal pattern electrical appliances (ElA); (b) ElA in different fractal levels; (c) magnification of levels 4 and 5.
Figure 2.
Link chain fractal of power systems: (a) The fractal pattern electrical appliances (ElA); (b) ElA in different fractal levels; (c) magnification of levels 4 and 5.

Figure 3.
The fractal of high voltage grids (HVGs).

Figure 4.
Overview of the structure of smart grids: (a) Real conditions; (b) fractal.

Figure 5.
The fractal set of HV and medium voltage graphs (MVGs).

Figure 6.
The fractal set of HV, MV and low voltage graphs (LVGs).

Figure 7.
The fractal set of HV, MV and LVGs and customer plants (CP).

Figure 8.
The fractal set of smart grids.

Figure 9.
Smart grid’s separate fractal sets in different levels: (a) Level 1; (b) level 2; (c) level 3; (d) level 4; (e) level 5.
Figure 9.
Smart grid’s separate fractal sets in different levels: (a) Level 1; (b) level 2; (c) level 3; (d) level 4; (e) level 5.

Figure 10.
Logarithmic diagram for measuring the fractal dimension of different separate fractal levels.
Figure 10.
Logarithmic diagram for measuring the fractal dimension of different separate fractal levels.

Figure 11.
The fractal dimension D for different separate fractal levels.

Figure 12.
Overview of the smart grid paradigm.

Figure 13.
Overview of the holistic models: (a) Technical, the “energy supply chain net”; (b) market.
Figure 13.
Overview of the holistic models: (a) Technical, the “energy supply chain net”; (b) market.

Figure 14.
Main elements of the LINK-based holistic architecture and the corresponding operators.

Figure 15.
Different stages of the LINK-based architecture: (a) Technical/functional, (b) generalized and (c) holistic.
Figure 15.
Different stages of the LINK-based architecture: (a) Technical/functional, (b) generalized and (c) holistic.

Figure 16.
Harmonization of the market structure with the grid link arrangement.

Figure 17.
Unified modelling language (UML) diagram of the process price driven demand response.

Figure 18.
The implemented technical/functional LINK-based architecture in the ZUQDE project.

Figure 19.
The realized volt/var control scheme in management system level in ZUQDE project.

Figure 20.
Voltage and active power course during the execution of the conservation voltage reduction (CVR) process in the ZUQDE project [76].
Figure 20.
Voltage and active power course during the execution of the conservation voltage reduction (CVR) process in the ZUQDE project [76].


Table 1.
The fractal structure of smart grids based on different fractal levels.
| Fractal Level | Grid | Active Power Appliances | ||
|---|---|---|---|---|
| Wire | Transformers | Reactive Power Devices | Appliances that Mainly Produce, Consume or Store Active Power | |
| Level 1. → HV_ElA | Very long | Very large | Very large | Very large |
| Level 2. → MV_ElA | Long | Large | Large | Large |
| Level 3. → LV_ElA | Short | Medium | Medium | Medium |
| Level 4. → CP_ElA | Very short | Small? | Small | Small |
| Level 5. → Dev_ElA | Tiny | Tiny | Tiny | Tiny |
Table 2.
The fractal structure of smart grids based on different fractal levels.
| Entire real Power System | Scaling Factors | Fractal of the Entire Power System | ||
|---|---|---|---|---|
| Zone | No. of Zones | No. of ElAs | Fractal Level | |
| HV | 1 | 1 | 1 | Level 1HV |
| MV (Suppl. Substations) | 300 | 50 | 6 | Level 2MV |
| LV (Distr. Substations) | 100,000 | 5,555.56 | 18 | Level 3LV |
| CP (Customers) | 4,000,000 | 55,555.56 | 72 | Level 4CP |
| Dev. (Elec. Devices) | 40,000,000 | 55,555.56 | 720 | Level 5Dev |
© 2019 by the author. Licensee MDPI, Basel, Switzerland. This article is an open access article distributed under the terms and conditions of the Creative Commons Attribution (CC BY) license (http://creativecommons.org/licenses/by/4.0/).
Share and Cite
MDPI and ACS Style
ILO, A. Design of the Smart Grid Architecture According to Fractal Principles and the Basics of Corresponding Market Structure. Energies 2019, 12, 4153. https://doi.org/10.3390/en12214153
AMA Style
ILO A. Design of the Smart Grid Architecture According to Fractal Principles and the Basics of Corresponding Market Structure. Energies. 2019; 12(21):4153. https://doi.org/10.3390/en12214153
Chicago/Turabian StyleILO, Albana. 2019. "Design of the Smart Grid Architecture According to Fractal Principles and the Basics of Corresponding Market Structure" Energies 12, no. 21: 4153. https://doi.org/10.3390/en12214153
Note that from the first issue of 2016, this journal uses article numbers instead of page numbers. See further details here.