Socio-Economic Effect on ICT-Based Persuasive Interventions Towards Energy Efficiency in Tertiary Buildings

 ,
,  ,
,  , , ,
, , ,  , and
, and 
Abstract
:
1. Introduction
2. The GreenSoul Project
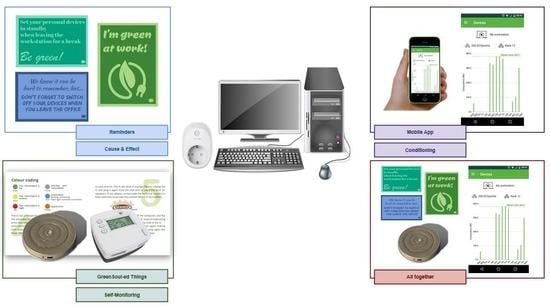
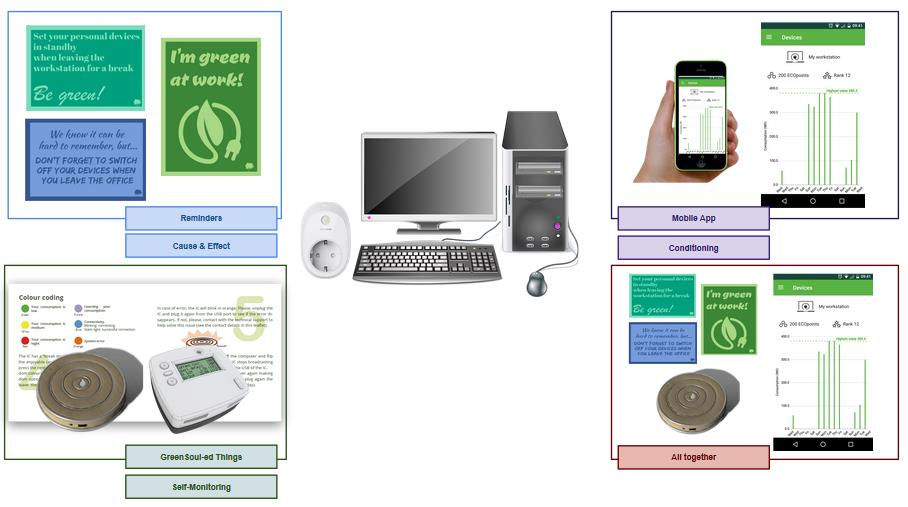
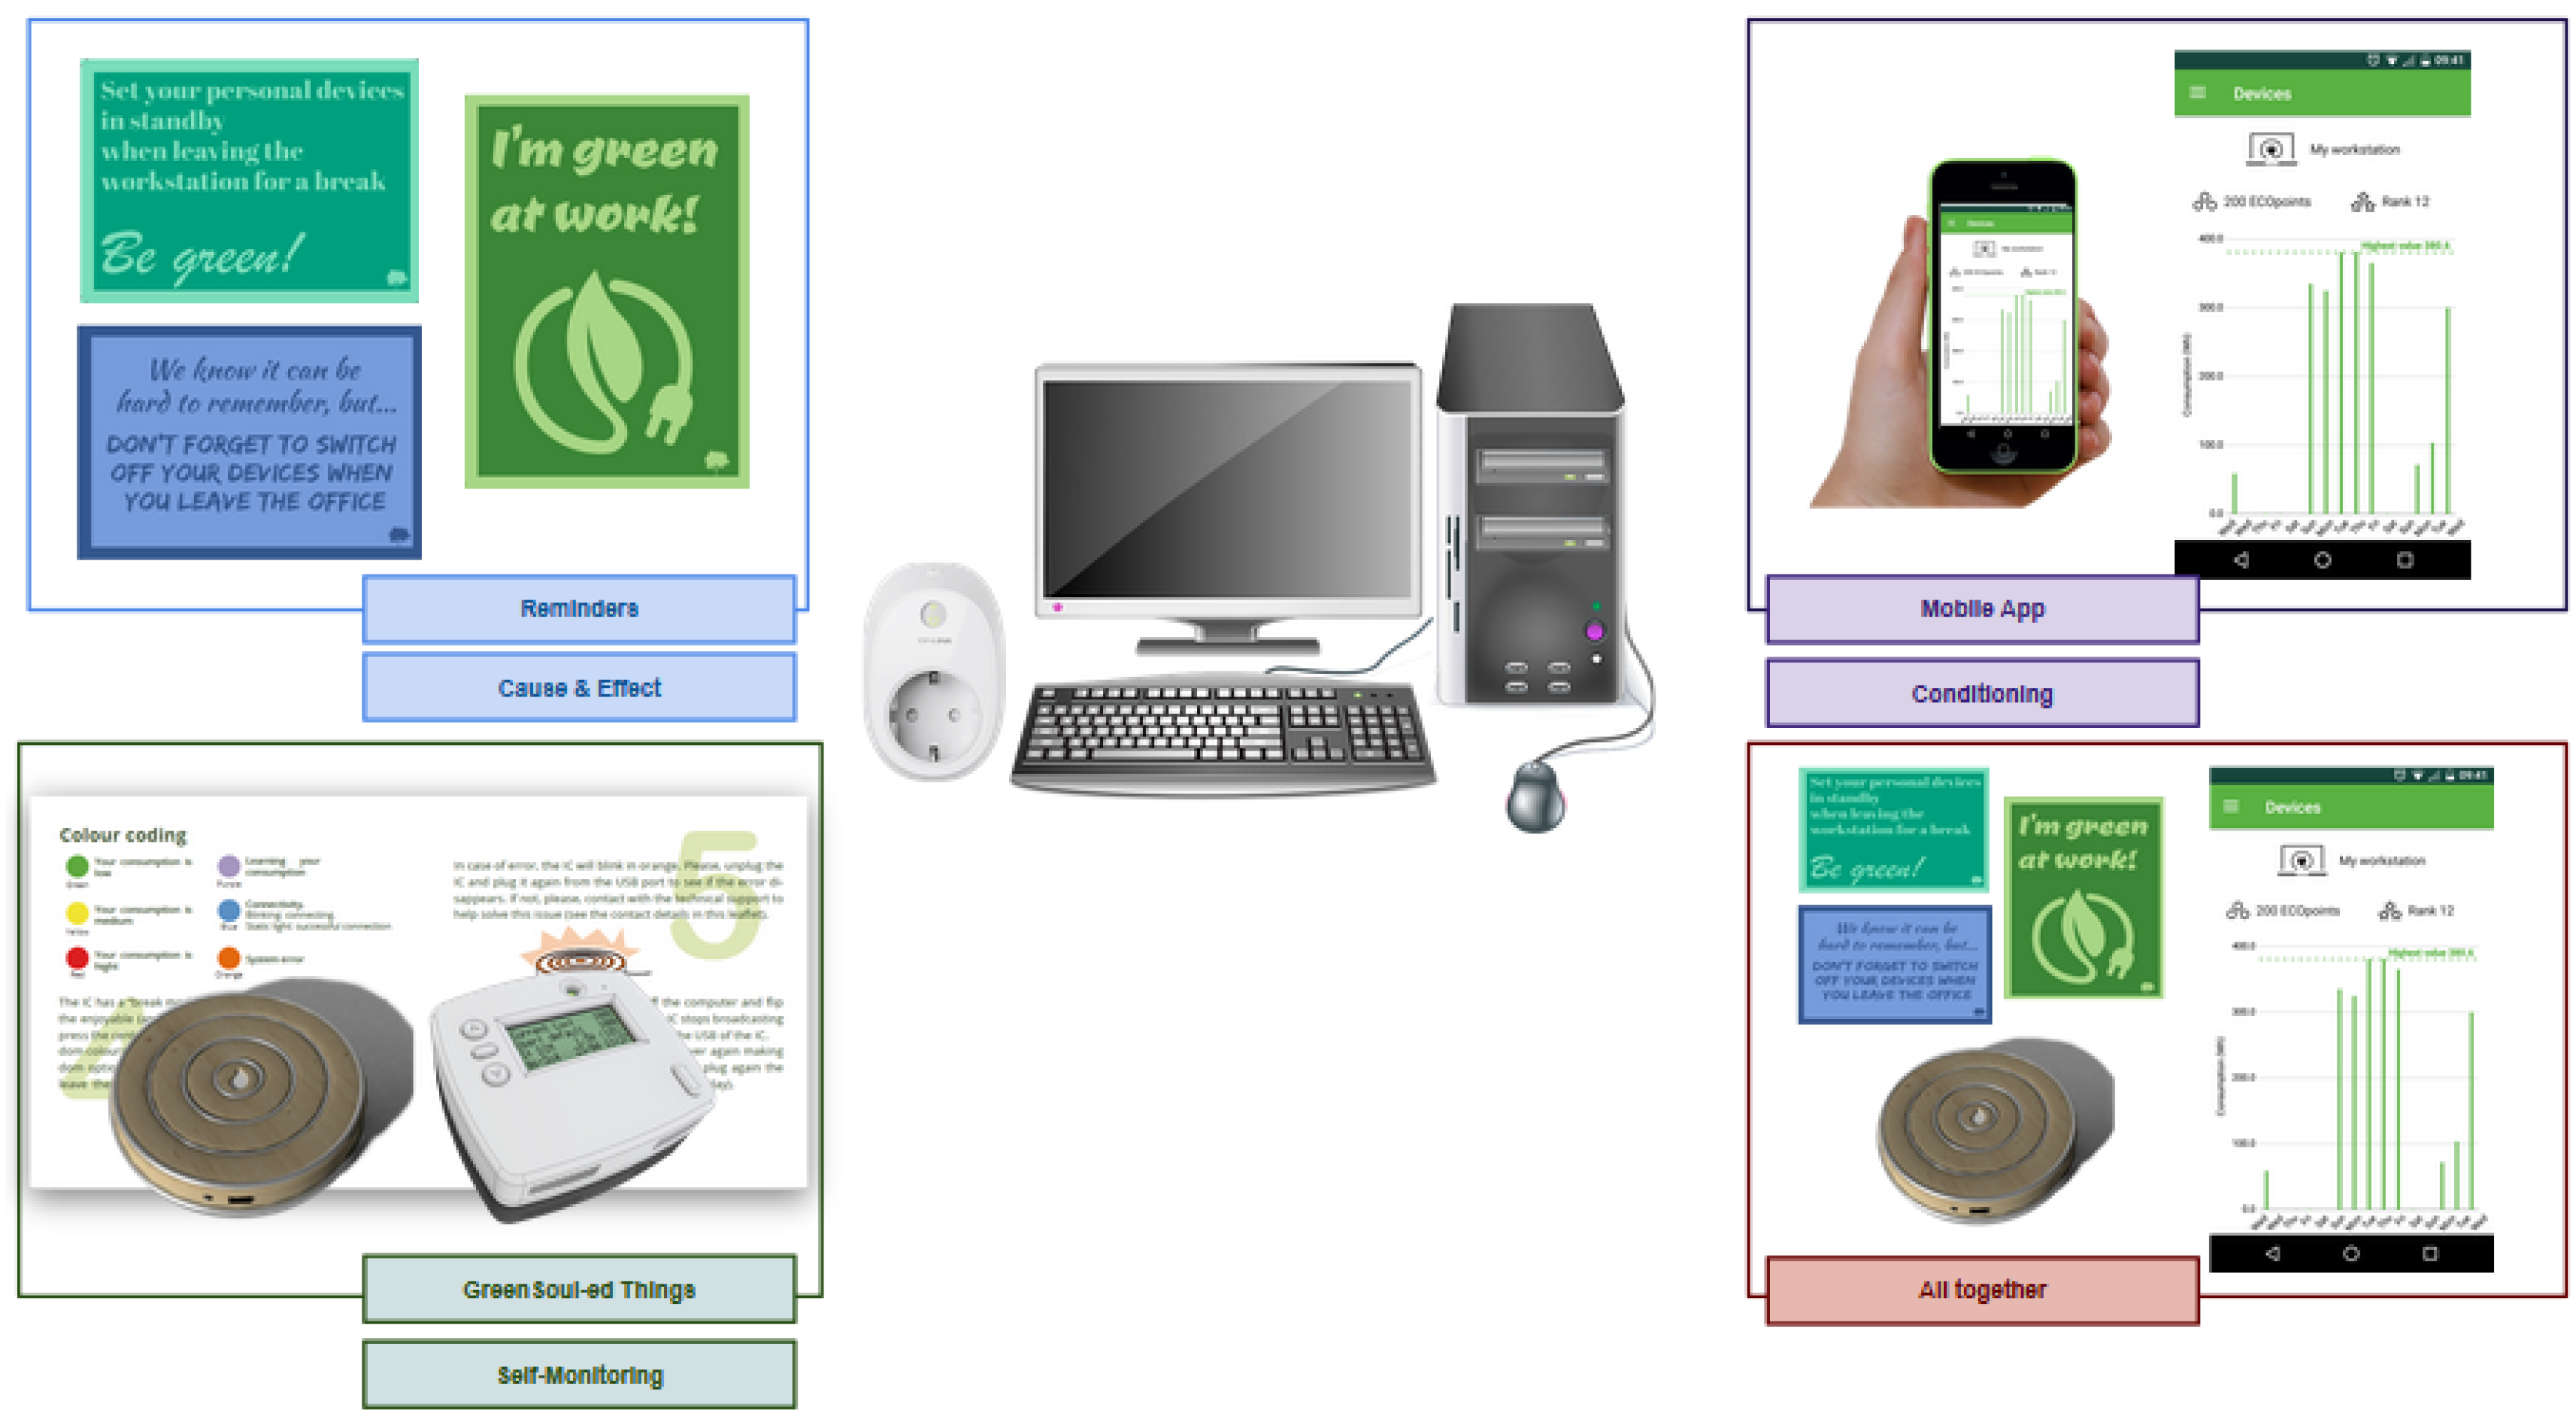
2.1. The GreenSoul Intervention
2.2. Evaluation Procedure
3. Survey Design and Delivery
3.1. Social, Economic and Demographic Traits
- Non-Dependent on Work: Common questions that cover demographic (static) aspects such as age, gender, education, country and city. Additionally, this group includes questions related also to dynamic aspects such as confidence in technology, susceptibility to persuasion as well as attitudinal and intentional profiles.
- Dependent on Work: Questions directly influenced by the organisation where the user is employed, consisting once again of static information such as the type of employment, the position, work culture, etc. and dynamic energy-related factors such as the main barriers to be energy efficient, the willingness to join an initiative to reduce energy consumption, and more.
- Energy-related actions at work: An ancillary profile was constructed through questions that cover energy-related social habits such as the use of the HVAC, the set-point established in summer and winter, the use of natural and artificial lighting, printing habits or the power mode set in users’ equipment.
- Ranking of Persuasion Strategies: Users were asked to self-rate (one to five likert scale) 21 persuasive strategies related to enhancing energy efficiency practices in shared spaces at working environments. The strategies were designed based on fifteen persuasion principles developed by experts [12,13,25]. Table 1 presents the Persuasion Principles, Table 2 introduces the Persuasion Strategies (numbered from v2 to v22 as this is the coding they have on Zenodo’s dataset), and in Table 3 these two are mapped together.
3.2. Survey Setup
4. Results
4.1. PRE/POST Preprocessing
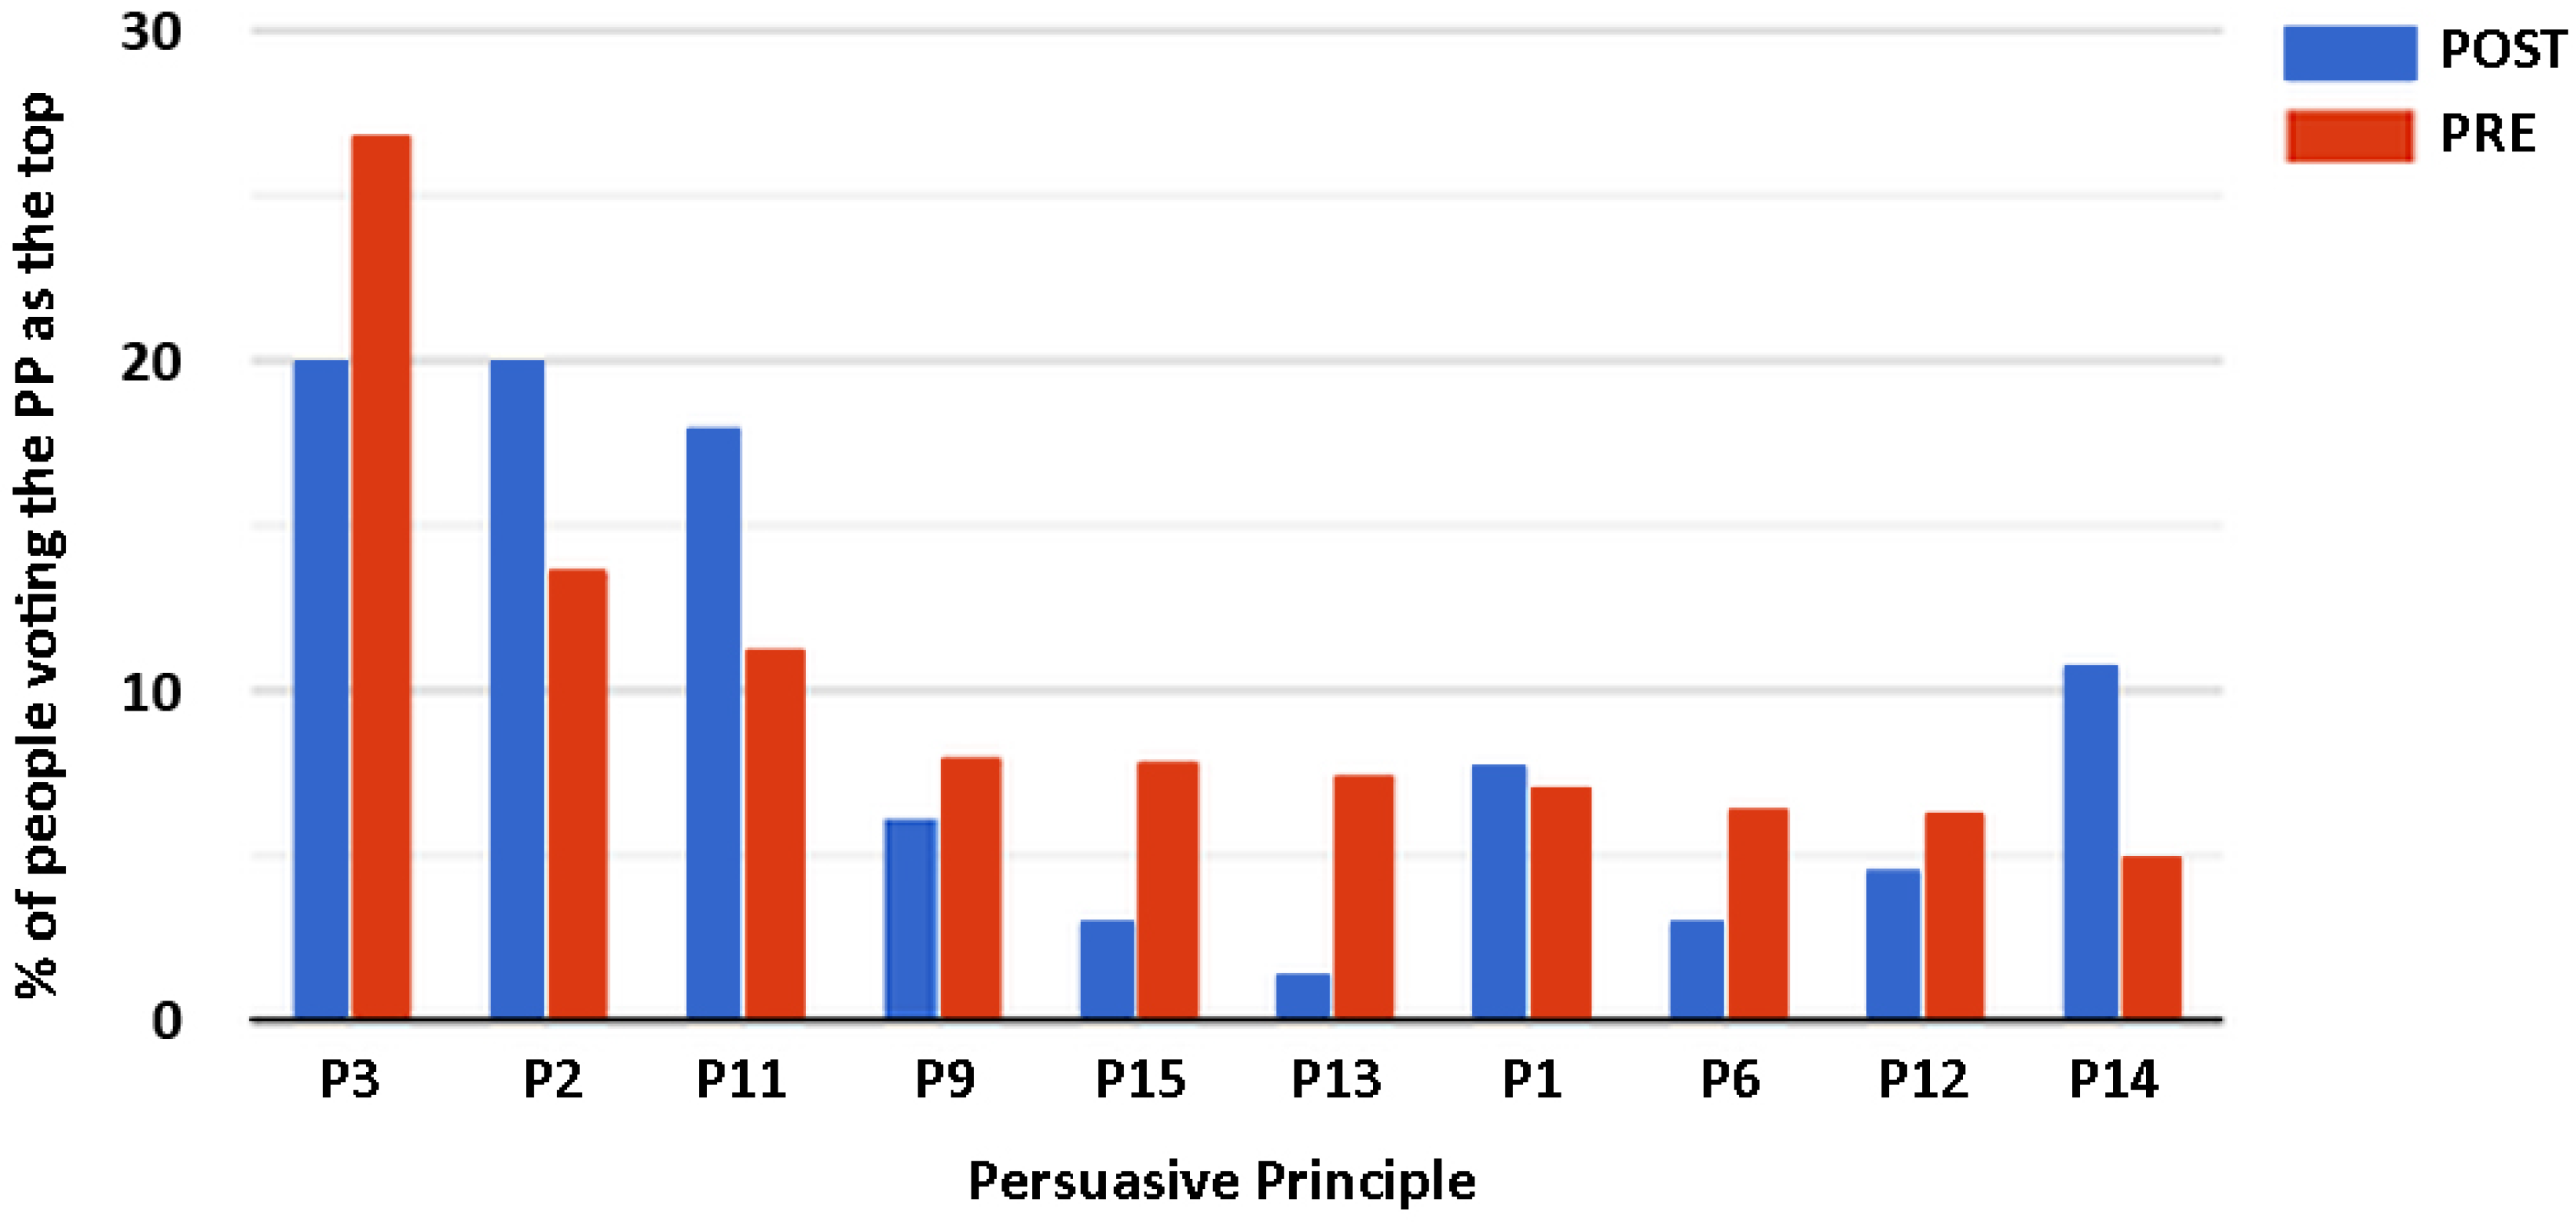
4.2. Descriptive Analysis: PRE vs. POST
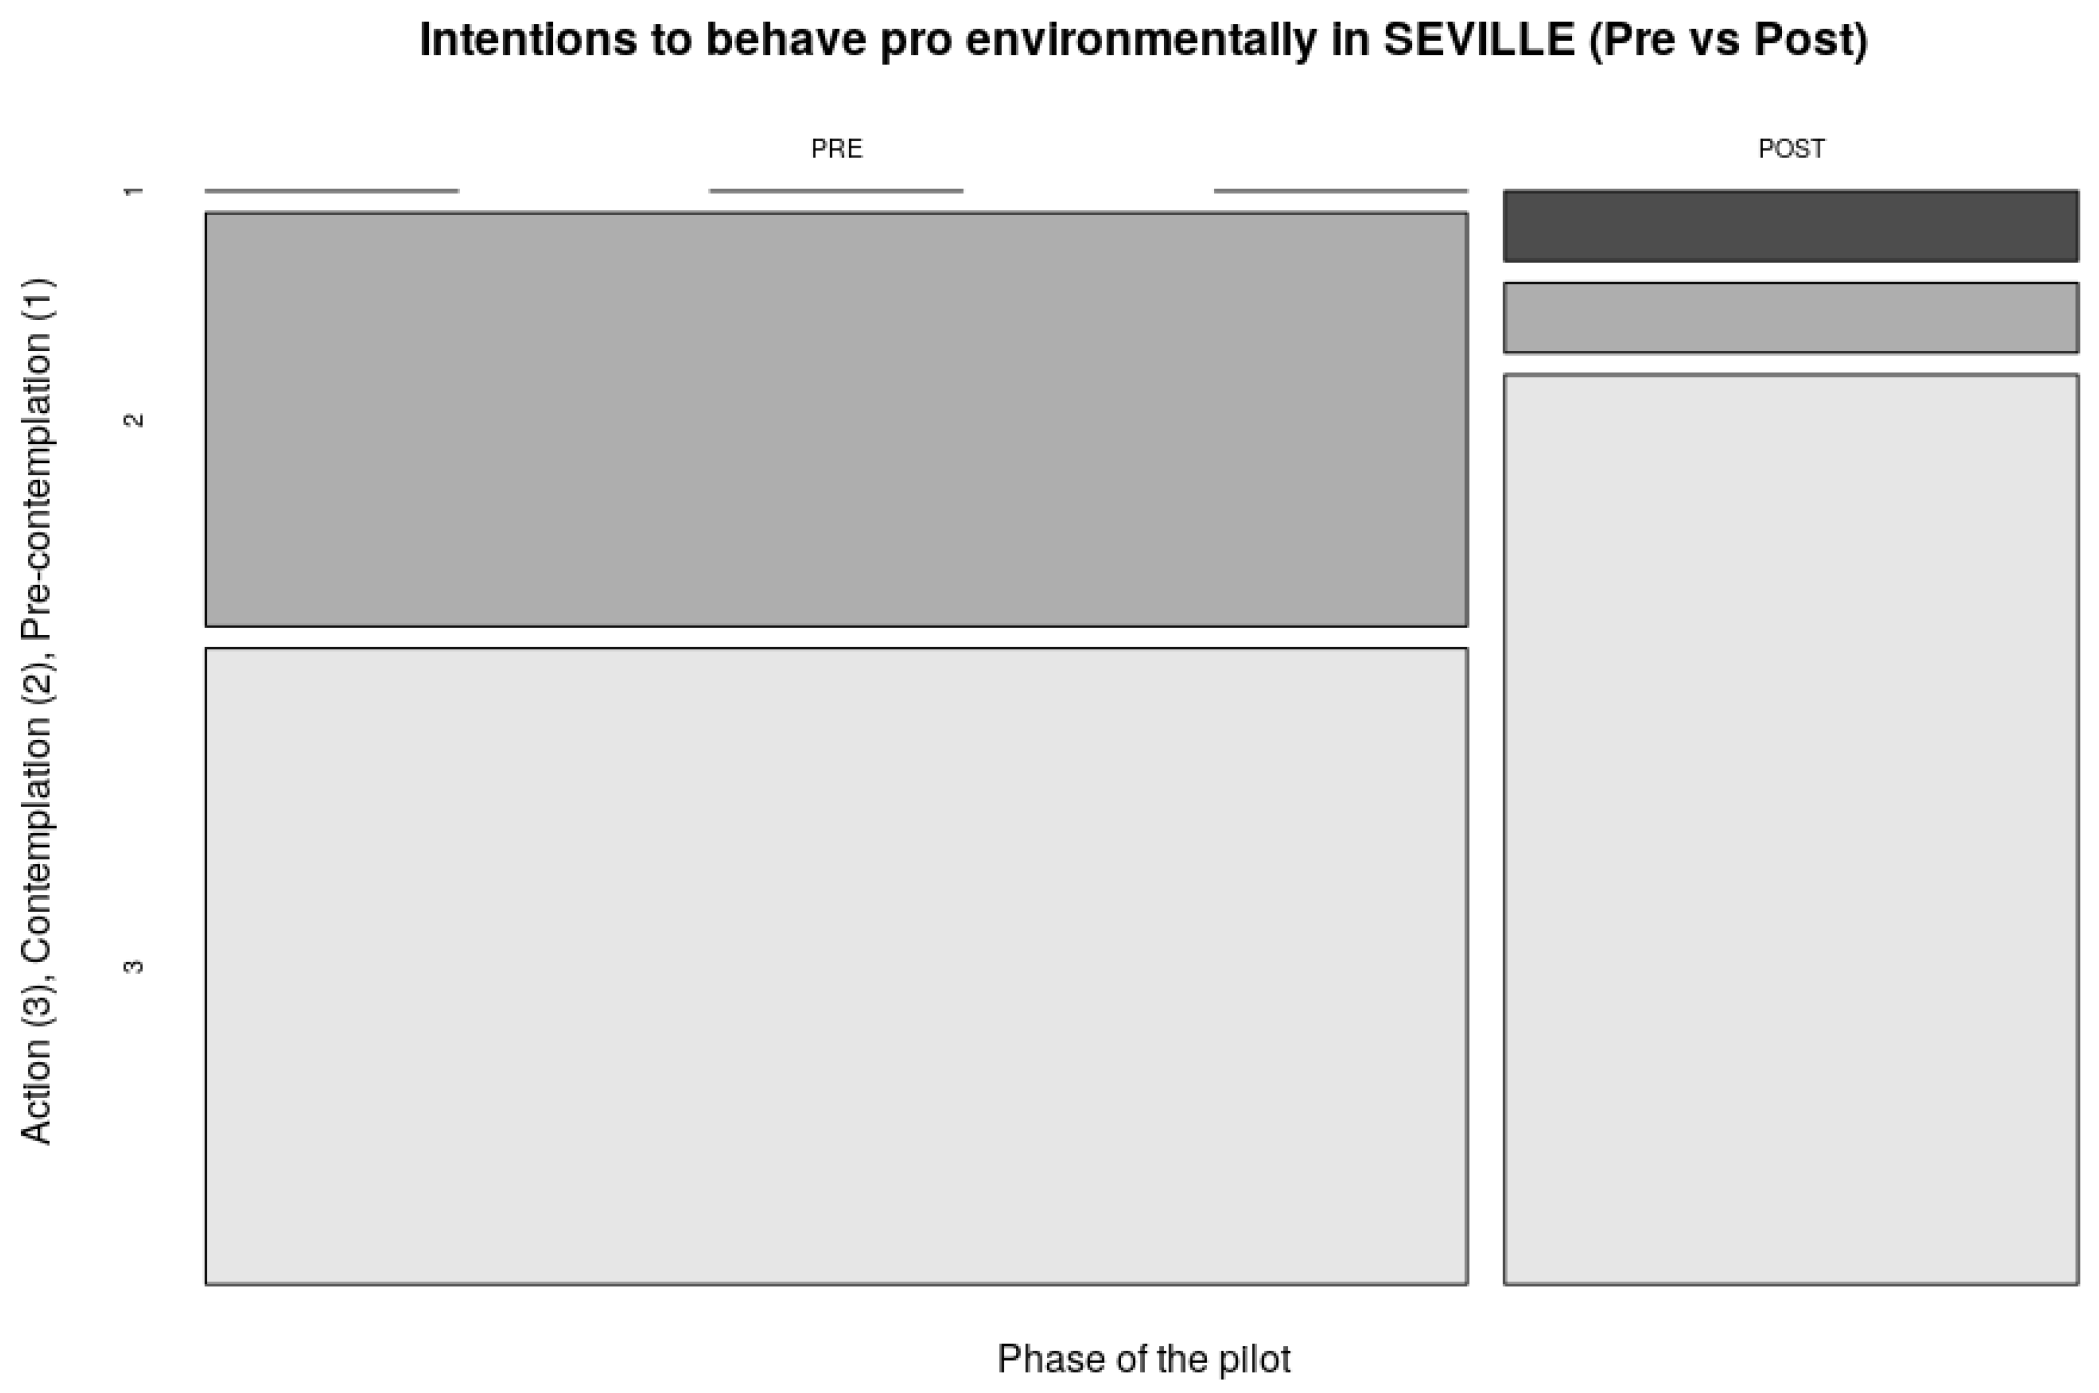
4.2.1. SEVILLE
4.2.2. DEUSTO
4.2.3. WEIZ
4.2.4. ALLIA
4.2.5. MPH
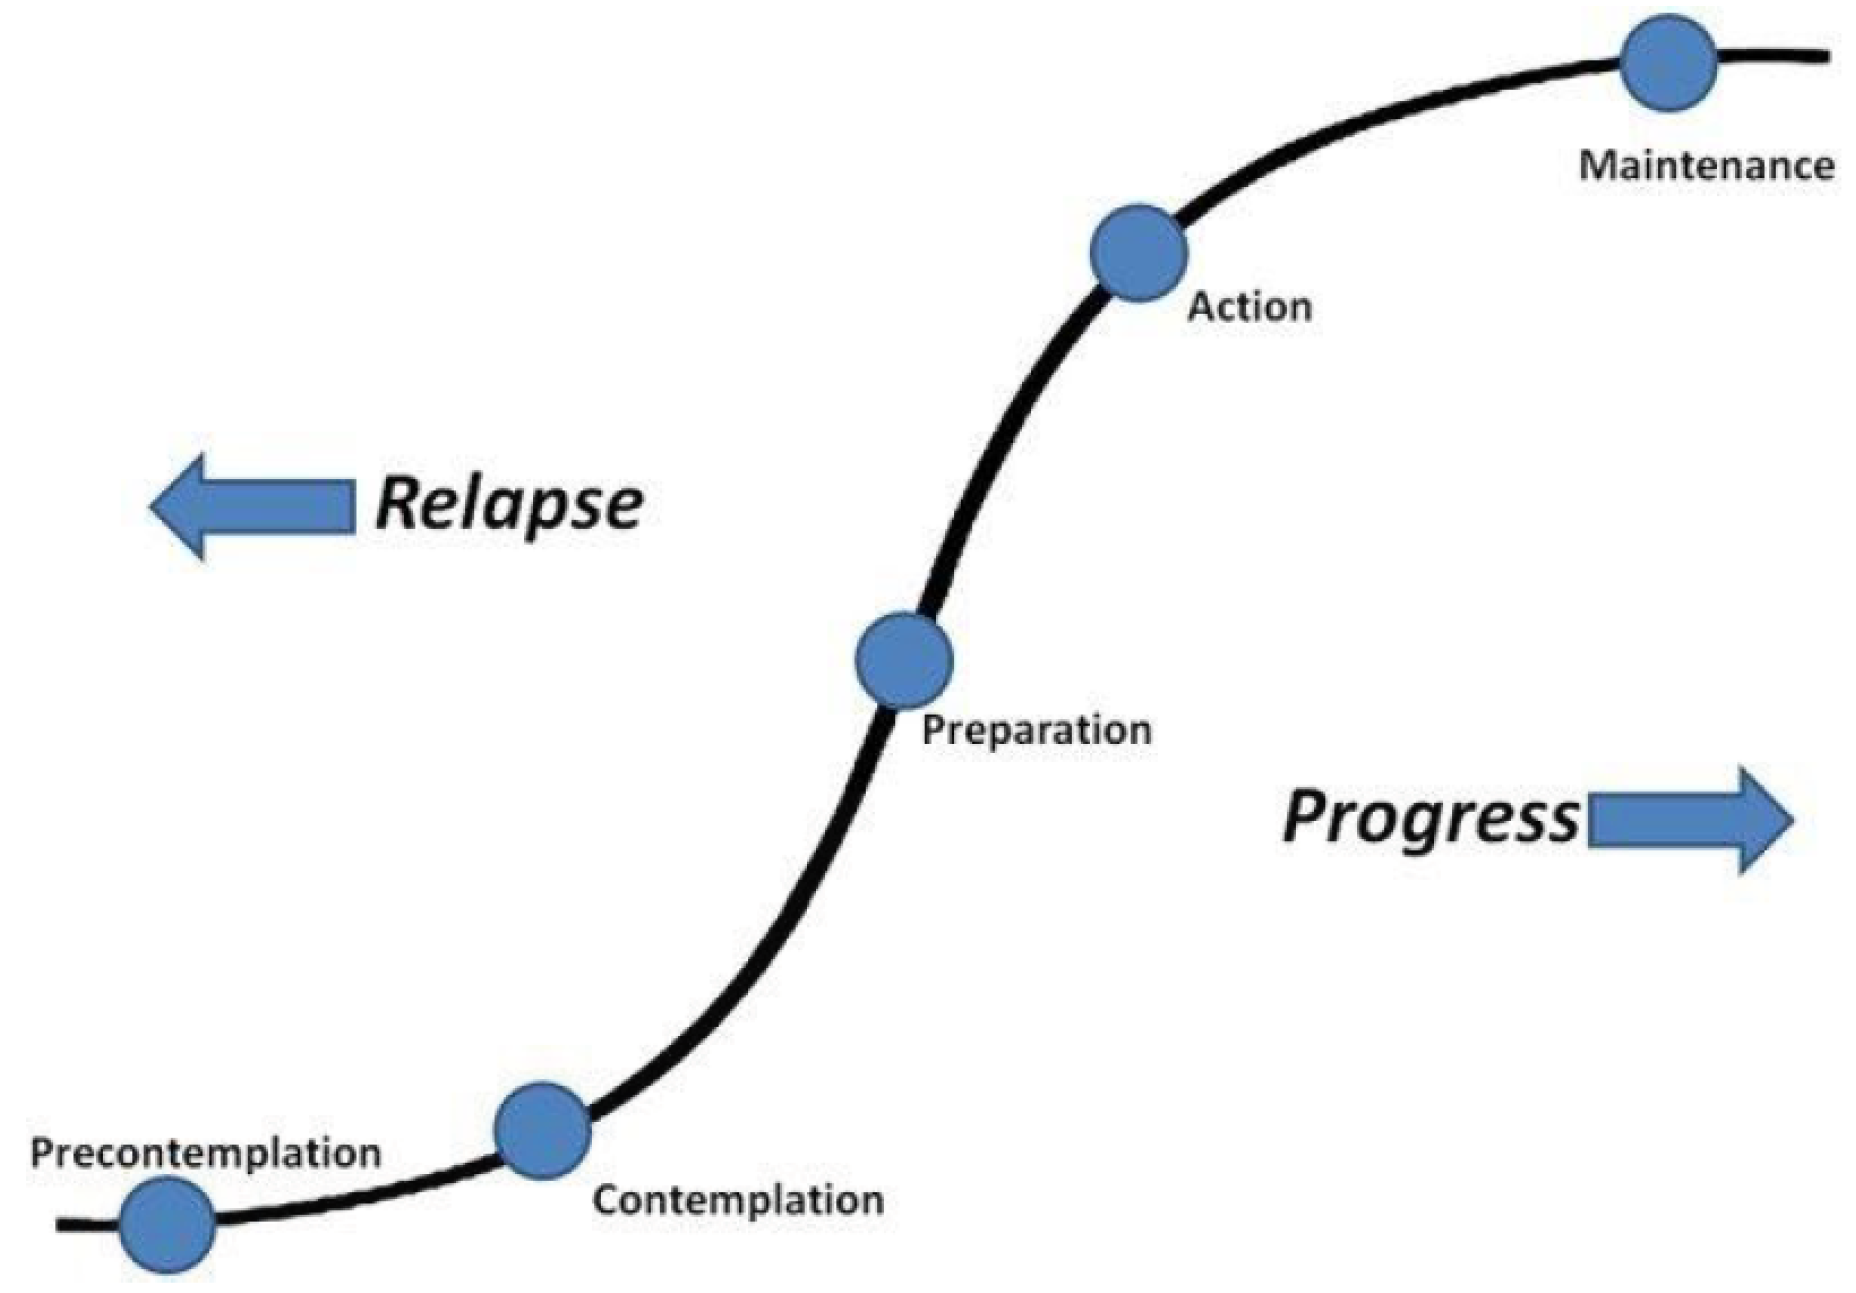
4.3. Prescriptive Analysis
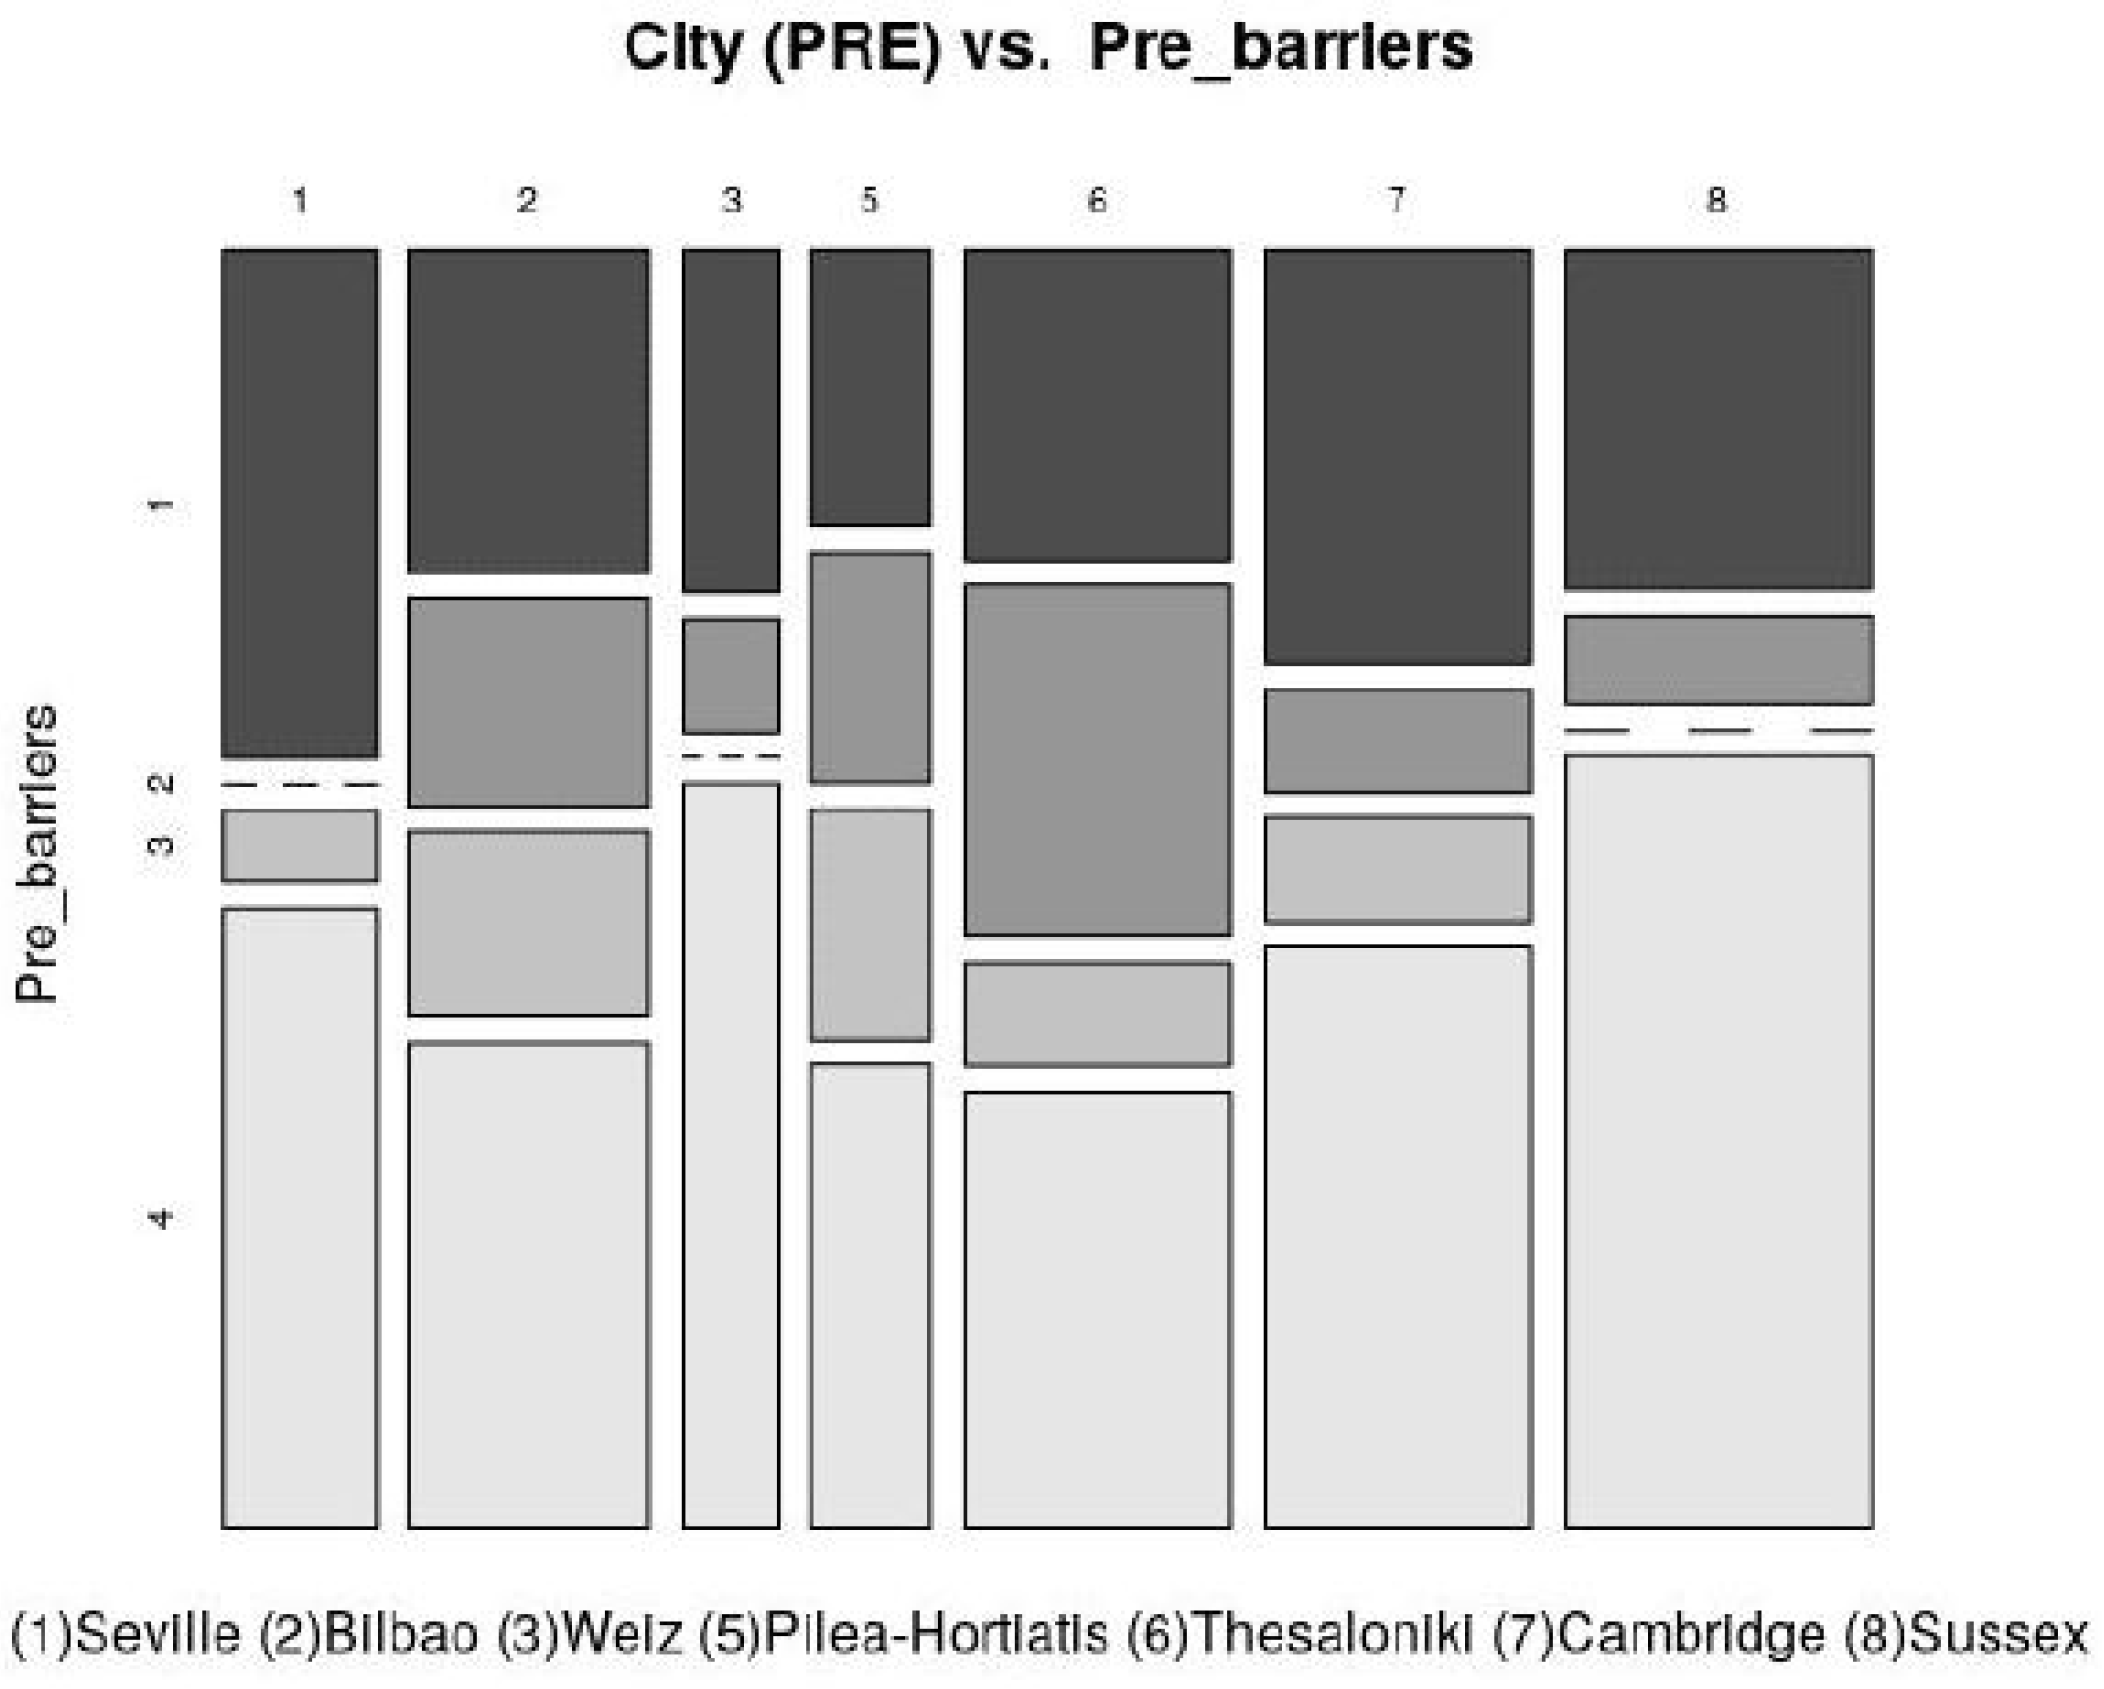
4.3.1. Results from Pre-Pilot Questionnaires
Pre-Contemplation, Contemplation, and Action
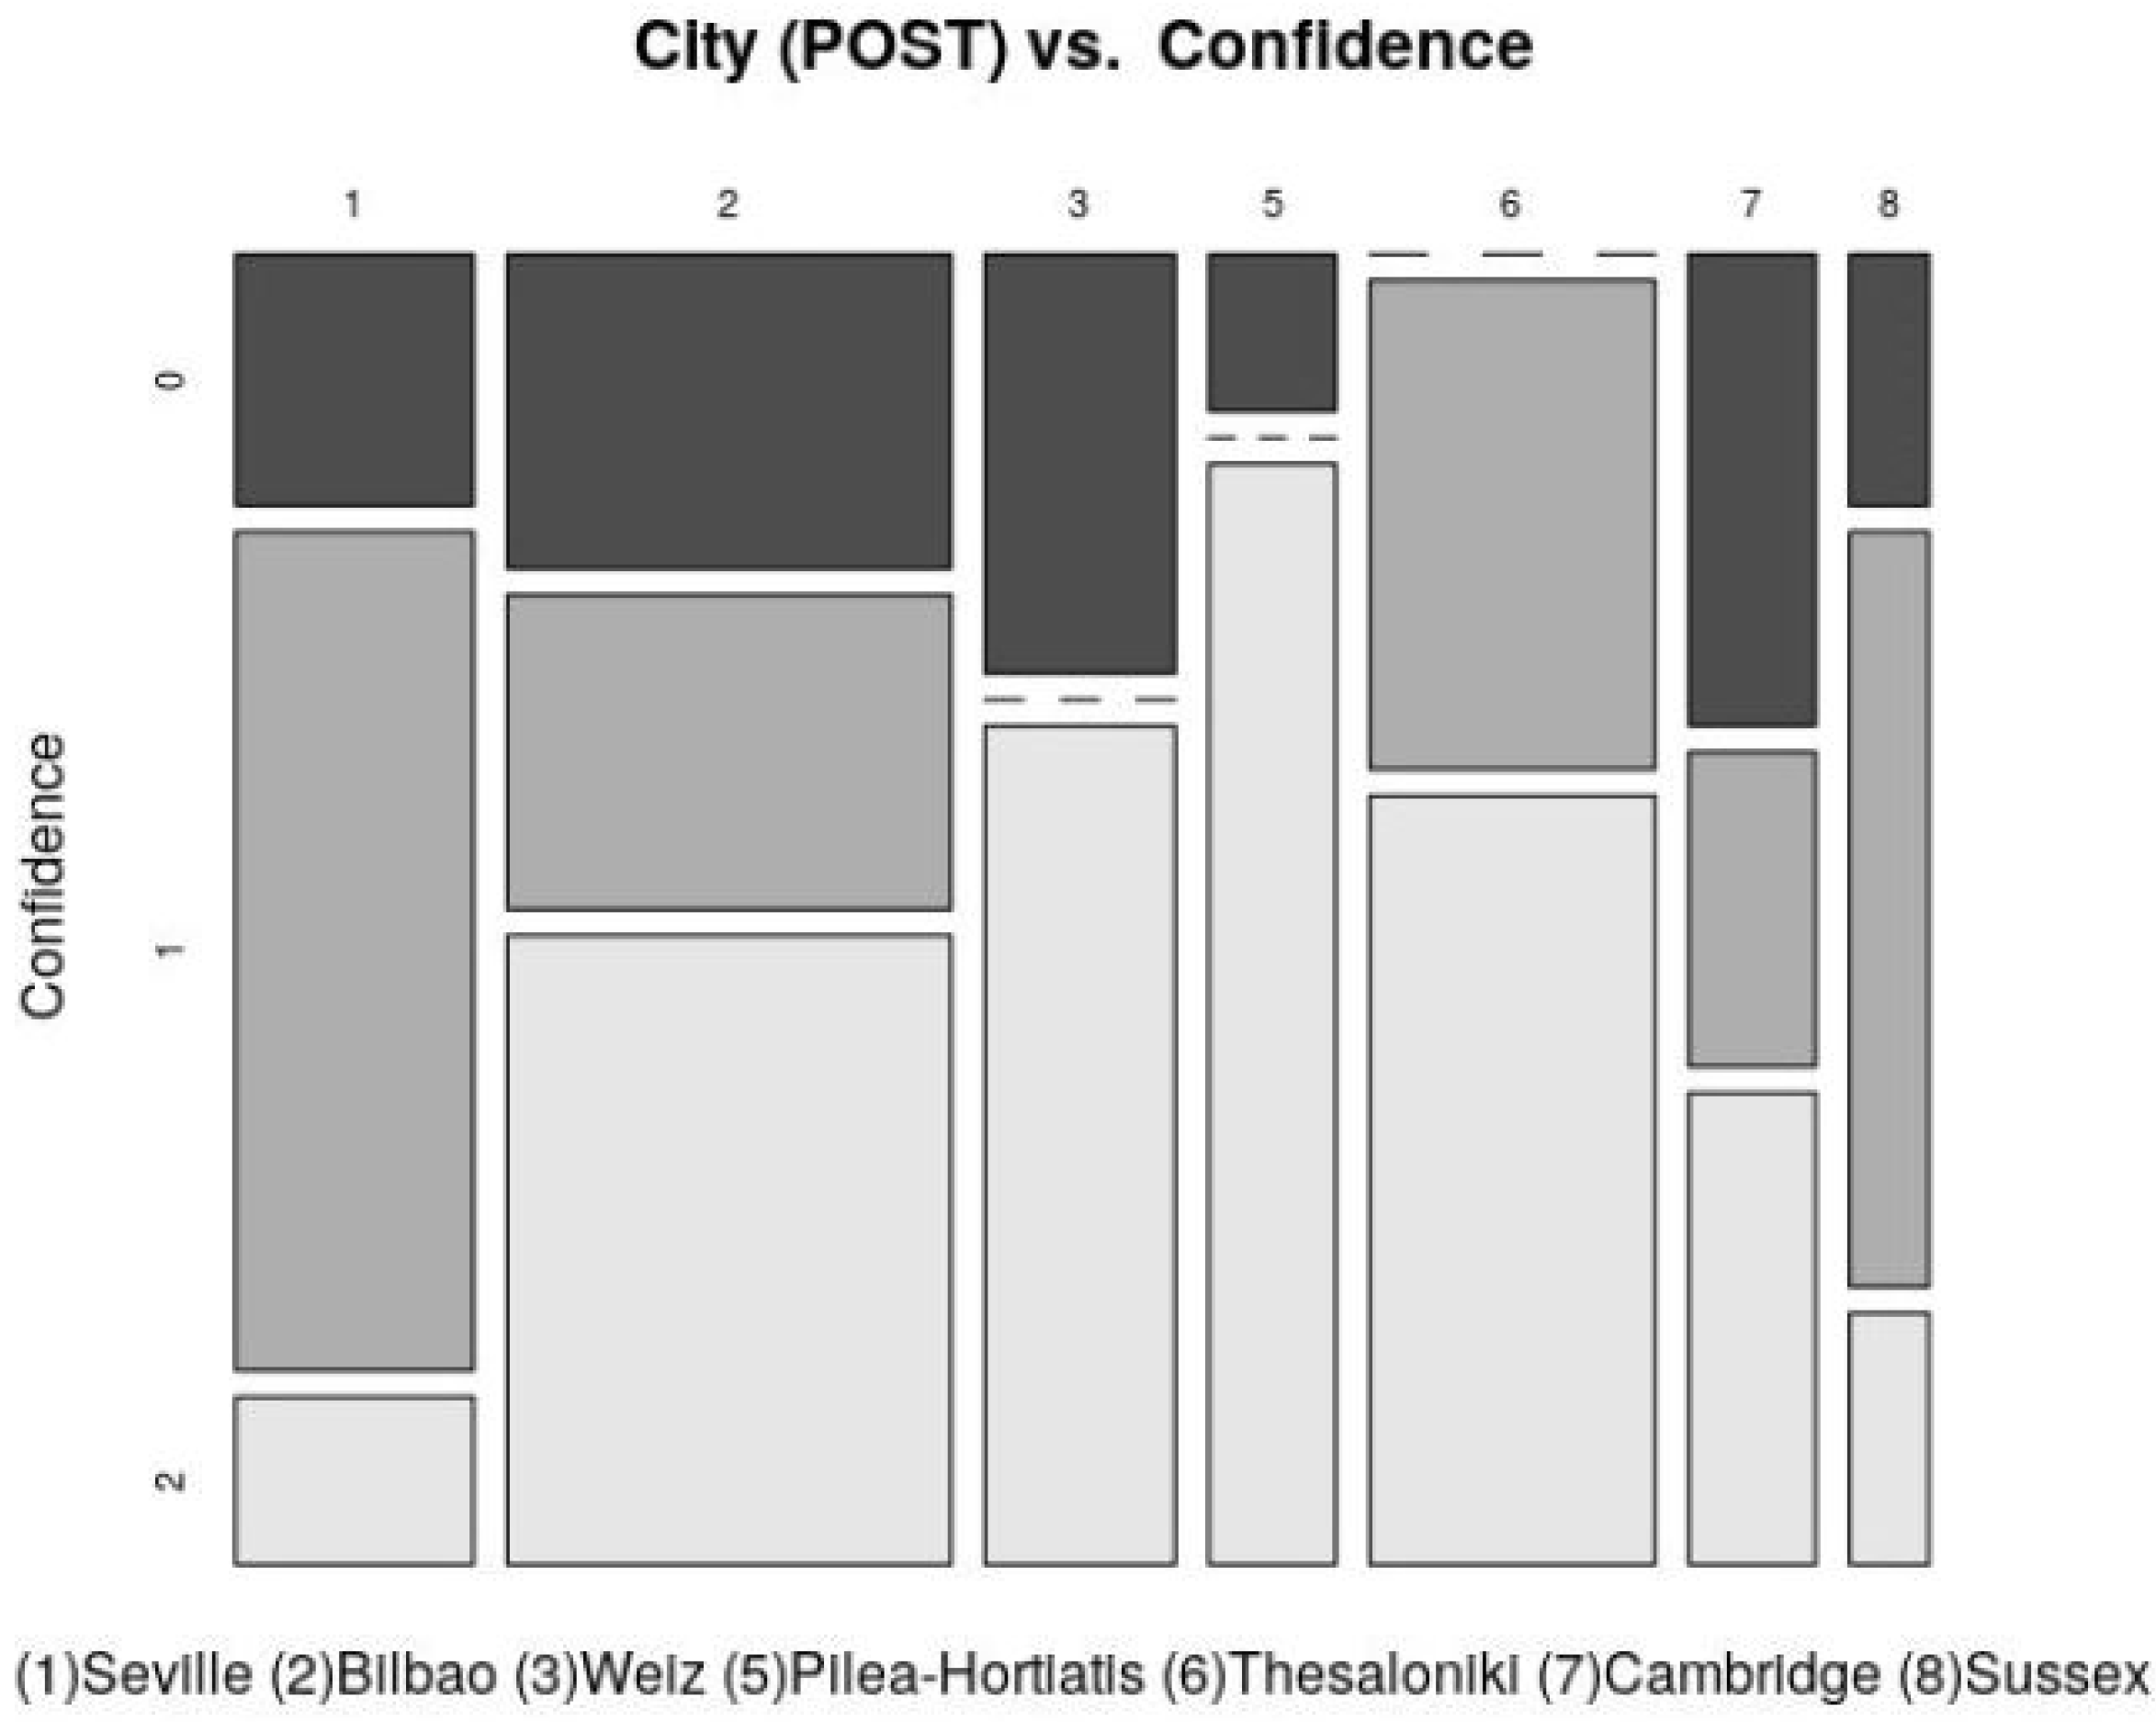
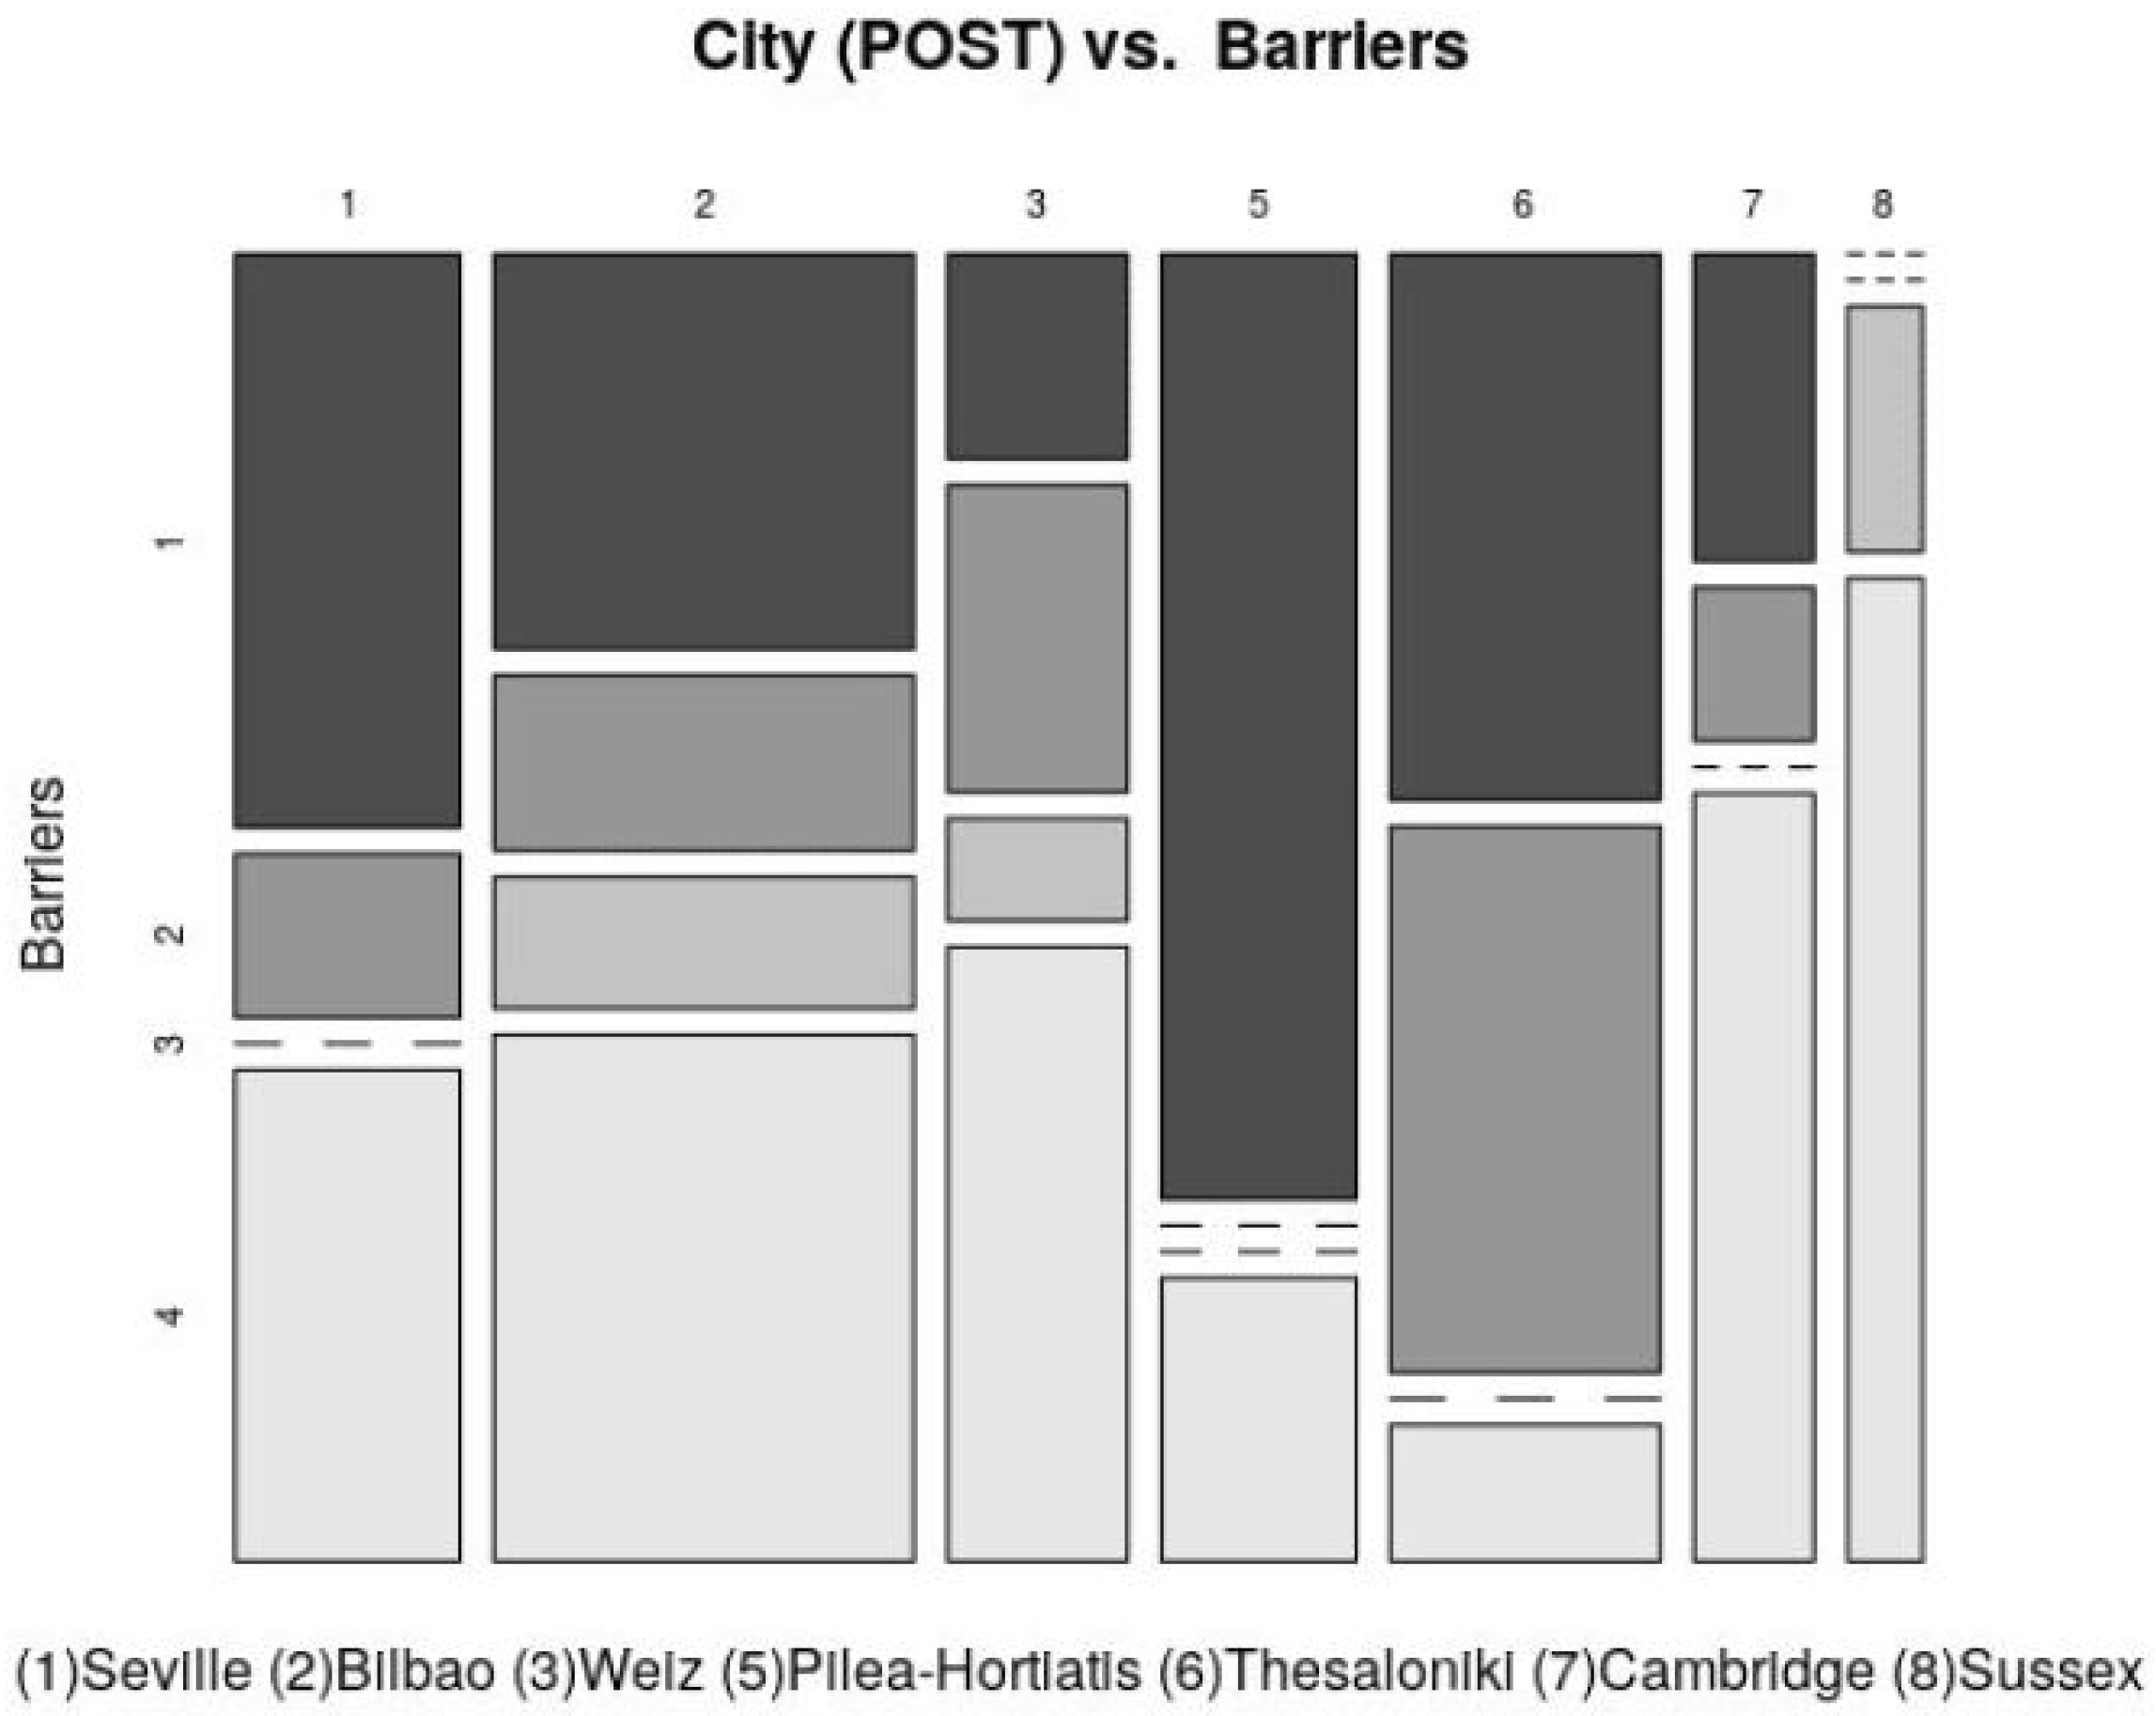
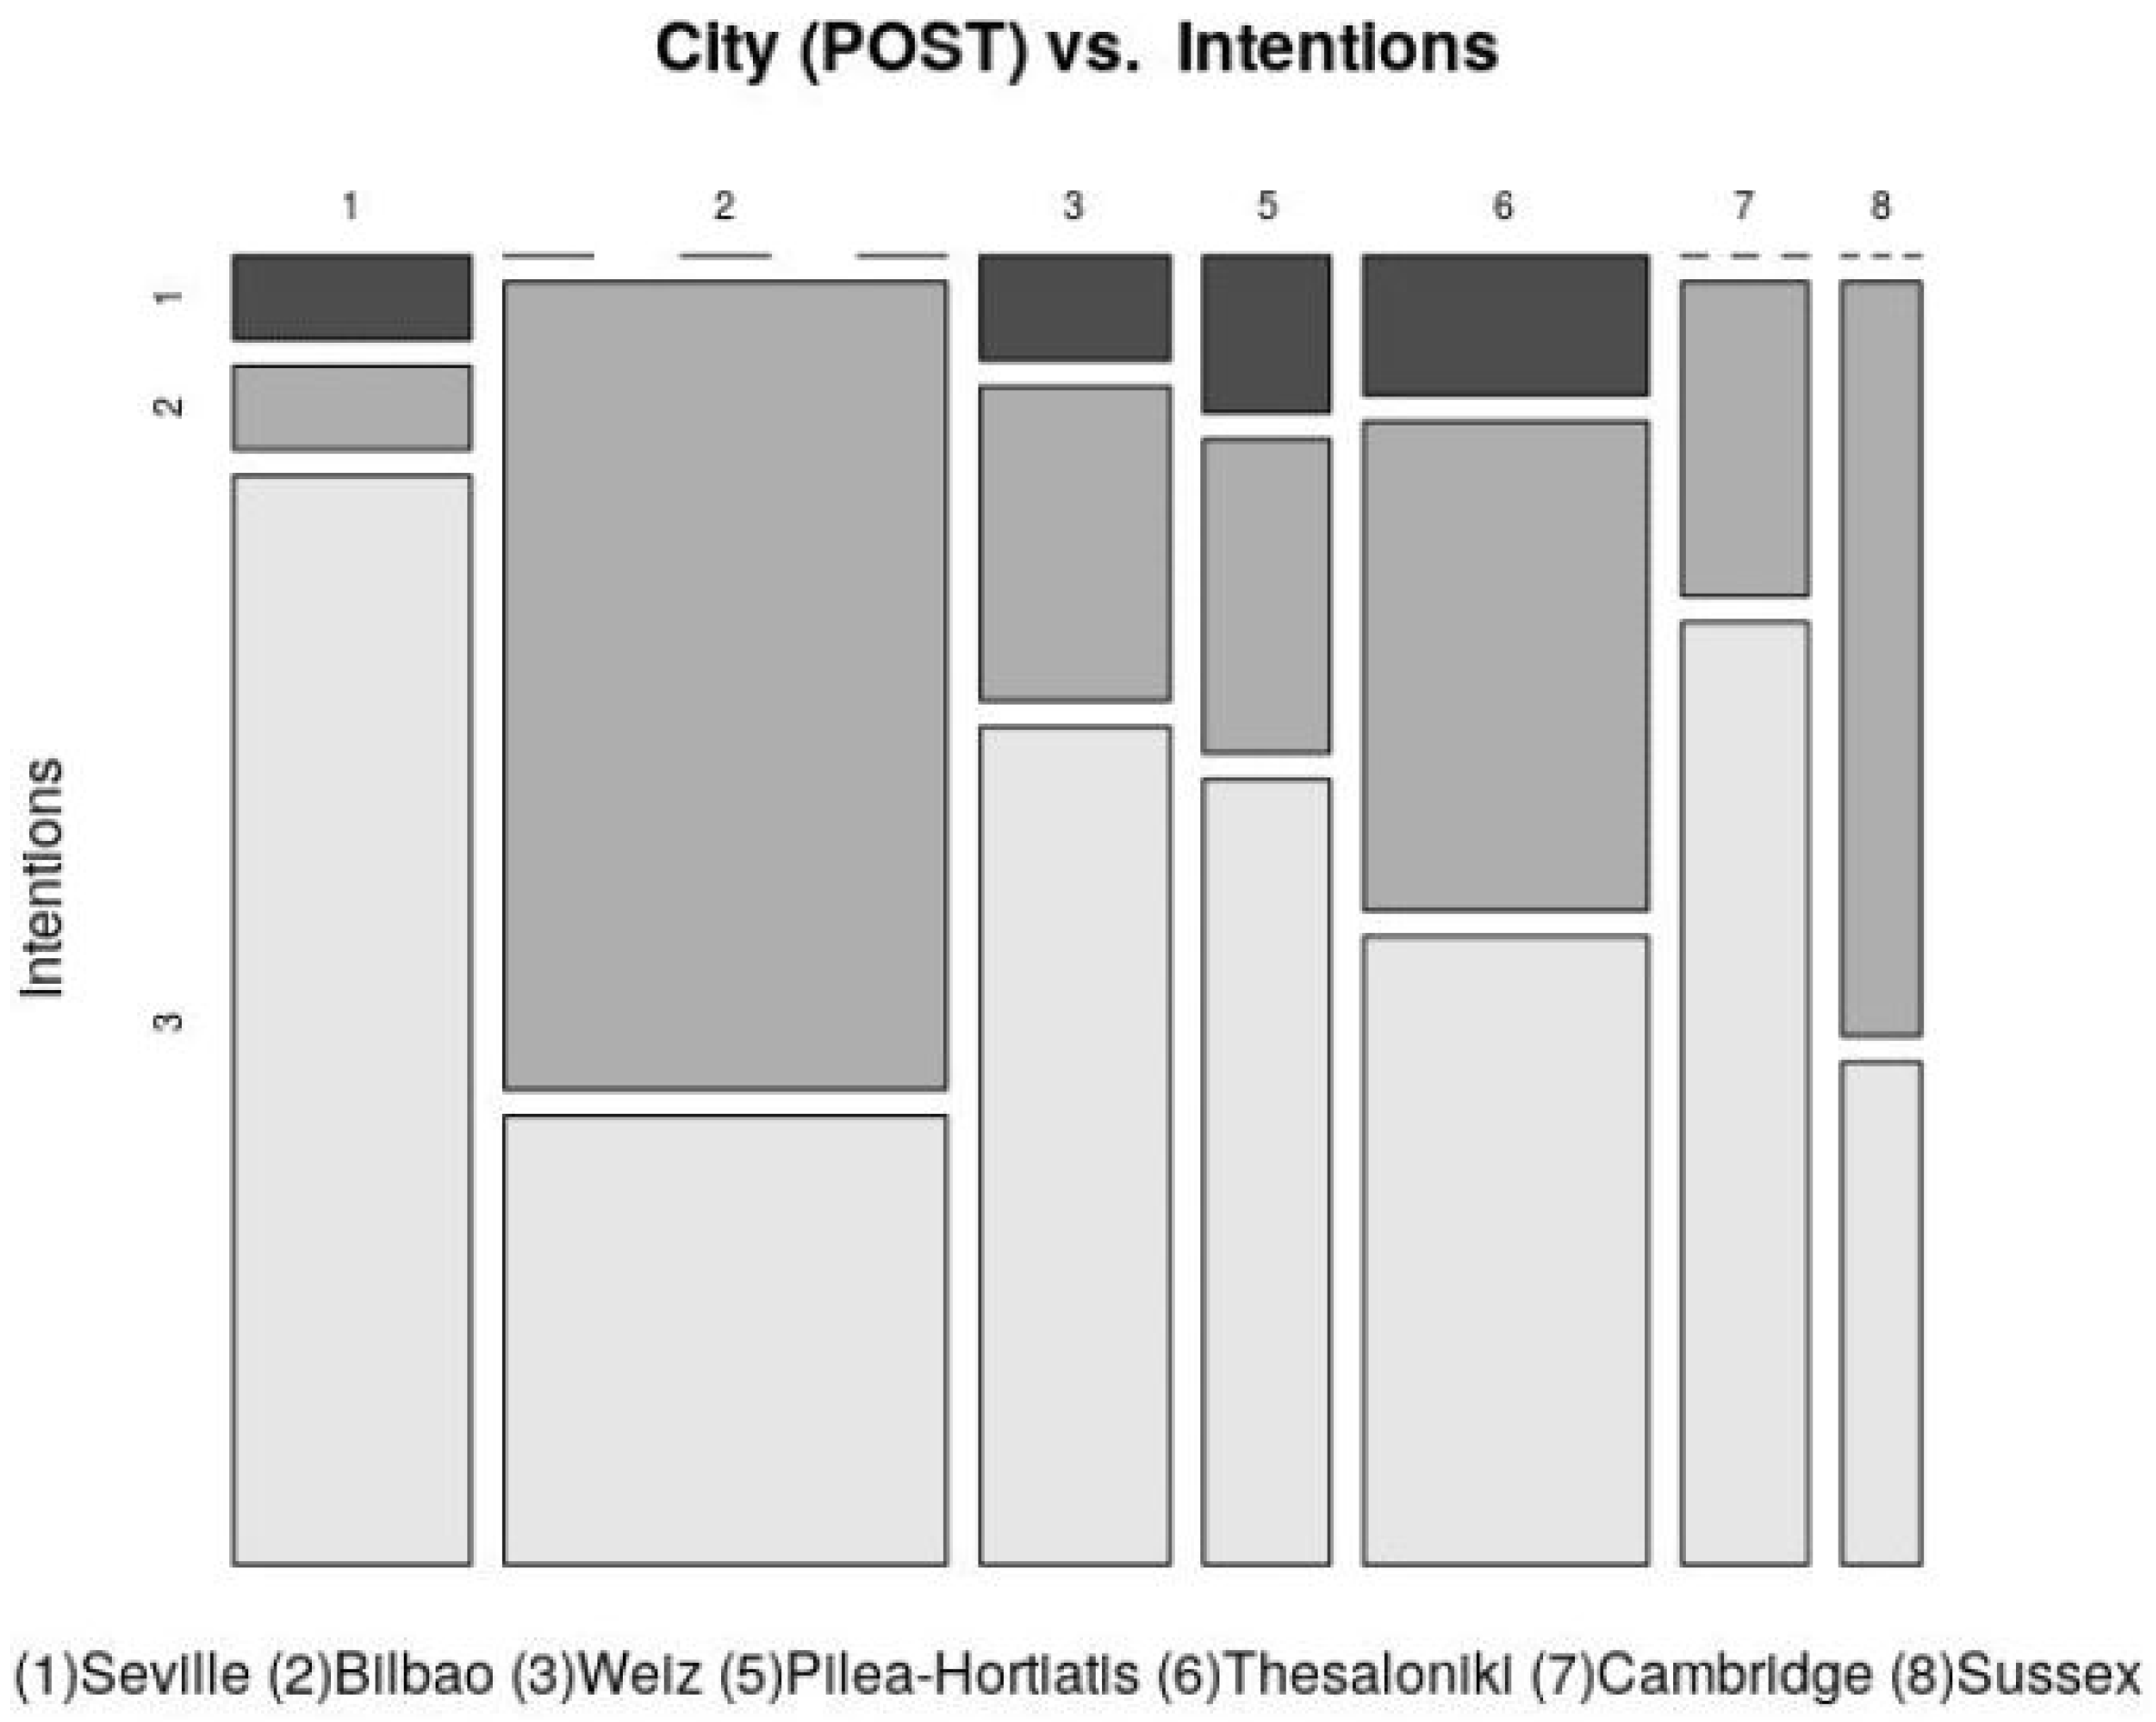
Intentions, Barriers and Confidence in Technology
4.3.2. Results from Post-Pilot Questionnaires
Pre-Contemplation, Contemplation and Action
Intentions, Barriers and Confidence in Technology
4.4. Summary of Results
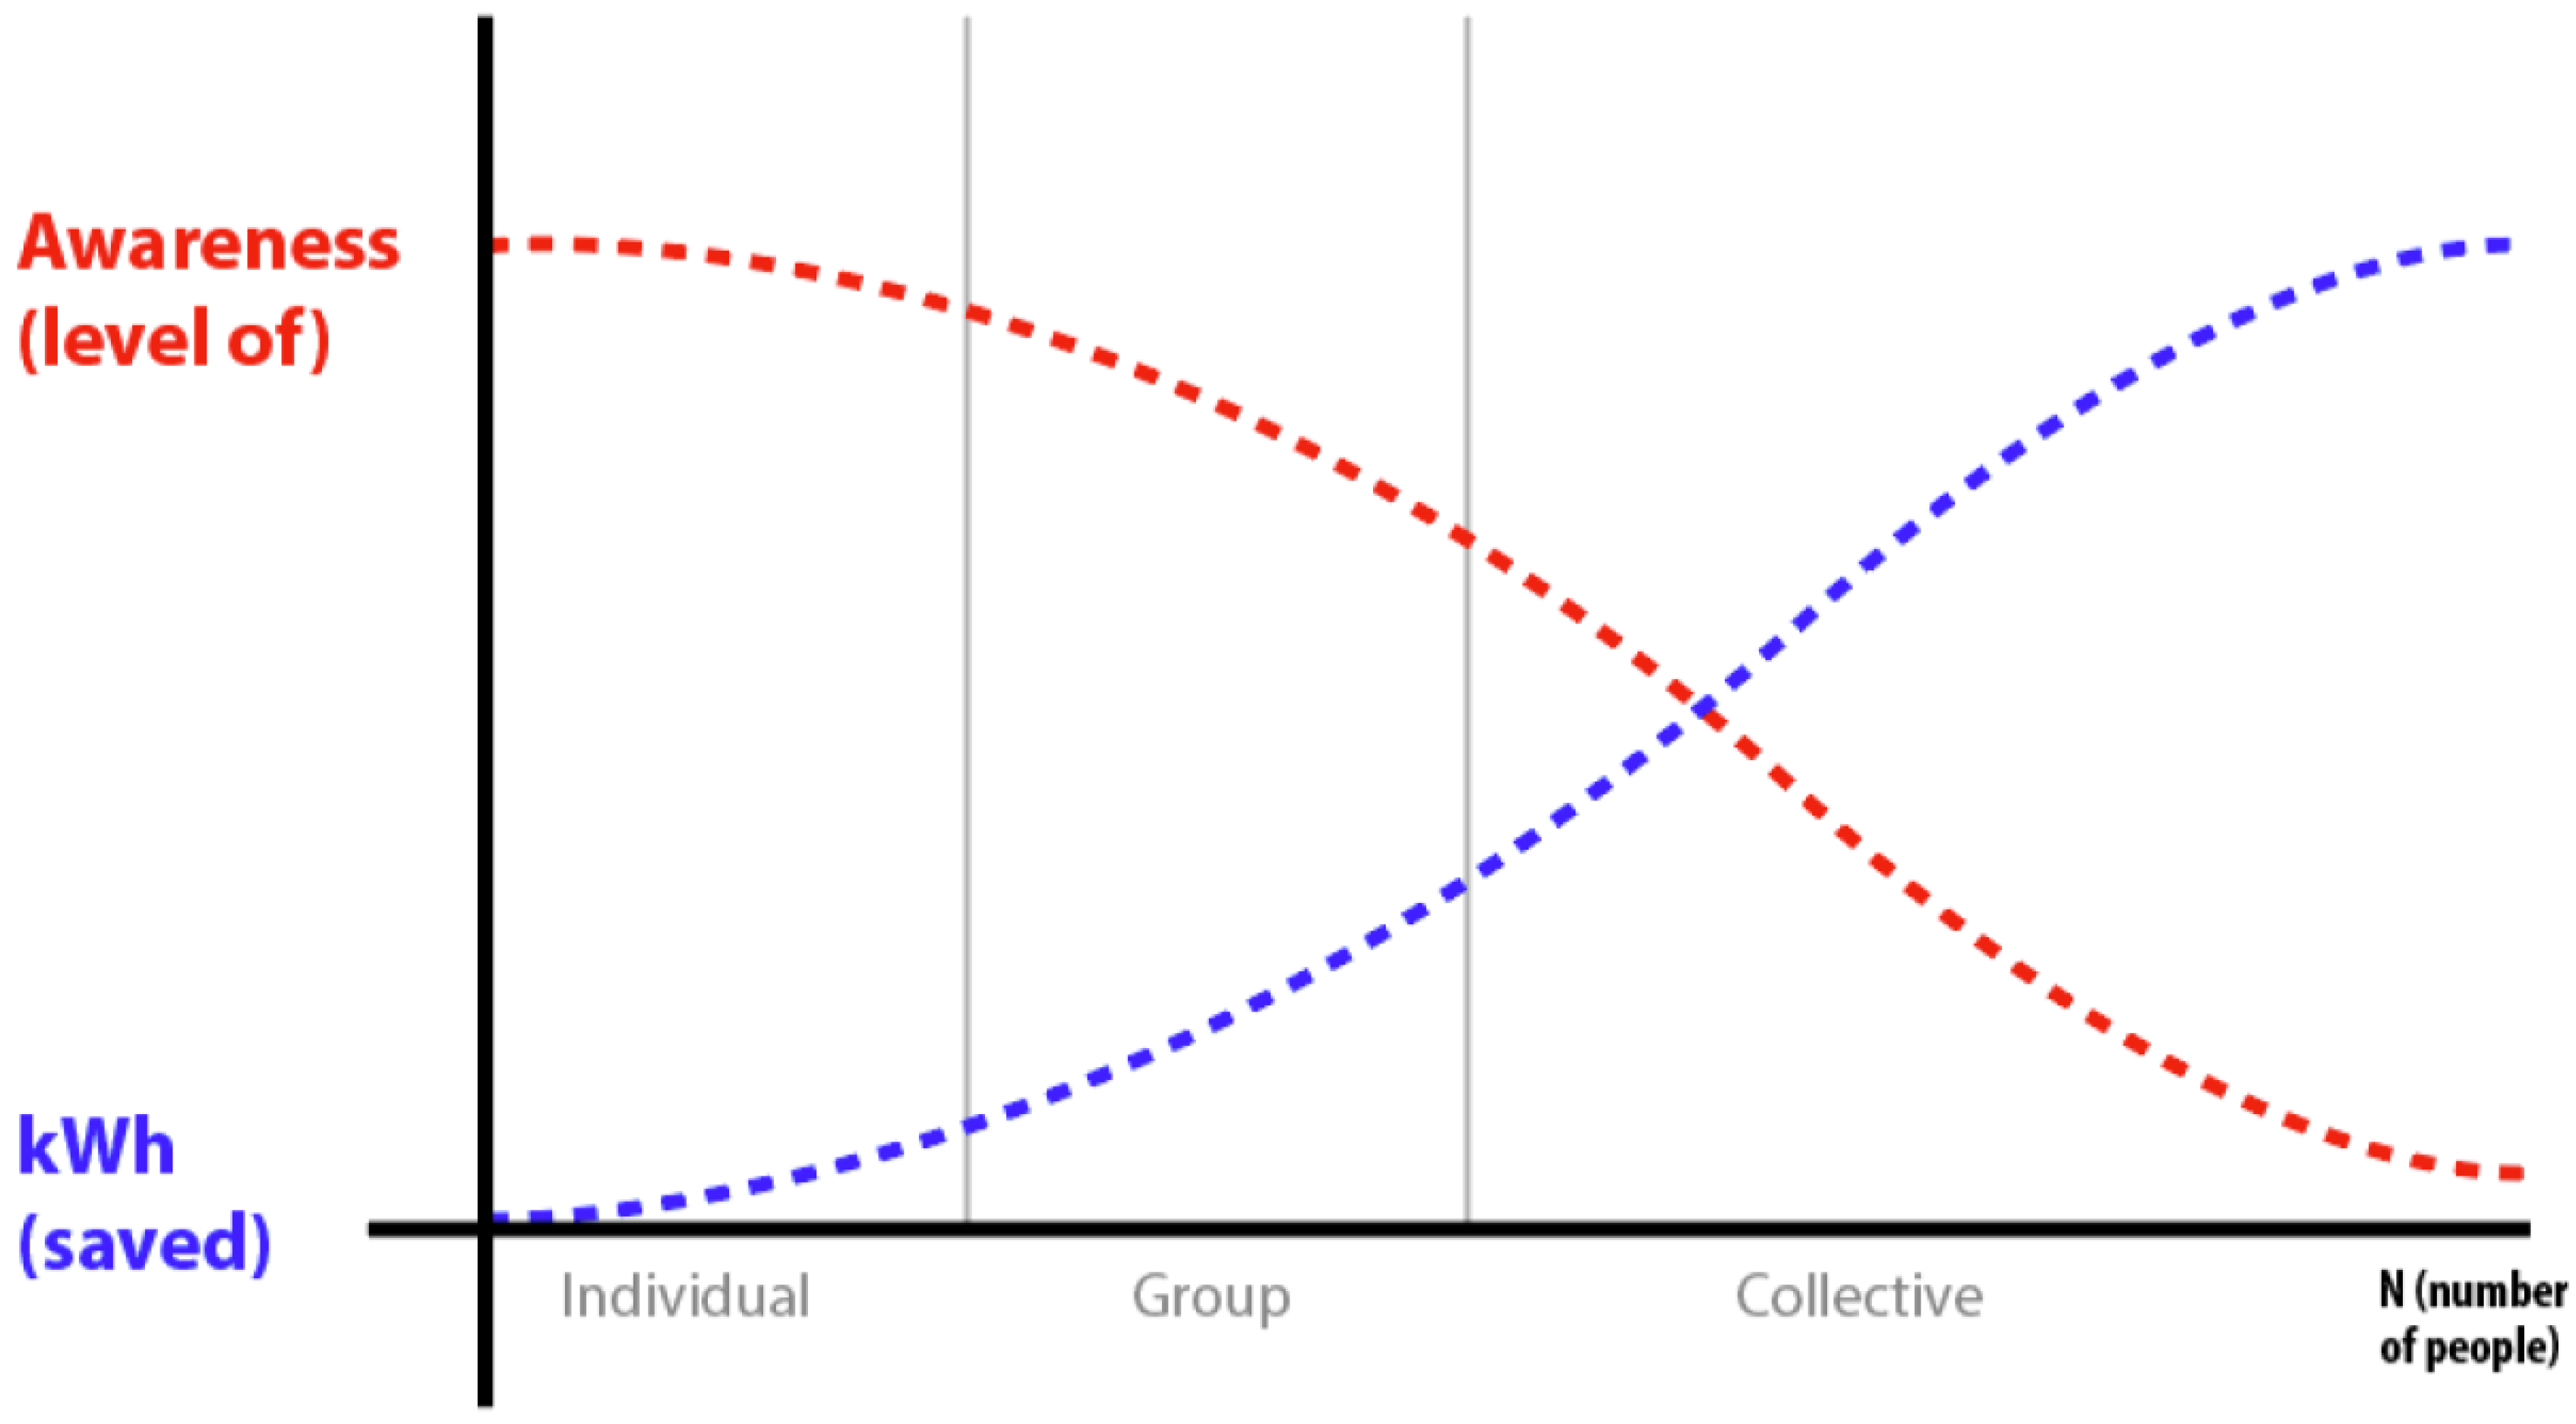
5. Implications on ICT-Based Interventions for Sustainability
Limitations and Mitigation Actions
6. Conclusions and Outlook
Author Contributions
Funding
Acknowledgments
Conflicts of Interest
Abbreviations
| ICT | Information and Commu Technologies |
| GS | GreenSoul |
| PP | Persuasive Principle |
| PS | Persuasive Strategy |
| TTM | Transtheoretical Model |
| PRE | Pre-Pilot |
| POST | Post-Pilot |
| RCT | Randomised Controlled Trial |
Appendix A. Offices and Pilots Description
References
- Scherbaum, A.; Popovich, P.; Finlinson, S. Exploring individual-level factors related to employee energy-conservation behaviors at work. J. Appl. Soc. Psychol. 2008, 38, 818–835. [Google Scholar] [CrossRef]
- Burger, P.; Bezençon, V.; Bornemann, B.; Brosch, T.; Carabias-Hütter, V.; Farsi, M.; Hille, S.; Moser, C.; Ramseier, C.; Samuel, R.; et al. Advances in understanding energy consumption behavior and the governance of its change–outline of an integrated framework. Front. Energy Res. 2015, 3, 29. [Google Scholar] [CrossRef] [Green Version]
- Ghazali, E.; Nguyen, B.; Mutum, D.; Yap, S. Pro-environmental behaviours and Value-Belief-Norm theory: Assessing unobserved heterogeneity of two ethnic groups. Sustainability 2019, 11, 3237. [Google Scholar] [CrossRef] [Green Version]
- Zhang, Y.; Bai, X.; Mills, F.P.; Pezzey, J.C. Rethinking the role of occupant behavior in building energy performance: A review. Energy Build. 2018, 172, 279–294. [Google Scholar] [CrossRef]
- Paone, A.; Bacher, J.P. The impact of building occupant behavior on energy efficiency and methods to influence it A review of the state of the art. Energies 2018, 11, 953. [Google Scholar] [CrossRef] [Green Version]
- Ajzen, I. The theory of planned behavior. Organ. Behav. Hum. Decis. Process. 1991, 50, 179–211. [Google Scholar] [CrossRef]
- Hines, J.; Hungerford, H.; Tomera, A. Analysis and synthesis of research on responsible environmental behavior: A meta-analysis. J. Environ. Educ. 1987, 18, 1–8. [Google Scholar] [CrossRef]
- Stren, P. Toward a coherent theory of environmentally significant behaviour. J. Soc. Issues 2000, 56, 407–424. [Google Scholar] [CrossRef]
- Kollmuss, A.; Agyeman, J. Mind the gap: Why do people act environmentally and what are the barriers to pro-environmental behavior? Environ. Educ. Res. 2002, 8, 239–260. [Google Scholar] [CrossRef] [Green Version]
- Belafi, Z.; Hong, T.; Reith, A. A critical review on questionnaire surveys in the field of energy-related occupant behaviour. Energy Effic. 2018, 11, 2157–2177. [Google Scholar] [CrossRef] [Green Version]
- Thaler, R.; Sunstein, C. Nudge: Improving Decisions About Health, Wealth, and Happiness; Penguin. 2009. Available online: https://www.penguin.co.uk/books/567/56784/nudge/9780141040011.html (accessed on 12 November 2019).
- Fogg, B.J. Persuasive technology: Using computers to change what we think and do. Ubiquity 2002, 2002, 2. [Google Scholar] [CrossRef] [Green Version]
- Cialdini, R.B.; Cialdini, R.B. Influence: The Psychology of Persuasion; Morrow: New York, NY, USA, 1993. [Google Scholar]
- Froehlich, J.; Findlater, L.; Landay, J. The design of eco-feedback technology. In Proceedings of the SIGCHI Conference on Human Factors in Computing Systems, Atlanta, GA, USA, 10–15 April 2010; pp. 1999–2008. [Google Scholar] [CrossRef]
- Kosters, M.; Van der Heijden, J. From mechanism to virtue: Evaluating Nudge theory. Evaluation 2015, 21, 276–291. [Google Scholar] [CrossRef] [Green Version]
- Hermsen, S.; Frost, J.; Renes, R.J.; Kerkhof, P. Using feedback through digital technology to disrupt and change habitual behavior: A critical review of current literature. Comput. Hum. Behav. 2016, 57, 61–74. [Google Scholar] [CrossRef] [Green Version]
- De Young, R. Changing behavior and making it stick: The conceptualization and management of conservation behavior. Environ. Behav. 1993, 25, 485–505. [Google Scholar] [CrossRef] [Green Version]
- Knowles, B.; Blair, L.; Walker, S.; Coulton, P.; Thomas, L.; Mullagh, L. Patterns of persuasion for sustainability. In Proceedings of the 2014 Conference on Designing Interactive Systems (DIS’14), Vancouver, BC, Canada, 21–25 June 2014; pp. 1035–1044. [Google Scholar] [CrossRef]
- GreenSoul, H2020. Available online: http://www.greensoul-h2020.eu/ (accessed on 2 April 2020).
- Casado-Mansilla, D.; Moschos, I.; Kamara-Esteban, O.; Tsolakis, A.C.; Borges, C.E.; Krinidis, S.; Irizar-Arrieta, A.; Konstantinos, K.; Pijoan, A.; Tzovaras, D.; et al. A Human-Centric Context-Aware IoT Framework for Enhancing Energy Efficiency in Buildings of Public Use. IEEE Access 2018, 6, 31444–31456. [Google Scholar] [CrossRef]
- Casado-Mansilla, D.; Lopez-de Armentia, J.; Garaizar, P.; López-de Ipiña, D. To switch off the coffee-maker or not: That is the question to be energy-efficient at work. In Proceedings of the CHI’14 Extended Abstracts on Human Factors in Computing Systems, Toronto, ON, Canada, 26 April–1 May 2014; pp. 2425–2430. [Google Scholar] [CrossRef]
- Whittle, C.; Jones, C. User perceptions of energy consumption in university buildings: A University of Sheffield case study. J. Sustain. Educ. 2013, 5, 27. [Google Scholar]
- Casado-Mansilla, D.; Papageorgiou, D.; Borges, C.; Tsolakis, A.; Kamara, O.; Krinidis, S.; Sanchez, R.; Moschos, I.; Zacharaki, A. (PRE) Socio-economic and cultural dataset in relation to Persuasive Strategies to boost Energy Efficiency and in the UK, Spain, Greece and Austria. 2019. Available online: http://10.5281/zenodo.2610102 (accessed on 23 February 2020).
- Papageorgiou, D.; Casado-Mansilla, D.; Tsolakis, A.C.; Borges, C.E.; Zacharaki, A.; Kamara-Esteban, O.; Avila, J.M.; Moschos, I.; Irizar-Arrieta, A. A Socio-economic Survey for Understanding Self-perceived Effectiveness of Persuasive Strategies Towards Energy Efficiency in Tertiary Buildings. In Proceedings of the 5th IEEE International Conference on Internet of People, Leicester, UK, 19–23 August 2018; pp. 1–6. [Google Scholar]
- Oinas-Kukkonen, H.; Harjumaa, M. Persuasive Systems Design: Key Issues, Process Model and System Features 1. In Routledge Handbook of Policy Design; Routledge: London, UK, 2018; pp. 87–105. [Google Scholar]
- Casado-Mansilla, D.; Tsolakis, A.; Borges, C.; Manterola, A.; Sanchez, R.; Krinidis, S.; Kamara, O.; López de Ipiña, D. (POST) Socio-economic and cultural dataset in relation to Persuasive Strategies to boost Energy Efficiency and in the UK, Spain, Greece and Austria. 2019. Available online: http://10.5281/zenodo.3565757 (accessed on 23 February 2020).
- Lockton, D.; Harrison, D.; Stanton, N.A. Models of the user: Designers’ perspectives on influencing sustainable behaviour. J. Des. Res. 2012, 10, 7–27. [Google Scholar] [CrossRef] [Green Version]
- Tribble, S.L. Promoting environmentally responsible behaviors using motivational interviewing techniques. In Honors Projects; Illinois Wesleyan University: Bloomington, IL, USA, 2008. [Google Scholar]
- Sutton, S. Transtheoretical model of behaviour change. In Cambridge Handbook of Psychology, Health and Medicine; Cambridge University Press: Cambridge, UK, 2007; pp. 228–232. Available online: https://doi.org/10.1017/CBO9780511543579.050 (accessed on 23 February 2020).
- Sullivan, G.M.; Feinn, R. Using effect size—or why the P value is not enough. J. Grad. Med Educ. 2012, 4, 279–282. [Google Scholar] [CrossRef] [Green Version]
- Eichhorn, W. Fisher’s tests revisited. Econom. J. Econom. Soc. 1976, 247–256. [Google Scholar] [CrossRef]
- Agresti, A. A survey of exact inference for contingency tables. Stat. Sci. 1992, 7, 131–153. [Google Scholar] [CrossRef]
- Casado-Mansilla, D.; Garaizar, P.; López-de Ipiña, D. User Involvement Matters: The Side-Effects of Automated Smart Objects in Pro-environmental Behaviour. In Proceedings of the 9th International Conference on the Internet of Things, Bilbao, Spain, 22–25 October 2019; pp. 1–4. [Google Scholar] [CrossRef]
- Anagnostopoulou, E.; Magoutas, B.; Bothos, E.; Schrammel, J.; Orji, R.; Mentzas, G. Exploring the links between persuasion, personality and mobility types in personalized mobility applications. In International Conference on Persuasive Technology; Springer: Berlin, Germany, 2017; pp. 107–118. [Google Scholar]
- Oyibo, K.; Adaji, I.; Orji, R.; Olabenjo, B.; Vassileva, J. Susceptibility to persuasive strategies: A comparative analysis of Nigerians vs. Canadians. In Proceedings of the 26th Conference on User Modeling, Adaptation and Personalization, Singapore, 8–11 July 2018; pp. 229–238. [Google Scholar]
- Oyibo, K.; Orji, R.; Vassileva, J. Investigation of the Persuasiveness of Social Influence in Persuasive Technology and the Effect of Age and Gender. In PPT@ PERSUASIVE; Amsterdam, The Netherlands, 2017; pp. 32–44. Available online: http://ceur-ws.org/Vol-1833/8_Oyibo.pdf (accessed on 3 April 2020).
- Peschiera, G.; Taylor, J.E.; Siegel, J.A. Response–relapse patterns of building occupant electricity consumption following exposure to personal, contextualized and occupant peer network utilization data. Energy Build. 2010, 42, 1329–1336. [Google Scholar] [CrossRef]
- Irizar-Arrieta, A.; Casado-Mansilla, D.; Garaizar, P.; López-de Ipiña, D.; Retegi, A. User perspectives in the Design of Interactive Everyday Objects for Sustainable Behaviour. Int. J. Hum. Comput. Stud. 2020, 137, 102393. [Google Scholar] [CrossRef]
- Kim, M.; Shi, R.; Cappella, J.N. Effect of character–audience similarity on the perceived effectiveness of antismoking PSAs via engagement. Health Commun. 2016, 31, 1193–1204. [Google Scholar] [CrossRef] [PubMed]
- Durantini, M.R.; Albarracin, D.; Mitchell, A.L.; Earl, A.N.; Gillette, J.C. Conceptualizing the influence of social agents of behavior change: A meta-analysis of the effectiveness of HIV-prevention interventionists for different groups. Psychol. Bull. 2006, 132, 212. [Google Scholar] [CrossRef] [PubMed] [Green Version]
- Ponce, P.; Polasko, K.; Molina, A. End user perceptions toward smart grid technology: Acceptance, adoption, risks, and trust. Renew. Sustain. Energy Rev. 2016, 60, 587–598. [Google Scholar] [CrossRef]
- Alcott, B. Jevons’ paradox. Ecol. Econ. 2005, 54, 9–21. [Google Scholar] [CrossRef]
- Murtagh, N.; Gatersleben, B.; Cowen, L.; Uzzell, D. Does perception of automation undermine pro-environmental behaviour? Findings from three everyday settings. J. Environ. Psychol. 2015, 42, 139–148. [Google Scholar] [CrossRef] [Green Version]
- Eysenbach, G. The law of attrition. J. Med. Internet Res. 2005, 7, e11. [Google Scholar] [CrossRef]
- GreenSoul Project. Greensoul Pilots. Available online: http://www.greensoul-h2020.eu/public-deliverables/greensoul-end-users-requirements-report (accessed on 23 March 2020).


| # | Persuasion Principle | Description |
|---|---|---|
| P1 | Authority | People will tend to obey authority figures, even if they are asked to perform objectionable acts. People want to follow the lead of real experts. |
| P2 | Cause and effect | This principle can effectively persuade people to change their attitudes or behaviour by enabling them to observe a direct link between cause and effects of daily actions. |
| P3 | Conditioning | A behavioural process whereby a response becomes more frequent or more predictable in a given environment as a result of reinforcement, with reinforcement typically being a stimulus or reward for a desired response. Computerised systems use principles of operant conditioning to change behaviours. To use operant conditioning is basically to provide reinforcement (positive or negative) to the user. |
| P4 | Cooperation Liking | A system can motivate users to adopt a target attitude or behaviour by leveraging human beings’ natural drive to cooperate. Further, People prefer to say “yes” to those they know and like. People are also more likely to favour those who are physically attractive, similar to themselves, or who give them compliments. Even something as “random” as having the same name as your prospects can increase your chances of making a sale (e.g., Coke). |
| P5 | Tailoring Personalisation | A system that offers personalised content or services has a greater capability for persuasion. Further, information provided by the system will be more persuasive if it is tailored to the potential needs, interests, personality, usage context, or other factors relevant to a user group. It provides information that is specific to the individual to better enable a certain behaviour. |
| P6 | Physical attractiveness | It plays an essential role in making the application easy to understand and more likeable. |
| P7 | Praise | By offering praise, a system can make users more open to persuasion. |
| P8 | Real-world feel verifiability | A system that highlights people or organisation behind its content or services will have more credibility. System should provide information of the organisation and/or actual people behind its content and services. Moreover, credibility perceptions will be enhanced if a system makes it easy to verify the accuracy of site content via outside sources. |
| P9 | Reciprocity | Reciprocation recognises that people feel indebted to those who do something for them or give them a gift. People tend to return a favour. |
| P10 | Reduction | A system that reduces complex behaviour into simple tasks helps users perform the target behaviour, and it may increase the benefit/cost ratio of a behaviour. |
| P11 | Self-monitoring | A system that keeps track of one’s own performance or status supports the user in achieving goals. The goal is to allow people to monitor themselves to modify their behaviour to achieve a predetermined objective or outcome. |
| P12 | Similarity | People are more readily persuaded through systems that remind them of themselves in some meaningful way. We are more persuaded by people we think are similar to us (personality, interests, etc). |
| P13 | Social proof | A psychological phenomenon where people assume the actions of others in an attempt to reflect correct behaviour for a given situation. It is the concept that people will conform to the actions of others under the assumption that those actions are reflective of the correct behaviour. |
| P14 | Social Recognition | By offering public recognition for an individual or group, a system can increase the likelihood that a person/group will adopt a target behaviour. |
| P15 | Suggestion | Systems offering fitting suggestions will have greater persuasive powers. People are more likely to engage in an activity when it is closely related to what they are currently doing. |
| # | Persuasion Strategy |
|---|---|
| v2 | Public (social) recognition of your contribution to energy savings is provided |
| v3 | Receive personal praise (privately) for your contribution to energy savings |
| v4 | The support of the majority of your peers to improve energy efficient behaviour |
| v5 | Receive energy related information in a simple and aesthetically appealing way |
| v6 | Receiving perks such as flexible working hours, skipping certain tasks, etc., as a reward for improving your energy performance |
| v7 | You and your team receive recognition for collectively achieving energy savings |
| v8 | You receive information about the people (e.g., engineers, vendors, etc.) behind the instruments and equipment which allows you to collect energy-related data |
| v9 | You are assisted in setting, meeting and reviewing your own personal energy saving goals |
| v10 | Your (top) managers are also committed to save energy |
| v11 | You can monitor & track your own energy performance in real-time |
| v12 | The overall energy saving goals are broken down into smaller easily achievable |
| v13 | The feasibility of the proposed energy savings has been verified in other buildings similar to your workplace |
| v14 | Energy related information is tailored to you and you are able to self-configure some parameters (e.g., data provided, frequency, etc.) according to your preferences |
| v15 | Information on the actual effect that your (potential) actions may have upon the energy consumption |
| v16 | Comparative assessment of your actual energy performance compared to benchmarks/ good practices |
| v17 | Comparative assessment of your energy saving performance with the respective performance of your peers (e.g., colleagues, other visitors, etc.) |
| v18 | Historical comparison of your energy performance and/or consumption |
| v19 | Tips or suggestions on the energy saving practice of the day/week |
| v20 | Progress, tips and lessons learned on specific energy saving actions performed by other users that are similar to me |
| v21 | Advice and quotes from energy experts (including external energy consultants, energy researchers, energy agencies, etc.) |
| v22 | Links to data about how energy consumption is monitored and (potential) energy savings assessed |
| Persuasion Principle | Persuasion Strategy |
|---|---|
| Authority (P1) | v10, v21 |
| Cause and effect (P2) | v15 |
| Conditioning (P3) | v6 |
| Cooperation & Liking (P4) | v4 |
| Tailoring & Personalization (P5) | v9, v14 |
| Physical attractiveness (P6) | v5 |
| Praise (P7) | v3 |
| Verifiability & Real-world feel (P8) | v8, v13, v22 |
| Reciprocity (P9) | v7 |
| Reduction (P10) | v12 |
| Self-monitoring (P11) | v11, v16, v18 |
| Similarity (P12) | v20 |
| Social proof (P13) | v20, v10 |
| Social Recognition (P14) | v2, v7 |
| Suggestion (P15) | v19 |
| Bilbao | Cambridge | Sussex | Pilea | Seville | Weiz | Thessaloniki | |
|---|---|---|---|---|---|---|---|
| Pre-Pilot | 53 | 58 | 60 | 26 | 30 | 18 | 58 |
| Post-Pilot | 28 | 8 | 5 | 19 | 15 | 12 | 18 |
| Absentmindedness | Lack of Awareness | Peers’ Discouragement | Other | |
|---|---|---|---|---|
| PRE | 6 | 5 | 5 | 10 |
| POST | 10 | 0 | 0 | 3 |
| Persuasion Principles | City | Education | Initiative_to_Join |
|---|---|---|---|
| P2 | - | ||
| P7 | - | ||
| P12 | - | - | |
| P15 | - | - |
| Pre-Contemplation | Contemplation | Action | |
|---|---|---|---|
| City | Weiz-Bilbao Weiz-Seville Weiz-Thessaloniki Weiz-Cambridge Weiz-Sussex (; ) | Bilbao - Sussex (; ) | - |
| Persuasion Principles | City | Organisation Strategy | Confidence |
|---|---|---|---|
| P3 | - | - | |
| P9 | - | - | |
| P12 | - | ||
| P14 | - | - |
| Pre-Contemplation | Contemplation | Action | |
|---|---|---|---|
| City | Thessaloniki-Bilbao Pilea-Bilbao () | Seville - Bilbao Thessaloniki-Bilbao Cambridge -Bilbao () | - |
© 2020 by the authors. Licensee MDPI, Basel, Switzerland. This article is an open access article distributed under the terms and conditions of the Creative Commons Attribution (CC BY) license (http://creativecommons.org/licenses/by/4.0/).
Share and Cite
Casado-Mansilla, D.; Tsolakis, A.C.; Borges, C.E.; Kamara-Esteban, O.; Krinidis, S.; Avila, J.M.; Tzovaras, D.; López-de-Ipiña, D. Socio-Economic Effect on ICT-Based Persuasive Interventions Towards Energy Efficiency in Tertiary Buildings. Energies 2020, 13, 1700. https://doi.org/10.3390/en13071700
Casado-Mansilla D, Tsolakis AC, Borges CE, Kamara-Esteban O, Krinidis S, Avila JM, Tzovaras D, López-de-Ipiña D. Socio-Economic Effect on ICT-Based Persuasive Interventions Towards Energy Efficiency in Tertiary Buildings. Energies. 2020; 13(7):1700. https://doi.org/10.3390/en13071700
Chicago/Turabian StyleCasado-Mansilla, Diego, Apostolos C. Tsolakis, Cruz E. Borges, Oihane Kamara-Esteban, Stelios Krinidis, Jose Manuel Avila, Dimitrios Tzovaras, and Diego López-de-Ipiña. 2020. "Socio-Economic Effect on ICT-Based Persuasive Interventions Towards Energy Efficiency in Tertiary Buildings" Energies 13, no. 7: 1700. https://doi.org/10.3390/en13071700