Exhaust Emissions and Energy Consumption Analysis of Conventional, Hybrid, and Electric Vehicles in Real Driving Cycles


Faculty of Civil and Transport Engineering, Poznan University of Technology, pl. M. Sklodowskiej-Curie 5, 60-965 Poznan, Poland
*
Author to whom correspondence should be addressed.
Energies 2020, 13(23), 6423; https://doi.org/10.3390/en13236423
Submission received: 13 November 2020
/
Revised: 28 November 2020
/
Accepted: 2 December 2020
/
Published: 4 December 2020
(This article belongs to the Special Issue Exhaust Emissions from Passenger Cars)
Abstract
:One of the environmental aims of the European Union is to achieve climate neutrality by 2050. According to European Parliament data, transport emissions accounted for about 25% of global carbon dioxide emissions in 2016, in which road transport had the largest share (approximately 72%). This phenomenon is particularly visible in urban agglomerations. The solution examples are the popularization of hybrid vehicles and the development of electromobility. The aim of this paper is an assessment of the energy consumption and exhaust emissions from passenger cars fitted with different powertrains in actual operation. For the tests, passenger cars with conventional engines of various emission classes were used as well as the latest hybrid vehicles and an electric car. It enabled a comparative assessment of the energy consumption under different traffic conditions, with particular emphasis on the urban phase and the entire RDE (Real Driving Emissions) test. The results were analyzed to identify changes in these environmental factors that have occurred with the technical advancement of vehicles. The lowest total energy consumption in real traffic conditions is characteristic of an electric vehicle; the plug-in hybrid vehicle with a gasoline engine is about 10% bigger, and the largest one is a combustion vehicle (30% bigger than an electric vehicle). These data may contribute to the classification of vehicles and identification of advantages of the latest developments in conventional, hybrid, and electric vehicles.
1. Introduction
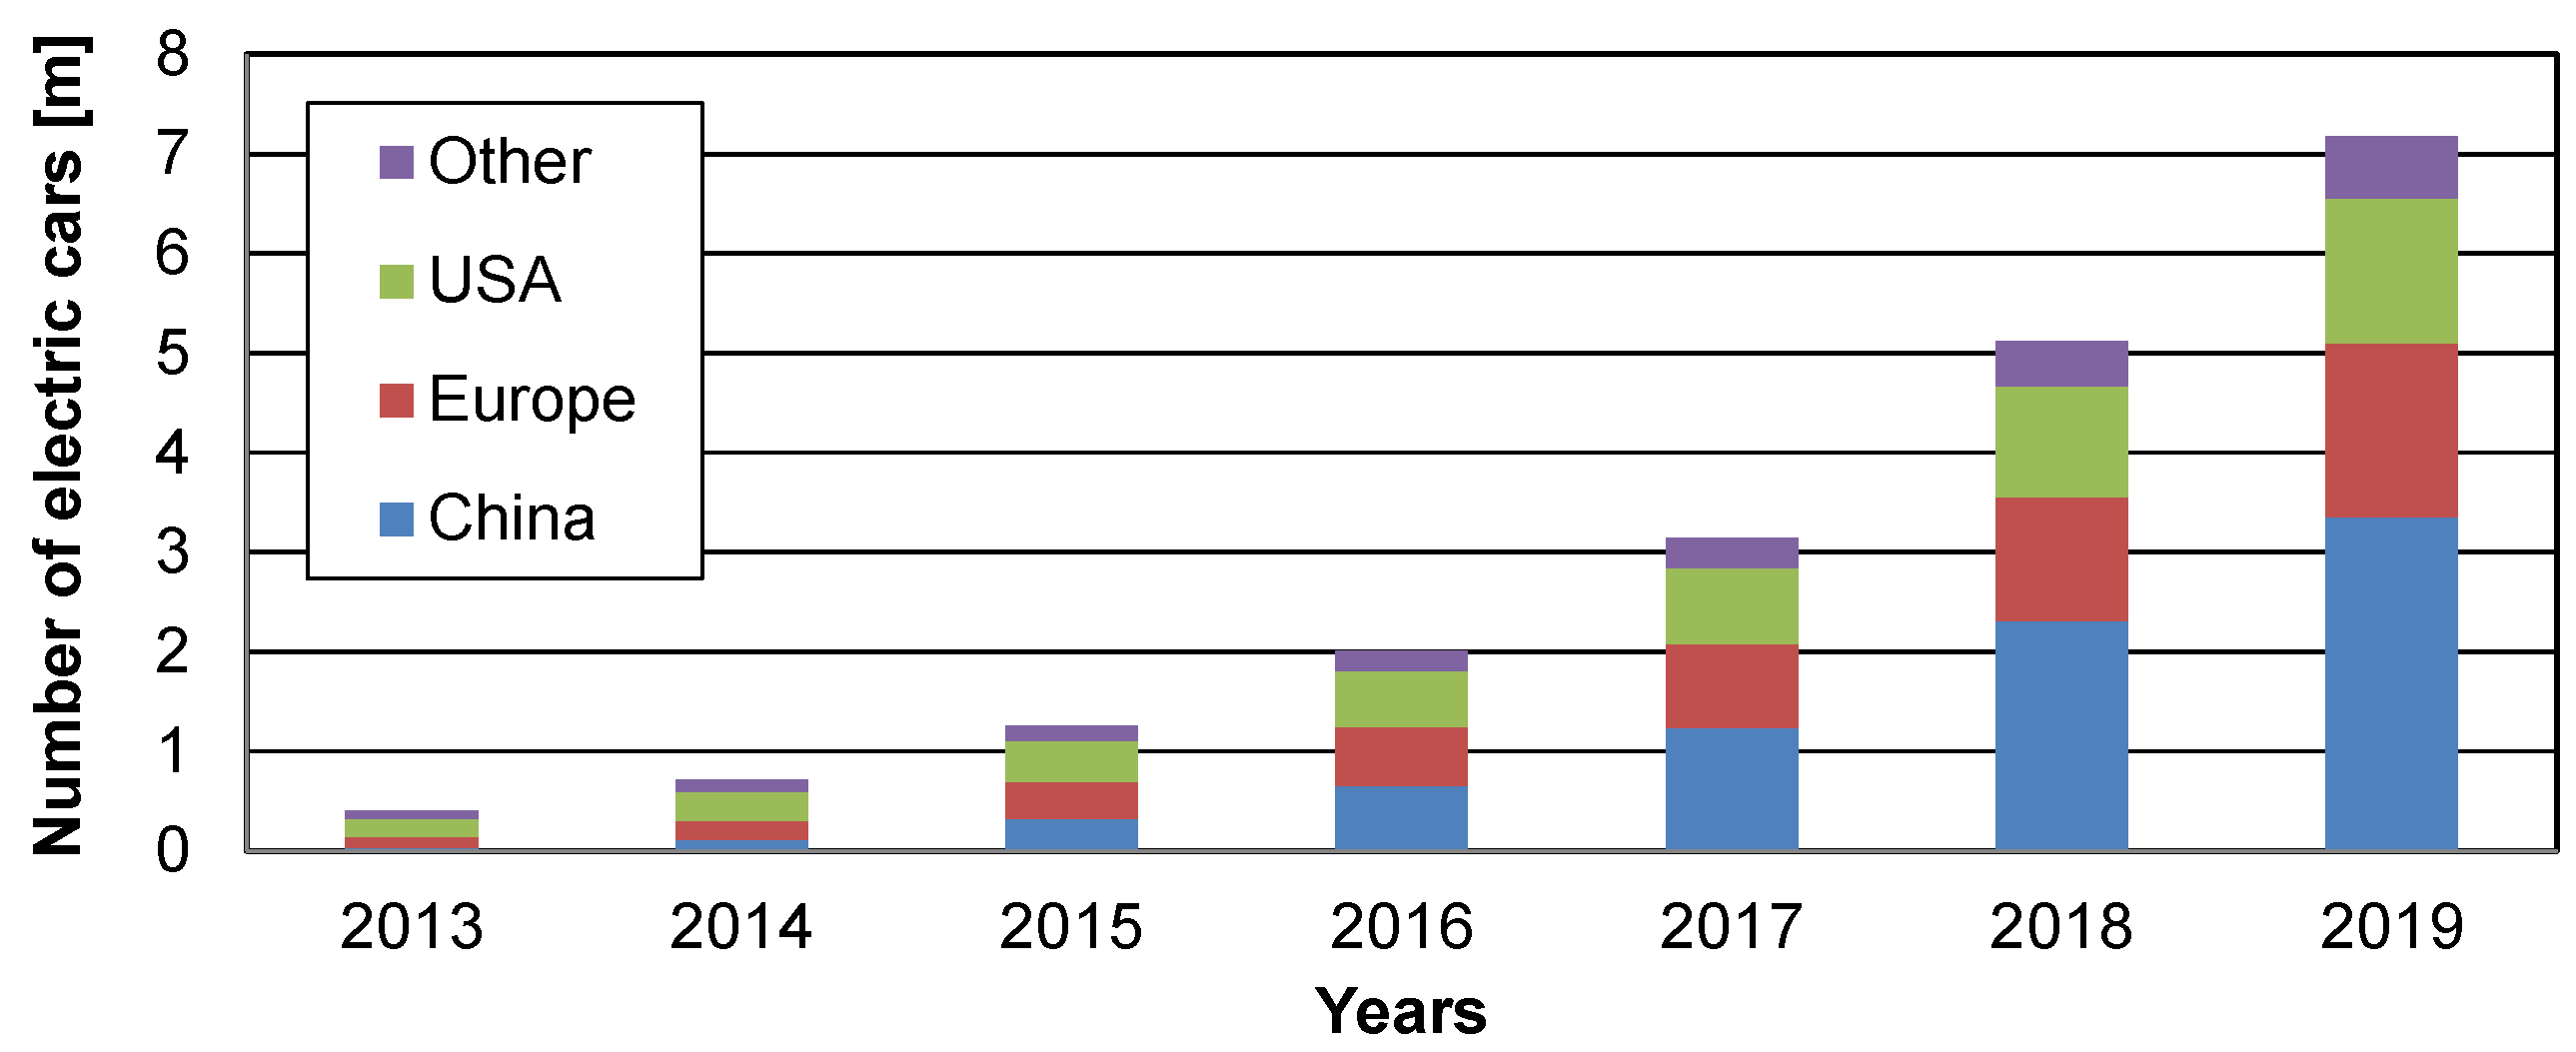
Transport is one of the main sectors of the economy characterized by an increased emission of carbon dioxide. According to the European Parliament [1], almost 30% of the total emissions within the European Union come from transport, 72% of which came from road transport (where passenger vehicles generate 60.7% of the carbon dioxide emissions (CO2)). Therefore, reduction of the emissions from transport by 60% by 2050 became one of the main objectives and challenges for the carmakers. Stringent emission and fuel consumption standards, subsidies for zero and low- emission vehicles, as well as support in the implementation of the vehicle charging infrastructure make electric and hybrid vehicles increasingly popular. In the last 7 years (since 2013), the number of electric vehicles increased and today, their share in the market amounts to 2.5% (one in 40 new vehicles is fitted with an electric powertrain), including 74% fully electric and 26% plug-in hybrids. The increase in the number of electric and hybrid vehicles is shown in Figure 1, where the period 2013–2019 is compared. In 2013, when the sales of electric vehicles was initiated, their number was 0.3 million. In 2015 the number of these vehicles exceeded one million, and in 2018, it increased to over five million. In 2019, the sales of electric vehicles reached 2.1 million units worldwide, exceeding the record year of 2018 and reaching a total of 7.2 million units [2]. Ambitious political declarations were a key factor in stimulating the advancement of electric vehicle technologies in the main vehicle markets in recent years. The increase in the number of vehicles is exponential—in each subsequent year, the number of vehicles increases twofold. Electric vehicles constitute a significant value in this calculation, which is why it is necessary to improve the interest in the area of energy demand for these vehicles. As a result, it will contribute to the strengthening of the position of alternative powertrains in the market and significant competition for conventional vehicles fitted with combustion engines.
For years, the most popular vehicles have been those fitted with combustion engines alone. The main reason for their popularity is the range of the vehicles. This type of powertrain is designed particularly for long-distance rural/motorway trips, for which the charging infrastructure is still insufficient. However, in terms of ecology, fuel consumption (directly related to the emission of carbon dioxide) and excess exhaust emissions necessitate searching for new solutions—solutions that will enable the realization of the increasingly ambitious objectives of legislators. One of them is the idea of a fully electric vehicle—the BEV (Battery Electric Vehicle), in which one or more electric motors are used as a source of power. The energy for the motors is stored in batteries. The vehicles are characterized by quiet, zero emission powertrains, yet, due to the low energy capacity of the batteries and the prolonged charging time, they are used mainly in the cities. An intermediate solution is a hybrid vehicle HEV (Hybrid Electric Vehicle) that uses a combination of a combustion engine with an electric motor. The application of a combustion engine significantly extends the vehicle range, thanks to which the vehicle can also be operated outside the city on long distances both rural and motorway. Another option is plug-in hybrid vehicles PHEV (Plug-in Hybrid Electric Vehicle) utilizing batteries of larger capacity. They can be charged directly from the power grid and can be operated in urban and suburban areas.
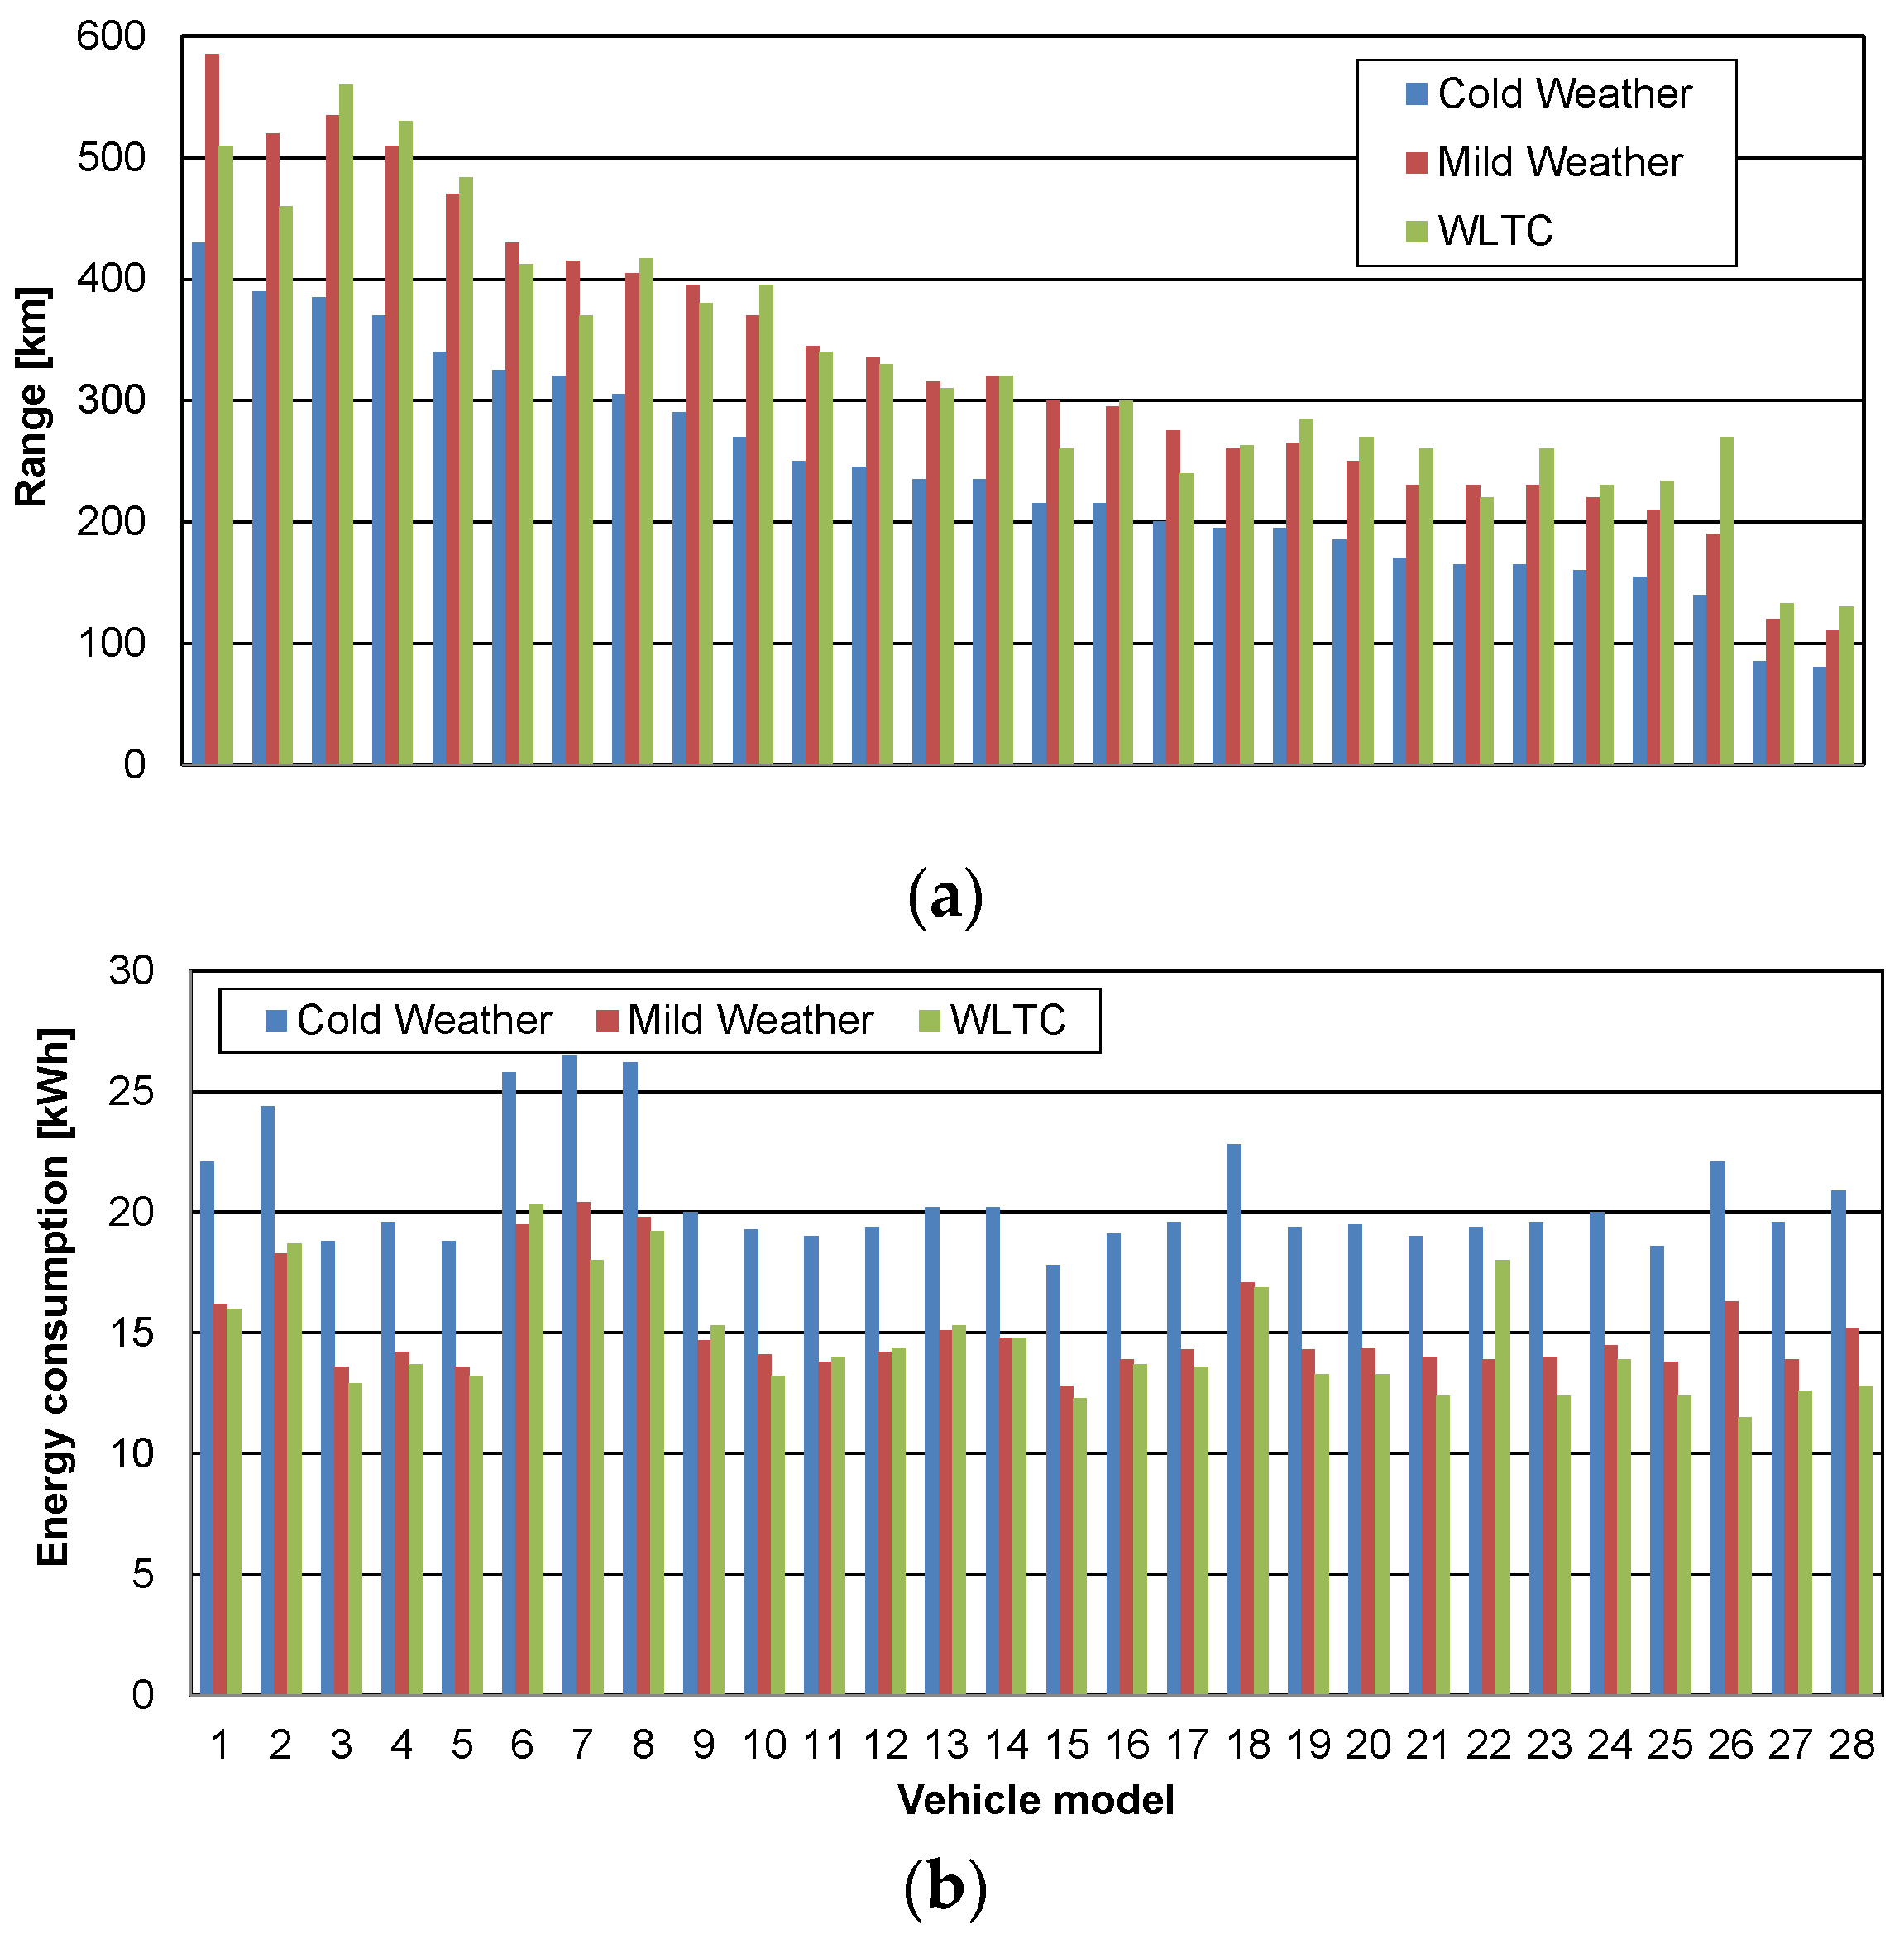
The above descriptions of the powertrains indicate that a perfect solution has yet to be developed. A continuous advancement of EV and PHEV vehicles contributed to the extension of their range, yet, the range of these vehicles, in most cases, is still far from that guaranteed by combustion engines. Figure 2a presents a comparison of the range and energy consumption of example electric vehicles. The obtained data indicate significant differences among electric vehicles depending on the ambient temperature of their operation. For the ambient temperature below 10 °C, the range is lower by approximately 30% compared to the ambient temperature of 20–25 °C. The range of electric vehicles varies widely and depends mostly on the energy capacity of the battery and vehicle weight. Yet, the energy consumption in similar road tests (Figure 2b) oscillates around constant intervals—approximately 20 kWh for the tests performed at approximately 10 °C and 15 kWh for the tests performed at approximately 25 °C and in the WLTC (Worldwide Harmonized Test Cycle) homologation test.
2. Review of the Passenger Vehicle Exhaust Emission Road Tests
Prior to launching a vehicle in the market, it is necessary to carry out type approval tests. In order to achieve this, cycles and procedures have been developed carried out on a chassis dynamometer under controlled conditions. Depending on the type of powertrain, fuel consumption, exhaust emissions, or energy consumption are measured. Currently in Europe, the WLTC (Worldwide Harmonized Test Cycle) procedure applies. As of 1 September 2017, it superseded the NEDC (New European Driving Cycle) light-duty vehicle homologation procedure for type approval tests, and on 1 September 2018, it applied to all new vehicles. Ever since, all new vehicles launched into the European market must be homologated according to the WLTC test procedure [4,5].
Further changes have introduced a new procedure of testing vehicles under actual traffic conditions. In the RDE (Real Driving Emissions) test, the exhaust emissions are measured by the PEMS (Portable Emissions Measuring Systems) equipment, fitted in the vehicle and used in real traffic [6]. This aims at supplementing the laboratory tests and reducing the discrepancy between the laboratory and real driving results.
The beginnings of research work on estimating vehicle emissions under real traffic conditions date back to the mid-20th century. It should be mentioned from a very large group of projects, among others the European MEET (Methodologies for Estimating air pollutant Emissions from Transport) project [7], which estimates emissions and energy consumption in transport for all types of road vehicles, as well as rail, sea, and air transport. The results obtained in the Artemis project (Assessment and reliability of transport emission models and inventory systems) were also widely used [8], which combines the experience of various other international exhaust emission calculation models. The results obtained in Copert [9] and HBEFA (Handbook Emission Factors for Road Transport) software were the components [10]. In the first one, trip average speed in a continuous model for Copert was used and in the second one, discrete traffic situations in HBEFA based on instantaneous modeling were used.
In recent years, RDE tests, fuel consumption (energy consumption) tests, and exhaust emission tests have been playing an important part. It is generally accepted that only this testing methodology allows obtaining correct exhaust emissions results practically under any operating parameters of vehicles and their engines. The number of research works related to the fuel consumption, testing procedures, or even comparison of driving cycles for combustion engines is constantly growing [11,12]. The authors of [13] have compared 13 light duty Euro 6b vehicles (eight diesel and five gasoline), both in the laboratory conditions on a chassis dynamometer and under actual traffic conditions using the PEMS equipment. The authors of [14] have attempted to determine the sources of the discrepancies on the results of the fuel consumption tests performed in the laboratory and in the road test. They monitored the fuel consumption of a single vehicle for the period of one year using 20 different drivers. The researchers focused on the study of exhaust emissions, including particulate matter [15], from passenger cars powered by combustion engines. They pointed out the need to take into account the emissions from cold start [16]. The authors of [17] have presented a review of the European passenger vehicle-related legislation. It focused on the relations between the actual exhaust emissions and local air quality. These investigations are appropriate mainly for conventional vehicles; however, this indicates a need to develop alternative solutions, particularly in Europe. This is important if Europe wants to keep its competitive advantage in the world market.
Unfortunately, the number of such comparisons for Hybrid Electric Vehicles (HEV), Plug-in Hybrid Vehicles (PHEV), and Electric Vehicles (EV) is still insufficient. In article [18], the authors have determined the fuel consumption and exhaust emissions from conventional light-duty vehicles and hybrid vehicles fitted with an electric motor in different driving cycles. The authors of [19] have investigated two hybrid vehicles (fitted with a combustion engine) under laboratory conditions in different driving cycles and different temperatures (summer, winter). They have observed that the emission values of carbon dioxide are higher compared to vehicles fitted with a combustion engine only. Some individual driving modes selected by the driver and the requiring driving regimes, particularly at lower ambient temperatures, may lead to excess exhaust emission limits within the type approval procedure. The authors of [20] have performed an analysis of energy consumption by electric vehicles in selected driving modes (NEDC, WLTC, and RDE) in relation to their Gross Vehicle Weight. It has been observed that, despite similar energy consumption values obtained in the NEDC and RDE test, there exist huge differences in the energy flow of the tested vehicles. It has been observed that the energy consumption by electric vehicles heavily depends on the type of tests. In the WLTC test, the values were 13–15 kWh/100 km, while in the RDE test, they were 12–16 kWh/100 km. Another observation was that increasing the weight of the vehicle results in increased energy consumption (increasing the vehicle weight by 100 kg results in an increase in the energy consumption by 0.34 kWh/100 km).
The problem of energy demand of vehicles is extremely important due to the relatively low capacity of the batteries, hence low vehicle range. Modi et al., in [21], in order to determine the vehicle range, have attempted to estimate the real-time energy consumption using the neural network. A solution was developed based on deep neural networks to assess the energy consumption by electric vehicles allowing for three external parameters: the road elevation, power, and velocity of the vehicle. Contrary to previous methods that require either hardly available manufacturer data or real-time data based on dedicated sensors mounted on the vehicles, the proposed approach needs only three easily obtained parameters, which makes the energy consumption assessment in electric vehicles much easier. Burski et al. in [22] have presented on-road test results evaluating the vehicle energy consumption in selected EU member states: Poland, Germany, and France. The obtained data indicate that on the motorways in different countries, the kinetic energy loss varies due to the difference in the transport infrastructure. This directly impacts the range of the electric vehicle. The problem of route planning for an electric fleet was discussed by Basso et al. in [23]. They have presented a method of accurate determination of energy consumption and route planning so as to allow for the loading/unloading time. The paper describes a two-stage approach integrating the finding and planning of the routes. The results show that determining of the energy and time as presented by the authors is more accurate than the existing methods. In paper [24], the authors assess the potential energy demand for electric vehicles based on the model comprising the energy consumption under real traffic conditions. Article [25] includes investigations on how the energy efficiency of an electric vehicle under actual traffic conditions depends on the driving style and the infrastructure. The analysis presented in this paper cannot distinguish the impact of the physical environment (repeated congestion, road curvature) from the driving style of a driver. Even though the investigations did not directly focus on the driver behavior analysis in terms of eco-driving, the authors conclude that eco-driving may have a great impact on the energy consumption in electric vehicles. Noura et al. [26] have compared the energy consumption of a diesel-fueled vehicle with an electric one. From these investigations, it results that the efficiency of the electric vehicle is three times higher compared to the conventional one.
3. Aim of the Paper
The aim of this paper is an assessment of the energy consumption and exhaust emissions by passenger vehicles fitted with different powertrains (conventional, hybrid, and electric) under actual operating conditions. For the tests, the authors used passenger vehicles fitted with conventional engines of different emission standards (Euro 6) as well as modern hybrid vehicles (HEV, PHEV) and an electric one. The tests were performed at Poznan University of Technology. The methodology was compliant with the requirements of the European Commission related to exhaust emissions measurement under actual conditions of operation. This allowed a comparative evaluation of energy consumption under varied traffic conditions particularly the urban cycle and the entire RDE test. The results of the investigations may contribute to the classification of vehicles and determination of their advantages (or disadvantages), the latest achievements in technologies of conventional, hybrid, and electric vehicles. This allowed a comparative evaluation of energy consumption under varied traffic conditions, particularly the individual phases of the RDE test.
4. Research Methodology
4.1. Research Objects
Due to the very wide spectrum of vehicles used in Poland, for the purpose of the tests, the authors decided to select new vehicles sold in the highest number in 2020. These were mainly vehicles fitted with gasoline engines (45%) and plug-in hybrids (25%). They made a total of 70% of all vehicles sold in Poland. Diesel-fueled vehicles constituted approximately 30% of the sales with the growing number of electric vehicles, although the percentage does not exceed 1%. For the tests, the authors selected passenger vehicles of the displacement of 1.4–1.5 dm3 of the Euro 6d-Temp emission standard (Table 1).
The selected gasoline-fueled vehicle was a vehicle utilizing state-of-the art solutions to improve its environmental performance. The hybrid vehicle fitted with a battery ensuring the vehicle range of approximately 40–50 km in the electric mode was also equipped with a combustion engine of the parameters similar to those of the said gasoline-fueled vehicle. The electric vehicle was capable of covering a distance of approximately 200 km (according to the technical specifications). All vehicles had similar curb weight and serial equipment. It is noteworthy that the fuel consumption tests, exhaust emissions, and energy consumption were performed under similar operating conditions and similar settings of the vehicle comfort equipment such as audio and climate control).
4.2. Test Routes
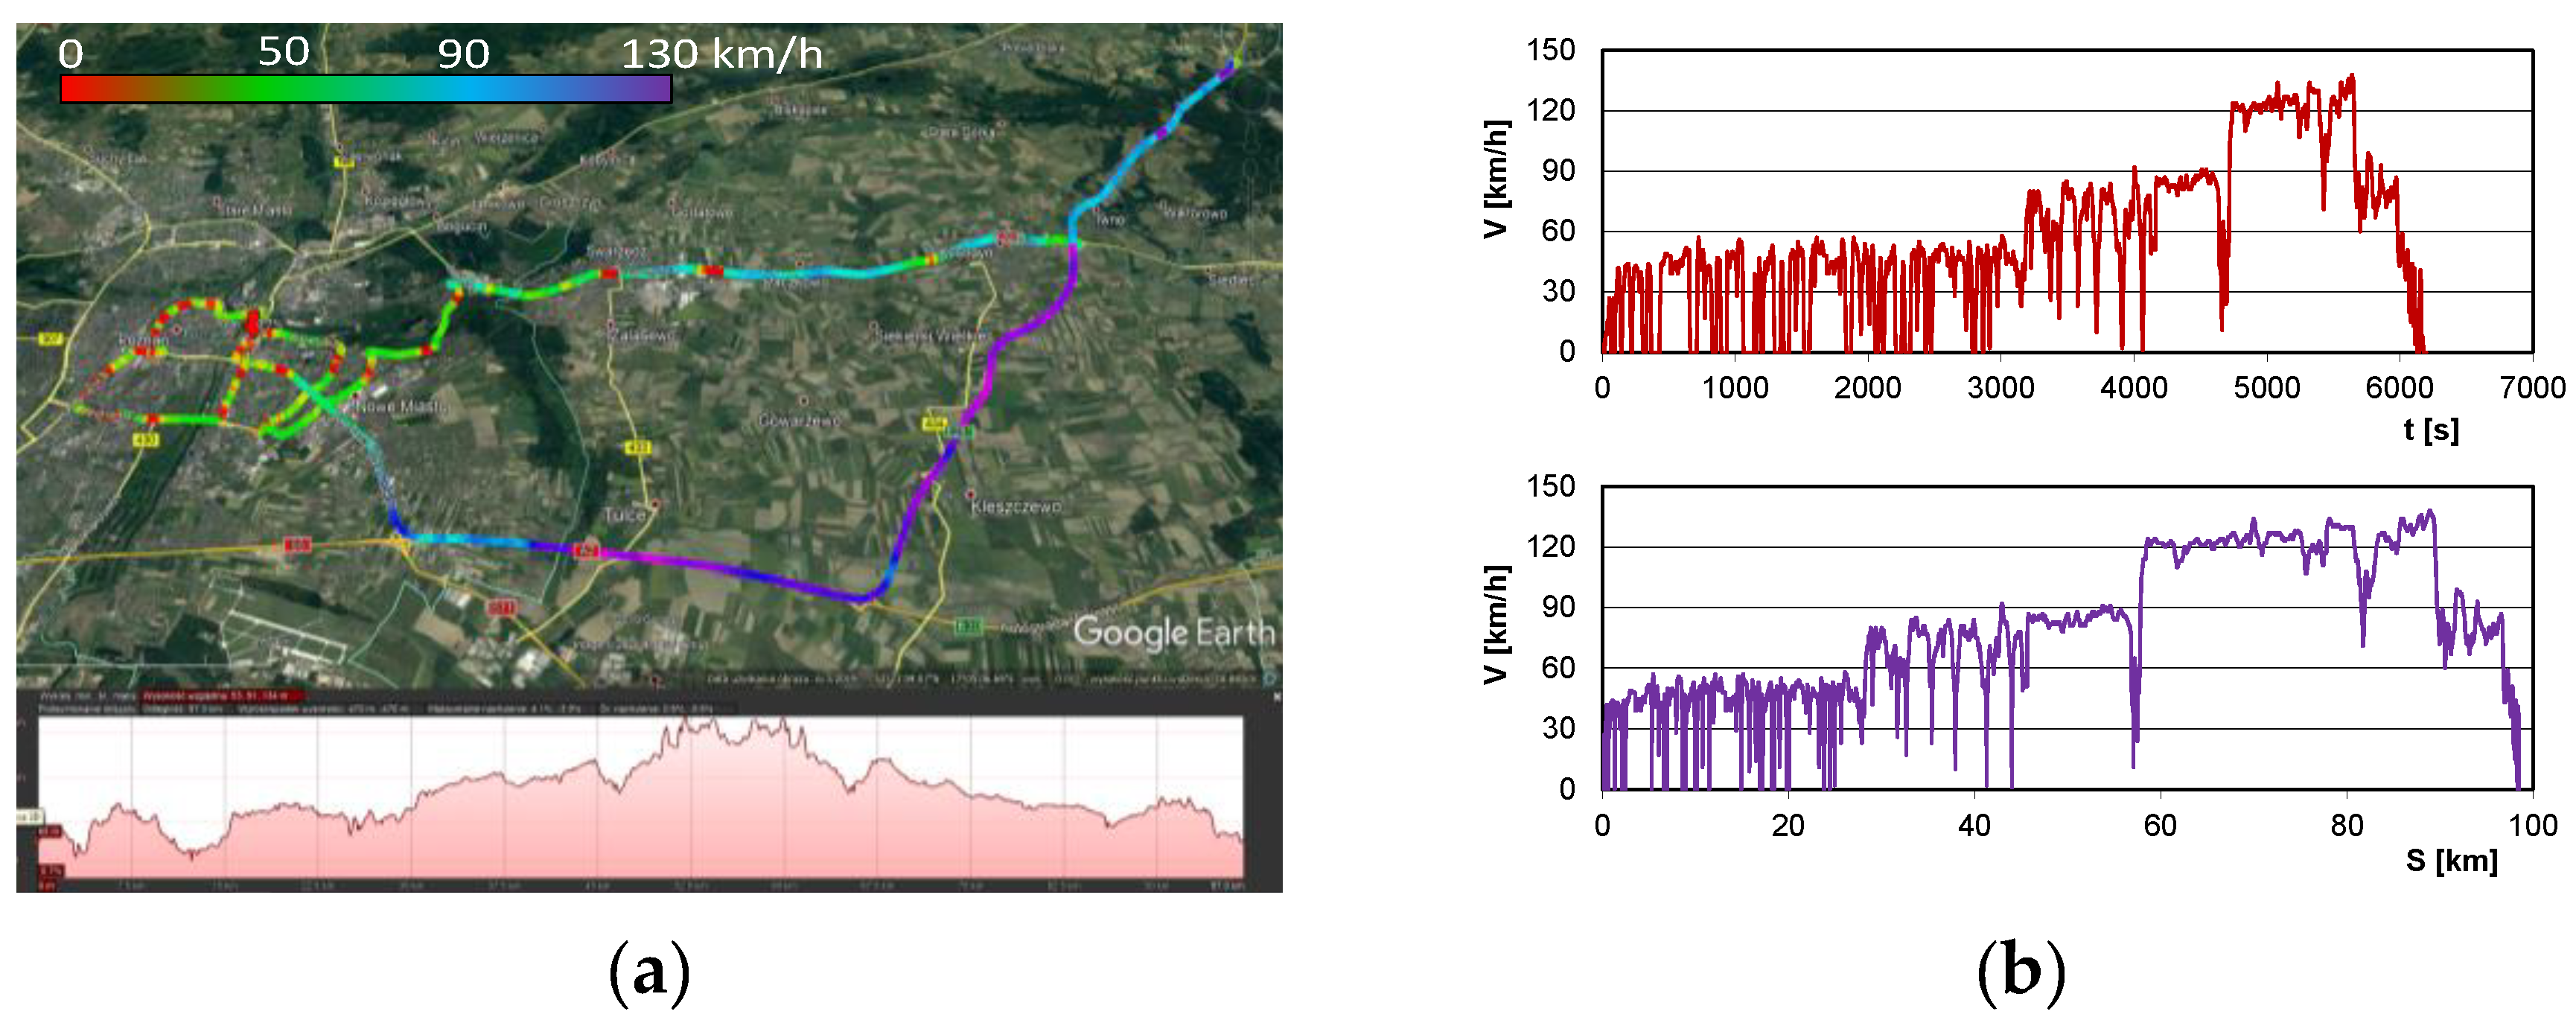
The exhaust emissions, fuel consumption, and energy consumption tests were carried out on the same test route selected according to the RDE requirements. The test route started in the urban area (urban phase was approximately 3000 s, which corresponded to the distance of approximately 30 km), in which the vehicle speed did not exceed 60 km/h (Figure 3). The next step was the rural phase (up to 4500 s, which also translated into the distance of 30 km), with the vehicle speed in the range of 60–90 km/h interrupted with short stops (traffic lights). The third stage was the motorway phase with the vehicle speed in excess of 90 km/h, whose length was approximately 30 km. Figure 3 shows the visualization of the test route with the speeds (urban—green, rural—blue, and motorway—purple) and the relative elevation profile indicated. Velocity profiles have also been presented in the figure depending on time and covered distance. Such data allow a temporal analysis of the individual road portions and an estimated share in terms of the distance of the individual stages of the RDE test.
A detailed analysis of the road parameters for the tested vehicles has been shown in Table 2, in which the following have been specified: distance of the urban, rural, and motorway phase and the total covered distance. The values listed in the table refer to Eco, Comfort, Sport driving mode—for vehicle A, state of charge SOC = 0%, 60% and 100%--for a hybrid vehicle, and Eco and Normal driving modes for an electric vehicle. The driving modes of vehicle A differed in response time to accelerator pedal pressure and the speed at which gear changes were made. The driving modes in vehicle C were mainly concerned with the energy recovery from the braking. Admissible limits of variability of these parameters have also been indicated. The values of the test parameters were close to one another for each tested vehicle, which is confirmed by the obtained coefficient of variation CoV from 1.6% to 4% (for the distances of the individual test phases). The repeatability of the share of the individual parts of the tests in the entire test was also characterized by the low spread of the CoV that amounted from 1.9% to 3.3% for this parameter. The greatest spread in the performed tests was the stop time in the urban part of the tests (8.4%) and was caused by the actual traffic conditions. This lack of repeatability of the traffic conditions is characteristic of road tests, indicating the impossibility of obtaining identical conditions during RDE tests. Therefore, all the tests were repeated four times, and the presented results are averaged values for a given test drive.
4.3. Testing Equipment
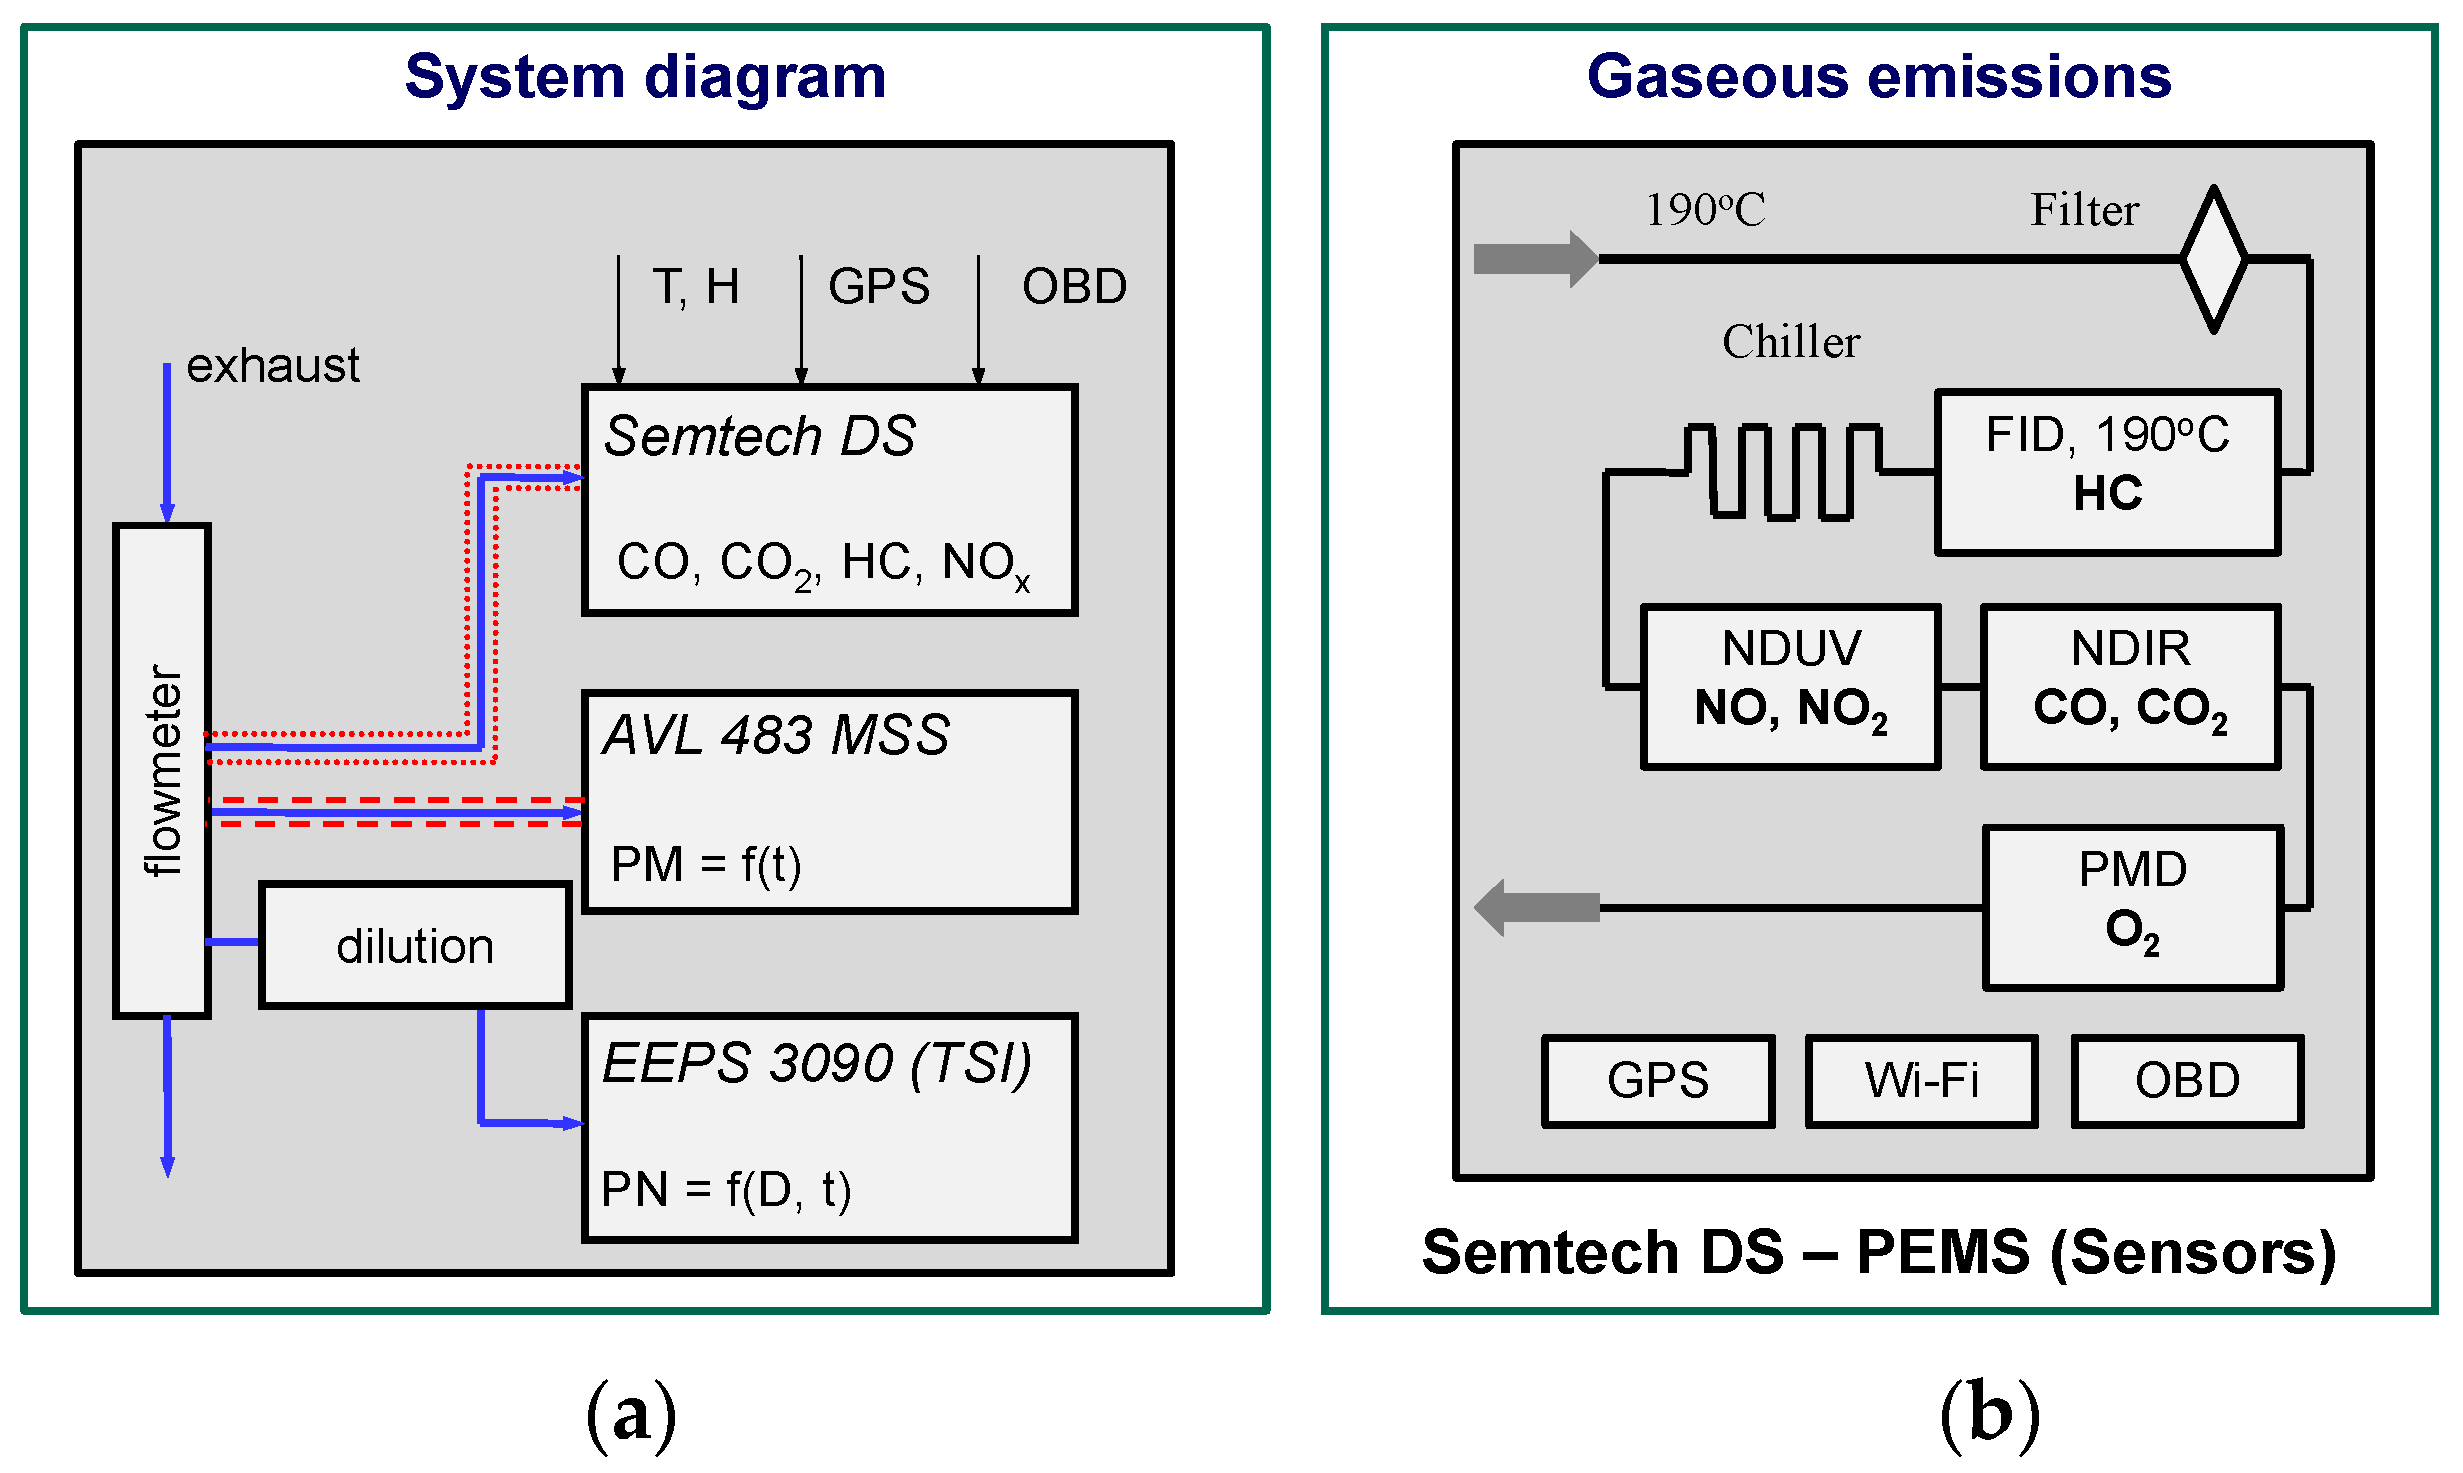
The exhaust emission measurements were carried out using the PEMS portable exhaust emissions analyzer designed for use in road tests. The exhaust sample was taken through a measurement probe fitted in the exhaust flow meter. For the assessment of the gaseous exhaust components, a heated line was applied. For the measurement of the particle number, an exhaust dilution system was applied (Figure 4a). Additionally, the equipment measured the particle number, yet, due to very low values and their relatively high spread, they were not included in this paper. The exhaust emissions were measured using the Semtech DS device allowing the measurement of CO2, CO, HC, and NOx (Figure 4b). Detailed technical parameters and measurement accuracies have been shown in Table 3. The measurement of the PM number was performed utilizing a mass spectrometer that determined the particle number and analyzed the diameter in the range from 19 nm (compliant with the EU regulations).
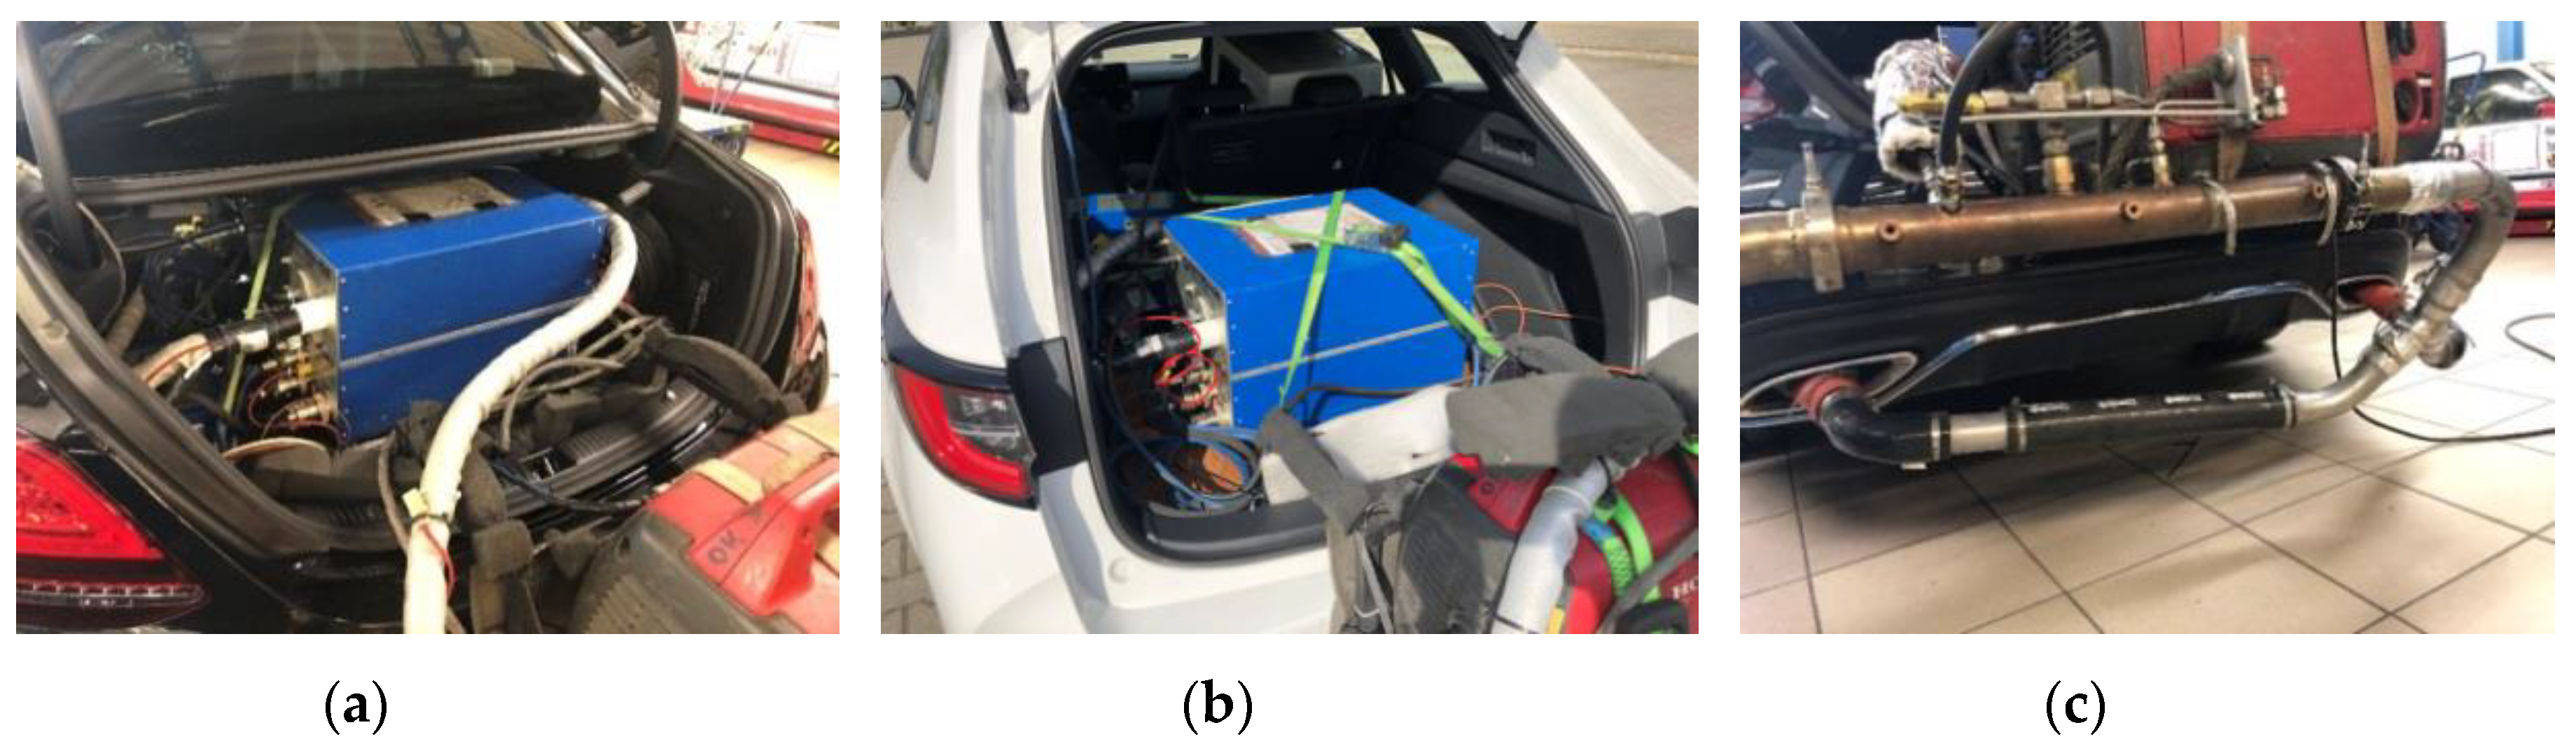
The measurement equipment (25 kg) and the fitting of the exhaust flow meter have been shown in Figure 5, in which the power generator is also visible (2 kW, 21 kg). The generator provided power to all the measurement devices. The data acquisition system recorded the engine diagnostic parameters, including the energy-related ones (hybrid and electric vehicles). The parameters were recorded with the resolution of 1 Hz, which allowed statistical processing of the results. This also allowed an evaluation of the dynamic driving conditions and exhaust emissions using the MAW (Moving Average Window) procedure required for proper exhaust emissions measurement in RDE tests.
5. Results
5.1. Formal Requirements for Road Tests
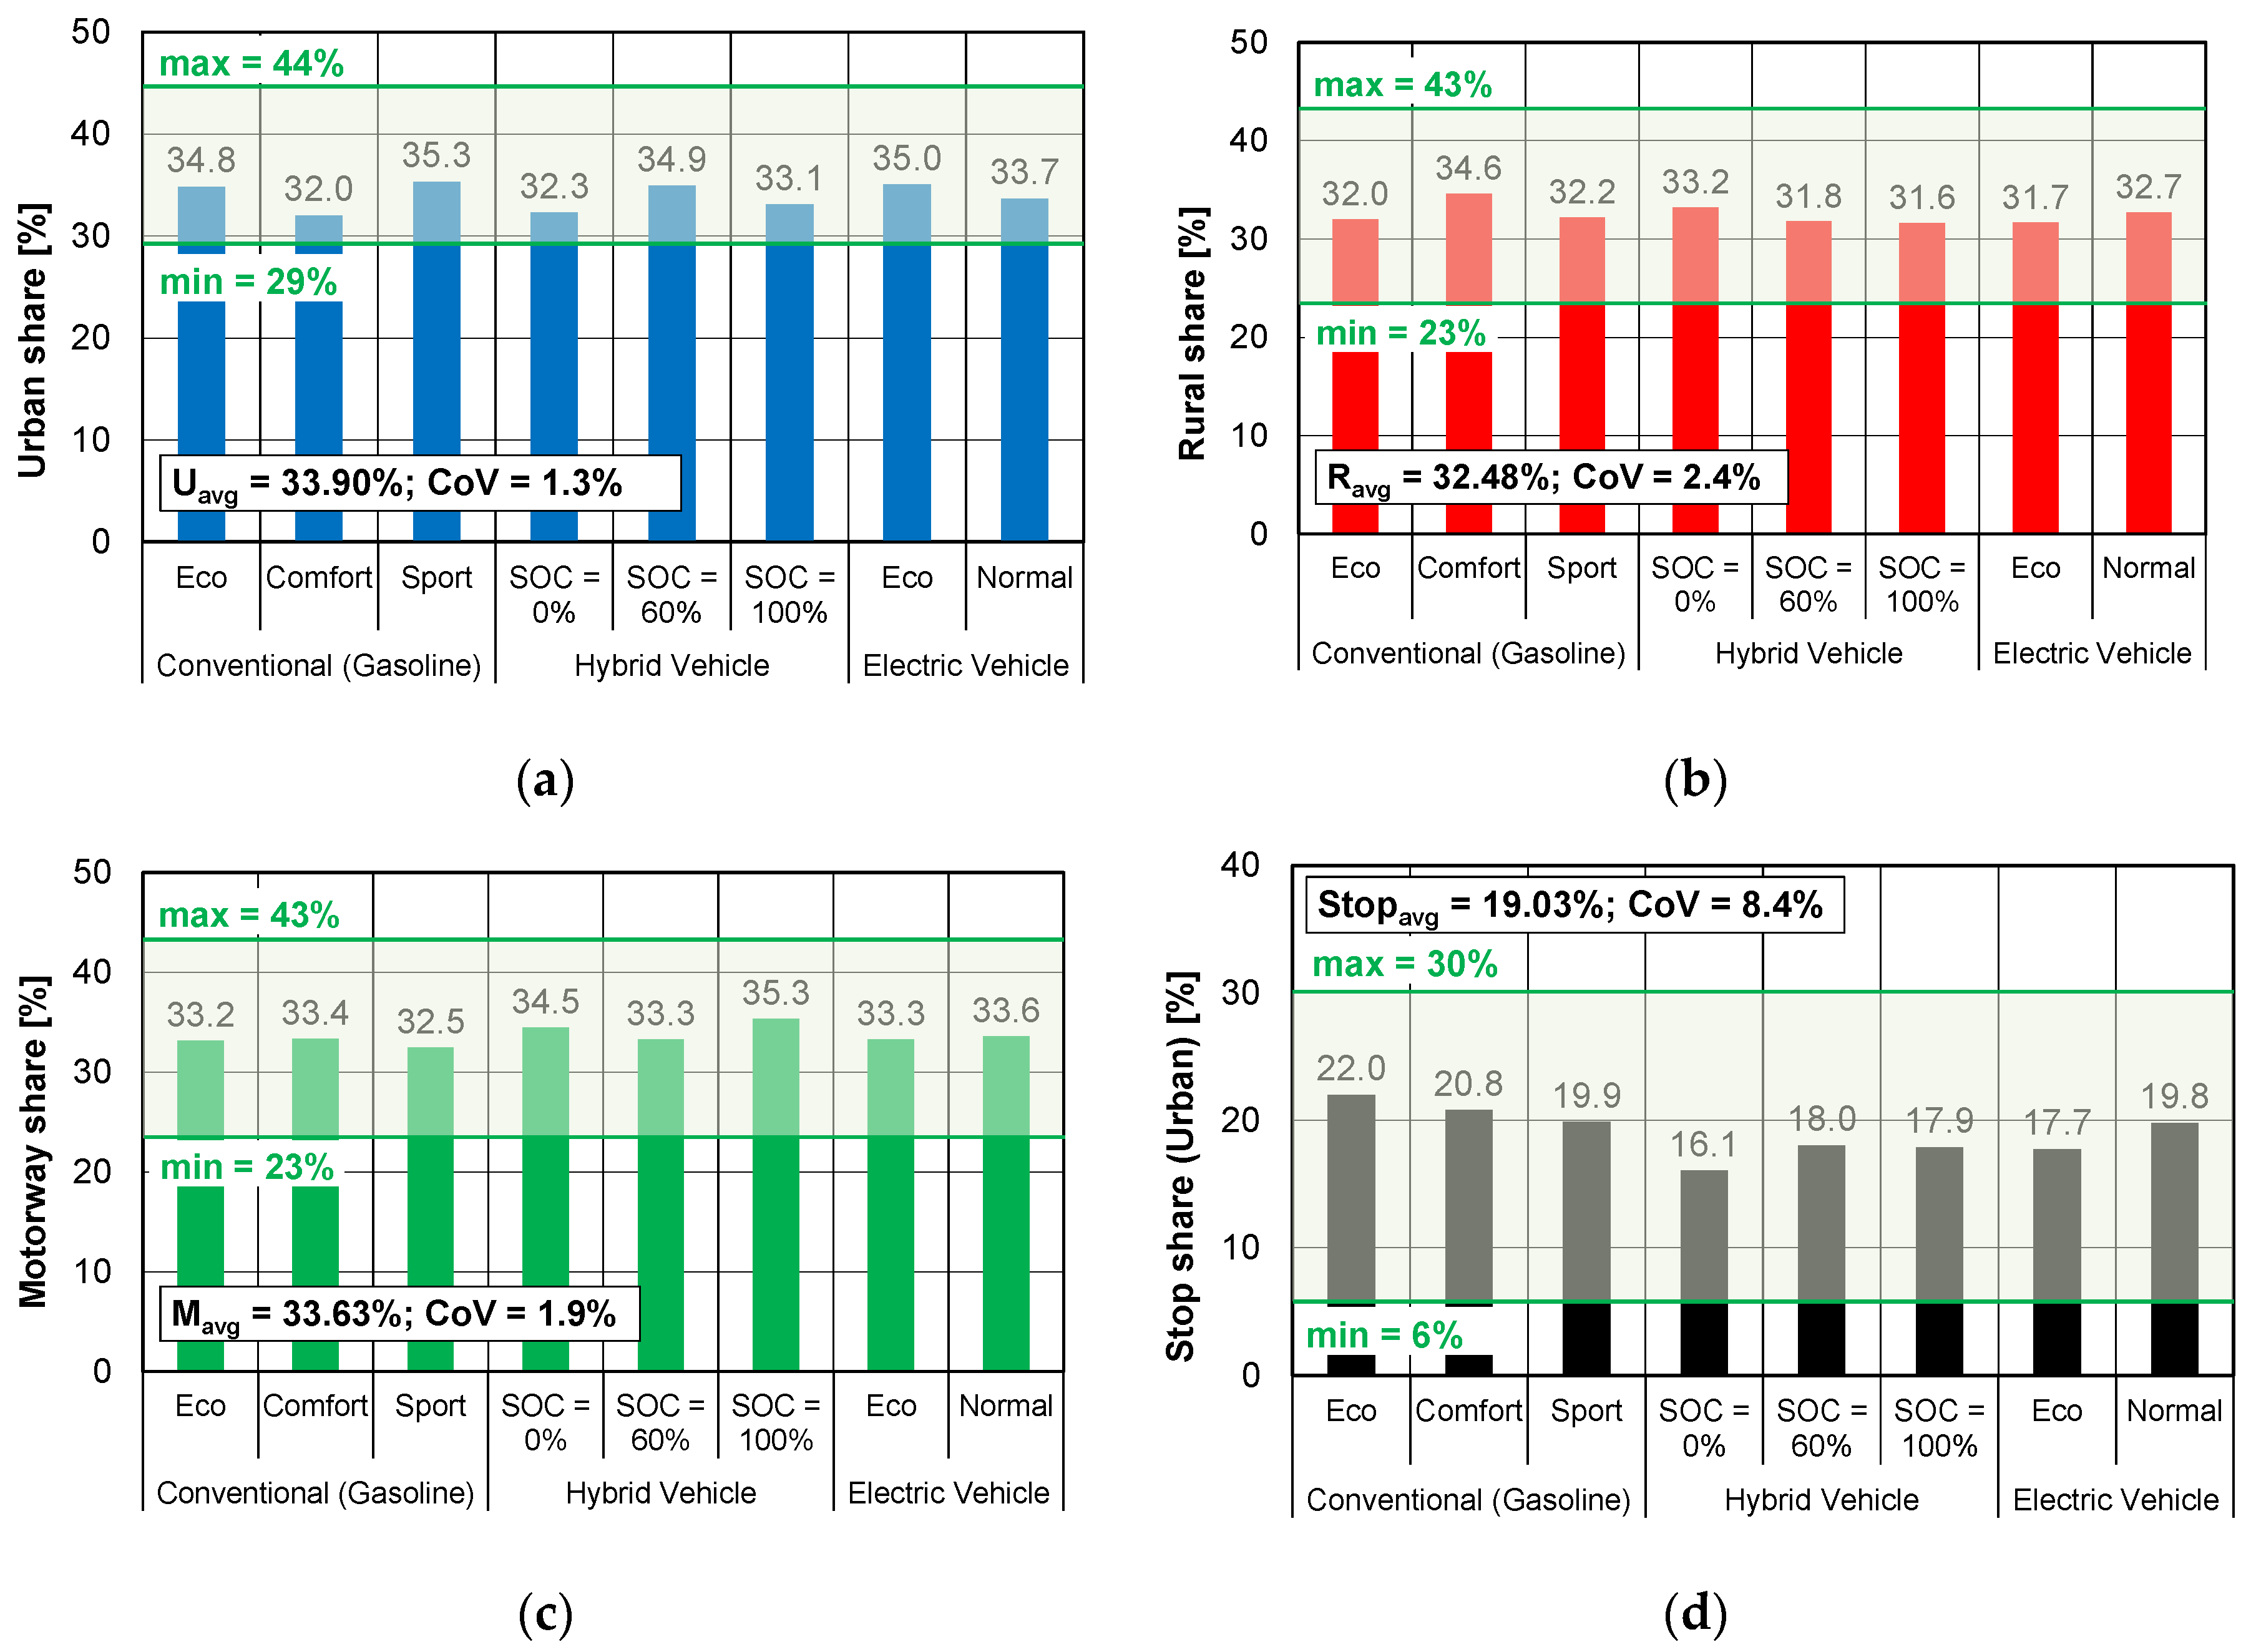
The analysis of the formal requirements for RDE compliant road tests has been presented below, where the validation of the previously defined compliance of individual driving parameters was performed. A high level of convergence was confirmed for the driving parameters (selected ones) by giving the admissible range of variability (if required) and the value of the obtained parameter. The percentage share of the driving time in the urban phase during the test was the lowest for the hybrid vehicle (32.4%) and the highest for the gasoline one (34%). For the electric vehicle, the average share of the urban phase during the test was 33.4%. All test drives complied with the urban road portion share requirements and the average value for all the test drives was 33.9% at CoV = 1.3%.
The percentage share of the rural phase in all the investigated cases fell in the admissible range of 29–44% (Figure 6a). The percentage time share of the rural phase in the RDE tests was the highest in the case of the vehicle fitted with the combustion engine (33.9%) and the lowest for the hybrid and electric ones (average value: 32.2%). In this respect, all the test drives were valid: they fell in the range of 23–43% (Figure 6b). The average value of the share of the urban phase for all the investigated cases was 32.48%, which, at the CoV of 2.4%, confirms the repeatability of this parameter.
The analysis of the obtained results pertaining to the time share of the motorway phase showed that the highest average value of this parameter was obtained for the hybrid vehicle (34.4%) and the lowest was obtained for the gasoline one: 33.0%. The test drive using the electric vehicle in the RDE test gave a share of the motorway phase of 33.5%. All the values of the shares of the motorway phase in the RDE test for the investigated vehicles fell in the admissible range of 23–43% (Figure 6c). The average value of this parameter was 33.63% with the CoV = 1.9%.
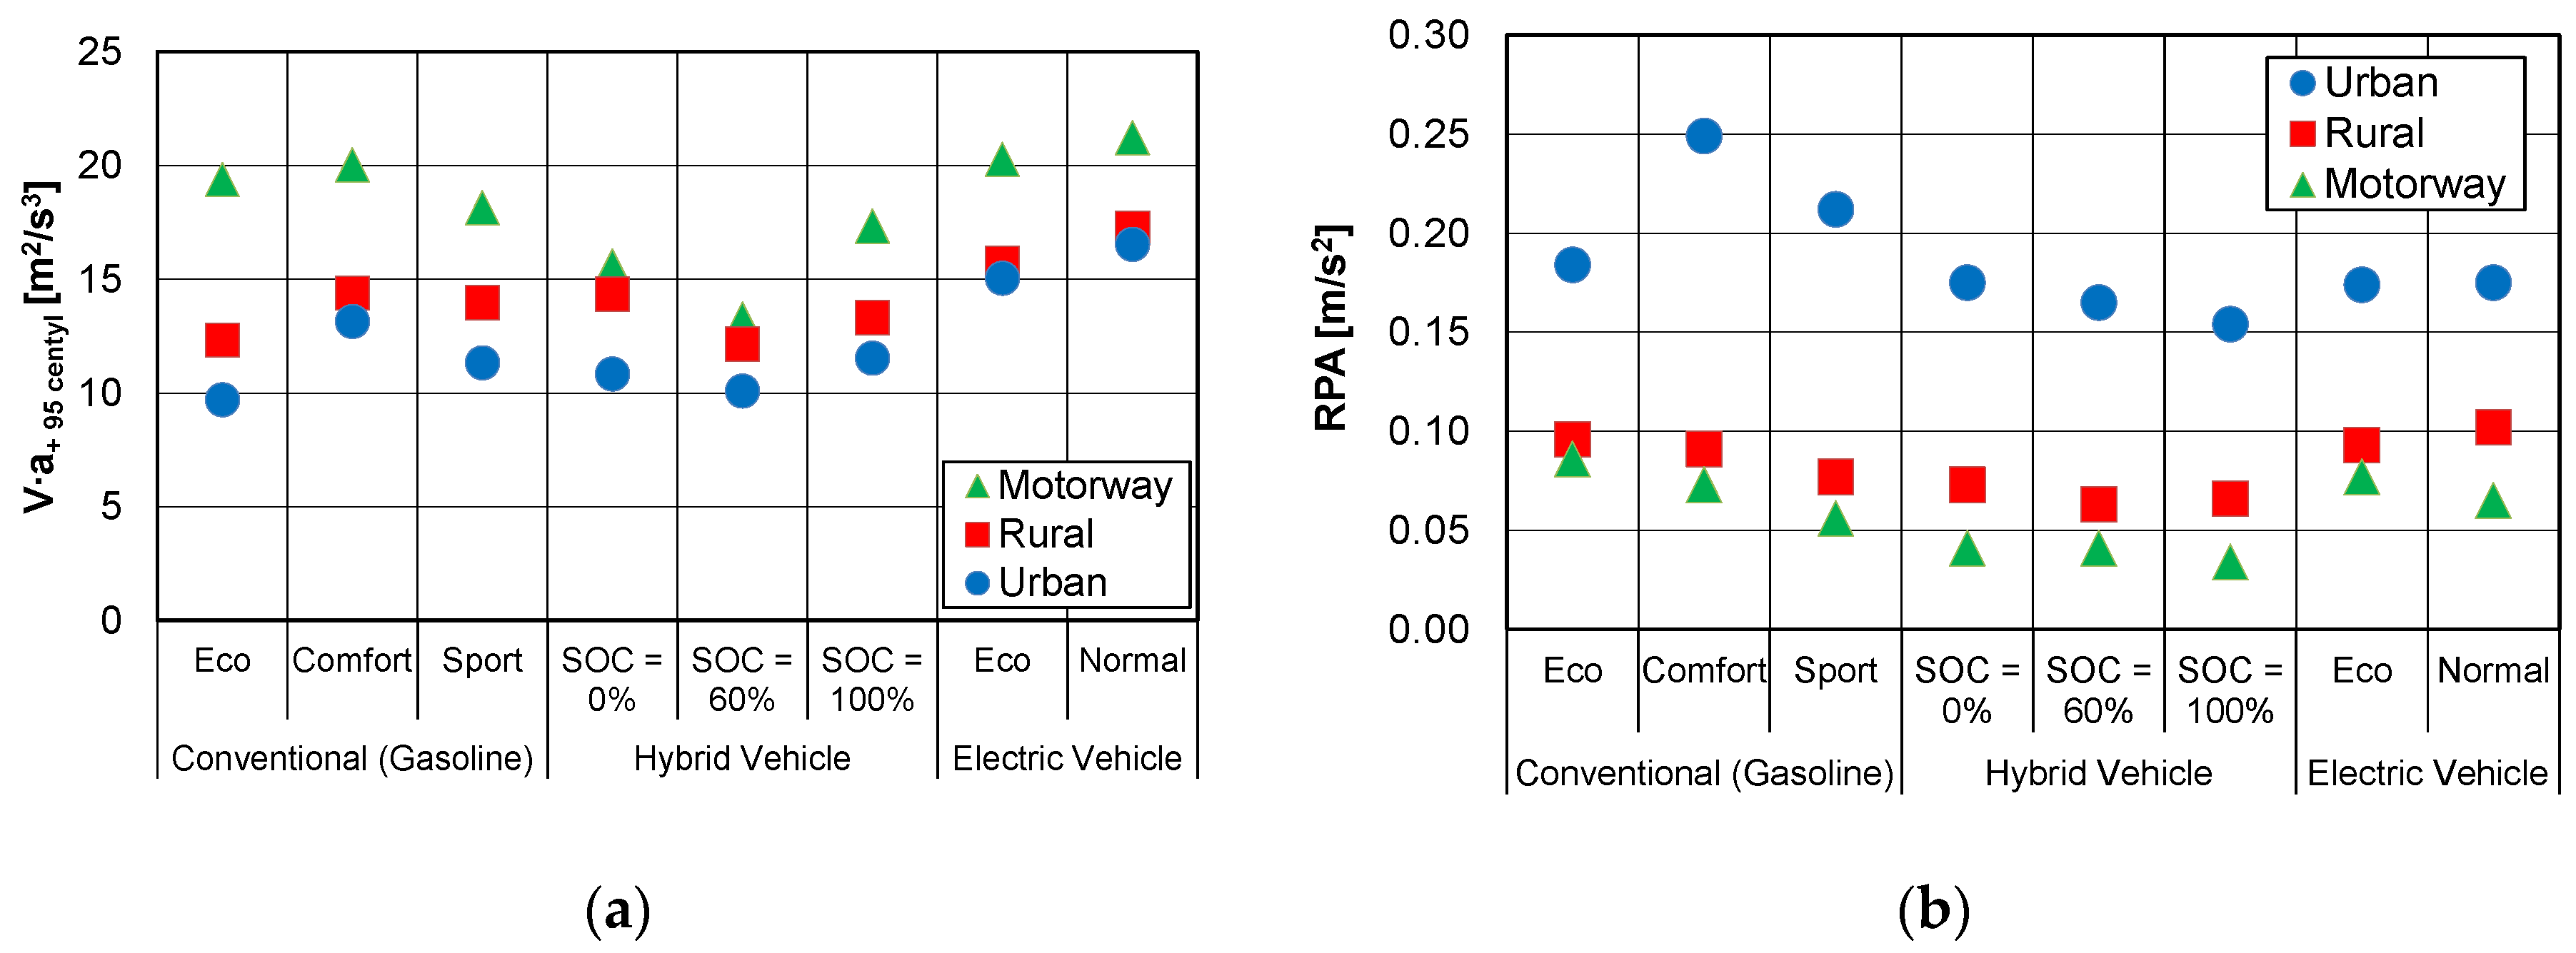
The obtained results of the distance share in each road phase (urban, rural, motorway) complied with the RDE requirements. This means that each share in the individual parts of the test deviated from the average value by several percent (from 1.3% to 2.4%), which confirms the similar value of this parameter and behooves the authors to state that the test drives were repeatable in the discussed aspect (Figure 6d).When analyzing the dynamic conditions of the test drives, one should note two parameters: the centile of the 95% product of velocity and positive acceleration (V·a+95centile) and the relative positive acceleration (RPA). These parameters have been presented in Figure 7. In the first case, the dynamic parameter pertains to the limitation (upper limit), so as to prevent the driving dynamics in individual parts of the test from going too high. In the second case (RPA), the limit (lower limit) forces the minimum dynamic conditions of the vehicle motion.
When analyzing the 95% product of the velocity and acceleration in the urban phase, one can state that at the upper limit of 17–18.5 m2/s3 (at the average speed of 20–30 km/h) for the urban phase, this value was not exceeded in any test (Figure 7a). The highest values (15–16 m2/s3) were obtained for the electric vehicle (owing to the highest torque at low speeds) and the lowest values were obtained for the hybrid vehicle (this interval was 10–12 m2/s3). For the rural phase, the limit for this parameter was 25 m2/s3 for the average speed of 75 km/h. In addition, in this case, the value of this parameter was not exceeded, as the highest values were also obtained for the electric vehicle (20–21 m2/s3) and the lowest, similarly to the previous case, were obtained for the hybrid one (14–17 m2/s3). Similar results were obtained for the dynamic parameters in the motorway phase of the RDE test. The upper limit for this part was 28–28.6 m2/s3 at the average speed of 120–130 km/h. The values obtained for the motorway phase of the tests were 18–20 m2/s3 for the conventional vehicle, 20–21 m2/s3 for the electric vehicle, and 18–22 m2/s3 for the plug-in hybrid. From this analysis, it results that the most dynamic vehicle is the electric one (owing to its torque characteristics) and the gasoline-fueled one. The hybrid vehicle was characterized by a significant inertia, yet the trend of evaluation is observed, as seen through the 95% product of velocity and acceleration, to higher driving dynamics in the urban phase, when the electric motor was used more frequently (for the SOC = 100% parameter V·a+95centile was greater by approximately 20% compared to the SOC = 0% or SOC = 60%).
The analysis of the next parameter of the dynamic conditions—relative positive acceleration—indicates that in the city traffic, the minimum of this parameter is 0.14–0.13 m/s2 for the average speed of 20–30 km/h (the values of the limit have been given in the order corresponding to the increasing average speed (as per the RDE regulations). When looking at the data in Figure 7b, one may observe that the lower limit is not exceeded, as all the RPA values of the urban phase are greater than 0.15 m/s2. The highest RPA values are for the vehicle fitted with the gasoline engine (RPA = 0.17–0.25 ms2), while for the hybrid and electric vehicles, these values are from 0.15 m/s2 to 0.18 m/s2. In the rural phase of the RDE test, the minimum RPA values are on the level of 0.05 m/s2 for the average speed of approximately 75 km/h. From the analysis of Figure 7b, it results that the requirement of the minimum value is met, i.e., all the determined RPA values are higher. For the vehicle fitted with the gasoline engine, they are from 0.07 m/s2 to 0.1 m/s2, for the hybrid vehicle the RPA values are from 0.06–0.08 m/s2, and for the electric vehicle, RPA = 0.09–0.1 m/s2. Unfortunately, the more “aggressive” vehicle A in “sport mode “did not translate into a significant increase in RPA compared to “comfort mode” in the urban part of the RDE test. This may have been a result of the current traffic volume in the various parts of the RDE test, but at the same time, it confirms the unpredictability of the road.
5.2. Exhaust Emissions Measurement Results
5.2.1. Analysis of the Obtained Results
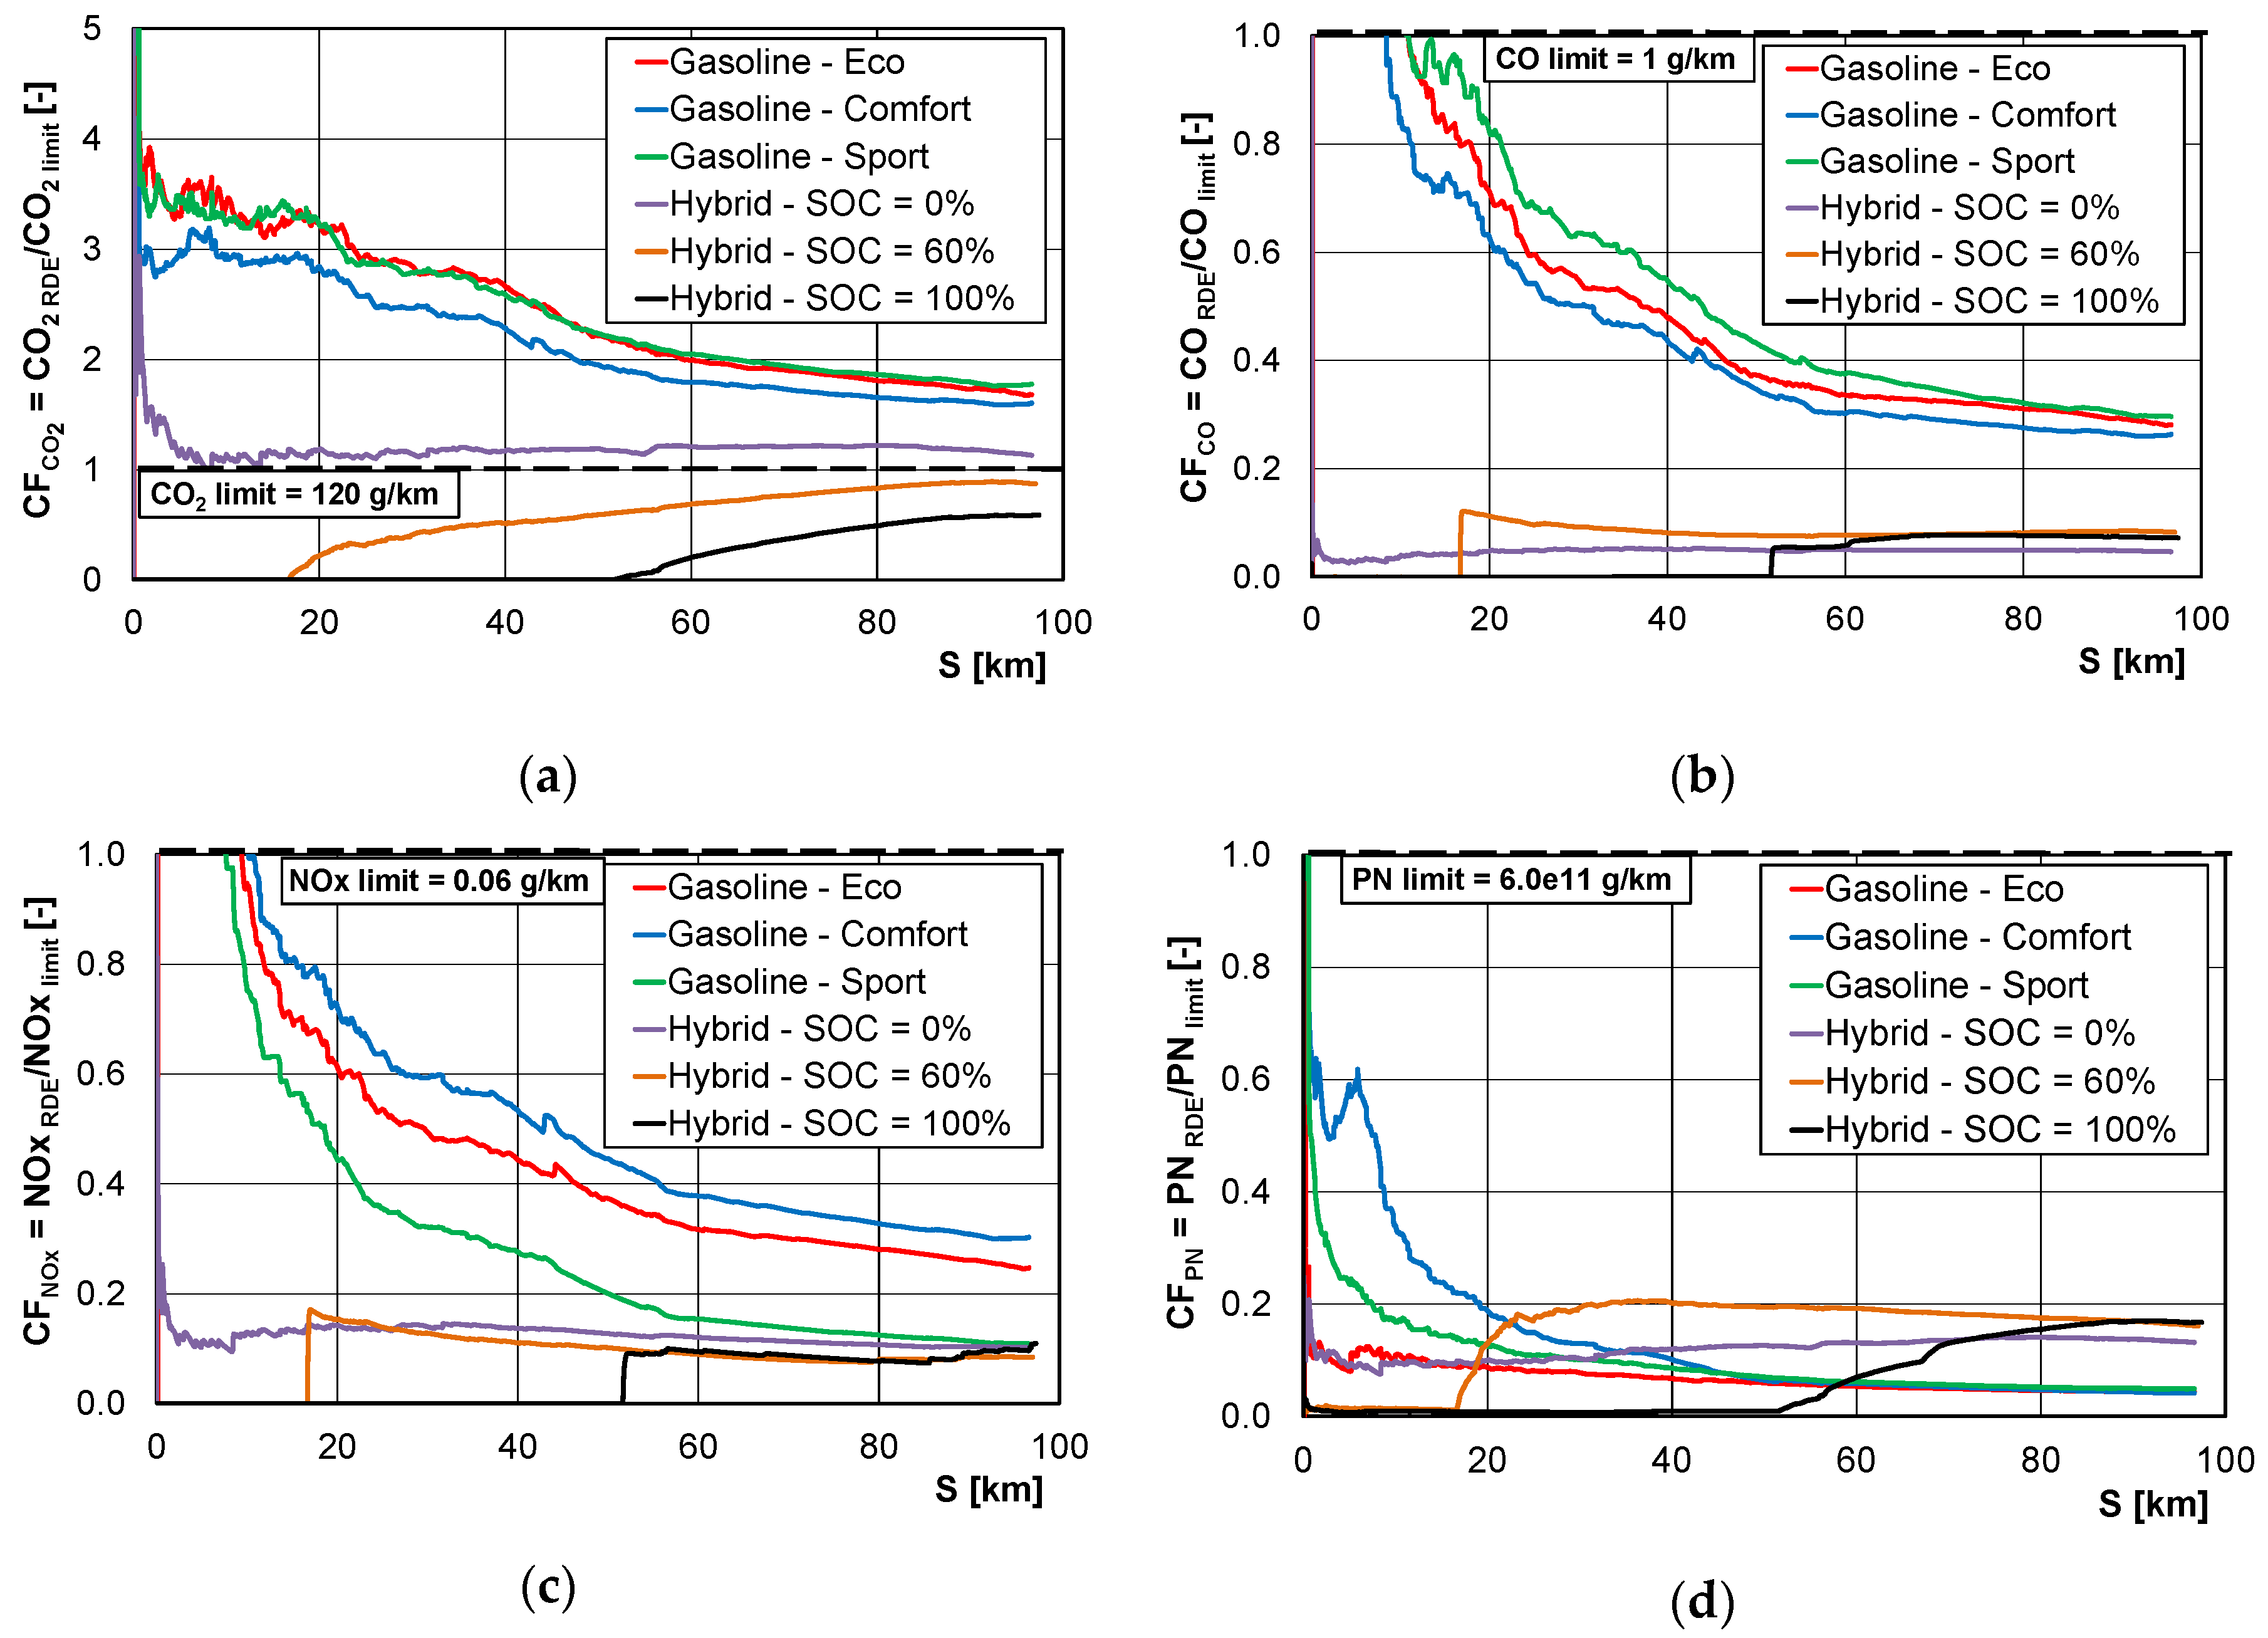
The values of the exhaust emissions were analyzed in terms of the conformity factors (CF), allowing for the vehicle emission category. The CF are determined for the entire test as a quotient of the road emission in the RDE tests and the exhaust emission limit set forth in the vehicle emission category:
where b—road emission of a given exhaust component [g/km] x—exhaust component (CO, NOx, PN).
According to the regulations regarding RDE tests, the maximum value of the CF for PN is 1.5, for NOx, it is 1.43, and the value of carbon monoxide is given for information purposes only. The authors of this paper determined the value of the CF in increments for each moment of the test, relating it to the distance covered during the test. Given that the recording of the emission rate and the covered distance are performed with the resolution of 1 Hz, we obtain a relation (in this case, the emission rate equals the mass of the exhaust component):
where b—road emission of a given exhaust component [g/km] S—distance [km], m—mass of the exhaust component [g], and x—exhaust component (CO, NOx, PN).
The analysis of the carbon dioxide CF (CFCO2, adopted CO2 limit 120 g/km) shows its varied nature depending on the applied powertrain (Figure 8a). For vehicles fitted with a conventional powertrain, the CF in the initial phase of the test assumes values in the range 3–4, confirming much greater road emission of carbon dioxide than the adopted limit of 120 g/km. A similar situation was observed for the plug-in hybrid (SOC = 0%), and for which the start of the engine took place already in the initial phase of the RDE test. Due to the fact that this initial period was characterized by a low average vehicle speed and a significant vehicle stop time (within the admissible limits), the value of the CF is several times higher compared to the subsequent stages of the test, in which the mass of the exhaust component and the covered distance were accumulated. A contrary behavior was observed for the hybrid vehicle of a high initial state of charge (SOC = 60% and SOC = 100%): due to the fact that the engine started for the first time during the drive at high vehicle speeds, there is no characteristic increase in the CF (as in the case of the vehicle fitted with the gasoline engine). In such a case, the value of the CF increases to a constant value, resulting from the entire test route (from the first engine start). The final values of the CF (for S = 96 km) are values resulting from the comparison of the road emission of carbon dioxide in the entire RDE test to the value adopted as the limit (120 g/km). Using such a reference value for road carbon dioxide emissions allowed illustrating the similarity of momentary CFCO2 values to other compounds that are considered in this article. It should be noted that this approach has been used in this article for scientific purposes only, and there is no reference in the regulations to exhaust gas toxicity. However, the results on CO2 emissions can also be referred to fuel consumption, and on this basis, the changes in fuel consumption in the various parts of the RDE test can be analyzed, referring to the driving modes of vehicles.
A similar nature of the changes can also be observed in the emission factor for carbon monoxide and nitrogen oxides (Figure 8b,c). Vehicle A in “sport mode” was characterized by the highest exhaust temperature, so heating the catalytic converter was the shortest and required less time to reach the correct operating temperature. Therefore, the current intensity of nitrogen oxide emissions was lower than in the less aggressive “eco mode” and “comfort mode”, where the heating time of the three-function reactor was longer. In these two cases, the difference is the limit of a given exhaust component, yet, the characteristics of the changes of the CF curve remain on a similar level. One can clearly see the impact of the type of powertrain on the final curves as well as the fact that the obtained final values of the emission factors oscillate around 20–30% limit determined by the emission standard. The tracings confirming a very good reflection of the variability of the discussed exhaust components are also similar. The beginning of the test is characterized by a much higher value of the factor due to a very high flow rate of a given exhaust component and a relatively short distance covered. As the covered distance increases, the efficiency of the aftertreatment systems grows, which results in a reduction of the CF.
The characteristics of the change of the CF for the particle number are qualitatively close to the previously analyzed cases (Figure 8d), yet the quantitative nature is different. When analyzing the CF for carbon dioxide, carbon monoxide, and nitrogen oxides, the final value of this factor for the vehicle fitted with the conventional engine was higher than that of the hybrid vehicle. This difference was always disadvantageous for the vehicle fitted with a conventional powertrain, but when analyzing the CF related to the particle number, a contrary relation was obtained. The final values of the CF for the analyzed exhaust components were higher for the hybrid vehicle compared to the vehicle fitted with a combustion engine, even despite the fact that the combustion engine in a hybrid configuration operated only partly in the entire RDE test.
Another analyzed aspect of the exhaust emissions is the increment rate of the emission against the distance covered in the RDE test. Only the S = 0 case was analyzed, in which the engine was started for the first time, and the end of the test was marked with parameter S = 1. This means that in the case of the hybrid vehicle, in which SOC = 100% and the first start of the engine took place after approximately 50 km, the covered distance was also marked S = 0 (Figure 9).
Therefore, the range of variability of S from 0 to 1 denotes starting the engine for S = 0 and end of the RDE test for S = 1. When analyzing the individual cases of exhaust emissions, only in the case of the road emission of carbon dioxide one can confirm a proportional relation of the component emission to the covered distance, irrespective of the type of investigated vehicle and the state of charge (hybrid vehicle). In the majority of the outstanding cases, the exhaust emissions always increased faster than the share of the covered distance with the active combustion engine. The tracings of the hybrid vehicles with the SOC = 100% draw particular attention by their significant initial emission of a given exhaust component. From these tracings, it results that in the first moments after the start of the engine during high speeds, approximately 40% of the relative emission of carbon monoxide and nitrogen oxides are generated. This results from a sudden increase in the engine speed and load and at the same time the time needed for the aftertreatment system to heat up is reduced; hence, the emission rate after a short time is significantly lower. Such a condition does not mean that the exhaust emissions are high, but that the share of this phase is significant in the entire emission of a given exhaust component.
5.2.2. Exhaust Emissions: Final Results
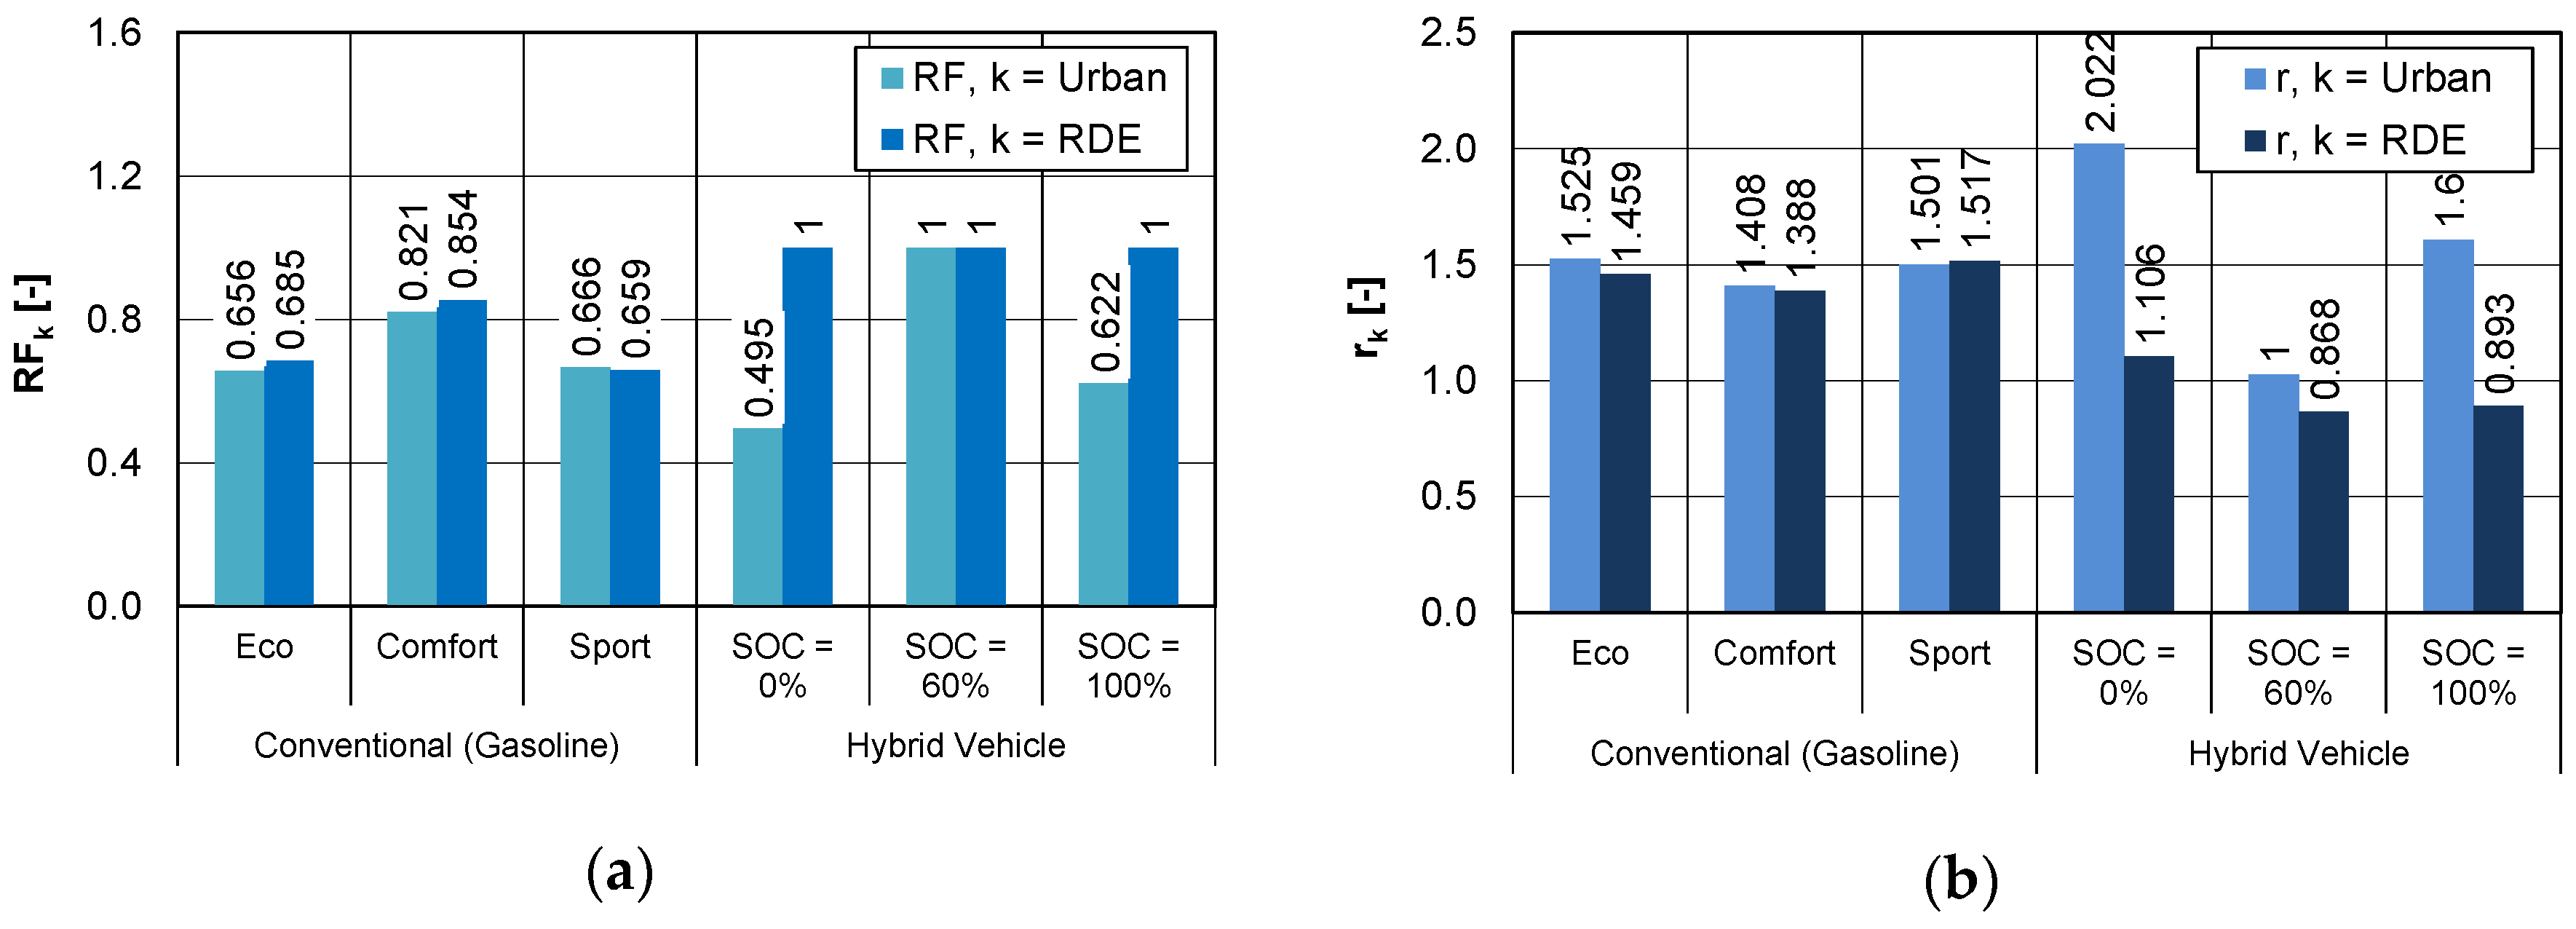
The EU regulation [3] on RDE introduced new principles of determination of the exhaust emissions based on the emission of carbon dioxide. Therefore, the basis for determining the emissions of exhaust components (CO, NOx, PN) in the RDE test was the value of carbon dioxide emissions in all phases of the WLTC test. The value of the RFk emission assessment factor (Equation (6)) depends on the quotient of the obtained carbon dioxide emission in the RDE test and the value of this emission in the WLTC test. Road emission increase factors of carbon dioxide rk applies to the urban part of the test (U) and the whole test (RDE) and is determined differently for conventional (Equation (3)) and hybrid (Equation (4)) vehicles:
- For conventional vehicles:
- For plug-in hybrid vehicles:
The use of the above information means that the obtained values of road emission of each pollutant under real traffic conditions are multiplied by the value of RFk (k = U or RDE), and only such values are taken into account as final results of exhaust emissions.
The analysis of the obtained results of the emission of carbon dioxide for conventional and hybrid vehicles clearly shows that in the urban part of the test, it is higher than in the WLTC test, which is reflected in the road emission increase factors of carbon dioxide rk and the RF factor.
During the RDE tests for the conventional vehicle, the average values of the carbon dioxide emission exceeded the value of the road emission of this component enlarged by 30% in the WLTC test; hence, for this vehicle (urban phase, k = U), the rU factor falls in the range from 1.408 to 1.525, and for the entire test (k = RDE), this factor is 1.388 to 1.517 (Figure 10a). The values of RF are (Figure 10b) for the urban phase RFU ∈ (0.656; 0.821) and for the entire RDE test RFRDE ∈ (0.659; 0.854).
In addition, for the hybrid vehicle, the average values of the carbon dioxide emission exceeded the road emission of this component enlarged by 30% in the WLTC test. For the plug-in hybrid, this excess was greater than for the conventional vehicle. Therefore, for the hybrid vehicle (urban phase, k = U) the rU factor fell in the range from 1.027 to 2.022, and for the entire test (k = RDE), the situation was contrary compared to the conventional vehicle, and this factor fell in the range from 0.868 to 1.106. The values of the RF factor for the hybrid vehicles were as follows: for the urban phase—RFU ∈ (0.459; 1.0) and the entire test—RFRDE = 1.0. This confirms that the investigated hybrid vehicles significantly exceeded the carbon dioxide emission limits in the urban phase of the RDE test compared to the WLTC test, but in the entire RDE test, the carbon dioxide emission did not deviate from the WLTC test more than 30%.
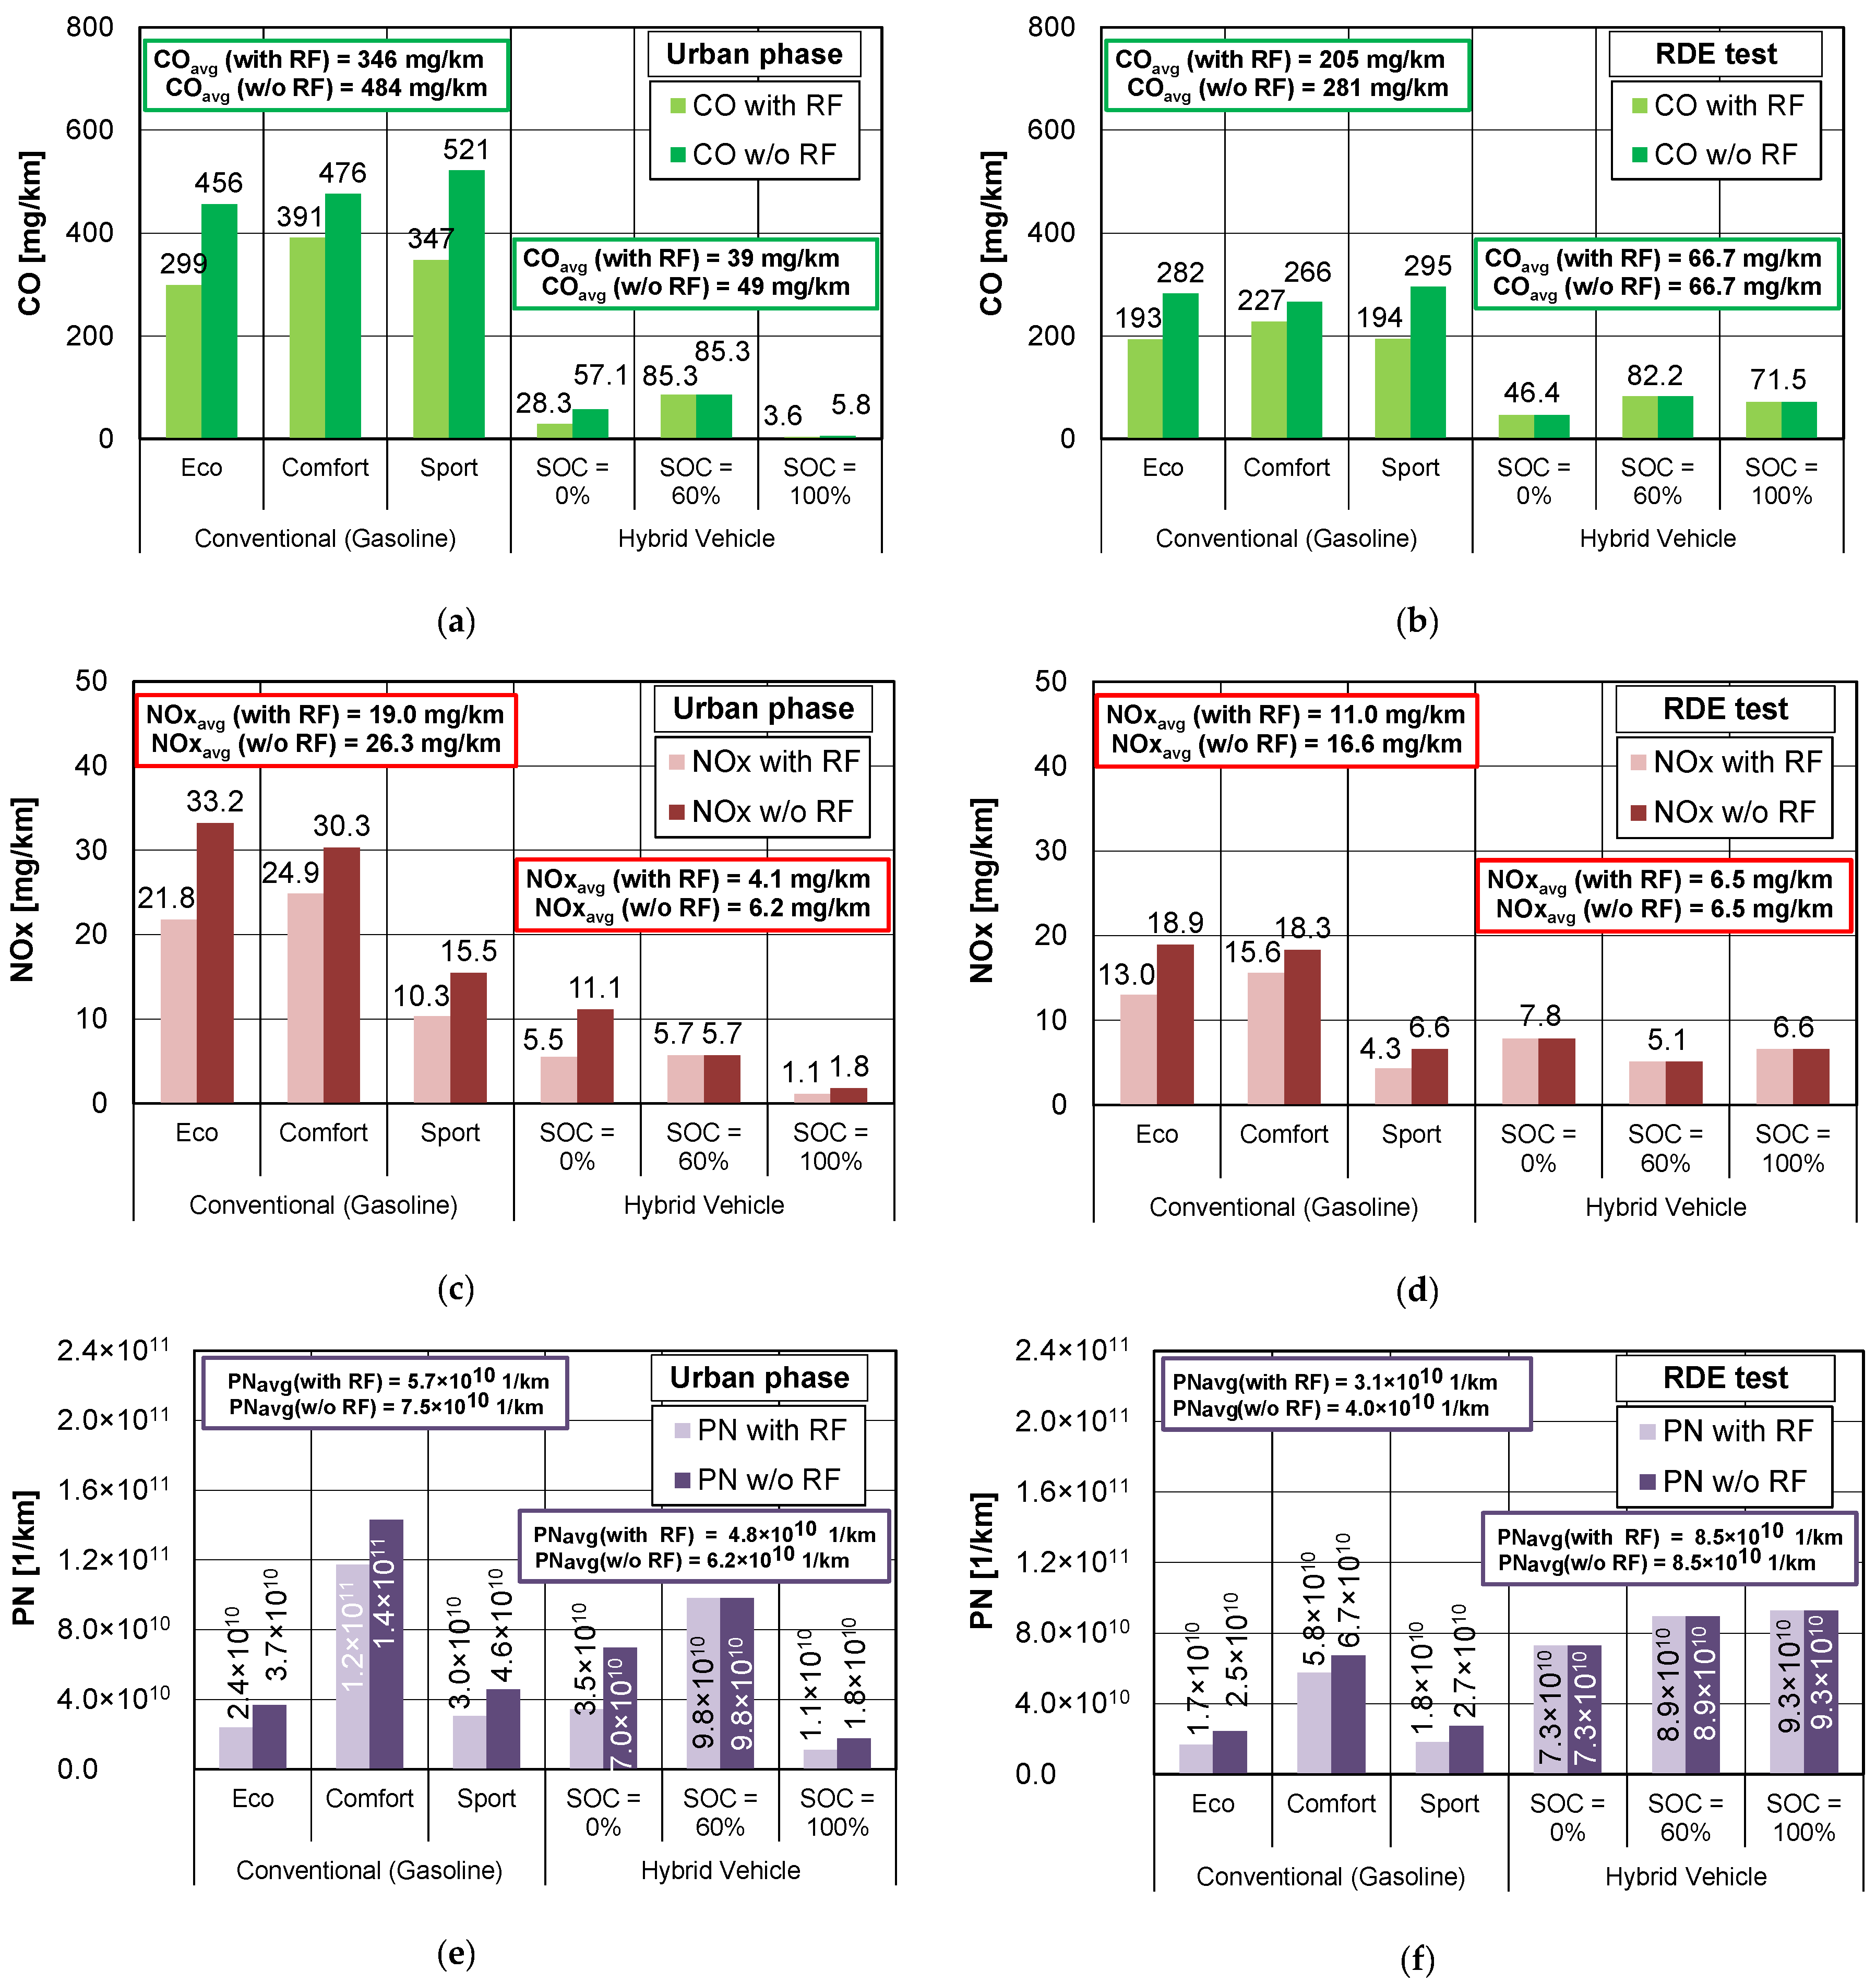
The values of the determined factors are directly translated into the values of road emissions, as presented in Figure 11. This figure shows the differences allowing for the RF factor in the road emissions results for individual exhaust components. From these results, we know that the significant deviations of the exhaust emissions obtained in the RDE test from those of the WLTC tests are compensated by the RF factors. When analyzing the road emission of carbon monoxide in the urban phase of the RDE test, one can observe a several times lower emission from the hybrid vehicles (depending on the battery state of charge and irrespective of the application of the RF factors) compared to the vehicles fitted with the combustion engines (Figure 11a). For the hybrid vehicles and the SOC = 0%, this multiplicity amounts to approximately 6–8, for the SOC = 60%—approximately 4–6 times, and for the SOC = 100%, it is the highest: 80–90 times. Much smaller differences are observed when analyzing the entire RDE test: this is 4–6 times, 2–3 times, and 3–4 times, for the state of charge 0%, 60%, and 100% respectively. A reference value was the average value of the road emission for the vehicle fitted with a combustion engine with/without the RF factor. When comparing only the average values of the road emission with and without the RF factor, we learn that the vehicle fitted with the gasoline engine generates 10 times more carbon monoxide than the hybrid one in the urban phase of the RDE test and approximately 3–4 times more in the entire RDE test (Figure 11b).
Upon the analysis of the road emission of nitrogen oxides, we have the same conclusions, yet, they are of lesser qualitative potential. The average road emission of nitrogen oxides for the hybrid vehicle is approximately five times lower in the urban phase of the RDE test if the RF is allowed for and four times lower if the RF factor is not allowed for (Figure 11c). When comparing the road emission of this component in the entire RDE test, we obtain values 1.5–2.5 times lower for the hybrid vehicle depending on the use of the RF factor (Figure 11d). The analysis of the particle number in the urban phase of the RDE test (Figure 11e) shows that the hybrid vehicle generated approximately 20% less of this component, irrespective of the fact whether the RF factor was applied. When we analyze the entire RDE test in terms of the particle number, the results are different: approximately twice as many particles were generated by the hybrid vehicles, which mainly results from the nature of operation of these vehicles—shutting down the engine for short periods of time generates a high number of particles during the subsequent engine starts (Figure 11f).
When summing up the considerations regarding the exhaust emissions from conventional (gasoline) and hybrid vehicles, it was observed that much lower values for the entire RDE test were obtained for the hybrid ones (carbon monoxide—approximately 3–4 times, nitrogen oxides—approximately 2–3 times). However, due to the intermittent operation of the combustion engines in the hybrid vehicles, the authors recorded more than twice the particle number in the RDE tests compared to conventional vehicles fitted only with combustion engines.
5.3. Energy Consumption
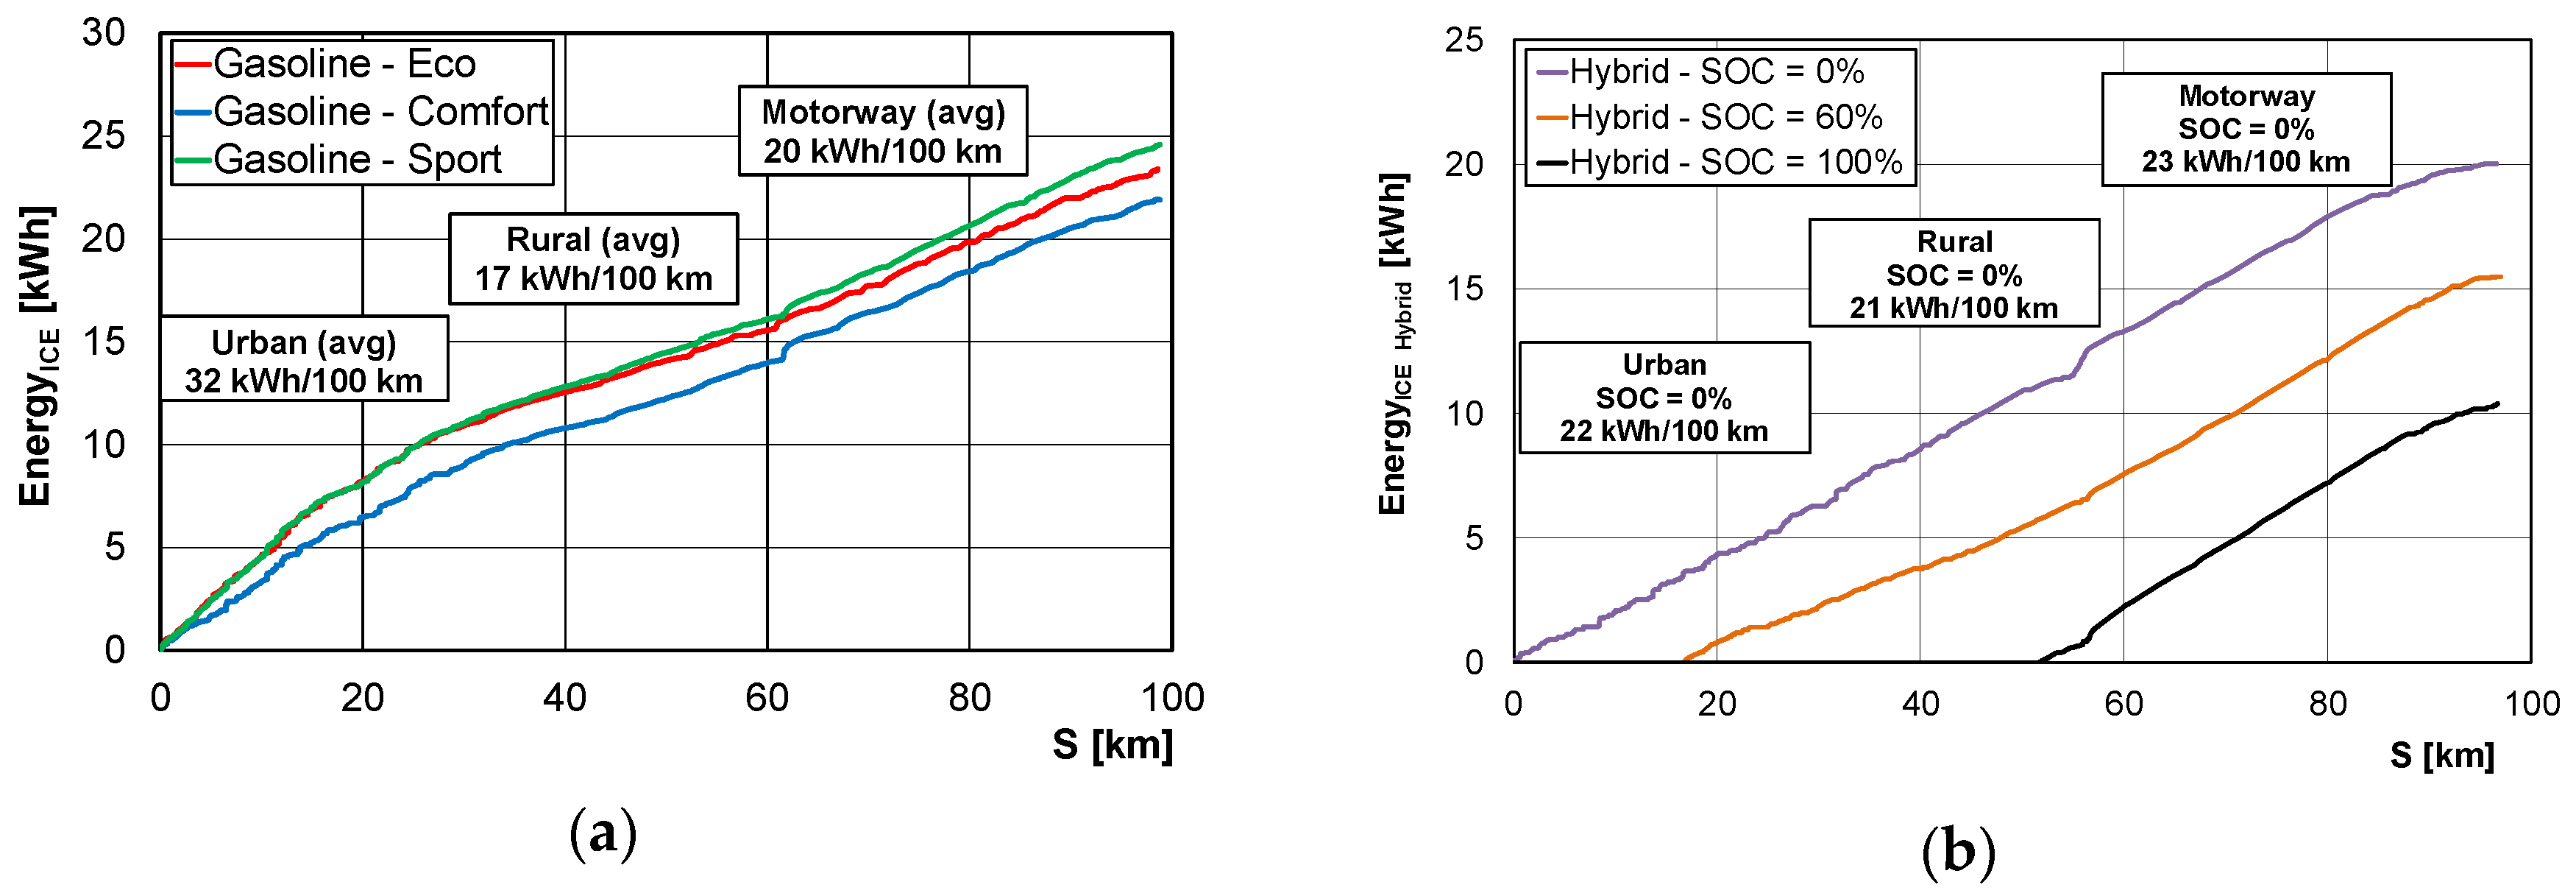
The measurements of the energy consumption were carried out not only in the electrical aspect but more holistically in terms of energy balance. To this end, the authors determined the energy consumption from the combustion of fuel in the gasoline engine, the energy consumption of the hybrid vehicle (combustion of fuel and consumption of electrical energy), and the energy consumption of the electric vehicle (electrical energy consumption only). In the hybrid and electric vehicles, regenerative braking was also taken into account. In the further part of the investigations, consumed energy was referred to as positive and the regenerated energy was referred to as negative. During the first stage of the investigations, the energy used by the combustion engine was determined, where the instantaneous engine power output was obtained for the recorded values of engine load and speed (pulled from the vehicle On-Board Diagnostic system) and using the engine characteristics M = f(n). The knowledge of this parameter allowed determining the vehicle instantaneous energy demand, and, consequently, the total energy used during the RDE test. During the second stage of the investigations, the consumption of electrical energy was determined for the hybrid and electric vehicles as taken from the measurements of the energy flow from/to the battery and the flow of current to the electric motor. The consumption of the electrical energy by the motor was marked as positive and the generation of energy by the generator and energy recovery was marked as negative. When analyzing the energy demand of the conventional vehicle fitted with the combustion engine, the authors determined that it amounted to approximately 32 kWh/100 km in the urban phase, approximately 17 kWh/100 km in the rural phase, and approximately 20 kWh/100 km in the motorway phase of the RDE test (Figure 12a). These values differed from one another by approximately 5% depending on the vehicle driving mode (Eco, Comfort, Sport). For the hybrid vehicle (Figure 12b), the energy demand, resulting from the operation of a combustion engine, assumed relatively constant values and was 22 kWh/100 km for the urban phase, 21 kWh/100 km for the rural phase, and approximately 23 kWh/100 km for the motorway phase of the RDE test. It is noteworthy that these values pertain to the SOC = 0% for the hybrid vehicle. For the remaining battery charge levels (60% and 100%), the slope of the energy consumption curves was similar to the slope of the curve at SOC = 0%, which makes it possible to find the similarity of energy consumption in all cases, and precise quantitative data will be presented later in this article.
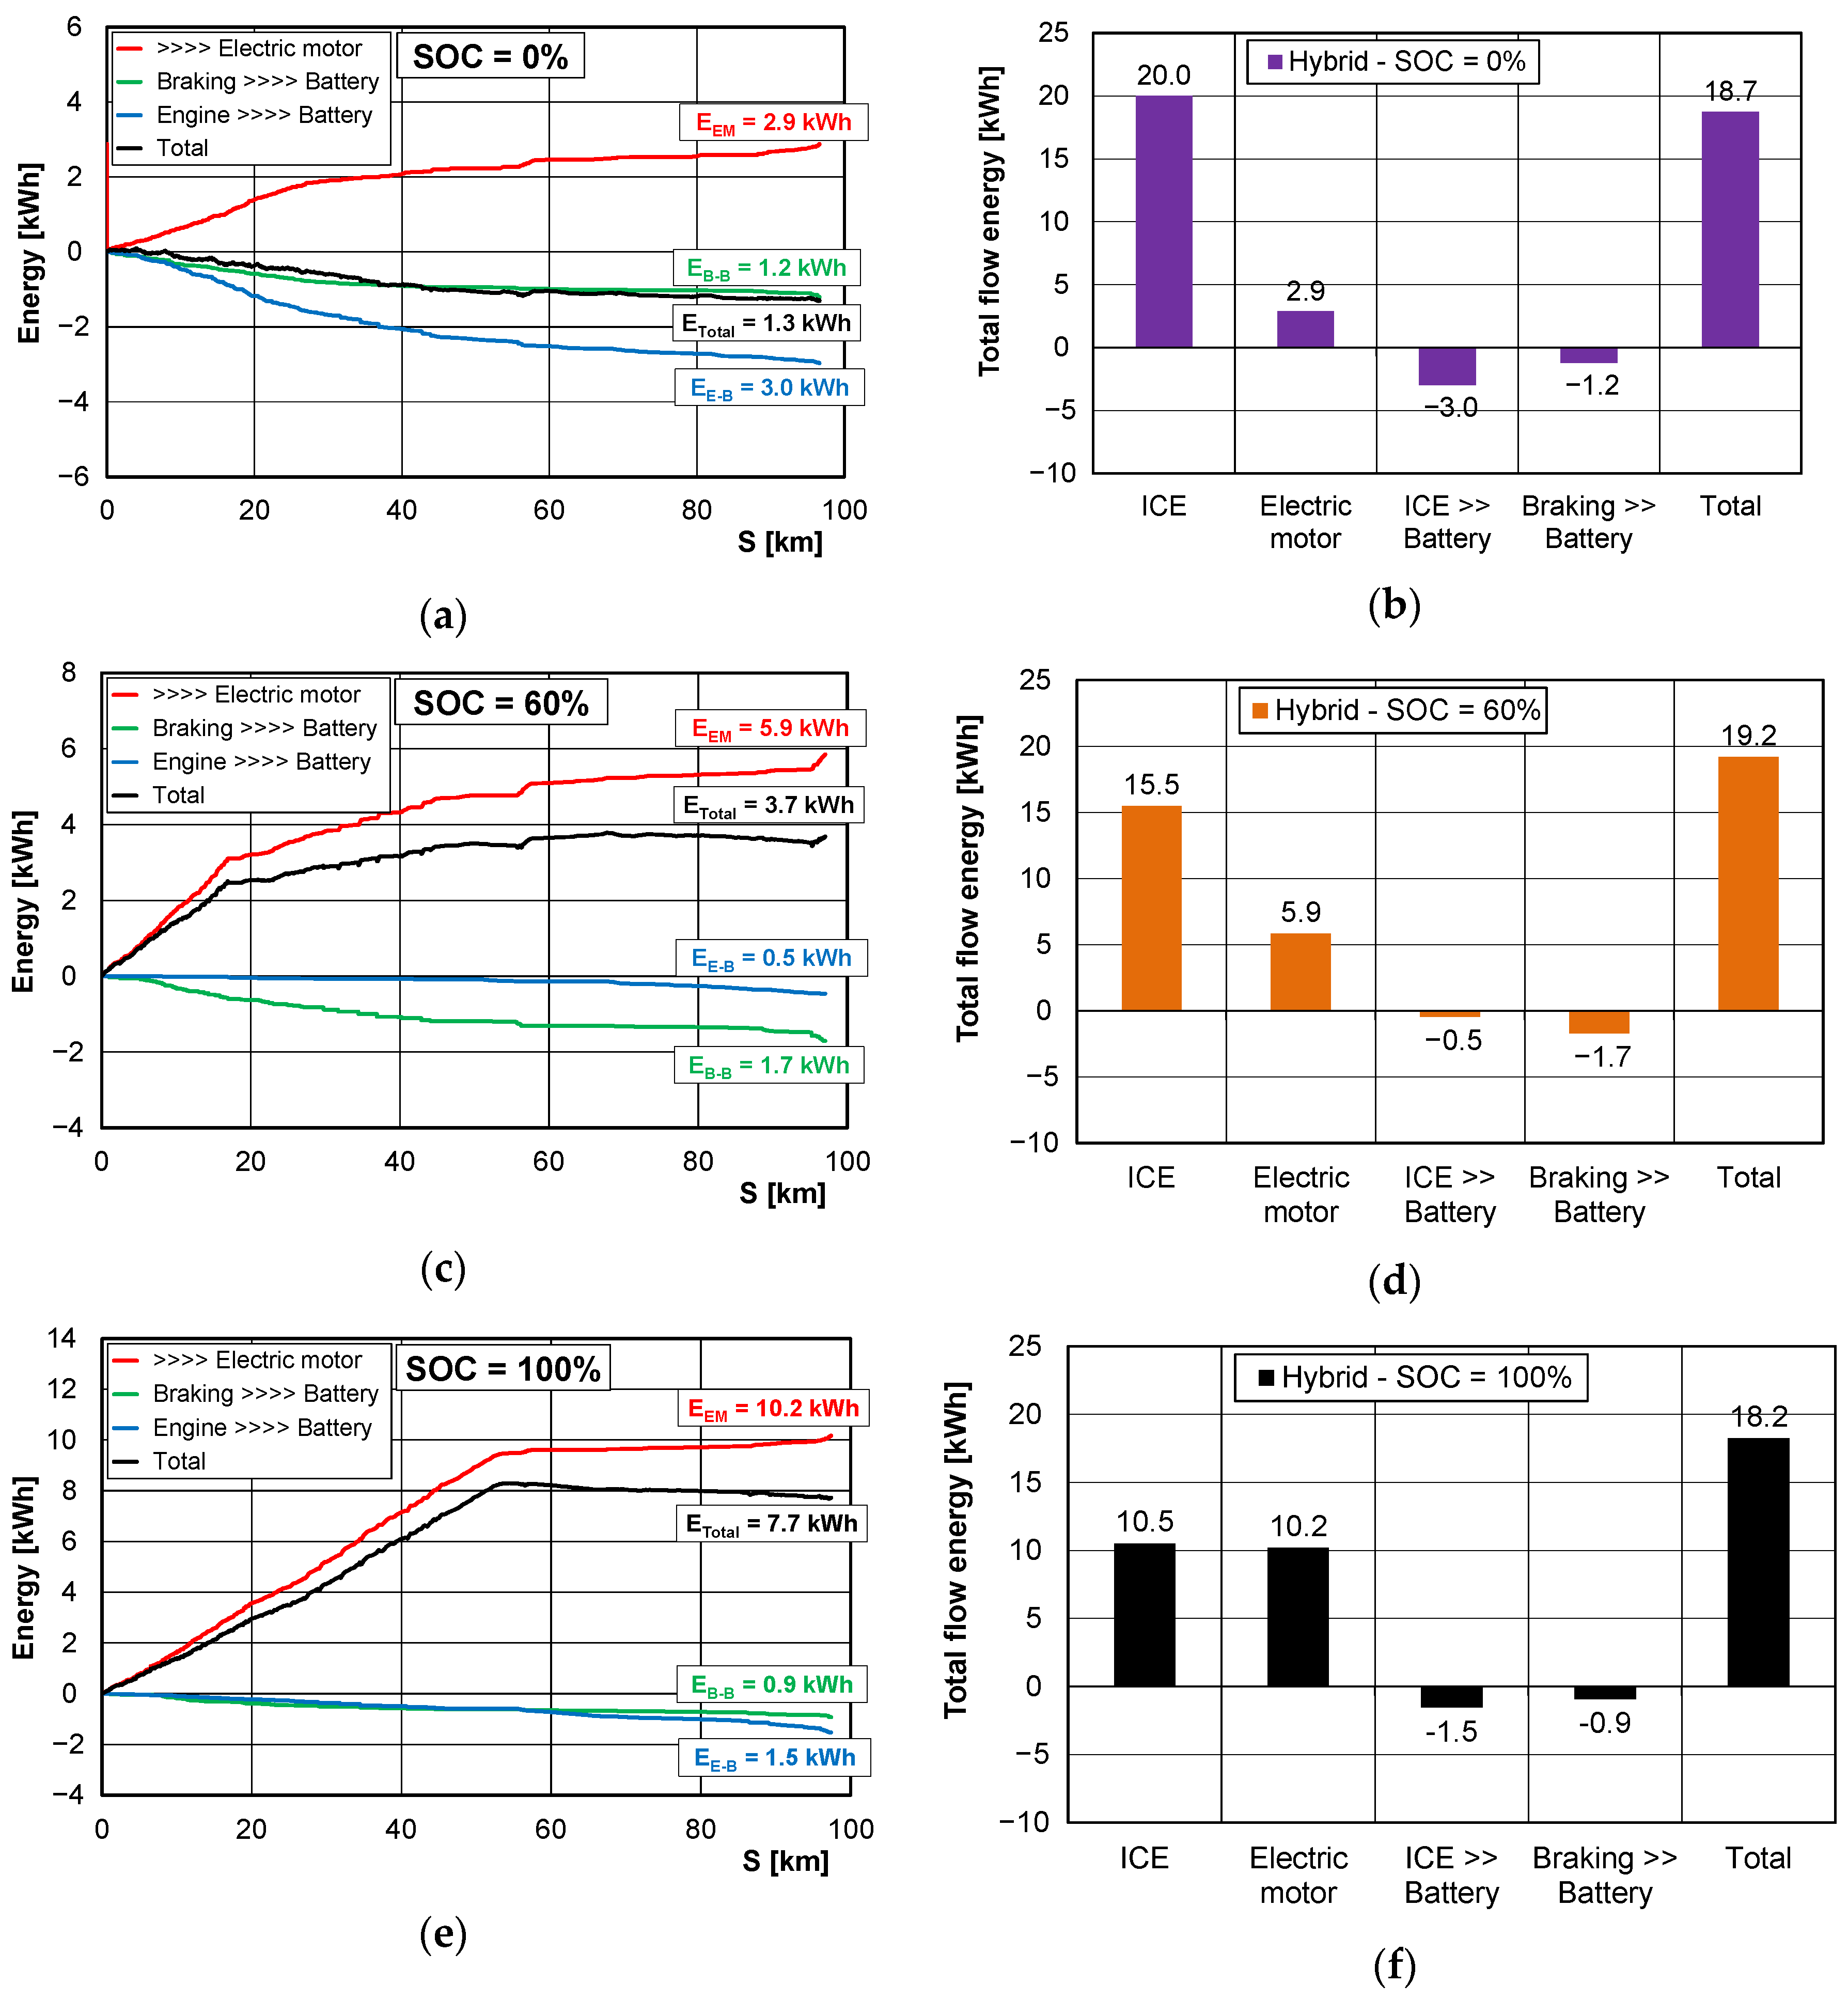
Below, the authors performed an analysis of the energy consumption in the hybrid vehicle depending on the battery state of charge (0%, 60%, 100%) in the entire RDE test (Figure 13a,c,e). One should note the variability of the tracings of the accumulated energy values and, at the same time, the total electrical energy consumption by the hybrid vehicles. For the hybrid vehicle with the battery initial state of charge SOC = 0% (Figure 13a), we can observe a very small use of the electric motor (2.9 kWh) and a significant value of the energy directed for battery charging (3.0 kWh). The regenerative braking gave approximately 1.2 kWh. The energy used by the combustion engine was approximately 20 kWh, which, when summing up the previously described data, allowed determining the total energy consumption on the level of 18.7 kWh (Figure 13b).
In the case of the plug-in hybrid vehicle of the initial sate of charge SOC = 60% in Figure 13c, we can clearly see a period when only the electric motor was used (the first 15 km of the test), in which period the electric motor consumed approximately 20 kWh/100 km. Such an initial SOC configuration allowed avoiding the use of the combustion engine at the initial stage of the test, which resulted in the combustion engine energy consumption of 15.5 kWh and the consumption of the energy by the electric motor of 5.5 kWh. When recovering energy of 2.2 kWh, the total energy consumption during the test amounted to 19.2 kWh (Figure 13d). For the last case, in which the battery initial state of charge was SOC = 100%, we can clearly see a test portion (approximately 50 km) when only the electric motor is used by the vehicle (Figure 13e) whose energy consumption was 18 kWh/100 km. For the plug-in hybrid vehicle with the fully charged battery, the energy consumption by the combustion engine in the entire RDE test was 10.5 kWh, and the consumption of electrical energy was 10.2 kWh. Owing to the energy recovery (1.5 kWh) and regenerative braking (0.9 kWh), the total energy consumption was 18.2 kWh (Figure 13f).
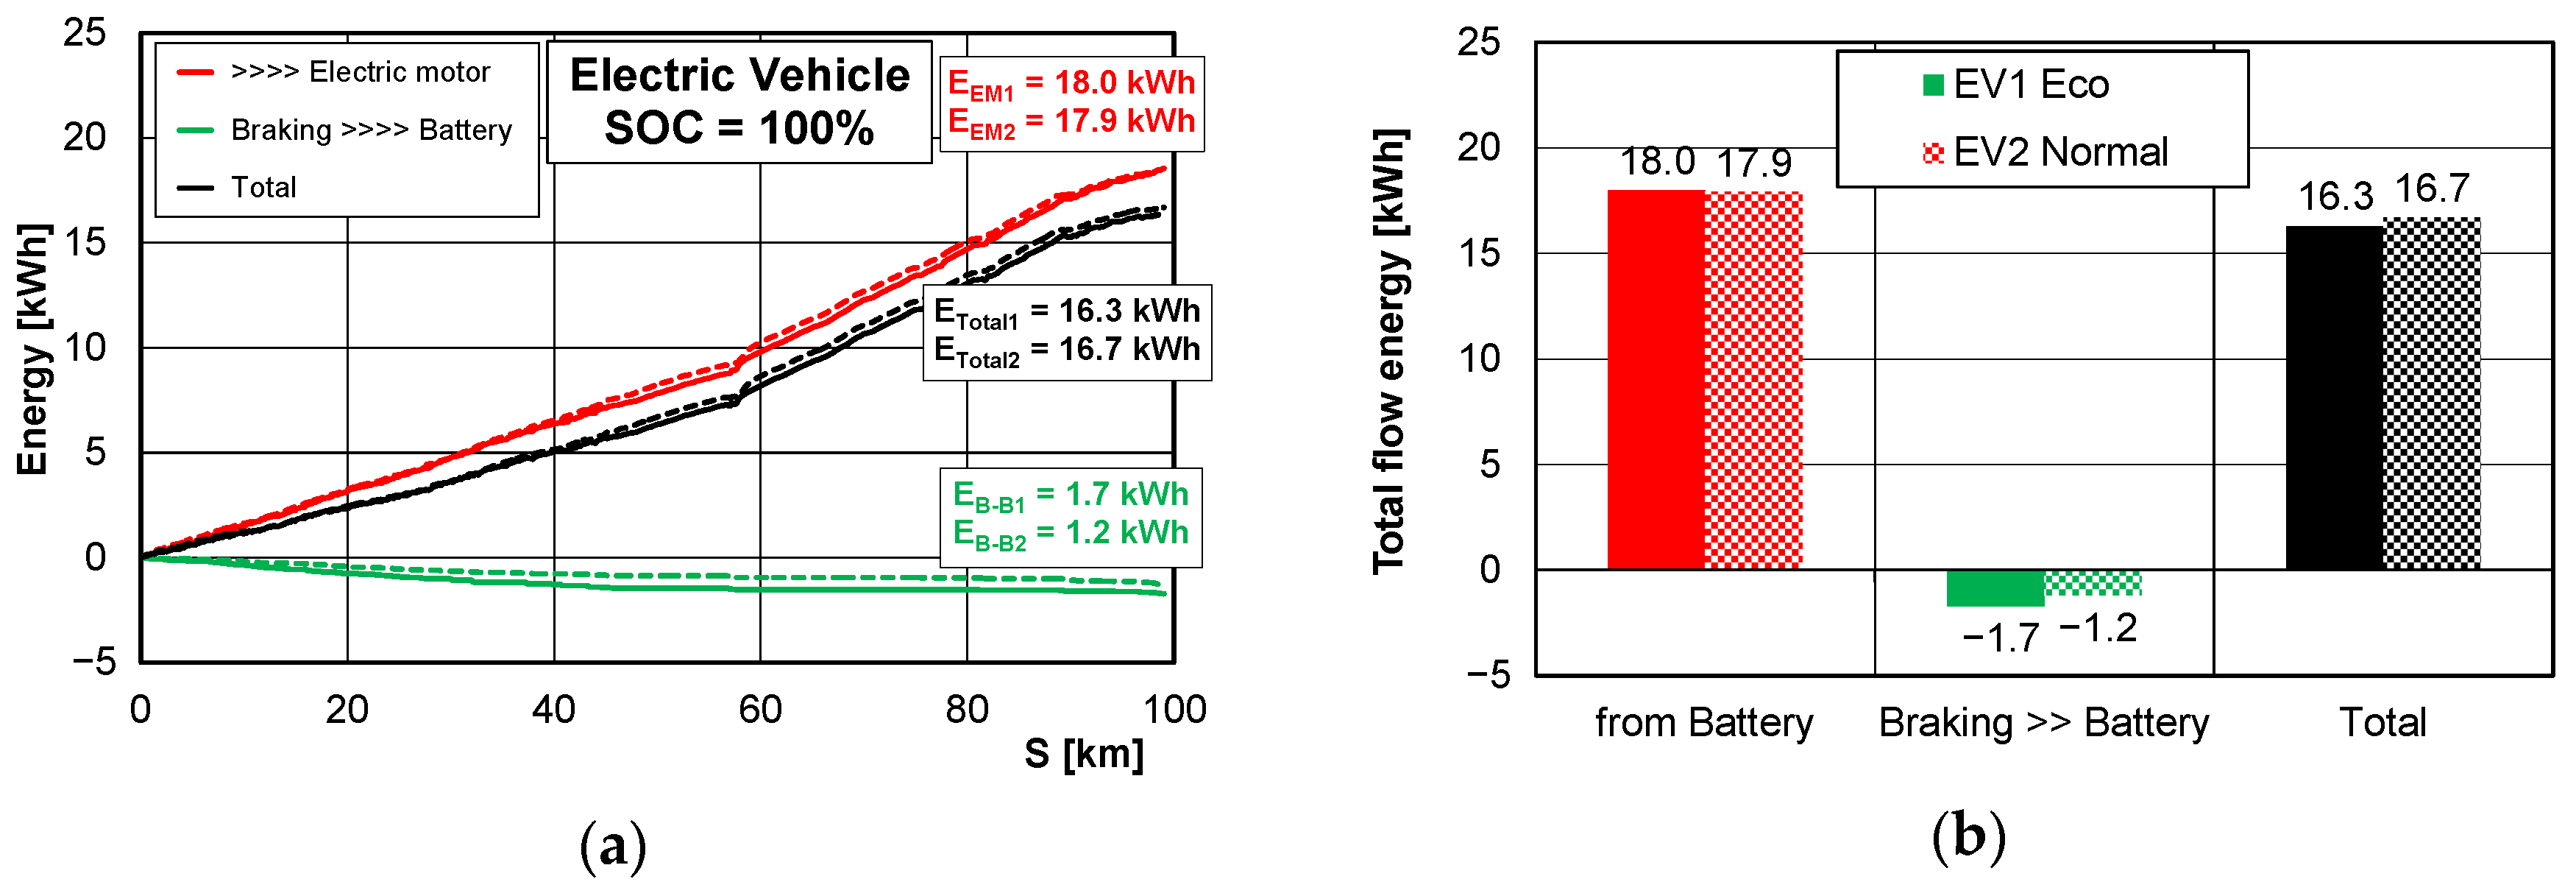
The energy consumption of the plug-in hybrid vehicle varies with the changing battery initial state of charge, influencing the internal energy balance of the vehicle. The external energy balance (total energy consumption) remains on a constant level, which, for the investigated vehicle was 18–19 kWh with the variability of the energy consumption of the combustion engine in the range from 10.5 kWh (SOC = 100%) to 20 kWh (SOC = 0%). The third investigated vehicle was the electric one, for which the energy balance was also calculated in two of its driving modes. The difference between the Eco and Normal driving modes for this vehicle was particularly noticeable during regenerative braking. In the Eco mode, 1.7 kWh was recovered, and in the Normal mode, approximately 1.2 kWh of energy was recovered. Despite the different driving modes (Eco, Normal), the energy flow balance remained on a similar level (Figure 14a). However, the energy balance was lower compared to the conventional vehicle (fitted with the gasoline combustion engine) and the plug-in hybrid. The energy consumption of the electric vehicle in the entire RDE test was approximately 18 kWh, which, at the energy recovery on the level of approximately 1.5 kWh, gave a result of approximately 16.5 kWh (Figure 14b).
6. Conclusions
The paper presented an analysis of the variability of exhaust emissions from conventional, hybrid, and electric vehicles. Modern plug-in hybrids, owing to their significant technical and operational advancement (e.g., the process of battery charging) are becoming competition for vehicles fitted with combustion engines. The most promising solution appears to be the vehicles fitted exclusively with electric powertrains. An important problem related to the operation of modern vehicles (of different powertrains) is the assessment of the energy consumption and efficiency under actual conditions of operation. This problem has been discussed in the paper thoroughly analyzing the exhaust emissions and energy consumption of the investigated vehicles. The final values are influenced by the energy consumption in the individual portions of the RDE (Figure 15a; Urban, Rural, Motorway), whose values are as follows (average values):
- For the vehicle fitted with the gasoline engine: 11 kWh (U), 5.6 kWh (R), 6.5 kWh (M),
- For the hybrid vehicle: 5.7 kWh (U), 6.9 kWh (R), 6.0 kWh (M),
- For the electric vehicle: 4.1 kWh (U), 5.6 kWh (R), 6.7 kWh (M).
These values referred to the distance of 100 km are as follows (Figure 15b):
- For the vehicle fitted with the combustion engine: 33 kWh/100 km (U), 17 kWh/100 km (R), 19.5 kWh/100 km (M),
- For the hybrid vehicle: 17 kWh/100 km (U), 21 kWh/100 km (R), 18 kWh/100 km (M),
- For the electric vehicle: 12.5 kWh/100 km (U), 17 kWh/100 km (R), 20.5 kWh/100 km (M).
The highest accumulated energy demand in the RDE test (on the same test route) occurs for the vehicle fitted with the combustion engine (23 kWh). In the case of the plug-in hybrid, it is lower by approximately 20% (18.7 kWh). The lowest value was obtained in the case of the electric vehicle (16.5 kWh). For the electric vehicle, this energy demand is approximately 30% lower compared to the combustion engine and approximately 10% lower compared to the plug-in hybrid.
Author Contributions
Conceptualization, J.P. and K.S.; methodology, J.P. and K.S.; formal analysis, J.P., K.S. and K.K.; investigation, J.P., K.S. and K.K.; writing—original draft preparation, J.P., K.S. and K.K.; writing—review and editing, J.P. and K.S.; visualization, J.P. All authors have read and agreed to the published version of the manuscript.
Funding
This research received no external funding.
Conflicts of Interest
The authors declare no conflict of interest.
Abbreviations
| BEV | Battery Electric Vehicle |
| CF | Conformity Factor |
| EV | Electric Vehicle |
| HEV | Hybrid Electric Vehicle |
| M | motorway |
| PEMS | Portable Emission Measurement System |
| PHEV | Plug-in Hybrid Electric Vehicle |
| r | ratio between the CO2 emissions measured during the RDE test and the WLTC test |
| R | rural |
| RDE | Real Driving Emissions |
| RF | Result evaluation factor for the RDE trip |
| RPA | Relative Positive Acceleration |
| SOC | state of charge |
| U | urban |
| WLTC | Worldwide-harmonized Light duty vehicles Test Cycle |
References
- European Parliament, CO2 Emissions from Cars: Facts and Figures (Infographics). Available online: https://www.europarl.europa.eu/news/pl/headlines/society/20190313STO31218/emisje-co2-z-samochodow-fakty-i-liczby-infografika (accessed on 19 August 2020).
- IEA. Global EV Outlook 2020, IEA, Paris. Available online: https://www.iea.org/reports/global-ev-outlook-2020 (accessed on 12 November 2020).
- Electric Vehicle Database. Available online: https://ev-database.org/ (accessed on 19 August 2020).
- Commission Regulation (EU) 2018/1832 of 5 November 2018 amending Directive 2007/46/EC of the European Parliament and of the Council, Commission Regulation (EC) No 692/2008 and Commission Regulation (EU) 2017/1151 for the purpose of improving the emission type approval tests and procedures for light passenger and commercial vehicles, including those for in-service conformity and real-driving emissions and introducing devices for monitoring the consumption of fuel and electric energy (Text with EEA relevance). Off. J. Eur. Union L 301 2018, 1–314.
- De Melo, T.C.C.; Botero, S.W.; De Carvalho, R.N.; Villela, A.C.S.; Machado, G.B.; Pontes, A.M.M.R. Light duty vehicle fuel economy—Comparison of ice, hybrid and electric vehicles based on different driving cycles. SAE Tech. Paper Ser. 2018. [Google Scholar] [CrossRef]
- Press release of the European Commission, Testing of Emissions from Cars, 4 May 2018. Available online: https://ec.europa.eu/commission/presscorner/detail/en/MEMO_18_3646 (accessed on 29 August 2020).
- Hickman, J.; Hassel, D.; Joumard, R.; Samaras, Z.; Sorenson, S. Methodology for Calculating Transport Emissions and Energy Consumption. Project Report Se/491/98. Transport Research Laboratory 1999. Available online: https://trimis.ec.europa.eu/sites/default/files/project/documents/meet.pdf (accessed on 27 November 2020).
- André, M.; Rapone, M.; Adra, N.; Pollak, I.; Keller, M.; McCrae, I. Traffic characteristics for the estimation of pollutant emissions from road transport—Artemis deliverable 10. Inrets Rep. 2006, LTE 0606, 89. [Google Scholar]
- Ntziachristos, L.; Samaras, Z. Copert III, Computer Program to Calculate Emissions from Road Transport; European Environment Agency: Copenhagen, Denmark, 2000. [Google Scholar]
- Keller, M. Emission Factors for Passenger cars and Light-Duty Vehicles, Handbook Mission Factors for Road Transport (HBEFA), Version 2.1. 2004, Software, Infras, Bern. Available online: https://www.hbefa.net/e/documents/AU_EFA_LMW.pdf (accessed on 27 November 2020).
- Mera, Z.; Fonseca, N.; López, J.-M.; Casanova, J. Analysis of the high instantaneous NOx emissions from Euro 6 diesel passenger cars under real driving conditions. Appl. Energy 2019, 242, 1074–1089. [Google Scholar] [CrossRef]
- Riemersma, I.; Mock, P. Too Low to be True? How to Measure Fuel Consumption and CO2 Emissions of Plug-In Hybrid Vehicles, Today and in the Future. The International Council on Clean Transportation 2017. Available online: https://theicct.org/sites/default/files/publications/EU-PHEV_ICCT-Briefing-Paper_280717_vF.pdf (accessed on 24 November 2020).
- Valverde, V.; Mora, B.A.; Clairotte, M.; Pavlovic, J.; Suarez-Bertoa, R.; Giechaskiel, B.; Astorga-Llorens, C.; Fontaras, G. Emission Factors Derived from 13 Euro 6b Light-Duty Vehicles Based on Laboratory and On-Road Measurements. Atmosphere 2019, 10, 243. [Google Scholar] [CrossRef] [Green Version]
- Pavlovic, J.; Fontaras, G.; Ktistakis, M.; Anagnostopoulos, K.; Komnos, D.; Ciuffo, B.; Clairotte, M.; Valverde, V. Understanding the origins and variability of the fuel consumption gap: Lessons learned from laboratory tests and a real-driving campaign. Environ. Sci. Eur. 2020, 32. [Google Scholar] [CrossRef] [Green Version]
- Merkisz, J.; Brzezinski, L.; Magdziak, A.; Skobiej, K. Analysis of particle emissions of passenger cars in RDE tests. E3S Web Conf. 2018, 44, 00108. [Google Scholar] [CrossRef] [Green Version]
- Han, D.; Jiaqiang, E.; Deng, Y.; Chen, J.; Leng, E.; Liao, G.; Zhao, X.; Feng, C.; Zhang, F. A review of studies using hydrocarbon adsorption material for reducing hydrocarbon emissions from cold start of gasoline engine. Renew. Sustain. Energy Rev. 2021, 135, 110079. [Google Scholar] [CrossRef]
- Hooftman, N.; Messagie, M.; Van Mierlo, J.; Coosemans, T. A review of the European passenger car regulations – Real driving emissions vs local air quality. Renew. Sustain. Energy Rev. 2018, 86, 1–21. [Google Scholar] [CrossRef]
- Wang, Y.; Ge, Y.; Wang, J.; Wang, X.; Yin, H.; Hao, L.; Tan, J. Impact of altitude on the real driving emission (RDE) results calculated in accordance to moving averaging window (MAW) method. Fuel 2020, 277, 117929. [Google Scholar] [CrossRef]
- Figenbaum, E.; Weber, C. Estimating Real-World Emissions of PHEVs in Norway by Combining Laboratory Measurement with User Surveys. World Electr. Veh. J. 2018, 9, 31. [Google Scholar] [CrossRef] [Green Version]
- Pielecha, I.; Pielecha, J. Simulation analysis of electric vehicles energy consumption in driving tests. Ekspolatacja i Niezawodn. Maint. Reliab. 2019, 22, 130–137. [Google Scholar] [CrossRef]
- Modi, S.; Bhattacharya, J.; Basak, P. Estimation of energy consumption of electric vehicles using Deep Convolutional Neural Network to reduce driver’s range anxiety. ISA Trans. 2020, 98, 454–470. [Google Scholar] [CrossRef] [PubMed]
- Burski, Z.; Mijalska-Szewczak, I.; Wasilewski, J.; Szczepanik, M. Evaluation of energy consumption of vehicles in EU Trans-European Transport Network. Transp. Res. Part A Policy Pract. 2016, 92, 120–130. [Google Scholar] [CrossRef]
- Basso, R.; Kulcsár, B.; Egardt, B.; Egardt, B.; Sanchez-Diaz, I. Energy consumption estimation integrated into the Electric Vehicle Routing Problem. Transp. Res. Part D Transp. Environ. 2019, 69, 141–167. [Google Scholar] [CrossRef]
- Qi, X.; Wu, G.; Boriboonsomsin, K.; Barth, M.J. Data-driven decomposition analysis and estimation of link-level electric vehicle energy consumption under real-world traffic conditions. Transp. Res. Part D Transp. Environ. 2018, 64, 36–52. [Google Scholar] [CrossRef] [Green Version]
- Hu, K.; Wu, J.; Schwanen, T. Differences in Energy Consumption in Electric Vehicles: An Exploratory Real-World Study in Beijing. J. Adv. Transp. 2017, 2017, 4695975. [Google Scholar] [CrossRef] [Green Version]
- Noura, N.; Erradi, I.; Desreveaux, A.; Bouscayrol, A. Comparison of the Energy Consumption of a Diesel Car and an Electric Car. In Proceedings of the 2018 IEEE Vehicle Power and Propulsion Conference (VPPC), Chicago, IL, USA, 27–30 August 2018; pp. 1–6. [Google Scholar]
Figure 1.
Increasing number of electric and plug-in hybrid vehicles between 2013 and 2019 [2].
Figure 1.
Increasing number of electric and plug-in hybrid vehicles between 2013 and 2019 [2].

Figure 2.
A comparison of the vehicle range (a) and the energy consumption (b) depending on the weather conditions [3].
Figure 2.
A comparison of the vehicle range (a) and the energy consumption (b) depending on the weather conditions [3].

Figure 3.
Example visualization of the test route with the description of the relative elevation (a) and the relation of speed, time, and covered distance (b).
Figure 3.
Example visualization of the test route with the description of the relative elevation (a) and the relation of speed, time, and covered distance (b).

Figure 4.
Measurement equipment for the RDE (Real Driving Emissions) tests (a) detailed diagram of the PEMS (Portable Emissions Measuring Systems) equipment (b).
Figure 4.
Measurement equipment for the RDE (Real Driving Emissions) tests (a) detailed diagram of the PEMS (Portable Emissions Measuring Systems) equipment (b).

Figure 5.
Measurement equipment used for the tests under real traffic conditions (a–c).

Figure 6.
Comparison of selected parameters of the road tests obtained and required for the following data: (a) share of the urban phase in the RDE test, (b) share of the rural phase in the RDE test, (c) share of the motorway phase in the RDE test, (d) share of the stop time in the RDE test.
Figure 6.
Comparison of selected parameters of the road tests obtained and required for the following data: (a) share of the urban phase in the RDE test, (b) share of the rural phase in the RDE test, (c) share of the motorway phase in the RDE test, (d) share of the stop time in the RDE test.

Figure 7.
Comparison of the dynamic parameters of the RDE test in its individual portions for all the investigated vehicles: (a) centile of the 95% product of velocity and positive acceleration, (b) relative positive acceleration.
Figure 7.
Comparison of the dynamic parameters of the RDE test in its individual portions for all the investigated vehicles: (a) centile of the 95% product of velocity and positive acceleration, (b) relative positive acceleration.

Figure 8.
Comparison of the emission conformity factors (CF) for selected exhaust components during the tests: (a) carbon dioxide, (b) carbon monoxide, (c) nitrogen oxides, and (d) particle number.
Figure 8.
Comparison of the emission conformity factors (CF) for selected exhaust components during the tests: (a) carbon dioxide, (b) carbon monoxide, (c) nitrogen oxides, and (d) particle number.

Figure 9.
Relations of the rate of increment of the mass of the exhaust components depending on the covered distance: (a) carbon dioxide, (b) carbon monoxide, (c) nitrogen oxides, and (d) particle number.
Figure 9.
Relations of the rate of increment of the mass of the exhaust components depending on the covered distance: (a) carbon dioxide, (b) carbon monoxide, (c) nitrogen oxides, and (d) particle number.

Figure 10.
Value of the RFk (a) and rk (b) of the carbon dioxide emission increase for all test drives.
Figure 10.
Value of the RFk (a) and rk (b) of the carbon dioxide emission increase for all test drives.

Figure 11.
Values of the road emissions of individual exhaust components determined using the RF emission factors in the urban phase of the RDE test (a,c,e) and the entire RDE test (b,d,f) for all the investigated vehicles fitted with combustion engines.
Figure 11.
Values of the road emissions of individual exhaust components determined using the RF emission factors in the urban phase of the RDE test (a,c,e) and the entire RDE test (b,d,f) for all the investigated vehicles fitted with combustion engines.

Figure 12.
Accumulated energy demand of the combustion engine fitted in the conventional (a) and the hybrid vehicle (b) as divided into individual RDE test phases.
Figure 12.
Accumulated energy demand of the combustion engine fitted in the conventional (a) and the hybrid vehicle (b) as divided into individual RDE test phases.

Figure 13.
The energy flow for the hybrid vehicle for different states of charge (a,c,e) and the accumulated energy demand of the vehicles (b,d,f).
Figure 13.
The energy flow for the hybrid vehicle for different states of charge (a,c,e) and the accumulated energy demand of the vehicles (b,d,f).

Figure 14.
The energy flow for the electric vehicle for different states of charge (a) and the accumulated energy demand of the vehicles (b).
Figure 14.
The energy flow for the electric vehicle for different states of charge (a) and the accumulated energy demand of the vehicles (b).

Figure 15.
Energy consumption in individual portions of the RDE test by different vehicles (a); energy demand of the investigated vehicles per 100 km (b).
Figure 15.
Energy consumption in individual portions of the RDE test by different vehicles (a); energy demand of the investigated vehicles per 100 km (b).


Table 1.
Technical parameters of the tested vehicles.
| Technical Parameters | Vehicle A (Gasoline) | Vehicle B (Hybrid) | Vehicle C (Electric) |
|---|---|---|---|
| Engine | Gasoline, Turbo, R4, 16V | Gasoline, Turbo, R4, 16V | – |
| Fuel system | direct injection | direct injection | – |
| Engine displacement | 1497 cm3 | 1395 cm3 | – |
| Max. power | 135 kW at 5800 rpm | 115 kW + 85 kW (electric) | 100 kW |
| Max. torque | 280 Nm/1200–4000 rpm | 250 Nm/1500–3500 rpm + 330 Nm (electric) | 290 Nm |
| Transmission | automatic, nine gears | automatic, six gears | |
| Size (L/W/H) | 4686/1810/1442 mm | 4869/1864/1503 mm | 4270/1799/1473 mm |
| Curb weight | 1430 kg | 1655 kg | 1585 kg |
| Specific power output | 21.33 kg/kW | 15.24 kg/kW | 18.65 kg/kW |
| Average CO2 emissions | 136–144 g/km (WLTC) | 31–42 g/km (WLTC) 16.4 kWh/100 km | 12.7 kWh/100 km |
| Euro standard | Euro 6d-Temp | Euro 6d-Temp | – |
| Battery | – | 13.6 kWh | 35.8 kWh |
Table 2.
Test route parameters along with the description of the criteria fulfillment and determination of the coefficient of variation (CoV), representing the variability of the road conditions during the tests (for each vehicle the results have been specified in relevant driving modes).
Table 2.
Test route parameters along with the description of the criteria fulfillment and determination of the coefficient of variation (CoV), representing the variability of the road conditions during the tests (for each vehicle the results have been specified in relevant driving modes).
| Test Parameter | Vehicle A Gasoline Eco/Comfort/Sport | Vehicle B Hybrid SOC = 0/60/100% | Vehicle C Electric Eco/Normal | Requirements Vehicle A/B/C | Correct/CoV [%] |
|---|---|---|---|---|---|
| Urban (U) [km] | 34.7/32.0/35.4 | 31.2/33.9/32.2 | 34.5/32.4 | >16 | OK/4.0% |
| Rural (R) [km] | 31.9/34.6/32.3 | 32.1/30.8/30.8 | 31.2/31.4 | >16 | OK/2.6% |
| Motorway (M) [km] | 33.1/33.3/32.6 | 33.3/32.3/34.4 | 32.8/32.3 | >16 | OK/1.6% |
| Total trip [km] | 99.7/100/100.2 | 96.6/97.0/97.4 | 98.5/96.1 | >48 | OK/1.4% |
| Urban share [%] | 34.8/32.0/35.3 | 32.3/34.9/33.1 | 35.0/33.7 | 29–44 | OK/3.3% |
| Rural share [%] | 32.0/34.6/32.2 | 33.2/31.8/31.6 | 31.7/32.7 | 33 ± 10 | OK/2.4% |
| Motorway share [%] | 33.2/33.4/32.5 | 34.5/33.3/35.3 | 33.3/33.6 | 33 ± 10 | OK/1.9% |
| U: average speed [km/h] | 27.9/26.8/29.7 | 31.9/29.9/31.1 | 32.9/29.7 | 15–40 | OK/5.0% |
| U: stop share [%] | 22.0/20.8/19.9 | 16.1/18.0/17.9 | 17.7/19.8 | 6–30 | OK/8.4% |
| M: time of speed above 100 km/h [min] | 15.6/17.9/15.7 | 16.1/16.6/16.6 | 15.2/16.3 | >5 | OK/3.7% |
| Time trip [min] | 105.3/105.1/101.7 | 101.3/109.2/104.5 | 103.3/106 | 90–120 | OK/1.8% |
Table 3.
Technical parameters of the measurement equipment (SEMTECH DS).
| Description | Measurement Method | Range | Accuracy of the Measurement Range |
|---|---|---|---|
| CO | NDIR | 0–10% | ±3% |
| THC | FID | 0–10,000 ppm | ±2.5% |
| NOx (NO + NO2) | NDUV | NO: 0–2500 ppm NO2: 0–500 ppm | ±3% |
| CO2 | NDIR | 0–20% | ±3% |
| O2 | Chemical analyzer | 0–22% | ±1% |
| Frequency | – | 1–4 Hz | – |
| Exhaust flow | Mass flow rate | 0–500 kg/h | ±1% |
Publisher’s Note: MDPI stays neutral with regard to jurisdictional claims in published maps and institutional affiliations. |
© 2020 by the authors. Licensee MDPI, Basel, Switzerland. This article is an open access article distributed under the terms and conditions of the Creative Commons Attribution (CC BY) license (http://creativecommons.org/licenses/by/4.0/).
Share and Cite
MDPI and ACS Style
Pielecha, J.; Skobiej, K.; Kurtyka, K. Exhaust Emissions and Energy Consumption Analysis of Conventional, Hybrid, and Electric Vehicles in Real Driving Cycles. Energies 2020, 13, 6423. https://doi.org/10.3390/en13236423
AMA Style
Pielecha J, Skobiej K, Kurtyka K. Exhaust Emissions and Energy Consumption Analysis of Conventional, Hybrid, and Electric Vehicles in Real Driving Cycles. Energies. 2020; 13(23):6423. https://doi.org/10.3390/en13236423
Chicago/Turabian StylePielecha, Jacek, Kinga Skobiej, and Karolina Kurtyka. 2020. "Exhaust Emissions and Energy Consumption Analysis of Conventional, Hybrid, and Electric Vehicles in Real Driving Cycles" Energies 13, no. 23: 6423. https://doi.org/10.3390/en13236423
Note that from the first issue of 2016, this journal uses article numbers instead of page numbers. See further details here.