Article

Validation of the Stolwijk and Tanabe Human Thermoregulation Models for Predicting Local Skin Temperatures of Older People under Thermal Transient Conditions

1
School of Mechanical Engineering, Tongji University, Shanghai 201804, China
2
Key Laboratory of Ecology and Energy Saving Study of Dense Habitat (Tongji University), Ministry of Education, Shanghai 201804, China
3
Research Center for Buildings, VANKE Co., Ltd., Shenzhen 518033, China
*
Author to whom correspondence should be addressed.
Energies 2020, 13(24), 6524; https://doi.org/10.3390/en13246524
Submission received: 23 October 2020 / Revised: 8 December 2020 / Accepted: 8 December 2020 / Published: 10 December 2020
(This article belongs to the Section B: Energy and Environment)

Abstract

:
Human thermoregulation models can predict human thermal responses to evaluate thermal comfort and help create a healthy environment, while their applicability to older people has not been sufficiently validated. This study aimed to evaluate the performance of the Stolwijk model and the Tanabe model for predicting older people’s mean and local skin temperatures under thermal transient conditions. Eighteen healthy older people were recruited and exposed to transient environments including neutral (26 °C), low-temperature (23 and 21 °C), and high-temperature (29 and 32 °C) conditions. The local skin temperatures of the subjects were measured and compared to predictions of the Stolwijk model and the Tanabe model. The results revealed that the Stolwijk model and the Tanabe model could accurately predict the mean skin temperature of older people under neutral and high-temperature conditions, while their predictive accuracy declined under low-temperature conditions. Increased deviations were observed in the predictions of local skin temperatures for all conditions. This work attempted to provide an understanding of older people’s thermal response characteristics under transient conditions and to inspire the improvement of thermoregulation models for older people.

1. Introduction

Population aging represents a major challenge for modern society. There are approximately 727.6 million people aged 65 and over worldwide in 2020, an increase of 120.1 million from 2015 [1]. Older people are more vulnerable to hot and cold stimuli because of their weak body functions [2,3]. They show less thermal sensitivity for environmental changes and react less efficiently to hot and cold exposure [4,5], which leads that older people would face more serious health risks and even death due to heat waves or cold weather [6,7]. The construction of a comfortable and healthy indoor environment for older people is a topic that has received substantial research attention [8,9,10].
Human thermoregulation models and coupled thermal sensation models can be helpful in predicting human thermal comfort and evaluating the environment [11,12]. Human thermoregulation models are one mathematic tool used to simulate the human body’s physiological responses and complex heat transfer processes under various thermal environmental conditions [13,14]. Taking the environmental parameters (e.g., air temperature, mean radiant temperature, relative humidity, and air velocity) and human-related factors (e.g., clothing insulation and activity level) as inputs, human thermoregulation models can predict the core and skin temperatures of the human body [12,15]. These outputs can be used as the optimal monitoring parameters to estimate human thermal sensation and thermal comfort [16,17,18,19,20,21], especially for older people [22,23,24]. Some studies have coupled human thermoregulation models and thermal sensation models [25,26,27]; however, the predictive accuracy of these coupled models has been found to largely depend on the reliability of its human thermoregulation models [28]. Therefore, to assess thermal comfort of older people through the coupled models, the predictive accuracy of thermoregulation models for older people requires validation.
Various human thermoregulation models have emerged. The 25-node model proposed by Stolwijk [29] in 1971 is one of the most influential human thermoregulation models, and has provided the basic framework for subsequent studies of human thermoregulation models [15]. Based on the Stolwijk model, the Tanabe model [30,31] and the Fiala model [32,33,34] were developed with more detailed body segmentation, complicated heat exchange and improved thermoregulatory system. However, these models are constructed with the physical body data of ‘average man’, ignoring the differences in gender, age, and ethnicity. Considering the individual body characteristics, the UCB model [35,36] was proposed with a ‘body builder’ model that can convert individual’s descriptive parameters (i.e., height, weight, gender, body fat, and skin color) into physiological data, but the physiological differences between young and older people were still not taken into account. A few human thermoregulation models for older people have been developed based on the existing human thermoregulation models [37,38,39]; however, there is still a lack of research on the strengths and weaknesses of classical human thermoregulation models for predicting the local skin temperature of older people. Therefore, it is meaningful to evaluate how classical human thermoregulation models work on older people and eventually design better thermoregulation models for this population.
In this study, a series of older people’s local skin temperatures under transient conditions, collected from lab experiments, were used to validate the predictions of the Stolwijk model and the Tanabe model. The performance of the Stolwijk model and the Tanabe model for predicting local skin temperature of older people were evaluated by comparing them with the experimental data. Then, the influence of differences between the simulated and measured local skin temperatures on predicting thermal sensation was investigated. Based on this work, the thermal response characteristics of older people under transient conditions were investigated and the reliability of the two human thermoregulation models for older people could be estimated, which would help to improve the thermoregulation models for older people.

2. Materials and Methods

The validation of the Stolwijk model and the Tanabe model for predicting the mean and local skin temperature of older people was conducted by comparing the calculated skin temperatures of the two models with the measured values. The measured local skin temperature of older people was obtained through lab experiments. The calculated results were determined by running the mentioned human thermoregulation models with the inputs from the lab experiments. The impact of the differences between the calculated and measured skin temperatures was evaluated by means of simulated human thermal sensation based on the UCB thermal sensation model.

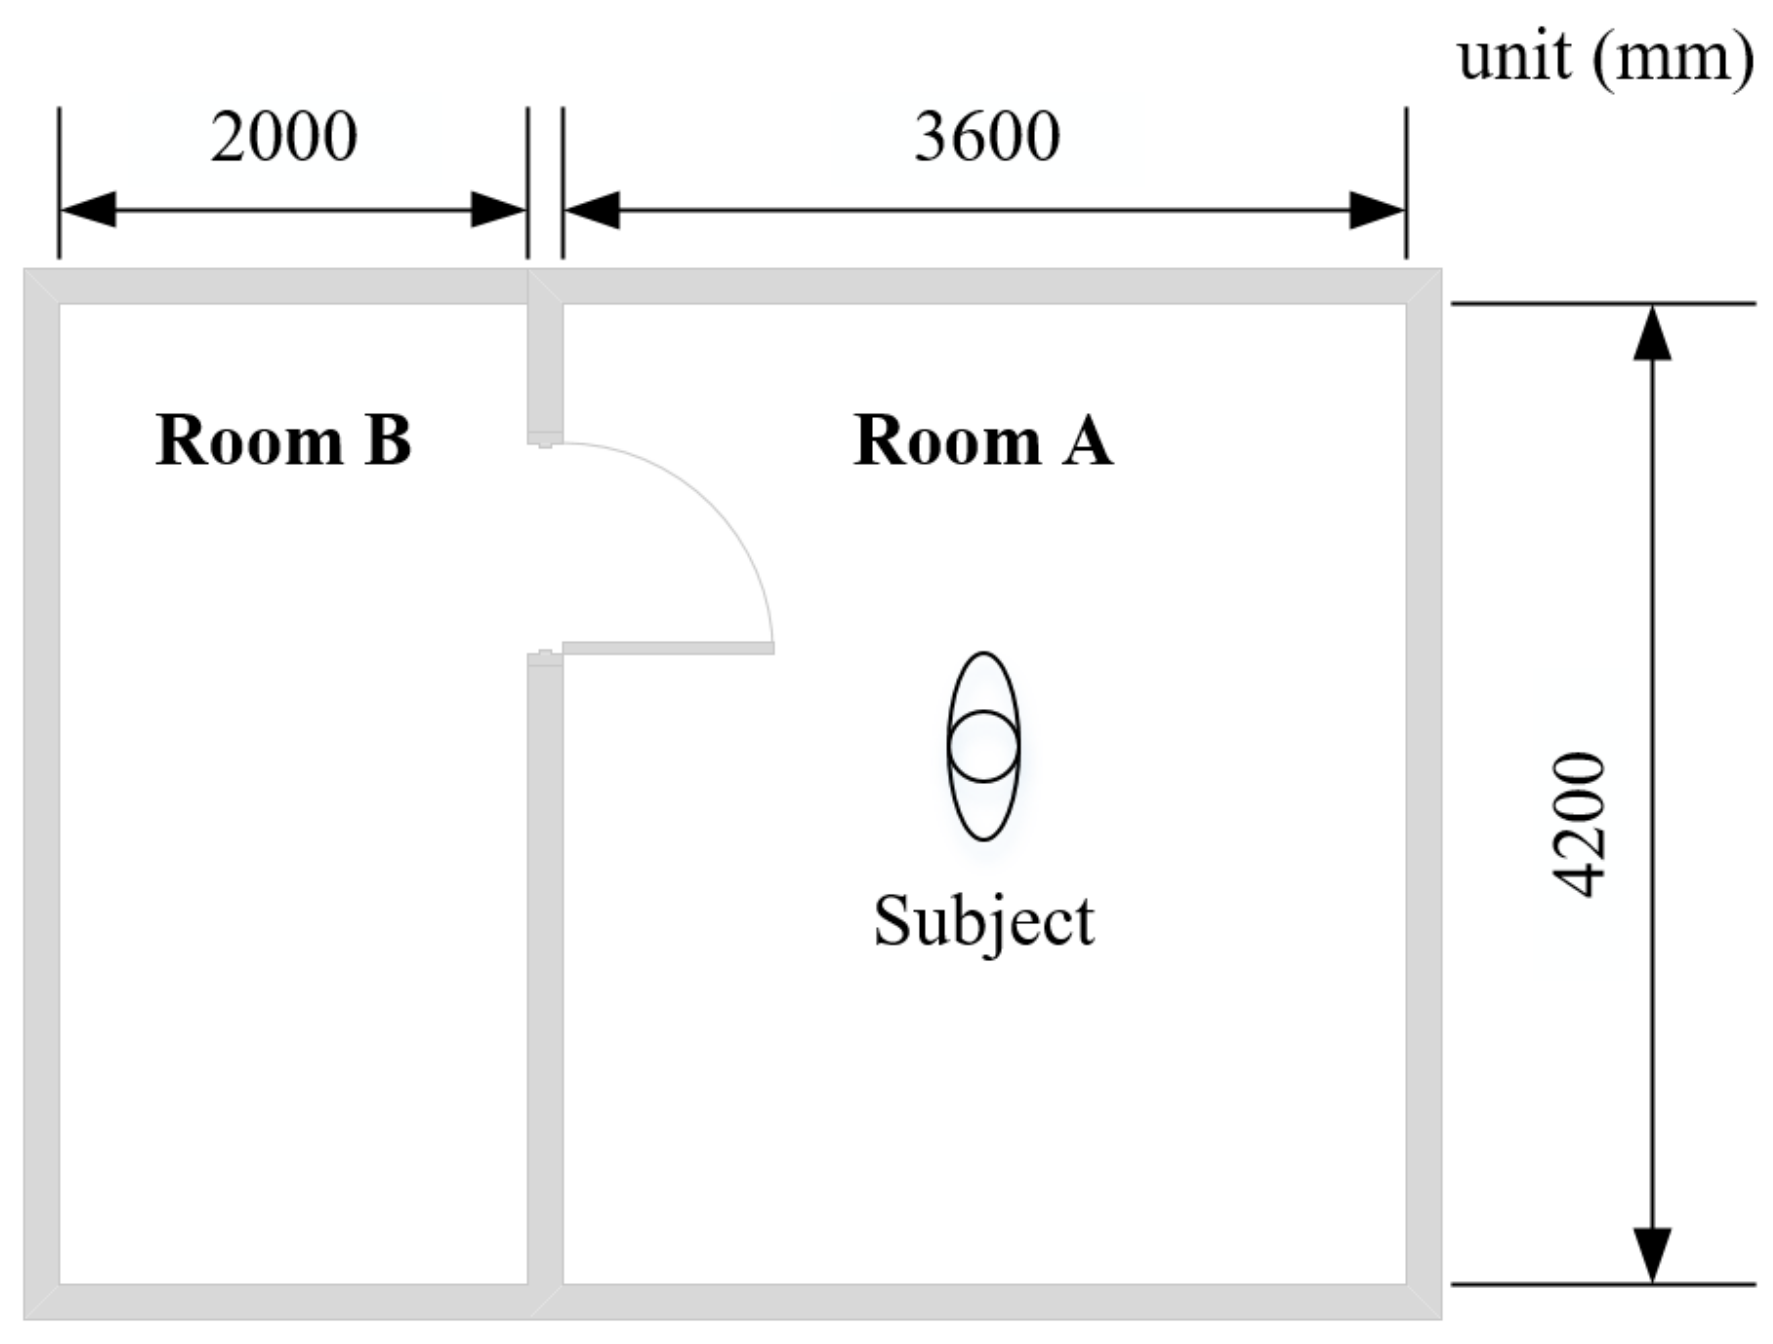
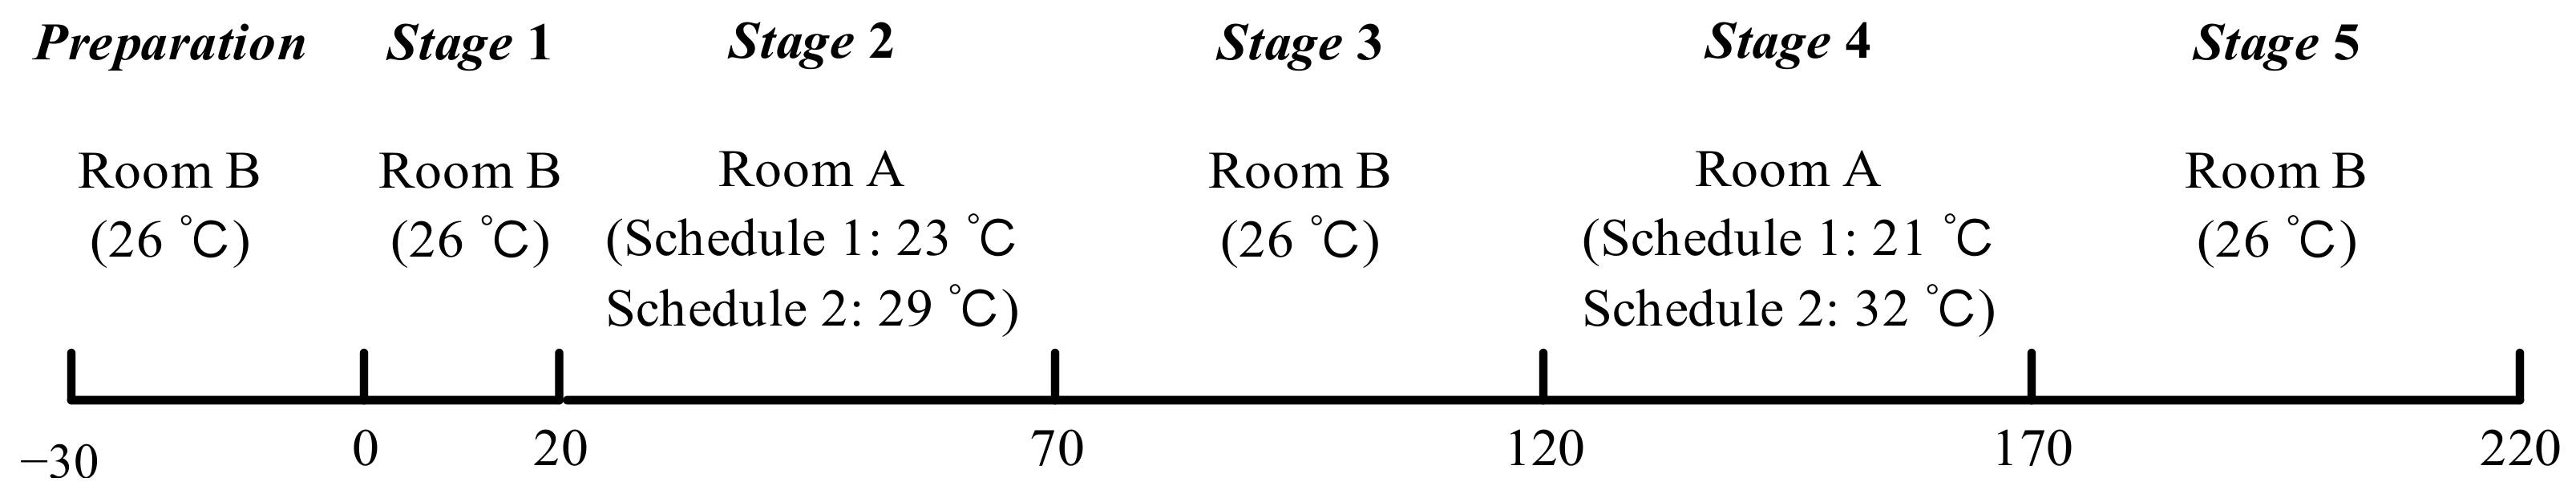
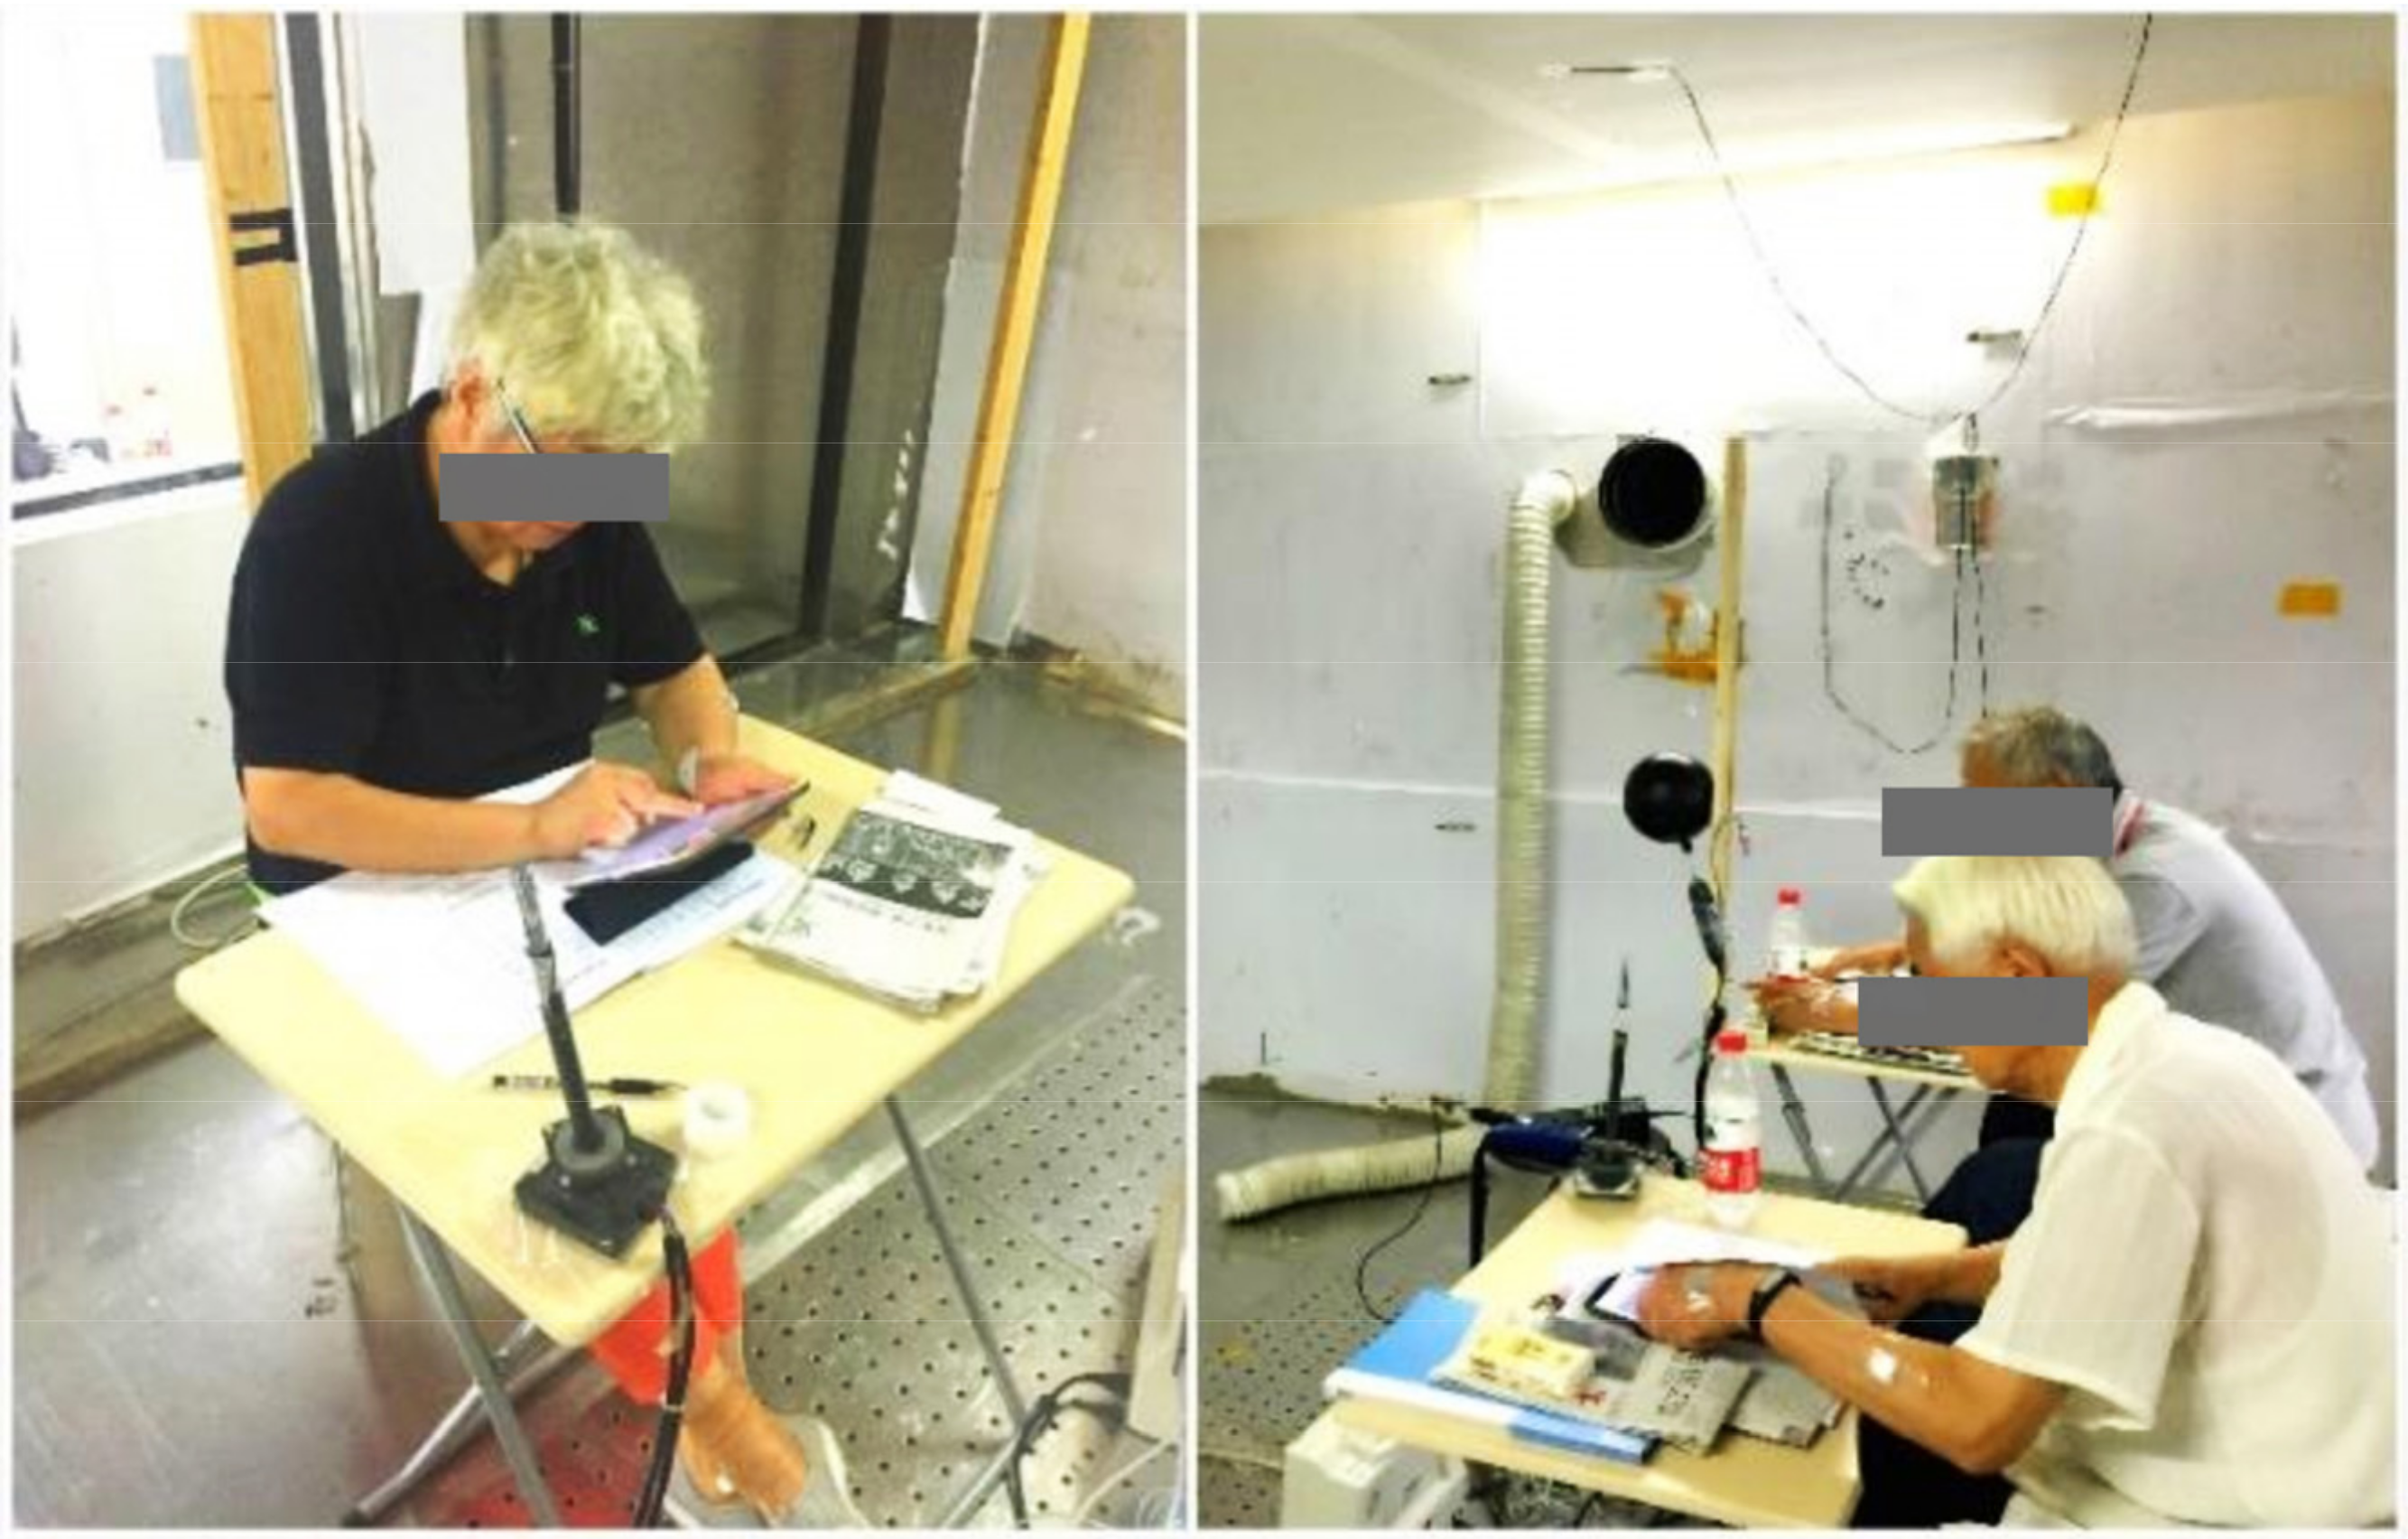
2.1. Lab Experiments

The lab experiments were conducted in a test chamber at Tongji University, Shanghai, China [40], to measure older people’s local skin temperatures under thermal transient conditions. The test chamber consists of two adjacent rooms (room A and room B), as shown in Figure 1. The thermal environment in the two rooms can be controlled by air-conditioning systems.
The lab study consisted of two series of experiments (schedule 1 and schedule 2) and the procedures are shown in Figure 2. Room B remained at 26 °C as a thermally neutral environment, and room A was set at low-temperature (23 °C and 21 °C) and high-temperature (29 °C and 31 °C) for schedule 1 and schedule 2, respectively. The temperature limit and test time were set based on health and safety concerns. Subjects remained sedentary in the test chamber (see Figure 3), except when moving between the two rooms. Based on Hardy and DuBois’s seven-point method [41], local skin temperatures of the forehead, chest, lower arm, back of hand, thigh, lower leg, and foot were monitored continuously at intervals of 1 min by wireless temperature sensors. The mean skin temperature was calculated using Equation (1) [41]. All experimental protocols were reviewed and approved by the Ethics Committee of Tongji University, and verbal and written informed consent was obtained from each subject before the experiments.
t s k i n , m e a n = 0.07 t s k i n , f o r e h e a d + 0.35 t s k i n , c h e s t + 0.14 t s k i n , l o w e r a r m + 0.05 t s k i n , h a n d + 0.19 t s k i n , t h i g h + 0.13 t s k i n , l o w e r l e g + 0.07 t s k i n , f o o t
Eighteen healthy older people aged 60 and over were recruited for the experiments. The detailed information of subjects is shown in Table 1. A typical summer clothing ensemble (short sleeves, underpants, thin trousers, socks, and cloth shoes) was worn by all subjects. The clothing insulation (Icl,i) of the ensemble was shown in Table 2, which was measured by a thermal manikin test [42]. The vapor resistance (Re,cl,i) and area factor (fcl,i) of the clothing ensemble were calculated using Equation (2) and Equation (3), respectively, according to ISO 9920 [43].
R e , c l , i = 0.18 × 0.155 I c l , i
f c l , i = 1.00 + 0.28 I c l , i
The thermal environmental parameters in the test chamber, including air temperature (ta), relative humidity (RH), air velocity (va), and globe temperature (tg), were measured during the experiments. Two environmental parameter measurement points were set up at 0.5 m on both sides of the subjects, at a height of 1.1 m. The environment at the two measurement points did not differ significantly during the experiment, so the measurement data were averaged. Detailed information of the thermal environment during the experiments is shown in Table 3. The fluctuations of the environmental parameters in each stage did not exceed the requirements of ISO 7726 [44], indicating that the environment in the test chamber can be considered as stationary. Information on the instruments used in this study is listed in Table 4.

2.2. Calculation Settings of the Stolwijk Model and the Tanabe Model

The human thermoregulation system in the Stolwijk model [29] includes a controlled (passive) system and a controlling (active) system. The controlled system models the physical human body, and the controlling system models the active thermoregulatory responses of the human body, including sweating, shivering, vasoconstriction, and vasodilation. The human body in the Stolwijk model is partitioned into head, trunk, arms, hands, legs, and feet, which are represented by sphere (head) and cylinders. Each body segment consists of four concentric tissue layers (skin, fat, muscle, and core), and a central blood compartment is additionally set, for a total of 25 nodes.
The Tanabe model [31] was developed based on the heat transfer theory of the Stolwijk model. The Tanabe model includes sixteen body segments (head, chest, back, pelvis, left shoulder, right shoulder, left arm, right arm, left hand, right hand, left thigh, right thigh, left leg, right leg, left foot, and right foot). Moreover, the basal metabolic rate, cardiac output, and some distribution coefficients are adjusted in the Tanabe model.
In this study, the sensible and evaporative heat losses at the skin surface of the Stolwijk model were calculated by the method used in the Tanabe model [31] because the original Stolwijk model does not consider the heat and moisture capacitances of clothing and is inapplicable to clothed situations. Other settings of the original Stolwijk model and Tanabe model were retained for the calculations [29,31]. The computer program of the Stolwijk model and the Tanabe model were implemented on the basis of the open-source codes provided by Stolwijk [29] and Auckland Bioengineering Institute Comfort Simulator [45].
To run the two models, the inputs of the environmental parameters for all body segments were set as the average values of the experimental data for each stage, as shown in Table 3. The mean radiant temperature ( t r ¯ ) was calculated from indoor air temperature, globe temperature, and air velocity according to ISO 7726 [44], expressed by Equation (4). The saturated vapor pressure (Pskin,sat) at the skin surface was calculated using Equation (5) based on the skin temperature (tskin) [46,47]. The clothing insulation and vapor resistance were set as the values in Table 2. The metabolic rate of the sedentary older people was assumed to be 0.8 met [23,48]:
t r ¯ = t g + 273 4 + 2.5 × 10 8 × v a 0.6 × t g t a 1 / 4 273
P s k i n , s a t = 0.1 exp 18.956 4030.183 t s k i n + 235
Considering the difference in body segmentation between the measurement and the simulation of the Stolwijk model and the Tanabe model, the validation of each body segment was based on the correspondence shown in Table 5. The calculated trunk temperature of the Stolwijk model was compared with the measured chest temperature in experiments, and the calculated leg temperature of the Stolwijk model was compared with the measured skin temperature of the thigh and lower leg.

2.3. Calculation Setting of the UCB Thermal Sensation Model

In this study, the UCB thermal sensation model [16,18] was employed to evaluate the influence of the predicted skin temperatures by the two human thermoregulation models on assessing older people’s thermal sensation. The UCB thermal sensation model could predict human thermal sensation based on local skin temperature of 19 segments and core temperature. The output thermal sensation was expressed by the continuous value between +4 (very hot) and −4 (very cold). Based on the seven-point method of skin temperature in this study, the UCB thermal sensation model was run with the following assumptions:
(1)
The skin temperature distribution of the left and right extremities was symmetrical.
(2)
The UCB sensation thermal model was adapted to the measurement and the two thermoregulation models according to the body segment correspondence shown in Table 5. The temperature of the face, breath, and neck was assumed to be the same as the head temperature. The temperature of the back and pelvis was assumed to be the same as the chest temperature. The upper arm temperature was assumed to be the same as the lower arm temperature.
(3)
The influence of the core temperature was neglected.
(4)
The skin temperature set point of each body segment for older people, which represents the neutral local skin temperature, was set according to the average values of the measurements in Stage 1 (26 °C) of both Schedule 1 and Schedule 2 (see Table 6 in Section 3.1), where the subjects’ responses were thermally neutral.
Based on the experimental data and predictions of the thermoregulation models, the thermal sensation values were calculated every minute.

3. Results

3.1. Experimental Results

The experimental results of mean and local skin temperatures of older people are shown in Table 6, Figure 4 and Figure 5. The thermal response of older people in the thermally neutral environment (26 °C) during stage 1 was measured firstly, as described by the statistical data of mean and local skin temperatures in Table 6. The average value of older people’s mean skin temperature was 33.6 °C, with a standard deviation of 0.5 °C. The highest average value of local skin temperature was found at the chest, followed by the head, with values of 34.0 °C and 33.9 °C, respectively. The lowest average local skin temperature was the forearm temperature, with a value of 32.8 °C. The variable with the largest standard deviation among the subjects was the hand temperature, followed by the foot temperature, with values of 1.0 °C and 0.8 °C, respectively.
Figure 4 shows the change trends of mean skin temperature during the thermal transient conditions for both schedule 1 of cold exposures (temperature order: 26-23-26-21-26 °C) and schedule 2 of hot exposures (temperature order: 26-29-26-32-26 °C). The black box represents the skin temperature, and the black line represents the standard deviation of skin temperature between subjects. The thermal responses of older people were different under cold and hot exposures. In the entire process of schedule 1, the average values of mean skin temperature varied from 33.7 °C to 31.2 °C (average 32.5 °C), with standard deviations differing among the subjects ranging from 0.4 °C to 0.6 °C (average 0.5 °C). In schedule 2, the average values of mean skin temperature varied from 33.6 °C to 34.9 °C (average 34.1 °C), with the standard deviations ranging from 0.2 °C to 0.6 °C (average 0.4 °C). The fluctuation of older people’s mean skin temperature in schedule 1 was greater than that in schedule 2, and the variation of standard deviation between the subjects in schedule 1 was significantly higher than that in schedule 2 (p < 0.001).
Furthermore, the steady mean skin temperatures in the thermally neutral conditions after cold exposure (stage 3 and stage 5) were lower than those before cold exposure (stage 1). The average value of older people’s mean skin temperature in the last 10 min of stage 1 was 33.6 °C, while those in the last 10 min of stage 3 and stage 5 were 33.0 and 32.7 °C, respectively. In contrast, the steady mean skin temperatures in the thermally neutral conditions were less affected by hot exposures. The average values of older people’s mean skin temperature in the last 10 min of stage 1, stage 3, and stage 5 for schedule 2 were 33.7, 33.8, and 33.7 °C, respectively.
The black boxes in Figure 5 show the older people’s thermal responses of local skin temperature under transient conditions for all segments. These typical tendencies of the thermal responses for local skin temperature were observed at all segments. However, the fluctuations of local skin temperatures under cold or hot exposures varied with segments. In schedule 1, the largest fluctuation of local skin temperature was found at the hand, ranging from 28.2 °C to 33.8 °C, while the smallest fluctuation was the chest temperature, ranging from 33.3 °C to 34.4 °C. In schedule 2, the largest fluctuation of local skin temperature was found at the forearm, ranging from 32.7 °C to 34.8 °C, while the smallest fluctuation was the thigh temperature, ranging from 33.3 °C to 34.4 °C.
Additionally, the temperature differences between the subjects varied with segments, and the largest standard deviations were observed at the hand and foot. Similar to the experimental results of the mean skin temperature, the fluctuations and standard deviations of local skin temperatures for most segments in schedule 1 were significantly higher than those in schedule 2.

3.2. Validation of Predictions by the Stolwijk Model and the Tanabe Model

The Stolwijk model and the Tanabe model were adopted to simulate the human thermal responses during the experiments based on the measured inputs. The calculated results of the two models were compared with the averaged values of the subjects to analyze their prediction performance. The results of calculated mean and local skin temperatures are shown in Figure 4 and Figure 5, respectively, where the red line represents the results of the Stolwijk model, and the blue line represents the results of the Tanabe model. Table 7 lists the root mean square error (RMSE) values between the predicted mean and local skin temperatures and the experimental data.

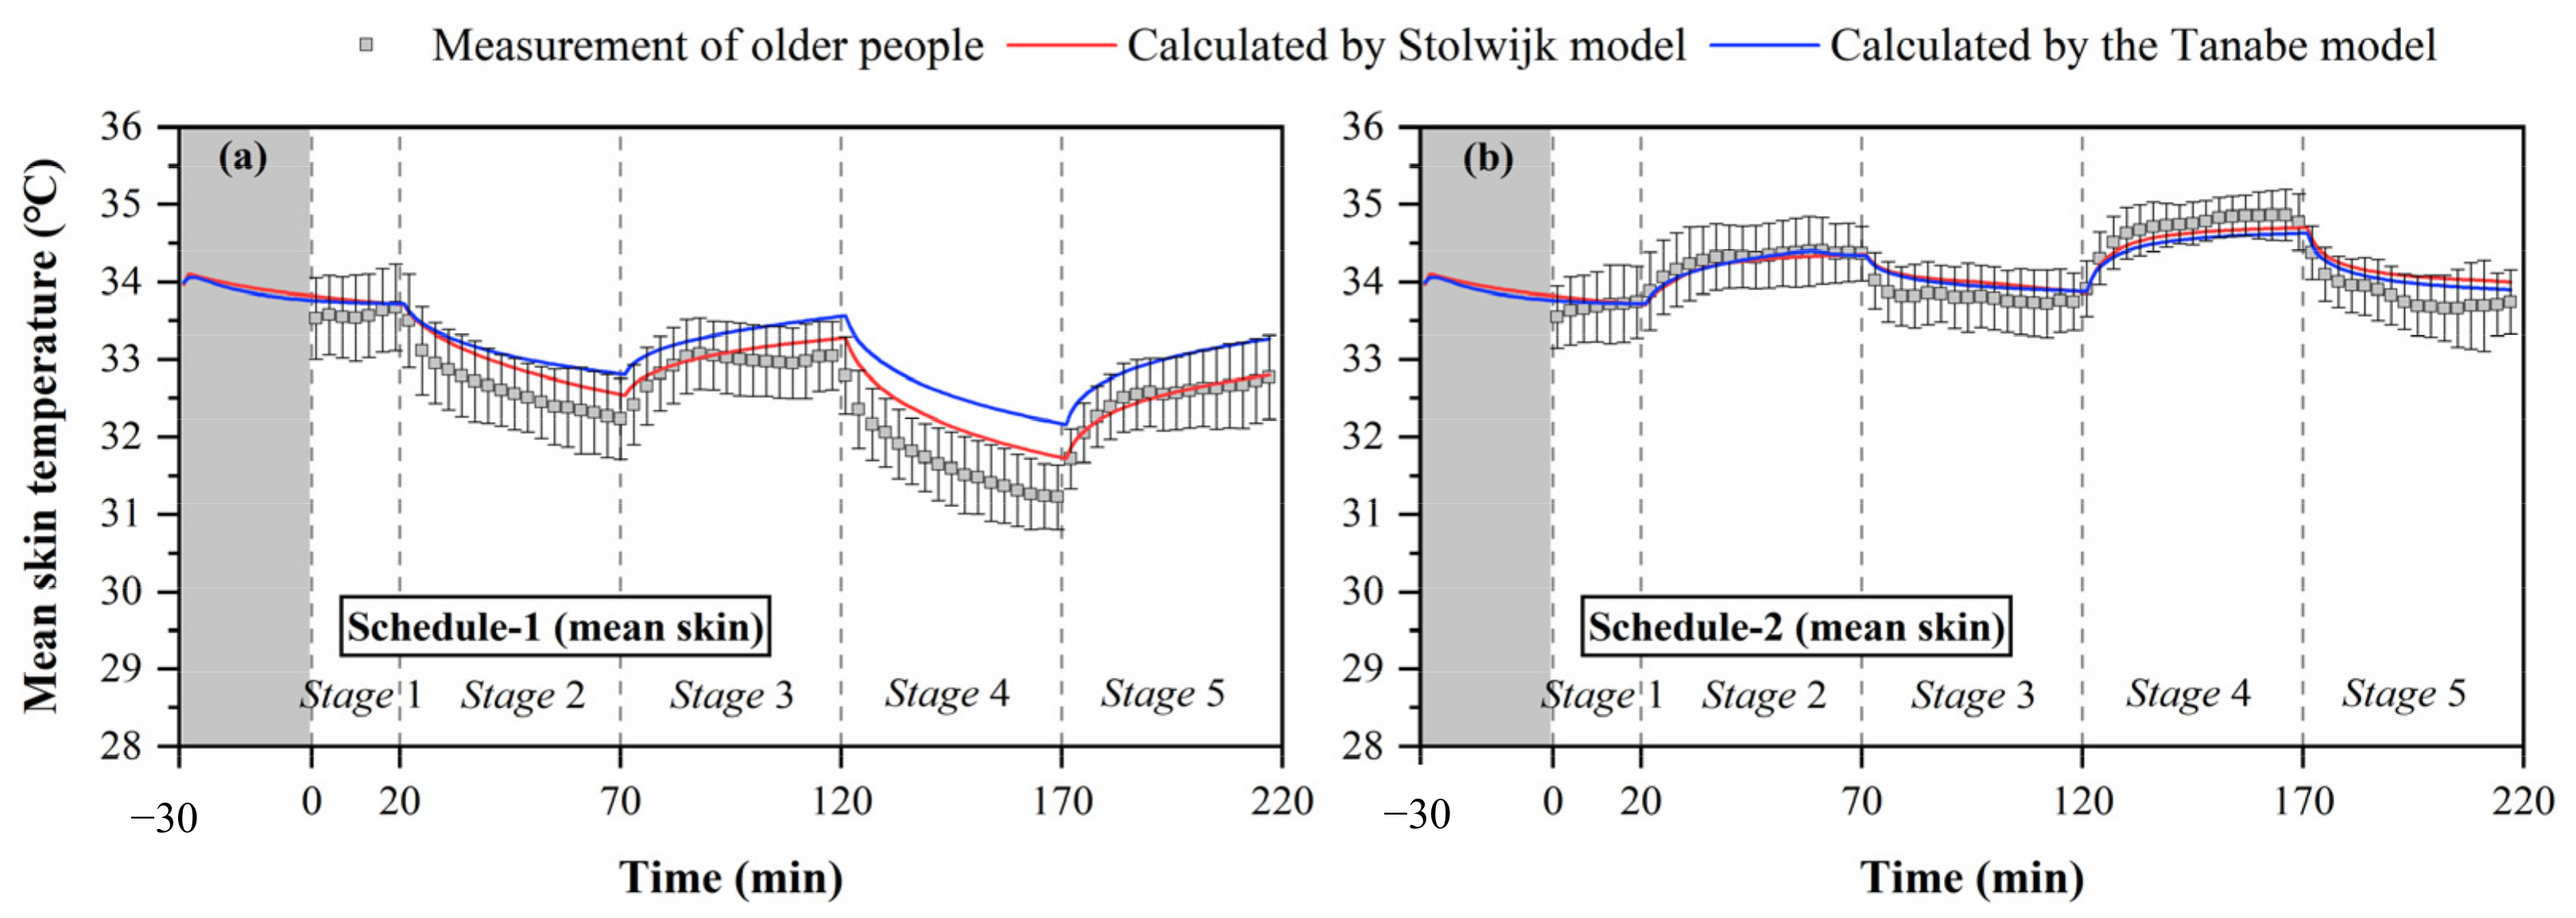
3.2.1. Validation of Prediction for Mean Skin Temperature

The comparisons between measured and predicted mean skin temperatures in Figure 4 show that the Stolwijk model and the Tanabe model both presented predictive abilities to the mean skin temperature for older people, but their performance was different between cold and hot exposures. For schedule 1, there are significant discrepancies between both calculated mean skin temperatures of the Stolwijk model and the Tanabe model and the experimental results in stage 2 (from 26 °C to 23 °C) and stage 4 (from 26 °C to 21 °C), with an RMSE of 0.3 °C for the Stolwijk model and 0.6 °C for the Tanabe model, respectively. The calculated mean skin temperatures were higher and decreased more slowly than the measured values when the subjects experienced a transient from neutral condition (26 °C) to low-temperature conditions (23/21 °C). For schedule 2, a close agreement was observed between the calculated mean skin temperatures and the experimental results, with an RMSE of 0.2 °C for both the Stolwijk model and the Tanabe model. Compared with the Stolwijk model, the Tanabe model showed more discrepancies for the prediction in low-temperature conditions, while the difference decreased in high-temperature conditions. The results show that the Stolwijk model could be reliable in the prediction of mean skin temperature for older people, and that the predictability of the Tanabe model appears to be limited during cold exposure.

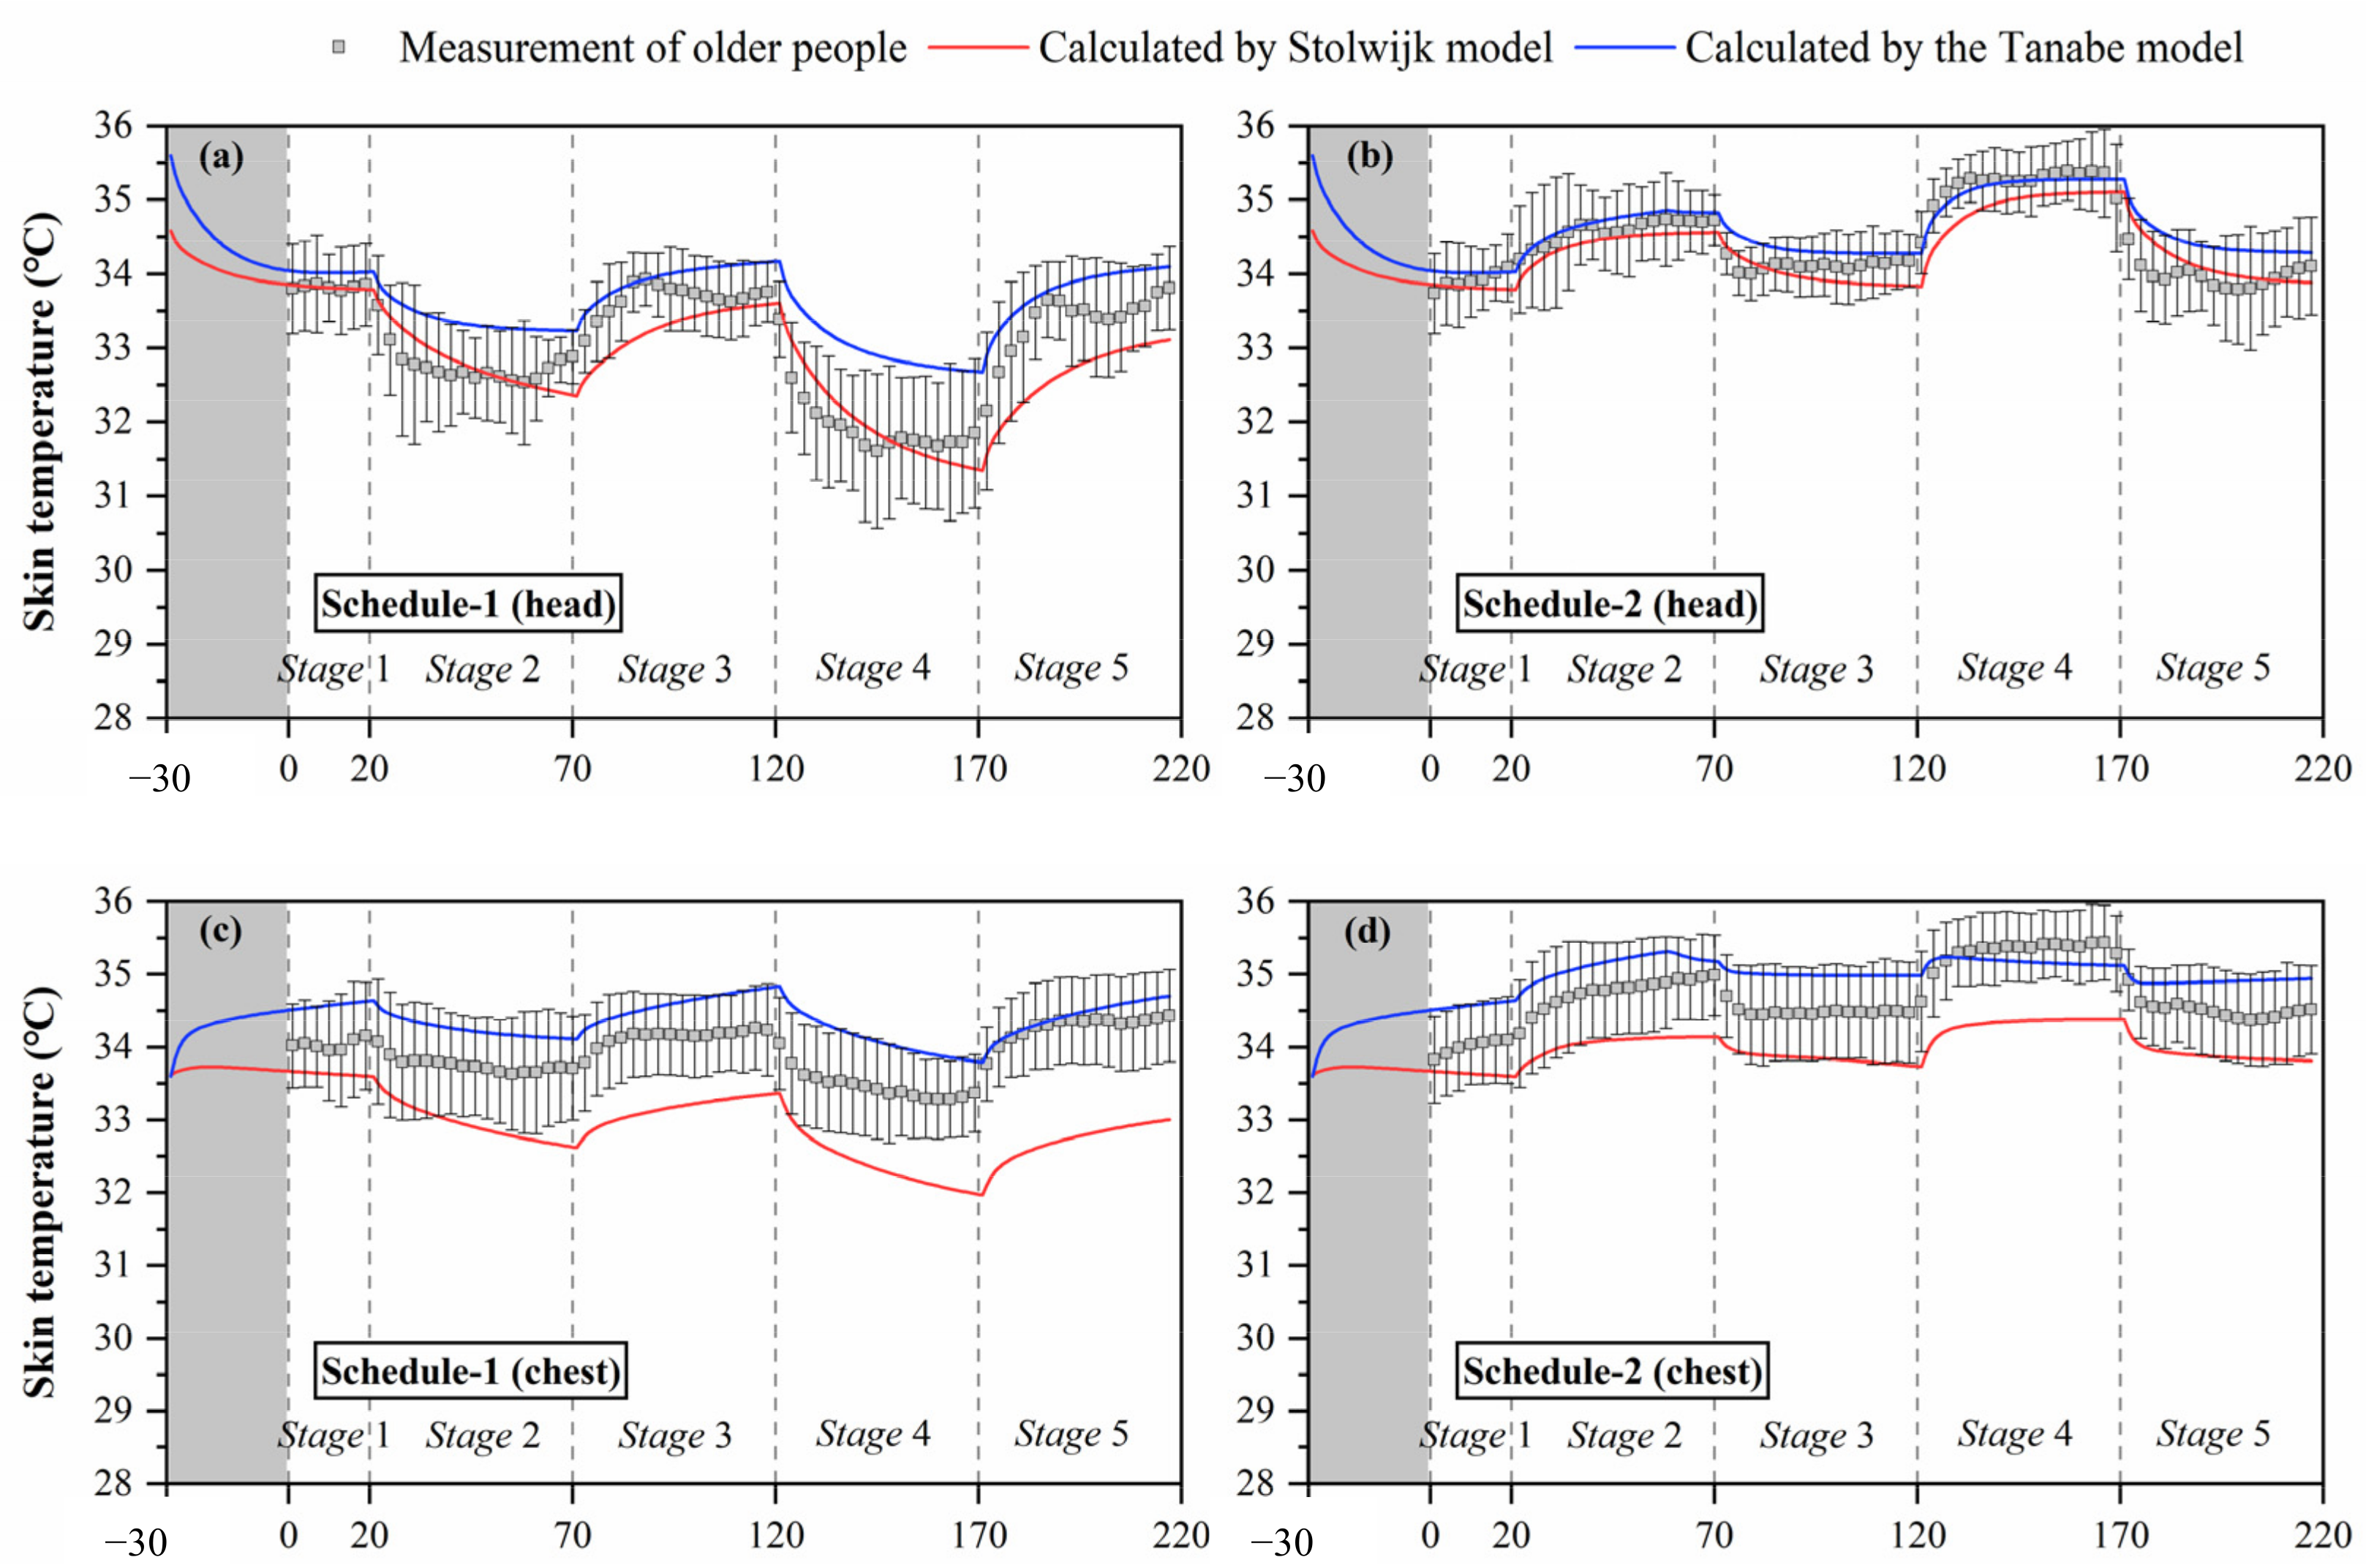
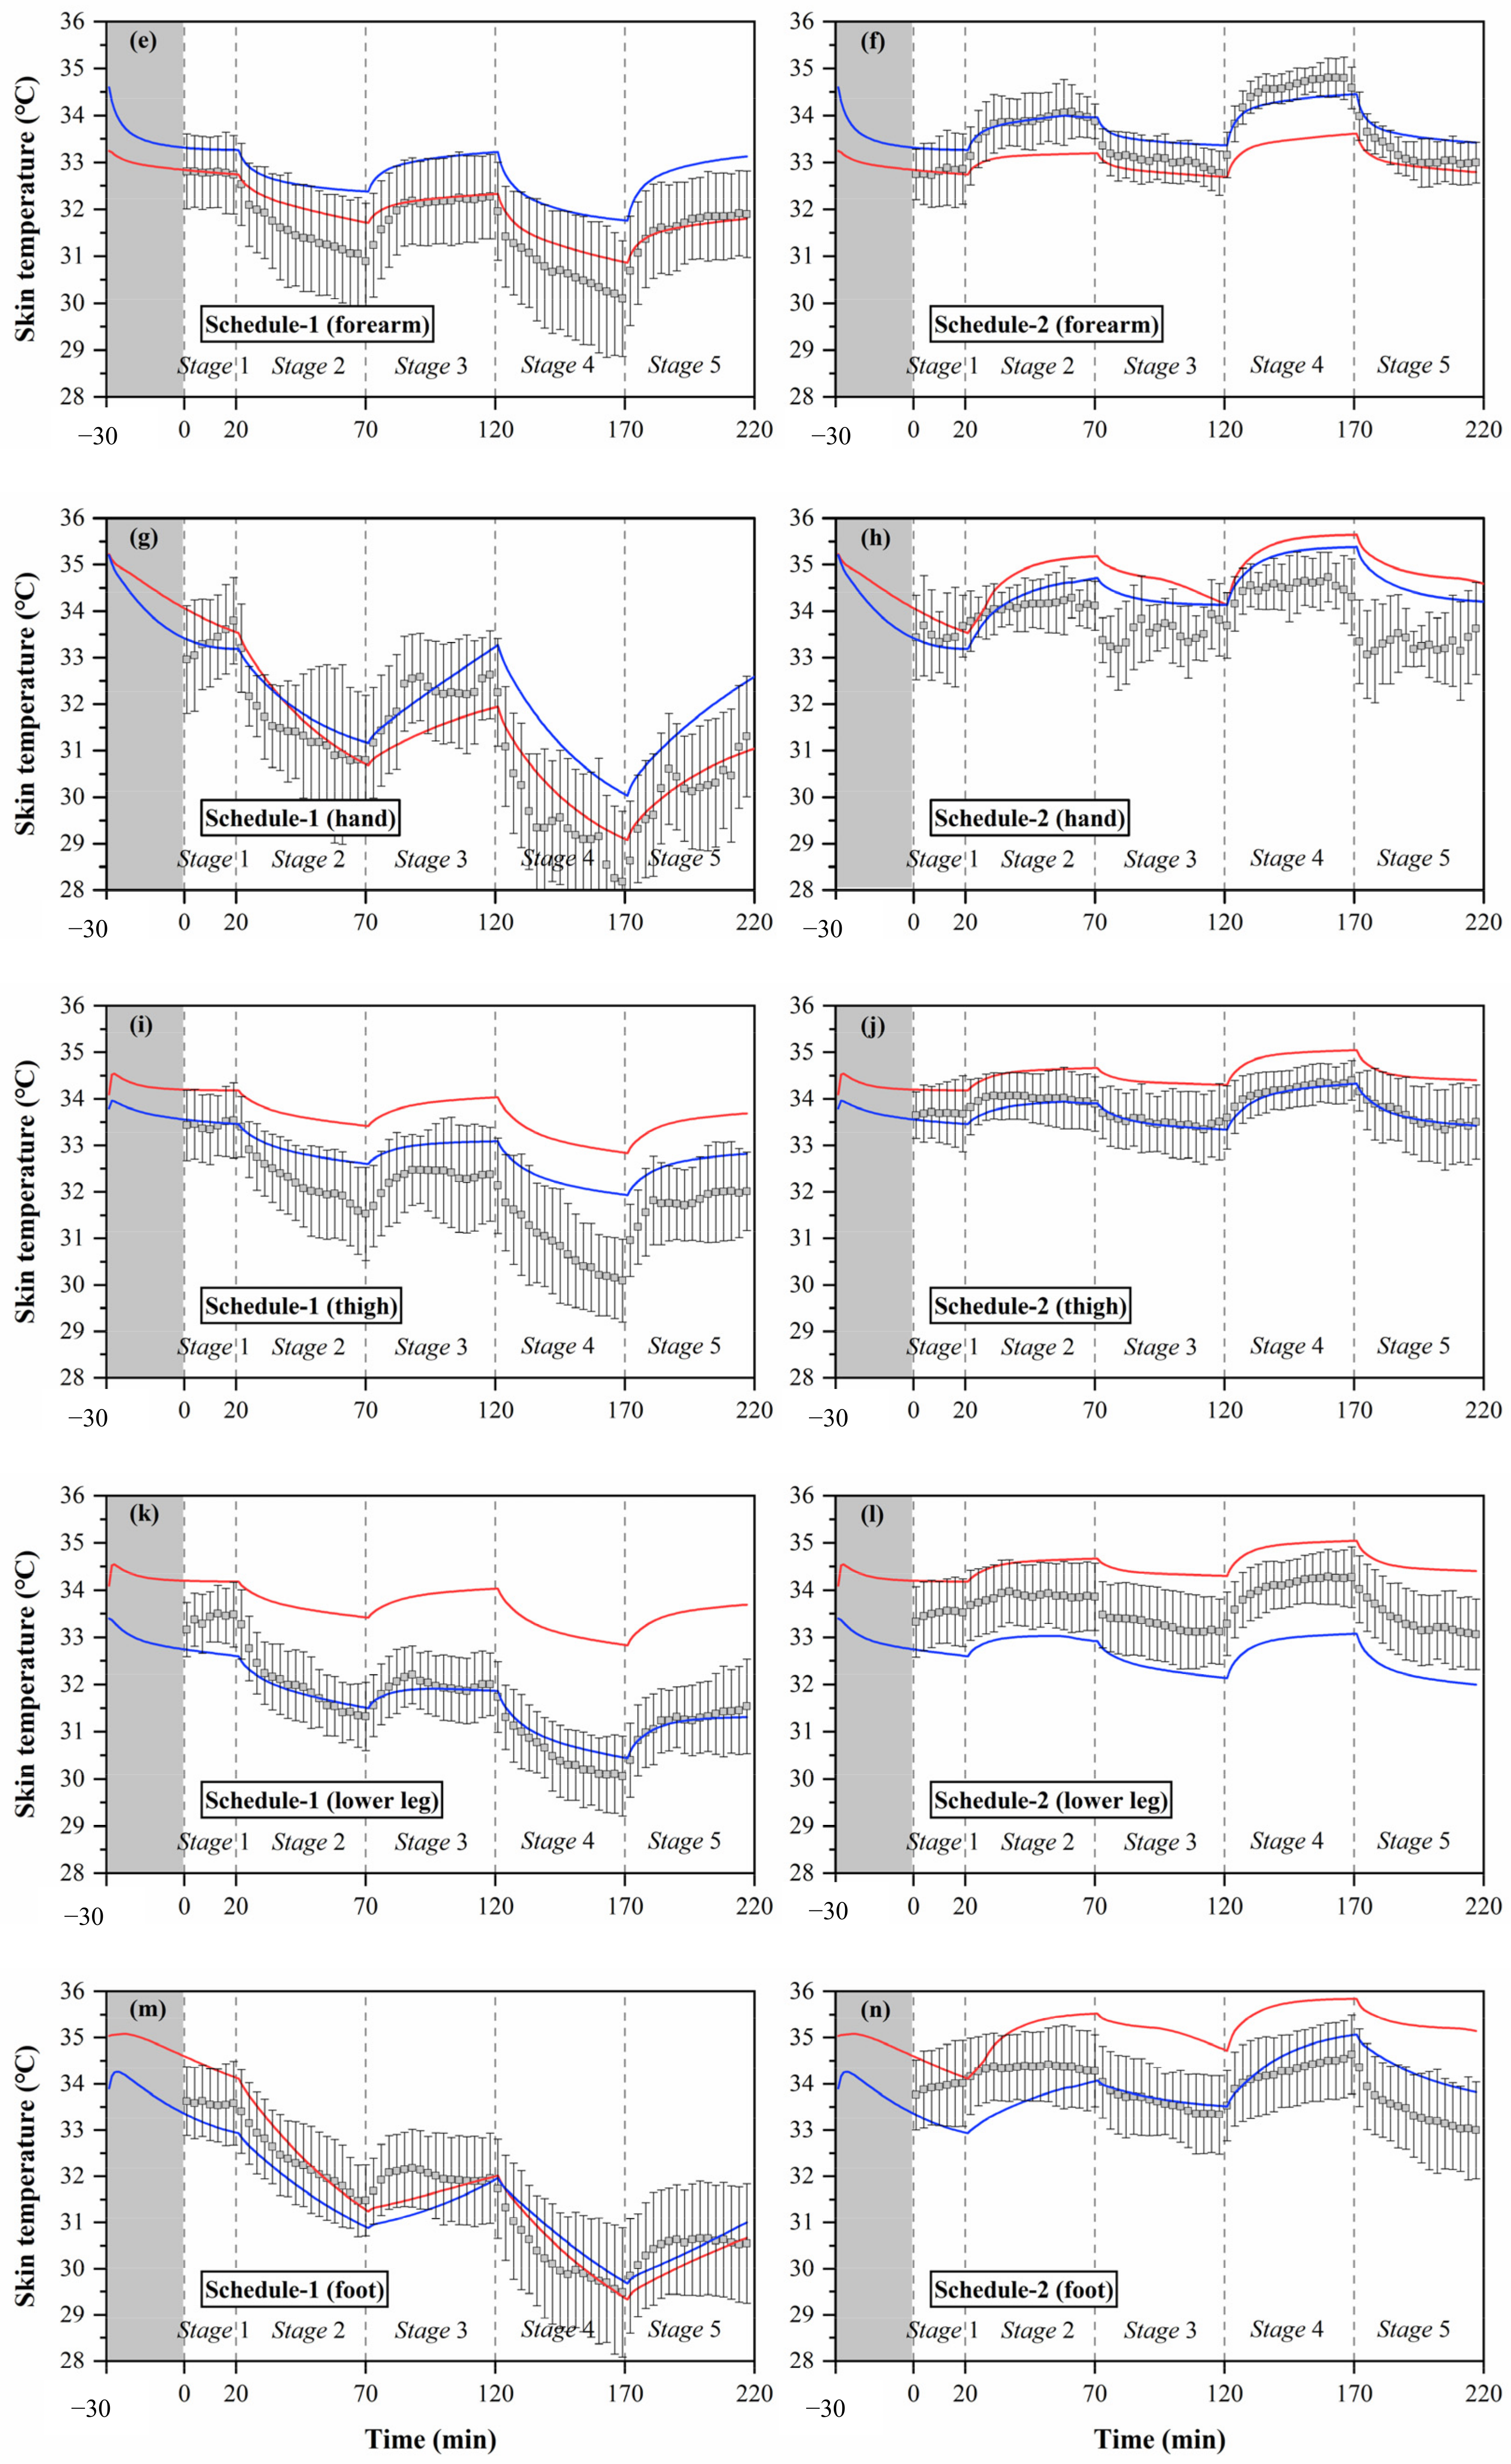
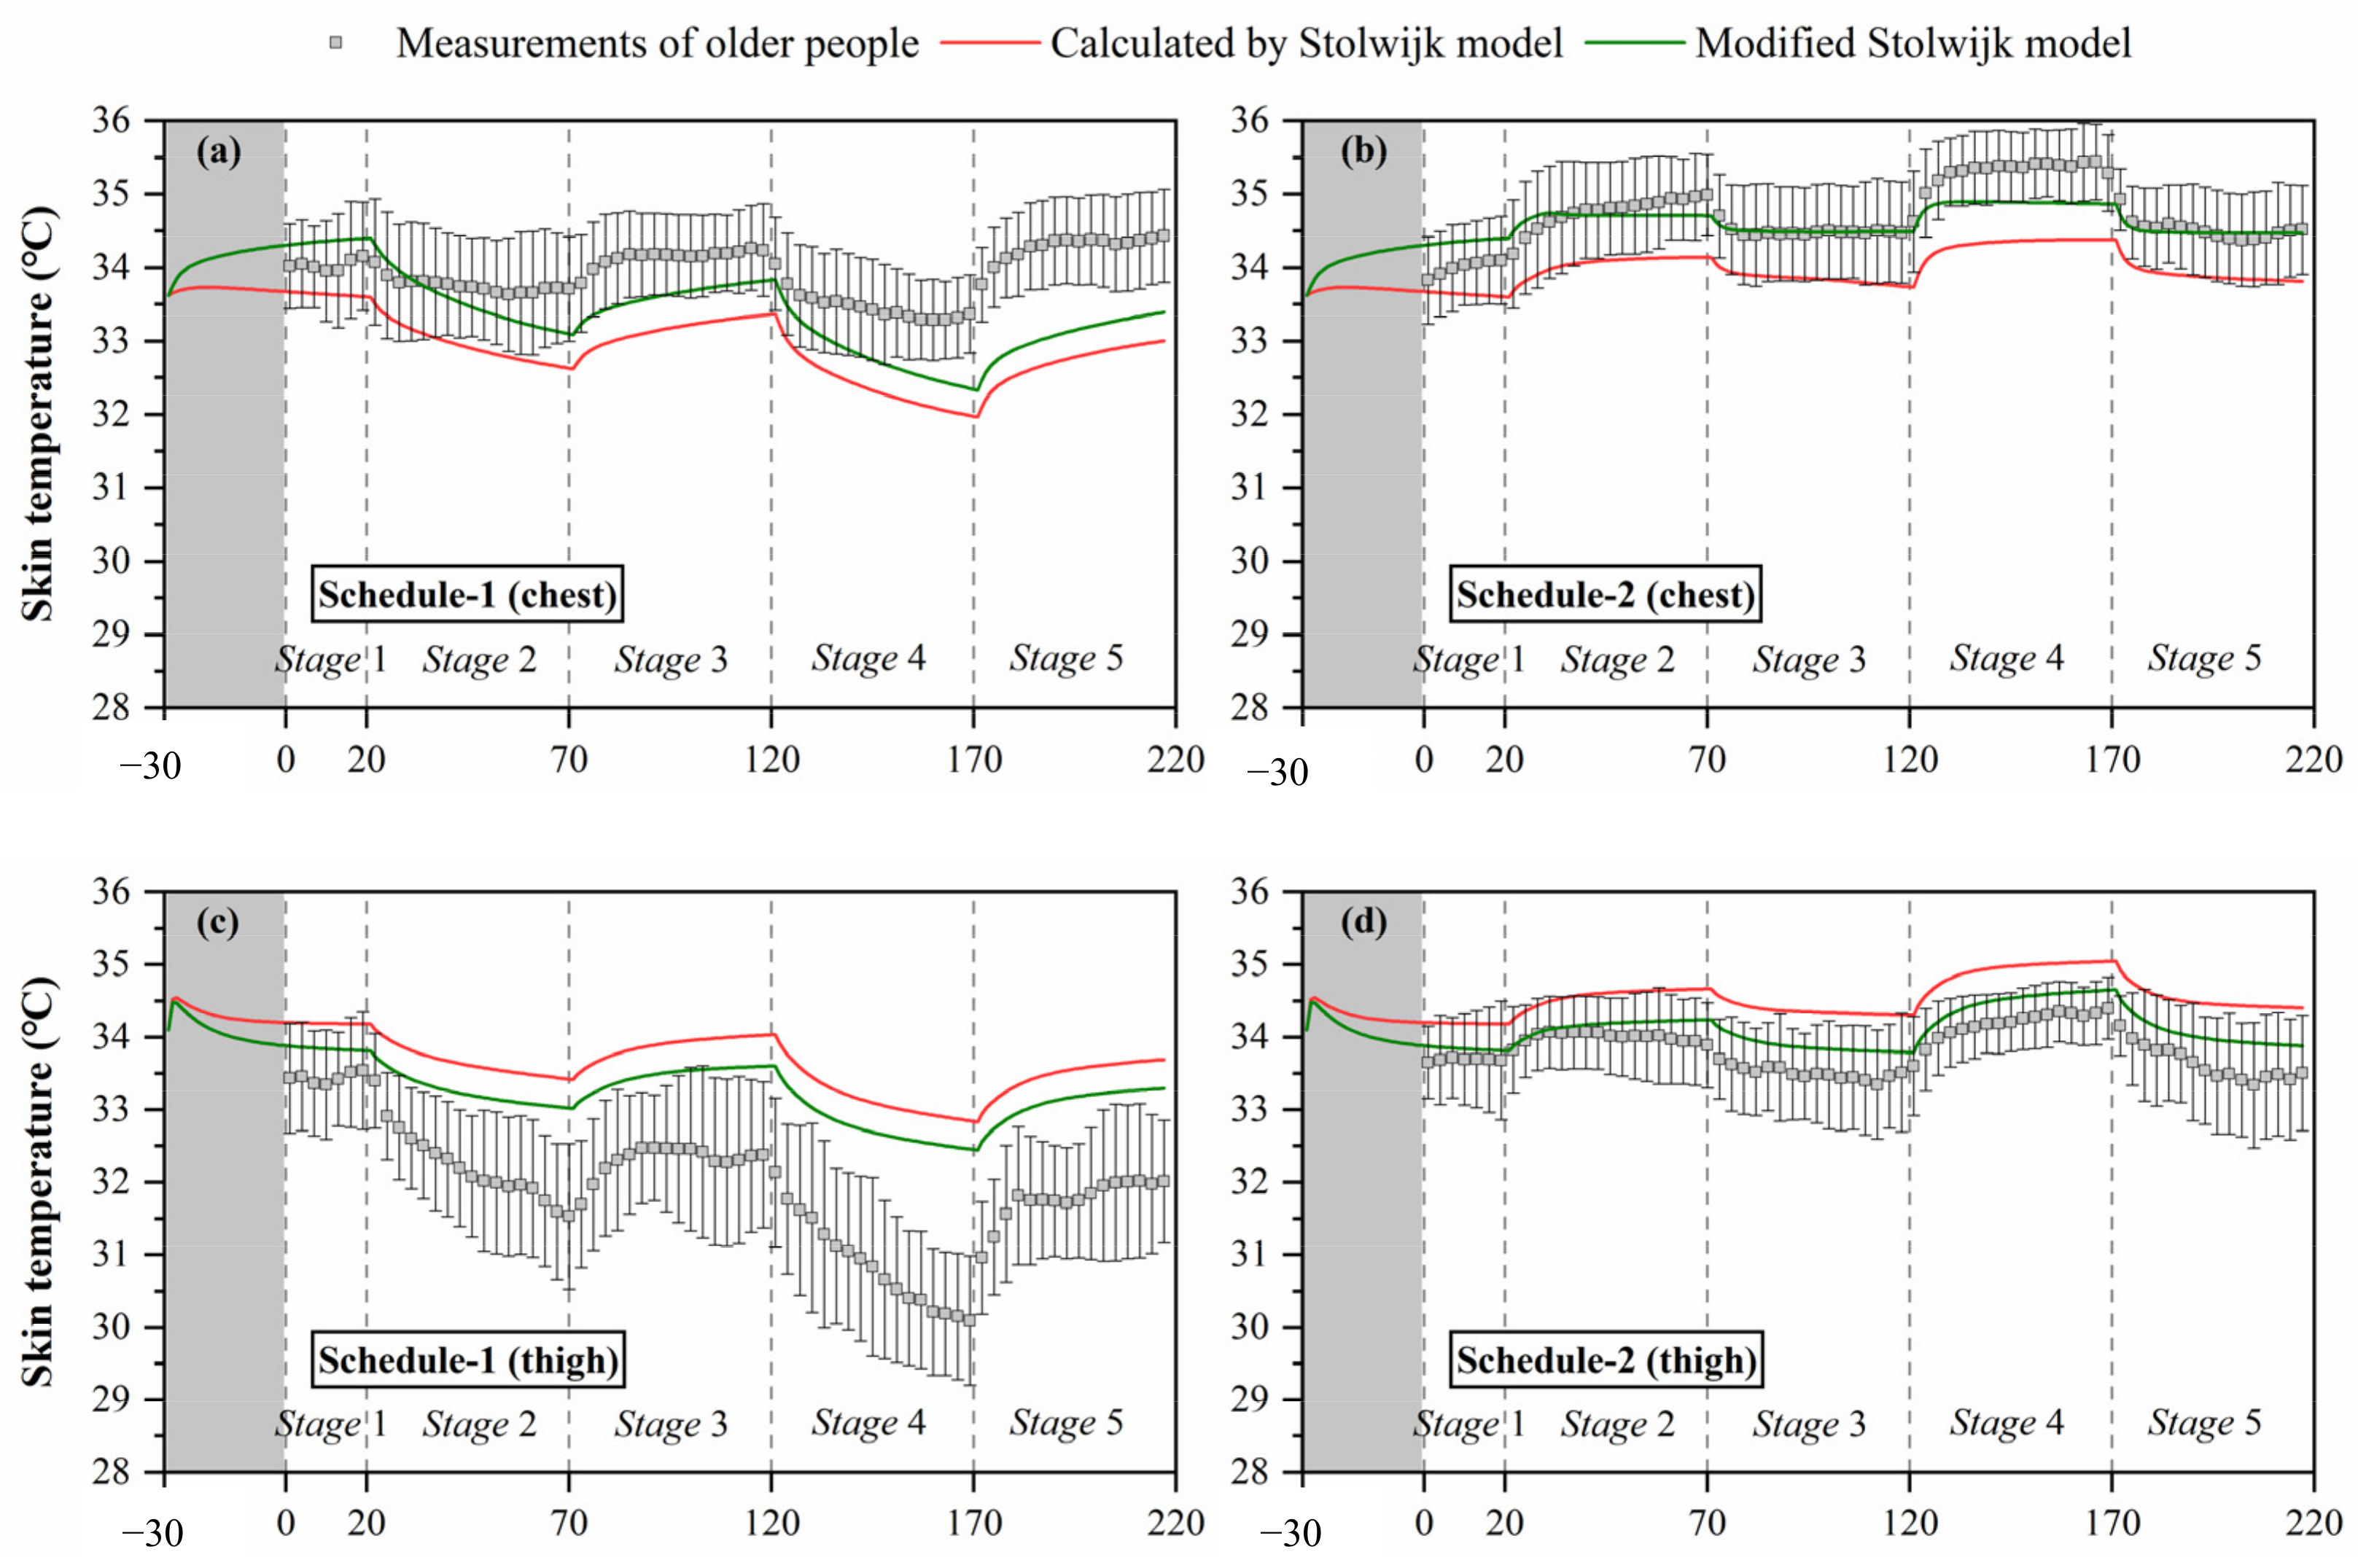
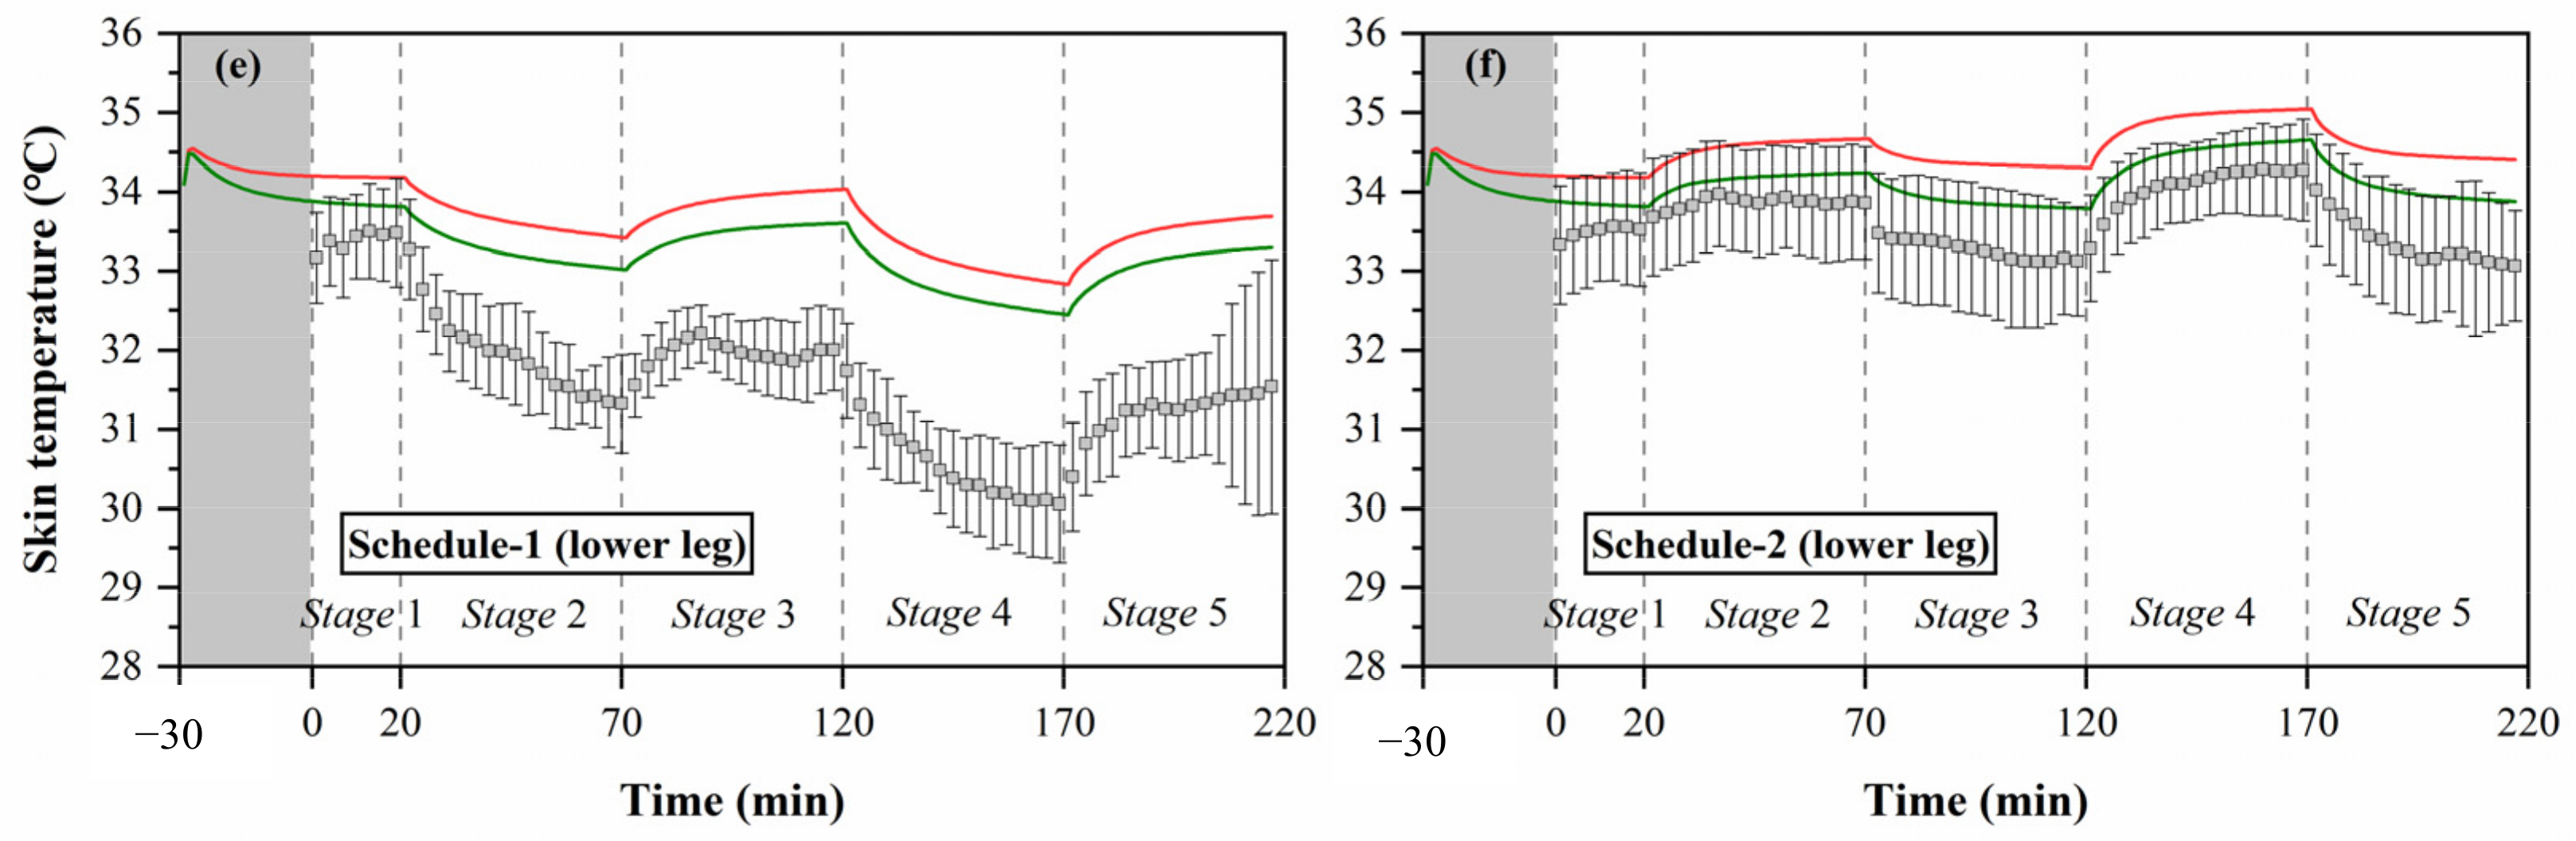
3.2.2. Validation of Prediction for Local Skin Temperature

The simulation results of local skin temperature by the two human thermoregulation models presented obvious disparities compared with the experimental data, as shown in Figure 5. The Stolwijk model underestimated the chest temperature and overestimated the temperatures of the thigh and lower leg in all experiments. For the Tanabe model, the arm skin temperature was overestimated in schedule 1, and the lower leg skin temperature was underestimated in schedule 2. Considering the RMSE values between the measured and calculated local skin temperatures shown in Table 7, for schedule 1, local skin temperatures for all body segments were predicted with an average RMSE value of 1.0 ± 0.7 °C for the Stolwijk model and 0.7 ± 0.3 °C for the Tanabe model. For schedule 2, the average RMSE value for all body segments was 0.8 ± 0.4 °C for the Stolwijk model and 0.5 ± 0.3 °C for the Tanabe model. The largest discrepancy for the Stolwijk model was found at the lower leg in schedule 1 and the foot in schedule 2, with RMSE values of 2.1 °C and 1.4 °C, respectively. For the Tanabe model, the largest discrepancy was found at the forearm in schedule 1 and at the hand in schedule 2, with RMSE values of 1.1 °C and 1.0 °C, respectively. The comparison results show that there may be some limitations for both models in predicting the local skin temperature of older people under transient conditions.

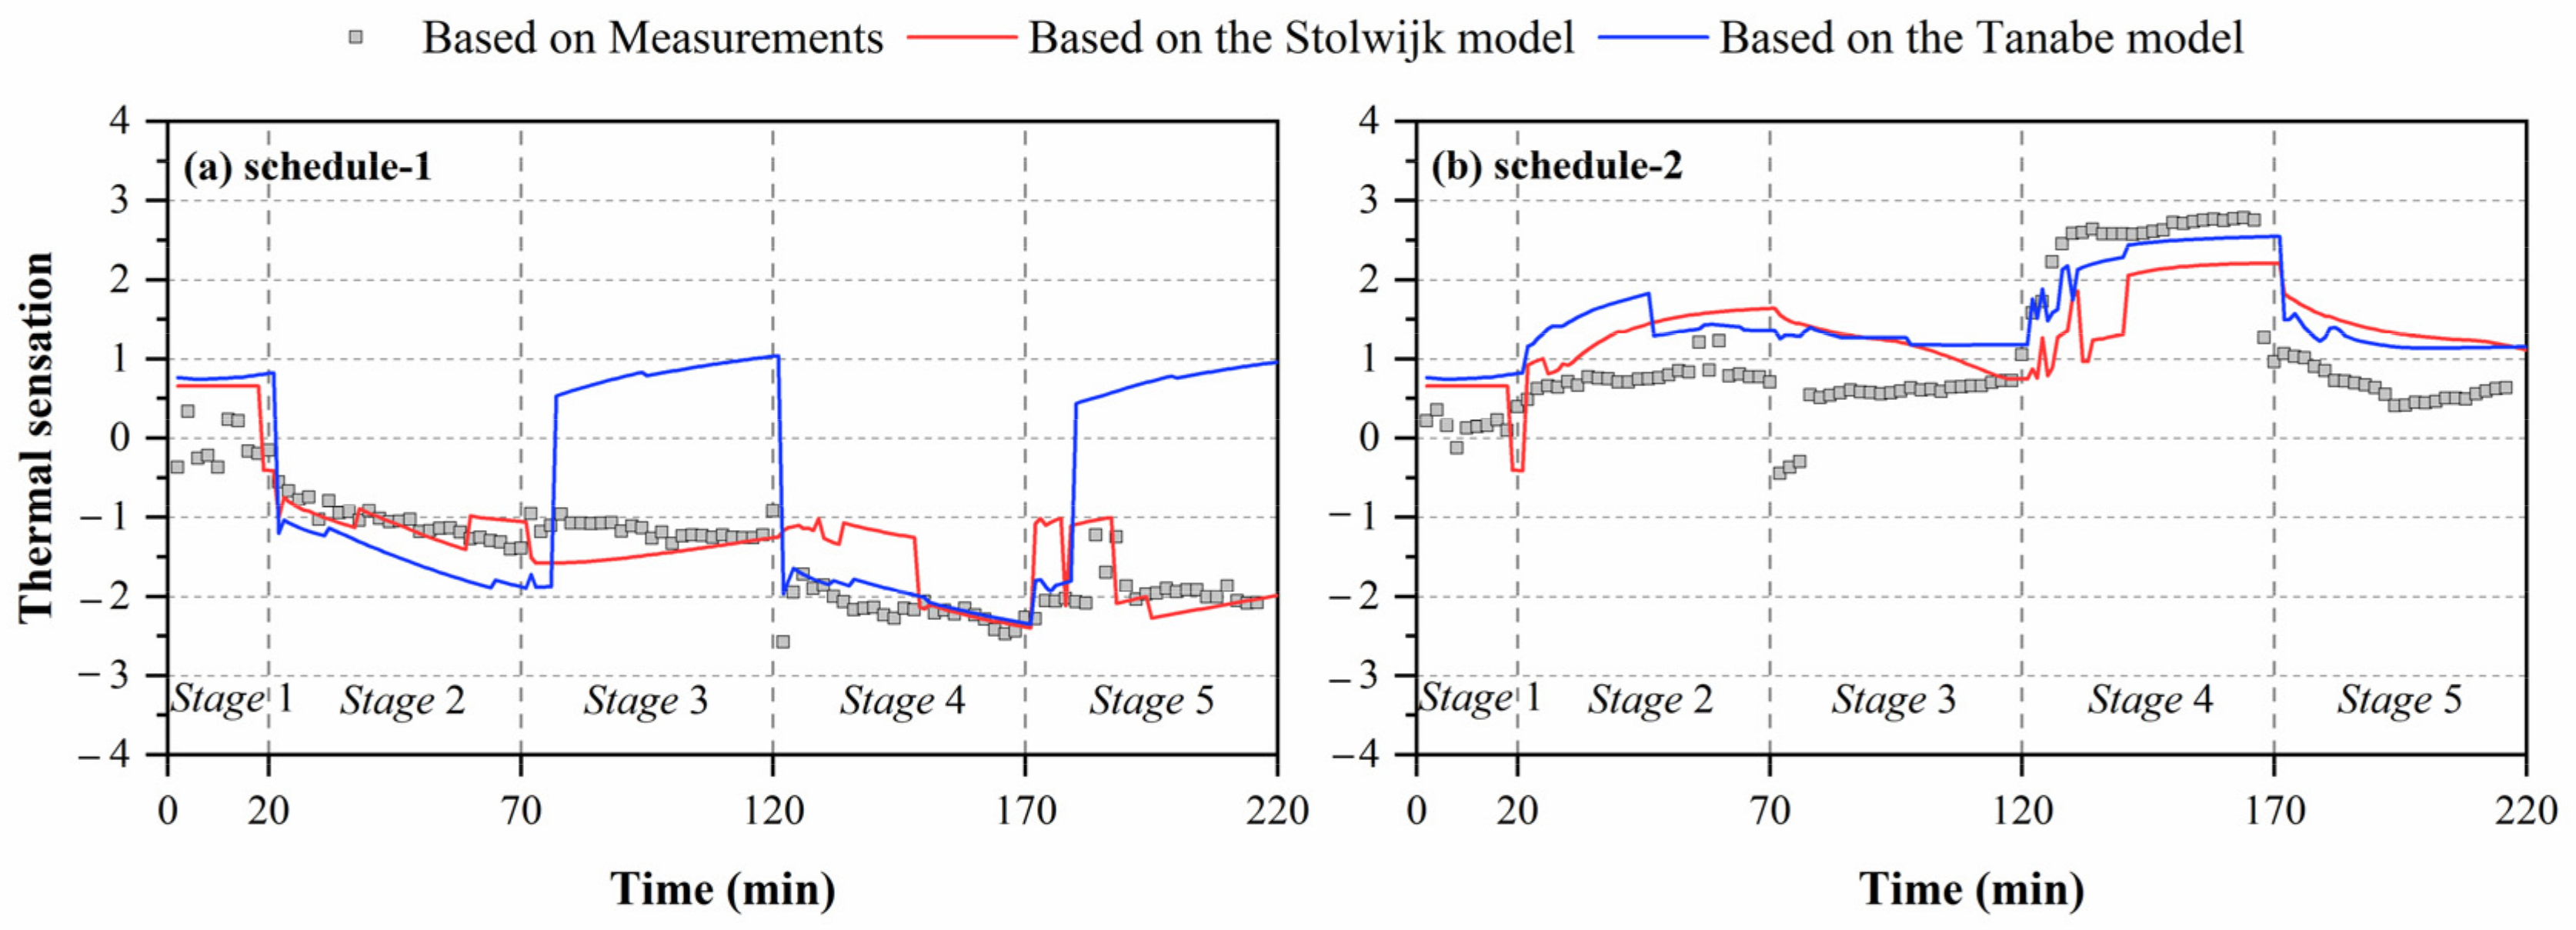
3.3. Influence of Local Skin Temperature’s Deviation on Thermal Sensation Prediction

Figure 6 shows the comparisons of thermal sensation predicted by local skin temperatures obtained from experiments and human thermoregulation models. Significant discrepancies in the calculated thermal sensation were observed in all experiments. For schedule 1, the largest deviation between thermal sensation predicted based on measured skin temperatures and the Tanabe model’s calculated results was 3.0 units in stage 5. Smaller discrepancies in thermal sensation were observed for the Stolwijk model, with an RMSE of 0.5 units. For schedule 2, the RMSE values between the thermal sensation predicted based on measured skin temperatures and calculated results of the Stolwijk model and the Tanabe model were 0.9 and 0.8 units, respectively. The largest variation for the Stolwijk model was 2.0 units in stage 2, and 1.7 units in stage 5 for the Tanabe model. The results show that the inaccurate prediction of older people’s local skin temperatures would lead to mistakes in evaluating thermal sensation.

4. Discussion

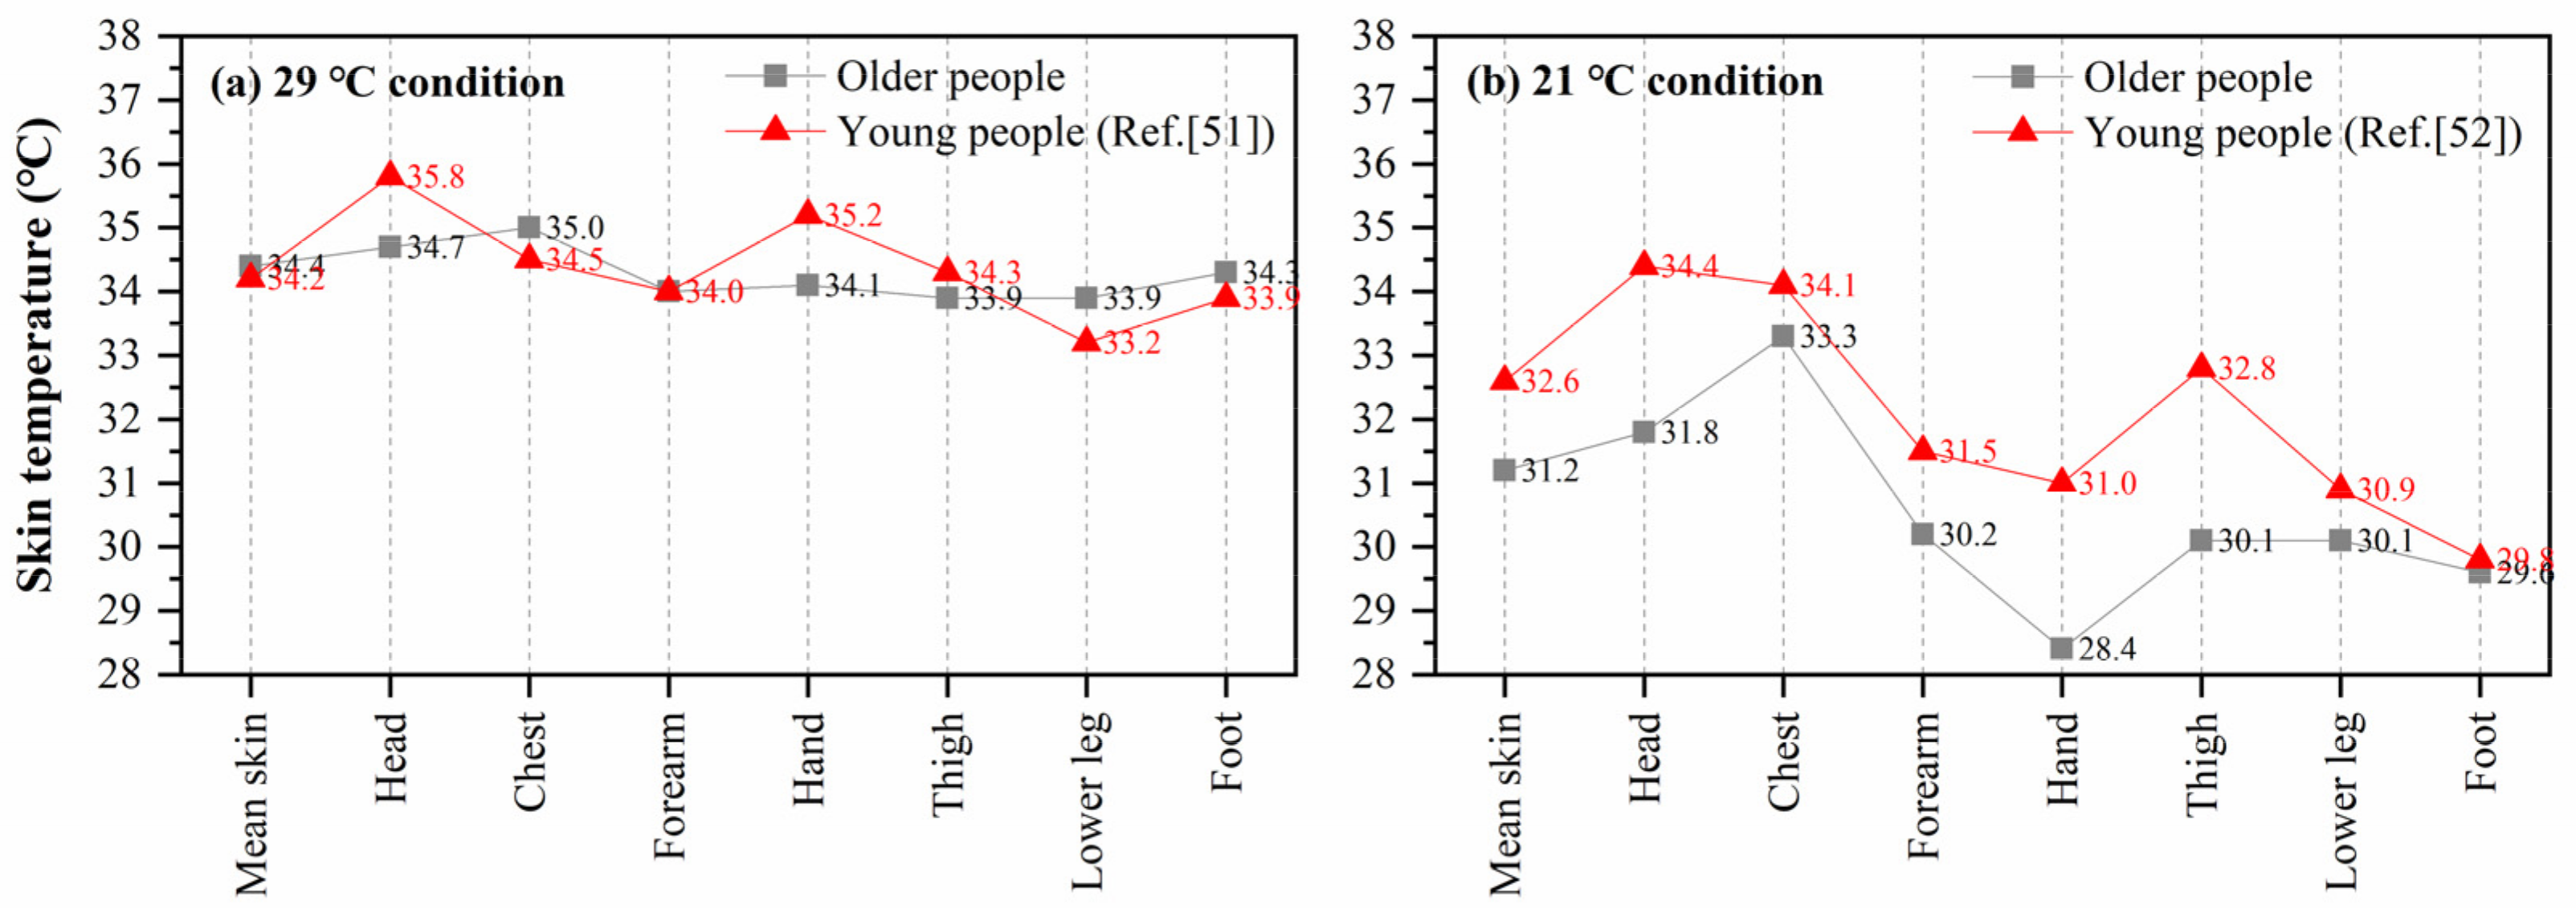
4.1. Comparisons of Local Skin Temperature Distribution Between Young and Older People

As the two thermoregulation models in this study were constructed based on young people, the prediction errors of local skin temperature may be caused by physiological differences between young and older people. Some studies have compared mean skin temperature differences between young and older people in various environments, but the results conflict. Tsuzuki and Ohfuku [49] conducted a lab experiment with 109 older people (average 72.4 years) and 100 young people (average 23.5 years), and found that the elderly subjects’ mean skin temperature was higher at a 23 °C condition and lower at a 31 °C condition than the younger subjects. Inoue et al. [50] compared the responses of nine young (average 21.7 years) and ten older (average 63.7 years) men under cold exposures (17 °C and 12 °C), and found that the older group’s mean skin temperature was significantly lower (p < 0.001) than that of the young group during cold exposure. However, the difference in local skin temperature between young and older people was rarely studied.
Some studies have reported the distribution of local skin temperature for young people in different environments, which can be compared with older people in this study. Munir et al. [51] measured the local skin temperatures of fifteen young men (22–30 years) in a warm environment (ta: 29.4 °C, RH: 46.8%, va: 0.09 m/s). Zhou [52] recruited ten healthy young men (20–33 years) and recorded their local skin temperature in a 21 °C environment after 30-min preparation and acclimation. Figure 7 shows the comparisons between the local skin temperature of older people in this study and that of young people reported in the abovementioned studies [51,52]. For the local skin temperatures of older people, the average values of the last 10 min of the two stages (29 °C and 21 °C) in schedule 1 and schedule 2 were used, when the skin temperature of the subjects had almost reached a steady state. Compared with the measured data in this study, obvious differences were found at the head and hand in high-temperature condition (29 °C). The head temperature of older people was 1.2 °C lower than that of young people, and the hand temperature was 1.1 °C lower than that of the young. The chest, lower leg, and foot skin temperatures of older people were slightly higher than those of the young, which may be due to the effect of clothing. In Munir’s experiment, all subjects wore only trunks (undershorts). In 21 °C condition, the discrepancies in local skin temperatures between young and older people were more significant. The young people’s head, arm, hand, and thigh temperatures were 1.0 °C higher than those of older people. The above comparisons indicate that there may be differences in the distribution of local skin temperature between young and older people, especially under cold exposure.

4.2. Improvement of the Human Thermoregulation Model for Older People

In this section, using the Stolwijk model as an example, the method to reduce the deviations between measured and calculated local skin temperatures is discussed. The validation results show that the Stolwijk model underestimated the chest temperature and overestimated the thigh and lower leg temperatures in all experiments, which may be improved by modifying the basal skin blood flow [51]. Increasing the skin blood flow of these segments would lead to more heat transfer from the blood to the skin, thereby increasing skin temperature. Thus, the prediction of the Stolwijk model could be improved by increasing the basal skin blood flow value at the trunk and decreasing the basal skin blood flow value at the legs. The above improvement method is supported by the values proposed in the Tanabe model [31], where the basal skin blood flow is higher for the trunk and lower for the legs than the values proposed in the Stolwijk model. The comparison of the basal skin blood flow rate between the two models is presented in Table 8.
Based on the above analysis, to improve the predictive accuracy of the Stolwijk model for older people, we modified the basal skin blood flow of the trunk and legs using the values of the Tanabe model, and maintained the basal skin blood flow of other segments unchanged. The calculated results of chest, thigh and lower leg temperatures with modification in the skin basal blood flow are shown in Figure 8. The predictions of chest, thigh, and lower leg skin temperatures were improved significantly in all experiments. Table 9 lists the RMSE for the modified Stolwijk model. The average RMSE value for all body segments decreased from for 1.0 ± 0.7 °C to 0.9 ± 0.5 °C for schedule 1, and from 0.8 ± 0.4 °C to 0.7 ± 0.5 °C for schedule 2. The results show that the modification in basal skin blood rate is valid to improve the prediction.

4.3. Limitations and Future Studies

(1)
The environmental parameters were measured only at one height. The environmental uniformity at different heights around the subjects needs further verification, and the difference in the environmental inputs to various body segments of the thermoregulation models needs to be further considered.
(2)
The input of the metabolic rate value was not measured in this study. The metabolic rate value is a key factor in the calculation of human thermoregulation models, and the determination of metabolic rate in the elderly deserves further study.
(3)
There was a lack of comparative experiments for young people, which makes it difficult to analyze the causes of deviation between predicted and measured skin temperatures. Thus, the reference sample of young people deserves further study.

5. Conclusions

This study provides an evaluation of the human thermoregulation models proposed by Stolwijk and Tanabe in predicting the mean and local skin temperatures of older people in transient environments, based on two series of experiments on eighteen older people. It is concluded that the mean skin temperatures predicted by the Stolwijk model and the Tanabe model for older people were in good agreement with the measured values under neutral and high-temperature conditions. However, both models overestimated the mean skin temperature of older people after transitioning from thermally neutral to low-temperature conditions. Deviations increased for predictions of local skin temperature at most body segments in all experiments. Additionally, the differences between measured and simulated local skin temperatures could lead to significant discrepancies in the predicted thermal sensation based on the UCB thermal sensation model. As presented in the discussion, the bias in the prediction of local skin temperature for older people may have two causes: the physiological differences between young and older people, and the design limitations of the thermoregulation models. Based on the characteristics of the Stolwijk model and the Tanabe model applied in older people, this study can help better design the thermoregulation models for older people, which has important benefits in creating an age-friendly indoor environment.

Author Contributions

Conceptualization, Y.T.; Funding acquisition, H.Y.; Methodology, Y.T. and Z.W.; Project administration, H.Y.; Supervision, H.Y.; Visualization, Y.T.; Writing—original draft, Y.T.; Writing—review & editing, Z.W., M.L. and C.L. All authors have read and agreed to the published version of the manuscript.

Funding

This research was supported by the Project of National Natural Science Foundation of China (No. 52078355 and No. 51578386).

Acknowledgments

The authors would like to acknowledge the kind participation of the volunteers.

Conflicts of Interest

The authors declare no conflict of interest.

References

  1. U.N. Department of Economic and Social Affairs. World Population Prospects; United Nations: New York, NY, USA, 2020. [Google Scholar]
  2. Waller, J.M.; Maibach, H.I. Age and skin structure and function, a quantitative approach (I): Blood flow, pH, thickness, and ultrasound echogenicity. Skin Res. Technol. 2005, 11, 221–235. [Google Scholar] [CrossRef] [PubMed]
  3. Anderson, G.S.; Meneilly, G.S.; Mekjavic, I.B. Passive temperature lability in the elderly. Eur. J. Appl. Physiol. 1996, 73, 278–286. [Google Scholar] [CrossRef] [PubMed]
  4. Yochihara, Y.; Ohnaka, T.; Nagai, Y.; Tokuda, T.; Kawashima, Y. Physiological responses and thermal sensations of the elderly in cold and hot environments. J. Therm. Biol. 1993, 18, 355–361. [Google Scholar] [CrossRef]
  5. Collins, K.J.; Exton-Smith, A.N.; Dore, C. Urban hypothermia: Preferred temperature and thermal perception in old age. Br. Med. J. (Clin. Res. Ed.) 1981, 282, 175–177. [Google Scholar] [CrossRef] [PubMed] [Green Version]
  6. Vandentorren, S.; Bretin, P.; Zeghnoun, A.; Mandereau-Bruno, L.; Croisier, A.; Cochet, C.; Ribéron, J.; Siberan, I.; Declercq, B.; Ledrans, M. August 2003 heat wave in France: Risk factors for death of elderly people living at home. Eur. J. Public Health 2006, 16, 583–591. [Google Scholar] [CrossRef] [PubMed] [Green Version]
  7. Hajat, S.; Bird, W.; Haines, A. Cold weather and GP consultations for respiratory conditions by elderly people in 16 locations in the UK. Eur. J. Epidemiol. 2004, 19, 959–968. [Google Scholar] [CrossRef]
  8. Van Hoof, J.; Schellen, L.; Soebarto, V.; Wong, J.K.W.; Kazak, J.K. Ten questions concerning thermal comfort and ageing. Build. Environ. 2017, 120, 123–133. [Google Scholar] [CrossRef]
  9. Giamalaki, M.; Kolokotsa, D. Understanding the thermal experience of elderly people in their residences: Study on thermal comfort and adaptive behaviors of senior citizens in Crete, Greece. Energy Build. 2019, 185, 76–87. [Google Scholar] [CrossRef]
  10. Jiao, Y.; Yu, H.; Yu, Y.; Wang, Z.; Wei, Q. Adaptive thermal comfort models for homes for older people in Shanghai, China. Energy Build. 2020, 215, 109918. [Google Scholar] [CrossRef]
  11. Cheng, Y.; Niu, J.; Gao, N. Thermal comfort models: A review and numerical investigation. Build. Environ. 2012, 47, 13–22. [Google Scholar] [CrossRef]
  12. Enescu, D. Models and Indicators to Assess Thermal Sensation Under Steady-State and Transient Conditions. Energies 2019, 12, 841. [Google Scholar] [CrossRef] [Green Version]
  13. Charny, C.K. Mathematical models of bioheat transfer. In Advances in Heat Transfer; Cho, Y.I., Ed.; Elsevier: Amsterdam, The Netherlands, 1992; Volume 22, pp. 19–155. [Google Scholar]
  14. Fu, M.; Weng, W.; Chen, W.; Luo, N. Review on modeling heat transfer and thermoregulatory responses in human body. J. Therm. Biol. 2016, 62, 189–200. [Google Scholar] [CrossRef] [PubMed]
  15. Katić, K.; Li, R.; Zeiler, W. Thermophysiological models and their applications: A review. Build. Environ. 2016, 106, 286–300. [Google Scholar] [CrossRef] [Green Version]
  16. Zhang, H.; Arens, E.; Huizenga, C.; Han, T. Thermal sensation and comfort models for non-uniform and transient environments: Part I: Local sensation of individual body parts. Build. Environ. 2010, 45, 380–388. [Google Scholar] [CrossRef] [Green Version]
  17. Zhang, H.; Arens, E.; Huizenga, C.; Han, T. Thermal sensation and comfort models for non-uniform and transient environments, part II: Local comfort of individual body parts. Build. Environ. 2010, 45, 389–398. [Google Scholar] [CrossRef] [Green Version]
  18. Zhang, H.; Arens, E.; Huizenga, C.; Han, T. Thermal sensation and comfort models for non-uniform and transient environments, part III: Whole-body sensation and comfort. Build. Environ. 2010, 45, 399–410. [Google Scholar] [CrossRef] [Green Version]
  19. Lan, L.; Xia, L.; Tang, J.; Wyon, D.P.; Liu, H. Mean skin temperature estimated from 3 measuring points can predict sleeping thermal sensation. Build. Environ. 2019, 162, 106292. [Google Scholar] [CrossRef]
  20. Liu, K.; Nie, T.; Liu, W.; Liu, Y.; Lai, D. A machine learning approach to predict outdoor thermal comfort using local skin temperatures. Sustain. Cities Soc. 2020, 59, 102216. [Google Scholar] [CrossRef]
  21. Liu, S.; Schiavon, S.; Das, H.P.; Jin, M.; Spanos, C.J. Personal thermal comfort models with wearable sensors. Build. Environ. 2019, 162, 106281. [Google Scholar] [CrossRef] [Green Version]
  22. Tejedor, B.; Casals, M.; Gangolells, M.; Macarulla, M.; Forcada, N. Human comfort modelling for elderly people by infrared thermography: Evaluating the thermoregulation system responses in an indoor environment during winter. Build. Environ. 2020, 186, 107354. [Google Scholar] [CrossRef]
  23. Wang, Z.; Yu, H.; Luo, M.; Wang, Z.; Zhang, H.; Jiao, Y. Predicting older people’s thermal sensation in building environment through a machine learning approach: Modelling, interpretation, and application. Build. Environ. 2019, 161, 106231. [Google Scholar] [CrossRef] [Green Version]
  24. Wu, Y.; Liu, H.; Li, B.; Kosonen, R.; Kong, D.; Zhou, S.; Yao, R. Thermal adaptation of the elderly during summer in a hot humid area: Psychological, behavioral, and physiological responses. Energy Build. 2019, 203, 109450. [Google Scholar] [CrossRef]
  25. Schellen, L.; Loomans, M.G.L.C.; Kingma, B.R.M.; de Wit, M.H.; Frijns, A.J.H.; van Marken Lichtenbelt, W.D. The use of a thermophysiological model in the built environment to predict thermal sensation: Coupling with the indoor environment and thermal sensation. Build. Environ. 2013, 59, 10–22. [Google Scholar] [CrossRef]
  26. Pokorny, J.; Jicha, M. Coupling of the models of human physiology and thermal comfort. EPJ Web Conf. 2013, 45, 01077. [Google Scholar] [CrossRef] [Green Version]
  27. Wang, Z.; Yu, H.; Zhou, X. Coupling a 65-node thermoregulation model and a data-driven thermal sensation model to forecast Chinese elderly’s thermal sensation in Buildings. In Proceedings of the 16th Conference of the International Society of Indoor Air Quality & Climate (Indoor Air 2020), Seoul, Korea, 1 November 2002. [Google Scholar]
  28. Veselá, S.; Kingma, B.R.M.; Frijns, A.J.H. Local thermal sensation modeling—A review on the necessity and availability of local clothing properties and local metabolic heat production. Indoor Air 2017, 27, 261–272. [Google Scholar]
  29. Stolwijk, J.A.J. A Mathematical Model of Physiological Temperature Regulation in Man; NASA: Washington, DC, USA, 1971.
  30. Tanabe, S.-I.; Nakano, J.; Kobayashi, K. Development of 65-node thermoregulation-model for evaluation of thermal environment. J. Archit. Plan. Environ. Eng. 2001, 541, 9–16. [Google Scholar]
  31. Tanabe, S.; Kobayashi, K.; Nakano, J.; Ozeki, Y.; Konishi, M. Evaluation of thermal comfort using combined multi-node thermoregulation (65MN) and radiation models and computational fluid dynamics (CFD). Energy Build. 2002, 34, 637–646. [Google Scholar] [CrossRef] [Green Version]
  32. Fiala, D. Dynamic Simulation of Human Heat Transfer and Thermal Comfort. Ph.D. Thesis, De Montfort University, Leicester, UK, 1998. [Google Scholar]
  33. Fiala, D.; Lomas, K.J.; Stohrer, M. A computer model of human thermoregulation for a wide range of environmental conditions: The passive system. J. Appl. Physiol. (1985) 1999, 87, 1957–1972. [Google Scholar] [CrossRef]
  34. Fiala, D.; Lomas, K.J.; Stohrer, M. Computer prediction of human thermoregulatory and temperature responses to a wide range of environmental conditions. Int. J. Biometeorol. 2001, 45, 143–159. [Google Scholar] [CrossRef]
  35. Huizenga, C.; Zhang, H.; Arens, E. A model of human physiology and comfort for assessing complex thermal environments. Build. Environ. 2001, 36, 691–699. [Google Scholar] [CrossRef] [Green Version]
  36. Zhang, H.; Huizenga, C.; Arens, E.; Yu, T. Considering individual physiological differences in a human thermal model. J. Therm. Biol. 2001, 26, 401–408. [Google Scholar] [CrossRef] [Green Version]
  37. Novieto, D.T. Adapting a human thermoregulation model for predicting the thermal response of older persons. Prog. Brain Res. 2013, 204, 169–190. [Google Scholar]
  38. Rida, M.; Ghaddar, N.; Ghali, K.; Hoballah, J. Elderly bioheat modeling: Changes in physiology, thermoregulation, and blood flow circulation. Int. J. Biometeorol. 2014, 58, 1825–1843. [Google Scholar] [CrossRef]
  39. Hirata, A.; Nomura, T.; Laakso, I. Computational estimation of body temperature and sweating in the aged during passive heat exposure. Int. J. Therm. Sci. 2015, 89, 154–163. [Google Scholar] [CrossRef]
  40. Wang, Z.; Yu, H.; Jiao, Y.; Chu, X.; Luo, M. Chinese older people’s subjective and physiological responses to moderate cold and warm temperature steps. Build. Environ. 2019, 149, 526–536. [Google Scholar] [CrossRef] [Green Version]
  41. Hardy, J.D.; Du Bois, E.F. The technic of measuring radiation and convection. J. Nutr. 1938, 15, 461–475. [Google Scholar] [CrossRef]
  42. Tang, Y.; Yu, H.; Wang, Z.; Luo, M.; Zhang, K.; Jiao, Y.; Li, C. Typical winter clothing characteristics and thermal insulation of ensembles for older people in China. Build. Environ. 2020, 182, 107127. [Google Scholar] [CrossRef]
  43. ISO9920. Ergonomics of the Thermal Environment—Estimation of the Thermal Insulation and Evaporative Resistance of a Clothing Ensemble; International Standards Organization: Geneva, Switzerland, 2007.
  44. ISO7726. Thermal Environments—Instruments and Methods for Measuring Physical Quantities; International Organization for Standardization: Geneva, Switzerland, 1998.
  45. Hussan, J.R.; Hunter, P.J. Comfort simulator: A software tool to model thermoregulation and perception of comfort. J. Open Res. Softw. 2020, 8, 16. [Google Scholar] [CrossRef]
  46. Fu, M.; Yu, T.; Zhang, H.; Arens, E.; Weng, W.; Yuan, H. A model of heat and moisture transfer through clothing integrated with the UC Berkeley comfort model. Build. Environ. 2014, 80, 96–104. [Google Scholar] [CrossRef] [Green Version]
  47. Salloum, M.; Ghaddar, N.; Ghali, K. A new transient bioheat model of the human body and its integration to clothing models. Int. J. Therm. Sci. 2007, 46, 371–384. [Google Scholar] [CrossRef]
  48. Piers, L.S.; Soares, M.J.; McCormack, L.M.; O’Dea, K. Is there evidence for an age-related reduction in metabolic rate? J. Appl. Physiol. 1998, 85, 2196–2204. [Google Scholar] [CrossRef] [PubMed]
  49. Tsuzuki, K.; Ohfuku, T. Thermal Sensation and Thermoregulation in Elderly Compared to Young People in Japanese Winter Season. In Proceedings of the 9th International Conference on Indoor Air Quality and Climate (Indoor Air 2002), Monterey, CA, USA, 30 June–5 July 2002; pp. 659–664. [Google Scholar]
  50. Inoue, Y.; Nakao, M.; Araki, T.; Ueda, H. Thermoregulatory responses of young and older men to cold exposure. Eur. J. Appl. Physiol. 1992, 65, 492–498. [Google Scholar] [CrossRef] [PubMed]
  51. Munir, A.; Takada, S.; Matsushita, T. Re-evaluation of Stolwijk‘s 25-node human thermal model under thermal-transient conditions: Prediction of skin temperature in low-activity conditions. Build. Environ. 2009, 44, 1777–1787. [Google Scholar] [CrossRef]
  52. Zhou, X. A multi-node thermal comfort model based on Chinese thermo-biological features. Ph.D. Thesis, Shanghai Jiaotong University, Shanghai, China, 2015. [Google Scholar]
Figure 1. Plan of the test chamber.
Energies 13 06524 g001
Figure 2. Procedures of experiments.
Energies 13 06524 g002
Figure 3. Experimental conditions.
Energies 13 06524 g003
Figure 4. Mean skin temperatures measured by experiments and calculated by the Stolwijk model and Tanabe model, (a) schedule 1, (b) schedule 2.
Energies 13 06524 g004
Figure 5. Local skin temperatures measured by experiments and calculated by the Stolwijk model and Tanabe model, (a) head temperature in schedule 1, (b) head temperature in schedule 2, (c) chest temperature in schedule 1, (d) chest temperature in schedule 2, (e) forearm temperature in schedule 1, (f) forearm temperature in schedule 2, (g) hand temperature in schedule 1, (h) hand temperature in schedule 2, (i) thigh temperature in schedule 1, (j) thigh temperature in schedule 2, (k) lower leg temperature in schedule 1, (l) lower leg temperature in schedule 2, (m) foot temperature in schedule 1, (n) foot temperature in schedule 2.
Energies 13 06524 g005aEnergies 13 06524 g005b
Figure 6. Comparisons of predicted thermal sensation based on local skin temperatures measured by experiments and calculated by the Stolwijk model and Tanabe model, (a) schedule 1, (b) schedule 2.
Energies 13 06524 g006
Figure 7. Comparison of mean and local skin temperature between young and older people, (a) 29 °C condition, (b) 21 °C condition.
Energies 13 06524 g007
Figure 8. Calculated results of local skin temperatures after modification of the Stolwijk model, (a) chest temperature in schedule 1, (b) chest temperature in schedule 2, (c) thigh temperature in schedule 1, (d) thigh temperature in schedule 2, (e) lower leg temperature in schedule 1, (f) lower leg temperature in schedule 2.
Energies 13 06524 g008aEnergies 13 06524 g008b
Table 1. Information of subjects [40].
GenderNumberAge (year)Height (cm)Weight (kg)
Male968.3 ± 6.2168.4 ± 4.163.5 ± 10.3
Female966.7 ± 2.7156.6 ± 5.358.7 ± 8.2
Table 2. Clothing insulation and vapor resistance.
SegmentIcl,i (clo)Re,cl,i (m2·kPa/W)fcl,i
Head0.020.0011.01
Trunk0.710.0201.20
Arm0.230.0061.06
Hand0.000.0001.00
Leg0.640.0181.18
Feet0.67 0.019 1.19
Table 3. Thermal environment during the experiments.
ta (°C)RH (%)va (m/s)tg (°C)
Room ASchedule 1
Stage 123.2 ± 0.463.8 ± 4.60.03 ± 0.0223.0 ± 0.4
Stage 321.6 ± 0.565.9 ± 1.20.05 ± 0.0221.3 ± 0.5
Schedule 2
Stage 129.3 ± 0.653.7 ± 7.40.03 ± 0.0128.9 ± 0.3
Stage 331.9 ± 0.454.0 ± 5.60.04 ± 0.0331.7 ± 0.5
Room B 26.1 ± 0.563.7 ± 3.60.03 ± 0.0226.2 ± 0.5
Table 4. Instrument information.
ParameterInstrumentRangeAccuracyAccuracy Requirements in ISO7726 (Class C)
Air temperatureWSZY-1, Tianjianhuayi, China0–+50 °C±0.5 °CRequired: ±0.5 °C
Desirable: ±0.2 °C
Relative humidity 10–90%±2%Partial pressure of water vapor: ±0.15 kPa
Globe temperatureGlobe thermometer, KIMO, France−50–+250 °C±0.2 °CRequired: ±2 °C
Desirable: ±0.2 °C
Air velocityAir velocity meter, TSI, USA0–20 m/s±0.025 m/sRequired: ±0.05 m/s
Desirable: ±0.02 m/s
Skin temperaturePyrobutton-L, OPULUS, USA−40–+85 °C±0.2 °CRequired: ±1 °C
Desirable: ±0.5 °C
Table 5. Body segment correspondence among the measurement, the Stolwijk model, the Tanabe model, and the UCB sensation thermal model.
MeasurementThe Stolwijk ModelThe Tanabe ModelUCB Thermal Sensation Model
HeadHeadHeadHead
Face
Breath
Neck
ChestTrunkChestChest
Back
Pelvis
Lower armLower armLower armUpper arm
Lower arm
HandHandHandHand
ThighLegThighThigh
Lower legLower legLower leg
FootFootFootFoot
Table 6. Mean and local skin temperatures in the thermally neutral environment.
Skin TemperatureMean (°C)Standard Deviation (°C)Maximum (°C)Minimum (°C)
Mean skin temperature33.60.534.632.3
Local skin temperature
Head33.90.534.932.8
Chest34.00.635.032.8
Forearm32.80.834.030.8
Hand33.41.035.530.7
Thigh33.60.735.531.7
Lower leg33.50.634.331.6
Foot33.80.835.832.2
Table 7. RMSE (°C) between measured and calculated mean and local skin temperatures.
Skin TemperatureSchedule 1Schedule 2
Stolwijk ModelTanabe ModelStolwijk ModelTanabe Model
Mean skin temperature0.30.60.20.2
Local skin temperature
Head0.50.70.30.3
Chest1.10.50.70.4
Forearm0.41.10.70.4
Hand0.61.11.10.8
Thigh1.70.90.80.1
Lower leg2.10.30.91.0
Foot0.50.51.40.6
Mean1.0 ± 0.70.7 ± 0.30.8 ± 0.40.5 ± 0.3
Table 8. Basal skin blood flow in the Stolwijk model and the Tanabe model.
SegmentBasal Skin Blood Flow (L/h)
The Stolwijk ModelThe Tanabe Model
Head1.442.24
Trunk2.105.23 1
Arms0.502.62 2
Hands2.001.82
Legs2.850.98 3
Feet3.000.90
Total11.8913.79
1 Combined values of the chest, back, and pelvis; 2 Combined values of the shoulders and arms; 3 Combined values of the thighs and lower legs.
Table 9. RMSE (°C) between and measured skin temperatures and calculated values of modified Stolwijk model.
Skin TemperatureSchedule 1Schedule 2
Mean skin temperature0.40.2
Local skin temperature
Head0.30.3
Chest0.70.3
Arm0.40.7
Hand0.91.2
Thigh1.30.3
Lower leg1.70.5
Foot0.71.5
Mean0.9 ± 0.50.7 ± 0.5
Publisher’s Note: MDPI stays neutral with regard to jurisdictional claims in published maps and institutional affiliations.

