
Evaluation of Integral Effect of Thermal Comfort, Air Quality and Draught Risk for Desks Equipped with Personalized Ventilation Systems


1
Faculdade de Ciências e Tecnologia—Universidade do Algarve, Campus de Gambelas, 8005-139 Faro, Portugal
2
School of Built Environment, University of Reading, Reading RG6 6DF, UK
*
Author to whom correspondence should be addressed.
Energies 2021, 14(11), 3235; https://doi.org/10.3390/en14113235
Submission received: 15 April 2021
/
Revised: 26 May 2021
/
Accepted: 27 May 2021
/
Published: 1 June 2021
(This article belongs to the Special Issue Ventilation and Building Energy Systems)
Abstract
:This work evaluates the integral effect of thermal comfort (TC), indoor air quality (IAQ) and Draught Risk (DR) for desks with four personalized ventilation (PV) systems. The numerical study, for winter and summer thermal conditions, considers a virtual chamber, a desk, four different PV systems, four seats and four virtual manikins. Two different PV configurations, two upper and two lower air terminal devices (ATD) with different distance between them are considered. In this study a coupling of numerical methodology, using one differential and two integral models, is used. The heating, ventilating and air conditioning (HVAC) system performance in this work is evaluated using DR and room air removal effectiveness (εDR) that is incorporated in an Air Distribution Index (ADI). This new index, named the Air Distribution Turbulence Index (ADTI), is used to consider simultaneously the TC, the IAQ, the DR and the effectiveness for heat removal (εTC), contaminant removal (εAQ) and room air removal (εDR). The results show that the ADI and ADTI, are generally higher for Case II than for Case I, increase when the inlet air velocity increases, are higher when the exit air is located at a height 1.2 m than when is located at 1.8 m, and are higher for summer conditions than for winter conditions. However, the values are higher for the ADI than ADTI.
1. Introduction
In order to evaluate the heating, ventilating and air conditioning (HVAC) system performance an index such as the Air Distribution Index (ADI) can be used. This index, developed by Awbi [1], considers simultaneously the predicted percentage of dissatisfied people (PPD), the effectiveness for heat removal (εTC), the percentage of dissatisfied people related to the air quality (PD) and the effectiveness for contaminant removal (εAQ). An index which evaluates the ventilation system performance can be used to compare the performances of different ventilation systems and calculates the influence of the ventilation method on each occupant and at different locations.
Different applications of the ADI were made to study the performance of ventilations systems. In Cho et al. [2] the performance of four ventilation systems was compared, in Cho et al. [3] the performance of a mixing ventilation system was analyzed, in Cho et al. [4] the performance of confluent jets ventilation system was studied, in Karimipanah et al. [5] two different floor air supply systems were investigated, Almesri et al. [6] assessed the thermal comfort (TC) and the indoor air quality (IAQ) levels for different systems and Awbi [7,8] studied performance of different ventilation systems that can deliver better IAQ and energy efficiency.
The model developed by Awbi [1] was applied for uniform environments. However, in Conceição et al. [8] this model was adapted to non-uniform environments. Conceição et al. [8] studied spaces equipped with mixing ventilation and with cold radiant floor, evaluated the IAQ, TC and Draught Risk (DR) for a virtual classroom using personalized ventilation systems for non-uniform environment. This model was also applied in Conceição et al. [9] for the evaluation of TC and IAQ quality in a classroom with six and twelve occupants.
ADI considers the TC and IAQ levels in a space. For TC evaluation, the predicted mean vote (PMV) and PPD are used. These indexes were developed by Fanger [10] and presented in ANSI/ASHRAE Standard 55 [11] and ISO 7730 [12]. These indices are functions of the air temperature, air velocity, relative humidity, mean radiant temperature (Tr), basic clothing insulation and metabolic rate. For IAQ assessment, the carbon dioxide concentration (see ANSI/ASHRAE Standard 62.1. [13]) was used in this work.
However, in ventilated spaces DR, presented in ISO 7730 [12] and developed by Fanger et al. [14], should also be considered. DR is function of the air temperature, air velocity and air turbulence intensity.
In this work personalized ventilation (PV) is studied. In these kinds of ventilation systems which have been developed during the last few years, the supply airflow is promoted in the respiration area, Fanger [15]. Initially a PV system used one ATD, however in the last few years more than one ATD has been considered, with air supply directed towards the upper and lower body areas. Initially for a PV system, the IAQ was the main objective, however in more recent years TC and energy consumption were also considered.
Melikov et al. [16] studied different types of ATDs for PV systems, Gao and Niu [17] studied the performance of PV systems under different room conditions, Cermak et al. [18] compared the performance of PV with mixing ventilation and displacement ventilation systems, Niu et al. [19] studied a chair-based PV strategy, Sun et al. [20] examined the dynamic performance of PV, Bolashikov et al. [21] analyzed the performance of PV by considering the airflow around the occupants, Schiavon et al. [22] analyzed the energy consumption of PV systems in hot and humid climates, Li et al. [23] studied PV system in combination with an under-floor ventilation system, Yang et al. [24] analyzed the use of a ceiling mounted PV in hot and humid climate, Chen et al. [25] investigated the integration of PV with mixing ventilation, Melikov et al. [26] applied PV using seat headrest-mounted air terminal devices, Makhoul et al. [27] studied the TC and the energy consumption for ceiling-mounted PV, Cheong and Huang [28] explored PV coupled with displacement ventilation, Dalewski et al. [29] analyzed PV in conjunction with the displacement ventilation and Chen et al. [30] evaluated the performance of PV system with individual airflow rate control.
This paper is a continuation of the previous work developed initially by Conceição et al. [31] and Conceição et al. [9] and more recently in Conceição et al. [8]. In the earlier work of Conceição et al. [31] and Conceição et al. [9], PV configurations were used in classroom desks with two ATDs located above and below the desk area. In Conceição et al. [31], desks equipped with PVs and two ATDs and one occupant was evaluated for the TC level that the occupant was subjected to. Conceição et al. [9] evaluated the IAQ, TC and DR for a virtual classroom using PV systems for non-uniform environment.
In this numerical simulation, the coupling of three types of software have been considered. The first integral model simulates the building thermal behavior and calculates the temperature of internal and surrounding virtual chamber surfaces. Application of this software is described in Conceição and Lúcio [32]. This work was applied to a complex topology building with several floor levels and the occupant’s TC was evaluated. Others models like Bacher and Madsen [33], had the propose of controlling the indoor climate and evaluating the energy consumption, and that of Pisello [34] with the objective to analyse the roof’s passive cooling to reduce energy consumption in of the building.
The second integral model simulates the human thermo-physiology and evaluates the human TC sensation, the tissue and clothing temperatures which is described in Conceição et al. [35]. In this study, the airflow around a thermal manikin was measured and the TC was evaluated using the integral human thermo-physiology numerical model. Other numerical models, related to the human thermal response can be found in Tang et al. [36] for the simulation of the local skin temperature in older people and Ozeki [37] for the evaluation of TC level of occupants subjected to solar radiation.
A third differential numerical model uses computational fluid dynamics (CFD) to simulate the air flow and evaluate the air quality, air velocity, air temperature, air turbulence intensity and CO2, can be found in Conceição et al. [38]. Other studies related with the CFD techniques can be found, as an example, in Takabayashi [39] for evaluating the thermal environment and TC level and Nilsson and Holmér [40] for evaluating the perceived thermal climate around a thermal manikin.
In this work a new index, named the Air Diffusion Turbulence Index (ADTI), is developed. This index considers simultaneously PPD, εTC, PD, εAQ, DR and εDR. For this study, two PV configurations were used to study the influence of the inlet air velocity, the air exhaust location and the inlet air temperature on ADI and ADTI.
2. Materials and Methods
2.1. Numerical Models
In this work, which is a continuation of that in Conceição et al. [8] three numerical models are applied: building thermal response (BTR) model, human thermal response (HTR) model and a CFD model.
The BTR numerical model evaluates the surrounding room environment and the body surface temperatures. This information is used by the CFD and the HTR numerical models in a coupling methodology. The BTR model considers the external environment conditions, the air change rate (ACR) and the thermal proprieties of the occupants and the internal room surfaces. More details of the numerical model can be found in Conceição and Lúcio [35] and details of the solar radiation, thermal proprieties of windows and convection heat transfer coefficients can be found in Conceição et al. [41]
The coupling of the CFD and HTR numerical models is used to evaluate the airflow around the occupants, the thermal comfort that the occupants are subjected to and air quality in the occupants’ respiration area.
The HTR numerical model, that applies for transient and steady-state conditions, together with the energy and mass balance integral equations, calculate the body and clothing temperatures, blood flow in the human body, water transpiration flow, blood (arterial and venous) temperature, clothing temperature, water flow through the clothing and the mean radiant temperature (Tr) and thermal comfort (TC) level. For the Tr evaluation, the numerical model considers the view factors, surrounding room surfaces and the body’s surface temperatures, while for TC the relative humidity, the air temperature and the air velocity around the occupants are used with consideration of the heat fluxes calculated around the human body.
The CFD model, which is used under steady-state conditions, evaluates the air temperature and air velocity inside the room and around the occupants, the DR and the IAQ level using the CO2 concentration data in the respiration area. This model considers the skin and clothing surface temperature, the room surrounding surfaces temperatures and the ACR. More details of an application of this modelling approach to moderate and isothermal environmental conditions without occupants can be found in Conceição et al. [38] and an application in non-isothermal environmental conditions with an occupant can be found in Conceição et al. [9].
The CFD numerical model, developed by the authors and applied in this work, considers:
- partial differential equations;
- finite volume method;
- hybrid scheme in the convective/diffusive fluxes;
- SIMPLE (Semi-Implicit Method for Pressure-Linked Equations) algorithm used in the velocity and pressure equations;
- non-uniform approach for the grid generation;
- grid refinement near the surfaces and in the airflow inlet and outlet;
- density changes with temperature;
- impulsion term in the vertical air velocity equation;
- carbon dioxide equation source term in the breathing area;
- iterative TDMA (Tri-Diagonal Matrix Algorithm) method in the equations system resolution;
- RNG turbulence model, for high Reynolds number, in the turbulence simulation;
- wall boundary in the surface proximity.
The numerical models applied in this work were previously validated. The models for BTR, HTR, CFD, the coupling of HTR with CFD and that of BTR, HTR with CFD were performed for the validation. In the validation process, the grid, the solution accuracy and other modelling aspects were evaluated in detail before the numerical models were applied in this research. Cross ventilation, personalized ventilation and other ventilation systems were used in the evaluations. Several grids, with different refinements, the RNG and the K-epsilon turbulence models were used in the evaluation for the air velocity, air temperature, air turbulence intensity and DR parameters. One example that used simultaneously the BTR, HTR and CFD numerical models, is described in Conceição and Lúcio [42]. In this study, the RNG turbulent model produced more accurate predictions than the k-epsilon turbulent model and this was chosen in this study.
2.1.1. Air Distribution Index (ADI) for Non-Uniform Environment
In a previous work by Awbi [1], the ADI concept was developed with the objective of obtaining, simultaneously, an evaluation of the TC and IAQ:
where NTC is the thermal comfort number, and NAQ is the air quality number.
2.1.2. Air Distribution Turbulence Index (ADTI) for Non-Uniform Environment
In this work, the ADTI concept was developed with the objective of obtaining, simultaneously, the evaluation of the TC, IAQ and DR. This index provides useful information concerning the ventilation system performance and allows the comparison between different systems.
The ADTI concept which is defined below is used in this study:
where NDR is the Draught Risk number.
The advantages of ADTI are obtained when the effect of NDR becomes significant, i.e., when the DR values are high or εDR is low. Using the ADTI concept, it is possible to evaluate simultaneously the influence of NDR, NTC and NAQ on the TC, IAQ and DR perception. With the application of the ADTI approach, it does not become necessary to evaluate TC and IAQ separately for assessing the effect of DR, but the influence of all the parameters are evaluated simultaneously.
The introduction of the DR in ADTI (when the effect of NDR becomes significant), could in some cases produce ADTI values lower than ADI (which excludes DR). Thus, it would be important to include DR in order to provide an overall assessment of the performance of the ventilation system for achieving acceptable levels of TC, IAQ and DR. In addition, the influence of inlet air velocity, location of the exhaust air terminal or the influence of external thermal conditions on the ADTI should also be investigated in the assessment of different ventilation systems.
2.1.3. Thermal Comfort
is evaluated by (see Awbi, [1]):
PPD is evaluated using a thermo-physiology numerical model (HTR numerical model) and is expressed as (see Awbi, [1]):
where T0 is the air temperature of the outlet air, Ti is the inlet air temperature and Tbody is the air mean temperature around the human body.
For non-uniform environment, the mean air temperature around the human body is obtained using (see Conceição et al., [8]):
where Abody is the human body external area, is the local air temperature around the human body at section j and is the body’s external area for the j section.
2.1.4. Air Quality
The air quality number (NAQ) is defined by (Awbi, [1]):
PD for air quality (see Fanger, [43]) is represented by:
where Q is the ventilating rate per occupant.
εAQ (see Sandeberg, [44]) is expressed as;
where Co is the contaminant concentration of the outlet air, Ci is the contaminant concentration of the inlet air and CR is the contaminant concentration in the respiration area.
2.1.5. Draught Risk
NDR is evaluated by:
The εDR is evaluated by:
where VOZ is the mean air velocity in the occupied zone and VOC is the mean air velocity around the occupant.
The mean Draught Risk around the human body, is evaluated by:
where is the mean DR around the human body for the j section.
The mean air velocity around the occupied zone is calculated using:
where is the mean air velocity around the human body for the j section.
Therefore, ADTI is based on the TC level (PPD), the IAQ level (PD), DR, εTC, εAQ and εDR.
2.2. Numerical Methodology
This study focuses on two different PV configurations in a desk installed in a virtual chamber. The square desk is equipped with four PV air supplies, each one located on one side of the desk with two air supply terminal devices located above and another two devices located below the desktop.
The square desk is occupied with four persons seated on four chairs located at the four sides of the desk. The occupants are subjected to four ATDs: one upper and one lower ATD located on the left side of the body area and one upper and one lower ATD located on the right side of the body area.
The virtual chamber is equipped with an exhaust air terminal attached to a duct located in the central ceiling area of the room. In the numerical simulations, two exhaust heights were used: one located at 1.2 m and another located 1.8 m above the floor level.
The numerical simulations were performed for winter and summer conditions. In the winter condition, the inlet air temperature is 20 °C and the outlet air temperature of 10 °C, while in the summer conditions the inlet air temperature is 25 °C and the outlet air temperature of 30 °C.
In the numerical simulations, the inlet air velocity at the ATD is varied between 1 to 4 m/s and the indoor air relative humidity is 50%.
The basic clothing insulation is 1 clo in winter condition and 0.4 clo in summer condition. In both situations a typical metabolic rate of 1.2 met is used.
The grid was refined at the air inlet (ATD) and air outlet (air exhaust), near surfaces (around the occupants) and the surrounding surfaces (wall, floor, ceiling, floor and desk). Thus, in this numerical simulation, a non-uniform grid is used. For Case I, a grid of 158 × 164 × 113 for the X, Y and Z directions was used, while for Case II a grid of 146 × 152 × 113 in the X, Y and Z directions was used. These grids were chosen as they produced the best results, as further refinement did not provide any significant improvement for the results obtained.
In this study the following conditions are used in the simulations:
- two different personalized ventilation systems, Case I and Case II;
- an inlet air velocity between 1 to 4 m/s;
- exhaust air terminal located at 1.2 m and at 1.8 m above the floor level;
- inlet air temperature representing winter and summer conditions.
In this study two PV systems were investigated: Case I and Case II both using two air ATDs above the desktop and two devices below the desktop, as follows:
- In Case I the distance between the upper two supply ATDs is 45 cm and the same distance is used between the lower two ATDs. In this Case, the airflow has the ability to bypass the occupants on both sides as the distance between the air terminal devices is wider than the upper width of a human body. Thus, the airflow before to exit from the space promotes a recirculation mainly at the back of the occupant;
- In the Case II the distance between the upper two air ATDs is 25 cm and this was the same for the lower two air terminal devices. In this Case the airflow is directed onto the occupant’s body as the distance between the two ATDs is lower than the width of a human body. Thus, the airflow promotes a recirculation mainly in front of the occupant before it passes to the air exit terminal.
2.2.1. Case I
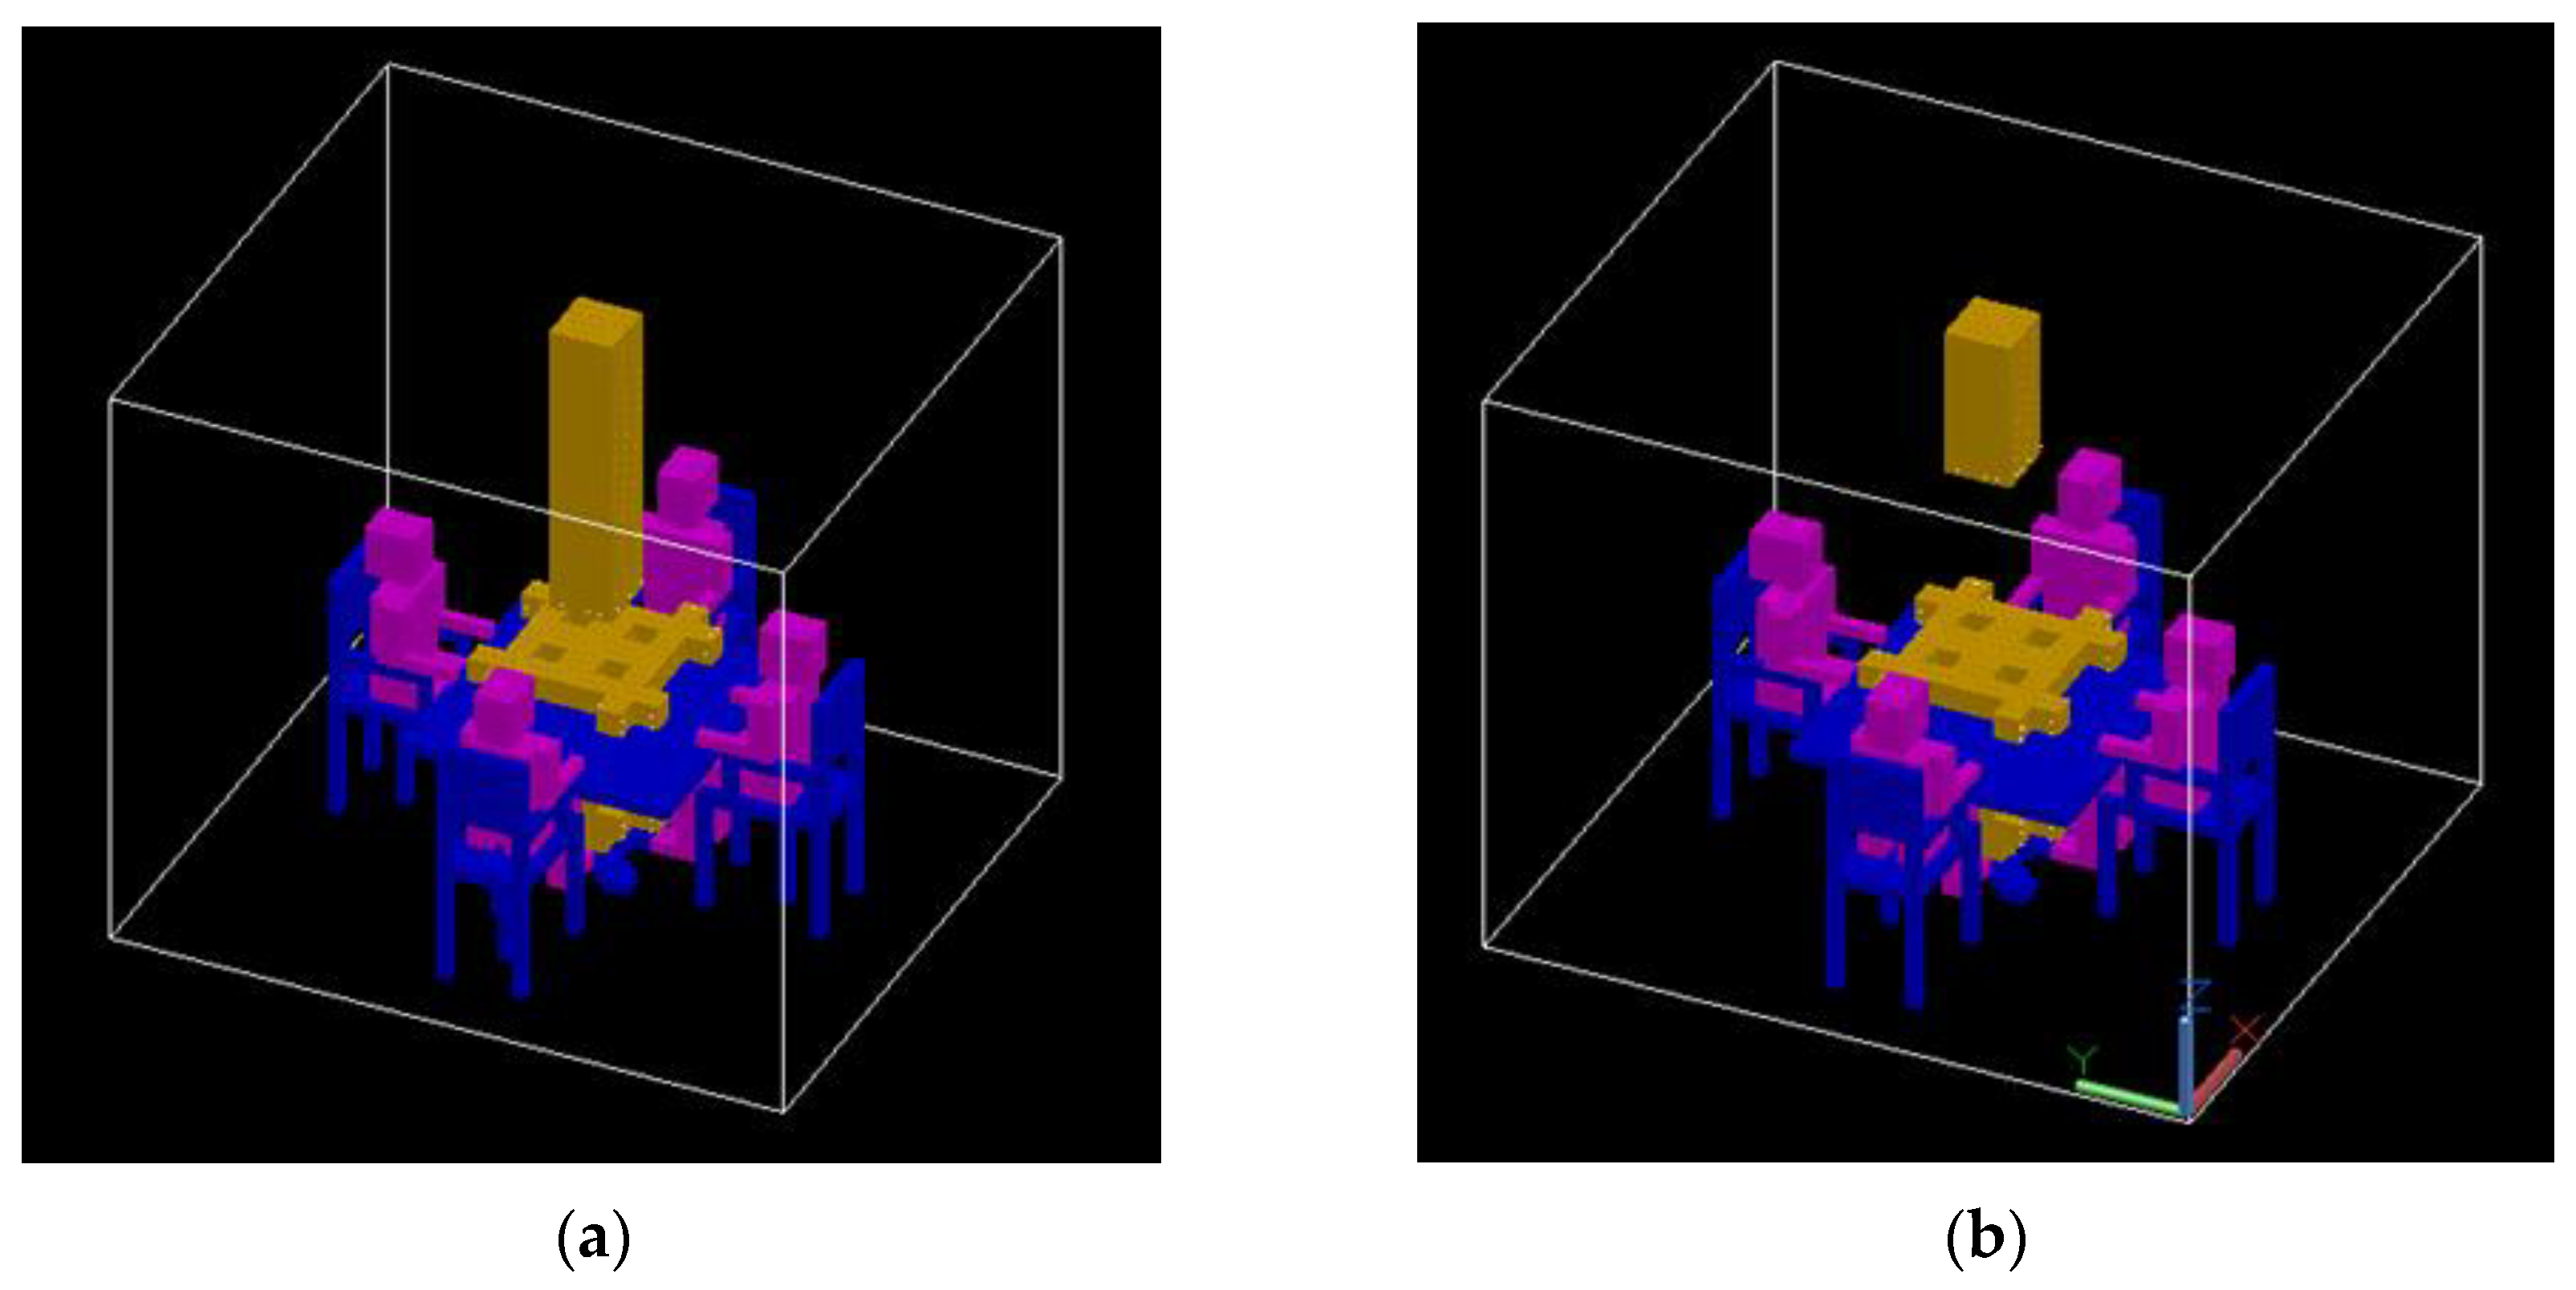
Figure 1 presents the three-dimensional virtual chamber with a desk equipped with four PVDs with the distance between the upper and lower devices being 45 cm. The figure (a) is when the exhaust air terminal is located at 1.2 m, while the figure (b) is when it is located at 1.8 m above the desk.
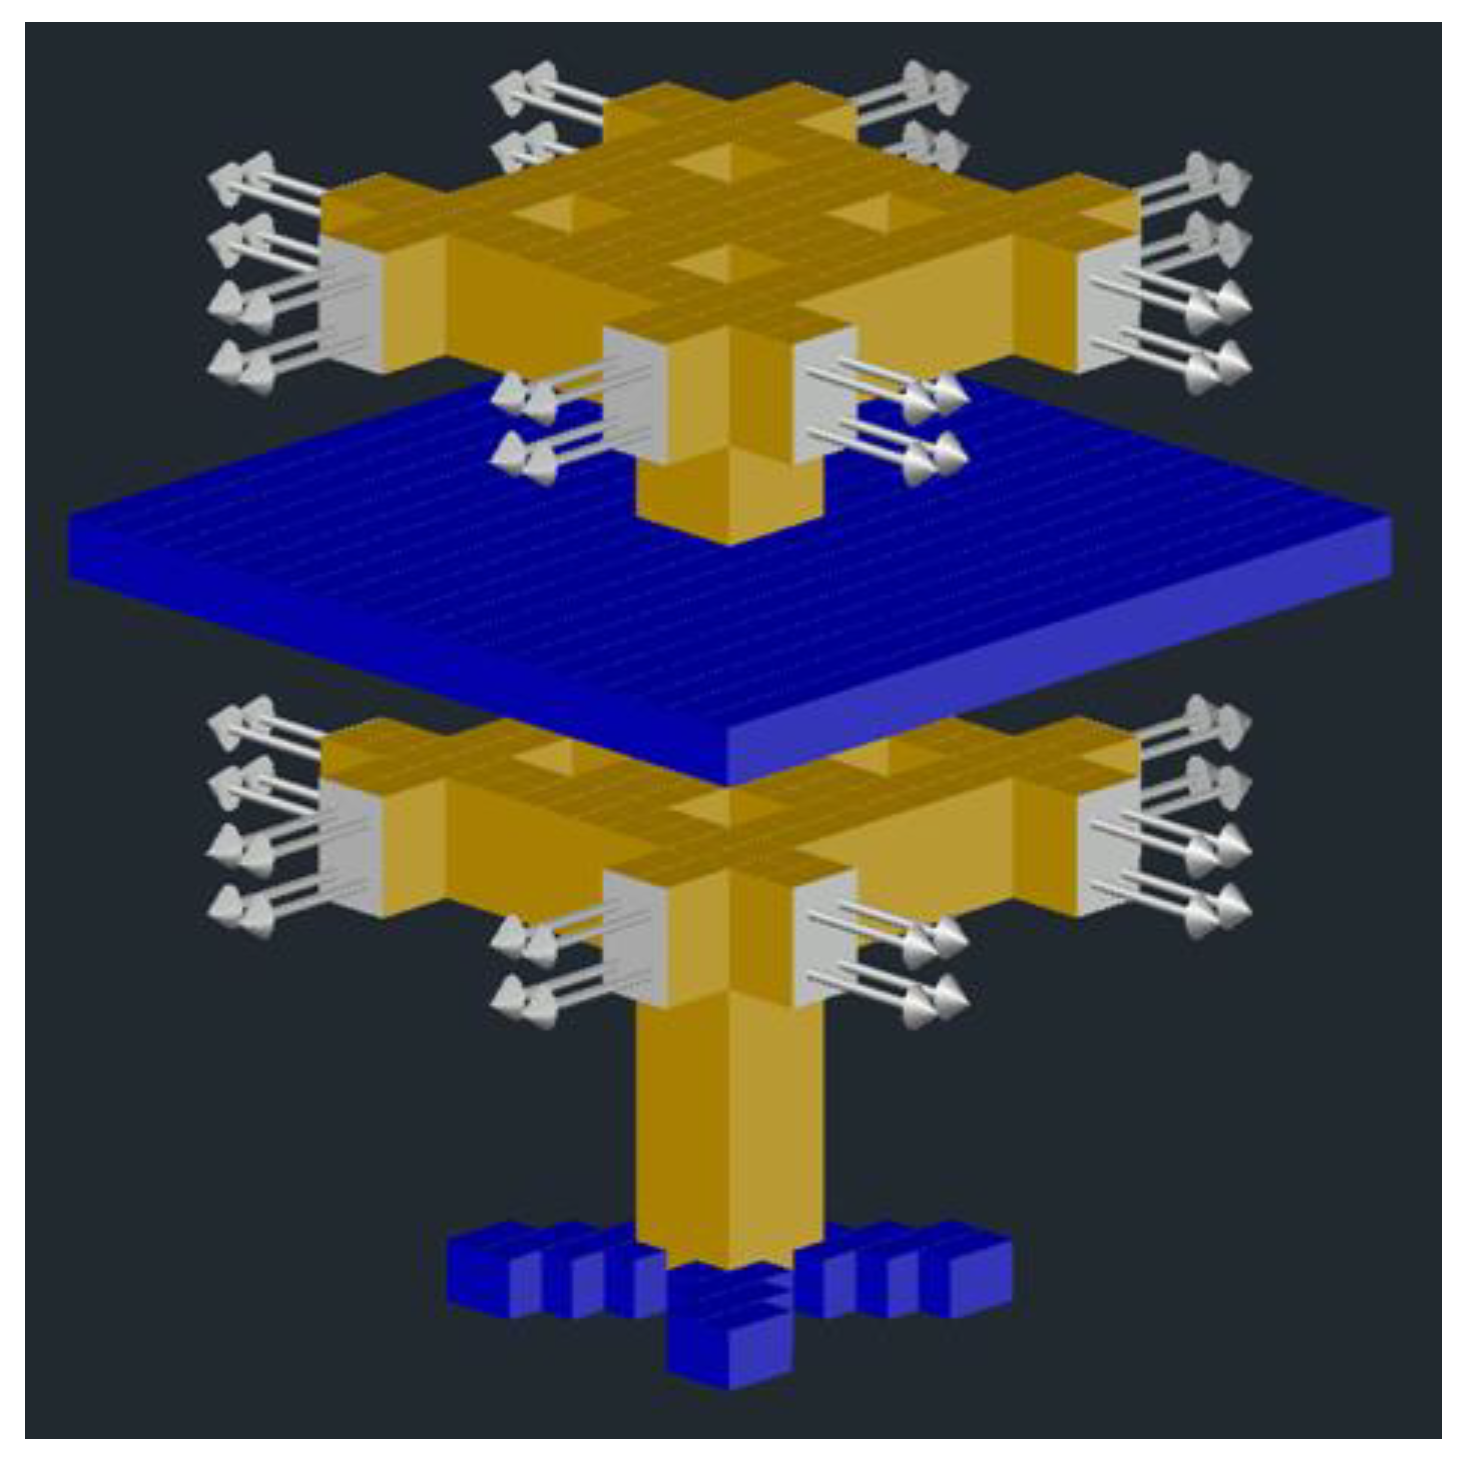
The location of the ATDs for 45 cm separation distance is presented in Figure 2.
2.2.2. Case II
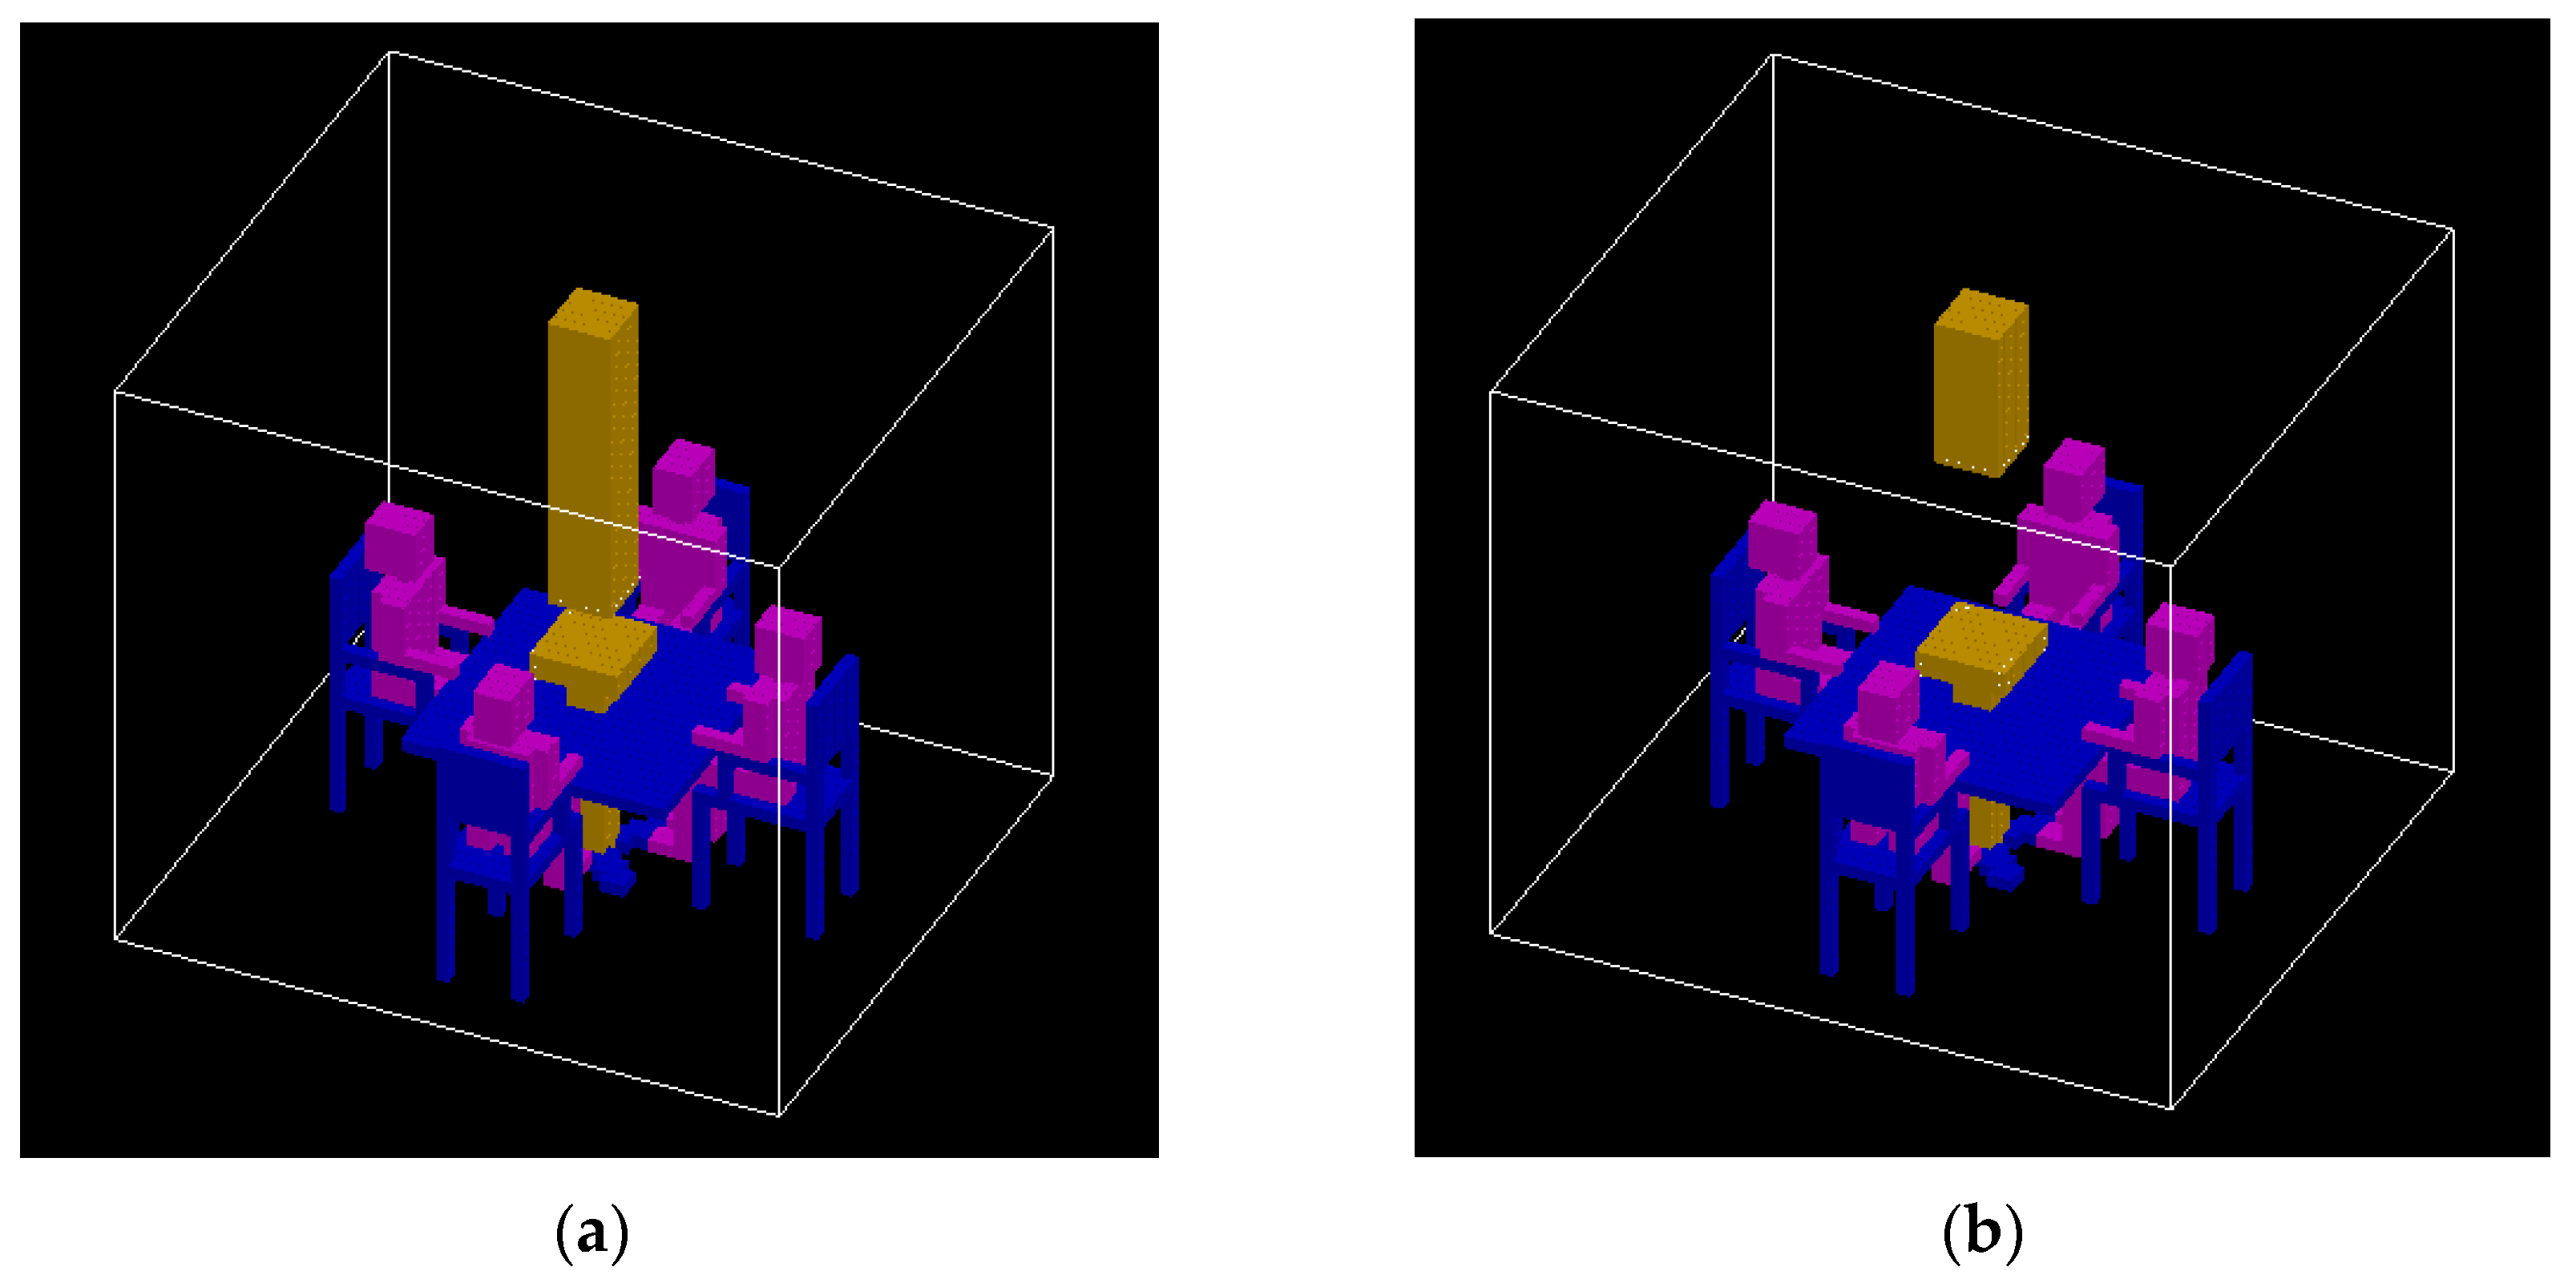
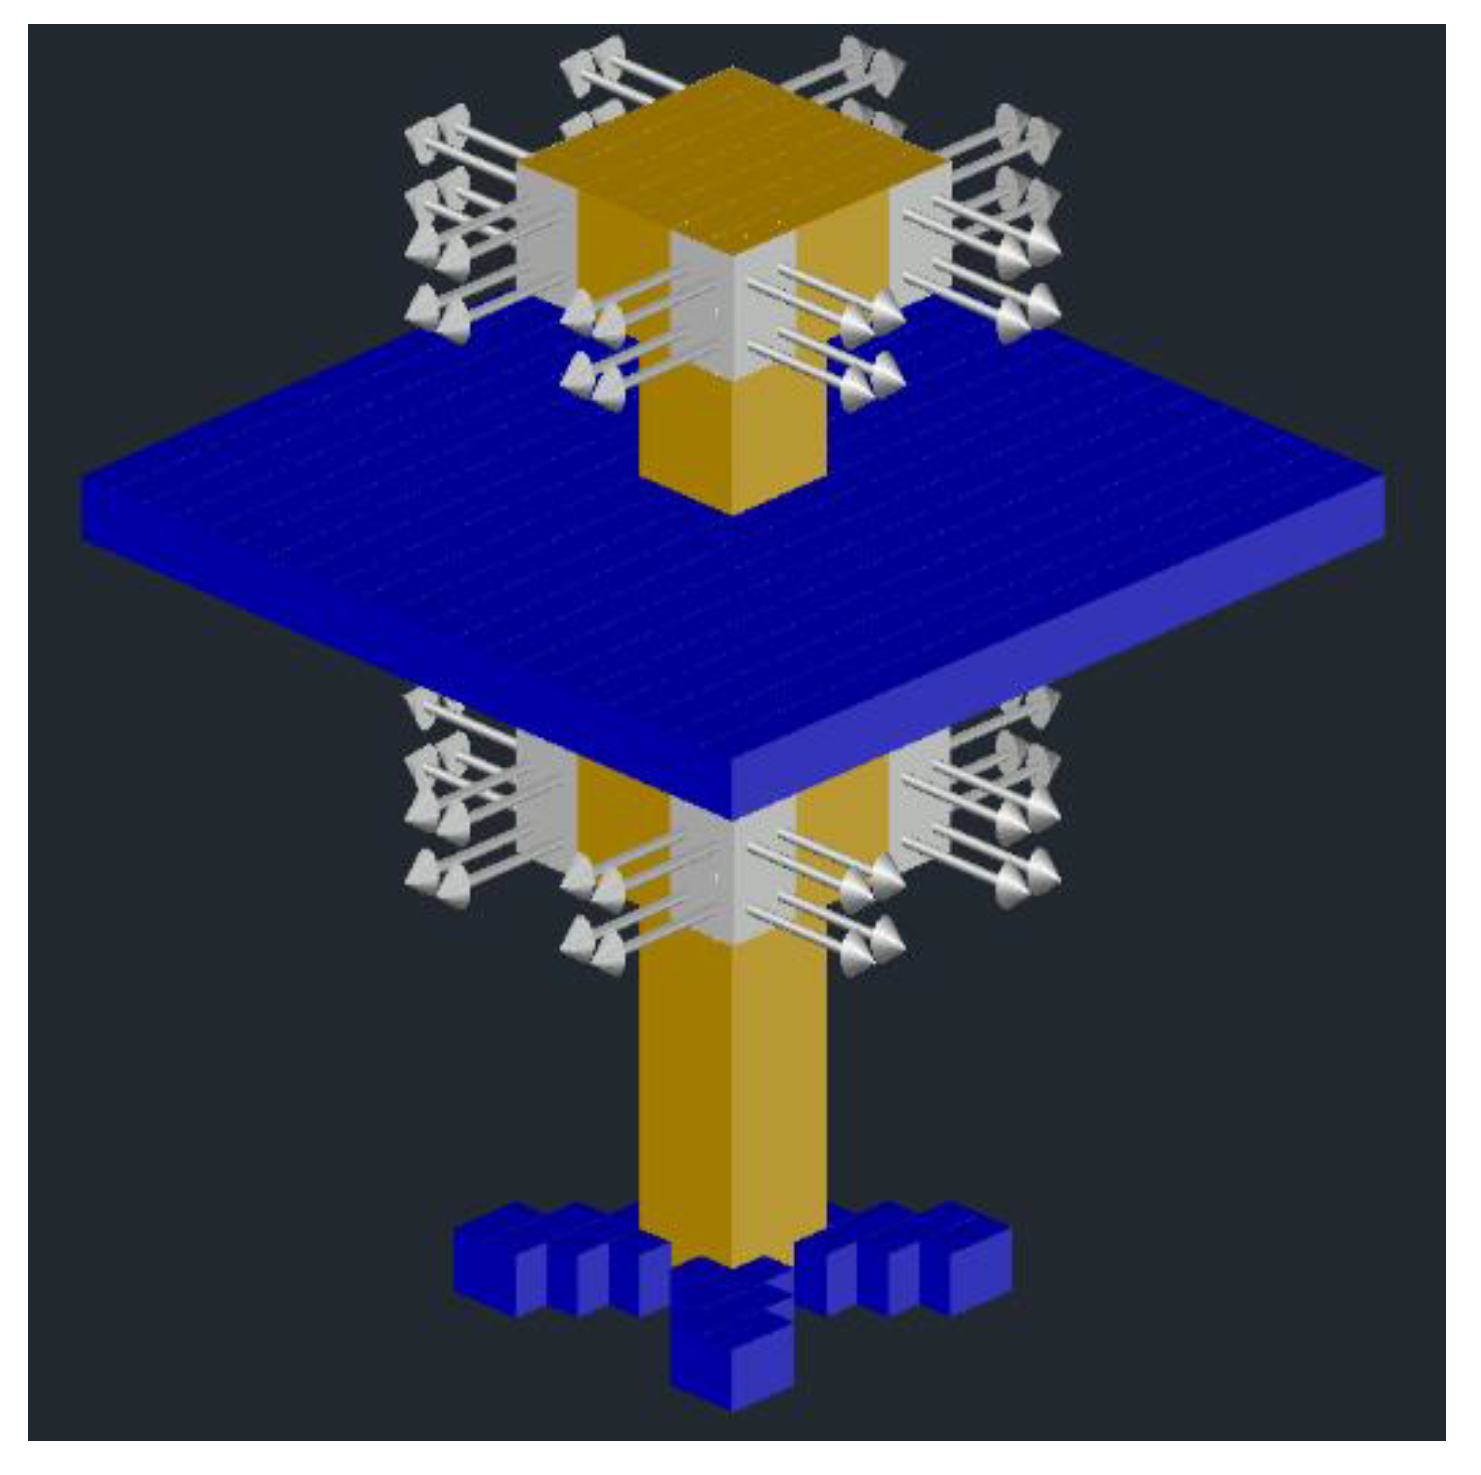
Figure 3 presents a three-dimensional virtual chamber containing a desk equipped with four PV supply terminals with a distance between the upper two and lower terminals being 25 cm. Figure 3 a is for the exhaust air terminal located at 1.2 m, while the Figure 3b is for the terminal located at 1.8 m above the floor level, as shown in Figure 4.
3. Results and Discussion
In this section the parameters influencing the four variables of the ADI and ADTI are discussed. These are:
- the PV geometry, namely two different PV configuration, represented by Case I and Case II;
- the inlet air velocity;
- the exhaust system location, namely, exhaust system located at 1.2 and 1.8 m above floor level;
- seasonal conditions for summer and winter, i.e., inlet air temperature.
The results are presented in four sections, namely:
- TC;
- IAQ;
- DR;
- ADI and ADTI.
In the following figures the S and W are associated, respectively, to the Summer and Winter conditions, while I and II are associated, respectively, to Cases I and II.
3.1. Thermal Comfort
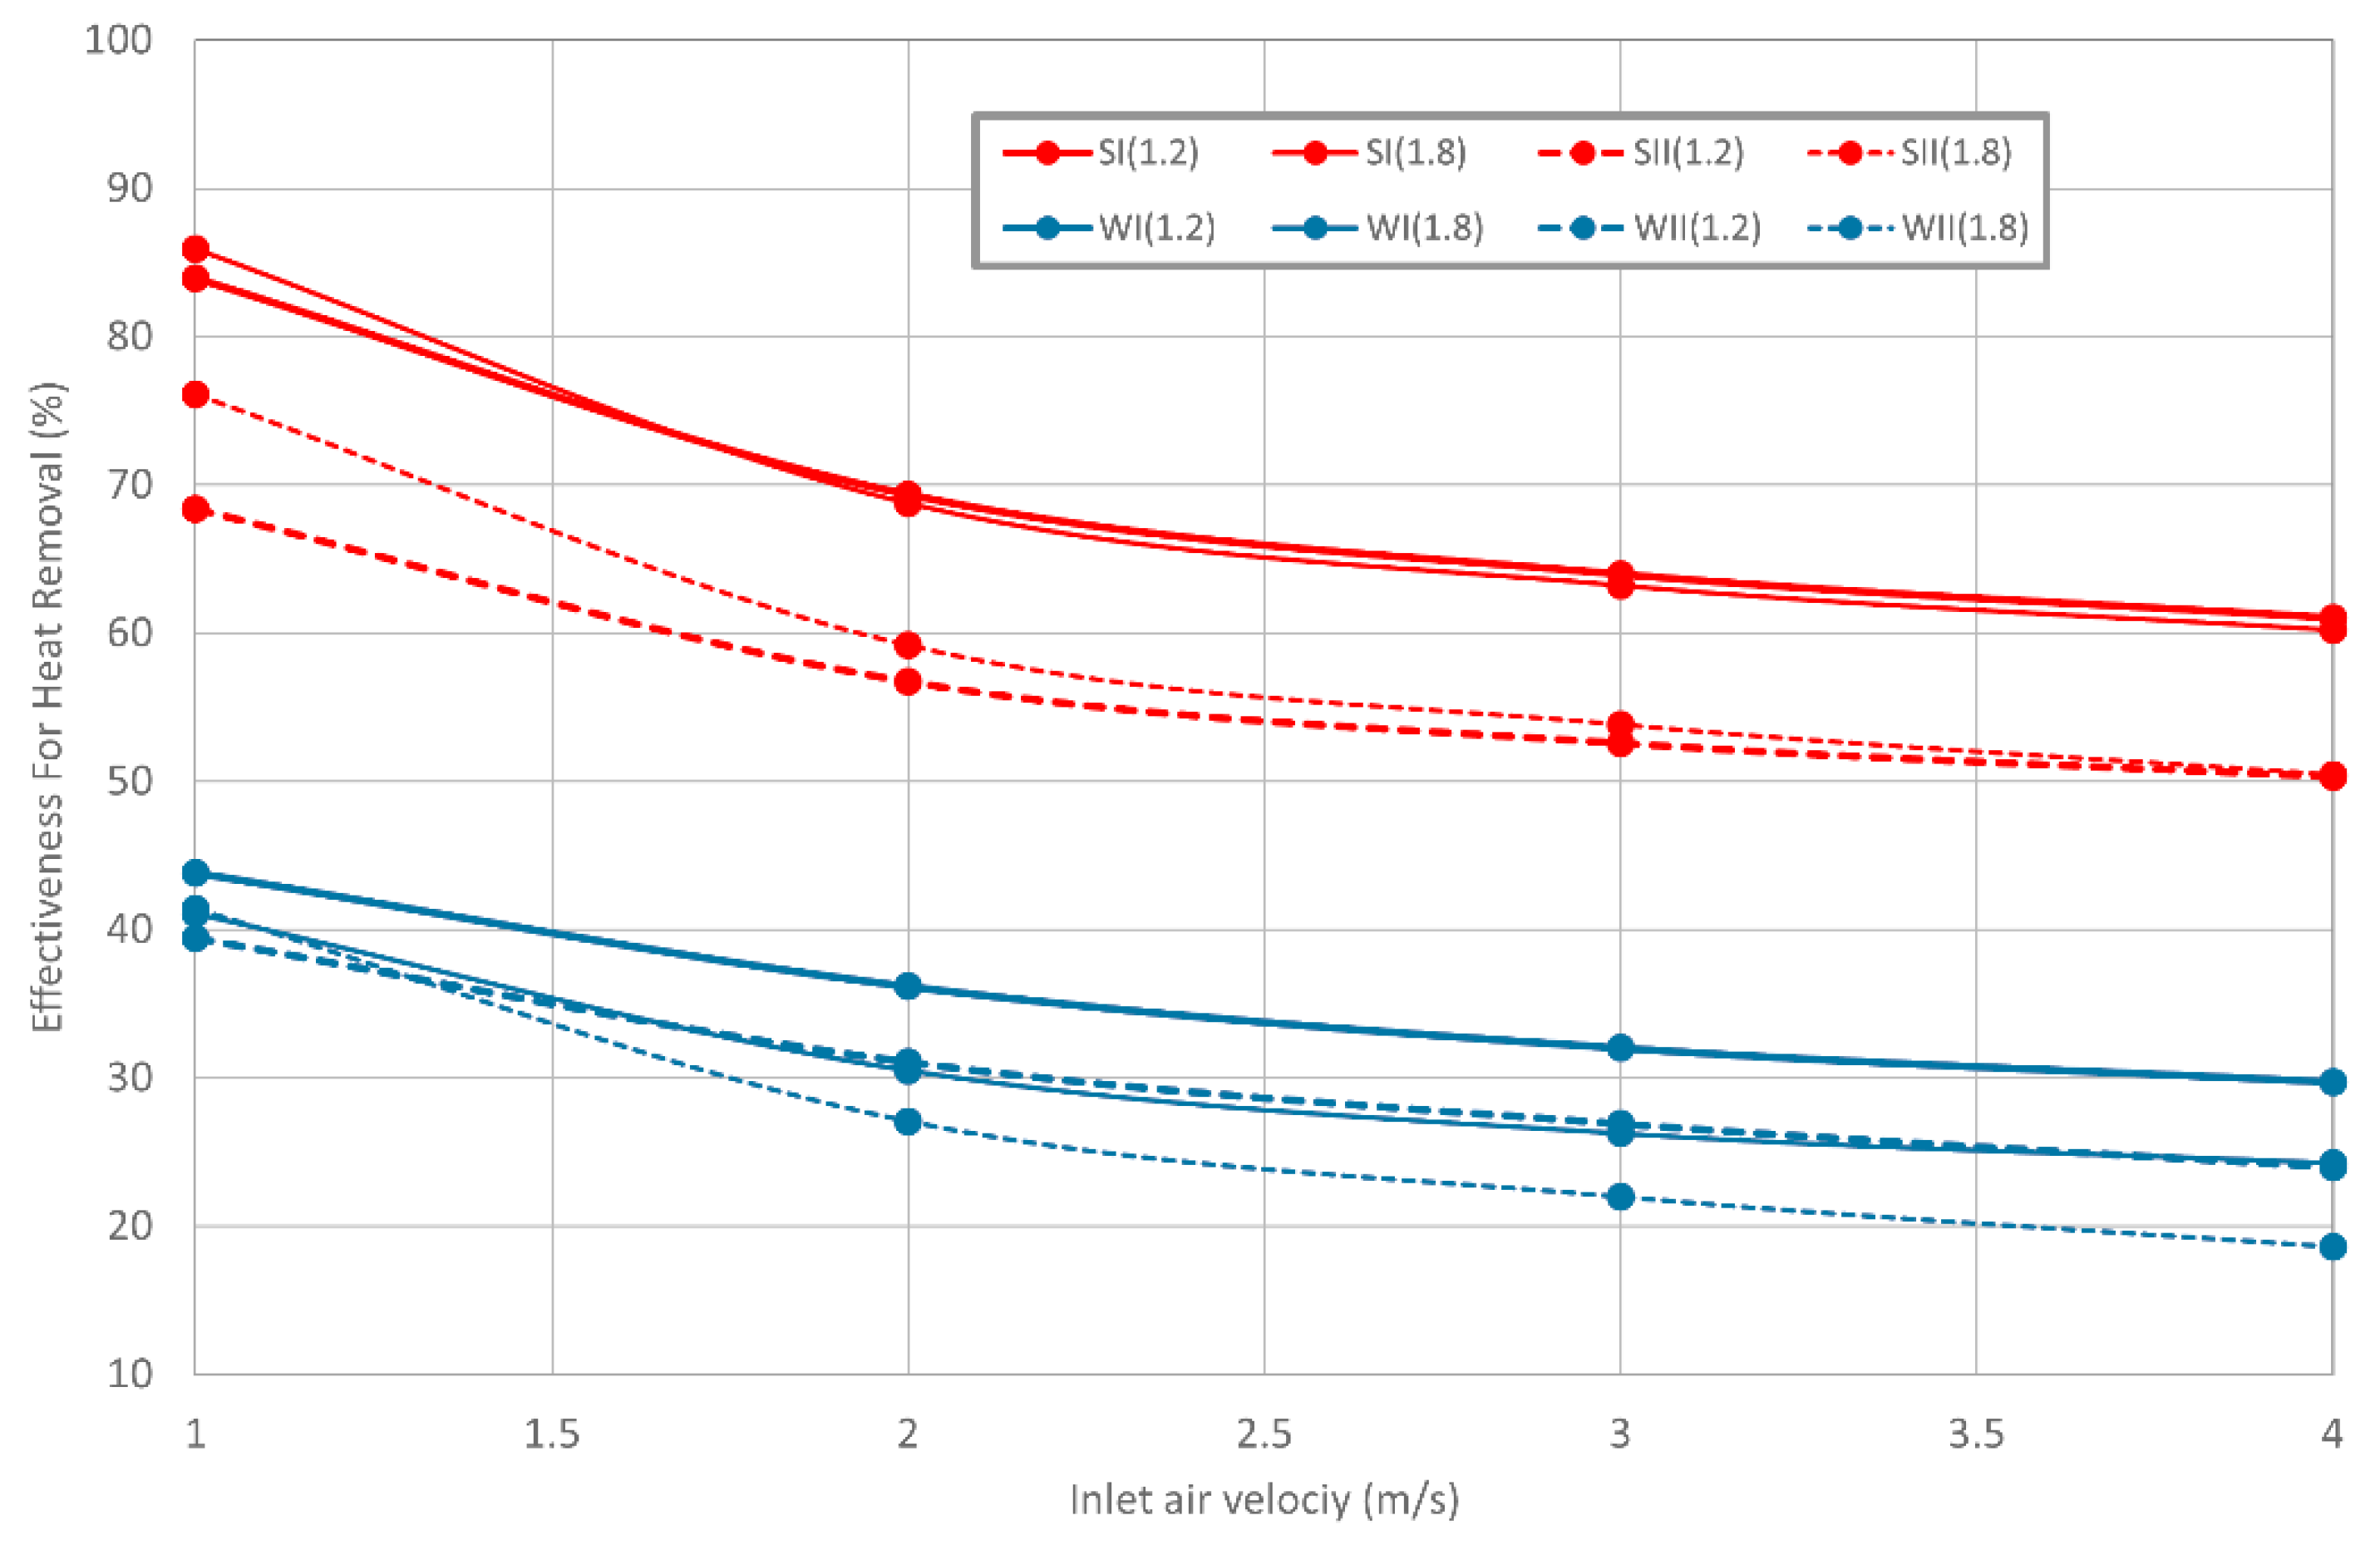
According to Figure 5, :
- is higher for Case I than Case II;
- decreases when the inlet air velocity increases;
- is higher when the exit air terminal is located 1.2 m than when it is located 1.2 m above the floor level for winter condition, but the opposite is the case for summer condition;
- is higher for summer condition than for winter condition.
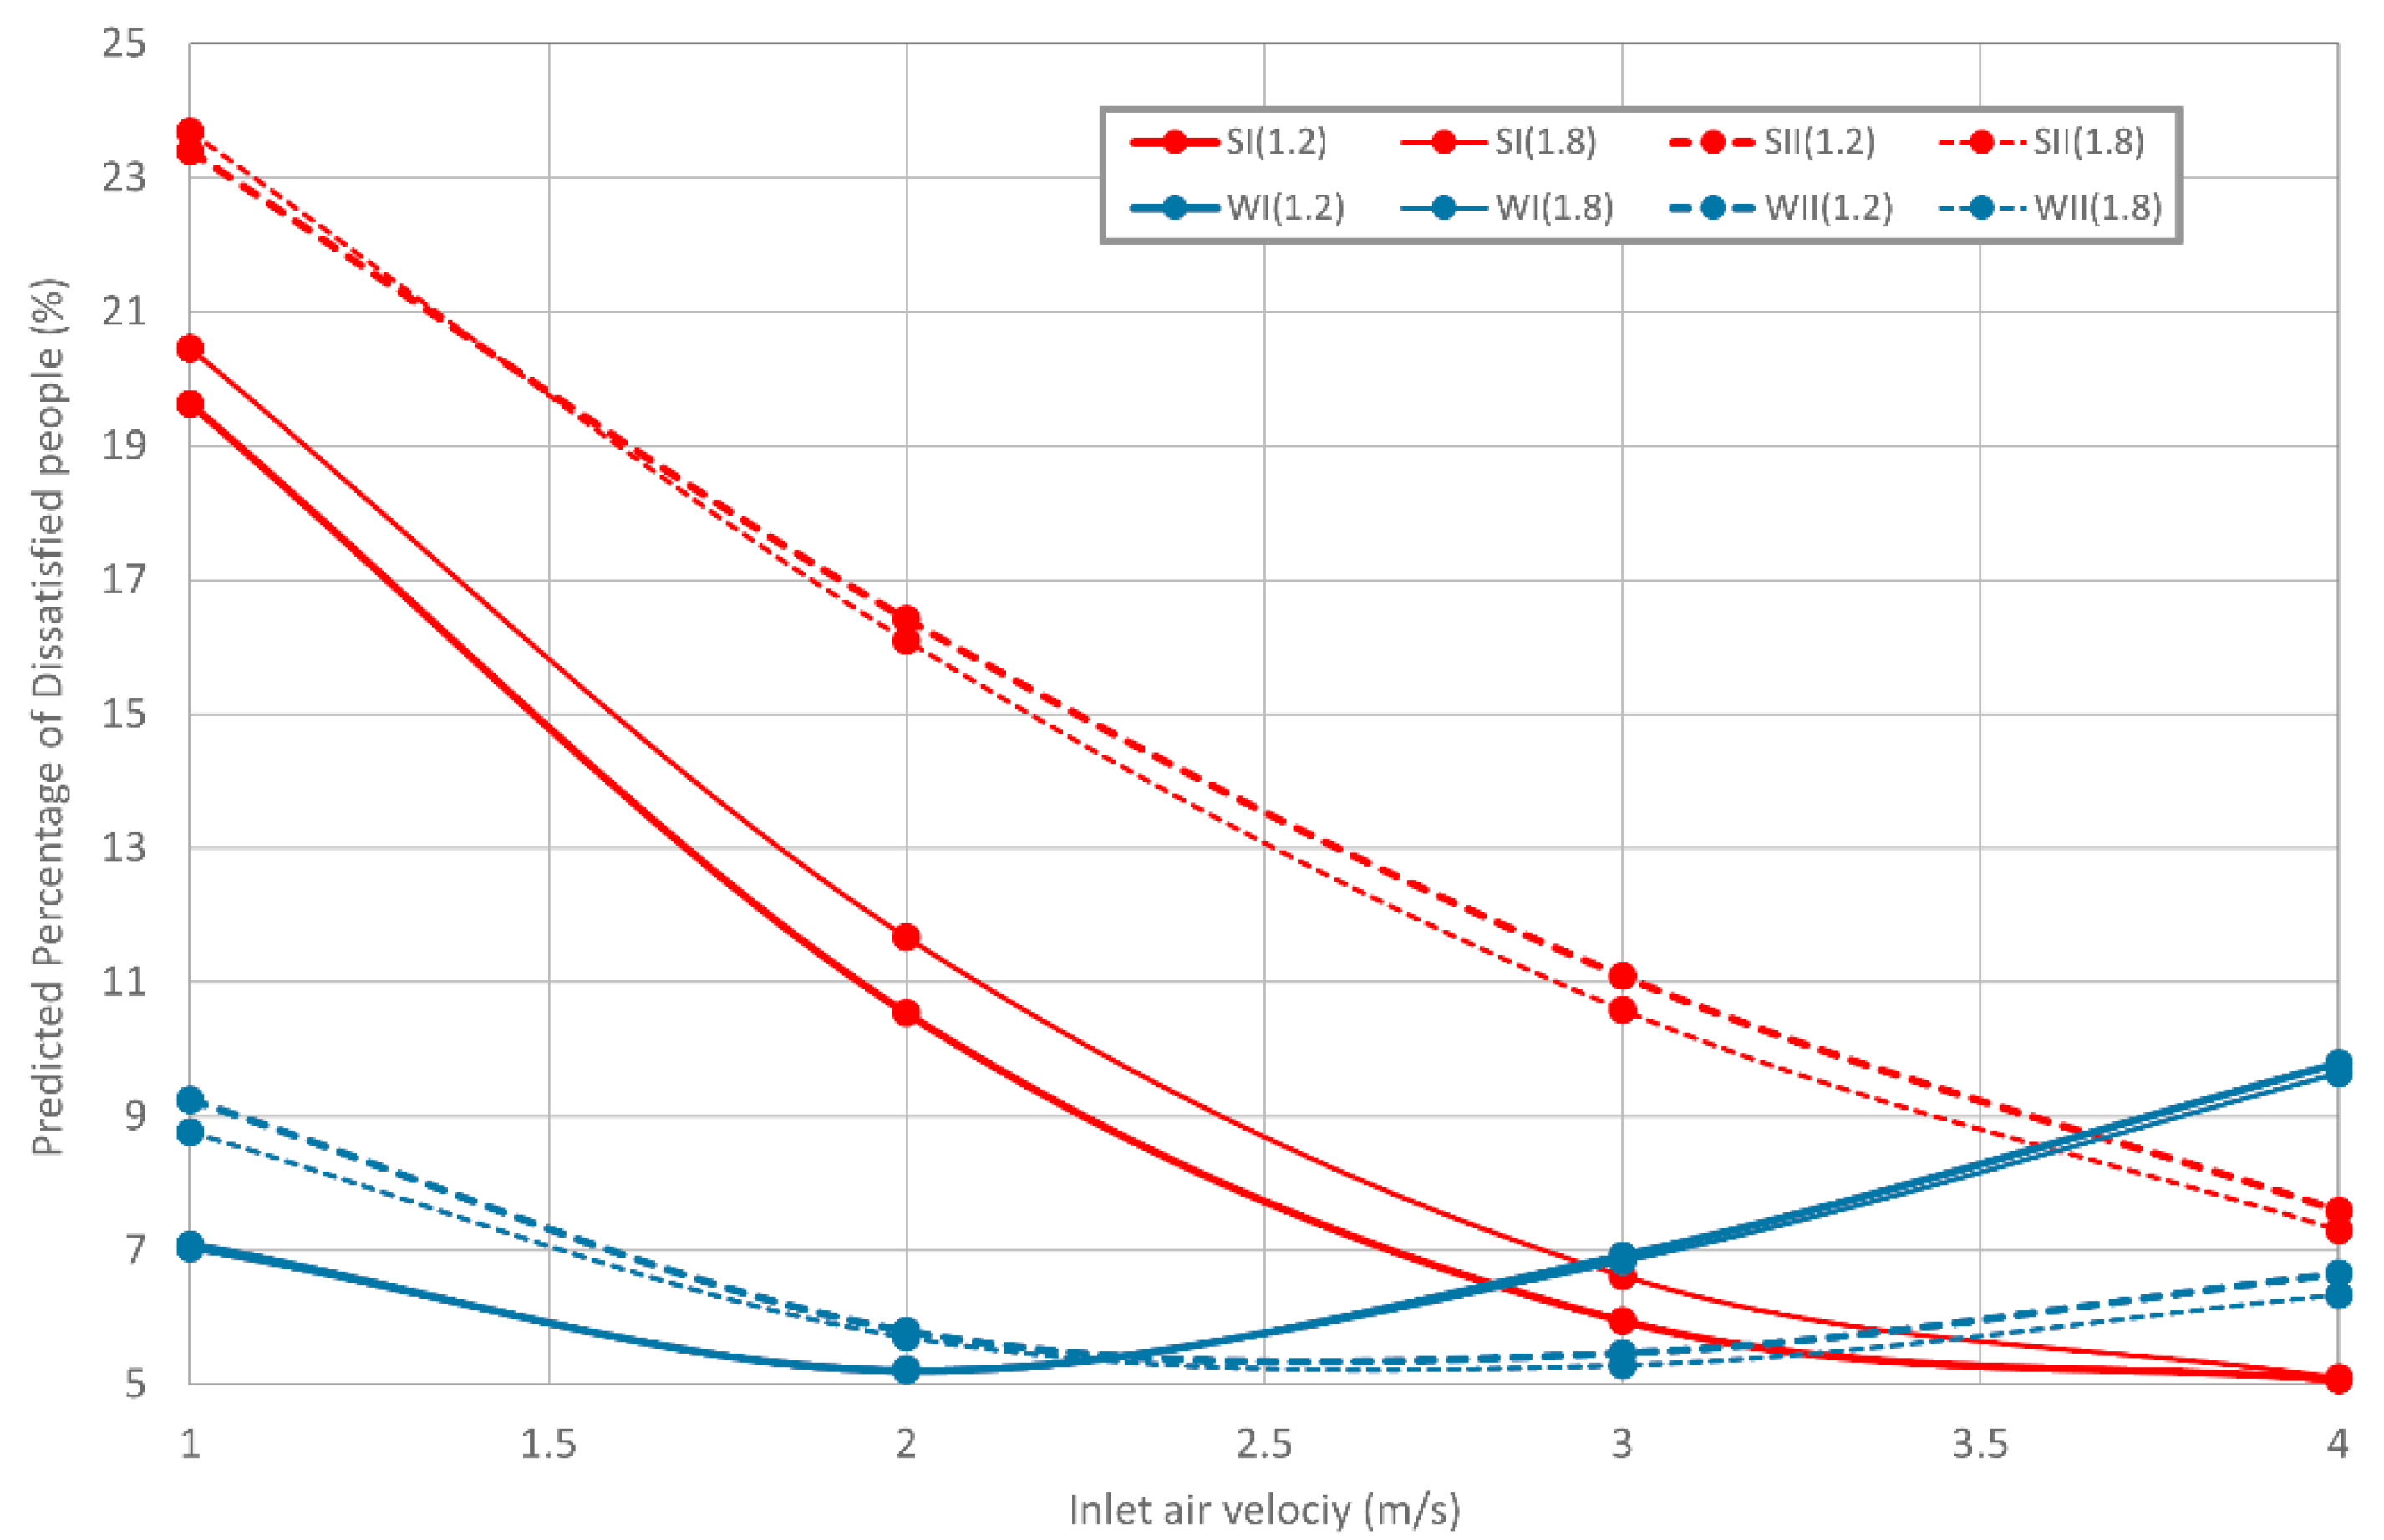
In accordance with Figure 6 the PPD related to the TC conditions:
- is higher for Case II than Case I in the summer conditions, and is higher for Case II than Case I for winter conditions with the lowest inlet air velocity, but is lower for Case II than Case I for highest inlet air velocity;
- for summer conditions, PPD decreases when the inlet air velocity increases, while in winter conditions it initially decreases as the inlet air velocity increases but then starts to increase as the air velocity increases;
- it is slightly higher when the exit air terminal is located at a height of 1.2 m than when located at 1.8 m for summer conditions in Case II, and is lower when the exit air terminal is located at 1.2 m than when located 1.8 m, for the Case I, however for winter conditions PPD is slightly higher when the exit air terminal is located 1.2 m than when located 1.8 m, for the Case II;
- is generally higher for summer condition than for winter conditions.
Generally, the TC comfort level is acceptable for winter conditions and for summer conditions at the highest inlet air velocity levels.
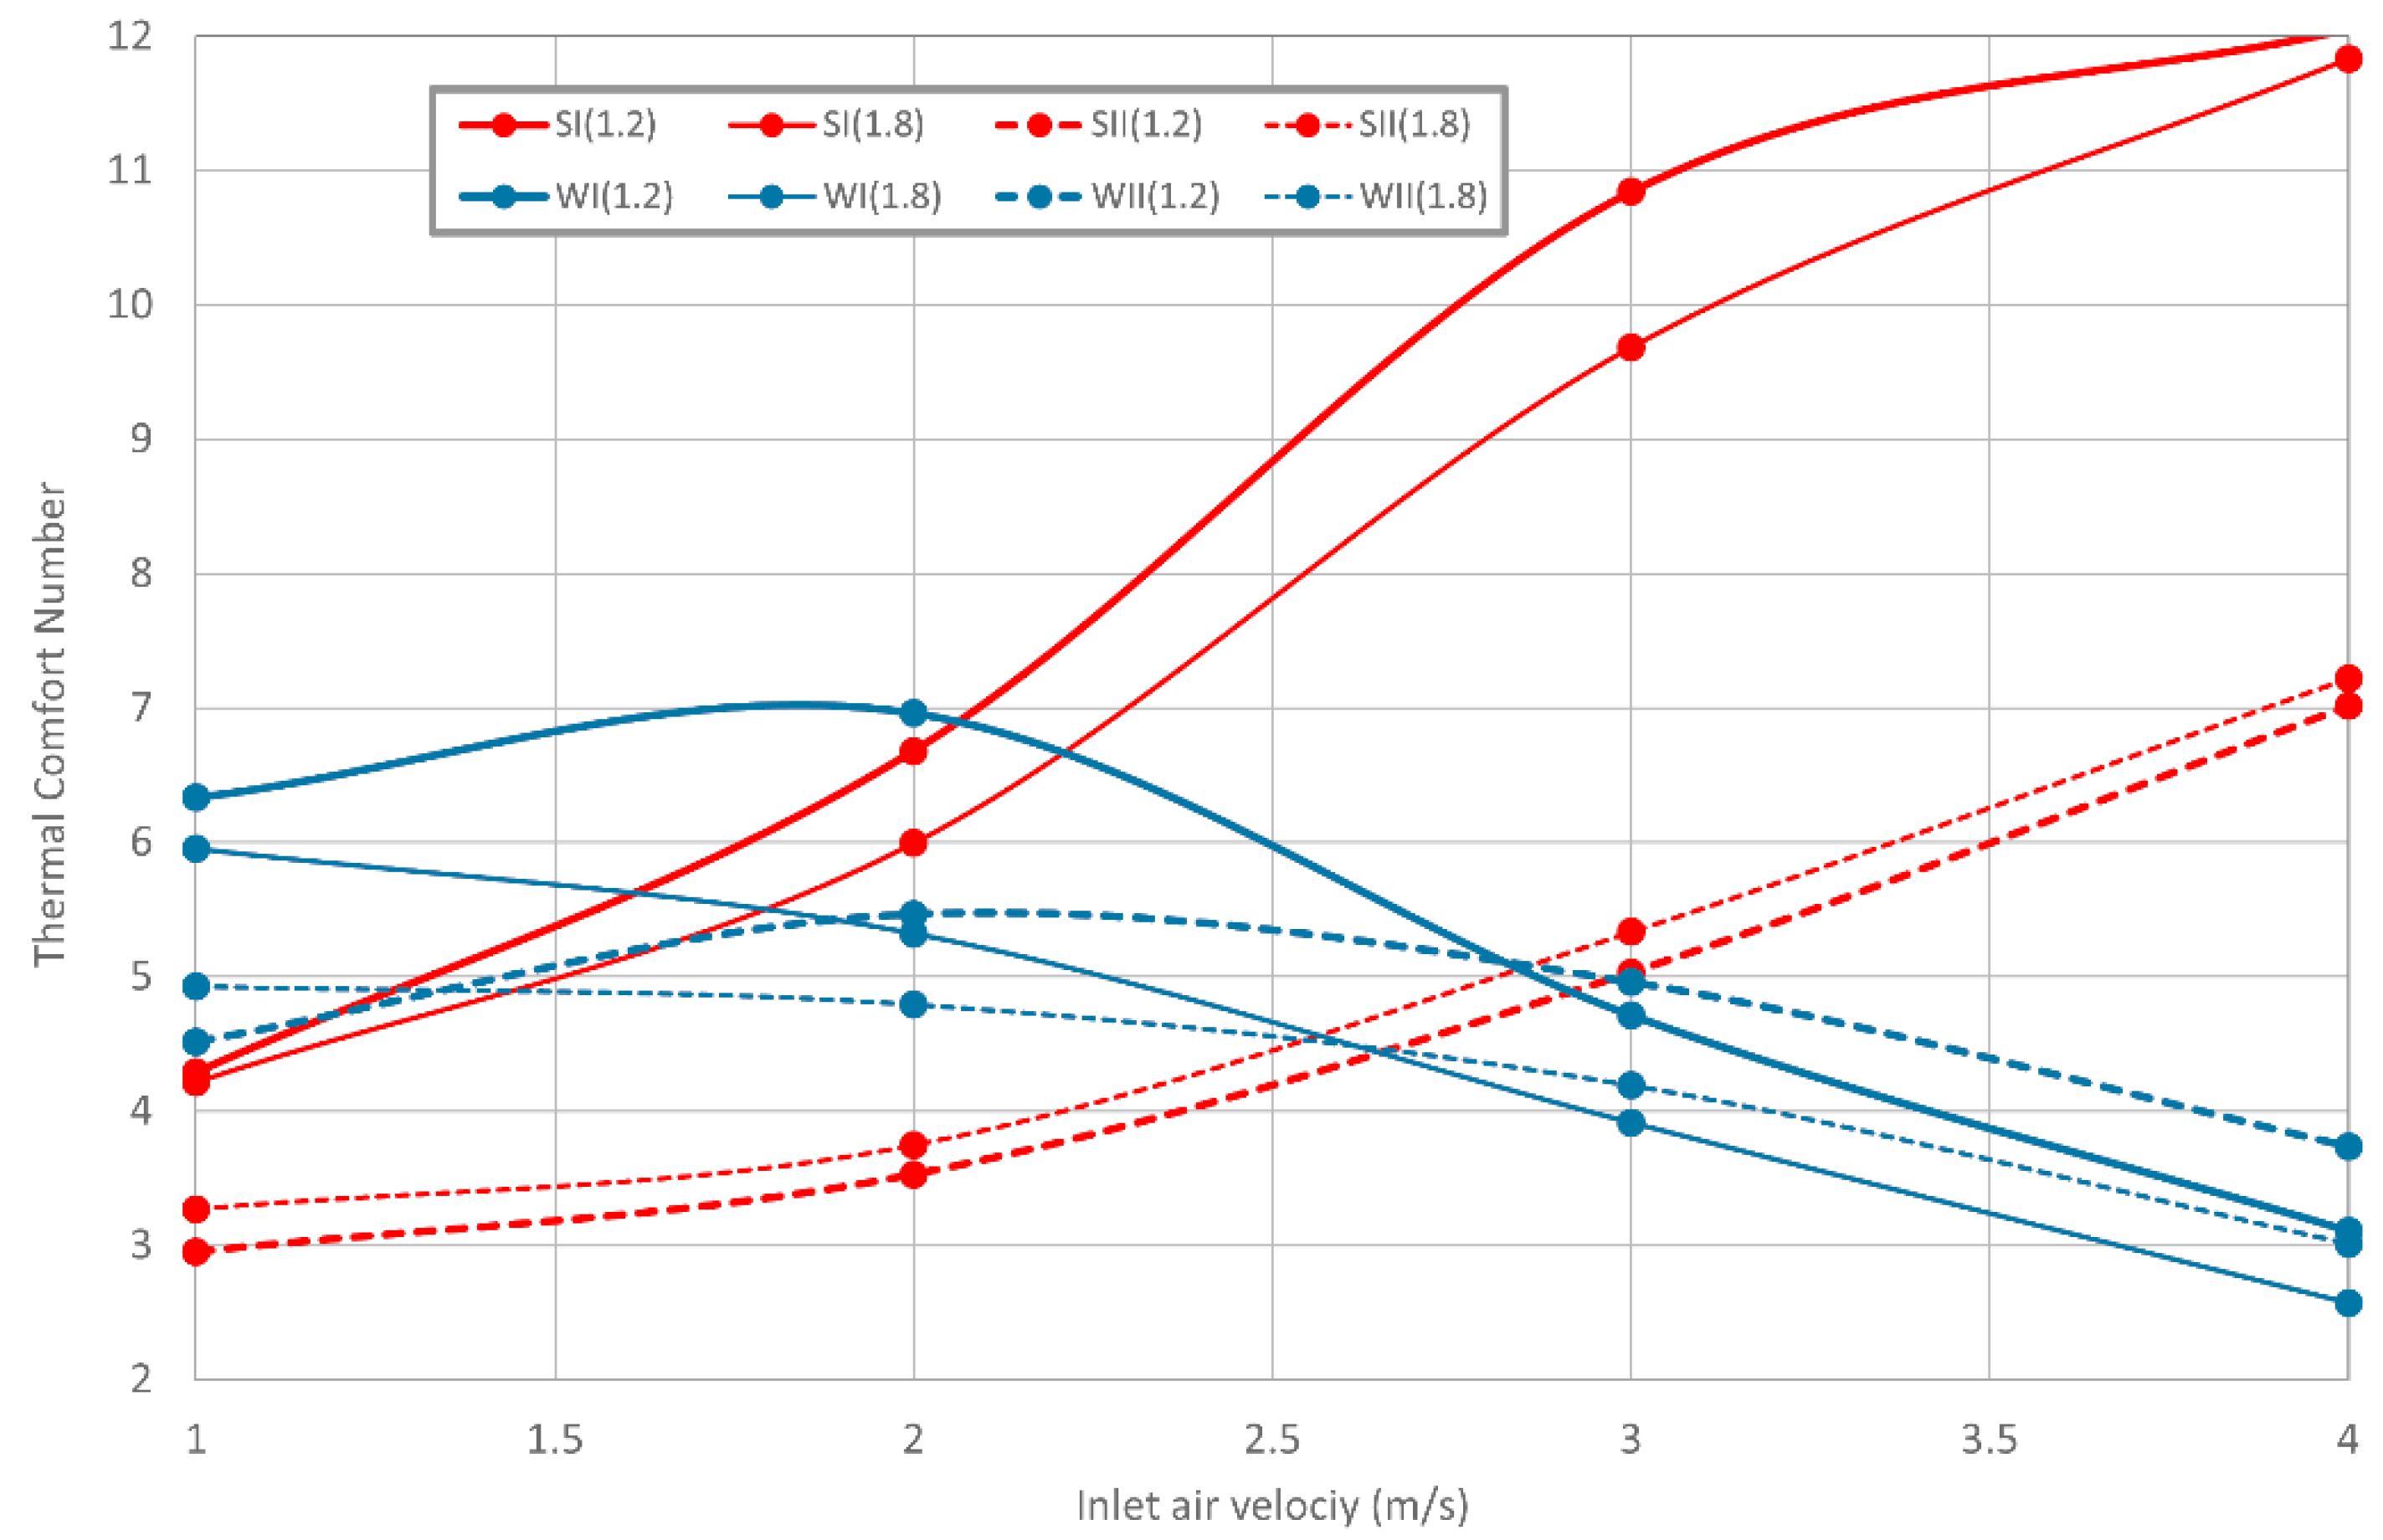
In accordance with the Figure 7, NTC:
- is generally higher for Case I than Case II;
- decreases when the inlet air velocity increase for winter condition and increases when the inlet air velocity increase for summer condition;
- is generally higher when the exit air terminal is located at 1.2 m than when it is located at 1.8 m;
- is higher for summer condition than for winter conditions for the highest air velocities, but lower for summer condition than for winter conditions for the lowest air velocities.
3.2. Air Quality
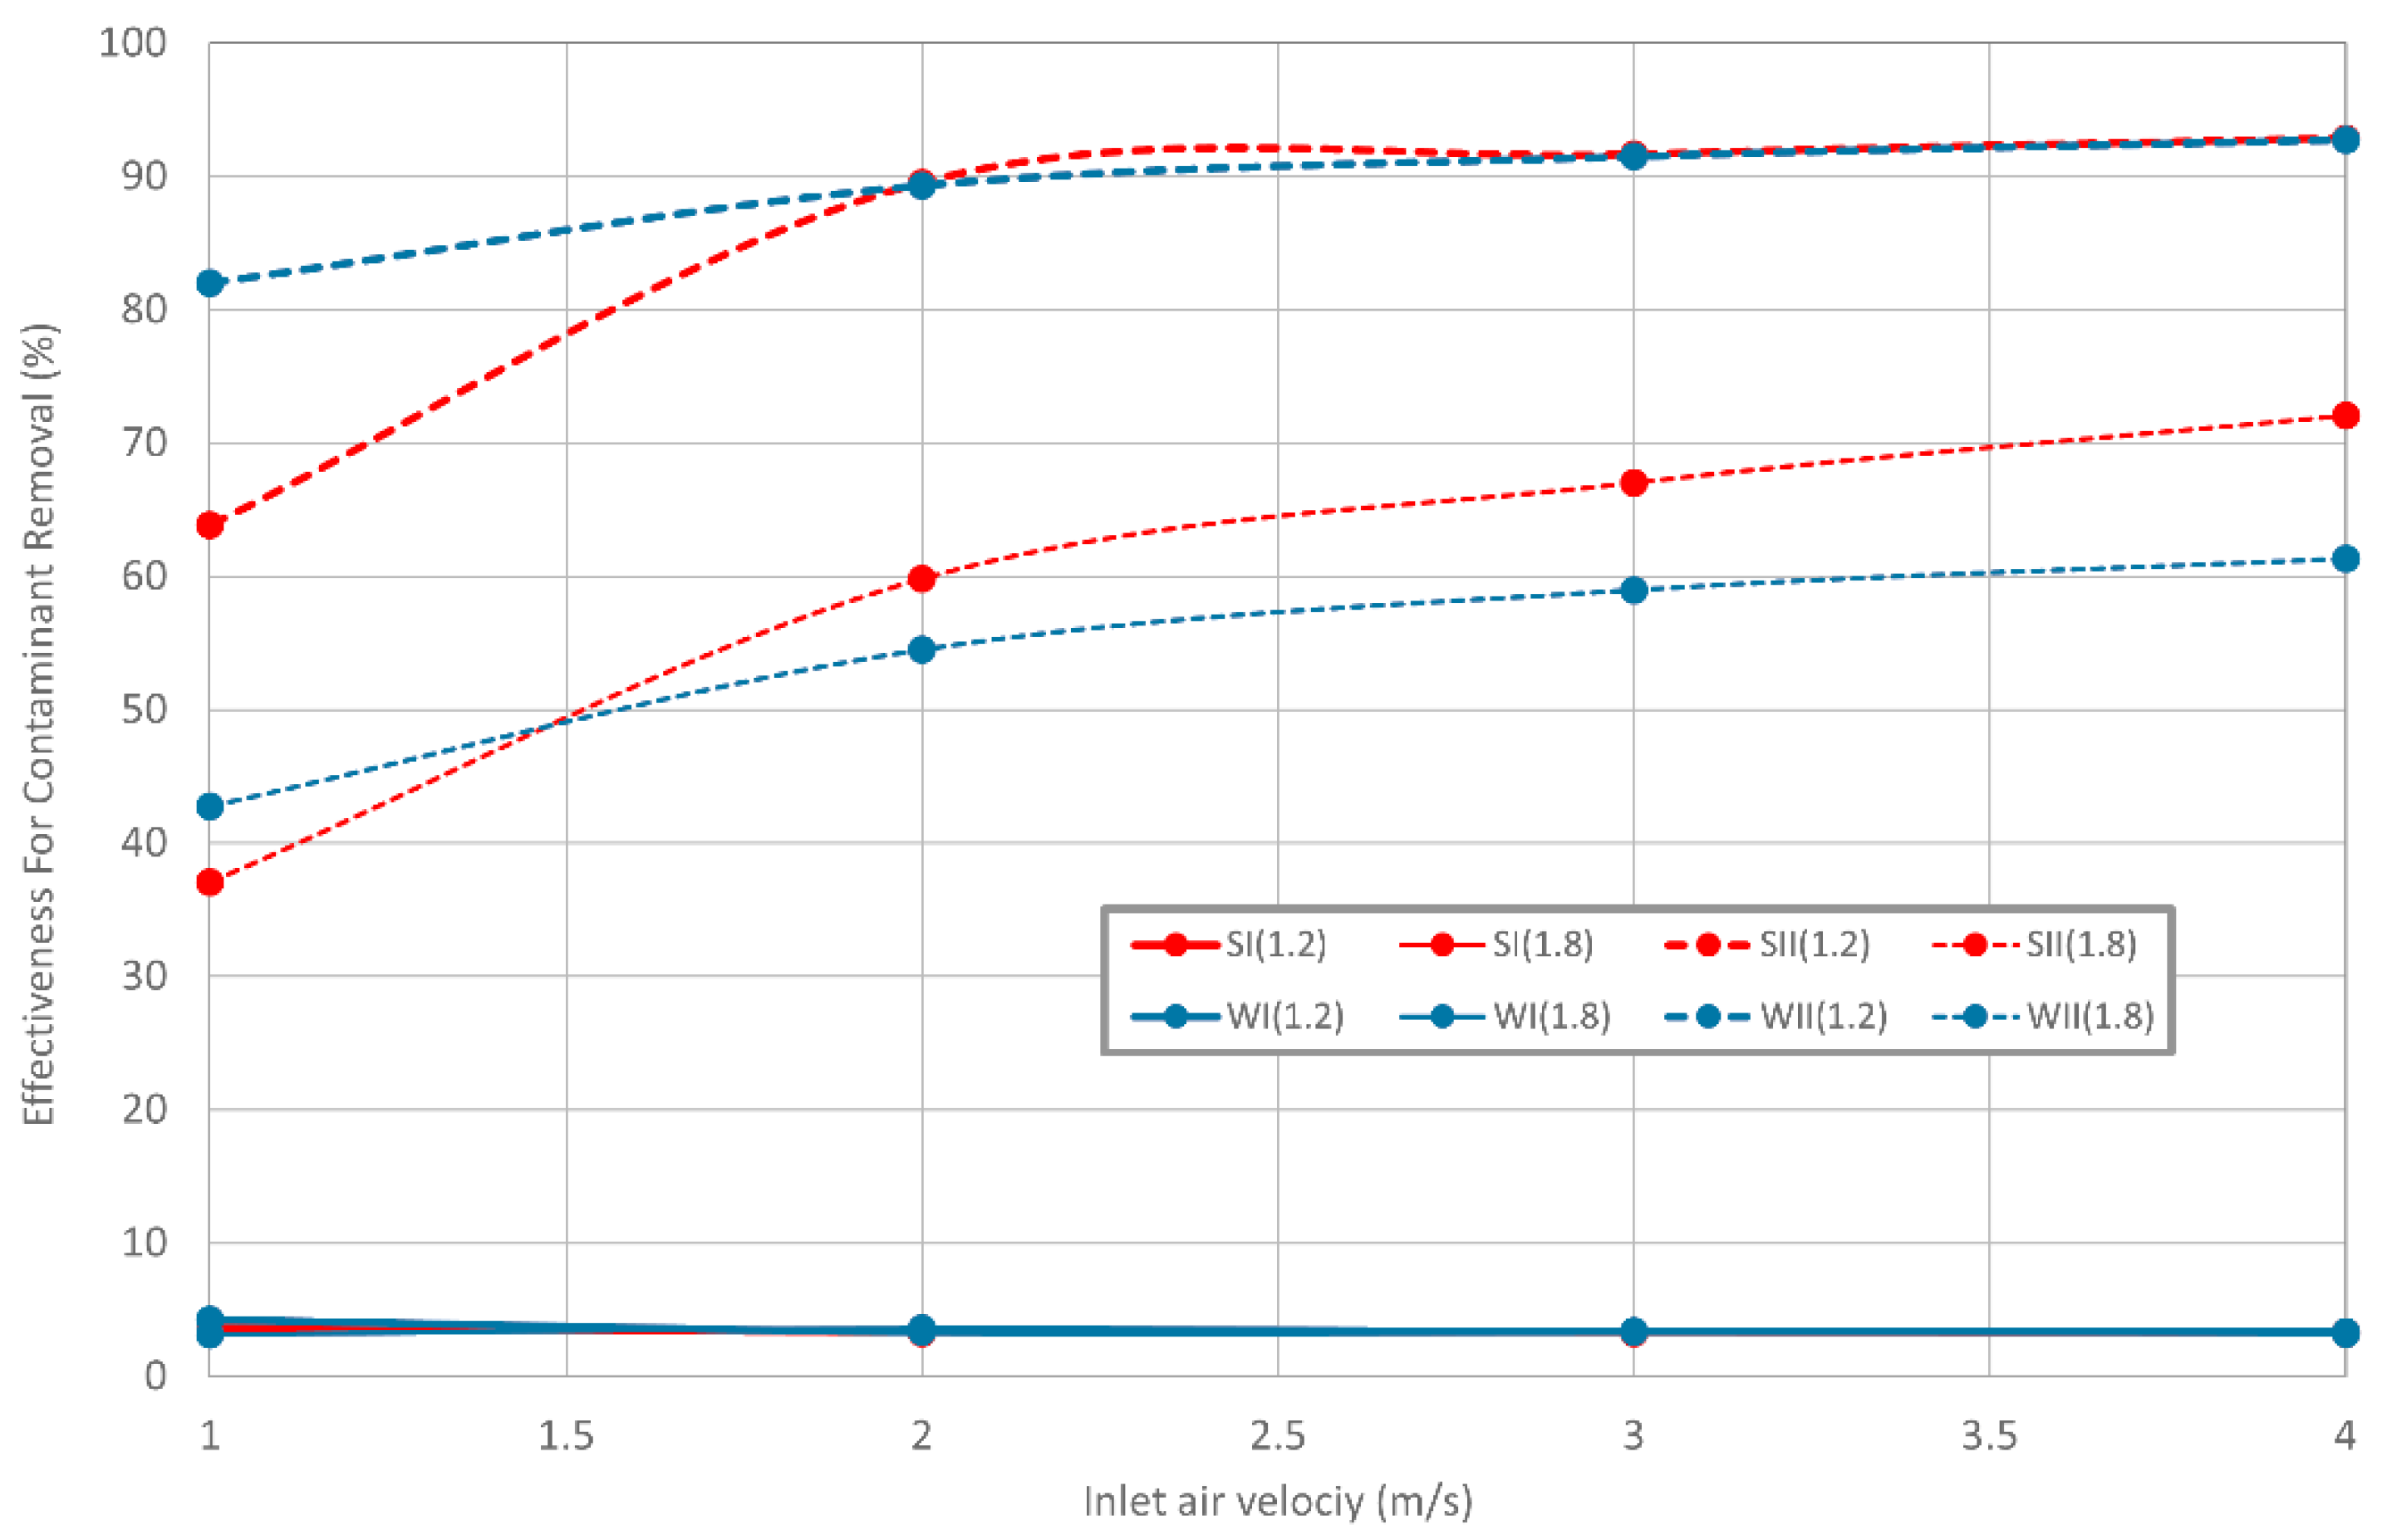
Based on the results in the Figure 8 the εAQ:
- is higher for Case II than Case I;
- increases for Case II as the inlet air velocity increases;
- is higher when the exit air terminal is located at 1.2 m than when it is at 1.8 m for the Case II.
- is almost the same for winter and summer conditions.
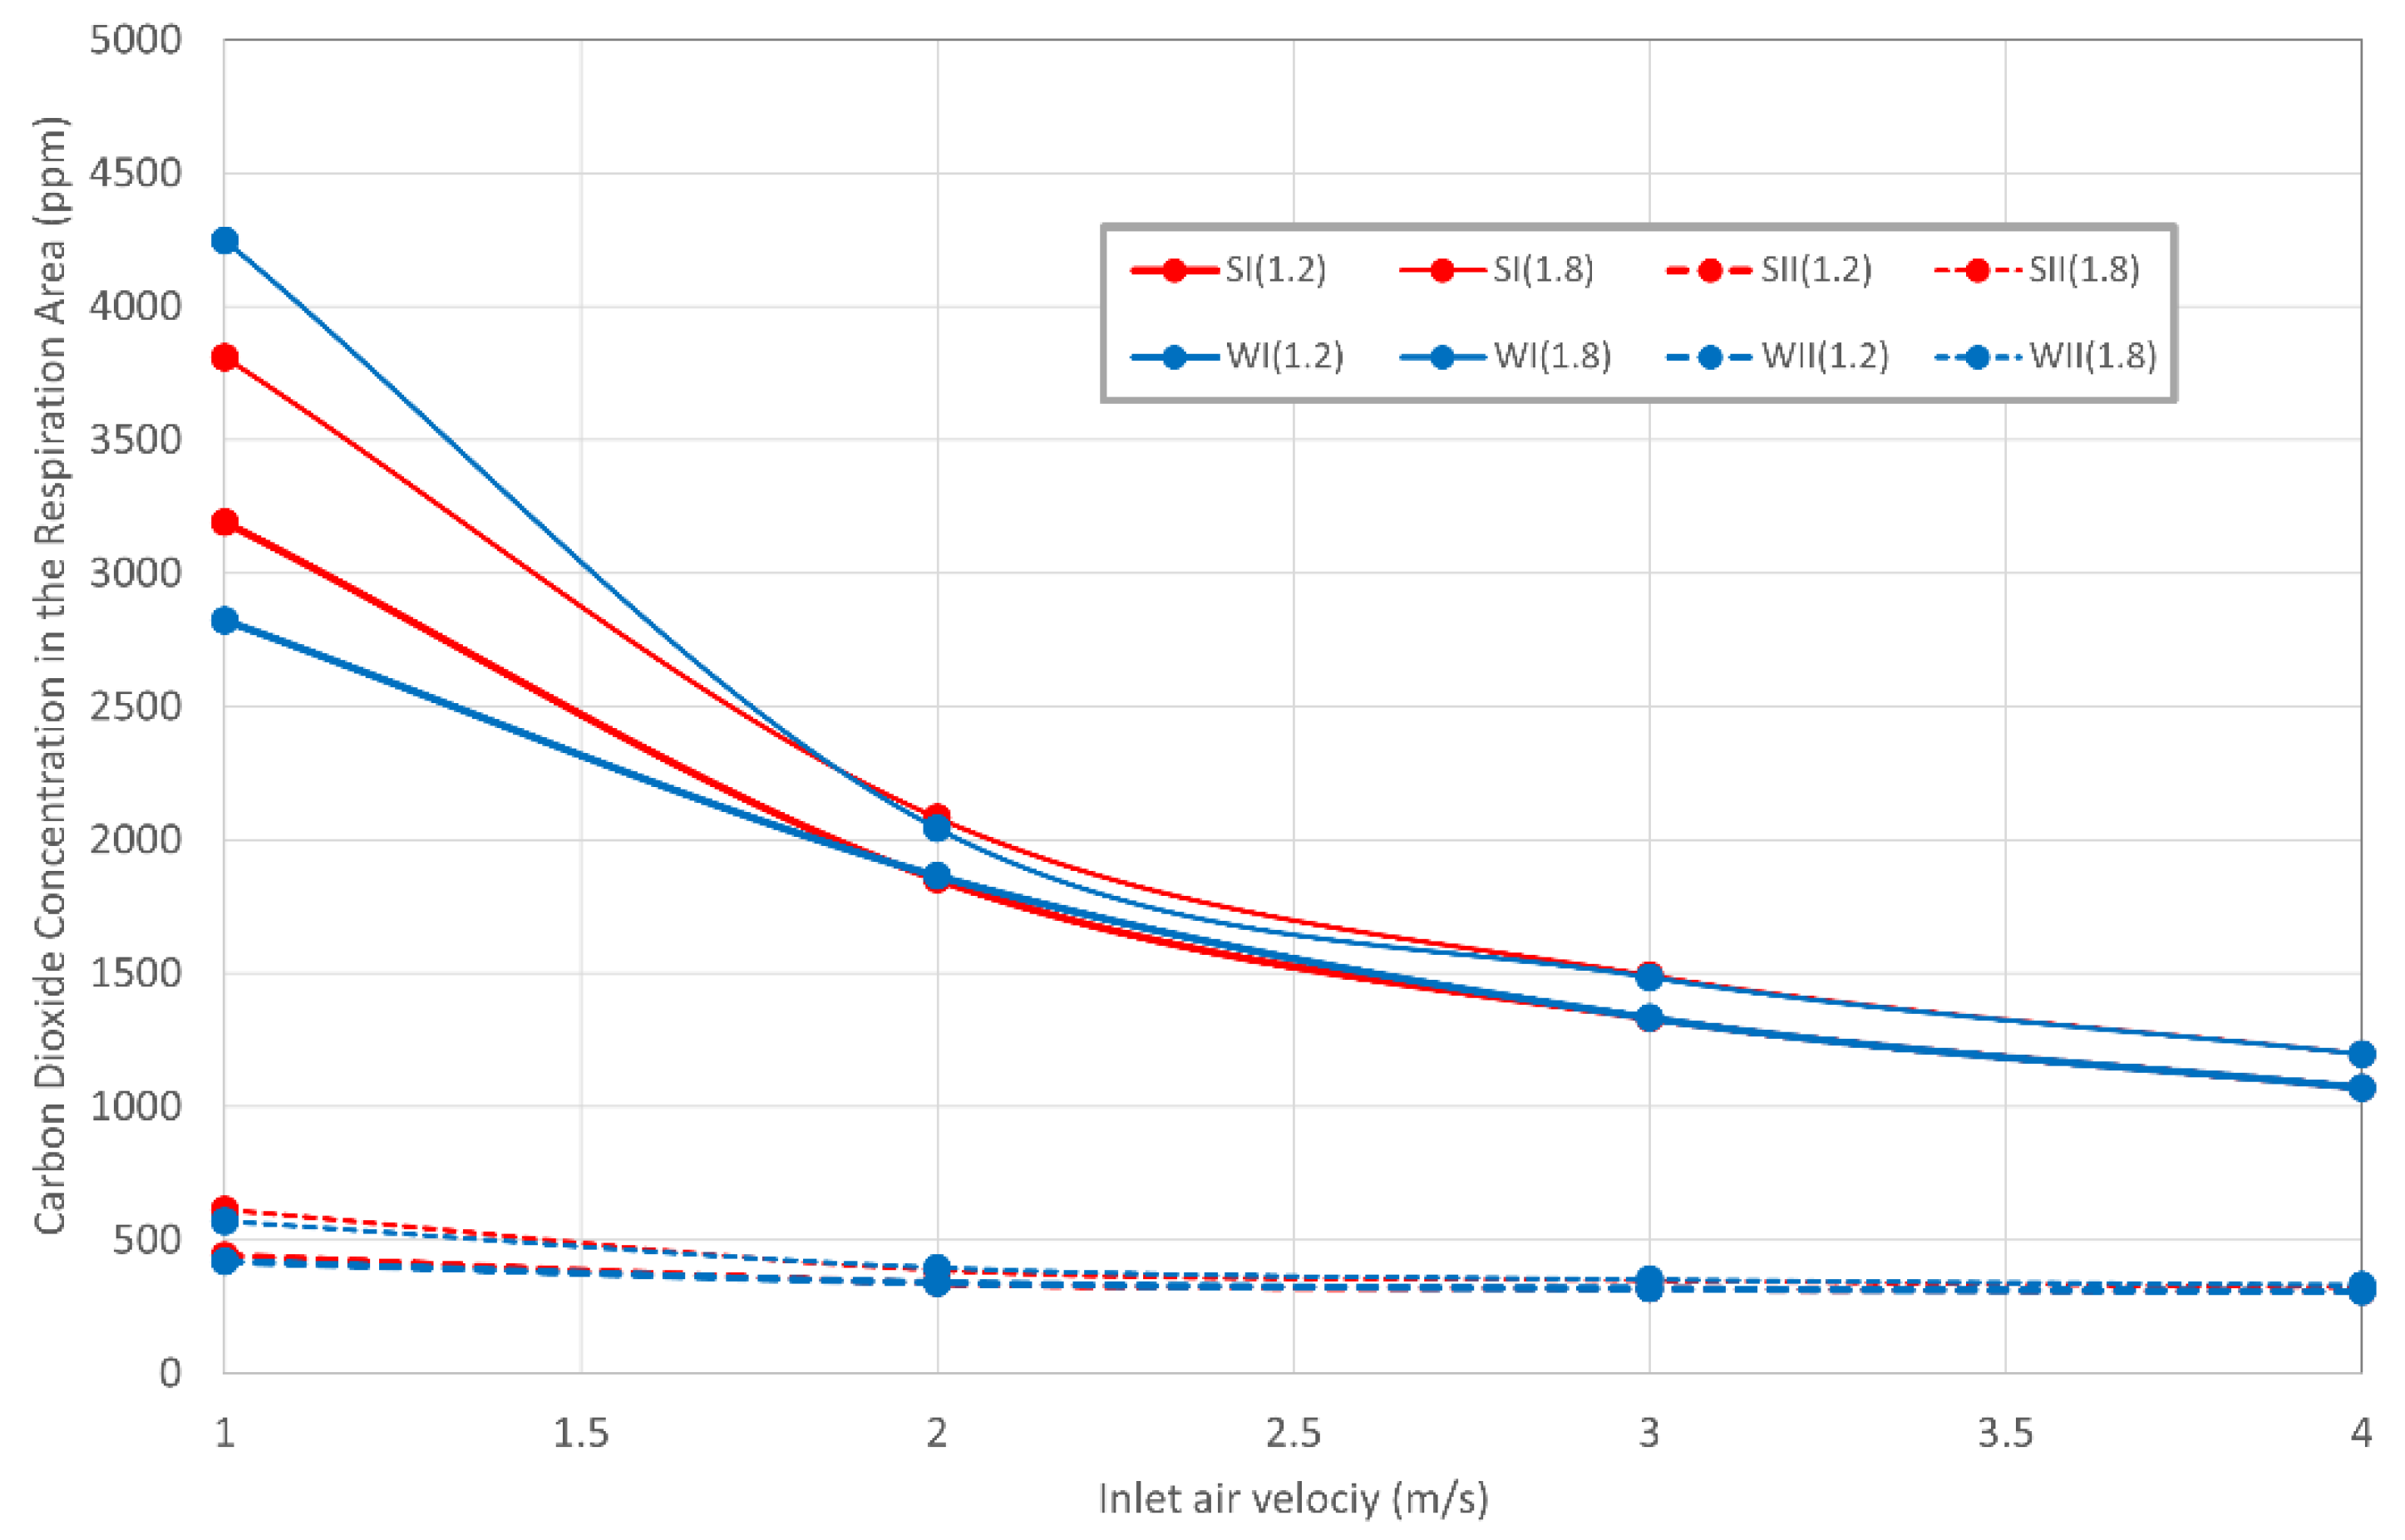
Based on the results of Figure 9 the CO2 concentration in the respiration area:
- is higher for Case I than Case II;
- decreases when the inlet air velocity increases;
- is higher when the exit air terminal is located at 1.8 m than when it is located at 1.2 m.
- is almost the same for winter and summer conditions for Case II.
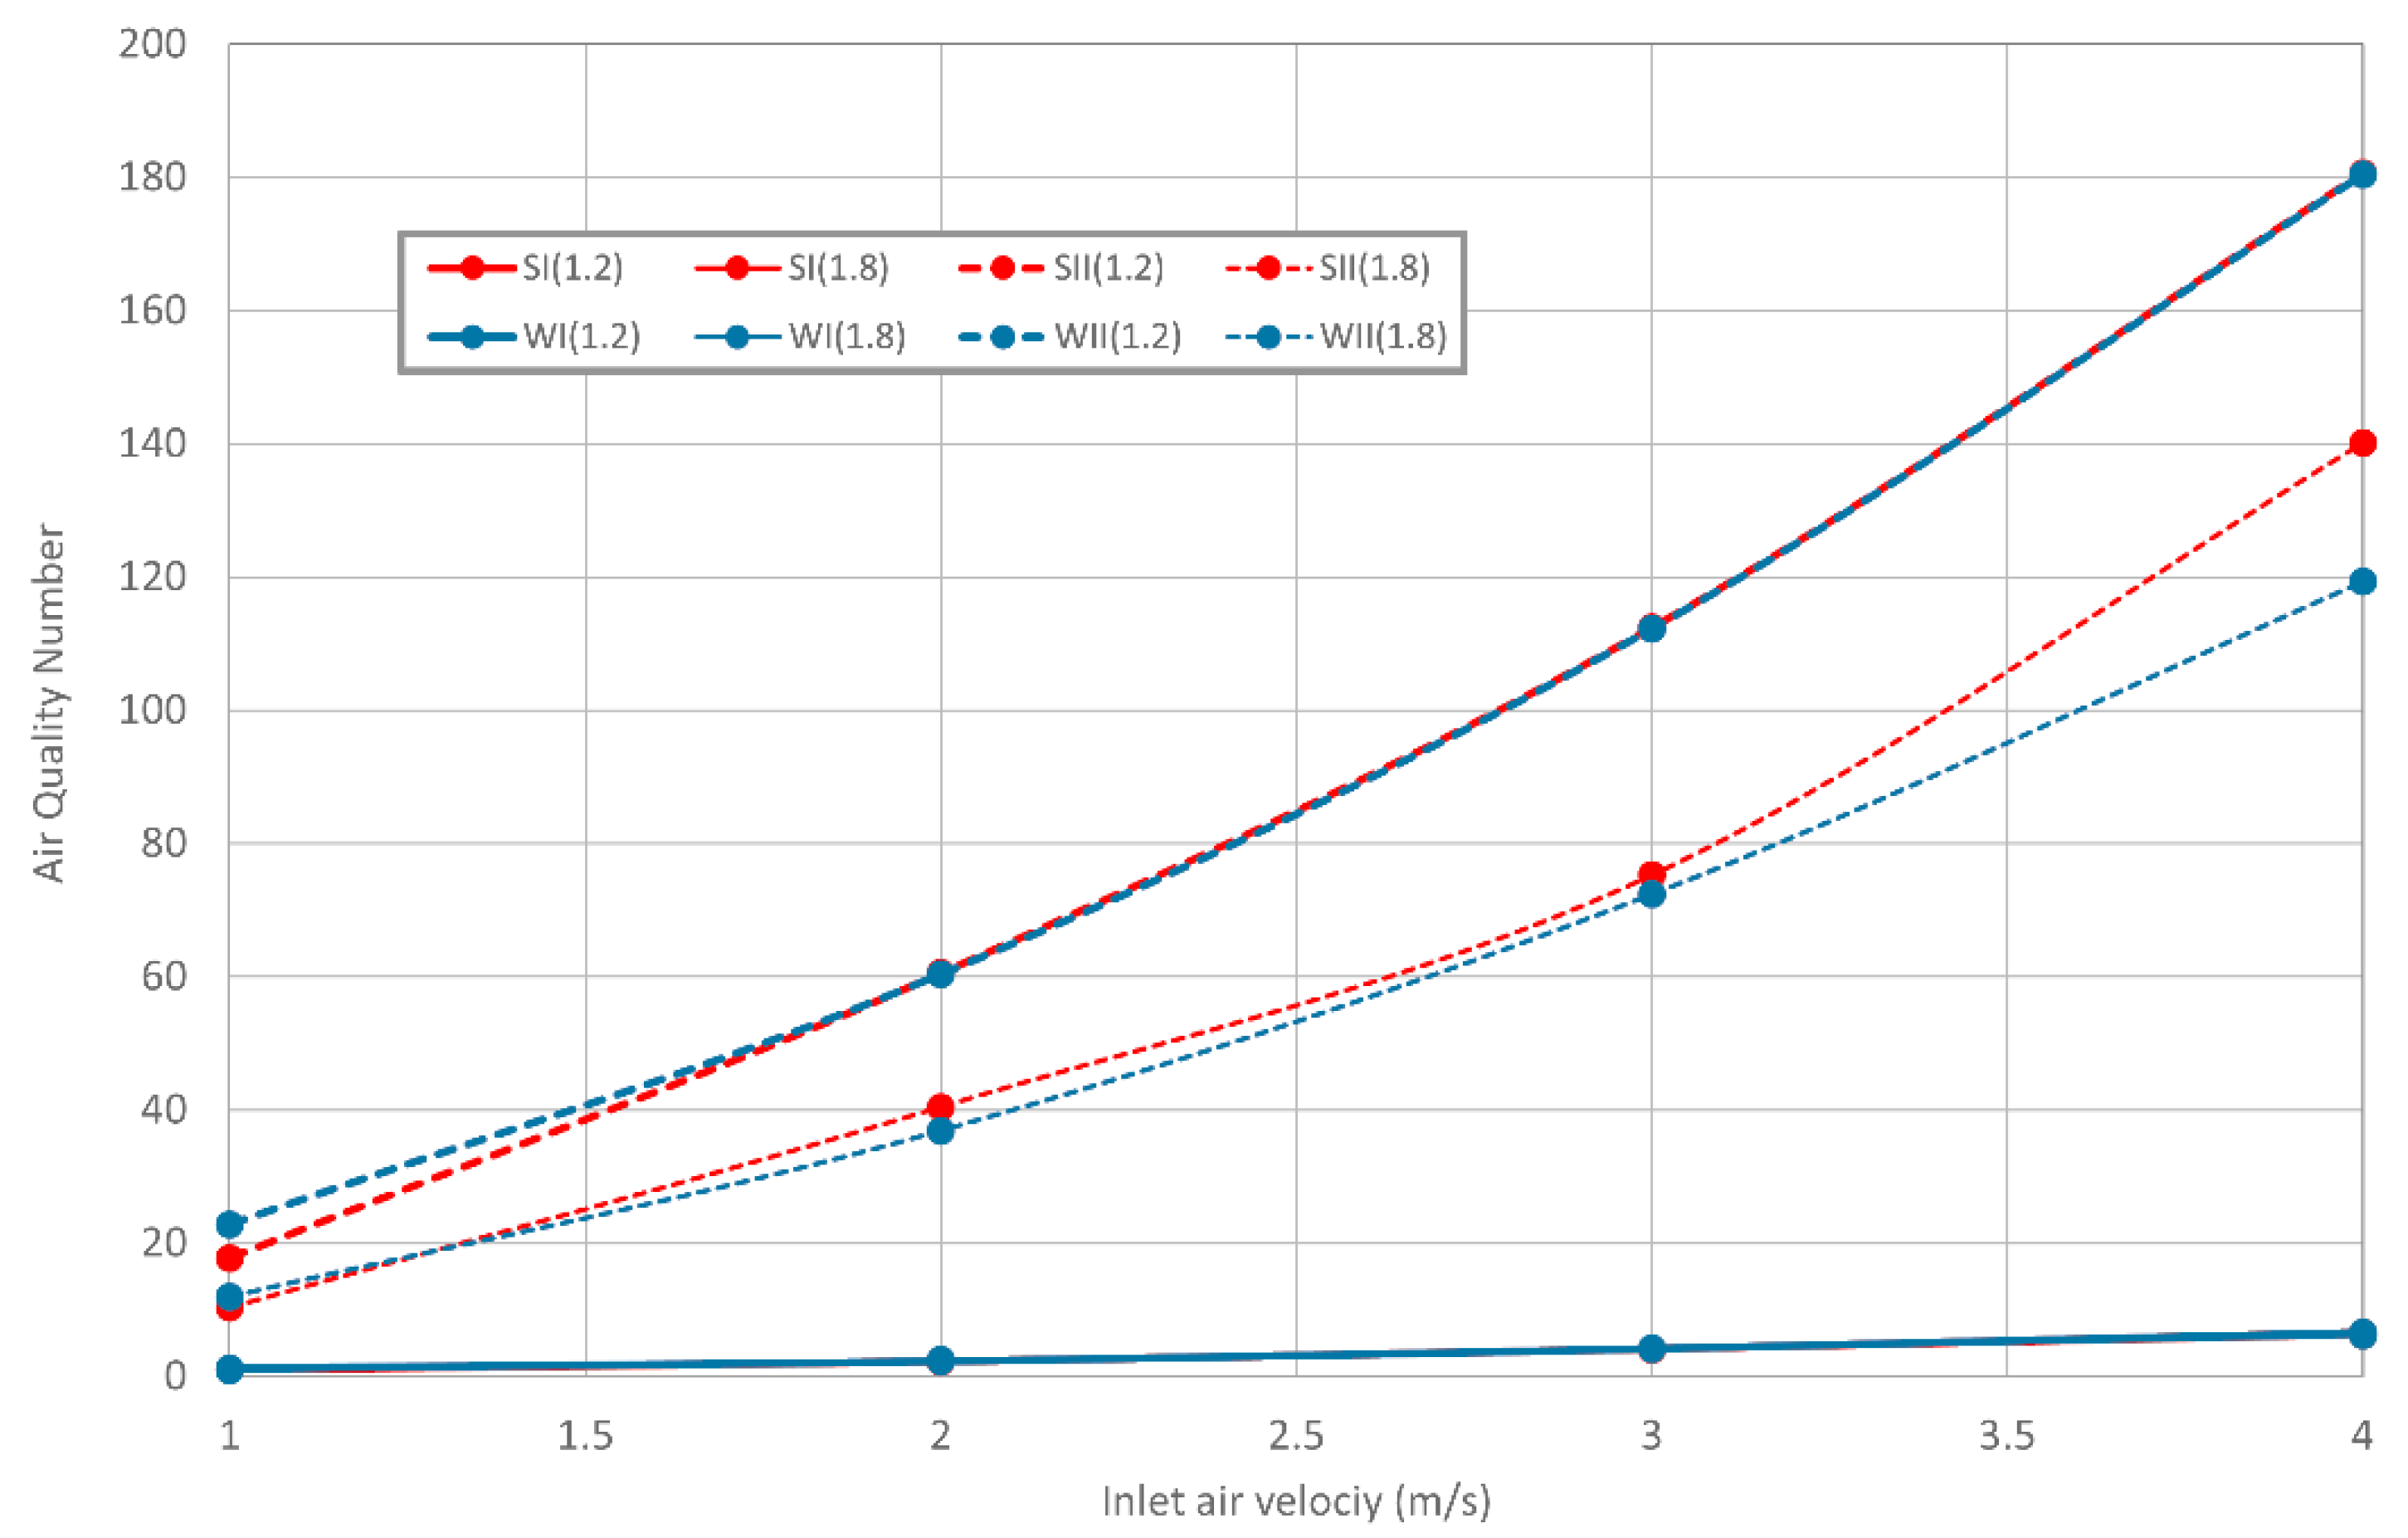
Based on the results of Figure 10, NAQ:
- is higher for Case II than Case I;
- generally, it increases as the inlet air velocity increases, but NAQ is higher for Case II than Case I;
- for Case II, it is generally higher when the exit air terminal is located at 1.2 m than when it is at 1.8 m;
- is almost similar for winter and summer conditions.
3.3. Draught Risk
The variations of εDR, body mean DR and the NDR are presented in Figure 11, Figure 12 and Figure 13 respectively.
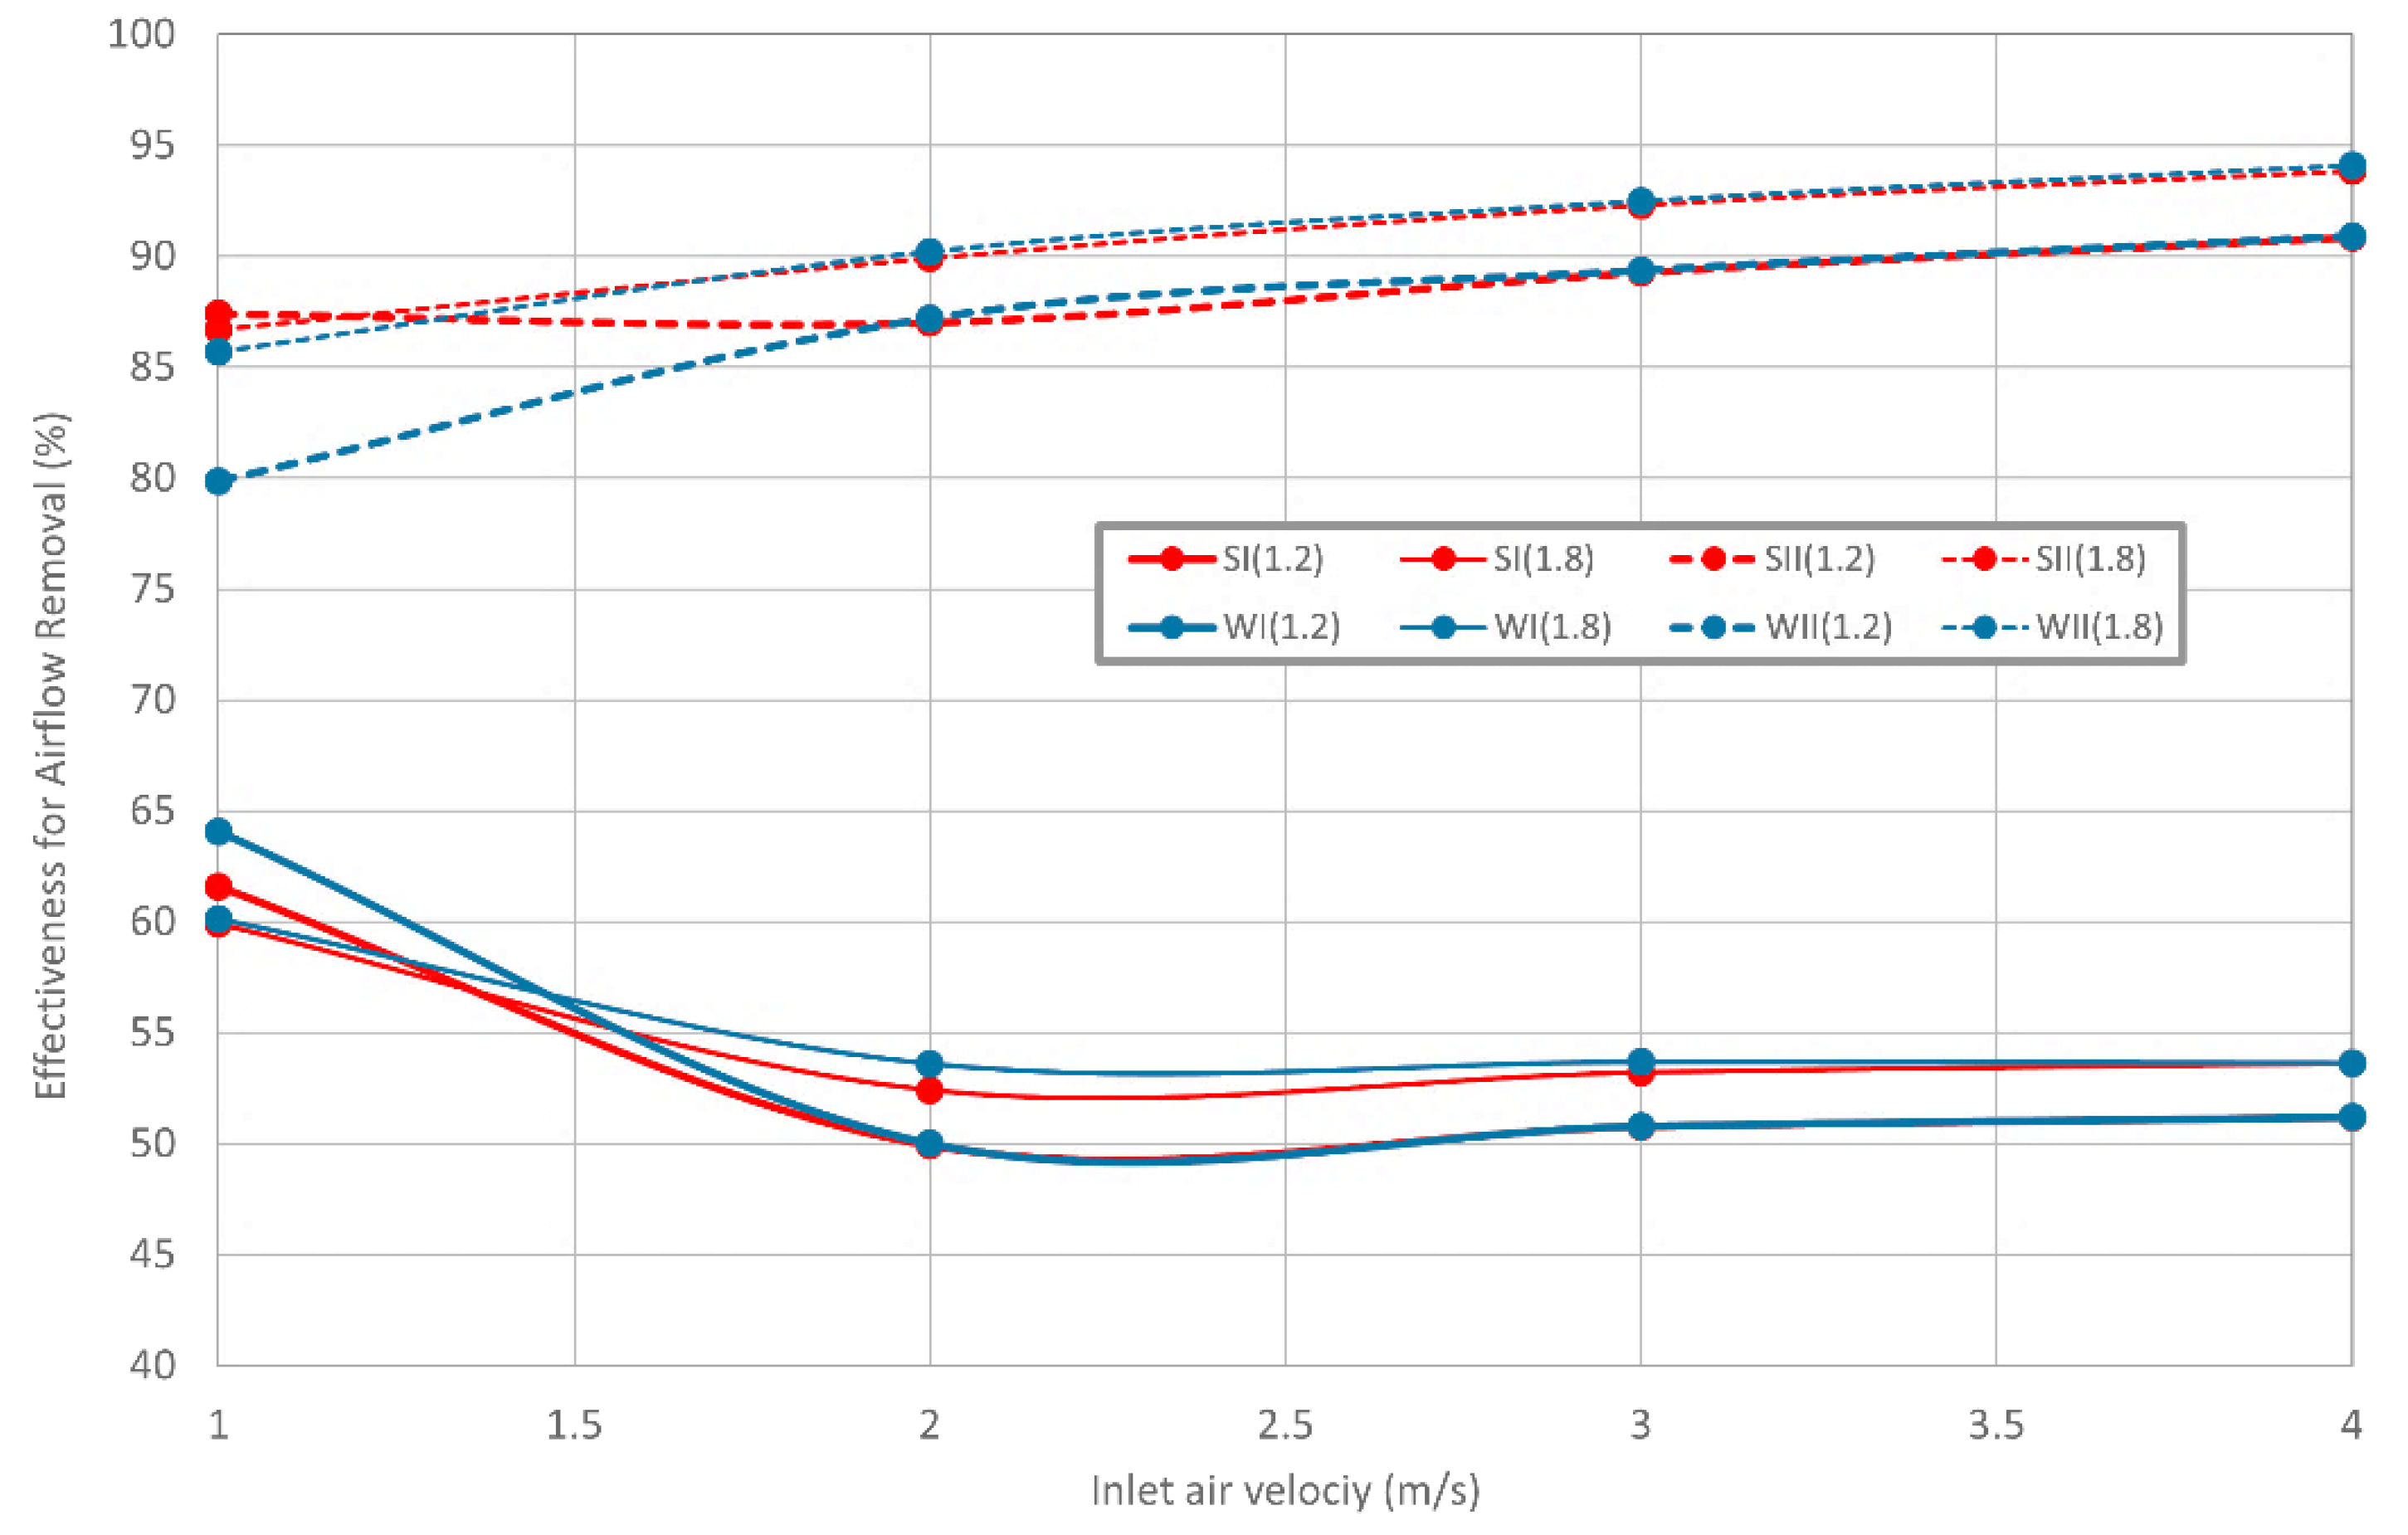
Based on the results of Figure 11, εDR:
- is higher for Case II than Case I;
- in the Case II it increase slightly as the inlet air velocity increases, but in Case I it decreases slightly as the inlet air velocity increases;
- generally, it is higher when the exit air terminal is located at 1.8 m than when it is located at 1.2 m;
- is almost similar for winter and summer conditions.
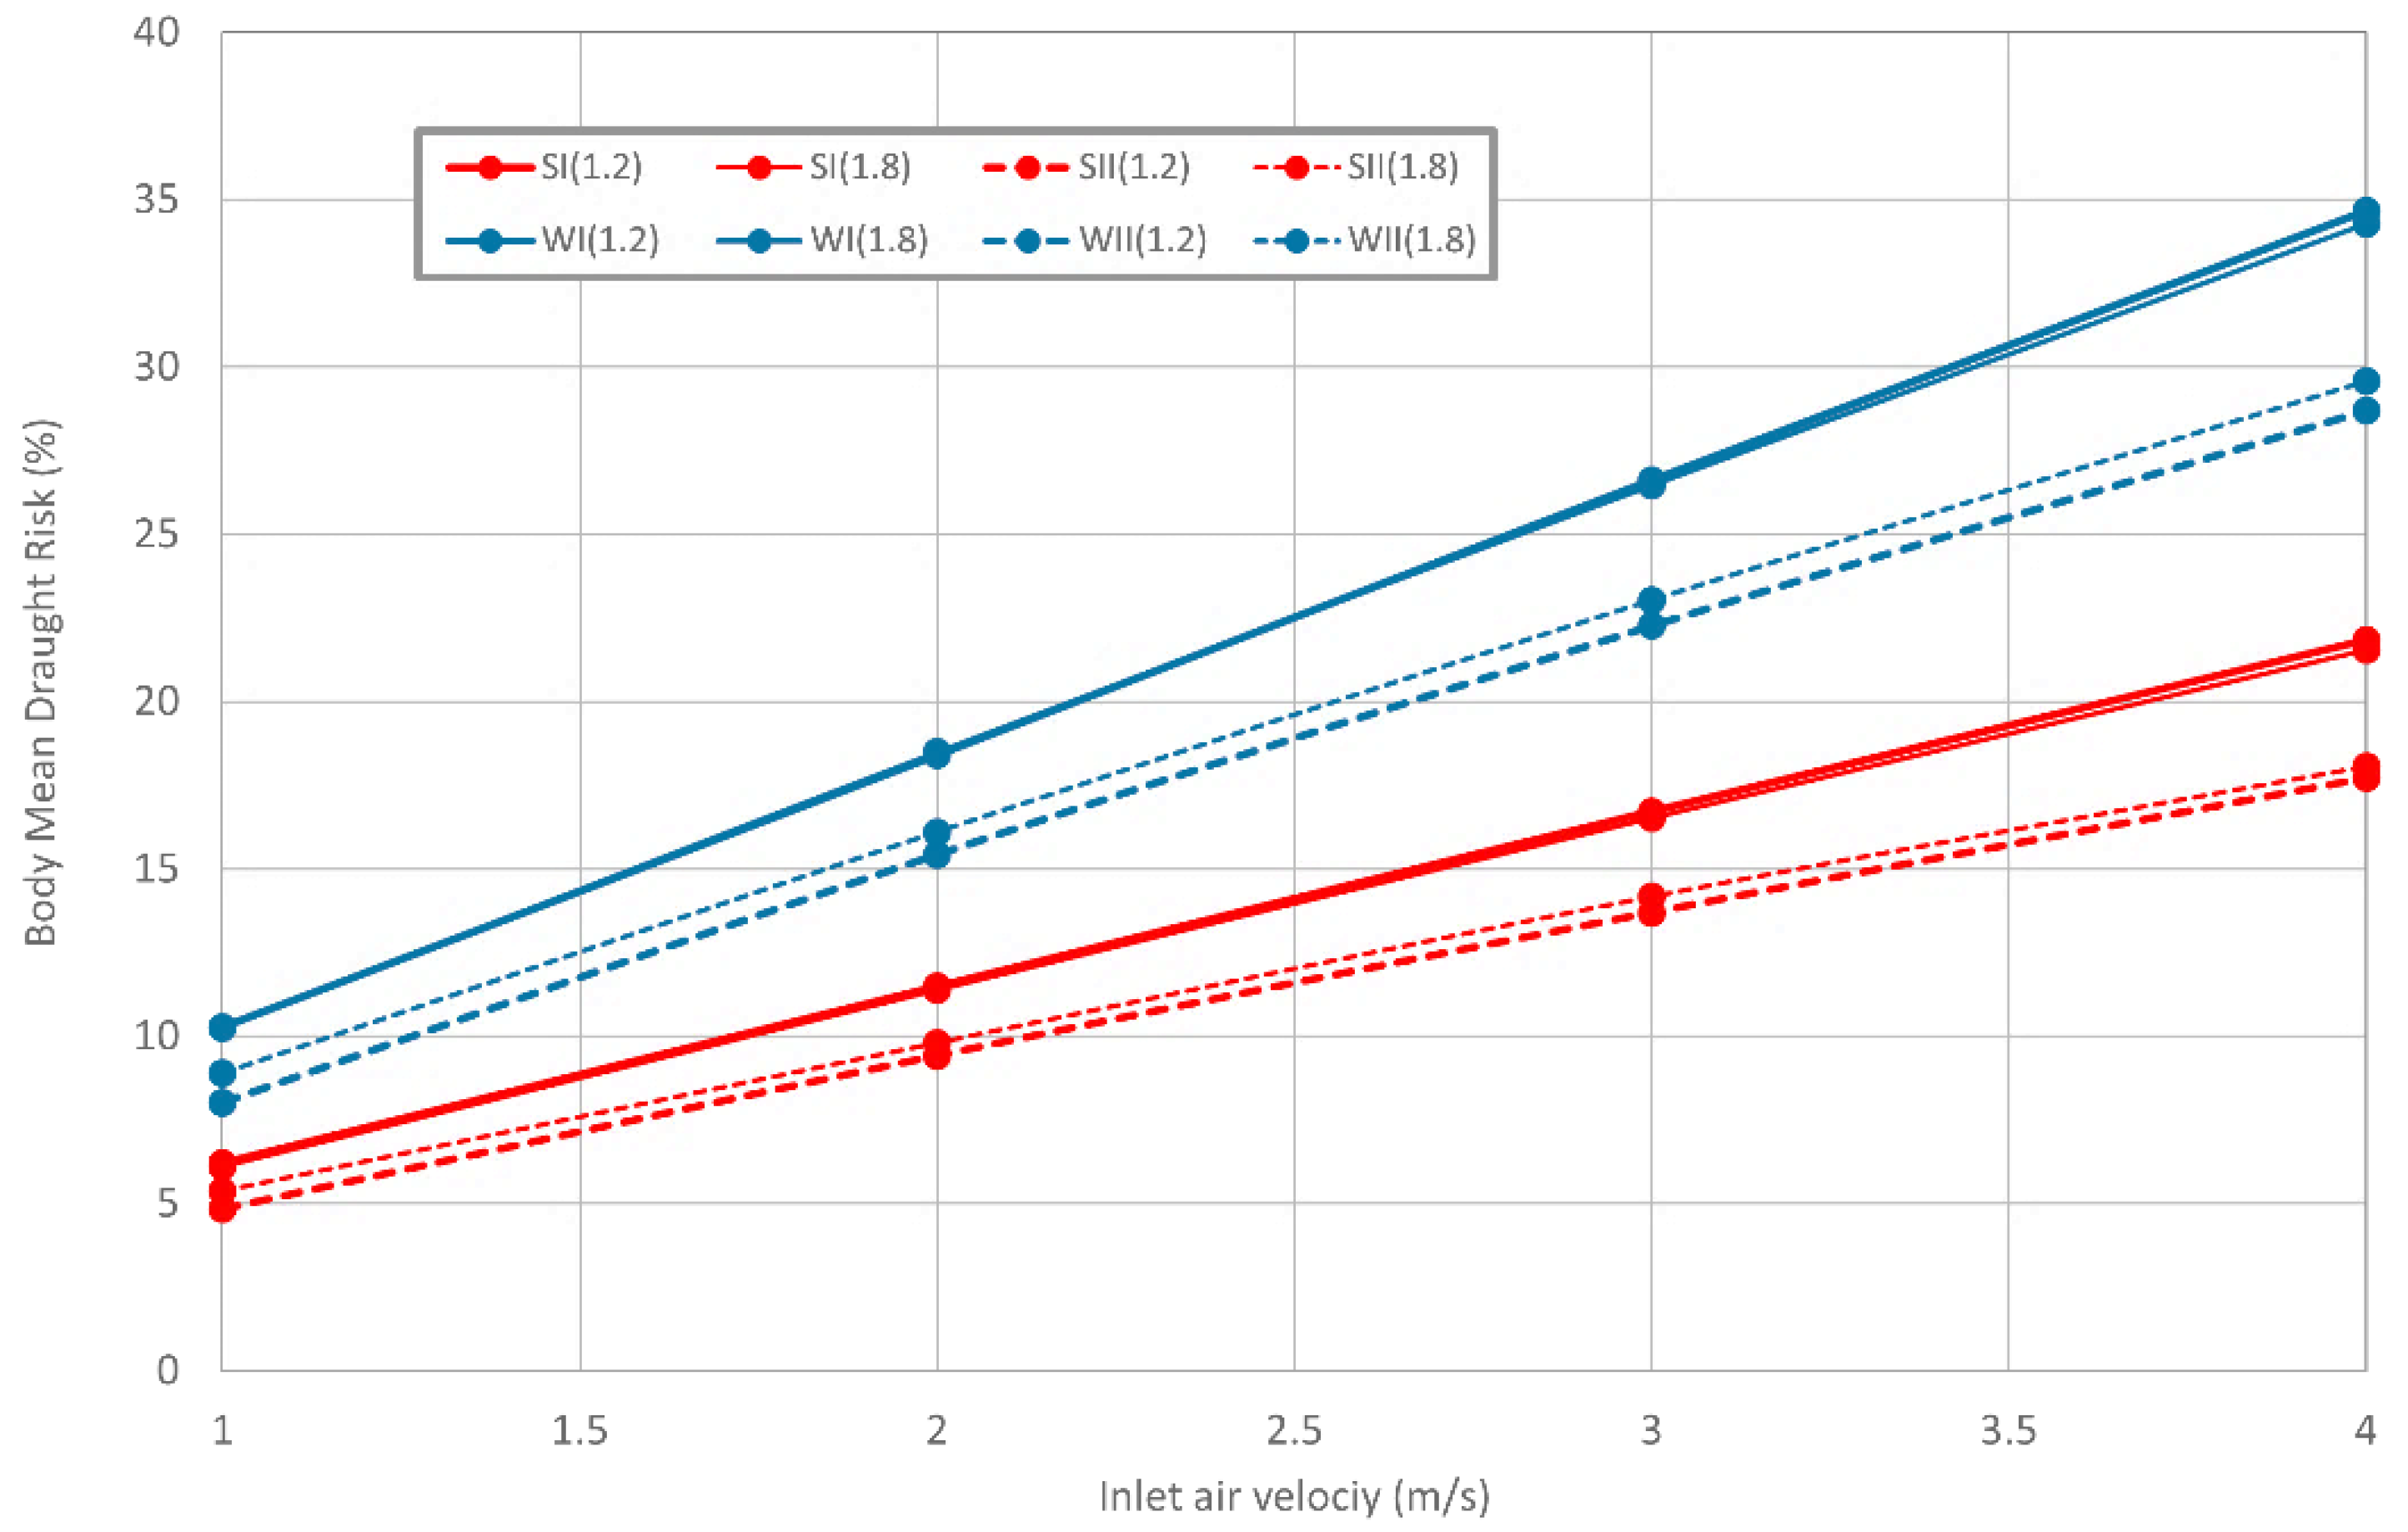
Based on the results of Figure 12, the body mean DR:
- for Case I is higher than Case II;
- increases when the inlet air velocity increases;
- for the Case II, is slightly higher when the exit air terminal is located 1.8 m than when the exit air terminal is located 1.2 m;
- is higher for winter condition than for summer conditions.
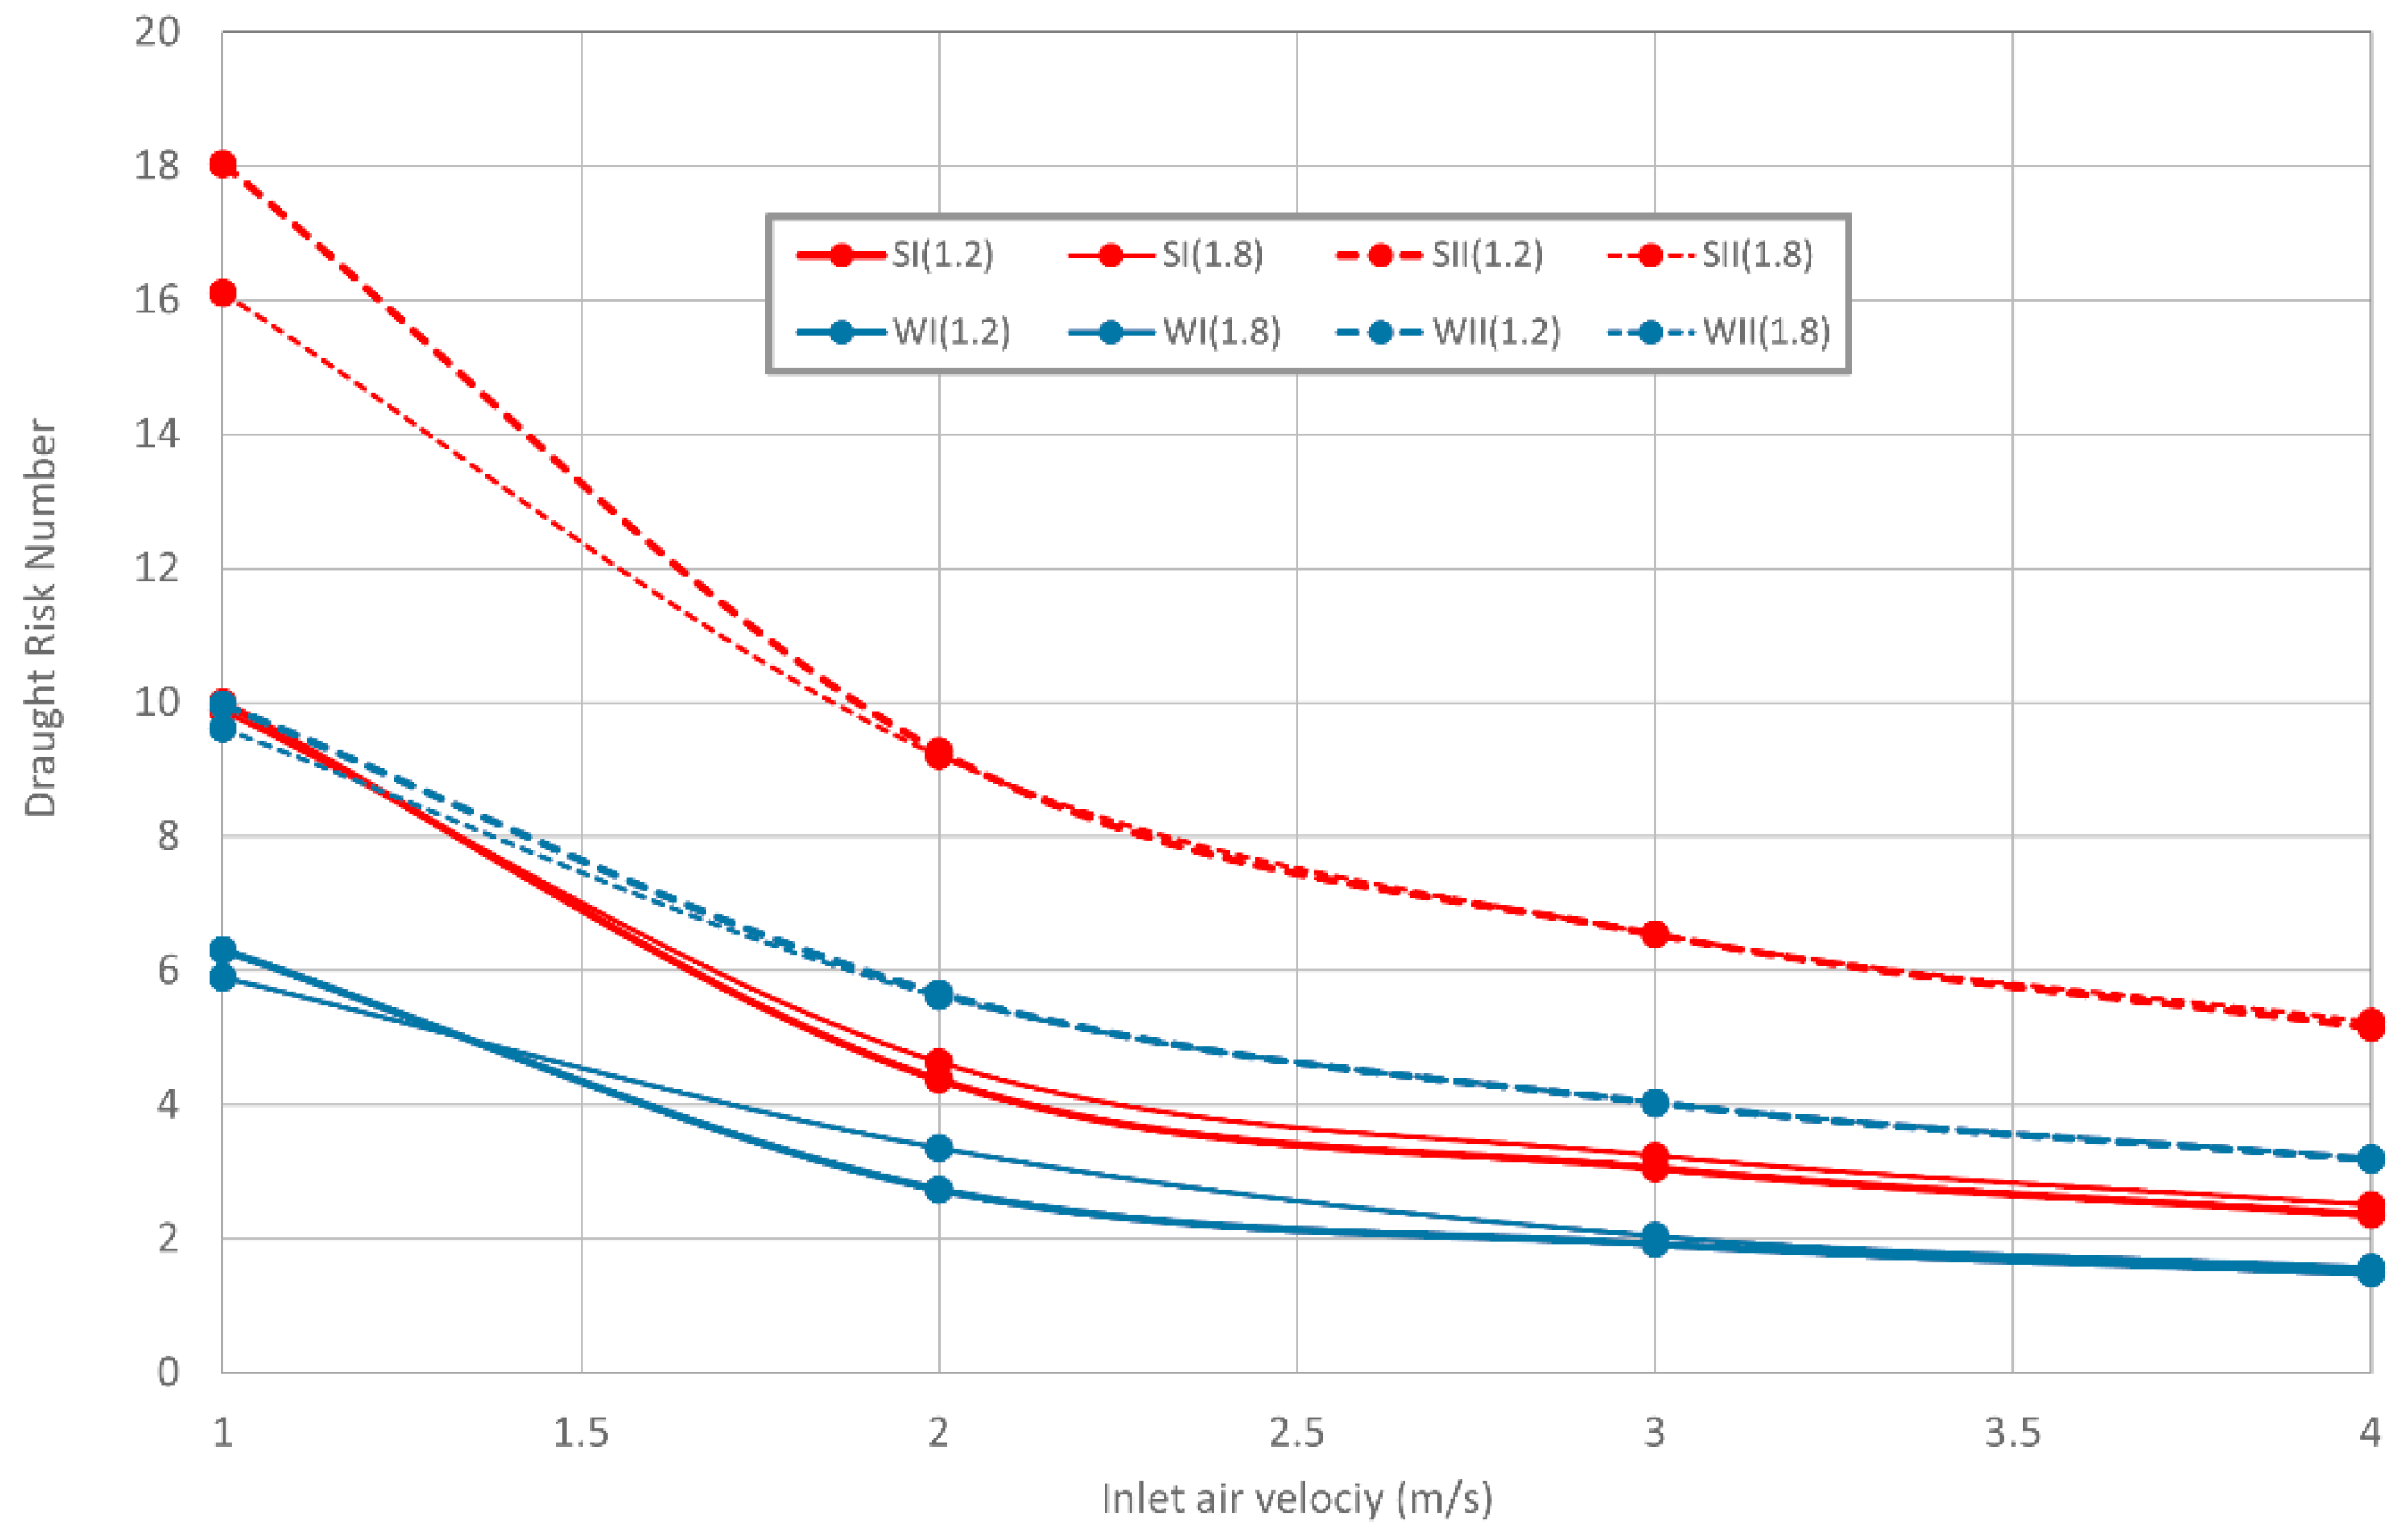
Based on the results of Figure 13, NDR:
- is higher for Case II than Case I;
- it decreases as the inlet air velocity increases;
- is quite similar for the exit air terminal located at 1.2 m and when it is located at 1.8 m;
- is higher for summer condition than for winter conditions.
3.4. Air Distribution Index and Air Distribution Turbulence Index
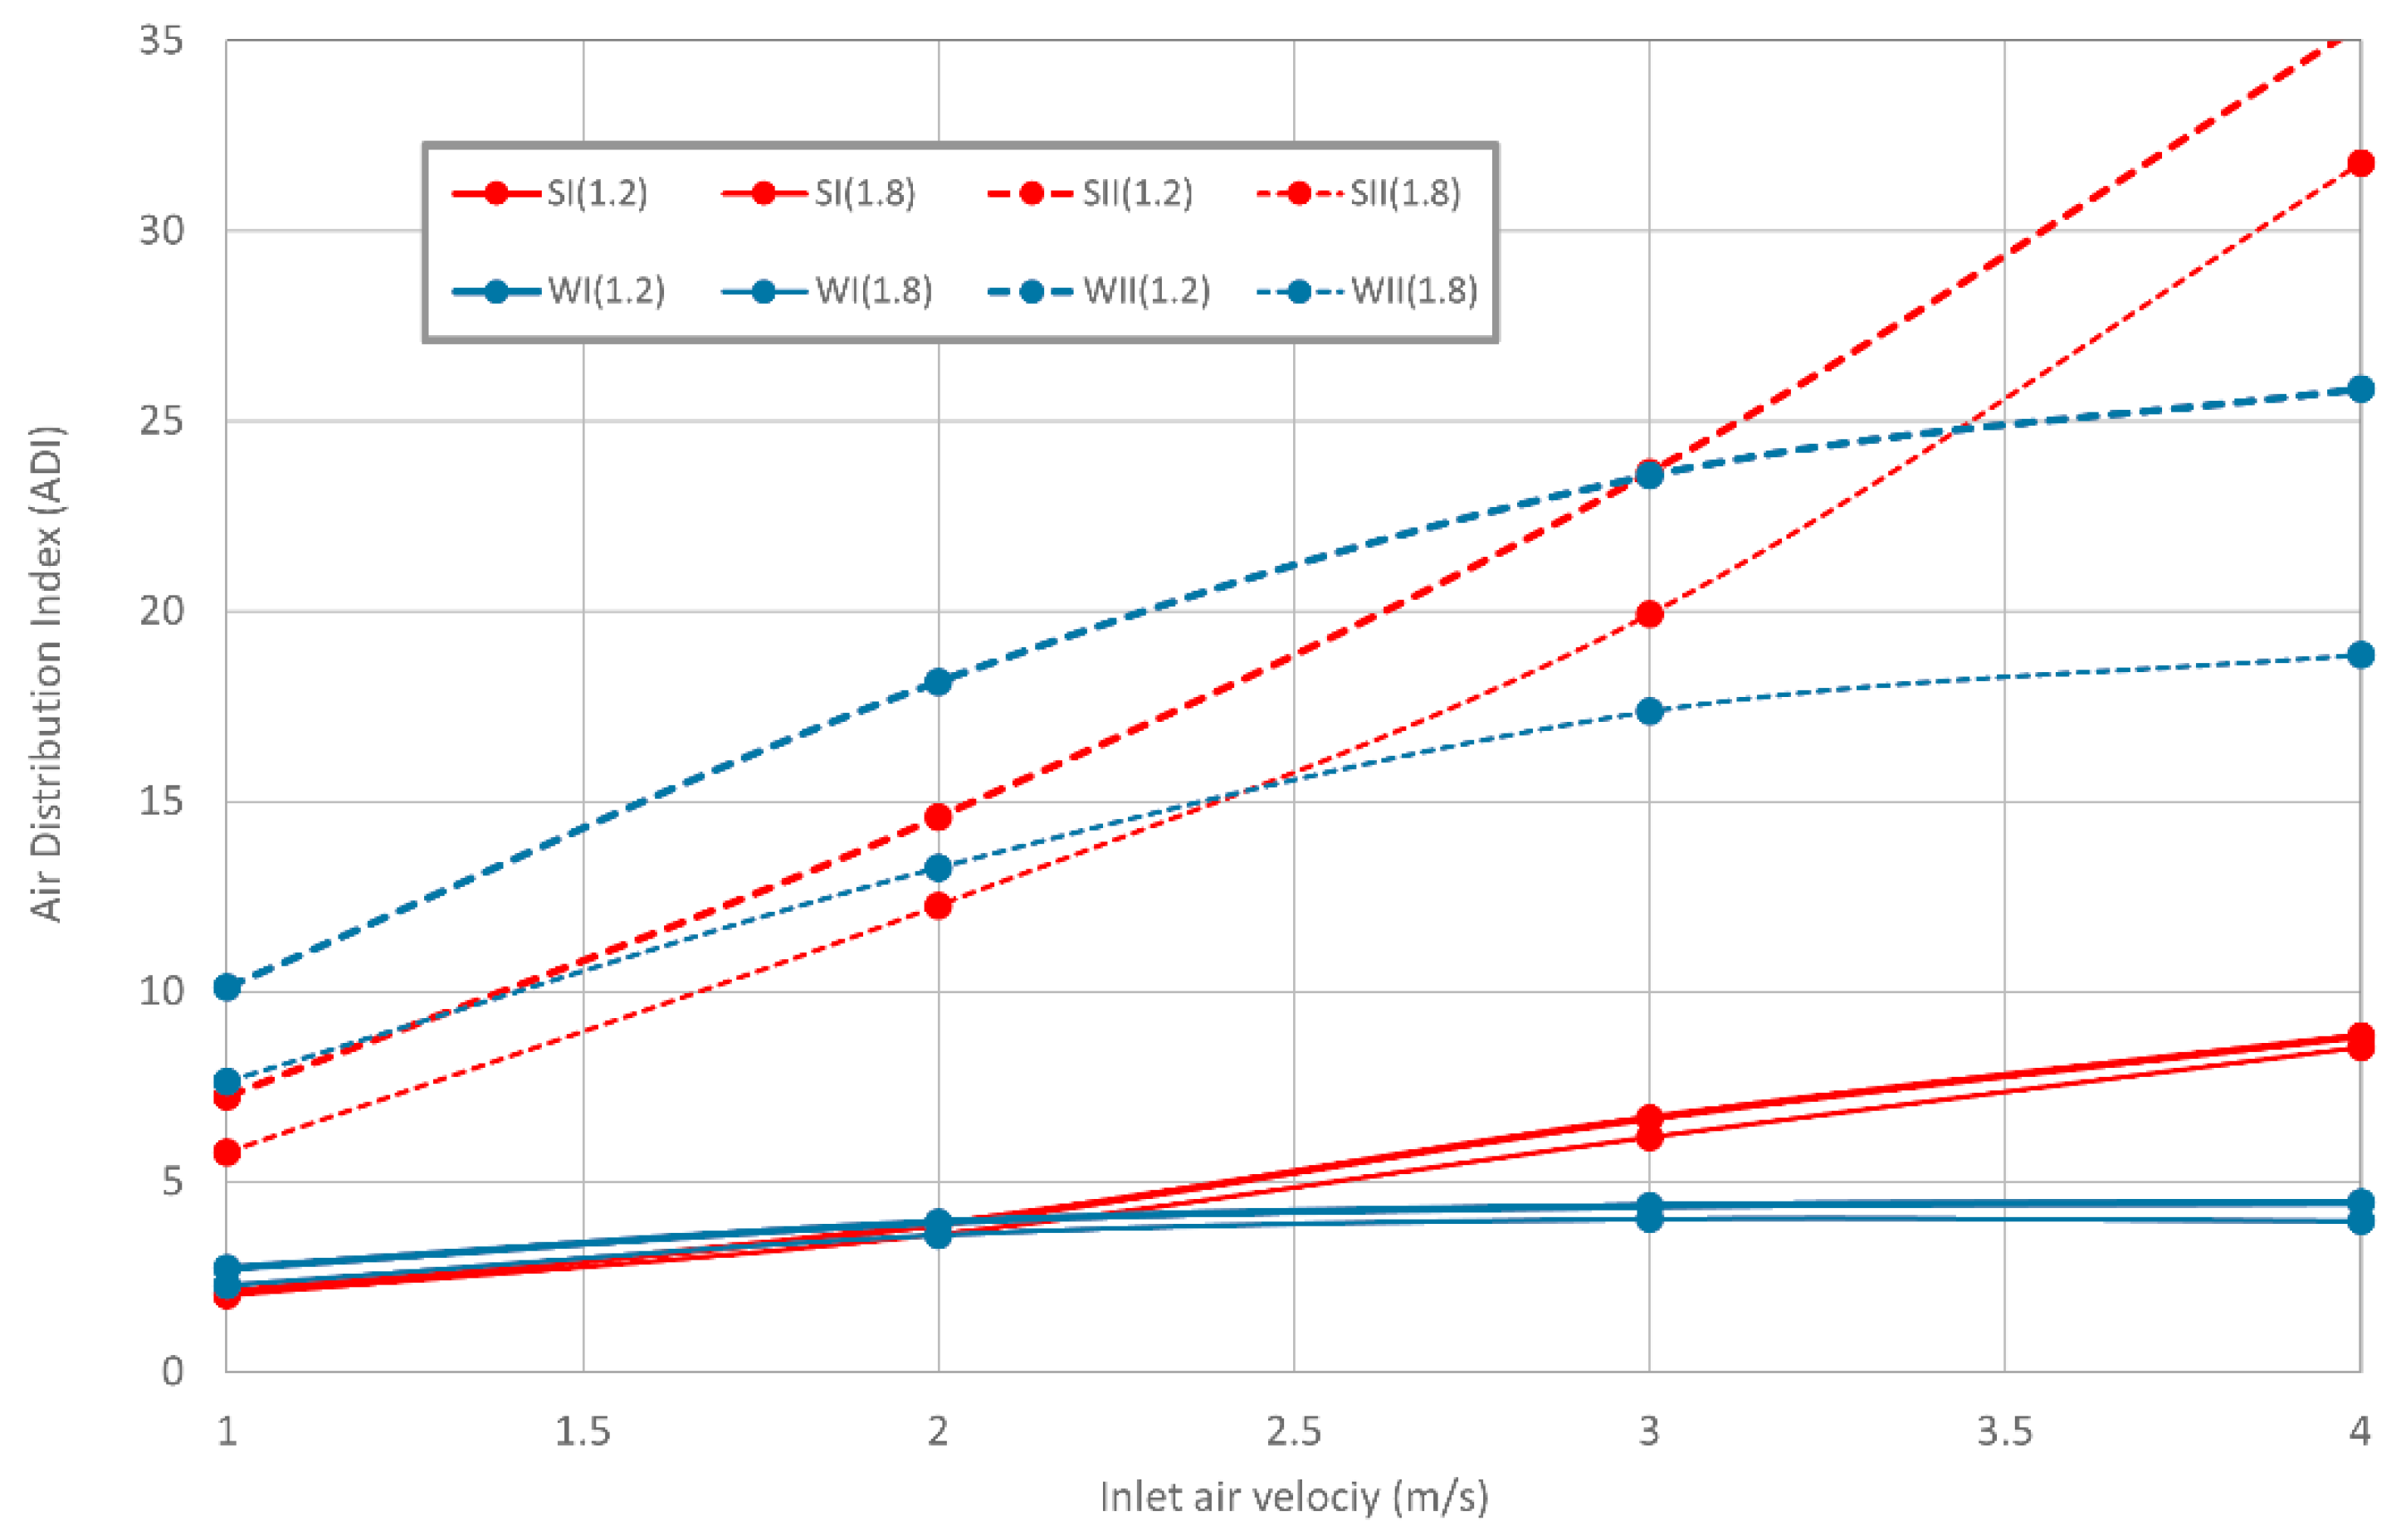
Figure 14 and Figure 15 show, respectively, the variation of ADI and ADTI with the inlet air velocity, for Cases I and II under summer and winter conditions, when the exit air terminal is located at 1.2 and 1.8 m above the floor level.
Based on the results in Figure 14, ADI:
- is higher for Case II than Case I;
- it generally increases as the inlet air velocity increases;
- is higher when the exit air terminal is located at 1.2 m than when it is located 1.8 m;
- is higher for winter condition than for summer conditions for the lower air velocity range, and is higher for summer condition than for winter condition, for higher air velocity range.
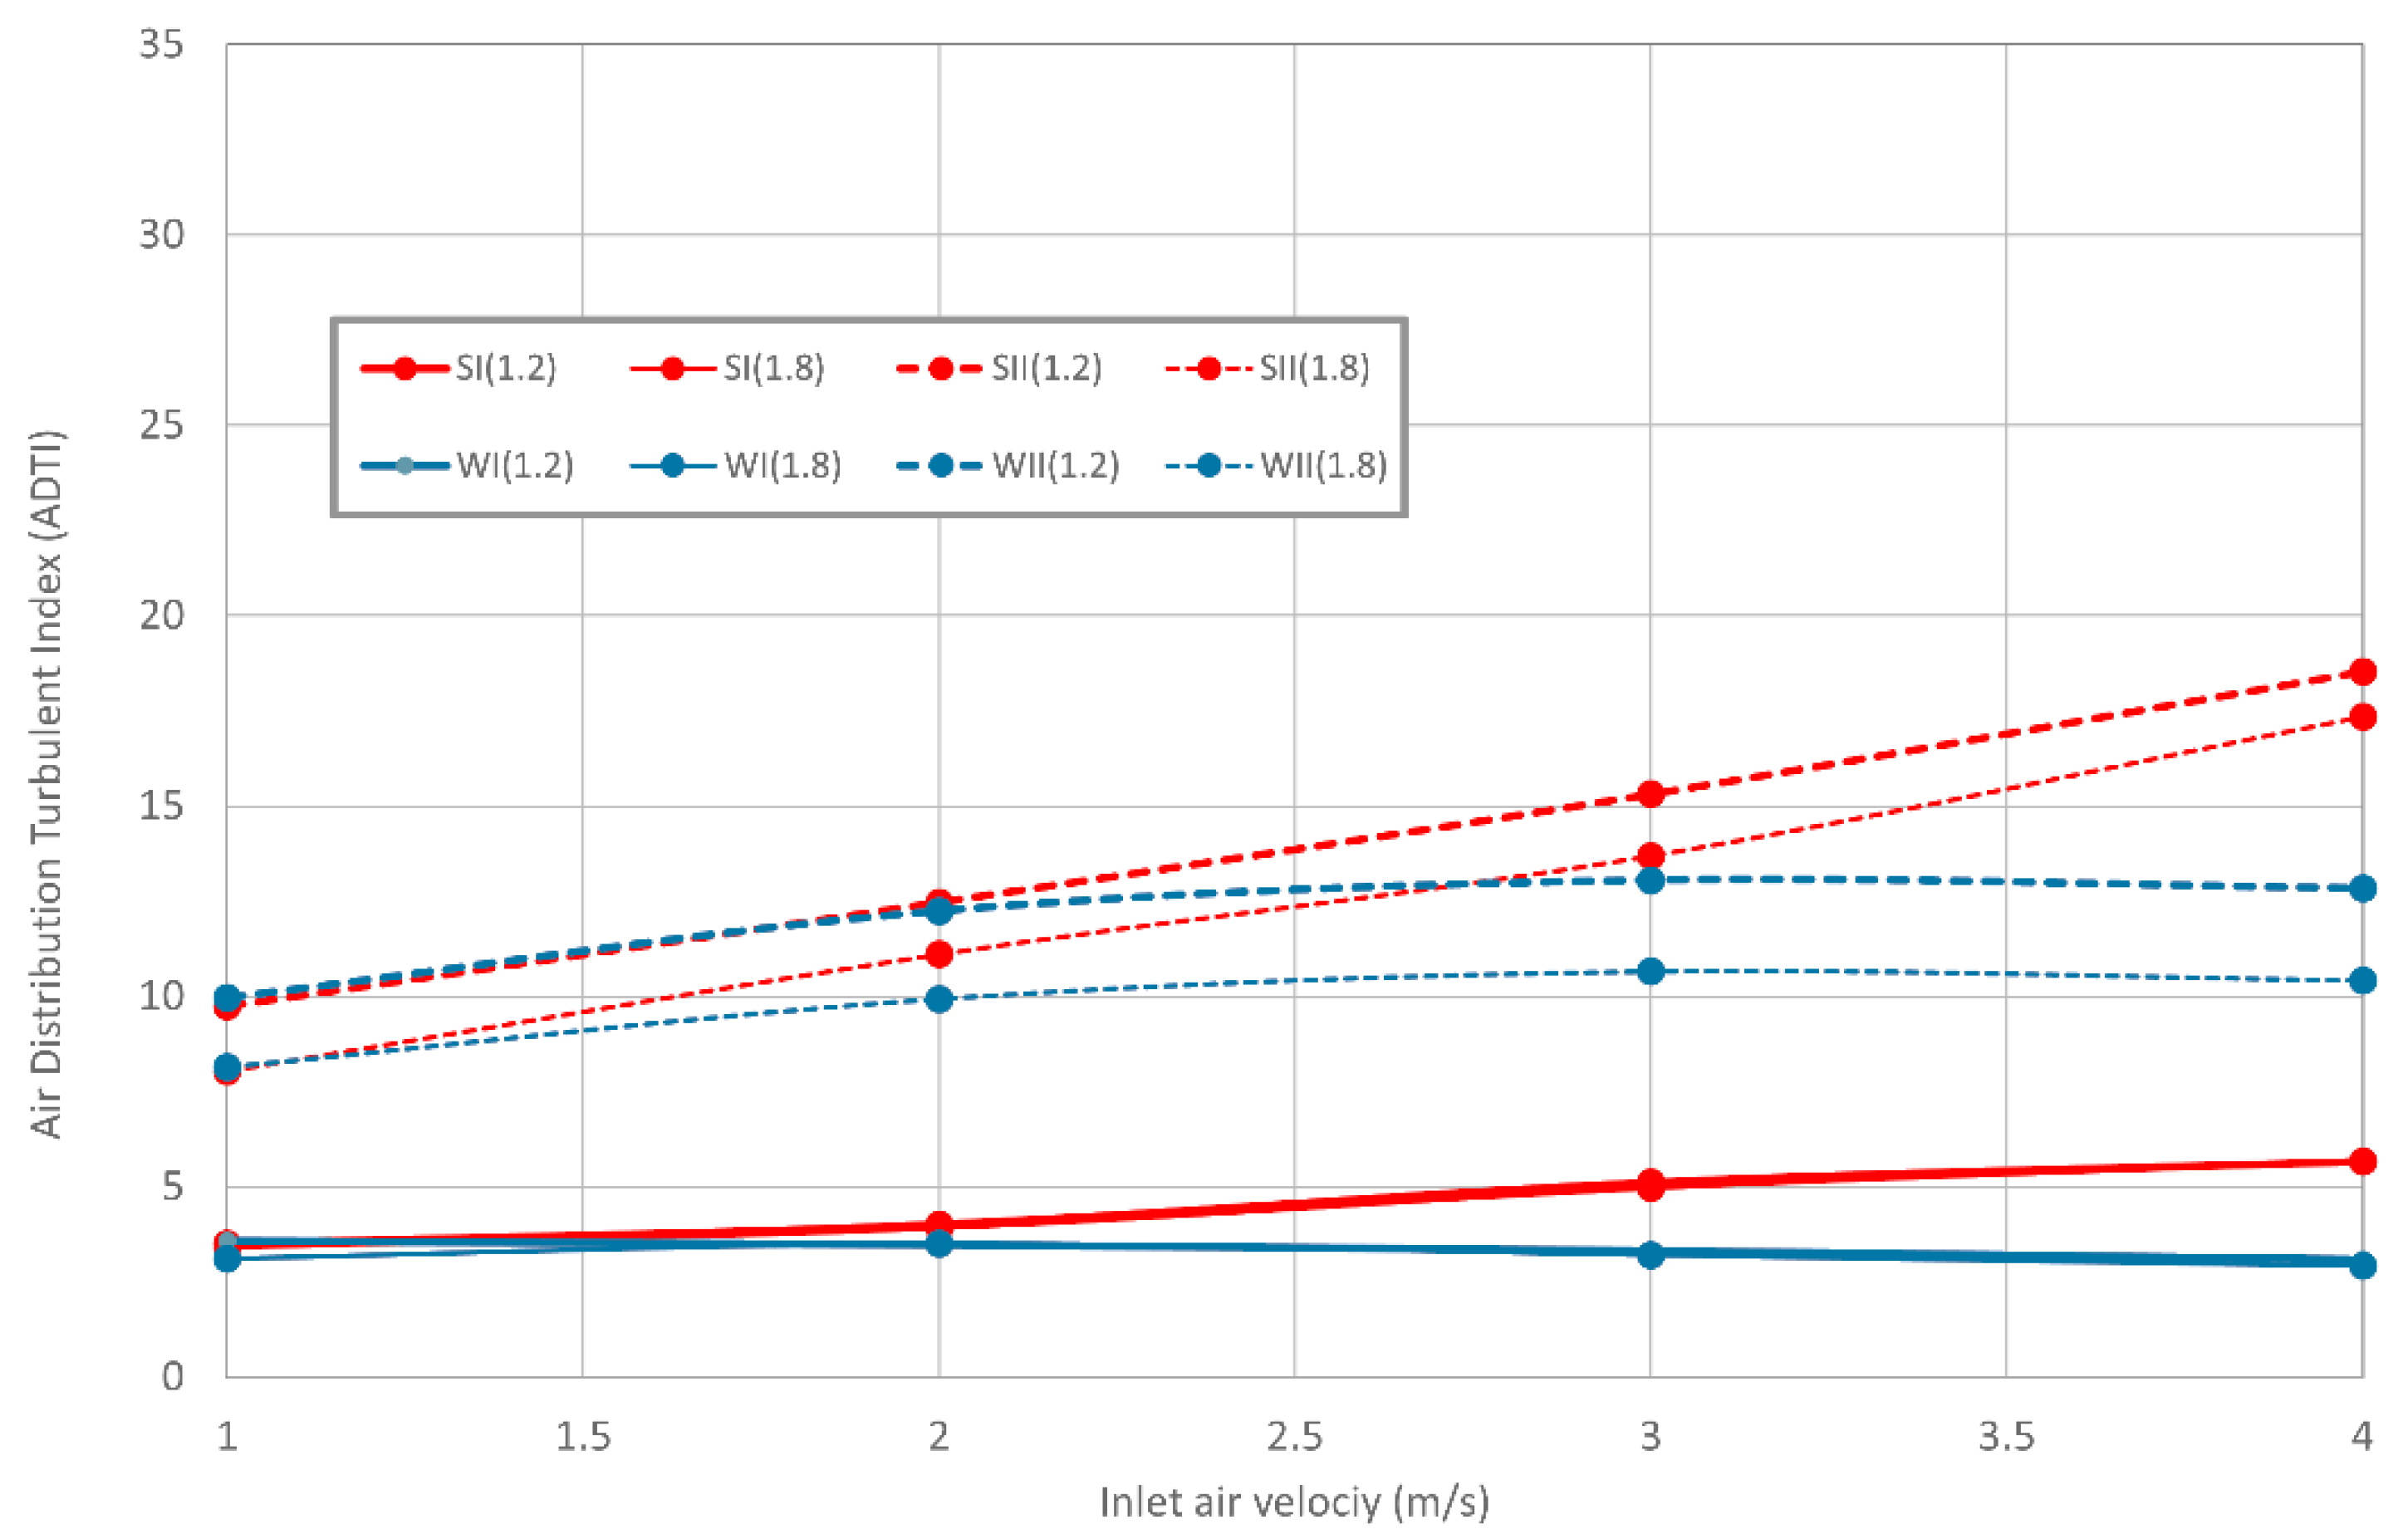
Based on the results in Figure 15 ADTI:
- is higher for Case II than Case I;
- it generally increases as the inlet air velocity increase;
- is higher when the exit air terminal is located 1.2 m than when it is located 1.8 m for Case II;
- is higher for summer condition than for winter condition.
In general, the ADI and ADTI increase when the inlet air velocity increases, but the increase is higher for ADI than for ADTI.
4. Discussion
In this section the four parameters that influence ADI and ADTI, namely the PV geometry, the inlet air velocity, the exhaust air terminal location and the season’s condition, which also impact on the three parameters NTC, NAQ and NDR are evaluated.
4.1. Indoor Environment Numbers
In this section the influence of the PV geometry, inlet air velocity, exhaust air terminal location and the seasonal conditions on the indoor environment numbers, namely NTC, NAQ and NDR are discussed.
According to the results obtained, the main reasons for the variation in the values of TC, IAQ and DR in the Case I and II, are associated with the airflow difference for the two PV system. In Case I the airflow has the ability to bypass the occupants on both sides as the distance between the air terminal devices is wider than the upper width of a human body, while in the Case II the airflow is directed onto the occupant’s body as the distance between the two ATDs is lower than the width of a human body. Thus, in Case I the airflow promotes a recirculation mainly at the back of the occupant before exiting from the space, while in Case II the airflow promotes a recirculation mainly in front of the occupant before it passes to the air exit terminal.
Case I presents the highest TC level for summer condition, due the airflow promoting a recirculation at the back of the occupant, while Case II presents the highest TC level for winter condition. As for TC, the DR for Case I presents highest levels. The IAQ is highest for Case II, due the airflow promoting a recirculation in front of the occupant before it passes to the air exit terminal.
The numbers NTC, NAQ and NDR used in this study are affected as follows:
- In general, NTC is higher for Case I than Case II;
- NAQ is higher for Case II than Case I;
- NDR is higher for Case II than Case I.
As the inlet air velocity increases:
- NTC and NAQ increase for summer condition;
- NTC and NDR decrease for winter.
As for the influence of the exit air terminal location, NTC and NAQ are generally higher when the exit air terminal is located at 1.2 m than at 1.8 m.
In general, the NTC (for lower inlet air velocity range) and NDR are higher for summer than for winter conditions.
4.2. Air Distribution Index and Air Distribution Turbulence Index
ADI and ADTI are higher for Case II than for Case I. These indices increase as the inlet air velocity increases, but the values for ADI are higher than for ADTI. ADI and ADTI are generally higher when the exit air terminal is located at 1.2 m than when it is at 1.8 m. also, both ADI and ADTI are generally are higher for summer than for winter conditions.
5. Conclusions
This work evaluates the integral effect of TC, IAQ and DR for a desk equipped with personalized ventilation systems supplying fresh air to four manikins. A new index, ADTI, is used to consider simultaneously the TC, IAQ, DR using effectiveness parameters εTC, εAQ and εDR.
The results show that the air supply and extract arrangement described under Case I presents the highest εTC. For this Case, εTC and εAQ decreases as the inlet air velocity increases and the εTC is higher for summer than for winter condition. The Case II presents highest εAQ and εDR. For this Case εTC decreases and εDR increases as the inlet air velocity increases and εTC is higher for summer than for winter conditions.
In general, Case II provides better IAQ and DR level than Case I. The IAQ improves when the exit air terminal is located at 1.2 m above the floor than when it is located at 1.8 m, the TC level is better for winter than for summer conditions and the DR is better for summer than for winter conditions.
NTC is higher for Case I than Case II, while NAQ and NDR are higher for Case II than Case I. When the inlet air velocity increases NTC for summer condition and NAQ both increase, while the NTC number for winter condition and the NDR both decrease. NTC and NAQ are higher when the exit air terminal is located at 1.2 m than when it is at 1.8 m. NTC and NDR are generally higher for summer condition than for winter conditions.
ADI and ADTI are generally higher for Case II than for Case I, they increase when the inlet air velocity increases, are higher when the exit air terminal is located at 1.2 m than when is at 1.8 m and are higher for summer condition than for winter condition. However, the values of ADI are higher than ADTI due the inclusion of DR in the latter.
Thus, when it is required to evaluate simultaneously the parameters for TC, IAQ, DR, and the related effectiveness values, applying these parameters to determine ADTI for the room can provide a more complete assessment of air supply to room occupants.
Author Contributions
All authors contributed equally in the preparation of this manuscript. All authors have read and agreed to the published version of the manuscript.
Funding
The authors would like to acknowledge the support of the project (SAICT-ALG/39586/2018) supported by Algarve Regional Operational Program (CRESC Algarve 2020), under the PORTUGAL 2020 Partnership Agreement, through the European Regional Development Fund (ERDF) and the National Science and Technology Foundation (FCT).
Institutional Review Board Statement
Not applicable.
Informed Consent Statement
Not applicable.
Data Availability Statement
Data sharing not applicable.
Conflicts of Interest
The authors declare no conflict of interest.
Nomenclature
| ADI | Air Distribution Index. |
| ADTI | Air Distribution Turbulence Index. |
| ATD | Air Terminal Device. |
| BTR | Building Thermal Response. |
| CFD | Computational Fluid Dynamics. |
| CO2 | Carbon Dioxide (ppm). |
| DR | Draught Risk (%). |
| HTR | Human Thermal Response. |
| HVAC | Heating, Ventilating and Air Conditioning. |
| IAQ | Indoor Air Quality. |
| NAQ | Air Quality Number. |
| NDR | Draught Risk Number. |
| NTC | Thermal Comfort Number. |
| PD | Percentage of Dissatisfied people due the indoor air quality (%). |
| PPD | Predicted Percentage of Dissatisfied people (%). |
| PV | Personalized Ventilation. |
| TC | Thermal Comfort. |
| Tr | Mean Radiant Temperature (°C). |
| εAQ | Effectiveness for contaminant removal (%). |
| εDR | Effectiveness for room air removal (%). |
| εTC | Effectiveness for heat removal (%). |
References
- Awbi, H.B. Ventilation of Buildings; Routledge: London, UK, 2004. [Google Scholar]
- Grigorescu, S.E.; Petkov, N.; Kruizinga, P. Comparison of texture features based on Gabor filters. IEEE Trans. Image Process. 2002, 11, 1160–1167. [Google Scholar] [CrossRef] [Green Version]
- Cho, Y.; Awbi, H.B.; Marchetti, M. The variation of ventilation performance in relation to change in workstation location in a ventilated room. In Proceedings of the Healthy Building Conference, Singapore, 7–11 December 2003. [Google Scholar]
- Cho, Y.; Awbi, H.B.; Karimipanah, T. Comparison between wall confluent jets and displacement ventilation in aspects of the spreading ration on the floor. In Proceedings of the 10th International Conference in Indoor Air Quality and Climate, Beijing, China, 4–9 September 2005; pp. 3249–3254. [Google Scholar]
- Karimipanah, T.; Awbi, H.; Sandberg, M.; Blomqvist, C. Investigation of air quality, comfort parameters and effectiveness for two floor-level air supply systems in classrooms. Build. Environ. 2007, 42, 647–655. [Google Scholar] [CrossRef]
- Almesri, I.; Awbi, H.B.; Foda, E.; Siren, K. An Air Distribution Index for Assessing the Thermal Comfort and Air Quality in Uniform and Nonuniform Thermal Environments. Indoor Built Environ. 2012, 22, 618–639. [Google Scholar] [CrossRef] [Green Version]
- Awbi, H.B. Ventilation for Good Indoor Air Quality and Energy Efficiency. Energy Procedia 2017, 112, 277–286. [Google Scholar] [CrossRef]
- Conceição, E.Z.E.; Lúcio, M.M.J.R.; Awbi, H.B. Comfort and airflow evaluation in spaces equipped with mixing ventilation and cold radiant floor. Build. Simul. 2012, 6, 51–67. [Google Scholar] [CrossRef]
- Conceição, E.Z.E.; Santiago, C.I.M.; Lúcio, M.M.J.R.; Awbi, H.B. Predicting the Air Quality, Thermal Comfort and Draught Risk for a Virtual Classroom with Desk-Type Personalized Ventilation Systems. Buildings 2018, 8, 35. [Google Scholar] [CrossRef] [Green Version]
- Fanger, P.O. Thermal Comfort: Analysis and Applications in Environmental Engineering; Danish Technical PRESS: Copenhagen, Denmark, 1972; Volume 3. [Google Scholar]
- ANSI/ASHRAE-55. Thermal Environmental Conditions for Human Occupancy; American Society of Heating, Refrigeration and Air-Conditioning Engineers: Atlanta, GA, USA, 2020. [Google Scholar]
- ISO. ISO 7730: Ergonomics of the thermal environment Analytical determination and interpretation of thermal comfort using calculation of the PMV and PPD indices and local thermal comfort criteria. Management 2005, 3, 615. [Google Scholar]
- ANSI/ASHRAE Standard 62.1. Ventilation for Acceptable Indoor Air Quality; American Society of Heating, Refrigerating and Air-Conditioning Engineers: Atlanta, GA, USA, 2020. [Google Scholar]
- Fanger, P.; Melikov, A.K.; Hanzawa, H.; Ring, J. Air turbulence and sensation of draught. Energy Build. 1988, 12, 21–39. [Google Scholar] [CrossRef]
- Fanger, P.O. Provide Good Air Quality for People and Improve Their Productivity. In Proceedings of the Seventh International Conference Air Distribution in Rooms, Reading, UK, 9–12 July 2000; pp. 1–5. [Google Scholar]
- Melikov, A.K.; Cermak, R.; Majer, M. Personalized ventilation: Evaluation of different air terminal devices. Energy Build. 2002, 34, 829–836. [Google Scholar] [CrossRef]
- Gao, N.; Niu, J. Modeling the performance of personalized ventilation under different room airflows. IBPSA 2005-Int. Build. Perform. Simul. Assoc. 2005, 11, 327–334. [Google Scholar]
- Cermak, R.; Melikov, A.K.; Forejt, L.; Kovar, O. Performance of Personalized Ventilation in Conjunction with Mixing and Displacement Ventilation. HVAC&R Res. 2006, 12, 295–311. [Google Scholar] [CrossRef]
- Niu, J.; Gao, N.; Phoebe, M.; Huigang, Z. Experimental study on a chair-based personalized ventilation system. Build. Environ. 2007, 42, 913–925. [Google Scholar] [CrossRef]
- Sun, S.; Ren, X.; Wang, L. Study on Personalized Dynamic Ventilation. In Proceedings of the indoor air, Copenhagen, Denmark, 17–22 August 2008; pp. 17–22. [Google Scholar]
- Bolashikov, Z.D.; Melikov, A.; Krenek, M. Improved performance of personalized ventilation by control of the convection flow around occupant body. ASHRAE Trans. 2009, 115, 421–431. [Google Scholar]
- Schiavon, S.; Melikov, A.K.; Sekhar, C. Energy analysis of the personalized ventilation system in hot and humid climates. Energy Build. 2010, 42, 699–707. [Google Scholar] [CrossRef]
- Li, R.; Sekhar, S.; Melikov, A.K. Thermal comfort and IAQ assessment of under-floor air distribution system integrated with personalized ventilation in hot and humid climate. Build. Environ. 2010, 45, 1906–1913. [Google Scholar] [CrossRef]
- Yang, B.; Sekhar, C.; Melikov, A.K. Ceiling mounted personalized ventilation system in hot and humid climate—An energy analysis. Energy Build. 2010, 42, 2304–2308. [Google Scholar] [CrossRef]
- Chen, Y.; Raphael, B.; Sekhar, S.C. Individual control of a personalized ventilation system integrated with an ambient mixing ventilation system. HVAC&R Res. 2012, 18, 1136–1152. [Google Scholar] [CrossRef]
- Melikov, A.K.; Ivanova, T.; Stefanova, G. Seat headrest-incorporated personalized ventilation: Thermal comfort and inhaled air quality. Build. Environ. 2012, 47, 100–108. [Google Scholar] [CrossRef]
- Makhoul, A.; Ghali, K.; Ghaddar, N. Thermal comfort and energy performance of a low-mixing ceiling-mounted personalized ventilator system. Build. Environ. 2013, 60, 126–136. [Google Scholar] [CrossRef]
- Cheong, D.K.W.; Huang, S. Performance evaluation of personalized ventilation system with two types of air terminal devices coupled with displacement ventilation in a mock-up office. HVAC&R Res. 2013, 19, 974–985. [Google Scholar] [CrossRef]
- Dalewski, M.; Melikov, A.K.; Veselý, M. Performance of ductless personalized ventilation in conjunction with displacement ventilation: Physical environment and human response. Build. Environ. 2014, 81, 354–364. [Google Scholar] [CrossRef]
- Chen, Y.; Raphael, B.; Sekhar, S. Experimental and simulated energy performance of a personalized ventilation system with individual airflow control in a hot and humid climate. Build. Environ. 2016, 96, 283–292. [Google Scholar] [CrossRef]
- Conceição, E.; Rosa, S.P.; Custódio, A.L.; Andrade, R.L.; Meira, M.J.; Manuela, M.; Lúcio, M.M.J. Study of Airflow around Occupants Seated in Desks Equipped with Upper and Lower Air Terminal Devices for Slightly Warm Environments. HVAC&R Res. 2010, 16, 401–412. [Google Scholar] [CrossRef]
- Conceição, E.; Lúcio, M.M.J. Numerical Study of the Thermal Efficiency of a School Building with Complex Topology for Different Orientations. Indoor Built Environ. 2009, 18, 41–51. [Google Scholar] [CrossRef] [Green Version]
- Bacher, P.; Madsen, H. Identifying suitable models for the heat dynamics of buildings. Energy Build. 2011, 43, 1511–1522. [Google Scholar] [CrossRef] [Green Version]
- Pisello, A.L.; Rossi, F.; Cotana, F. Summer and Winter Effect of Innovative Cool Roof Tiles on the Dynamic Thermal Behavior of Buildings. Energies 2014, 7, 2343–2361. [Google Scholar] [CrossRef] [Green Version]
- Conceição, E.Z.E.; Lúcio, M.M.J.R. Numerical simulation of passive and active solar strategies in buildings with complex topology. Build. Simul. 2010, 3, 245–261. [Google Scholar] [CrossRef]
- Tang, Y.; Yu, H.; Wang, Z.; Luo, M.; Li, C. Validation of the Stolwijk and Tanabe Human Thermoregulation Models for Predicting Local Skin Temperatures of Older People Under Thermal Transient Conditions. Energies 2020, 13, 6524. [Google Scholar] [CrossRef]
- Ozeki, Y.; Takabayashi, T.; Tanabe, S.-I. Numerical Comfort Simulator for Thermal Environment (Part 1) A Comprehensive Combined Analysis Method with Multi-Node Thermoregulation Model, Radiation Model and CFD for Evaluation of Thermal Comfort. SAE Tech. Pap. Ser. 2002. [Google Scholar] [CrossRef]
- Conceição, E.Z.; Vicente, V.D.; Manuela, M.; Lucio, J.R. Airflow Inside School Building Office Compartments with Moderate Environments. HVAC&R Res. 2008, 14, 195–207. [Google Scholar] [CrossRef]
- Takabayashi, T.; Ozeki, Y.; Tanabe, S.-I. Numerical Comfort Simulator for Thermal Environment (Part 2) An Application of Simulator for the Evaluation of Solar Reduction Glass in a Vehicle Model. SAE Tech. Paper 2002. [Google Scholar] [CrossRef]
- Nilsson, H.O.; Holmer, I. Comfort climate evaluation with thermal manikin methods and computer simulation models. Indoor Air 2003, 13, 28–37. [Google Scholar] [CrossRef] [PubMed]
- Conceição, E.; Da Silva, M.C.G.; André, J.C.S.; Viegas, D.X. Thermal behaviour simulation of the passenger compartment of vehicles. Int. J. Veh. Des. 2000, 24, 372. [Google Scholar] [CrossRef] [Green Version]
- Conceição, E.Z.E.; Lúcio, M.M.J.R. Numerical Simulation of the Application of Solar Radiant Systems, Internal Airflow and Occupants’ Presence in the Improvement of Comfort in Winter Conditions. Buildings 2016, 6, 38. [Google Scholar] [CrossRef] [Green Version]
- Fanger, P. Introduction of the olf and the decipol units to quantify air pollution perceived by humans indoors and outdoors. Energy Build. 1988, 12, 1–6. [Google Scholar] [CrossRef]
- Sandberg, M. What is ventilation efficiency? Build. Environ. 1981, 16, 123–135. [Google Scholar] [CrossRef]
Figure 1.
Personalized quadruple ventilation system with a distance between the two upper and two lower ATDs of 45 cm and the exhaust air terminal located at 1.2 m; (a) and at 1.8 m; (b) above the floor level.
Figure 1.
Personalized quadruple ventilation system with a distance between the two upper and two lower ATDs of 45 cm and the exhaust air terminal located at 1.2 m; (a) and at 1.8 m; (b) above the floor level.

Figure 2.
ATDs for Case I.

Figure 3.
Personalized quadruple ventilation system with a distance between the two upper and two lower air supply terminal of 25 cm, and exhaust air located at 1.2 m; (a) and at 1.8 m; (b) above the floor level.
Figure 3.
Personalized quadruple ventilation system with a distance between the two upper and two lower air supply terminal of 25 cm, and exhaust air located at 1.2 m; (a) and at 1.8 m; (b) above the floor level.

Figure 4.
ATDs for Case II.

Figure 5.
Variation of with inlet air velocity for the Case I and II for the exit air terminal located at 1.2 and 1.8 m above the floor level (for summer and winter conditions). (S = Summer, W = Winter, I = Case I, II = Case II, 1.2 = exhaust system located 1.2 m above floor level and 1.8 = exhaust system located 1.8 m above floor level).

Figure 6.
Variation of PPD with inlet air velocity for Case I and II with the exit air terminal located at 1.2 and 1.8 m above the floor level (for summer and winter conditions). (S = Summer, W = Winter, I = Case I, II = Case II, 1.2 = exhaust system located 1.2 m above floor level and 1.8 = exhaust system located 1.8 m above floor level).

Figure 7.
Variation of NTC with inlet air velocity for the Case I and II with the exit air terminal located at 1.2 and 1.8 m above the floor level (for summer and winter conditions). (S = Summer, W = Winter, I = Case I, II = Case II, 1.2 = exhaust system located 1.2 m above floor level and 1.8 = exhaust system located 1.8 m above floor level).

Figure 8.
Variation of Effectiveness for Contaminant Removal with inlet air velocity for Cases I and II with the exit air terminal located at 1.2 and 1.8 m above the floor level (for summer and winter conditions). (S = Summer, W = Winter, I = Case I, II = Case II, 1.2 = exhaust system located 1.2 m above floor level and 1.8 = exhaust system located 1.8 m above floor level).

Figure 9.
Variation of CO2 concentration in the respiration area with inlet air velocity for Cases I and II with the exit air terminal located at 1.2 and 1.8 m above the floor level (for summer and winter conditions). (S = Summer, W = Winter, I = Case I, II = Case II, 1.2 = exhaust system located 1.2 m above floor level and 1.8 = exhaust system located 1.8 m above floor level).

Figure 10.
Variation of NAQ with inlet air velocity for the Cases I and II with the exit air terminal located at 1.2 and 1.8 m above the floor level (for summer and winter conditions). (S = Summer, W = Winter, I = Case I, II = Case II, 1.2 = exhaust system located 1.2 m above floor level and 1.8 = exhaust system located 1.8 m above floor level).

Figure 11.
Variation of εDR with inlet air velocity for the Cases I and II with the exit air terminal located at 1.2 and 1.8 m above the floor level (for summer and winter conditions). (S = Summer, W = Winter, I = Case I, II = Case II, 1.2 = exhaust system located 1.2 m above floor level and 1.8 = exhaust system located 1.8 m above floor level).

Figure 12.
Variation of body mean DR with inlet air velocity for the Cases I and II with the exit air terminal located at 1.2 and 1.8 m above the floor level (for summer and winter conditions). (S = Summer, W = Winter, I = Case I, II = Case II, 1.2 = exhaust system located 1.2 m above floor level and 1.8 = exhaust system located 1.8 m above floor level).

Figure 13.
Variation of NDR with inlet air velocity for the Case I and II with the exit air terminal located 1.2 and 1.8 m above the floor level (for summer and winter conditions). (S = Summer, W = Winter, I = Case I, II = Case II, 1.2 = exhaust system located 1.2 m above floor level and 1.8 = exhaust system located 1.8 m above floor level).

Figure 14.
Variation of ADI with inlet air velocity for Cases I and II with the exit air terminal located at 1.2 and 1.8 m above the floor level (for summer and winter conditions). (S = Summer, W = Winter, I = Case I, II = Case II, 1.2 = exhaust system located 1.2 m above floor level and 1.8 = exhaust system located 1.8 m above floor level).

Figure 15.
Variation of ADTI with inlet air velocity for Cases I and II with the exit air terminal located at 1.2 and 1.8 m above the floor level (for summer and winter conditions). (S = Summer, W = Winter, I = Case I, II = Case II, 1.2 = exhaust system located 1.2 m above floor level and 1.8 = exhaust system located 1.8 m above floor level).

Publisher’s Note: MDPI stays neutral with regard to jurisdictional claims in published maps and institutional affiliations. |
© 2021 by the authors. Licensee MDPI, Basel, Switzerland. This article is an open access article distributed under the terms and conditions of the Creative Commons Attribution (CC BY) license (https://creativecommons.org/licenses/by/4.0/).
Share and Cite
MDPI and ACS Style
Conceição, E.; Awbi, H. Evaluation of Integral Effect of Thermal Comfort, Air Quality and Draught Risk for Desks Equipped with Personalized Ventilation Systems. Energies 2021, 14, 3235. https://doi.org/10.3390/en14113235
AMA Style
Conceição E, Awbi H. Evaluation of Integral Effect of Thermal Comfort, Air Quality and Draught Risk for Desks Equipped with Personalized Ventilation Systems. Energies. 2021; 14(11):3235. https://doi.org/10.3390/en14113235
Chicago/Turabian StyleConceição, Eusébio, and Hazim Awbi. 2021. "Evaluation of Integral Effect of Thermal Comfort, Air Quality and Draught Risk for Desks Equipped with Personalized Ventilation Systems" Energies 14, no. 11: 3235. https://doi.org/10.3390/en14113235
Note that from the first issue of 2016, this journal uses article numbers instead of page numbers. See further details here.